ari technical report 302 investigation of existing post
TRANSCRIPT

Arthur Rylah Institute for Environmental Research Technical Report Series No 302
Investigation of existing post-construction mortality
monitoring at Victorian wind farms to assess its utility in estimating
mortality rates
PD Moloney LF Lumsden and I Smales
September 2019
Arthur Rylah Institute for Environmental Research Department of Environment Land Water and Planning PO Box 137 Heidelberg Victoria 3084 Phone (03) 9450 8600 Website wwwarivicgovau
Citation Moloney PD Lumsden LF and Smales I (2019) Investigation of existing post-construction mortality monitoring at Victorian wind farms to assess its utility in estimating mortality rates Arthur Rylah Institute for Environmental Research Technical Report Series No 302 Department of Environment Land Water and Planning Heidelberg Victoria
Front cover photo A Victorian wind farm (Photo Lindy Lumsden)
copy The State of Victoria Department of Environment Land Water and Planning 2019
This work is licensed under a Creative Commons Attribution 30 Australia licence You are free to re-use the work under that licence on the condition that you credit the State of Victoria as author The licence does not apply to any images photographs or branding including the Victorian Coat of Arms the Victorian Government logo the Department of Environment Land Water and Planning logo and the Arthur Rylah Institute logo To view a copy of this licence visit httpcreativecommonsorglicensesby30audeeden
Printed by Melbourne Polytechnic Preston
Edited by Organic Editing
ISSN 1835-3827 (print) ISSN 1835-3835 (pdf)) ISBN 978-1-76077-796-8 (Print) ISBN 978-1-76077-797-5 (pdfonlineMS word)
Disclaimer This publication may be of assistance to you but the State of Victoria and its employees do not guarantee that the publication is without flaw of any kind or is wholly appropriate for your particular purposes and therefore disclaims all liability for any error loss or other consequence which may arise from you relying on any information in this publication
Accessibility If you would like to receive this publication in an alternative format please telephone the DELWP Customer Service Centre on 136 186 email customerservicedelwpvicgovau or contact us via the National Relay Service on 133 677 or wwwrelayservicecomau This document is also available on the internet at wwwdelwpvicgovau
Arthur Rylah Institute for Environmental Research Department of Environment Land Water and Planning Heidelberg Victoria
Investigation of existing post-construction mortality monitoring at Victorian wind farms to assess its utility in estimating mortality rates
Paul Moloney1 Lindy Lumsden1 and Ian Smales2
1 Arthur Rylah Institute for Environmental Research Department of Environment Land Water and Planning 123 Brown Street Heidelberg Victoria 3084
2 Biosis Pty Ltd 38 Bertie Street Port Melbourne Victoria 3207
Date
Arthur Rylah Institute for Environmental Research Technical Report Series No 302
ii Investigation of post-construction mortality monitoring at Victorian wind farms
Acknowledgements
This project was funded through the Energy Environment and Climate Change Group of the Department of Environment Land Water and Planning (DELWP) Support and policy input were provided by Lis Ashby Ruby Campbell-Beschorner Nick Rintoul Tracey Taylor and Karen Weaver Useful comments on the report were provided by Amanda Bush and Emma Bennett We thank Amanda Bush and Tiarne Ecker for assistance with compiling the data
Investigation of post-construction mortality monitoring at Victorian wind farms iii
Contents
Acknowledgements ii
Summary 1
Context 1
Aims 1
Methods 1
Results 2
Conclusions and implications 3
1 Introduction 5
11 Context 5
12 Report objectives and scope 5
13 Overview of approach 6
2 Analyses of data collected during post-construction mortality monitoring at Victorian wind farms 8
21 Overview of methods used to estimate total mortalities for individual wind farms 8
22 Variability in methods used during post-construction mortality monitoring at Victorian wind farms 9
23 Numbers of bats and birds found dead during mortality searches at Victorian wind farms 10
231 Bats 11
232 Birds 12
24 Suitability of the data for statistical analyses 14
25 Methods used to analyse mortality rates 16
251 Searcher efficiency trials 16
252 Carcass persistence trials 16
253 Mortality rate 16
26 Estimated mortality rates 17
261 Searcher efficiency trial results 17
262 Searcher efficiency trials discussion 19
263 Carcass persistence trial results 20
264 Carcass persistence trials discussion 21
265 Mortality rate analysis results 21
266 Mortality surveys discussion 32
27 Comparison of estimates of mortality rates with those undertaken by the wind farms 33
271 Wind Farm A 33
272 Wind Farm B 35
273 Potential reasons for differences between mortality estimates in the BAMM reports and those obtained in our analysis 38
274 Other wind farms 38
3 Simulations to examine the likelihood of detecting mortalities of different species 39
31 Mortality estimates 39
iv Investigation of post-construction mortality monitoring at Victorian wind farms
32 Likelihood of detecting at least one individual 43
321 Bat species 43
322 Small bird species 44
323 Medium-sized bird species 45
324 Large bird species 46
33 Discussion results of simulations 47
4 Population and cumulative impacts 49
41 Population-level impacts 49
411 Population modelling 49
42 Cumulative impacts 50
421 Nature of cumulative impacts 51
422 Pre-requisites to assessment of cumulative impacts 51
5 Key learnings and limitations of current assessment processes 53
51 Detection of carcasses 53
52 Estimation of total wind farm mortalities 54
53 Population and cumulative impact assessment 54
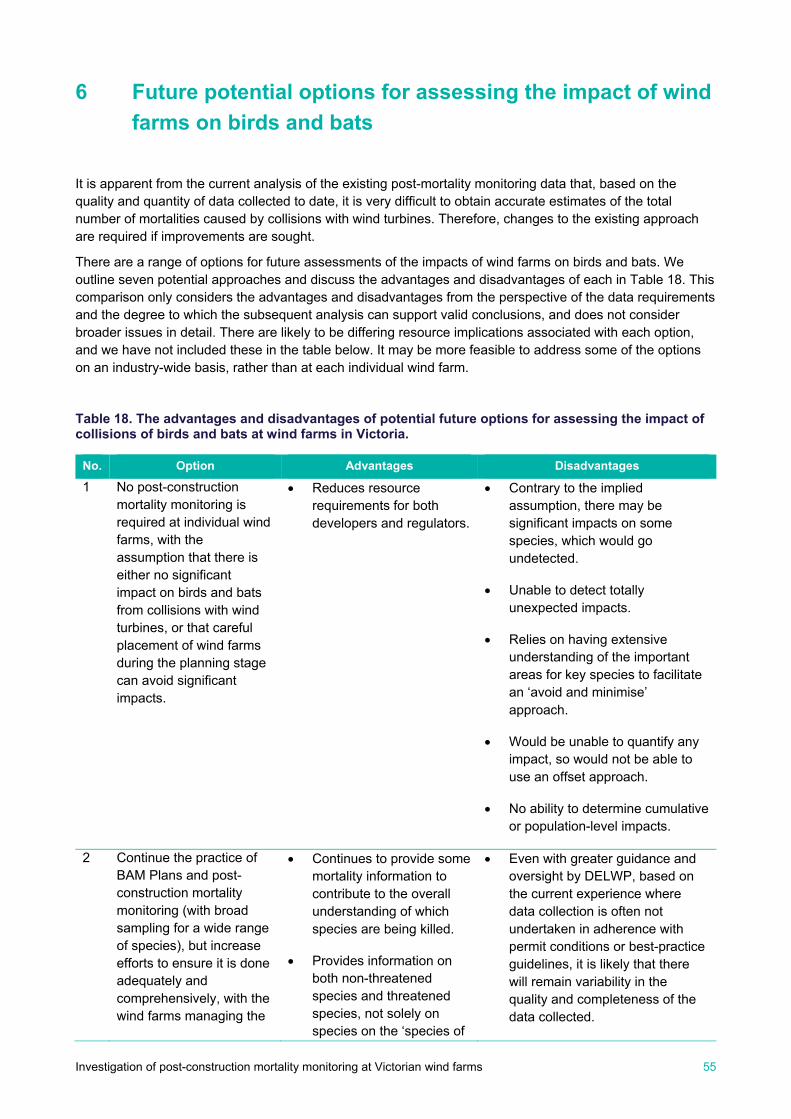
6 Future potential options for assessing the impact of wind farms on birds and bats 55
7 Key knowledge gaps 61
8 References and selected further reading 64
9 Appendices 67
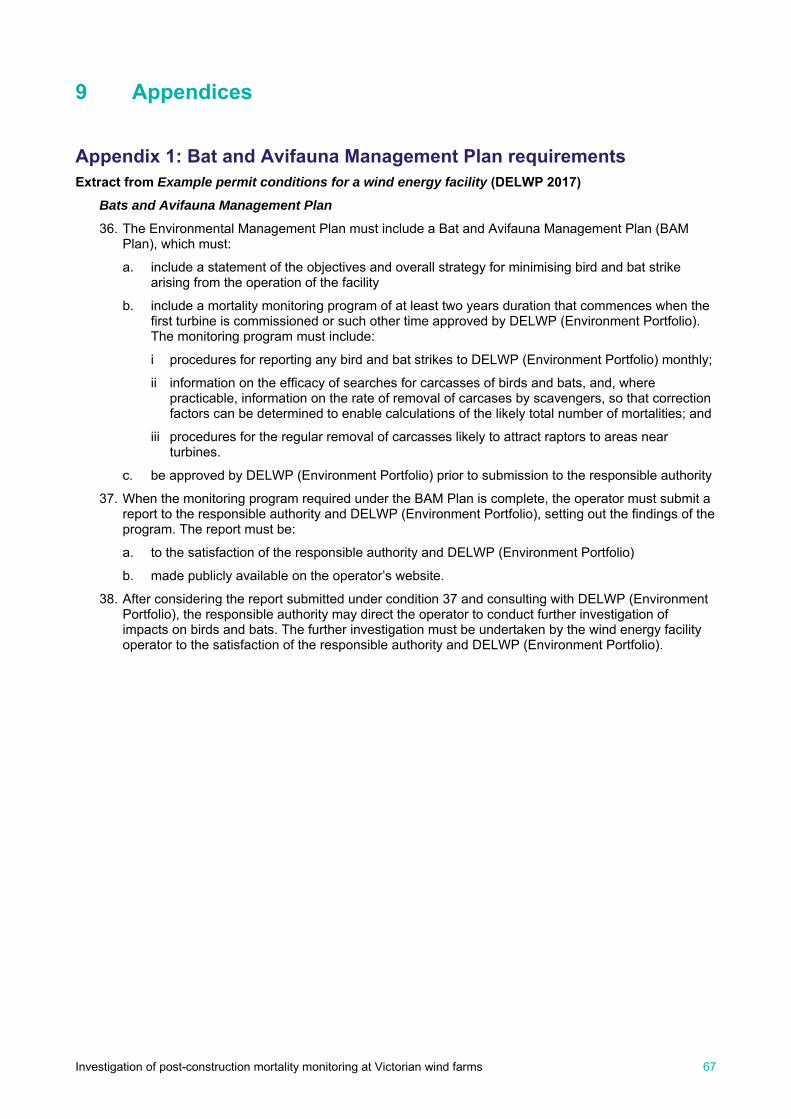
Appendix 1 Bat and Avifauna Management Plan requirements 67
Appendix 2 Data requirements for effective estimation of annual mortality rates 68
Appendix 3 Additional detail on the modelling approach for determining mortality rates 71
Appendix 4 Model estimates for the combined searcher and carcass persistence trials using the data from the four wind farms for which raw data was available 72
Appendix 5 Parameter estimates for the searcher efficiency and carcass persistence trials at Wind Farm A and Wind Farm B 73
Investigation of post-construction mortality monitoring at Victorian wind farms v
Tables
Table 1 The number of bats found dead at Victorian wind farms during post-construction mortality monitoring from 2003 to 2018 12
Table 2 The number of birds found dead at Victorian wind farms during post-construction mortality monitoring from 2003 to 2018 13
Table 3 Total number of reported turbine surveys and numbers of individual carcasses used in searcher efficiency trials and carcass persistence trials at the six wind farms where raw data was requested for further analysis based on data received in November 2017 16
Table 4 The probabilities (shown as percentages) of detecting a bat or a bird when present using either humans or dogs (using the combined data from the four wind farms where the raw data was available) 18
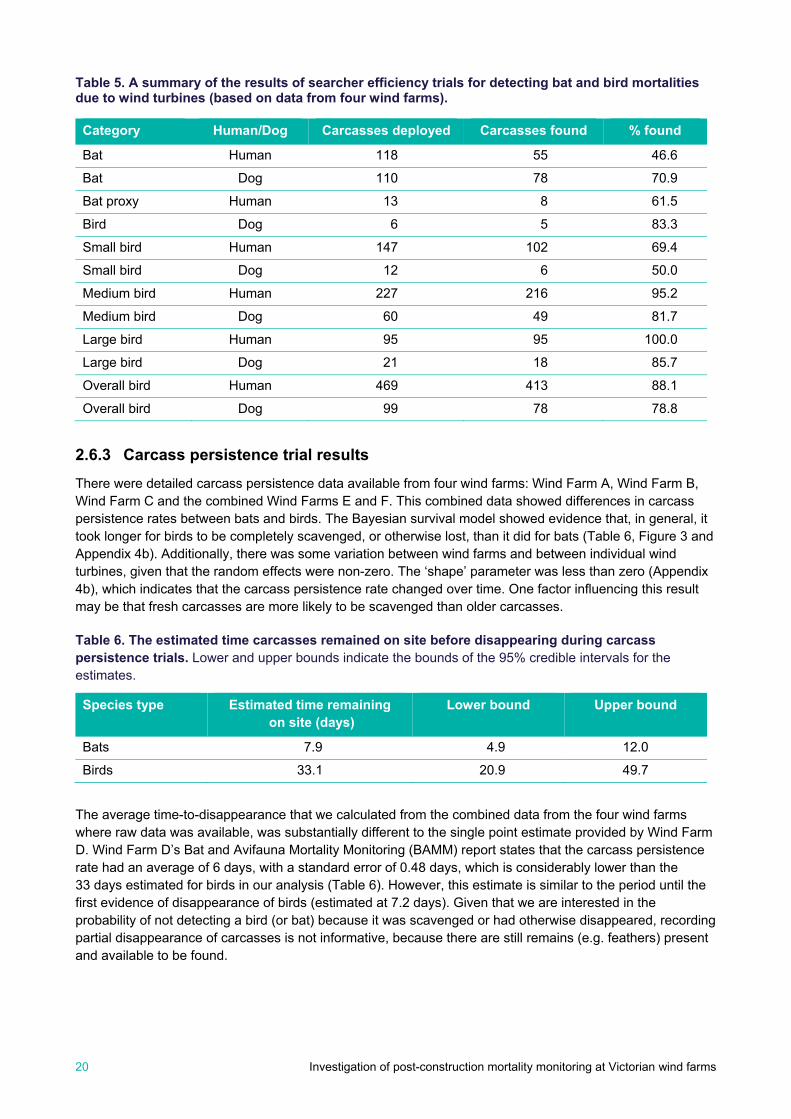
Table 5 A summary of the results of searcher efficiency trials for detecting bat and bird mortalities due to wind turbines (based on data from four wind farms) 20
Table 6 The estimated time carcasses remained on site before disappearing during carcass persistence trials 20
Table 7 The estimated detection rate obtained from the searcher efficiency trials at Wind Farm A for bats and three size classes of birds 22
Table 8 The estimated carcass persistence rates based on data from trials at Wind Farm A for bats and three size classes of birds 22
Table 9 The estimated proportion of carcasses that were not scavenged or otherwise lost prior to a survey (averaged over 30 days) at Wind Farm A 23
Table 10 The estimated mortality rate (per turbine per year) at Wind Farm A 24
Table 11 The detection rates estimated from data from searcher efficiency trials at Wind Farm B for bats and for three size classes of birds 27
Table 12 The estimated carcass persistence rates estimated from data from trials at Wind Farm B for bats and three size classes of birds 27
Table 13 The estimated proportion of carcasses that were not scavenged or otherwise lost prior to survey (averaged over 30 days) at Wind Farm B 28
Table 14 The estimated mortality rates (per turbine per year) at Wind Farm B 29
Table 15 Comparison between Wind Farm A and Wind Farm B of the modelled estimates for the detection rates based on the searcher efficiency trials and the length of time before disappearance 32
Table 16 Detection rates from searcher efficiency trials for each size class and searcher type using data from Wind Farms A B C E and F 39
Table 17 Estimated proportion of carcasses that will remain to be observed for each size class using data from Wind Farms A and B 39
Table 18 The advantages and disadvantages of potential future options for assessing the impact of collisions of birds and bats at wind farms in Victoria 55
vi Investigation of post-construction mortality monitoring at Victorian wind farms
Figures
Figure 1 Estimated detection probabilities (shown as percentages) for surveys undertaken using humans or dogs to locate bats and birds during the searcher efficiency trials (using the combined data from the four wind farms where the raw data was available) 18
Figure 2 Estimated detection probabilities for four human surveyors and four dog surveyors undertaking searcher efficiency trials for bats and birds 19
Figure 3 Estimated probabilities of carcass persistence for bats and birds during carcass persistence trials from the four wind farms where raw data was obtained 21
Figure 4 Estimated mortality rate (individual deaths per turbine per year) for bat species at Wind Farm A Lines indicate the 95 credible intervals 23
Figure 5 Estimated mortality rates (individuals per turbine per year) for small bird species found at Wind Farm A Lines indicate the 95 credible intervals 25
Figure 6 Estimated mortality rates (individuals per turbine per year) for medium-sized bird species found at Wind Farm A 26
Figure 7 Estimated mortality rates (individuals per turbine per year) for large bird species found at Wind Farm A 26
Figure 8 Estimated mortality rates (individuals per turbine per year) for bat species found at Wind Farm B 28
Figure 9 Estimated mortality rates (individuals per turbine per year) for small bird species found at Wind Farm B Lines indicate the 95 credible intervals 30
Figure 10 Estimated mortality rates (individuals per turbine per year) for medium-sized bird species found at Wind Farm B 31
Figure 11 Estimated mortality rates (individuals per turbine per year) for large bird species found at Wind Farm B 31
Figure 12 Estimated bat mortality rate (bat deaths per turbine per year) at Wind Farm A from the Bat and Avifauna Mortality Monitoring report (orange) and from our model (termed lsquolegacyrsquo in blue) 34
Figure 13 Estimated total bird mortality rate (total bird deaths per turbine per year) at Wind Farm A from the Bat and Avifauna Mortality Monitoring report (orange) and from our model (termed lsquolegacyrsquo in blue) 34
Figure 14 Estimated bat mortality rate (bat deaths per turbine per year) at Wind Farm B from each year of their 2-year monitoring program taken from annual Bat and Avifauna Mortality Monitoring reports (orange) and from our analysis of their combined data (termed lsquolegacyrsquo in blue) 35
Figure 15 Estimated total bird mortality rate (total bird deaths per turbine per year) at Wind Farm B from annual Bat and Avifauna Mortality Monitoring reports (orange) and from our analysis of their combined data (termed lsquolegacyrsquo in blue) 36
Figure 16 Estimated small bird mortality rate (small bird deaths per turbine per year) at Wind Farm B from annual Bat and Avifauna Mortality Monitoring reports (orange) and from our analysis of their combined data (termed lsquolegacyrsquo in blue) 36
Figure 17 Estimated medium-sized bird mortality rate (medium-sized bird deaths per turbine per year) at Wind Farm B from annual Bat and Avifauna Mortality Monitoring reports (orange) and from our analysis of their combined data (termed lsquolegacyrsquo in blue) 37
Figure 18 Estimated large bird mortality rate (large bird deaths per turbine per year) at Wind Farm B from annual Bat and Avifauna Mortality Monitoring reports (orange) and from our analysis of their combined data (termed lsquolegacyrsquo in blue) 37
Figure 19 The estimated mortality rates from the simulation with monthly surveys at 5 of the 50 turbines Mortality rates of 1 5 and 10 deaths per annum (pa) are considered 40
Figure 20 The estimated mortality rates from the simulation with monthly surveys at 15 of the 50 turbines Mortality rates of 1 5 and 10 deaths per annum (pa) are considered 41
Figure 21 The estimated mortality rates from the simulation with monthly surveys at 25 of the 50 turbines Mortality rates of 1 5 and 10 deaths per annum (pa) are considered 42
Investigation of post-construction mortality monitoring at Victorian wind farms vii
Figure 22 The estimated mortality rates from the simulation with monthly surveys at all 50 turbines Mortality rates of 1 5 and 10 deaths per annum (pa) are considered 43
Figure 23 Probability that at least one bat of a particular species was detected during monthly surveys over 2 years given the total number of annual mortalities for that species 44
Figure 24 Probability that at least one small bird of a particular species was detected during monthly surveys over 2 years given the total number of annual mortalities for that species 45
Figure 25 Probability that at least one medium-sized bird of a particular species was detected during monthly surveys over 2 years given the total number of annual mortalities for that species 46
Figure 26 Probability that at least one large bird of a particular species was detected during monthly surveys over 2 years given the total number of annual mortalities for that species 47
Investigation of post-construction mortality monitoring at Victorian wind farms 1
Summary
Context Wind energy is a significant component of the Victorian governmentrsquos commitment to renewable energy Assessment of potential impacts on birds and bats due to collisions with turbines is now routinely undertaken at operating wind farms and this includes post-construction mortality monitoring Monitoring programs vary considerably between wind farms in their objectives and design and in the intensity frequency and duration of monitoring Bird and bat carcasses that are found are documented and to estimate the total numbers of mortalities that are likely to have occurred on a wind farm correction factors are developed to factor in the level of sampling and site-specific detectability issues However despite many years of monitoring the accuracy of such estimates remains unclear and it is not yet known whether turbine collisions are having a significant impact on populations of birds and bats Therefore it is timely to conduct a review of the post-construction mortality monitoring that has been undertaken to date to assess what conclusions can be drawn from the available data and to develop options for improvements in the future
Aims The specific aims of this review are
to examine the existing post-construction mortality monitoring data to evaluate whether these data are adequate to estimate annual mortalities of birds and bats at wind farms
to generate a list of all the species known to have been killed by collisions with turbines at wind farms
to discuss possible approaches for assessing the cumulative and population-level impacts of multiple wind farms across the landscape
to develop options for future post-construction monitoring for wind farms and to discuss their advantages and disadvantages and
to identify key knowledge gaps that if filled would enable greater confidence in mortality assessments and in estimates of cumulative and population-level impacts
Methods The approach taken in analysing the existing post-construction mortality monitoring data from Victorian wind farms involved
collating information on the sampling approach undertaken by each wind farm in their post-construction mortality monitoring
collating the mortality records to provide an aggregate list of numbers of all species known to have been killed at Victorian wind farms (including non-threatened species for completeness and for comparison with threatened or migratory lsquospecies of interestrsquo1)
requesting the raw data from the subset of the wind farms that we assessed as potentially having sufficient data from the mortality searches searcher efficiency trials and carcass persistence trials to enable a detailed analysis of the annual mortality rates
for the wind farms where there was sufficient data undertaking analysis to estimate annual mortality rates and the range of plausible values for these estimates to provide an indication of uncertainty
comparing these annual mortality estimates with those calculated by the wind farms and
1 lsquoSpecies of interestrsquo is used instead of lsquospecies of concernrsquo because the latter list had not been finalised at the time of writing this report
(see Lumsden et al 2019)
2 Investigation of post-construction mortality monitoring at Victorian wind farms
undertaking simulations to determine the level of monitoring required to significantly reduce the uncertainty in the estimates of annual mortalities
Results Collation of existing data Data was collated from post-construction mortality surveys for 15 Victorian wind farms Survey methods varied markedly between wind farms (i) in the length of the monitoring program (most were for 2 years) (ii) in the proportion and absolute number of turbines searched (ranging from about one-third for larger wind farms to all turbines for smaller wind farms) (iii) in the frequency of monitoring (typically monthly) (iv) in whether monitoring was undertaken by people or dogs (v) in the size of the area under the turbines searched and the search pattern (vi) in the rigour of the searcher efficiency trials (there was large variability in the number and types of carcasses used) and (vii) in the rigour of the carcass persistence trials (again there was large variability in the number and types of carcasses used) As a result the quality of the data collected varied markedly with higher quality data collected at some wind farms compared to others A key finding of this component of the review was that searcher efficiency trials were typically not undertaken as true blind trials despite this often being specified in the Bat and Avifauna Management Plans (BAM Plans) This significantly reduces confidence in the results of these trials
Collation of mortality records A total of 1011 bats or birds have been found dead at Victorian wind farms (based on the data available to February 2018) with bats representing 44 and birds 56 of the total Carcasses of at least 13 species of bats have been recorded at wind farms with the majority of bat records being of the White-striped Freetail Bat (Austronomus australis) (67) There were eight mortality records of one species of interest the Critically Endangered Southern Bent-wing Bat (Miniopterus orianae bassanii) At least 58 species of birds have been found dead but approximately one-quarter of the birds found dead were unable to be identified to species level so this number may be an underestimate The most commonly recorded bird species in the mortality records were the Australian Magpie (Cracticus tibicen) (20) and the Wedge-tailed Eagle (Aquila audax) (10) Eight bird species listed as species of interest have been recorded as found dead at Victorian wind farms For six of these species (Black Falcon Falco subniger Fairy Prion Pachyptila turtur Fork-tailed Swift Apus pacificus Little Button-quail Turnix velox Spotted Harrier Circus assimilis and White-bellied Sea-Eagle Haliaeetus leucogaster) only a single individual has been found to date The remaining two species of interest which are listed under the provisions of the Commonwealth Environment Protection and Biodiversity Conservation Act 1999 (EPBC Act) for migratory species the Short-tailed Shearwater (Ardenna tenuirostris) and the Vulnerable White-throated Needletail (Hirundapus caudacutus) have been found dead nine and five times respectively These numbers represent just a subset of the birds and bats that will have been killed at wind farms because many individuals will have been lost or scavenged in between monitoring events not detected during monitoring killed at turbines that are not monitored or killed after monitoring had been completed Accordingly further analysis is required to estimate actual annual mortality rates
Analysis of annual mortality rates Raw data was requested from the operators of six wind farms thought to potentially have sufficient data suitable for analysis A full list of the types of data needed was provided to the operators This list highlights the level of data required for comprehensive estimates of annual mortality rates Our assessment of the data that was available to us at the time of our analysis was that only two wind farms had sufficient data for rigorous analysis but that some of the data from three other wind farms could be included in the overall assessment of the searcher efficiency trials and the carcass persistence trials In general birds especially large or medium-sized birds were more likely to be found than bats Purpose-trained dogs were more effective at finding bats than human searchers however humans appear to have been marginally better at finding birds (although as the searcher trials were not truly blind trials there is some doubt regarding the accuracy of the human efficiency rates in particular) For both bats and birds there was a large amount of uncertainty in the mortality estimates as revealed by the large range in the 95 credible bounds The carcass persistence trials showed that birds remained on site and hence available to be found for much longer than bats (estimates of 33 vs 8 days) although again there was a high degree of uncertainty in the estimates Site-specific searcher efficiency estimates and carcass persistence rates were incorporated into the model of annual mortality rates for the two wind farms with sufficient data enabling an estimate of the number of individuals killed per year and the range of plausible values of this estimate The White-striped Freetail Bat had the highest annual mortality rate of any native species of bird or bat at both wind farms with estimates of 397 individuals killed per year (range 211ndash634) at one wind farm and 378 individuals killed per
Investigation of post-construction mortality monitoring at Victorian wind farms 3
year (range 168ndash672) at the other One Southern Bent-wing Bat was found dead at one of these two wind farms during mortality monitoring with the mortality model estimating an annual mortality rate of 14 individuals (range 0ndash70) at that wind farm Mortality estimates for the two bird species of interest found dead at one of the wind farms also had high levels of uncertainty
Comparisons of our estimates of mortality rates with those presented by the wind farms We compared our estimates of mortality rates for bats small birds medium-sized birds and large birds at the two wind farms where we undertook detailed analysis with those provided by the wind farm operators While some of the provided estimates were fairly similar to ours our analysis suggested that the wind farm operators had underestimated the uncertainty in the figures our confidence intervals were much larger In some cases the operatorsrsquo estimates differed significantly from ours but we were not able to explain these differences since the analyses were based on the same raw data Many of the other wind farms also undertook annual mortality estimates however based on the data made available to us we considered that it was insufficient to determine valid annual mortality estimates
Simulations to investigate the likelihood of detecting mortalities of different size classes of birds and bats These simulations indicated the proportion of turbines that would need to be searched each month to have confidence that if a certain number of individuals of particular size classes of birds or bats were killed at least one of them would be detected These simulations suggested that for most size classes a higher level of sampling than typically occurs at present would be needed in order to have confidence in the findings
Population and cumulative impacts Obtaining accurate estimates of annual mortality rates is just the first step in assessing whether wind farms are impacting the various species of birds and bats The next step is determining whether the mortality rates are having a negative impact on the Victorian population of the relevant species The third step is determining whether there is a cumulative impact on the relevant populations as a result of mortalities occurring at multiple wind farms These latter two issues are very difficult to resolve A range of modelling approaches (such as Population Viability Analysis Integrated Population Modelling and Potential Biological Removal Modelling) each with their advantages and disadvantages can be informative however for many species the required basic demographic data is lacking which would necessitate the use of more assumptions and hence reduce confidence in the findings For some key species the collection of additional demographic data is likely to be required Planning regulators have increasingly called for consideration of cumulative impacts from multiple wind farms however methods of assessing cumulative impacts are yet to be developed There are a number of challenges that need to be overcome before a sound assessment of the cumulative impacts of wind farms in Victoria can be made These include (i) the need for reduced uncertainties in the mortality estimates from individual wind farms (ii) the need for all assessments to be undertaken using an agreed set of standards (iii) the need for mortality estimates to be undertaken over the entire lifetime of a wind farm (iv) the need for greater understanding of the impact of other anthropogenic causes of declines in populations and (v) the need for the effects of all existing wind farms to be available before the likely effects of a new one can be predicted which requires a centralised coordinated repository for all relevant information
Conclusions and implications
Conclusions Examination and analysis of existing post-construction mortality monitoring data from Victorian wind farms found that monitoring undertaken at many wind farms was not designed or undertaken in a manner that would enable valid estimation of total mortalities The data available to us was deemed to be sufficient to enable statistical analysis to be validly applied in the estimation of total mortalities at only two of the 15 wind farms with mortality monitoring Even for those two wind farms the estimates had very large credible intervals due to factors that can introduce uncertainty even in well-designed monitoring programs especially in relation to the likelihood of detection of carcasses The capacity to detect carcasses is influenced by the frequency of searches the proportion of the turbines searched and how the searches are undertaken The likelihood of finding carcasses also varies according to the body size of birds and bats (it is greater for large birds than for small birds and bats) and it varies depending on whether dogs or humans undertake the searches There was marked variation in searcher efficiency and carcass persistence rates between wind farms indicating that trials need to be carried out at each wind farm and that findings cannot be transferred from one wind farm to another
Future options for assessing the impact of wind farms on birds and bats It is apparent from our analysis of the available data that it is currently very difficult to obtain accurate estimates of the total number of
4 Investigation of post-construction mortality monitoring at Victorian wind farms
mortalities caused by collisions with wind turbines If improvements are sought changes to the existing monitoring approach are required We outline seven potential options and list their advantages and disadvantages The options include abandoning the current practice of post-construction mortality monitoring at individual wind farms altogether continuing the existing approach but increasing efforts to ensure it is undertaken adequately and comprehensively either with greater guidance from the Department of Environment Land Water and Planning (DELWP) or being undertaken by DELWP just focus mortality monitoring on key species of concern replacing the current approach with a more comprehensive assessment aimed at addressing key unknowns at a selected sample of wind farms or implementing a centrally designed landscape approach to assessing population trends and all causes of mortality for each of the species of concern
Key knowledge gaps While our knowledge of the risk to birds and bats of collisions at wind farms has improved there remains much to be learnt before we have a full understanding of the impacts of wind turbines The gaps in knowledge fall into three categories (i) the need for a more comprehensive understanding of the rate at which species especially key species of concern (Lumsden et al 2019) are being killed by collisions with wind turbines (ii) the need for greater understanding of why particular species are being killed and what the key risk factors are and (iii) the need for a greater understanding of the impact of the annual mortalities on the viability of the populations of species of concern factoring in cumulative impacts as well as population-level impacts Filling these knowledge gaps would enable the impacts from wind farms to be put into context with other threats to the species and provide a better indication of whether wind farms are putting greater stress on threatened species and increasing their risk of extinction
Investigation of post-construction mortality monitoring at Victorian wind farms 5
1 Introduction
11 Context The Victorian Government is committed to growing the renewable energy sector and has set targets of 25 renewable energy by 2020 and 40 by 2025 Increased use of wind energy is a significant component of this commitment The assessment of potential impacts on birds and bats is now a routine consideration in commercial-scale wind energy projects in Victoria due to the possibility of in-flight collisions with wind turbines or associated infrastructure eg transmission lines High levels of mortalities have been recorded at some international wind farms (Frick et al 2017 Hayes 2013 Lehnert et al 2014) but the reported mortality rates are highly variable and there remains uncertainty about the impact of Victorian wind farms on bird and bat populations
The Victorian Government has published Policy and Planning Guidelines for Development of Wind Energy Facilities in Victoria These guidelines have been updated a number of times since their first issue in 2003 The most recent version was issued in November 2017 (DELWP 2017) The guidelines include an example set of permit conditions including conditions for the management of effects on birds and bats (Appendix 1) The permit conditions specify that the development and regulatory approval of a Bat and Avifauna Management Plan (BAM Plan) is required for each wind farm Previous iterations of the guidelines have contained example permit conditions that have differed somewhat from the 2017 version so the operating wind farms in Victoria have been subject to a variety of permit conditions Nonetheless approval of the majority of wind energy facilities in Victoria has routinely been subject to conditions that include requirements to monitor and report mortalities of birds and bats due to collisions with turbines As a consequence monitoring of collision mortalities has been carried out at most wind farms in Victoria but the details of monitoring programs have varied considerably over time and between wind farms with differences in the objectives design intensity frequency and duration of monitoring regimes
Collision mortality monitoring documents the numbers of bird and bat mortalities that are detected To estimate the total number of mortalities for a wind farm correction factors are developed to account for the frequency of monitoring proportion of turbines monitored site-specific detection factors individual searcher efficiency and the duration carcasses may persist in the environment (which is affected by scavenging and decay rates) Where the number of carcasses detected is small (as is often the case) derived estimates necessarily have very large confidence intervals
Despite the fact that monitoring has now been carried out at multiple wind farms in Victoria for a number of years and derived estimates of mortalities have been attempted at many of these wind farms it remains unclear whether turbine collisions are having a significant impact on fauna populations In addition while it is apparent that multiple wind energy facilities may have cumulative effects on populations and regulatory consent processes have increasingly recognised the potential for cumulative effects to occur this aspect has not yet been addressed
Therefore it is timely to conduct a review of the post-construction mortality monitoring undertaken to date to evaluate what can be drawn from this data and to outline options for future improvements
It is important that monitoring of fauna collisions at a wind farm is undertaken to meet clearly defined objectives The overarching purpose of monitoring fauna collisions is to determine whether the mortalities that occur are sufficient to result in a negative impact on the functioning of the Victorian population of any species of conservation concern either as a result of the total number of mortalities occurring at the particular wind farm alone or in combination with other wind farms
12 Report objectives and scope
This report has been prepared in order to evaluate the utility and effectiveness of collision monitoring at individual wind farms with respect to the requirement to monitor and report mortalities of birds and bats resulting from collisions with turbines The primary intention of the report is to highlight key learnings with a view to improving the capacity for investigations at wind farms to achieve or contribute to better
6 Investigation of post-construction mortality monitoring at Victorian wind farms
understanding of the effects of turbine collisions on important wildlife populations It also provides a discussion of population-level effects and of cumulative impacts outlining issues and requirements for achieving effective assessment of such effects
This report concentrates on the impact of the collisions of birds and bats with wind turbines There are a number of other potential effects of wind energy facilities on wildlife These include habitat loss disturbance due to the construction and subsequent operation of a wind farm (associated with turbines vehicles people etc) collisions with overhead powerlines and avoidance of the site because of the presence of turbines However a number of these effects are common to other types of development approvals (eg for urban development or other infrastructure) and most of these effects are not quantifiable in the way that collision mortalities are In addition permit conditions have placed particular emphasis on bird and bat mortality due to turbine collisions It is thus important to review this specific effect of wind energy
Consideration of turbine collisions in Victoria is focused on species of conservation concern The criteria for determining the relevant species are detailed in Lumsden et al (2019) Permit conditions and BAM Plans for many wind farms in Victoria have simply required monitoring and total mortality estimation for all bird and bat species Although many species recorded during the monitoring are thus not of conservation concern the information and learnings obtained from monitoring all species has provided a dataset that has been more useful for analyses of techniques and methods than would have been obtained by monitoring just selected species
Death of microbats from traumatic injury to the respiratory tract (barotrauma) was first described by Baerwald et al (2008) It is presumed to be associated with rapid changes in air pressure close to rotating turbine blades It has since been questioned as a real effect due to difficulties with accurate diagnosis from retrieved carcasses (Rollins et al 2012) Barotrauma is not known to have been diagnosed as a cause of death in bats at Victorian wind farms but for the purposes of this review all bat carcasses detected during monitoring of wind farms were treated as mortalities due to interactions with turbines
As noted by Masden et al (2010) it is useful to distinguish the terms lsquoeffectrsquo and lsquoimpactrsquo ldquoAn impact is the ultimate change due to an effect with the effect being the proximate response of an individual to an actionrdquo This distinction is of particular relevance in the present context where a turbine or a wind farm may have an effect on individual bats or birds but the focus of the impact assessment is on changes that may impact the species population
The specific objectives of this review are
to examine the existing post-construction mortality monitoring data to evaluate whether this data is adequate to estimate annual mortalities of birds and bats at wind farms and to assess the effectiveness of the BAM Plan monitoring designs in meeting the objectives outlined in the plans
to generate a list of all species known to have been killed by collisions with wind turbines
to discuss options for assessing cumulative and population-level impacts of multiple wind farms across the landscape
to develop options for future post-construction mortality monitoring for wind farms and discuss their advantages and disadvantages and
to identify key knowledge gaps that if filled would enable greater confidence in annual mortality estimates and cumulative and population-level impacts
13 Overview of approach In essence there are three potential steps required to obtain an understanding of the impact of mortalities on a population of concern
1 The first step is to accurately estimate total turbine-caused mortalities at a wind farm over a specific period determined on the basis of carcasses detected during a monitoring program incorporating the efficiency of the searches (Huso et al 2017)
Investigation of post-construction mortality monitoring at Victorian wind farms 7
2 The second step is to determine whether the mortality rates occurring at the wind farm might have a negative impact on the Victorian population of relevant species
3 The third step is to determine whether there is a cumulative impact on the relevant population as a result of mortalities occurring at multiple wind farms
To date monitoring at most wind farms in Victoria has attempted the first step only Steps 2 and 3 are not likely to be the responsibility of any individual wind farm operator but the objective of monitoring will only be met if they are addressed A consideration of the three steps is set out in this report
This report starts with a brief description of the processes used to monitor collisions and to apply the results to estimate total collision mortalities for a wind farm Our investigation of the data that has been collected to date from operating wind farms in Victoria is described A summary of the numbers of each bird and bat species reported dead at Victorian wind farms during post-construction mortality monitoring programs is provided including the numbers of threatened or migratory species mortalities recorded Analysis of the data used a hierarchical approach in which an initial assessment determined whether based on the data extracted from individual wind farm reports there was likely to be sufficient suitable data for subsequent statistical analyses The raw data was then requested from those wind farms The data from the wind farms that were found to have sufficient data were then analysed to estimate total mortalities These estimates were then compared with the annual mortality estimates provided by the wind energy operators and differences in the analytical approach taken or the assumptions made were considered
The primary purpose of the analyses was to obtain key learnings to inform the design of future monitoring and estimates of total mortalities at wind farms To that end a series of simulation exercises were undertaken to determine how incremental increases in monitoring effort particularly in the proportion of turbines searched might improve capacity to detect mortalities and reduce uncertainty in mortality estimation
The report also considers population-level and cumulative impacts on species of concern particularly to review what may be required to achieve such broader assessments It then outlines future potential options for assessing the impact of wind farms on birds and bats It concludes with a summary of what has been learnt to date and of the remaining key knowledge gaps
8 Investigation of post-construction mortality monitoring at Victorian wind farms
2 Analyses of data collected during post-construction
mortality monitoring at Victorian wind farms
21 Overview of methods used to estimate total mortalities for individual wind farms
The objective of investigating turbine mortalities must be explicit because it influences the design of the monitoring regimes and subsequent analyses of the results It can be reiterated as follows
The purpose of monitoring fauna collisions is to determine whether the mortalities that occur are sufficient to result in a negative impact on the functioning of the Victorian population of any species of conservation concern either as a result of the total number of mortalities occurring at the particular wind farm alone or in combination with other wind farms
Methods for detecting collision mortalities and for using the results of such monitoring to estimate total numbers of collisions have been developed and applied internationally A recent review of monitoring program designs and processes is provided in Huso et al (2017) and the concepts described there form the basis of techniques used for this purpose in Victoria
Since it is not feasible to detect every individual that collides with a turbine ndash or to be certain of having done so ndash any monitoring regime will necessarily be a sampling exercise Hence the objective requires that a monitoring regime must be designed in such a way that it has capacity both to detect the highest possible proportion of the mortalities of species of concern and to facilitate sound estimation of the total number of such mortalities that are occurring
There are three fundamental issues related to estimation of the number of collision mortalities that may occur at a wind farm It is important to recognise the potential influences of all three
1 A monitoring program must be designed for the purpose of estimating total numbers of mortalities A program that does not have inherent capacity to do so is of no value
2 A well-designed and appropriate program of monitoring will necessarily be a sampling exercise in that it is not feasible to detect every carcass Imperfect detection is due to a variety of factors and can result in an uncertain proportion of mortalities actually being detected Such factors include
searching a subset of the turbines rather than all of them
searching only a prescribed area under turbines with the potential for some animals to be flung outside the search area or to be injured and die later off site
carcass decay and loss due to scavengers or wind resulting in the need to do carcass persistence trials
the length of time between monitoring sessions resulting in some carcasses being lost before the next sampling session and
imperfect searcher detection resulting in not all carcasses that are present being found necessitating searcher efficiency trials
3 A further factor is the uncertainty associated with small numbers of relatively infrequent events Because it is not feasible to be certain of detecting every carcass the uncertainty around estimation of the total mortalities increases as the number of detections decreases Thus where a monitoring program finds no carcasses of a rare species this cannot be interpreted as demonstrating that no collisions have occurred
As a result of the limitations associated with issues 2 and 3 final estimates of total numbers of mortalities are usually imprecise and generally have large associated confidence intervals even when a study has been based on a sound design
Investigation of post-construction mortality monitoring at Victorian wind farms 9
Methods to account for the variables in issue 2 are essential components of monitoring studies They include trials to ascertain rates of carcass persistence and searcher detection rates and extrapolations to account for monitoring interval number of turbines searched and search area These methods are necessary and appropriate but must also be properly designed to achieve their intended purposes Of themselves they introduce further variables and uncertainties
22 Variability in methods used during post-construction mortality monitoring at Victorian wind farms
In an attempt to document the methods used for post-construction mortality monitoring at the currently operating Victorian wind farms information on sampling approach was collated from annual and final reports from each facility This information was collated in mid-2017
Surveys to detect carcasses resulting from turbine collisions have been undertaken at 15 wind farms Ararat Bald Hills Cape Bridgewater Cape Nelson North and Cape Sir William Grant Cape Nelson South Challicum Hills Chepstowe Hepburn Macarthur Mortons Lane Mt Mercer Oaklands Hill Toora Waubra and Yambuk Two other wind farms that were constructed in the early 2000s were not required to undertake post-construction mortality monitoring at that time So as to not identify the mortality results from any particular wind farm in this report wind farms have been de-identified by using letters (eg Wind Farm A) rather than names
Survey methods varied in numerous aspects across the 15 wind farms including the following
The length of the monitoring program Most post-construction mortality monitoring programs were run over 2 years although some extended to 3 or 35 years For at least one facility the monitoring was deemed insufficient at the end of the 2-year period and a further 2 years of monitoring was required
The proportion and the absolute number of turbines searched The number of turbines varies markedly between wind farms from 140 turbines at one wind farm to 2 at another In total there are 699 turbines across the 17 existing facilities with a mean of 41 turbines per facility For some wind farms it was not always possible to ascertain from the available data the proportion of turbines that were monitored resulting in uncertainty in the sampling effort at those facilities For the facilities where this information was available the proportion of the turbines monitored varied with the size of the facility with some of the smaller facilities monitoring all turbines while at the larger facilities approximately one-third of the turbines were typically monitored
Frequency of monitoring Where monitoring frequency was documented it was typically undertaken monthly with an increase in sampling frequency to twice a month or weekly at some facilities especially during periods of high bat activity
Monitoring undertaken by people or dogs At some facilities the searches have been undertaken by people including both ecological consultants and technicians from the facilities resulting in potential variability in adherence to searching protocols Increasingly trained dogs have been used to undertake the mortality searches but there appears to have been some variability in the specificity of training of the dogs with some dogs having been trained specifically to find bats while others appear to have been more generally trained For some wind farms it was unclear whether dogs or people were used for the monitoring
The area under the turbines searched and the search pattern Some searches extended out to 50 m from the base of the turbine whereas others extended to 100 m (circular search area) Others covered a rectangular area of up to 280 x 280 m in size Trained dogs were permitted to roam over a defined search area because they use olfactory cues to locate carcasses whereas transects were walked when searches were carried out by people Transects were mostly either 6 or 12 m apart The search area was not documented for some facilities
Searcher efficiency trials The thoroughness and documentation of searcher efficiency trials varied markedly between wind farms Despite this data being a critical component of the calculations for annual mortality rates many wind farm facilities did not document how many trials were undertaken what types and size classes of animals were used in the trials or the detection rate for each group In
10 Investigation of post-construction mortality monitoring at Victorian wind farms
contrast some wind farms undertook extensive trials (eg 457 carcasses were used for the searcher efficiency trials at Wind Farm B) As the size of a bird or bat can influence a searcherrsquos ability to locate it the more effective trials used four different categories of carcasses bats small birds medium-sized birds and large birds The wind farms allocated species to size classes broadly corresponding to those outlined in Hull and Muir (2010) It was often difficult for the wind farms to obtain sufficient carcasses to use in the searcher efficiency and carcass persistence trials and surrogates were often used Some of these roughly resembled the target animal ndash eg mice used as a surrogate for bats (although the smell of mice would be different to that of bats) However in other trials the sample did not resemble the target ndash eg chicken breasts ndash and this is likely to have affected the results of the trials significantly A key failing of most if not all trials was that the trials were not truly blind Many of the BAM plans specify that searcher efficiency trials are to be undertaken lsquoblindrsquo ndash ie without the knowledge of the person conducting the search However this appeared not to be the case because often the searcher was told that the trial was occurring with some being informed of the number of carcasses used resulting in the searchers continuing until all carcasses were found Even if not explicitly told of the trial this would have become apparent when chicken breasts or species not expected to be found (eg turkeys used as a surrogate for Brolgas) started to be located during a search In some instances the searchers undertaking the mortality searches were not the same people who undertook the efficiency trial with no information on the efficiency of those undertaking the actual searches When trained dogs were used for searches the dogs themselves would have been blind to whether or not a trial was occurring However it was not explicitly stated whether dog handlers conducted trial searches in an identical manner to routine searches Even if there was no conscious bias there was a potential for bias to be relayed to the dogs unconsciously
Carcass persistence trials We use the term lsquocarcass persistencersquo to indicate the period in which a carcass may remain present and lsquoavailablersquo to be detected Trials of carcass persistence have often been termed lsquoscavenger trialsrsquo but there are multiple potential influences on persistence of carcasses in addition to removal by scavengers including natural decay activities of livestock use of agricultural machinery wind and rain
As for the searcher efficiency trials there was considerable variability between wind farms in the scale and thoroughness of the carcass persistence trials There was variation in the number and type of carcasses used the intervals between carcass checks and how the trials were documented No documentation was provided for some wind farms data was amalgamated for others and some used a single value for all types and size classes of carcasses whereas others indicated the extent of persistence variability between categories Since the length of time the carcasses remain available to be found before disappearing from the site is a critical component in the overall mortality estimates when this information has been collected or reported inadequately the ability to accurately generate mortality estimates is severely limited
23 Numbers of bats and birds found dead during mortality searches at Victorian wind farms
The number of individuals of each species of bat and bird that have been found dead at wind turbines during mortality surveys (or as incidental observations) at wind farms in Victoria has been collated We extracted this information from the annual or final reports [or in some cases from spreadsheets sent to the Department of Environment Land Water and Planning (DELWP)] from the 15 wind farms where mortality monitoring has been undertaken These data span from February 2003 to February 2018 While relatively comprehensive the compiled list is based on the data available to us and it is possible that some data is missing
Although the main concern is for listed threatened or migratory species that are killed due to collisions with wind turbines we have collated the available data for all species for completeness and to enable comparisons between threatened and non-threatened species A science-based approach for determining species that should be considered lsquoof concernrsquo in relation to wind farm developments has recently been published (Lumsden et al 2019) The first step in this process was to define from a policy perspective a list of lsquospecies of interestrsquo from which a list of lsquospecies of concernrsquo could then be derived based on the likelihood and consequences of collisions lsquoSpecies of interestrsquo are considered to be any species of bird or bat on the
Investigation of post-construction mortality monitoring at Victorian wind farms 11
Advisory List of Threatened Vertebrate Fauna in Victoria (DSE 2013) or listed under either the Victorian Flora and Fauna Guarantee Act 1988 (the FFG Act) or the Commonwealth Environment Protection and Biodiversity Conservation Act 1999 (the EPBC Act) or any bird species listed as migratory under the EPBC Act irrespective of whether it is considered threatened or not The relative risk for each species of interest was assessed as the basis for developing the list of lsquospecies of concernrsquo (Lumsden et al 2019) however the list of lsquospecies of concernrsquo was not finalised at the time of preparing this report As a result in this report reference is made to the list of lsquospecies of interestrsquo rather than the list of lsquospecies of concernrsquo
231 Bats
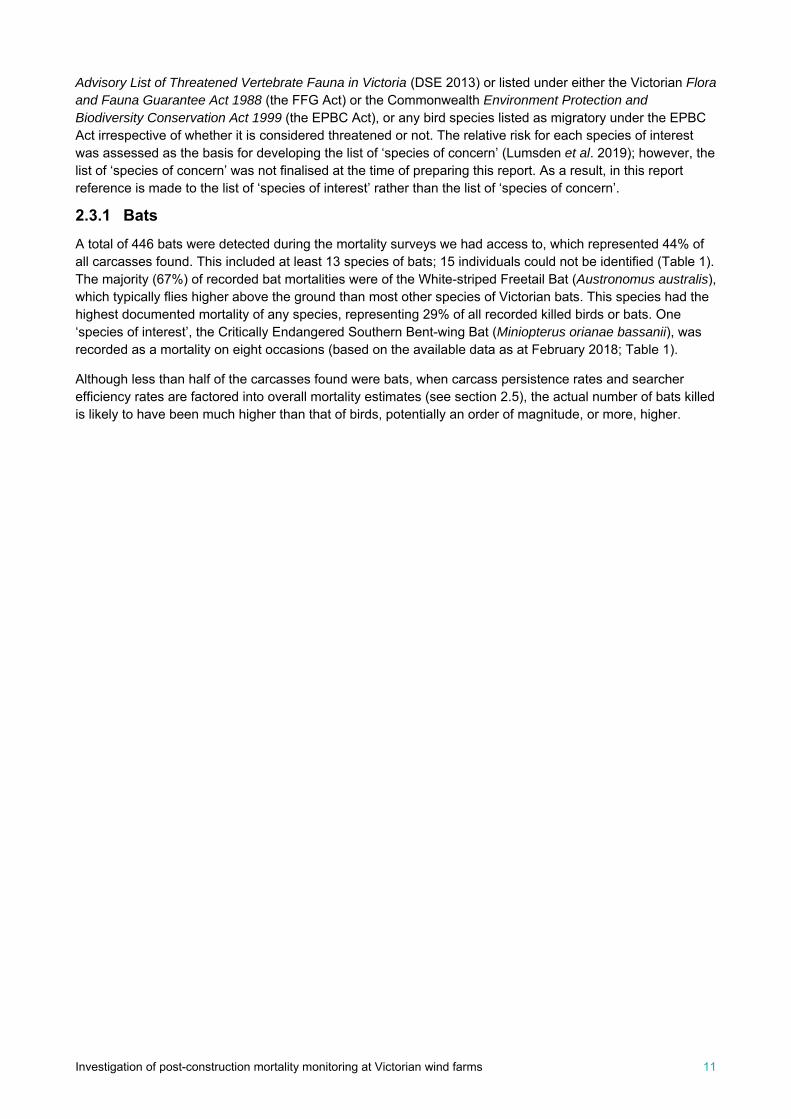
A total of 446 bats were detected during the mortality surveys we had access to which represented 44 of all carcasses found This included at least 13 species of bats 15 individuals could not be identified (Table 1) The majority (67) of recorded bat mortalities were of the White-striped Freetail Bat (Austronomus australis) which typically flies higher above the ground than most other species of Victorian bats This species had the highest documented mortality of any species representing 29 of all recorded killed birds or bats One lsquospecies of interestrsquo the Critically Endangered Southern Bent-wing Bat (Miniopterus orianae bassanii) was recorded as a mortality on eight occasions (based on the available data as at February 2018 Table 1)
Although less than half of the carcasses found were bats when carcass persistence rates and searcher efficiency rates are factored into overall mortality estimates (see section 25) the actual number of bats killed is likely to have been much higher than that of birds potentially an order of magnitude or more higher
12 Investigation of post-construction mortality monitoring at Victorian wind farms
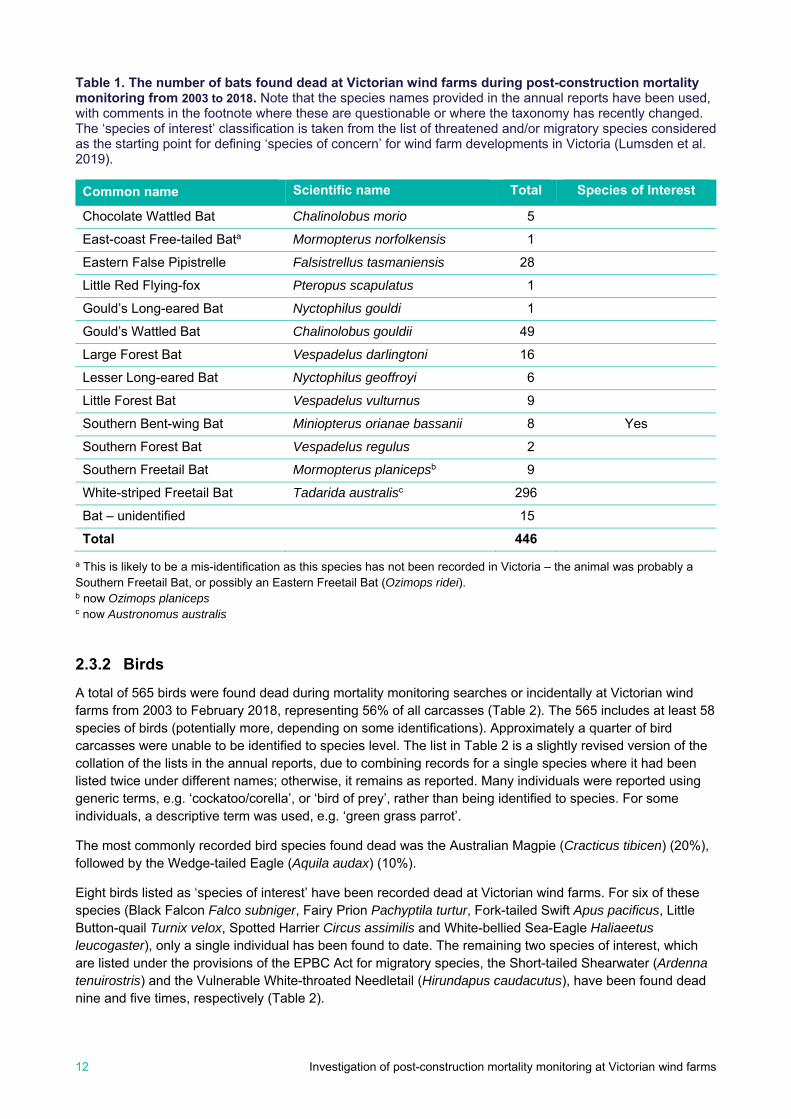
Table 1 The number of bats found dead at Victorian wind farms during post-construction mortality monitoring from 2003 to 2018 Note that the species names provided in the annual reports have been used with comments in the footnote where these are questionable or where the taxonomy has recently changed The lsquospecies of interestrsquo classification is taken from the list of threatened andor migratory species considered as the starting point for defining lsquospecies of concernrsquo for wind farm developments in Victoria (Lumsden et al 2019)
Common name Scientific name Total Species of Interest
Chocolate Wattled Bat Chalinolobus morio 5
East-coast Free-tailed Bata Mormopterus norfolkensis 1
Eastern False Pipistrelle Falsistrellus tasmaniensis 28
Little Red Flying-fox Pteropus scapulatus 1
Gouldrsquos Long-eared Bat Nyctophilus gouldi 1
Gouldrsquos Wattled Bat Chalinolobus gouldii 49
Large Forest Bat Vespadelus darlingtoni 16
Lesser Long-eared Bat Nyctophilus geoffroyi 6
Little Forest Bat Vespadelus vulturnus 9
Southern Bent-wing Bat Miniopterus orianae bassanii 8 Yes
Southern Forest Bat Vespadelus regulus 2
Southern Freetail Bat Mormopterus planicepsb 9
White-striped Freetail Bat Tadarida australisc 296
Bat ndash unidentified 15
Total 446
a This is likely to be a mis-identification as this species has not been recorded in Victoria ndash the animal was probably a Southern Freetail Bat or possibly an Eastern Freetail Bat (Ozimops ridei) b now Ozimops planiceps c now Austronomus australis
232 Birds
A total of 565 birds were found dead during mortality monitoring searches or incidentally at Victorian wind farms from 2003 to February 2018 representing 56 of all carcasses (Table 2) The 565 includes at least 58 species of birds (potentially more depending on some identifications) Approximately a quarter of bird carcasses were unable to be identified to species level The list in Table 2 is a slightly revised version of the collation of the lists in the annual reports due to combining records for a single species where it had been listed twice under different names otherwise it remains as reported Many individuals were reported using generic terms eg lsquocockatoocorellarsquo or lsquobird of preyrsquo rather than being identified to species For some individuals a descriptive term was used eg lsquogreen grass parrotrsquo
The most commonly recorded bird species found dead was the Australian Magpie (Cracticus tibicen) (20) followed by the Wedge-tailed Eagle (Aquila audax) (10)
Eight birds listed as lsquospecies of interestrsquo have been recorded dead at Victorian wind farms For six of these species (Black Falcon Falco subniger Fairy Prion Pachyptila turtur Fork-tailed Swift Apus pacificus Little Button-quail Turnix velox Spotted Harrier Circus assimilis and White-bellied Sea-Eagle Haliaeetus leucogaster) only a single individual has been found to date The remaining two species of interest which are listed under the provisions of the EPBC Act for migratory species the Short-tailed Shearwater (Ardenna tenuirostris) and the Vulnerable White-throated Needletail (Hirundapus caudacutus) have been found dead nine and five times respectively (Table 2)
Investigation of post-construction mortality monitoring at Victorian wind farms 13
Table 2 The number of birds found dead at Victorian wind farms during post-construction mortality monitoring from 2003 to 2018 The lsquospecies of interestrsquo classification is taken from the list of threatened andor migratory species considered as the starting point for defining lsquospecies of concernrsquo for wind farm developments in Victoria (Lumsden et al 2019)
Common name Scientific name Total Species of interest
Identified to species level
Australasian Pipit Anthus novaeseelandiae 2
Australian Hobby Falco longipennis 1
Australian Magpie Cracticus tibicen 115
Australian Raven Corvus coronoides 1
Australian White Ibis Threskiornis molucca 1
Barn Owl Tyto alba 1
Black-shouldered Kite Elanus axillaris 3
Black Falcon Falco subniger 1 Yes
Black Swan Cygnus atratus 1
Brown Falcon Falco berigora 48
Brown Goshawk Accipiter fasciatus 3
Brown Songlark Megalurus cruralis 1
Buff-banded Rail Gallirallus philippensis 1
Collared Sparrowhawk Accipiter cirrhocephalus 1
Common Bronzewing Pigeon Phaps chalcoptera 1
Common Starlinga Sturnus vulgaris 8
Crested Pigeon Ocyphaps lophotes 1
Crimson Rosella Platycercus elegans 1
Dusky Woodswallow Artamus cyanopterus 1
Eurasian Skylarka Alauda arvensis 42
European Goldfincha Carduelis carduelis 6
Fairy Prion Pachyptila turtur 1 Yes
Fluttering Shearwater Puffinus gavia 1
Fork-tailed Swift Apus pacificus 1 Yes
Galah Eolophus roseicapilla 3
Grey Teal Anas gracilis 1
Guinea Fowla Numida meleagris 2
Hoary-headed Grebe Poliocephalus poliocephalus 1
Horsfieldrsquos Bronze-Cuckoo Chrysococcyx basalis 1
House Sparrowa Passer domesticus 5
Little Button-quail Turnix velox 1 Yes
Little Eagle Hieraaetus morphnoides 1
Little Raven Corvus mellori 3
Magpie-lark Grallina cyanoleuca 13
Nankeen Kestrel Falco cenchroides 54
New Holland Honeyeater Phylidonyris novaehollandiae 1
Noisy Miner Manorina melanocephala 1
Pacific Black Duck Anas superciliosa 3
Peregrine Falcon Falco peregrinus 2
Purple Swamphen Porphyrio melanotus 1
Red-rumped Parrot Psephotus haematonotus 3
Sacred Kingfisher Todiramphus sanctus 1
Short-tailed Shearwater Ardenna tenuirostris 9 Yes
14 Investigation of post-construction mortality monitoring at Victorian wind farms
Common name Scientific name Total Species of interest
Silver Gull Chroicocephalus novaehollandiae
2
Silvereye Zosterops lateralis 1
Southern Fulmar Fulmarus glacialoides 1
Spotted Harrier Circus assimilis 1 Yes
Straw-necked Ibis Threskiornis spinicollis 3
Stubble Quail Coturnix pectoralis 1
Sulphur-crested Cockatoo Cacatua galerita 2
Swamp Harrier Circus approximans 6
Wedge-tailed Eagle Aquila audax 58
Welcome Swallow Hirundo neoxena 4
Whistling Kite Haliastur sphenurus 5
White-bellied Sea-eagle Haliaeetus leucogaster 1 Yes
White-throated Needletail Hirundapus caudacutus 5 Yes
Identified to a category of bird
Bird of prey 2
Corellacockatoo 7
Duck sp 2
Finch sp 1
Green grass parrot 2
Gull sp 1
Ibis 1
Ravencrow 41
Unknown bird 69
Total 565
a introduced species
Note that this data is based on the mortality monitoring which will have detected only a subset of the birds and bats that were killed at wind turbines because many individuals would have been lost or scavenged in between monitoring events In addition not all individuals present during the monitoring searches may have been detected all turbines are not usually searched and in some cases the areas searched under turbines were smaller than the potential fall zone Therefore the number of carcasses found is an underestimate of the actual number of individuals killed In addition if some species are more or less likely to be scavenged or found the relative proportions of each species detected may be misrepresented These figures also do not factor in the likelihood of species using the types of habitats within the vicinity of the existing wind farms Nevertheless these figures give at least a baseline list of the species known to have been killed In order to estimate actual mortality rates further detailed analysis is required
24 Suitability of the data for statistical analyses As outlined in section 22 there was considerable variability in the quality and quantity of the post-construction mortality monitoring data from the 15 wind farms for which monitoring data was available Based on our assessment it was considered that only six of these potentially had sufficient suitable data to validly attempt more detailed statistical analysis to estimate annual mortality rates Accordingly the raw data from all searches and trials was requested from these six wind farms So that the individual wind farms from which this data was obtained are not identifiable they are referred to as Wind Farms A B C D E and F in this report (Table 3)
Investigation of post-construction mortality monitoring at Victorian wind farms 15
The following data was requested
1 Turbine details ndash details of the location size height and proximity to potential wildlife habitat for each turbine within a wind farm development
2 Searcher efficiency trials ndash details of the methods and results of each searcher efficiency trial undertaken with different carcass types including if the trials were blind if dogs were used the configuration of the search area the area and pattern over which the carcasses were distributed and the vegetation cover at the time of the trial
3 Carcass persistence trials ndash details of the methods used and the results of trials including the types of carcasses vegetation cover number of checks weather in intervening period condition of carcasses when found and any pest control at the time
4 Mortality surveys ndash details of methods used and findings which turbines were searched if dogs were used weather conditions search area vegetation cover percentage of time each turbine was operational prior to the search condition of carcass and distance carcass was from the base of the turbine
5 Incidental finds of carcasses outside of the mortality surveys including turbine number date species condition vegetation cover distance from the base of the turbine and if the carcass was removed or left in place to be included in the mortality surveys
This list indicates the level of detail required to comprehensively and rigorously estimate annual mortality rates and is outlined in more detail in Appendix 2
All six wind farms provided their raw data for this analysis in November 2017 The raw data relating to mortality monitoring and searcher efficiency and carcass persistence rates varied in quality and quantity The following issues were identified with respect to the data collection process
The searcher efficiency trials were never blind
There were often insufficient searcher efficiency andor carcass persistence trials
Some estimates were provided for the searcher efficiency or carcass persistence rates rather than the raw data on which these estimates were based
The location of the carcasses was not consistently recorded in either the searcher efficiency trials or the mortality surveys
The distance from a turbine to where a carcass was detected was not consistently recorded
Searchers were not always specific in their naming of species detected
Surveys where no mortalities were observed were not always recorded
Potential variation in detection and carcass persistence rates were not explored thoroughly For instance investigation of differences in rates due to seasonality or substrate where the carcass was found was rarely attempted
Unsuitable carcass surrogates were used in some trials
16 Investigation of post-construction mortality monitoring at Victorian wind farms
Table 3 Total number of reported turbine surveys and numbers of individual carcasses used in searcher efficiency trials and carcass persistence trials at the six wind farms where raw data was requested for further analysis based on data received in November 2017 The raw data for the searcher efficiency and carcass persistence trials were not supplied for Wind Farm D The data from two wind farms (Wind Farms E and F) are combined into a single category because much of the data that was supplied had been combined
Wind farm Total turbine surveys
Total number of carcasses in searcher efficiency trials
Total number of carcasses in carcass persistence trials
Wind Farm A 799 136 79
Wind Farm B 1385 560 276
Wind Farm C 360 40 40
Wind Farm D 148 Not supplied Not supplied
Wind Farms E amp F 1504 74 46
25 Methods used to analyse mortality rates The raw data provided from the six wind farms was used to undertake statistical analysis to estimate searcher efficiency and carcass persistence rates and where possible annual mortality rates The approach used for these analyses is outlined below
251 Searcher efficiency trials
The raw data from the observer efficiency trials from five of the six wind farms were incorporated into a single analysis using a binomial model in a Bayesian framework (the Wind Farm D data could not be used as the raw data was not provided) The fixed effects in the model were the interaction of the type of carcass deployed (bat or bird) and the search method used (dog with handler or human only) Differences between searchers (and their ability to detect each carcass type) and wind farms were treated as random effects Birds of all sizes were combined for part of this analysis because not all wind farms distinguished size classes
Model estimates were constructed in the statistical program R (R Core Team 2018) and STAN using the package outlined in Buumlrkner (2017) Naiumlve (uninformative) priors were used for each parameter Four separate Monte Carlo Markov chains were run until they converged Once they had converged they were used to estimate the posterior distribution of each parameter The posterior distribution is an estimate of the distribution of the parameters of interest A parameter was considered to have strong evidence if its 95 credible interval did not include zero A credible interval in Bayesian analysis is similar to a confidence interval in frequentist statistics In Bayesian statistics there is a 95 probability that the true value of the parameter is within the 95 credible interval In frequentist statistics there is a 95 probability that when a 95 confidence interval is calculated for data of this sort the true value of the parameter falls within it
252 Carcass persistence trials
Carcass persistence rates from all locations were analysed as a group using a survival analysis model in a Bayesian framework The Weibull hazard rate used the type of carcass (bat or bird) as a fixed effect and the turbine nested within a wind farm as a random effect The survival analysis model allows for some right-censored data Right-censored data is where observations stopped before the event (in this case scavenging) occurred (Miller et al 1981) Model estimates were constructed in the same way as for the searcher efficiency trials
253 Mortality rate
The mortality rate (individuals killed per turbine per year) needs to take into account errors caused by the observation process A common formulation for adjusting the observed mortality rate is the following
120582119909
119901 119878 1
Investigation of post-construction mortality monitoring at Victorian wind farms 17
where 120582 is the adjusted mortality per turbine per year 119909 is the unadjusted mean number of mortalities per turbine per year 119901 is the probability of detecting the carcass and 119878 is the proportion of carcasses remaining since the last survey (Smallwood 2007) The probability of detecting a carcass may vary between species between searcher type (human or dog) and between individual searchers The searcher efficiency trials can be used to estimate the detection rates 119901 The probability that a carcass remains to be observed may vary between species and between turbines The carcass persistence trials can be used to estimate the proportion of carcasses that will remain 119878 One issue with this formulation is that if a species is killed but not detected then it is assumed that that species has zero mortality Bayesian models allow for the possibility that a species is killed but not detected in the surveys The details of how this possibility was included in the modelling are provided in Appendix 3
The model parameters were estimated using the program JAGS using the package ldquoR2jagsrdquo (Su and Yajima 2015) through the statistical program R (R Core Team 2018) Naiumlve priors were used for each parameter (ie an unconditional probability was assigned before any relevant evidence was taken into account) Four chains were run until they converged A parameter was considered to have strong evidence if its 95 credible interval did not include zero
The mortality rate model involves a series of assumptions These include
the probability of detecting a carcass of the same class (bat small bird medium-sized bird or large bird) is independent of species
the probability of detecting a carcass is independent of time and substrate
the probability of a carcass of the same class (bat small bird medium-sized bird or large bird) being scavenged or otherwise disappearing is independent of species
the probability of a carcass being scavenged or otherwise disappearing is independent of time
the distribution of carcasses under turbines is independent (ie carcasses are evenly spread over the area underneath the turbine) and
the area searched by the searcher is representative of the area where bats and birds would fall after colliding with the turbine
The formulation in equation 1 can be extended to include seasonal differences in mortality and carcass persistence rates decomposition rates background mortality rates crippling bias and search radius bias Decomposition rates refer to the numbers of individuals that decompose before they are able to be observed Background mortality refers to the underlying mortality rate in the area that is not related to wind turbines Crippling bias refers to individuals that are injured by the turbine but can move outside the search area before dying Search radius bias refers to individuals that are thrown by the turbine and land outside the search area However due to the way the data has been collected inclusion of these errors is not possible for many if any of the wind farms and therefore it was not able to be accounted for in the estimated mortality rates
26 Estimated mortality rates
261 Searcher efficiency trial results
There were searcher efficiency trial data from four of the wind farms where the raw data was obtained Wind Farm A Wind Farm B Wind Farm C and the combined Wind Farms E and F This combined data revealed differences in detection rates between bats and birds and differences between human observers and dogs The Bayesian detection model showed evidence that in general birds were more likely to be found than bats and that birds were found at a lower rate than expected when dogs were used (Table 4 Figure 1 and Appendix 4 Table A41) There was however a large amount of uncertainty in these figures as evidenced by the large range of values between the upper and lower 95 credibility bounds For example for human surveyors locating bats the median probability of detecting a bat was 57 however the range of plausible values was between 12 and 92 (Table 4) Additionally there was a reasonable amount of variation in the data from one searcher to another and from one wind farm to another The estimated standard deviation of
18 Investigation of post-construction mortality monitoring at Victorian wind farms
the random effects was 074 and 093 respectively (on the logit scale) which is large considering that the estimate for the largest fixed effect (where the observation trial was for a bird) was only 203 (in logit scale) This result indicated that there was a large difference between searchers and between locations hence extrapolating from particular searchers or specific locations to other searchers or locations without undertaking site-specific trials would not be reliable
Figure 1 Estimated detection probabilities (shown as percentages) for surveys undertaken using humans or dogs to locate bats and birds during the searcher efficiency trials (using the combined data from the four wind farms where the raw data was available)
Table 4 The probabilities (shown as percentages) of detecting a bat or a bird when present using either humans or dogs (using the combined data from the four wind farms where the raw data was available) Lower and upper bounds refer to the bounds of the 95 credible intervals for each estimate and indicate the precision of the estimate giving a range of plausible values
Species type Human or dog Detection probability Lower bound Upper bound
Bat Human 574 115 924
Bat Dog 729 184 970
Bird Human 911 493 990
Bird Dog 820 290 983
Wind Farm D was not included in this analysis because the raw data from the observer efficiency trials was not provided Instead a single figure for the average detection rate for birds and bats combined was provided which was 92 This estimate was similar to our estimated detection rate for birds using human searchers however it was different from our estimates for all the other combinations (Table 4)
Four different people and four different dogs were used in the searcher efficiency trials and the estimated detection rates varied between individual surveyors (Figure 2)
Investigation of post-construction mortality monitoring at Victorian wind farms 19
Figure 2 Estimated detection probabilities for four human surveyors and four dog surveyors undertaking searcher efficiency trials for bats and birds One dog was tested only on bats
262 Searcher efficiency trials discussion
The analysis of the searcher efficiency trials highlighted potential differences between human and dog detection rates and between the rates of detection of bats and birds (Table 5) There was strong evidence that human searchers were much better at detecting birds than bats There was less (but still substantial) evidence that dogs were better at detecting birds than they were at detecting bats (evidence ratio = 02) There was some evidence that birds were detected at a higher rate by humans than by dogs (evidence ratio gt 100) There was some evidence that bats were detected at a higher rate by dogs than by human searchers (evidence ratio = 13) This suggests that humans detect birds at a higher rate than dogs do whereas dogs detect bats at a higher rate than humans do which may be due to differences between humans and dogs in the use of visual versus olfactory cues
Complicating the matter further is the fact that none of the trials were true blind trials This means that searcher efficiency may have been increased (ie positively biased) because the searcher knew they were being assessed It is also likely that the bias was larger for human searchers than for dog searchers analogous to the differences between non-blind trials (human searcher knows) blind trials (handler knows so the dog could read cues) and double-blind trials (no-one knows) Comparing these results with those of a randomised blind trial for detection of bat carcasses in the UK (Mathews et al 2013) supports this contention of greater bias for human searches There the percentage of bat carcasses found by dogs (73) was very similar to the Victorian result (71 Table 5) but only 20 of carcasses were found by humans in the UK blind trial compared with over twice this rate (47) in Victoria where the searchers often knew they were being tested
In summary our analyses do not provide a clear indication of whether dogs or people provide better detection of bird or bat carcasses The relatively small amount of comparable data from Victorian wind farms and the lack of blind trials are likely to be principal reasons for this For the present it is probably best for future search regimes to use whichever is the most effective method for a particular site taking the target species into account
20 Investigation of post-construction mortality monitoring at Victorian wind farms
Table 5 A summary of the results of searcher efficiency trials for detecting bat and bird mortalities due to wind turbines (based on data from four wind farms)
Category HumanDog Carcasses deployed Carcasses found found
Bat Human 118 55 466
Bat Dog 110 78 709
Bat proxy Human 13 8 615
Bird Dog 6 5 833
Small bird Human 147 102 694
Small bird Dog 12 6 500
Medium bird Human 227 216 952
Medium bird Dog 60 49 817
Large bird Human 95 95 1000
Large bird Dog 21 18 857
Overall bird Human 469 413 881
Overall bird Dog 99 78 788
263 Carcass persistence trial results
There were detailed carcass persistence data available from four wind farms Wind Farm A Wind Farm B Wind Farm C and the combined Wind Farms E and F This combined data showed differences in carcass persistence rates between bats and birds The Bayesian survival model showed evidence that in general it took longer for birds to be completely scavenged or otherwise lost than it did for bats (Table 6 Figure 3 and Appendix 4b) Additionally there was some variation between wind farms and between individual wind turbines given that the random effects were non-zero The lsquoshapersquo parameter was less than zero (Appendix 4b) which indicates that the carcass persistence rate changed over time One factor influencing this result may be that fresh carcasses are more likely to be scavenged than older carcasses
Table 6 The estimated time carcasses remained on site before disappearing during carcass persistence trials Lower and upper bounds indicate the bounds of the 95 credible intervals for the estimates
Species type Estimated time remaining on site (days)
Lower bound Upper bound
Bats 79 49 120
Birds 331 209 497
The average time-to-disappearance that we calculated from the combined data from the four wind farms where raw data was available was substantially different to the single point estimate provided by Wind Farm D Wind Farm Drsquos Bat and Avifauna Mortality Monitoring (BAMM) report states that the carcass persistence rate had an average of 6 days with a standard error of 048 days which is considerably lower than the 33 days estimated for birds in our analysis (Table 6) However this estimate is similar to the period until the first evidence of disappearance of birds (estimated at 72 days) Given that we are interested in the probability of not detecting a bird (or bat) because it was scavenged or had otherwise disappeared recording partial disappearance of carcasses is not informative because there are still remains (eg feathers) present and available to be found
Investigation of post-construction mortality monitoring at Victorian wind farms 21
Figure 3 Estimated probabilities of carcass persistence for bats and birds during carcass persistence trials from the four wind farms where raw data was obtained
264 Carcass persistence trials discussion
Our analysis of the data from the carcass persistence trials showed clear differences between the persistence rates of bat and bird carcasses There was very strong evidence that bats were scavenged or otherwise lost at a much higher rate than birds with the average time-to-disappearance being over four times longer for birds This may be a result of there being more inedible parts of a bird eg feathers that could become dislodged and hence remain on the site for a longer time and also be recognisable In addition due to the small size of most bats the whole carcass may be more likely to be consumed leaving no remaining parts to persist in the landscape
265 Mortality rate analysis results
We had planned to run the mortality rate model for each wind farm from which the full raw data was requested (ie Wind Farms A B C D E and F) However once the supplied data was investigated it became clear that the data recorded at most of those locations was insufficient For instance carcass persistence trials at Wind Farm C had used only two small bird carcasses a very low number to make estimations from and only five large bird carcasses none of which were scavenged completely and hence the number of days to removal could not be calculated Therefore the carcass persistence rates could not be estimated for this wind farm without making bespoke assumptions about the farm Wind Farms E and F had a similar problem in their carcass persistence trials (only one large bird was used in the carcass persistence trials and it was not scavenged completely) in addition their searcher efficiency trials used searchers who were not used in the mortality surveys and so this data could not be used As our analysis has shown (sections 261ndash4) there was variation between wind farms in the carcass persistence rates and between wind farms and between searchers in the searcher efficiency rates so applying the rates from one wind farm when analysing the data from another wind farm is not valid Wind Farm D only supplied the estimated searcher efficiency and overall average time-to-disappearance In summary each of Wind Farms C D E or F had issues with their data which meant it was not suitable data to analyse for the mortality model As a result only Wind Farms A and B had data suitable for generating mortality rate estimates
22 Investigation of post-construction mortality monitoring at Victorian wind farms
Wind Farm A
The detection rates obtained from the searcher efficiency trials at Wind Farm A showed relatively large differences between the rates of detection of bats and the three size classes of birds (Table 7) Dogs were used for all trials2 The detection rate for bats was estimated to be 68 [95 credible interval (CI) 41ndash96] The credible interval covers 55 of possible values which indicates a high level of uncertainty Detection rates for small birds were even more uncertain with the estimated rate being 45 (95 CI 9ndash85) with the credible interval covering 76 of possible values The detection rate for medium-sized and large birds was higher (~90) and the credible intervals only covered 30 of the possible values (Table 7) Additionally there was extra uncertainty in the model due to differences between searchers The standard deviation of the difference between searchers was 08 (95 CI 02ndash21) which is not trivial
Table 7 The estimated detection rate obtained from the searcher efficiency trials at Wind Farm A for bats and three size classes of birds Lower and upper bounds refer to the bounds of the 95 credible intervals for the estimate
Size class Naiumlve detection Estimated detection Lower bound Upper bound
Bat 066 068 041 096
Small bird 040 044 009 085
Medium bird 083 086 065 099
Large bird 084 091 069 099
The carcass persistence rates obtained from the data from the trials at Wind Farm A also showed a relatively high level of variability (Table 8) The median time-to-disappearance for bats was estimated to be 49 days (95 CI 23ndash76 days) The median times-to-disappearance for small and medium-sized birds were estimated to be 143 and 136 days respectively However the large bird median time-to-disappearance was 68 days (95 CI from 00 to over 1000) This estimate was based on only two large bird carcasses one of which was scavenged on the first day while the other had not been scavenged by 30 days This resulted in a very unreliable estimate that may not be representative of a larger sample had that been taken The standard deviation of the difference between searchers was 03 (95 CI 0ndash06) which is quite small in comparison to that for other factors like size class The parameter estimates for the searcher efficiency trials and carcass persistence trials for Wind Farm A are provided in Appendix 5 Table A51
Table 8 The estimated carcass persistence rates based on data from trials at Wind Farm A for bats and three size classes of birds Lower and upper bounds refer to the bounds of the 95 credible intervals for the estimate
Size class Median time-to-disappearance
Lower bound Upper bound
Bat 485 227 761
Small bird 1429 680 2423
Medium bird 1360 686 2342
Large bird 680 000 gt100000
The estimated proportion of carcasses that were not scavenged or otherwise lost prior to a mortality survey (averaged over 30 days) at Wind Farm A varied between bats and the three size classes of birds (Table 9) We estimated that at Wind Farm A approximately half of the small and medium-sized birds were not
2 Note at the time of the analysis the data indicated that all monitoring at this wind farm was undertaken using dogs We have since
learnt that some of this monitoring was actually undertaken using human observers This may affect some of the results and interpretation presented here The bat detection rate in particular is likely to have been higher had the data collected by dogs only been used
Investigation of post-construction mortality monitoring at Victorian wind farms 23
scavenged and therefore would have been available to be detected and that only 40 of the large birds would have remained The estimated survival rate for bat carcasses was 23 and the estimated detection rate was 68 This means that at Wind Farm A less than 16 of bat mortalities were estimated to have been found and so the actual number of bat mortalities will be much higher than the relatively limited number of carcasses found
Table 9 The estimated proportion of carcasses that were not scavenged or otherwise lost prior to a survey (averaged over 30 days) at Wind Farm A Lower and upper bounds refer to the bounds of the 95 credible intervals for the estimate
Size class Estimated proportion of carcasses that did not disappear prior to survey
Lower bound Upper bound
Bat 023 014 034
Small bird 051 034 068
Medium bird 050 036 065
Large bird 040 002 090
Incorporating the searcher efficiency and carcass persistence rates into the mortality model for Wind Farm A enabled an estimation of the total number of individuals likely to have been killed These calculations have been undertaken for all species not just those considered lsquoof interestrsquo or lsquoof concernrsquo (for completeness and to enable comparisons between threatened and non-threatened species)
The mortality model showed that White-striped Freetail Bats had the highest mortality rate at 62 individuals per turbine per year (95 CI 33ndash99 Figure 4 and Table 10) The range of the 95 credible interval is large especially in view of the fact that this needs to be multiplied by the number of turbines at the wind farm to obtain the estimate for the overall annual White-striped Freetail Bat mortality at Wind Farm A With 64 turbines at this wind farm this equates to 397 individuals of this species being killed per year with the range of plausible values being between 211 and 634 individuals This is the highest number killed for any species of bird or bat at this wind farm It should be noted that each turbine each year also had an estimated 11 bat mortalities for which a bat carcass was found but the species could not be determined Additionally for a species that was not detected the mortality rate was estimated to be 01 individuals per turbine per year (95 CI 0ndash04)
Figure 4 Estimated mortality rate (individual deaths per turbine per year) for bat species at Wind Farm A Lines indicate the 95 credible intervals
24 Investigation of post-construction mortality monitoring at Victorian wind farms
Table 10 The estimated mortality rate (per turbine per year) at Wind Farm A Lower and upper bounds refer to the bounds of the 95 credible intervals for the estimate
Size class Common name Total observed
Naiumlve estimate
Estimated mortality rate
Lower bound
Upper bound
Bat Chocolate Wattled Bat 1 01 01 00 05
Bat Eastern False Pipistrelle 11 11 16 06 29
Bat Gouldrsquos Wattled Bat 7 07 10 03 21
Bat Large Forest Bat 9 09 13 05 25
Bat Little Forest Bat 5 05 07 01 15
Bat Southern Forest Bat 1 01 01 00 05
Bat Southern Freetail Bat 1 01 01 00 05
Bat White-striped Freetail Bat 43 44 62 33 99
Bat Bat (unknown species) 8 08 11 04 22
Bat Undetected bat species 0 00 00 00 03
Small bird Common Starlinga 2 02 02 00 07
Small bird Eurasian Skylarka 3 03 03 00 10
Small bird European Goldfincha 1 01 01 00 04
Small bird House Sparrowa 3 03 03 00 09
Small bird Brown Songlark 1 01 01 00 04
Small bird Undetected small bird 0 00 00 00 02
Medium bird Australian Magpie 21 22 11 06 18
Medium bird Black-shouldered Kite 1 01 01 00 02
Medium bird Brown Falcon 7 07 04 01 07
Medium bird Brown Goshawk 1 01 01 00 02
Medium bird Corvus sp 5 05 03 01 05
Medium bird Crow 1 01 01 00 02
Medium bird Galah 2 02 01 00 03
Medium bird Nankeen Kestrel 2 02 01 00 03
Medium bird Pacific Black Duck 1 01 01 00 02
Medium bird Raven 6 06 03 01 06
Medium bird Bird (unknown species) 23 24 13 07 20
Medium bird Undetected medium bird 0 00 00 00 01
Large bird Corella sp 1 01 01 00 04
Large bird Wedge-tailed Eagle 1 01 01 00 04
Large bird Undetected large bird 0 00 00 00 02
a introduced species
The mortality model shows that two introduced bird species the Eurasian Skylark and the House Sparrow have the highest mortality rates for small birds at 03 individuals per turbine per year each (95 CI 0ndash10 Figure 5 and Table 10) For a small bird species that is not detected the mortality rate is estimated to be zero individuals per turbine per year (95 CI 0ndash02)
Investigation of post-construction mortality monitoring at Victorian wind farms 25
Figure 5 Estimated mortality rates (individuals per turbine per year) for small bird species found at Wind Farm A Lines indicate the 95 credible intervals indicates an introduced species
The mortality model shows that Australian Magpies had the highest medium-sized bird mortality rate at 11 individuals per turbine per year (95 CI 06ndash18 Figure 6 and Table 10) The range of the 95 credible interval is large especially in view of the fact that these figures need to be multiplied by 64 to obtain an estimate for the annual Australian Magpie mortality It should be noted that each turbine each year had an estimated 13 medium bird mortalities for which the species could not be determined even though the carcass was found That is about the same as the number identified as Australian Magpies Additionally for a medium bird species that is not detected the mortality rate is estimated to be zero individuals per turbine per year (95 CI 0ndash02)
The mortality model shows that the two types of large birds found (Wedge-tailed Eagle and Corella species) each have mortality rates at 006 individuals per turbine per year (95 CI 002ndash041 Figure 7 and Table 10) For the Wedge-tailed Eagle this equates to an estimated 39 birds being killed annually with the plausible range between 1 and 26 individuals the large range reflecting the high degree of uncertainty in the large bird carcass persistence rate at this wind farm which was based on just two individuals Additionally for a large bird species that was not detected the mortality rate was estimated to be 003 individuals per turbine per year (95 CI 002ndash017)
26 Investigation of post-construction mortality monitoring at Victorian wind farms
Figure 6 Estimated mortality rates (individuals per turbine per year) for medium-sized bird species found at Wind Farm A Lines indicate the 95 credible intervals
Figure 7 Estimated mortality rates (individuals per turbine per year) for large bird species found at Wind Farm A Lines indicate the 95 credible intervals
Investigation of post-construction mortality monitoring at Victorian wind farms 27
Wind Farm B
The detection rates obtained from the data from the searcher efficiency trials at Wind Farm B showed a relatively high level of variability between bats and the three size classes of birds (Table 11) Human searchers were used for all trials The detection rate for bats was estimated to be 54 (95 CI 28ndash78) The credible interval covers 50 of possible values which indicates a high level of uncertainty Detection rates for small birds were similarly uncertain The estimate of the detection rate was 70 (95 CI 42ndash87) with the credible interval covering 45 of possible values The estimates of the detection rates for medium-sized and large birds was much higher (~100 for each) and the credible intervals covered less than 10 of the possible values (Table 11) There was additional uncertainty in the estimates generated by the model due to differences between searchers The standard deviation of the difference between searchers was 1 (95 CI 03ndash22) which is not trivial For instance if you had a searcher who was good at detecting bats (better than say 75 of searchers) the estimated detection rate would go from 54 (for the average searcher) to 70 A similar searcher would increase the estimated detection rate for small birds from 70 to 82
Table 11 The detection rates estimated from data from searcher efficiency trials at Wind Farm B for bats and for three size classes of birds Lower and upper bounds refer to the bounds of the 95 credible intervals for the estimate
Size class Naiumlve detection Estimated detection Lower bound Upper bound
Bat 045 054 028 078
Small bird 069 070 042 087
Medium bird 096 097 091 099
Large bird 100 099 097 099
The carcass persistence rate estimates based on data from the trials at Wind Farm B also showed a relatively high level of variability (Table 12) The median time-to-disappearance for bats was estimated to be 3 days (95 CI 15ndash47 days) the median time-to-disappearance for small birds was estimated to be 20 days (95 CI 09ndash32) and the median time-to-disappearance for medium-sized birds was estimated to be 36 days (95 CI 17ndash59) However the large bird median time-to-disappearance was 826 days (95 CI 337ndash2042) This estimate was based on 87 large bird carcasses of which 73 (84) did not disappear during the trial which increases the carcass persistence rate substantially compared with the other size classes The standard deviation of the difference between searchers was 05 (95 CI 03ndash08) which was quite small in comparison with the variability due to other factors such as size class The parameter estimates for the searcher efficiency trials and carcass persistence trials for Wind Farm B are provided in Appendix 5 Table A52
Table 12 The estimated carcass persistence rates estimated from data from trials at Wind Farm B for bats and three size classes of birds Lower and upper bounds refer to the bounds of the 95 credible intervals for the estimate
Size class Median time-to-disappearance
Lower bound Upper bound
Bat 298 145 470
Small bird 195 088 315
Medium bird 363 171 591
Large bird 8260 3373 20419
The estimated proportion of carcasses that had not disappeared prior to the survey (averaged over 30 days) at Wind Farm B varied between bats and the three size classes of birds (Table 13) It was estimated that more than 80 of large birds would not have been scavenged or otherwise lost and therefore most would have been available to be detected This percentage was much lower for the other size classes It was
28 Investigation of post-construction mortality monitoring at Victorian wind farms
estimated that only one in ten small birds would remain to be able to be observed during surveys Medium-sized birds fair better at one in five Bat carcass persistence was in between that of small and medium-sized birds with approximately one in seven carcasses remaining This means that at Wind Farm B bat small bird and medium-sized bird carcasses were rarely going to be observed even if mortalities occurred because they would be scavenged or otherwise lost relatively quickly
Table 13 The estimated proportion of carcasses that were not scavenged or otherwise lost prior to survey (averaged over 30 days) at Wind Farm B Lower and upper bounds refer to the bounds of the 95 credible intervals for the estimate
Size class Estimated proportion of carcasses that did not disappear prior to survey
Lower bound Upper bound
Bat 014 007 023
Small bird 009 004 014
Medium bird 021 012 031
Large bird 086 079 093
Incorporating the searcher efficiency and carcass persistence rates into the mortality model for Wind Farm B enabled estimation of the total numbers of individuals likely to have been killed The mortality model indicated that the White-striped Freetail Bat had the highest mortality rate of any native species of bird or bat at 27 individuals per turbine per year (95 CI 12ndash48 Figure 8 and Table 14) The range of the 95 credible interval was large especially considering that this needs to be multiplied by the number of turbines at the wind farm to obtain an estimate for the annual White-striped Freetail Bat mortality Wind Farm B has 140 turbines so this equates to 378 individuals killed per year with the range of plausible values being between 168 and 672 individuals One Critically Endangered Southern Bent-wing Bat was found dead at Wind Farm B during mortality monitoring The mortality model generated an estimate of the annual mortality rate of 01 individuals per turbine per year (95 CI 0ndash05 Figure 8 and Table 14) equating to a mortality rate of 14 Southern Bent-wing Bats annually for the whole wind farm with the range of plausible values being between zero and 70 individuals
Figure 8 Estimated mortality rates (individuals per turbine per year) for bat species found at Wind Farm B Lines indicate the 95 credible intervals
Investigation of post-construction mortality monitoring at Victorian wind farms 29
Table 14 The estimated mortality rates (per turbine per year) at Wind Farm B Lower and upper bounds refer to the bounds of the 95 credible intervals for the estimate
Size class Common name Total observed
Naiumlve estimate
Estimated mortality rate
Lower bound
Upper bound
Bat Little Red Flying-fox 1 00 01 00 05
Bat Gouldrsquos Wattled Bat 5 02 07 02 16
Bat Lesser Long-eared Bat 1 00 01 00 05
Bat Southern Bent-wing Bata 1 00 01 00 05
Bat White-striped Freetail Bat 18 08 27 12 48
Bat Undetected bat species 0 00 00 00 02
Small bird Common Starlingb 1 00 01 00 06
Small bird Eurasian Skylarkb 33 14 54 28 92
Small bird European Goldfinchb 3 01 04 00 11
Small bird Fork-tailed Swifta 1 00 01 00 05
Small bird New Holland Honeyeater 1 00 01 00 06
Small bird Skylark 2 01 03 00 08
Small bird Stubble Quail 1 00 01 00 05
Small bird Undetected small bird 0 00 00 00 03
Medium bird Australian Magpie 19 08 11 05 18
Medium bird Bird ndash unidentified 16 07 09 04 15
Medium bird Bird of prey 1 00 01 00 02
Medium bird Black-shouldered Kite 2 01 01 00 03
Medium bird Black Falcona 1 00 01 00 02
Medium bird Brown Falcon 10 04 06 02 10
Medium bird Duck spp 1 00 01 00 02
Medium bird Magpie-lark 12 05 07 03 12
Medium bird Nankeen Kestrel 19 08 11 05 19
Medium bird Pacific Black Duck 1 00 01 00 02
Medium bird Raven 9 04 05 02 09
Medium bird Red-rumped Parrot 3 01 02 00 04
Medium bird Undetected medium bird 0 00 00 00 01
Large bird Barn Owl 1 00 00 00 01
Large bird CorellaCockatoo 1 00 00 00 01
Large bird Corella sp 2 01 00 00 01
Large bird Guinea Fowl 2 01 00 00 01
Large bird Poss Whistling Kite 1 00 00 00 01
Large bird Purple Swamp Hen 1 00 00 00 01
Large bird Spotted Harrier 1 00 00 00 01
Large bird Straw-necked Ibis 1 00 00 00 01
Large bird Wedge-tailed Eagle 5 02 01 00 02
Large bird Undetected large bird 0 00 00 00 01
a species listed as a lsquospecies of interestrsquo in Lumsden et al (2019) b introduced species
30 Investigation of post-construction mortality monitoring at Victorian wind farms
The mortality model indicated that an introduced species the Eurasian Skylark had the highest mortality rate for small birds at 54 individuals per turbine per year (95 CI 28ndash92 Figure 9 and Table 14) For a small bird species that was not detected the mortality rate was estimated to be zero individuals per turbine per year (95 CI 0ndash03) One lsquospecies of interestrsquo the migratory Fork-tailed Swift has been recorded as a mortality at Wind Farm B with an estimate of 01 individuals killed per turbine per year equating to 14 individuals for the wind farm annually with the plausible range of values between zero and 70 (Figure 9 and Table 14)
Figure 9 Estimated mortality rates (individuals per turbine per year) for small bird species found at Wind Farm B Lines indicate the 95 credible intervals indicates introduced species
The mortality model shows that the Australian Magpie and the Nankeen Kestrel have the highest medium-sized bird mortality rates at 11 individuals per turbine per year for each species (95 CI 05ndash19 Figure 10 and Table 14) It should be noted that each turbine had an estimated bird mortality per year for which the species would not be determined if it was found That is about the same as the number identified as Australian Magpie or Nankeen Kestrel Additionally for a medium bird species that was not detected the mortality rate was estimated to be zero individuals per turbine per year (95 CI 0ndash01) One lsquospecies of interestrsquo in the medium-sized bird category the Black Falcon was recorded as a mortality at Wind Farm B with an estimate of 01 individuals killed per turbine per year equating to 14 individuals for the wind farm annually with the plausible range of values between zero and 28 (Figure 10 and Table 14)
The mortality model shows that the Wedge-tailed Eagle had the highest large bird mortality rate at 01 individuals per turbine per year (95 CI 0ndash02 Figure 11 and Table 14) equating to 14 for the whole wind farm with the plausible range of values between zero and 28 individuals Additionally for large bird species that is not detected the mortality rate is estimated to be zero individuals per turbine per year (95 CI 0ndash01)
Investigation of post-construction mortality monitoring at Victorian wind farms 31
Figure 10 Estimated mortality rates (individuals per turbine per year) for medium-sized bird species found at Wind Farm B Lines indicate the 95 credible intervals
Figure 11 Estimated mortality rates (individuals per turbine per year) for large bird species found at Wind Farm B Lines indicate the 95 credible intervals
32 Investigation of post-construction mortality monitoring at Victorian wind farms
266 Mortality surveys discussion
The detailed analysis of the searcher efficiency rates and carcass persistence rates for bats and the three size classes of birds revealed marked differences between Wind Farm A and Wind Farm B (Table 15) For example it was estimated that 44 of the small birds were found in searcher efficiency trials at Wind Farm A compared with 70 at Wind Farm B and there were similar although reverse differences for the bats In contrast the rates at which the medium and large birds were found were fairly similar The length of time that carcasses remained on site and hence available to be found also varied markedly between the two wind farms especially for the large birds (7 days vs 83 days for Wind Farms A and B respectively) (Table 15)
Table 15 Comparison between Wind Farm A and Wind Farm B of the modelled estimates for the detection rates based on the searcher efficiency trials and the length of time before disappearance The estimate figures are taken from Tables 7 8 11 and 12
This analysis has highlighted the importance of obtaining detailed wind farmndashspecific data for these two critical variables in the mortality estimates These figures may vary due to different searchers being used that have different efficiency rates or due to site-specific factors such as the vegetation structure within the search area seasonal patterns or land management practices Without undertaking considerably more detailed studies to determine patterns to enable extrapolation in the future it is currently not possible to use either the searcher efficiency rates or the carcass persistence rates from one wind farm in the mortality estimates for another wind farm unless there is very clear evidence that there would not be significant differences in these rates between the farms in question
There were also differences between the two wind farms in the annual mortality estimates Three lsquospecies of interestrsquo were recorded as mortalities at Wind Farm B whereas there were no lsquospecies of interestrsquo recorded dead at Wind Farm A For each of the species of interest killed at Wind Farm B just a single individual was found dead however this equated to an estimate of 14 individuals of each of these species with the range of plausible values for Southern Bent-wing Bats and Fork-tailed Swifts each being between zero and 70 individuals annually and those for the Black Falcon being between zero and 28 individuals annually
The annual mortality rates were higher for some of the non-threatened species At both Wind Farms A and B the White-striped Freetail Bat had the highest mortality rate for bats (63 and 27 individuals per turbine per year respectively) which was often an order of magnitude higher than that of other species At Wind Farm A this rate was also higher than for any bird species and at Wind Farm B it was higher than any native bird species When the number of turbines was factored in the estimated annual number of mortalities of this species was 397 (plausible range 211ndash634) individuals at Wind Farm A and 378 (plausible range 168ndash672) individuals at Wind Farm B These are very high numbers for both wind farms and although accurate density estimates for this tree hole-roosting bat are lacking they are likely to represent a significant proportion of the local populations of this species in these areas
The introduced Eurasian Skylark mortality rate at Wind Farm B was the highest of any bird species at 54 individuals per turbine per year Other bird species commonly killed included the Australian Magpie (11 per turbine per year at each of Wind Farms A and B) corella (presumably one or both of Little Corella Cacatua sanguinea and Long-billed Corella Cacatua tenuirostris) (11 at Wind Farm A) and Nankeen Kestrel (11 per turbine per year at Wind Farm B)
Size class Wind Farm A searcher
efficiency rate
Wind Farm B searcher
efficiency rate
Wind Farm A time to
disappearance (days)
Wind Farm B time to
disappearance (days)
Bat 068 054 485 298
Small bird 044 070 1429 195
Medium bird 086 097 1360 363
Large bird 091 099 680 8260
Investigation of post-construction mortality monitoring at Victorian wind farms 33
The accuracy of the estimated number of Wedge-tailed Eagles killed by turbines at each wind farm is difficult to determine given the data At Wind Farm A the rate was 01 individuals per turbine per year with the upper bound 04 individuals per turbine per year This uncertainty is a result of the very low number of large birds used in the carcass persistence trials One of the two large birds used in the carcass persistence trials at Wind Farm A was completely scavenged on the first day whereas the other was not completely scavenged by the end of the trial (30 days) resulting in a relatively high carcass persistence rate (median time-to-disappearance of 7 days) More large birds would need to have been included in the carcass persistence trials in order to achieve a more reliable estimate for the relevant carcass persistence rate At Wind Farm B five Wedge-tailed Eagles were detected during mortality monitoring surveys plus another 11 were found dead incidentally However the estimated mortality rate was only slightly greater at Wind Farm B than at Wind Farm A (ie 01 individuals per turbine per year) due to a much lower carcass persistence rate (median time-to-disappearance of 83 days)
The mortality estimates provided above are based on data from just two of the 15 wind farms at which mortality monitoring has been undertaken As outlined above it was considered that these two were the only ones for which there was sufficient data to validly undertake these estimations using the data available to us Mortality rates are likely to vary markedly between wind farms depending on their proximity to key habitat features (eg important cave roosts for Southern Bent-wing Bats) and a range of other variables Therefore it is not possible to extrapolate from the mortality estimates provided here to predict mortality estimates for other wind farms mortality estimates need to be determined for each individual wind farm based on the site-specific observed mortalities searcher efficiency trials and carcass persistence trials
27 Comparison of estimates of mortality rates with those undertaken by the wind farms
The mortality rate estimates outlined above have been undertaken independently from those conducted by the various wind farms To explore how our estimates compare with those provided by the wind farms in their mortality monitoring reports we compare our estimates for the two wind farms we examined in detail with those provided in the BAMM reports from those wind farms This enables an exploration of the estimated values as well as the confidence limits around these estimates and the assumptions underlying them
271 Wind Farm A
Bats Our estimated mortality rate for bats at Wind Farm A were similar to those in Wind Farm Arsquos BAMM report (Figure 12) The overall bat mortality rate (total bat deaths per turbine per year) was slightly higher in the BAMM report but within our confidence intervals However our model had much larger credible intervals for the estimated bat mortality rate indicating that there is a higher level of uncertainty in these figures than that indicated by the BAMM figures
34 Investigation of post-construction mortality monitoring at Victorian wind farms
Figure 12 Estimated bat mortality rate (bat deaths per turbine per year) at Wind Farm A from the Bat and Avifauna Mortality Monitoring report (orange) and from our model (termed lsquolegacyrsquo in blue)
Birds The BAMM report estimated mortality rate (total deaths per turbine per year) for birds at Wind Farm A was similar to but slightly higher than our model estimates (Figure 13) There was no confidence interval for the bird mortality rate given in the BAMM report This contrasted with our analysis which indicated that there was a moderate level of uncertainty around this estimate All size classes of birds were combined to obtain a single estimate for the bird mortality rate in the BAMM report despite there being marked differences in the mortality rates between size classes (see Table 10)
Figure 13 Estimated total bird mortality rate (total bird deaths per turbine per year) at Wind Farm A from the Bat and Avifauna Mortality Monitoring report (orange) and from our model (termed lsquolegacyrsquo in blue)
Investigation of post-construction mortality monitoring at Victorian wind farms 35
272 Wind Farm B
Bats Wind Farm B reported their estimated mortality rates separately for the first and second years of their mortality monitoring program Our estimated mortality rates for bats at Wind Farm B were similar to the BAMM reportrsquos second-year estimates (Figure 1414) In contrast their first yearrsquos bat mortality rates (total bat deaths per turbine per year) was much smaller Given our model is a combination of the 2 years of monitoring the comparison should be made to the combined average of the BAMM reports figures when that is done our model appears to indicate a higher bat mortality rate than that in the BAMM report Estimated annual mortality rates were not provided specifically for the Southern Bent-wing Bat in the BAMM report so no comparison can be made for this Critically Endangered species
Figure 14 Estimated bat mortality rate (bat deaths per turbine per year) at Wind Farm B from each year of their 2-year monitoring program taken from annual Bat and Avifauna Mortality Monitoring reports (orange) and from our analysis of their combined data (termed lsquolegacyrsquo in blue)
Birds overall Our estimated mortality rate for all birds at Wind Farm B was similar to the rates in the BAMM reports (Figure 15) The total bird mortality rate (total bird deaths per turbine per year) in the BAMM reports was marginally lower in the first year of monitoring Given our model is a combination of the 2 years of monitoring the comparison should be made to the combined average of the BAMM reports when that is done our model appears to indicate a similar bird mortality rate but with a larger 95 CI for the estimate indicating greater uncertainty in the estimate than is indicated in the BAMM reports
36 Investigation of post-construction mortality monitoring at Victorian wind farms
Figure 15 Estimated total bird mortality rate (total bird deaths per turbine per year) at Wind Farm B from annual Bat and Avifauna Mortality Monitoring reports (orange) and from our analysis of their combined data (termed lsquolegacyrsquo in blue)
Small birds As Wind Farm B provided mortality rate estimates for each size class of bird these rates can be compared with our estimates The first annual BAMM report small bird mortality rate (total small bird deaths per turbine per year) was significantly lower than that in the second report (Figure 16) Our model estimate (which combined both years) was in between the two annual estimates Our estimates had a much larger 95 credible interval potentially reflective of the differences between the mortality rates for the 2 years
Figure 16 Estimated small bird mortality rate (small bird deaths per turbine per year) at Wind Farm B from annual Bat and Avifauna Mortality Monitoring reports (orange) and from our analysis of their combined data (termed lsquolegacyrsquo in blue)
Medium-sized birds Our estimated mortality rate for medium-sized birds at Wind Farm B (total medium-sized bird deaths per turbine per year) was similar to that in the first BAMM report (Figure 17) however the medium-sized birds mortality rate was much smaller in the second yearrsquos BAMM report The estimates in our model which combines the data for the 2 years of monitoring were similar to the first year and slightly higher than the second year and contained greater levels of uncertainty
Investigation of post-construction mortality monitoring at Victorian wind farms 37
Figure 17 Estimated medium-sized bird mortality rate (medium-sized bird deaths per turbine per year) at Wind Farm B from annual Bat and Avifauna Mortality Monitoring reports (orange) and from our analysis of their combined data (termed lsquolegacyrsquo in blue)
Large birds Our estimated mortality rate for large birds at Wind Farm B was much larger than the estimates provided in that wind farmrsquos BAMM reports (Figure 18) Their second year BAMM report estimate was much larger than that in the first year BAMM report but their estimates for both years were much smaller than our estimate It is unclear where these large discrepancies came from
Figure 18 Estimated large bird mortality rate (large bird deaths per turbine per year) at Wind Farm B from annual Bat and Avifauna Mortality Monitoring reports (orange) and from our analysis of their combined data (termed lsquolegacyrsquo in blue)
38 Investigation of post-construction mortality monitoring at Victorian wind farms
273 Potential reasons for differences between mortality estimates in the BAMM reports and those obtained in our analysis
There are several potential reasons for differences between the mortality estimates given in the BAMM reports and those resulting from our analysis which generally relate to how the estimates were calculated In general our analysis suggested a higher level of uncertainty in the estimates than was indicated in the BAMM reports
Differences between the wind farms and between their analyses and ours in calculating and using the carcass persistence rates are likely to have resulted in a number of these dissimilarities There were low numbers of carcasses used in the persistence trials for specific bats and the three size classes of birds especially for seasonal estimates For large birds often only one or two trials were conducted with very low numbers of individual carcasses being used This may have caused the mortality rate estimates to vary greatly especially if the carcasses were not scavenged or otherwise lost within the allotted time Underestimating the median time-to-disappearance would cause the mortality rate estimate to decrease
Our analysis generated mortality rates for each species whereas the BAMM reports only reported mortality rate estimates at the level of class (sometimes split into size groups) To calculate group level mortality estimates in our analysis the cohorts were combined which may have resulted in larger credible intervals
The searcher efficiency trials and carcass persistence trials were sometimes carried out over different time periods Our analysis generally analysed all the data at once as did Wind Farm A whereas Wind Farm B provided estimates at the annual or even seasonal level This would produce different overall estimates if the estimates varied over time
274 Other wind farms
Mortality estimates have been calculated for most wind farms in their Bat and Avifauna Mortality Monitoring reports by extrapolating from the numbers found during the mortality searches using data from searcher efficiency trials and carcass persistence trials where available However in our view the data on searcher efficiency rates or carcass persistence rates were often not sufficient to make valid mortality estimates For some wind farms no indication of uncertainty in the estimates was provided with just a single value given From our analysis it is clear that even with the best-quality data available to us there was a high degree of uncertainty in the estimates of mortality rates so the uncertainty is likely to be even higher for the other wind farms
Investigation of post-construction mortality monitoring at Victorian wind farms 39
3 Simulations to examine the likelihood of detecting
mortalities of different species
To determine the level of monitoring required in order to significantly reduce the uncertainty in the estimates of annual mortalities a series of simulations were undertaken Using the searcher efficiency and carcass persistence rate data available from the six wind farms from which we obtained raw data for analysis several scenarios were constructed to examine the likelihood of detecting mortalities of different species The same four size classes were used ie bat small bird medium-sized bird and large bird Both human and dog searchers were included with their estimated detection rates for each size class being taken from the centre of the modelled distribution rounded to the nearest 005 (Table 16) For these simulations the wind farm was assumed to be of moderate size with 50 turbines operating Mortality surveys were assumed to occur monthly for 2 years For each size class of carcass the proportion remaining after a month was estimated using a combination of the data from Wind Farms A and B (Table 17) The variables used in the simulations were the number of turbines surveyed each month which was varied from 5 (10) to 25 (50) and the total wind farmndashwide mortalities which were set to range from 1 to 100 individuals per annum
Table 16 Detection rates from searcher efficiency trials for each size class and searcher type using data from Wind Farms A B C E and F
Searcher Bat Small bird Medium bird Large bird
Dog 075 05 085 09
Human 055 07 095 10
Table 17 Estimated proportion of carcasses that will remain to be observed for each size class using data from Wind Farms A and B
Size class Proportion of carcasses from the month available to be detected
Bat 025
Small bird 030
Medium bird 040
Large bird 080
31 Mortality estimates
From the simulations it can be seen that the mean estimated mortality rate is equal to the actual mortality rate as would be expected from an unbiased estimator (Figures 19 to 22) For example when there were 10 mortalities per year (the lower box in each figure) the number of mortalities found per turbine per year was 02 and with 50 turbines in the simulation this would be equivalent to a total of 10 mortalities per year (ie 02 x 50 = 10) This was the case irrespective of how many turbines are searched However what varies markedly in response to the number of turbines searched is the plausible range of this estimate The upper end of the estimate range is at least double the actual amount for most scenarios and even triple for some Using bats with human searchers as an example when 5 of the 50 turbines are searched the plausible range of the estimate is from zero to 15 While the estimate remains at 02 when 15 of the 50 turbines are searched the upper limit is increased to 08 The upper limit reduced to 06 if 20 turbines are searched and to 045 if all 50 turbines are searched This reduces the upper range of the estimated annual number of mortalities from 75 if five turbines are searched to 40 30 and 23 if 15 20 and all turbines are searched respectively Therefore undertaking searches at more turbines markedly reduces the uncertainty in the plausible range of the estimate In addition under many of the scenarios especially for the lower proportions of turbines searched the lower limit of the range of plausible values is zero indicating that there would be uncertainty in knowing if a species had actually been killed at all
40 Investigation of post-construction mortality monitoring at Victorian wind farms
Figure 19 The estimated mortality rates from the simulation with monthly surveys at 5 of the 50 turbines Mortality rates of 1 5 and 10 deaths per annum (pa) are considered The red circles and green triangles represent the means and the lines extend to the 95 confidence intervals
Investigation of post-construction mortality monitoring at Victorian wind farms 41
Figure 20 The estimated mortality rates from the simulation with monthly surveys at 15 of the 50 turbines Mortality rates of 1 5 and 10 deaths per annum (pa) are considered The red circles and green triangles represent the means and the lines extend to the 95 confidence intervals
42 Investigation of post-construction mortality monitoring at Victorian wind farms
Figure 21 The estimated mortality rates from the simulation with monthly surveys at 25 of the 50 turbines Mortality rates of 1 5 and 10 deaths per annum (pa) are considered The red circles and green triangles represent the means and the lines extend to the 95 confidence intervals
Investigation of post-construction mortality monitoring at Victorian wind farms 43
Figure 22 The estimated mortality rates from the simulation with monthly surveys at all 50 turbines Mortality rates of 1 5 and 10 deaths per annum (pa) are considered The red circles and green triangles represent the means and the lines extend to the 95 confidence intervals
32 Likelihood of detecting at least one individual
Overestimating the plausible range of the estimate by a factor of two or three may make it appear that more individuals may have been killed than actually were However underestimation suggesting that no mortalities may have occurred is also of concern In this simulation this happened frequently under the many scenarios in which total mortality rates andor survey rates were low To investigate this issue further the following simulations were run to explore the amount of survey effort required to detect at least one dead individual of a species The simulations all specified that surveys were conducted monthly for 2 years at each surveyed turbine and for simplicity assumed a constant mortality rate over that time The parameter values for detection and persistence rates are based on the survey data supplied It should be re-emphasised that none of the searcher efficiency trials were truly blind trials and therefore the estimates may be positively biased (too high) especially for human searchers which would influence the derived results
321 Bat species
Where the likely number of bat mortalities for a species is 100 or more annually across the wind farm then detecting at least one of these mortalities is almost guaranteed if at least 10 of the 50 turbines are surveyed (Figure 23) As the number of bat mortalities decreases the fraction of turbines surveyed needs to increase in order to maintain a reasonable chance of detecting any mortalities of the species Surveys using dogs are more likely to detect any bat mortalities If there are 10 bat mortalities for a species annually then even if using dogs and surveying half the turbines (ie 25 out of 50) there is a 15 chance that none of the mortalities would be detected over 2 years of monthly surveys (ie the green line in Figure 23 never reaches the value of one whereby at least one mortality would be detected although it comes close if all 50 turbines
44 Investigation of post-construction mortality monitoring at Victorian wind farms
are searched) Under the same scenario but with a bat mortality rate of one per year the chance that it is not detected in either year is 82 Even if monthly surveys were conducted at each turbine there is still a 65 chance that this one mortality would not be detected The likelihood of detection would be even lower if humans are used as the searchers
Figure 23 Probability that at least one bat of a particular species was detected during monthly surveys over 2 years given the total number of annual mortalities for that species
322 Small bird species
For a small bird species the likelihood of detecting at least one mortality is similar to that for bat species with the exception that human searchers based on the data available appear to be superior to dogs (although note the previously mentioned qualifier that most human trials were not blind) (Figure 24) At moderate to high numbers of mortalities per annum (50 or more total mortalities annually) surveying 10 of the 50 turbines per month would almost guarantee some detections As the number of mortalities decreases the fraction of turbines surveyed needs to increase to maintain a reasonable chance of detecting any mortalities of the species Surveying using humans would require fewer turbines to be surveyed If there is only a single mortality for a small bird species annually and if humans were used to survey half (25 out of 50) of the turbines in 80 of the time the single mortality would not be detected over 2 years of monthly surveys Even if monthly surveys were conducted at each turbine there is a 62 chance that the single mortality of that species would not be detected
Investigation of post-construction mortality monitoring at Victorian wind farms 45
Figure 24 Probability that at least one small bird of a particular species was detected during monthly surveys over 2 years given the total number of annual mortalities for that species
323 Medium-sized bird species
Where the likely number of medium-sized bird mortalities for a species is 50 or more annually across the wind farm then detecting at least one of these mortalities is almost guaranteed if at least 5 of the 50 turbines are searched (Figure 25) As the number of mortalities decreases the fraction of turbines surveyed needs to increase to maintain a reasonable chance of detecting any mortalities of the species Surveys using humans are more likely to detect any medium-sized bird mortalities If there are 5 mortalities for a medium-sized bird species annually using humans to survey half of the turbines (25 out of 50 turbines) 15 of the time none of those mortalities would be detected over 2 years of monthly surveys Under the same scenario but a lower mortality rate of one per year the chance that none of that species are detected in either year is 65 Even if monthly surveys were conducted at each turbine there is still a 40 chance that it would not be detected
46 Investigation of post-construction mortality monitoring at Victorian wind farms
Figure 25 Probability that at least one medium-sized bird of a particular species was detected during monthly surveys over 2 years given the total number of annual mortalities for that species
324 Large bird species
When the likely number of large bird mortalities for a species is 50 or more annually across the wind farm then detecting at least one of these mortalities is almost guaranteed if at least 5 of the 50 turbines are surveyed (Figure 26 in which both the 50 and 100 individuals lines are consistently at 10) As the number of mortalities decreases the proportion of turbines surveyed needs to increase to maintain a reasonable chance of detecting any mortalities of the species Surveys using humans appear to be marginally more likely to detect any large bird mortalities If there are 5 mortalities for a large bird species annually then using humans and surveying 10 turbines 20 of the time the species would fail to have been detected over 2 years of monthly surveys Under the same scenario but when the mortality rate was one per year the chance that it is not detected in either year is 70 If monthly surveys were conducted at each turbine however the chance that this one individual would not be detected declines considerably to just a 5 chance
Investigation of post-construction mortality monitoring at Victorian wind farms 47
Figure 26 Probability that at least one large bird of a particular species was detected during monthly surveys over 2 years given the total number of annual mortalities for that species
33 Discussion results of simulations Given the estimates derived from our analysis of the existing post-construction mortality monitoring data there are some clear concerns about the efficacy with which the assessment of bird and bat turbine collision mortalities is currently being implemented
The range of values obtained from the simulations above shows that even with moderate levels of mortality (01 to 02 mortalities per turbine per year) at a wind farm with a reasonably good coverage of surveys (eg sampling 25 of 50 turbines every month for 2 years) the derived total mortality estimates are highly variable
If a species is likely to be affected by even a single death a year across an entire wind farm then for anything other than large bird species the current methods are unlikely to detect it After large bird species medium-sized birds have the best chance of being detected However even for medium-sized birds with 2 years of monthly surveys at 25 of 50 turbines two-thirds of the time neither of the simulated single mortalities from each year would be detected For bats the simulation indicates that two-thirds of the time monthly surveys at all turbines over 2 years would not detect either of the bat mortalities
If post-construction mortality surveys are to continue careful consideration needs to be given to the nature of the surveys and what they are likely to be able to detect The critical issues relate to which species of concern are likely to be present in the area the best detection method for those species (dogs or humans ndash further investigations are required regarding this) and what level of risk of not detecting any given mortalities is acceptable
48 Investigation of post-construction mortality monitoring at Victorian wind farms
If the only species of concern for a given wind farm was a large bird such as the Brolga (Antigone rubicundus) where any mortalities may be considered important then monthly surveys by humans are likely to be required at 80 of turbines (ie 40 of the 50 turbines in our simulations) to achieve an 85 chance of a detection over 2 years The precision under this scenario would be reasonable with the 95 confidence intervals for the mortality rate per turbine per year ranging from 0 to 003 around the simulated actual mortality rate of 002 deaths per turbine per year
If the only species of concern for a wind farm was a small bird such as the Orange-bellied Parrot (Neophema chrysogaster) where any mortalities are important then according to our simulation monthly surveys would be required at all turbines (ie 50 in our simulation) to achieve a 30ndash40 chance of a detection over 2 years This detection rate is quite low and more frequent surveys may be required during the times of the year when individuals are known to be in Victoria The precision under this scenario was also poor with the 95 confidence intervals for the mortality rate per turbine per year ranging from 0 to 01 around the simulated actual mortality rate of 002 deaths per turbine per year The results of such monitoring (with a 60ndash70 chance of no detection) might readily be interpreted to mean that no mortalities are occurring and that therefore there is no concern On the other hand the same results could be interpreted to indicate that the turbines are killing up to five times as many birds as they actually are ie five individuals not one
If the only species of concern was a Southern Bent-wing Bat for which larger numbers of mortalities may occur in line with their larger population numbers the detection of at least one of these mortalities is effectively guaranteed if there were monthly surveys by dogs at a smaller proportion of turbines such as 15 of the 50 turbines in our simulation The precision under this scenario would be reasonable with the 95 confidence intervals for the mortality rate per turbine per year ranging from 09 to 34 around the simulated actual mortality rate of 20 deaths per turbine per year If however the actual number of mortalities is important not just recording at least one individual as is likely to be the case then a greater intensity of surveying would be required
The question remains what if there are multiple species of concern from a number of size classes andor where there are differing numbers of lsquoacceptablersquo mortalities The answer will depend on the combination of species involved For instance if the region has a small bird species for which any death would be problematic a bat species for which larger numbers of mortalities would be problematic and a large bird species for which any death is problematic then the appropriate monitoring design might be to search all turbines at least once a month Such a strategy would provide the best sampling for the small bird marginally too much sampling for the large bird and a lower detection rate for the bat which would be countered to some extent by sampling more turbines This is an illustration of how sampling regimes should be constructed factoring in which species are at risk in the particular area and how many deaths would make a meaningful impact on the population of the species
These conclusions are predicated on the analysis of the data that has been supplied to us Given the issues associated with some of this data the above simulations should be used for illustrative purposes only their applicability needs to be confirmed with data that has been collected in the appropriate fashion and with adequate replication
Investigation of post-construction mortality monitoring at Victorian wind farms 49
4 Population and cumulative impacts
41 Population-level impacts A fundamental objective of Victorian and Commonwealth planning law and policy is to maintain viable populations of indigenous fauna in the long term Assessments in relation to this should be framed in terms of population-level impacts because the population is the principal unit of conservation Obtaining an estimate of total mortality of a species of concern at a wind farm is not an end in itself but is a critical first step It is also important to know whether the level of mortality is likely to have an impact on the functioning of the Victorian population of the species particularly in light of the fact that wildlife populations experience natural variation and most have mechanisms to cope with minor fluctuations Thus after an estimate of the mortality rate of a species of concern has been determined for a wind farm an assessment of the likely influence of that mortality rate on the Victorian population of the species should be made
Population modelling offers a framework for understanding the effects of collision mortality on the viability of the population of the relevant species Population viability analysis (PVA) has sometimes been used for this purpose and potential biological removal (PBR) may be applicable where less precise demographic information is available Each of these models has data requirements that may limit their application to mortality estimates for single wind farms however their greater value is likely to be in assessment of the broader effects of the cumulative impacts of multiple sites (Diffendorfer et al 2015 Smales 2017) (see below)
411 Population modelling
PVA was developed as an approach to evaluate the various influences on a population and to quantify its viability in terms of altered extinction risk or more commonly quasi-extinction risk (ie the risk of reaching a population size that is insufficient to assure the long-term survival of the population) (Gilpin and Souleacute 1986) Because of the relatively small number of mortalities that usually result from collisions with wind turbines for many species and the typical expected lifespan of a wind farm (25ndash30 years) PVA results defined by the probability of extinction over much longer timespans (eg 50-100 years) are not particularly relevant to wind farm studies thus a PVA or similar population model is more usually undertaken to simply quantify population-level impacts
To date PVA has been used in the pre-approval processes of environmental impact assessments for a few wind farms to quantify the potential levels of impact on particular species as predicted by collision risk modelling but the approach is equally applicable to estimating the total number of mortalities that may be occurring based on monitoring of mortalities at an operational wind farm Examples of the use of PVA for investigating the impact of wind farm collisions on species include those done for the Brolga (DSE 2012) and for the Orange-bellied Parrot (Smales et al 2006) For Brolgas a species-specific PVA has been developed by McCarthy (2008) in order to quantify the appropriate measures needed to achieve a zero net effect on the Victorian population
It is important to note though that PVAs can only be used in situations where there is a relatively high level of demographic information for the taxon in question such as background age- and sex-specific survivorship and mortality rates density dependence and measures of population stochasticity Where these values are available a PVA undertaken to evaluate background population trends for an important taxon offers a valuable context for consideration of the impact of additional mortalities due to wind farm collisions Information sufficient to support a PVA is currently available for only some threatened species of birds and bats and it will be valuable to review the currency of that information and its availability for species deemed to be of concern in the context of potential for collisions at wind farms in Victoria Where relevant demographic data are not currently available for key threatened species it may be necessary to carry out appropriate studies to enable a PVA to be performed In this context it will be necessary to use a clear definition of the lsquopopulationrsquo of a particular species in question This may present a challenge in cases where the population of a species has a geographic range that is much broader than Victoria especially since many such populations have substantial dispersal and exchange of individuals over a number of states or even the entire continent Migratory and nomadic species that may be present in the state periodically
50 Investigation of post-construction mortality monitoring at Victorian wind farms
andor whose populations here may vary due to such movements or effects outside Victoria (even internationally) present additional challenges
Relative to population size estimates of total collision mortality for a wind farm are often quite low and within natural population cycles they are likely to be masked by population variability andor the imprecision of demographic values available for use in population models These factors may mean that it is simply beyond the functional capacity of PVA to assess the effects of collision estimates for a single wind farm
Where sufficient information about demography is not available integrated population modelling (IPM) (Besbeas et al 2002 Brooks et al 2004 Schaub and Abadi 2011) is an approach that permits various sources of data such as those from individual surveys to provide estimates of demographic parameters (Abadi et al 2010) and this approach may then permit more comprehensive analysis using PVA However this approach necessarily incorporates substantial uncertainty that is associated with the assumptions made
PBR is an approach that has been developed to assess effects at the population level when values for few demographic parameters are available PBR requires a value for the maximum annual recruitment rate an estimate of population size and a lsquorecovery factorrsquo of between 01 and 1 (Dillingham and Fletcher 2011 and authors cited therein) PBR has been used to evaluate population-level effects of collisions for some species at individual wind farms For example Sugitomo and Matsuda (2011) applied PBR for a population of approximately 3000 White-fronted Geese (Anser albifrons frontalis) inhabiting the site of a small wind farm in Japan where pre-construction collision risk modelling estimated an annual collision mortality of 0ndash2 birds In that case PBR indicated that the population could sustain a loss of 75 geese and thus that mortalities due to turbine collisions would have a negligible effect on the population Otherwise PBR has mainly been used in relation to assessments of species with quite large populations interacting with offshore wind farms (eg Natural England 2012)
PBR is reliant on assumptions where there are imprecise or unknown demographic values and Dillingham and Fletcher (2008 2011) caution against its use for very small populations For populations in which a specific recovery rate is uncertain Wade (1998) and Dillingham and Fletcher (2008 2011) provide suggested default values for recovery rates according to the conservation status levels for threatened taxa but these are arbitrary and all such assumptions would necessarily add to uncertainty about the real level of impact on a population
Assessment of population-level impacts using any method will have greatest value when applied to the cumulative effects of all relevant wind farms (see section 42) Wherever mortality estimates from wind farms and demographic information for a lsquospecies of concernrsquo (Lumsden et al 2019) are sufficient to support PVA that will be the best modelling approach to use in determining population-level impacts In summary the following will be required to achieve this
Review the availability and currency of demographic information needed to run a PVA for the lsquospecies of concernrsquo
For species where relevant demographic data are not currently available it may be necessary to carry out appropriate studies to collect this key information before it is possible to run a PVA
A clear definition of the lsquopopulationrsquo of the particular species in question is needed
42 Cumulative impacts Environmental impact assessment processes have historically been focused on the potential effects of a particular project or development that is the subject of a planning application However where mortalities of a particular species occur at more than one wind farm the cumulative effects of the wind farms involved are of potentially greater importance than those of any individual facility As a result there is now a heightened focus on the consideration of cumulative impacts and environmental impact assessment processes are increasingly calling for consideration of the extent to which an individual wind farm might add to the accumulated effects of similar developments However methods to assess cumulative impacts have not as yet been detailed in Victorian planning requirements
Investigation of post-construction mortality monitoring at Victorian wind farms 51
It is vital that we have a clear definition of lsquocumulative effectsrsquo Fauna populations are affected by all manner of anthropogenic activities Ideally all of these activities should all be taken into account in any comprehensive consideration of the cumulative impacts on populations of conservation concern However almost none of the negative effects of such activities are able to be quantified in a way that would allow them to be assessed cumulatively with those due to wind energy Masden et al (2010) have noted that reference to a lsquocumulative effectrsquo may mean different things in different contexts In particular they note that the term is applied at times to the combined effects of multiple wind farms and at other times to the accumulated effects over time at one wind farm In the present context the term lsquocumulative effectsrsquo is used to refer only to the combined effects of multiple wind farms
There is a growing body of international literature about the cumulative impacts of wind energy on wildlife populations and section 8 (References and Selected Further Reading) includes some of the more recent andor comprehensive publications The majority of the publications about cumulative impacts include discussion of conceptual approaches but it is worth noting that no published examples have been found of jurisdictions in which a program is in operation to determine the cumulative effects of mortalities at operating wind farms
421 Nature of cumulative impacts
Scottish Natural Heritage (2012) lists the following ways in which cumulative impacts may function
the effects of different wind farms may be additive (ie a multiple independent additive model) or
the effects of different wind farms may interact in ways that are antagonistic (ie the sum of impacts are less than in a multiple independent additive model) or
the effects of different wind farms may be synergistic (ie the cumulative impact is greater than the sum of the multiple individual effects)
To these we can add that for some species routine migration passage or nomadic movements might expose them to multiple wind farms in a sequence so that the cumulative risk may be a function of the probability of surviving one wind farm after another (Smales et al 2006)
As noted by Scottish Natural Heritage (2012) it may be difficult to demonstrate antagonistic or synergistic effects and it may be simpler at least initially to concentrate on the concepts of additive effects or those associated with movements that interact with one wind farm after another
422 Pre-requisites to assessment of cumulative impacts
At present there are a number of challenges to be overcome before sound assessment of the cumulative impacts of wind energy in Victoria can be made The following points document some of them and they may not be exhaustive This is provided to offer a realistic appraisal of what would be required in order to achieve a cumulative impact assessment for the effects of turbine collisions We view this list as a prompt for further discussion and consideration of the additional work required
Uncertainties about the effects of wind energy on fauna include those related to linguistic and decision-making issues (Masden et al 2014) in addition to uncertainties of knowledge Clear definitions and standards in language and details of required processes will need to be determined and prescribed
Almost no anthropogenic causes of impact on and decline in fauna populations other than from wind energy are numerically quantified or indeed quantifiable However it is certain that there are many such causes that they affect various species in different ways depending upon the ecology of the relevant species and that many are ongoing This means that the cumulative effects of wind energy are potentially only part of a much larger negative impact on populations Importantly it also means that impacts from other causes may overlap andor mask wind farm effects in ways that confound our capacity to consider the impacts of the wind energy sector
52 Investigation of post-construction mortality monitoring at Victorian wind farms
In order to ascertain the cumulative effects of wind farms the assessments of all relevant individual wind farms must be undertaken to an agreed set of uniform standards This will be vital to ensure the compatibility of the data for use in calculations of cumulative effects
Any consideration of cumulative impact should take account of the mortalities over the expected life of a wind farm However as various wind farms will have commenced operating at different times it will be important to use a standard metric which should be the annual rate at which mortalities of relevant species occur
It is a prerequisite that quantified values for the effects or potential effects of all other relevant wind farms are available before the effects of a new one can be added to determine an overall cumulative impact It will be necessary for government or the industry itself to establish and maintain a central coordinated repository for all relevant information
Investigation of post-construction mortality monitoring at Victorian wind farms 53
5 Key learnings and limitations of current assessment
processes
The limitations outlined in this section relate to the current situation in which an individual wind farm undertakes monitoring and then estimates total mortalities occurring at the site
The examination and analyses of the existing data from Victorian wind farms as described in this report found that the monitoring carried out at many wind farms was not designed or undertaken in a manner that would allow for analyses to validly or accurately estimate annual mortality rates In part this appears to be the result of prescriptions in permit conditions andor BAM Plans that were not designed to meet a clear objective andor were written without reference to the appropriate science Examples of these issues include prescriptions for monitoring using an arbitrary search interval or around a specific number of turbines without any indication of how these might influence the capacity to estimate a total number of collisions from carcasses detected They also include carcass persistence trials and searcher efficiency trials that did not use sufficient carcasses or an adequate number of trials to provide sufficient power for the required analyses
For two wind farms the monitoring program and results were able to provide a basis on which statistical methods could be applied in an effort to calculate total mortalities However the results presented here as estimates of total numbers of mortalities per turbine per annum have very large credible intervals due to factors that introduced uncertainty even in relatively well-designed monitoring programs
51 Detection of carcasses Current practices used to detect dead birds and bats at wind farms have the capacity to detect only a small but uncertain percentage of the mortalities that may be occurring Where few collision mortalities actually occur for a particular species current methods have a low probability of detecting any carcasses at all The capacity to detect carcasses is influenced by the frequency of searches the proportion of turbines searched and how searches are undertaken The likelihood of finding carcasses also varies according to the type and height of substrate (eg whether there is long grass) and the body size of the carcasses (it is higher for large birds than for small birds and bats) These issues related to the detection of carcasses are well known and have been documented internationally For example in many overseas studies searches are undertaken much more frequently (eg twice a week) than the typical frequency in Victoria Poorly designed or executed programs exacerbate these issues but in the Victorian context as elsewhere they are realities that present substantial limitations and uncertainty even for programs that have been designed and implemented in compliance with permit conditions for wind energy projects
The simulation exercise described in this report demonstrated that searching an incrementally greater proportion of turbines could improve the capacity to detect mortalities but that even if every turbine was to be searched the chance of detecting a given carcass remained low especially for small species It indicated that if every turbine was to be searched monthly the chance of detecting a present carcass at least once over 2 years would be 35 for a microbat 40 for a small bird 60 for a medium-sized bird and 95 for a large bird
Detection of carcasses also varied individually between searchers and according to whether people or trained dogs were used for searching The analyses provided here suggest that in general dogs may be better at detecting bats but that people may be better at detecting birds Capacity to detect carcasses is also influenced by the rate at which carcasses persist or are lost due to scavengers and other environmental factors Methods currently employed to determine rates of searcher efficiency and of carcass persistence have generally been limited by a lack of truly blind trials the small numbers of trials and the use of small numbers of carcasses of the various size classes of bats and birds
It is important to note that the limitations summarised here vary according to the species in question and that their effects have less influence for large birds than they do for bats and small birds If the species of concern
54 Investigation of post-construction mortality monitoring at Victorian wind farms
at a particular site is a large-bodied bird a current search regime may have the ability to adequately detect it but that is unlikely to be the case for a small-bodied species
The potential to improve overall detection capacity appears to be limited to increasing the amount of sampling Improvements to the design of monitoring programs would thus entail greater search frequency effort and intensity and searching of greater numbers of turbines The current practices are labour-intensive and costly and improvements intended to increase detection rates would inevitably entail additional effort and cost
There were some identification issues in the data provided with incorrect species being listed (eg for one species of freetail bat see Table 1 footnote) or descriptive terms being used (eg lsquoa green grass parrotrsquo) In addition many individuals were identified only to genus level or could not be identified at all From the data available to us it is not possible to determine whether the identification issues were due to lack of expertise of the people doing the searches or identifications or due to only partial remains that lacked diagnostic features being available
52 Estimation of total wind farm mortalities The factors influencing carcass detection involve uncertainties that significantly limit the ability to calculate precise estimates of total annual collision mortality for a wind farm Unless many carcasses are found for a particular species it is not presently possible to provide estimates of total mortalities without very large credible intervals around mean values In many cases the credible intervals are so large that the utility of the estimates themselves becomes questionable
Limitations on estimating total numbers of mortalities are largely due to uncertainties associated with carcass detection The mathematics used for such estimations is well developed however despite this our estimates and uncertainty levels differed from those presented in the BAMM reports even though they were based on the same raw data Therefore the underlying assumptions made must have differed It is important that all assumptions are clearly documented to enable a transparent understanding of the factors influencing the mortality estimates
53 Population and cumulative impact assessment
In order to determine the effects of bird and bat collisions on the populations of any species it is first necessary to understand the population dynamics of the animal Modelling with methods like PVA can be used only when there is a relatively high level of demographic information available for the species in question Such information includes background rates of age- and sex-specific survivorship and mortality density dependence and measures of population stochasticity But information sufficient to run PVA is unlikely to be available for many species of Victorian birds and bats This knowledge gap is a major limitation for determining whether collision mortalities result in a negative impact on populations of key species of concern
To date with the exception of the Interim Guidelines for Brolgas (DSE 2012) monitoring programs and the calculation of total mortalities for individual wind farms has been undertaken in the absence of uniform standards for any part of the relevant processes This represents a significant limitation on determining the possible effects particularly the cumulative effects of multiple wind farms on populations because at present the data from the various sites are not compatible and the results are not comparable A set of uniform standards is vital if understanding of collision effects is to be improved
Before the cumulative effect of a newly proposed wind farm can be considered it is first necessary for the effects of all other relevant wind farms to be quantified to a consistent standard and to be available At present they are not readily available If cumulative impact assessment is to be pursued it will be necessary for government or the wind energy industry to establish and maintain a central coordinated repository for all relevant information
Investigation of post-construction mortality monitoring at Victorian wind farms 55
6 Future potential options for assessing the impact of wind
farms on birds and bats
It is apparent from the current analysis of the existing post-mortality monitoring data that based on the quality and quantity of data collected to date it is very difficult to obtain accurate estimates of the total number of mortalities caused by collisions with wind turbines Therefore changes to the existing approach are required if improvements are sought
There are a range of options for future assessments of the impacts of wind farms on birds and bats We outline seven potential approaches and discuss the advantages and disadvantages of each in Table 18 This comparison only considers the advantages and disadvantages from the perspective of the data requirements and the degree to which the subsequent analysis can support valid conclusions and does not consider broader issues in detail There are likely to be differing resource implications associated with each option and we have not included these in the table below It may be more feasible to address some of the options on an industry-wide basis rather than at each individual wind farm
Table 18 The advantages and disadvantages of potential future options for assessing the impact of collisions of birds and bats at wind farms in Victoria
No Option Advantages Disadvantages
1 No post-construction mortality monitoring is required at individual wind farms with the assumption that there is either no significant impact on birds and bats from collisions with wind turbines or that careful placement of wind farms during the planning stage can avoid significant impacts
Reduces resource requirements for both developers and regulators
Contrary to the implied assumption there may be significant impacts on some species which would go undetected
Unable to detect totally unexpected impacts
Relies on having extensive understanding of the important areas for key species to facilitate an lsquoavoid and minimisersquo approach
Would be unable to quantify any impact so would not be able to use an offset approach
No ability to determine cumulative or population-level impacts
2 Continue the practice of BAM Plans and post-construction mortality monitoring (with broad sampling for a wide range of species) but increase efforts to ensure it is done adequately and comprehensively with the wind farms managing the
Continues to provide some mortality information to contribute to the overall understanding of which species are being killed
Provides information on both non-threatened species and threatened species not solely on species on the lsquospecies of
Even with greater guidance and oversight by DELWP based on the current experience where data collection is often not undertaken in adherence with permit conditions or best-practice guidelines it is likely that there will remain variability in the quality and completeness of the data collected
56 Investigation of post-construction mortality monitoring at Victorian wind farms
No Option Advantages Disadvantages
data collection and analysis to a set of uniform standards under guidance from DELWP
concernrsquo list to inform future reassessments of species at risk from wind farms
High risk that at least some of the searcher efficiency trials would not be undertaken as blind trials (although some BAM Plans currently specify that trials are to be blind it appears they are not truly blind) resulting in lower confidence in this aspect of the analysis
Difficulty in obtaining accurate estimates of overall mortalities due to risk of insufficient sampling since DELWP may only be able to provide guidance and not be able to enforce compliance
Mortality analysis could continue to be done in varying ways making it difficult to compare results between wind farms and it may not always be done to DELWP standards despite the provision of extra guidance
Sampling effort not necessarily targeted to the key species of concern and hence less effective in obtaining reliable mortality estimates of these species
It will remain difficult to estimate cumulative and population-level impacts
An efficient sampling design would need to be developed to facilitate each wind farmrsquos collection of data to a uniform set of standards that would be incorporated into BAM Plans to be approved by the responsible authority
3 Continue the practice of BAM Plans and post-construction mortality monitoring (with broad sampling for a wide range of species) but with DELWP undertaking the mortality analysis based on data collected by the
Analysis would be undertaken to a high standard and with consistency across all wind farms leading to greater confidence in the findings
Potential for there still to be a wide range in data quality and completeness if the data continues to be collected by the wind farm operators as illustrated by the present analysis even with greater guidance
Investigation of post-construction mortality monitoring at Victorian wind farms 57
No Option Advantages Disadvantages
wind farms but to DELWPrsquos specifications This would provide consistency in analysis and greater guidance on data collection to improve its quality
Greater likelihood of transparency should there be insufficient data to make valid conclusions if the analysis is carried out by DELWP than by the wind farm operators
Risk that at least some of the searcher efficiency trials would not be undertaken as blind trials resulting in lower confidence in this aspect of the analysis
Difficulty in obtaining accurate estimates of overall mortalities due to risk of insufficient sampling since DELWP may only be able to provide guidance and not be able to enforce compliance
Sampling effort not necessarily targeted at the key species of concern and hence less effective in obtaining reliable mortality estimates of these species
Will remain difficult to estimate cumulative and population-level impacts
An efficient sampling design would need to be developed to facilitate each wind farm to collect data to a uniform set of standards that would be incorporated into BAM Plans to be approved by the responsible authority
4 Continue to undertake post-construction mortality monitoring (with broad sampling for a wide range of species) but DELWP to undertake both the data collection and analysis of mortality rates through DELWP
Can ensure data is collected comprehensively to a high and uniform standard
Can ensure data is analysed rigorously consistently and to a high standard with all assumptions fully documented and a clear indication of the level of uncertainty in the conclusions
Likely to get a much clearer indication of true mortality rates providing greater confidence in assessments of impact
DELWP would need to develop an efficient sampling strategy for each wind farm
Sampling effort not necessarily targeted at the key species of concern and hence less effective in obtaining reliable mortality estimates of these species
Will remain difficult to estimate cumulative and population-level impacts
58 Investigation of post-construction mortality monitoring at Victorian wind farms
No Option Advantages Disadvantages
5 Modify the current practice of post-construction mortality monitoring to target just the key species of concern and only require monitoring at those wind farms where there is a risk for these species (Note that this approach has started to be used in some areas of
Victoria) This would require DELWP to specify the species of concern and to map the regions in which monitoring would be needed for each species
NB This approach could be applied to the collection and analysis of data using any of options 2 3 or 4 above with their advantages and disadvantages being additional to those outlined here
Monitoring can be more targeted to focus primarily on the species of concern in the areas where they are at most risk
Will still have the capacity to detect mortalities of species not of concern at wind farms where monitoring is undertaken if this information is recorded This would maintain some capacity to provide a lsquowatching briefrsquo over such species
Potential reduction in resource requirements for both the wind industry and DELWP
Requires a good knowledge of the key risk areas for each species of concern to enable the mapping of regions in which monitoring is required
If knowledge is incomplete and monitoring is not undertaken in areas where species of concern are in fact being impacted such impacts will go undetected and hence unmitigated
If threatened species considered to be at lower risk (and hence not on the list of species of concern) are being killed more often than expected this is likely to go undetected hence this data would not be available for future reassessments of species of concern
6 Replace the current approach of each individual wind farm undertaking mortality assessments with a comprehensive investigation of a selected sample of wind farms The investigation would be designed and managed by DELWP or an independent research body to a set of uniform standards The investigation would be designed to answer key agreed questions about the effects of turbine collisions Its intention would be to inform future decisions about the significance or otherwise of effects on populations of a sample of species and may need to include investigation of
Intention would be lsquoone-offrsquo studies aimed at answering key questions on a selection of key species to inform future planning decisions
Can ensure data is collected comprehensively to a high and uniform standard
Can ensure data is analysed rigorously consistently and to a high standard with all assumptions fully documented and a clear indication of the level of uncertainty in the conclusions
Likely to get a much clearer indication of true mortality rates and of the factors increasing the risk of collisions allowing
Selected study sites may miss some important species or some species that may later emerge as being of concern or important areas for those species
Likely that not all species of concern would be able to be studied in this level of detail and hence limited data would be available on the non-studied species
Relevance of results may change as wind energy technology develops
Substantial research effort required especially to obtain population information
Investigation of post-construction mortality monitoring at Victorian wind farms 59
No Option Advantages Disadvantages
demographics of selected species
greater confidence in assessments of impact
7 Replace the current approach of each individual wind farm undertaking mortality assessments with a centrally designed and implemented landscape approach to assess population trends and all causes of mortality for each of the species of concern
Could place mortalities from wind farms into context in relation to other threats
If done comprehensively could be less subjective than individual wind farm mortality estimates based on the current level of sampling
It would be difficult to isolate any declines in populations due to wind farm mortalities from those caused by other threats
Demographic and population-level data is lacking for many species reducing the ability to undertake PVA (or similar analyses) needed to assess overall population trends
Likely to be time lags between when mortalities occur and when declines are detectable in the population trend data
Likely to not be sensitive enough to detect localised significant impacts when considered at a statewide scale negating the ability to consider mitigations at individual wind farms
An individually designed landscape-scale monitoring program would need to be developed for each species of concern requiring in an extensive amount of work in the design data collection and data analysis stages
Seasonal and year-to-year variability in population numbers would need to be considered so as to factor in natural fluctuations (such as due to drought or seasonal activity patterns) thus requiring very long-term data collection
It is clear from Table 18 that there are a range of advantages and disadvantages to each option However the options that are likely to provide the highest quality data and hence give the greatest confidence in the mortality estimates for the widest range of species are those in which DELWP (or equivalent independent organisation) undertakes both the data collection and analysis (ie options 4 and 6) If a greater focus were to be given to the species of concern (ie combining option 5 with option 4) this would enable a more targeted data collection approach with the available resources being directed more effectively to these species However this would require a good understanding of the risk profile throughout the distribution of each species of concern which is not always available Where this is not available a precautionary
60 Investigation of post-construction mortality monitoring at Victorian wind farms
approach would be needed whereby any areas of potential risk would need to be considered for surveying All these approaches would require an increase in both the quantity and quality of the data collected during mortality assessments An example of the level of detail required is provided in Appendix 2
The approach outlined in option 6 of undertaking detailed studies on a limited number of species to address key knowledge gaps would greatly improve understanding of the impacts on those species but it may not be possible to study each species of concern at this level of intensity There is therefore a trade-off between understanding more about some species but little about others as opposed to obtaining a lower but more consistent level of information about all species of concern
The final option (option 7) is an alternative centralised approach with the aim of enabling land-use change impacts to be detected at the site region and landscape scales for key species of concern This would be a marked departure from the current approach and would require extensive consideration prior to any implementation If such an approach was to be considered the following principles would be required for an effective and workable program
A robust statistically valid sampling design would be required
Each species of concern would require its own sampling design because each species will occur in different areas and at different densities have different sampling requirements and be subject to different broader threats
Consistent standardised sampling methods would be required for each species
Variables that would enable assessment of changes in population numbers over time would need to be determined and measured
A power analysis would be needed to determine how much sampling would be required in order to detect a pre-determined rate of decline with a specified level of accuracy
The sampling design would need to factor in seasonal and yearly variation in activity patterns or numbers of individuals when determining population trends
A large sampling effort would be needed to detect changes at site region and landscape scales
Much greater information would be required on population parameters population trends and demographic variables because this is currently lacking for most species
There would be a need to assess the impact of other threats in order to put the impact of wind farms into context which could require further detailed studies
Investigation of post-construction mortality monitoring at Victorian wind farms 61
7 Key knowledge gaps
While our understanding of the risks of wind farm developments to birds and bats through turbine collisions has improved there remains much to be learnt before we have a full understanding of the impacts The gaps in our knowledge fall into three categories
First we need a more comprehensive understanding of the rate at which species especially key species of concern are being killed by collisions with wind turbines The analysis undertaken in this report has highlighted a number of gaps inadequacies and inconsistencies in the existing data collection and analysis process Improving this process would enable more confidence in annual mortality estimates and a clearer understanding of how many birds and bats are being killed
Second there remain many unanswered questions as to why these species are being killed what the key risk factors are and why some species are being killed more than others Having a greater understanding of these risk factors would enable wind farms to be sited or operated in such a way as to reduce the risk
Third we need a greater understanding of the impact of the annual mortalities on the viability of populations of species of concern factoring in cumulative impacts as well as population-level impacts This would enable the impacts from wind farms to be put into context with other threats to the species and indicate whether wind farms are putting greater stress on the conservation of threatened species and increasing their risk of extinction However for many species of concern there will be limited data available on which to base a PVA and expert elicitation may be required to provide estimates for some parameters However even with incomplete information developing PVAs can help to identify where the key knowledge gaps are so that future data collection can focus on these areas to enable subsequent versions of the models to be based on actual data While expert elicitation can be useful where data is lacking there are often high levels of uncertainty within this data thus reducing confidence in the findings from the models
Some of the key knowledge gaps within each of these three categories are outlined below
1 Improving estimates of annual mortality rates
Improved understanding of the full range of species impacted ndash while there is currently a long list of species that have been recorded killed this is not necessarily a complete list because not all individuals are found during mortality searches
Increased knowledge of the numbers of individuals killed by improving searcher efficiency and carcass persistence trials because both factors have a key impact on the uncertainty in estimates of annual mortality rates Knowledge of how detectability varies based on different substrates across different seasons (in which the vegetation density and height may vary) and between dogs and human searchers is needed As part of this it is critical to undertake blind trials
Increased understanding of carcass persistence rates and how this varies seasonally in different habitats across different wind farms and under different pest management regimes
Specific mortality assessments focused on addressing some of the key risk factors (see category 2) may be a more effective approach than broadscale mortality monitoring For example for the Southern Bent-wing Bat intensive mortality monitoring could be undertaken closer to key roost sites with sampling radiating out from these sites to determine the relationship between distance from a roost cave and mortality rates or undertaken more intensively during specific high-risk weather conditions
Greater understanding of the variability in mortality rates across the range of key species of concern especially for those species that congregate in large numbers in parts of the landscape For example some of the operating wind farms are outside the range of Southern Bent-wing Bats others are within the range but not close to key roost sites whereas some are near key roosts The expected mortality rates for this species are likely to vary markedly across these wind farms
62 Investigation of post-construction mortality monitoring at Victorian wind farms
Assessment of the numbers of birds or bats that are hit but flung outside the search area or are injured but die away from the vicinity of the turbines
2 Improving understanding of why individuals are being killed and what the key risk factors are
A greater understanding of the key areas within the range of species of concern to identify where there could be a greater risk to the species ndash for example where are the key roostingnesting sites where are the key foraging areas and what are the movement pathways between foraging and roostingnesting sites Developing a lsquoheat maprsquo showing the most important areas for each species of concern would be beneficial
Understanding how the pattern of use of these key areas changes seasonally based on resource availability for species that occupy different areas seasonally This information could also have a longer-term element based on changes between years For example in drought years animals may be concentrated at the remaining wetlands much more than in wetter years
Understanding nightlydaily activity patterns and whether some species are more at risk during certain weather conditions For example bats are less likely to fly in very windy conditions which may influence collision rates
Behaviour around turbines ndash some species may be attracted to the turbines as potential roosts or navigational markers whereas other species may avoid areas containing turbines thus reducing their collision risk but potentially resulting in restricting access to some areas of habitat Undertaking well-planned and strategic activity monitoring in conjunction with mortality monitoring would help to distinguish between whether a species is not being found dead because it is not using the area or is present but is avoiding being killed
Gaining an understanding of what a changing mortality rate may mean at a wind farm If there is a decline in mortalities over time is this a result of animals learning to avoid the turbines or due to the resident animals being killed with no recruitment leaving no animals left to be found during mortality monitoring
A greater understanding of flight heights and how these vary with habitat types in which turbines are sited would improve understanding of collision risks
How far from key habitat types (such as preferred roost or forage areas) do species fly Is there a standard buffer distance that could be applied to turbines thus keeping them apart from potential foraging habitat
Investigating why some species are more susceptible to collision risks than others that fly at similar heights This has been investigated to some extent interstate and overseas and there may be variation between bird guilds (Hull et al 2013) and between the sensory perceptions of different taxa (Martin 2011) It remains an area of substantial potential investigation for Victorian fauna
3 Improving understanding of population-level impacts
There is currently limited information available on population sizes and population trends for many of the key species of concern however such information is critical for understanding population-level impacts due to wind farms
PVAs can model trends in population numbers over time under different scenarios and help to put into context the mortality rates associated with wind farm collisions However for many species key demographic information will be lacking (eg survival rates for each cohort and sex fecundity rate longevity dispersal capability population growth rate) as will the impact of threats their responses to management actions and the use and availability of key habitat resources Where this information is lacking expert elicitation can provide a best guess however there is no substitute for real data and PVAs developed just using expert elicitation are likely to have high levels of uncertainty
Investigation of post-construction mortality monitoring at Victorian wind farms 63
PVAs can however be a useful tool with these being refined as new data becomes available The initial development of PVAs for the key species of concern should be seen as a first step in improving understanding of population-level impacts It is highly likely that there will be large areas of uncertainty in these models even if some data is available The models however will be useful for identifying the areas of greatest uncertainty which can then be the focus of targeted data collection in order to improve the models The models will only be as good as the data on which they are built and if there is a high level of uncertainty in the data going into the models the model output will reflect this
64 Investigation of post-construction mortality monitoring at Victorian wind farms
8 References and selected further reading
Abadi F Gimenez O Arlettaz R and Schaub M (2010) An assessment of integrated population models bias accuracy and violation of the assumption of independence Ecology 91 7ndash14
Baerwald EF DrsquoAmours GH Klug BJ and Barclay RMR (2008) Barotrauma is a significant cause of bat fatalities at wind turbines Current Biology 18(16) 695ndash696
Bastos R Pinhancos A Santos M Fernandes RF Vicente JR Morinha F Honrado JP Travassos P Barros P and Cabral JA (2016) Evaluating the regional cumulative impact of wind farms on birds how can spatially explicit dynamic modelling improve impact assessments and monitoring Journal of Applied Ecology 53 1330ndash1340
Besbeas P Freeman SN Morgan BJT and Catchpole EA (2002) Integrating markndashrecapturendashrecovery and census data to estimate animal abundance and demographic parameters Biometrics 58 540ndash547
Brooks SP King R and Morgan BJT (2004) A Bayesian approach to combining animal abundance and demographic data Animal Biodiversity and Conservation 27 515ndash529
Buumlrkner P-C (2017) brms An R Package for Bayesian Multilevel Models Using Stan Journal of Statistical Software 80(1) 1ndash28 doi1018637jssv080i01
Department of Environment Land Water and Planning (DELWP) (2017) Policy and Planning Guidelines for Development of Wind Energy Facilities in Victoria The State of Victoria
Department of Sustainability and Environment (2012) Interim guidelines for the assessment avoidance mitigation and offsetting of potential wind farm impacts on the Victorian Brolga population Revision 1 February 2012 Victorian Government Department of Sustainability and Environment Melbourne Victoria
Department of Sustainability and Environment (DSE) (2013) Advisory List of Threatened Vertebrate Fauna in Victoria Department of Sustainability and Environment Melbourne
Diffendorfer JE Beston JA Merrill MD Stanton JC Corum MD Loss SR Thogmartin WE Johnson DH Erickson RA and Heist KW (2015) Preliminary methodology to assess the national and regional impact of US wind energy development on birds and bats US Geological Survey Scientific Investigations Report 2015ndash5066 httpdxdoiorg103133sir20155066
Diffendorfer JE Beston JA Merrill MD Stanton JC Corum MD Loss SR Thogmartin WE Johnson DH Erickson RA and Heist KW (2017) A method to assess the population-level consequences of wind energy facilities on bird and bat species In Koumlppel J (Ed) Wind Energy and Wildlife Interactions Presentations from the CWW2015 Conference pp 65ndash76 Springer Cham Switzerland
Dillingham PW and Fletcher D (2008) Estimating the ability of birds to sustain additional human-caused mortalities using a simple decision rule and allometric relationships Biological Conservation 141 1783ndash1792
Dillingham PW and Fletcher M (2011) Potential biological removal of albatrosses and petrels with minimal demographic information Biological Conservation 144 1885ndash1894
Frick WF Baerwald EF Pollock JF Barclay RMR Szymanski JA Weller TJ Russell AL Loeb SC Medellin RA and McGuire JP (2017) Fatalities at wind turbines may threaten population viability of a migratory bat Biological Conservation 209 172ndash177
Gilpin ME and Souleacute ME (1986) Minimum viable populations processes of species extinction In Souleacute ME (Ed) Conservation Biology The Science of Scarcity and Diversity pp 19ndash34 Sinauer Associates Sunderland MA USA
Goodale MW and Milman A (2016) Cumulative adverse effects of offshore wind energy development on wildlife Journal of Environmental Planning and Management 59(1) 1ndash21
Hull CL and Muir S (2010) Search areas for monitoring bird and bat carcasses at wind farms using a Monte-Carlo model Australasian Journal of Environmental Management 17 77ndash87
Investigation of post-construction mortality monitoring at Victorian wind farms 65
Hull C Stark E and Muir S (2014) Indirect (disturbance) impact of wind farms on birds can it be measured Presentation to New Zealand Wind Energy Conference 2014 httpwwwwindenergyorgnzstoredoc2014NZWEC_CindyHullpdf
Hull CL Stark EM Peruzzo S and Sims CC (2013) Avian collisions at two wind farms in Tasmania Australia taxonomic and ecological characteristics of colliders versus noncolliders New Zealand Journal of Zoology 40(1) 47ndash62
Huso M Dalthorp D and Korner-Nievergelt F (2017) Statistical principles of post-construction fatality monitoring Perrow MR (Ed) Wildlife and Wind Farms Conflicts and Solutions Vol 2 Onshore Monitoring and Mitigation pp 84ndash102 Pelagic Publishing Exeter UK
Kahlert J Petersen I K Fox A D Desholm M and Clausager I (2004) Investigations of birds during construction and operation of Nysted offshore wind farm at Roslashdsand Annual status report 2003 82 pp NERI Report Roslashnde National Environmental Research Institute Denmark
Keacutery M and Schaub M (2012) Bayesian Population Analysis Using WinBUGS A Hierarchical Perspective Academic Press Waltham USA
Landscape Design Associates (2000) Cumulative effects of wind turbines Vol 3 Report on results of consultations on cumulative effects of wind turbines on birds Report for New and Renewable Energy Programme ETSU for Department of Trade and Industry UK
Lehnert LS Kramer-Schadt S Schonborn S Lindecke O Niermann I and Voigt CC (2014) Wind farm facilities in Germany kill noctule bats from near and far PLoS ONE 9(8) e103106 doi 101371journalpone0103106
Leopold MF Boonman M Collier MP Davaasuren N Fijn RC Gyimesi A de Jong J Jongbloed RH Jonge Poerink B Kleyheeg-Hartman JC Krijgsveld KL Lagerveld S Lensink R Poot MJM van der Wal JT and Scholl M (2014) A first approach to deal with cumulative effects on birds and bats of offshore wind farms and other human activities in the southern North Sea IMARES Report C16614
Lumsden LF Moloney PD and Smales I (2019) Developing a science-based approach to defining key species of birds and bats of concern for wind farm developments in Victoria Arthur Rylah Institute for Environmental Research Technical ReportSeries No 301 Department of Environment Land Water and Planning
Martin GR (2011) Understanding bird collisions with man-made objects a sensory ecology approach Ibis 153 239ndash254
Masden EA Fox AD Furness RW Bullman R and Haydon DT (2010) Cumulative impact assessments and birdwind farm interactions developing a conceptual framework Environmental Impact Assessment Review 30(1) 1ndash7
Masden EA Haydon DT Fox AD Furness RW Bullman R and Desholm M (2009) Barriers to movement impacts of wind farms on migrating birds ICES Journal of Marine Science 66 746ndash753 httpswwwresearchgatenetpublication249284301_Barriers_to_movement_Impacts_of_wind_farms_on_migrating_birds
Masden EA McCluskie A Owen E and Langston RHW (2014) Renewable energy developments in an uncertain world the case of offshore wind and birds in the UK Marine Policy 51 169ndash172
Mathews F Swindells M Goodhead R August TA Hardman P Linton DM and Hosken DJ (2013) Effectiveness of search dogs compared with human observers in locating bat carcasses at wind-turbine sites a blinded randomized trial Wildlife Society Bulletin 37(1) 34ndash40 doi101002wsb256
McCarthy M (2008) A model of population viability to assess impacts of wind farms on the Victorian Brolga population Final report 24 June 2008
Miller RG Gong G and Muntildeoz A (1981) Survival Analysis Wiley New York
Natural England (2012) The Planning Act 2008 The infrastructure planning (Examination procedure) Rules 2010 Triton Knoll Wind Farm Order Application Annex C Expert Report on Ornithology by Dr Alex Banks httpinfrastructureplanninginspectorategovukprojectseast-midlandstriton-knoll-offshore-wind-farmipcsection=docsampstage=4ampfilter=Written+Representations (accessed 24 February 2016)
66 Investigation of post-construction mortality monitoring at Victorian wind farms
Pearce-Higgins JW Stephen L Langston RHW and Bright JA (2008) Assessing the cumulative impacts of wind farms on peatland birds a case study of golden plover Pluvialis apricaria in Scotland Mires and Peat 4 1ndash13
R Core Team (2018) R A Language and Environment for Statistical Computing R Foundation for Statistical Computing Vienna Austria httpswwwR-projectorg
Rollins KE Meyerholz DK Johnson GD Capparella AP and Loew SS (2012) A forensic investigation into the etiology of bat mortality at a wind farm barotrauma or traumatic injury Veterinary Pathology 49(2) 362ndash371
Schaub M and Abadi F (2011) Integrated population models a novel analysis framework for deeper insights into population dynamics Journal of Ornithology 152 (Suppl 1) 227ndash237
Scottish Natural Heritage (2012) Guidance note ndash assessing the cumulative impacts of onshore wind energy developments httpswwwnaturescotassessing-cumulative-impact-onshore-wind-energy-developments
Smales I (2017) Modelling of collision risk and populations In Perrow MR (Ed) Wildlife and Wind Farms Conflicts and Solutions Vol 2 Onshore Monitoring and Mitigation pp 58ndash83 Pelagic Publishing Exeter UK
Smales I Muir S and Meredith C (2006) Modelled cumulative impacts on the orange-bellied parrot of wind farms across the speciesrsquo range in southeastern Australia Biosis Research report to the Australian Government Department of Environment and Heritage httpwwwenvironmentgovausystemfilesresources2d42fcbd-31ea-4739-b109-b420571338a3fileswind-farm-bird-riskpdf [accessed January 2007]
Smallwood KS (2007) Estimating wind turbine-caused bird mortality Journal of Wildlife Management 71(8) 2781ndash2791 httpwwwjstororgstable4496403
Su Y-S and Yajima M (2015) R2jags Using R to Run lsquoJagsrsquo httpsCRANR-projectorgpackage=R2jags
Sugimoto H and Matsuda H (2011) Collision risk of white-fronted geese with wind turbines Ornithological Science 10 61ndash71
Wade PR (1998) Calculating limits to the allowable human-caused mortality of cetaceans and pinnepeds Marine Mammal Science 14 1ndash37
Investigation of post-construction mortality monitoring at Victorian wind farms 67
9 Appendices
Appendix 1 Bat and Avifauna Management Plan requirements Extract from Example permit conditions for a wind energy facility (DELWP 2017)
Bats and Avifauna Management Plan
36 The Environmental Management Plan must include a Bat and Avifauna Management Plan (BAM Plan) which must
a include a statement of the objectives and overall strategy for minimising bird and bat strike arising from the operation of the facility
b include a mortality monitoring program of at least two years duration that commences when the first turbine is commissioned or such other time approved by DELWP (Environment Portfolio) The monitoring program must include
i procedures for reporting any bird and bat strikes to DELWP (Environment Portfolio) monthly
ii information on the efficacy of searches for carcasses of birds and bats and where practicable information on the rate of removal of carcases by scavengers so that correction factors can be determined to enable calculations of the likely total number of mortalities and
iii procedures for the regular removal of carcasses likely to attract raptors to areas near turbines
c be approved by DELWP (Environment Portfolio) prior to submission to the responsible authority
37 When the monitoring program required under the BAM Plan is complete the operator must submit a report to the responsible authority and DELWP (Environment Portfolio) setting out the findings of the program The report must be
a to the satisfaction of the responsible authority and DELWP (Environment Portfolio)
b made publicly available on the operatorrsquos website
38 After considering the report submitted under condition 37 and consulting with DELWP (Environment Portfolio) the responsible authority may direct the operator to conduct further investigation of impacts on birds and bats The further investigation must be undertaken by the wind energy facility operator to the satisfaction of the responsible authority and DELWP (Environment Portfolio)
68 Investigation of post-construction mortality monitoring at Victorian wind farms
Appendix 2 Data requirements for effective estimation of annual mortality rates The following list outlines the level of detail required to enable comprehensive rigorous analysis of annual mortality rates at wind farms in Victoria
This list was sent to request raw data from the six wind farms that were considered to potentially have sufficient data to warrant more detailed analysis for this project This request was sent in August 2017 to six wind farms (A B C D E and F)
Data required for an assessment of existing post-construction mortality monitoring data at Victorian wind farms
The following data is required to evaluate the effectiveness of the existing post-construction mortality monitoring data in estimating annual mortalities of birds and bats at wind farms
The required data is split into five categories
1 Turbine details ndash details of the location size and proximity to wildlife habitat for each turbine within a wind farm development
2 Searcher efficiency trials ndash details of each searcher trial undertaken with different carcass types
3 Carcass persistence trials ndash details of methods used and results of trials
4 Mortality surveys ndash details of methods used and findings
5 Incidental finds of carcasses outside of the mortality surveys
An excel spreadsheet is provided outlining the preferred format for the provision of data The information requested is provided in more detail below
Turbine details
For each turbine on each wind farm the following details are required
Turbine identification number
GPS location
Description of location of turbine ndash such as if turbine is located on edge or in the centre of the array availability of bird or bat habitat nearby eg native vegetation or scattered paddock trees wetlands
Blade length
Minimum swept height (metres above ground)
Maximum swept height (metres above ground)
Height of base
Hardstand area (square metres)
Date the turbine commenced operations
Turbine lit ndash if the turbine has lights and if it was lit during the previous month
Searcher efficiency trials
For each time searcher trials were undertaken at a wind farm the following information is required
Date of trial
Weather conditions on day of trial
Blind trial ndash were searchers aware that a trial was being undertaken on that day If aware of the trial were they aware of the number of carcasses
Investigation of post-construction mortality monitoring at Victorian wind farms 69
Name of the searcher
If a dog was used provide the name of the dog
Search transect ndash include total area searched distance walked and time spent searching and the number of turbines searched Was it done as part of the normal mortality survey or specifically as a trial Were the carcasses randomly spread To what distance from the base were they spread
For each type of carcass ndash large bird medium bird small bird and bat ndash provide the following
o Carcass ndash what species was used to simulate the carcass type
o Vegetation type (the density of the vegetation will influence detectability so it would be useful to determine detectability for a range of vegetation types)
Bare ground
Short or sparse vegetation ndash eg short grass
Long or dense vegetation ndash eg long grass or heath
o Number of carcasses deployed and the number found in each vegetation type
Carcass persistence trials
For each carcass used in a carcass persistence trial at a wind farm provide the following information
The category of carcass ndash ie large bird medium bird small bird bat
Carcass ndash the species of carcass
The date the carcass was put in place
The turbine it was closest to
Vegetation ndash virtually none short or sparse vegetation dense or long vegetation
Pest control etc ndash date and details of any pest control that could impact carcass persistence rates eg rabbit control fox baiting or other activities such as lambing under turbines carrion removal
The number of days the carcass was checked and frequency of checks
For each check
o Date
o Weather ndash general weather conditions since previous check ndash eg temperature and rainfall (as these will affect decomposition rates)
o Condition of carcass ndash eg intact partly scavenged remnants only (eg feathers) or completely removed
Mortality surveys
For each mortality survey undertaken at a wind farm provide the following data ndash include all surveys irrespective of whether carcasses were located
Date of survey
The number of turbines searched
Were turbines cleared of existing carcasses prior to commencement of scheduled searches If so how many days prior to the search
Pest control etc ndash date and details of any pest control that could impact observation rates eg rabbit control fox baiting or other activities such as lambing under turbines carrion removal
Weather conditions on the day of the survey
For each individual turbine searched
70 Investigation of post-construction mortality monitoring at Victorian wind farms
o Turbine number
o Searcherrsquos name
o Dogrsquos name if used
o Search method ndash describe the search method including duration of search transect width shape of search area distance out from base if GPS track was taken etc
o Search area ndash estimated total area searched in square metres
o of area searched that was bare ground
o of area searched that was short or sparse vegetation
o of area that was long or dense vegetation
o The percentage of time the turbine was operational over the past 5 days
o The percentage of time the turbine was operational over the past 30 days
o Total number of carcasses detected in this search at this turbine
o For each carcass
Species
Condition ndash injured intact carcass partial remains scavenged feathers only etc
Vegetation within general vicinity of carcass ndash bare ground short or sparse vegetation dense or long vegetation
GPS location
Distance to turbine base
Direction to turbine base (bearing)
Carcass identifier ndash who identified the species
Incidental finds
For any incidental finds outside of mortality surveys provide subset of above data
Turbine number
Date
Searcher
Species
Condition ndash injured intact carcass partial remains scavenged feathers only etc
Vegetation within general vicinity of carcass ndash bare ground short or sparse vegetation dense or long vegetation
GPS location
Distance to turbine base
Direction to turbine base (bearing)
Carcass identifier ndash who identified the species
Fate of carcass ndash was it removed or left in place to be included in mortality surveys
Investigation of post-construction mortality monitoring at Victorian wind farms 71
Appendix 3 Additional detail on the modelling approach for determining mortality rates Bayesian models allow for the possibility that a species is killed but not detected in the surveys (Keacutery and Schaub 2012) The formulation we used assumed that underlying mortality for each species followed a negative binomial distribution that the carcass persistence rate hazard rate followed a Weibull distribution and that the detection rate of the carcasses that remained followed a Bernoulli distribution Difference between searchers and between turbines were treated as random effects A Bayesian model using the equation outlined in section 253 (1) as the basis of the model was formulated using the following set of equations and distributions
119883 sim Pois 120583 120601 2
119884 sim Bern 119901 3
119879 sim Weibull 119903 120578 4
120583 120582 D ℎ
365 5
120601 119901 119878 6
logit 119901 120572 120598 7
119878 120564 120596
D 8
120596 Pr 119879 119896 9
log 120578 120573 120598 10
ℎ sim Gamma 120575 120575 11
120598 sim 119873 0 120590 12
120598 sim 119873 0 120590 13
From the turbine surveys 119883 is the number of individuals of species 119894 that were detected at observation 119895 120582
is the mortality rate for species 119894 per turbine per year From the searcher efficiency trials 119884 is 1 if the
carcass was detected and 0 if it wasnrsquot and 119901 is the probability that an individual of species 119894 is detected by
the searcher at observation 119895 From the carcass persistence trials 119879 is the time it takes for the carcass to
disappear
72 Investigation of post-construction mortality monitoring at Victorian wind farms
Appendix 4 Model estimates for the combined searcher and carcass persistence trials using the data from the four wind farms for which raw data was available Table A41 The searcher efficiency trial model estimates (on logit scale) combined for the four wind farms for which raw data was available Lower and upper bounds refer to the bounds of the 95 credible intervals for the estimate
Effect Parameter Estimate Lower bound
Upper bound
Fixed Bat detection using humans 0298 -2037 2499
Fixed Difference between bird and bat detection using humans
2029 1243 2805
Fixed Difference in bat detection between dogs and humans
0690 -2264 3761
Fixed Additional difference between bird detection using dogs and bat detection using humans compared with previous two estimates
-1499 -2704 -0251
Random sd Searcher 0740 0080 2000
Random sd Wind farm 0930 0020 4850
Table A42 The carcass persistence trial model estimates (on logarithmic scale) for the four wind farms where the raw data was available Lower and upper bounds refer to the bounds of the 95 credible intervals for the estimate
Effect Parameter Estimate Lower bound
Upper bound
Fixed Mean time to total disappearance for bats 2037 1594 2486
Fixed Difference between birds and bats for the mean time to total-disappearance
1440 1093 1787
Random sd Wind farm 0230 0010 1020
Random sd Turbine 0180 0010 0460
Shape 0720 0650 0790
Investigation of post-construction mortality monitoring at Victorian wind farms 73
Appendix 5 Parameter estimates for the searcher efficiency and carcass persistence trials at Wind Farm A and Wind Farm B Table A51 The parameter estimates for the searcher efficiency and carcass persistence rates from Wind Farm A Lower and upper bounds refer to the bounds of the 95 credible intervals for the estimate Detection estimates are in logistic scale non-shape carcass persistence estimates are in logarithmic scale
Model Estimate Estimate Lower bound
Upper bound
Detection Bat 0762 -0702 2384
Detection Difference between small bird amp bat -0235 -2151 1874
Detection Difference between medium bird amp bat 1794 0314 3635
Detection Difference between large bird amp bat 2269 0592 4473
Carcass persistence Bat -1810 -2572 -0889
Carcass persistence Difference between small bird amp bat -3184 -4772 -1955
Carcass persistence Difference between medium bird amp bat -2481 -3416 -1621
Carcass persistence Difference between large bird amp bat -1133 -3752 0837
Carcass persistence Shape parameter for bat 0911 0615 1193
Carcass persistence Shape parameter for small bird 1060 0619 1531
Carcass persistence Shape parameter for medium bird 0813 0577 1066
Carcass persistence Shape parameter for large bird 0336 0007 0954
Table A52 The parameter estimates for the searcher efficiency and carcass persistence rates from Wind Farm B Lower and upper bounds refer to the bounds of the 95 credible intervals for the estimate Detection estimates are in logistic scale non-shape carcass persistence estimates are in logarithmic scale
Model Estimate Estimate Lower bound
Upper bound
Detection Bat 0171 -0984 1236
Detection Difference between small bird amp bat 0848 -0343 1896
Detection Difference between medium bird amp bat 3432 2158 4608
Detection Difference between large bird amp bat 4546 3515 5000
Carcass persistence Bat -1328 -1945 -0731
Carcass persistence Difference between small bird amp bat -0954 -1560 -0350
Carcass persistence Difference between medium bird amp bat -1290 -1801 -0803
Carcass persistence Difference between large bird amp bat -4439 -5000 -3414
Carcass persistence Shape parameter for bat 0883 0699 1105
Carcass persistence Shape parameter for small bird 0887 0708 1102
Carcass persistence Shape parameter for medium bird 0717 0605 0838
Carcass persistence Shape parameter for large bird 0915 0630 1197
wwwdelwpvicgovau
wwwarivicgovau

Arthur Rylah Institute for Environmental Research Department of Environment Land Water and Planning PO Box 137 Heidelberg Victoria 3084 Phone (03) 9450 8600 Website wwwarivicgovau
Citation Moloney PD Lumsden LF and Smales I (2019) Investigation of existing post-construction mortality monitoring at Victorian wind farms to assess its utility in estimating mortality rates Arthur Rylah Institute for Environmental Research Technical Report Series No 302 Department of Environment Land Water and Planning Heidelberg Victoria
Front cover photo A Victorian wind farm (Photo Lindy Lumsden)
copy The State of Victoria Department of Environment Land Water and Planning 2019
This work is licensed under a Creative Commons Attribution 30 Australia licence You are free to re-use the work under that licence on the condition that you credit the State of Victoria as author The licence does not apply to any images photographs or branding including the Victorian Coat of Arms the Victorian Government logo the Department of Environment Land Water and Planning logo and the Arthur Rylah Institute logo To view a copy of this licence visit httpcreativecommonsorglicensesby30audeeden
Printed by Melbourne Polytechnic Preston
Edited by Organic Editing
ISSN 1835-3827 (print) ISSN 1835-3835 (pdf)) ISBN 978-1-76077-796-8 (Print) ISBN 978-1-76077-797-5 (pdfonlineMS word)
Disclaimer This publication may be of assistance to you but the State of Victoria and its employees do not guarantee that the publication is without flaw of any kind or is wholly appropriate for your particular purposes and therefore disclaims all liability for any error loss or other consequence which may arise from you relying on any information in this publication
Accessibility If you would like to receive this publication in an alternative format please telephone the DELWP Customer Service Centre on 136 186 email customerservicedelwpvicgovau or contact us via the National Relay Service on 133 677 or wwwrelayservicecomau This document is also available on the internet at wwwdelwpvicgovau
Arthur Rylah Institute for Environmental Research Department of Environment Land Water and Planning Heidelberg Victoria
Investigation of existing post-construction mortality monitoring at Victorian wind farms to assess its utility in estimating mortality rates
Paul Moloney1 Lindy Lumsden1 and Ian Smales2
1 Arthur Rylah Institute for Environmental Research Department of Environment Land Water and Planning 123 Brown Street Heidelberg Victoria 3084
2 Biosis Pty Ltd 38 Bertie Street Port Melbourne Victoria 3207
Date
Arthur Rylah Institute for Environmental Research Technical Report Series No 302
ii Investigation of post-construction mortality monitoring at Victorian wind farms
Acknowledgements
This project was funded through the Energy Environment and Climate Change Group of the Department of Environment Land Water and Planning (DELWP) Support and policy input were provided by Lis Ashby Ruby Campbell-Beschorner Nick Rintoul Tracey Taylor and Karen Weaver Useful comments on the report were provided by Amanda Bush and Emma Bennett We thank Amanda Bush and Tiarne Ecker for assistance with compiling the data
Investigation of post-construction mortality monitoring at Victorian wind farms iii
Contents
Acknowledgements ii
Summary 1
Context 1
Aims 1
Methods 1
Results 2
Conclusions and implications 3
1 Introduction 5
11 Context 5
12 Report objectives and scope 5
13 Overview of approach 6
2 Analyses of data collected during post-construction mortality monitoring at Victorian wind farms 8
21 Overview of methods used to estimate total mortalities for individual wind farms 8
22 Variability in methods used during post-construction mortality monitoring at Victorian wind farms 9
23 Numbers of bats and birds found dead during mortality searches at Victorian wind farms 10
231 Bats 11
232 Birds 12
24 Suitability of the data for statistical analyses 14
25 Methods used to analyse mortality rates 16
251 Searcher efficiency trials 16
252 Carcass persistence trials 16
253 Mortality rate 16
26 Estimated mortality rates 17
261 Searcher efficiency trial results 17
262 Searcher efficiency trials discussion 19
263 Carcass persistence trial results 20
264 Carcass persistence trials discussion 21
265 Mortality rate analysis results 21
266 Mortality surveys discussion 32
27 Comparison of estimates of mortality rates with those undertaken by the wind farms 33
271 Wind Farm A 33
272 Wind Farm B 35
273 Potential reasons for differences between mortality estimates in the BAMM reports and those obtained in our analysis 38
274 Other wind farms 38
3 Simulations to examine the likelihood of detecting mortalities of different species 39
31 Mortality estimates 39
iv Investigation of post-construction mortality monitoring at Victorian wind farms
32 Likelihood of detecting at least one individual 43
321 Bat species 43
322 Small bird species 44
323 Medium-sized bird species 45
324 Large bird species 46
33 Discussion results of simulations 47
4 Population and cumulative impacts 49
41 Population-level impacts 49
411 Population modelling 49
42 Cumulative impacts 50
421 Nature of cumulative impacts 51
422 Pre-requisites to assessment of cumulative impacts 51
5 Key learnings and limitations of current assessment processes 53
51 Detection of carcasses 53
52 Estimation of total wind farm mortalities 54
53 Population and cumulative impact assessment 54
6 Future potential options for assessing the impact of wind farms on birds and bats 55
7 Key knowledge gaps 61
8 References and selected further reading 64
9 Appendices 67
Appendix 1 Bat and Avifauna Management Plan requirements 67
Appendix 2 Data requirements for effective estimation of annual mortality rates 68
Appendix 3 Additional detail on the modelling approach for determining mortality rates 71
Appendix 4 Model estimates for the combined searcher and carcass persistence trials using the data from the four wind farms for which raw data was available 72
Appendix 5 Parameter estimates for the searcher efficiency and carcass persistence trials at Wind Farm A and Wind Farm B 73
Investigation of post-construction mortality monitoring at Victorian wind farms v
Tables
Table 1 The number of bats found dead at Victorian wind farms during post-construction mortality monitoring from 2003 to 2018 12
Table 2 The number of birds found dead at Victorian wind farms during post-construction mortality monitoring from 2003 to 2018 13
Table 3 Total number of reported turbine surveys and numbers of individual carcasses used in searcher efficiency trials and carcass persistence trials at the six wind farms where raw data was requested for further analysis based on data received in November 2017 16
Table 4 The probabilities (shown as percentages) of detecting a bat or a bird when present using either humans or dogs (using the combined data from the four wind farms where the raw data was available) 18
Table 5 A summary of the results of searcher efficiency trials for detecting bat and bird mortalities due to wind turbines (based on data from four wind farms) 20
Table 6 The estimated time carcasses remained on site before disappearing during carcass persistence trials 20
Table 7 The estimated detection rate obtained from the searcher efficiency trials at Wind Farm A for bats and three size classes of birds 22
Table 8 The estimated carcass persistence rates based on data from trials at Wind Farm A for bats and three size classes of birds 22
Table 9 The estimated proportion of carcasses that were not scavenged or otherwise lost prior to a survey (averaged over 30 days) at Wind Farm A 23
Table 10 The estimated mortality rate (per turbine per year) at Wind Farm A 24
Table 11 The detection rates estimated from data from searcher efficiency trials at Wind Farm B for bats and for three size classes of birds 27
Table 12 The estimated carcass persistence rates estimated from data from trials at Wind Farm B for bats and three size classes of birds 27
Table 13 The estimated proportion of carcasses that were not scavenged or otherwise lost prior to survey (averaged over 30 days) at Wind Farm B 28
Table 14 The estimated mortality rates (per turbine per year) at Wind Farm B 29
Table 15 Comparison between Wind Farm A and Wind Farm B of the modelled estimates for the detection rates based on the searcher efficiency trials and the length of time before disappearance 32
Table 16 Detection rates from searcher efficiency trials for each size class and searcher type using data from Wind Farms A B C E and F 39
Table 17 Estimated proportion of carcasses that will remain to be observed for each size class using data from Wind Farms A and B 39
Table 18 The advantages and disadvantages of potential future options for assessing the impact of collisions of birds and bats at wind farms in Victoria 55
vi Investigation of post-construction mortality monitoring at Victorian wind farms
Figures
Figure 1 Estimated detection probabilities (shown as percentages) for surveys undertaken using humans or dogs to locate bats and birds during the searcher efficiency trials (using the combined data from the four wind farms where the raw data was available) 18
Figure 2 Estimated detection probabilities for four human surveyors and four dog surveyors undertaking searcher efficiency trials for bats and birds 19
Figure 3 Estimated probabilities of carcass persistence for bats and birds during carcass persistence trials from the four wind farms where raw data was obtained 21
Figure 4 Estimated mortality rate (individual deaths per turbine per year) for bat species at Wind Farm A Lines indicate the 95 credible intervals 23
Figure 5 Estimated mortality rates (individuals per turbine per year) for small bird species found at Wind Farm A Lines indicate the 95 credible intervals 25
Figure 6 Estimated mortality rates (individuals per turbine per year) for medium-sized bird species found at Wind Farm A 26
Figure 7 Estimated mortality rates (individuals per turbine per year) for large bird species found at Wind Farm A 26
Figure 8 Estimated mortality rates (individuals per turbine per year) for bat species found at Wind Farm B 28
Figure 9 Estimated mortality rates (individuals per turbine per year) for small bird species found at Wind Farm B Lines indicate the 95 credible intervals 30
Figure 10 Estimated mortality rates (individuals per turbine per year) for medium-sized bird species found at Wind Farm B 31
Figure 11 Estimated mortality rates (individuals per turbine per year) for large bird species found at Wind Farm B 31
Figure 12 Estimated bat mortality rate (bat deaths per turbine per year) at Wind Farm A from the Bat and Avifauna Mortality Monitoring report (orange) and from our model (termed lsquolegacyrsquo in blue) 34
Figure 13 Estimated total bird mortality rate (total bird deaths per turbine per year) at Wind Farm A from the Bat and Avifauna Mortality Monitoring report (orange) and from our model (termed lsquolegacyrsquo in blue) 34
Figure 14 Estimated bat mortality rate (bat deaths per turbine per year) at Wind Farm B from each year of their 2-year monitoring program taken from annual Bat and Avifauna Mortality Monitoring reports (orange) and from our analysis of their combined data (termed lsquolegacyrsquo in blue) 35
Figure 15 Estimated total bird mortality rate (total bird deaths per turbine per year) at Wind Farm B from annual Bat and Avifauna Mortality Monitoring reports (orange) and from our analysis of their combined data (termed lsquolegacyrsquo in blue) 36
Figure 16 Estimated small bird mortality rate (small bird deaths per turbine per year) at Wind Farm B from annual Bat and Avifauna Mortality Monitoring reports (orange) and from our analysis of their combined data (termed lsquolegacyrsquo in blue) 36
Figure 17 Estimated medium-sized bird mortality rate (medium-sized bird deaths per turbine per year) at Wind Farm B from annual Bat and Avifauna Mortality Monitoring reports (orange) and from our analysis of their combined data (termed lsquolegacyrsquo in blue) 37
Figure 18 Estimated large bird mortality rate (large bird deaths per turbine per year) at Wind Farm B from annual Bat and Avifauna Mortality Monitoring reports (orange) and from our analysis of their combined data (termed lsquolegacyrsquo in blue) 37
Figure 19 The estimated mortality rates from the simulation with monthly surveys at 5 of the 50 turbines Mortality rates of 1 5 and 10 deaths per annum (pa) are considered 40
Figure 20 The estimated mortality rates from the simulation with monthly surveys at 15 of the 50 turbines Mortality rates of 1 5 and 10 deaths per annum (pa) are considered 41
Figure 21 The estimated mortality rates from the simulation with monthly surveys at 25 of the 50 turbines Mortality rates of 1 5 and 10 deaths per annum (pa) are considered 42
Investigation of post-construction mortality monitoring at Victorian wind farms vii
Figure 22 The estimated mortality rates from the simulation with monthly surveys at all 50 turbines Mortality rates of 1 5 and 10 deaths per annum (pa) are considered 43
Figure 23 Probability that at least one bat of a particular species was detected during monthly surveys over 2 years given the total number of annual mortalities for that species 44
Figure 24 Probability that at least one small bird of a particular species was detected during monthly surveys over 2 years given the total number of annual mortalities for that species 45
Figure 25 Probability that at least one medium-sized bird of a particular species was detected during monthly surveys over 2 years given the total number of annual mortalities for that species 46
Figure 26 Probability that at least one large bird of a particular species was detected during monthly surveys over 2 years given the total number of annual mortalities for that species 47
Investigation of post-construction mortality monitoring at Victorian wind farms 1
Summary
Context Wind energy is a significant component of the Victorian governmentrsquos commitment to renewable energy Assessment of potential impacts on birds and bats due to collisions with turbines is now routinely undertaken at operating wind farms and this includes post-construction mortality monitoring Monitoring programs vary considerably between wind farms in their objectives and design and in the intensity frequency and duration of monitoring Bird and bat carcasses that are found are documented and to estimate the total numbers of mortalities that are likely to have occurred on a wind farm correction factors are developed to factor in the level of sampling and site-specific detectability issues However despite many years of monitoring the accuracy of such estimates remains unclear and it is not yet known whether turbine collisions are having a significant impact on populations of birds and bats Therefore it is timely to conduct a review of the post-construction mortality monitoring that has been undertaken to date to assess what conclusions can be drawn from the available data and to develop options for improvements in the future
Aims The specific aims of this review are
to examine the existing post-construction mortality monitoring data to evaluate whether these data are adequate to estimate annual mortalities of birds and bats at wind farms
to generate a list of all the species known to have been killed by collisions with turbines at wind farms
to discuss possible approaches for assessing the cumulative and population-level impacts of multiple wind farms across the landscape
to develop options for future post-construction monitoring for wind farms and to discuss their advantages and disadvantages and
to identify key knowledge gaps that if filled would enable greater confidence in mortality assessments and in estimates of cumulative and population-level impacts
Methods The approach taken in analysing the existing post-construction mortality monitoring data from Victorian wind farms involved
collating information on the sampling approach undertaken by each wind farm in their post-construction mortality monitoring
collating the mortality records to provide an aggregate list of numbers of all species known to have been killed at Victorian wind farms (including non-threatened species for completeness and for comparison with threatened or migratory lsquospecies of interestrsquo1)
requesting the raw data from the subset of the wind farms that we assessed as potentially having sufficient data from the mortality searches searcher efficiency trials and carcass persistence trials to enable a detailed analysis of the annual mortality rates
for the wind farms where there was sufficient data undertaking analysis to estimate annual mortality rates and the range of plausible values for these estimates to provide an indication of uncertainty
comparing these annual mortality estimates with those calculated by the wind farms and
1 lsquoSpecies of interestrsquo is used instead of lsquospecies of concernrsquo because the latter list had not been finalised at the time of writing this report
(see Lumsden et al 2019)
2 Investigation of post-construction mortality monitoring at Victorian wind farms
undertaking simulations to determine the level of monitoring required to significantly reduce the uncertainty in the estimates of annual mortalities
Results Collation of existing data Data was collated from post-construction mortality surveys for 15 Victorian wind farms Survey methods varied markedly between wind farms (i) in the length of the monitoring program (most were for 2 years) (ii) in the proportion and absolute number of turbines searched (ranging from about one-third for larger wind farms to all turbines for smaller wind farms) (iii) in the frequency of monitoring (typically monthly) (iv) in whether monitoring was undertaken by people or dogs (v) in the size of the area under the turbines searched and the search pattern (vi) in the rigour of the searcher efficiency trials (there was large variability in the number and types of carcasses used) and (vii) in the rigour of the carcass persistence trials (again there was large variability in the number and types of carcasses used) As a result the quality of the data collected varied markedly with higher quality data collected at some wind farms compared to others A key finding of this component of the review was that searcher efficiency trials were typically not undertaken as true blind trials despite this often being specified in the Bat and Avifauna Management Plans (BAM Plans) This significantly reduces confidence in the results of these trials
Collation of mortality records A total of 1011 bats or birds have been found dead at Victorian wind farms (based on the data available to February 2018) with bats representing 44 and birds 56 of the total Carcasses of at least 13 species of bats have been recorded at wind farms with the majority of bat records being of the White-striped Freetail Bat (Austronomus australis) (67) There were eight mortality records of one species of interest the Critically Endangered Southern Bent-wing Bat (Miniopterus orianae bassanii) At least 58 species of birds have been found dead but approximately one-quarter of the birds found dead were unable to be identified to species level so this number may be an underestimate The most commonly recorded bird species in the mortality records were the Australian Magpie (Cracticus tibicen) (20) and the Wedge-tailed Eagle (Aquila audax) (10) Eight bird species listed as species of interest have been recorded as found dead at Victorian wind farms For six of these species (Black Falcon Falco subniger Fairy Prion Pachyptila turtur Fork-tailed Swift Apus pacificus Little Button-quail Turnix velox Spotted Harrier Circus assimilis and White-bellied Sea-Eagle Haliaeetus leucogaster) only a single individual has been found to date The remaining two species of interest which are listed under the provisions of the Commonwealth Environment Protection and Biodiversity Conservation Act 1999 (EPBC Act) for migratory species the Short-tailed Shearwater (Ardenna tenuirostris) and the Vulnerable White-throated Needletail (Hirundapus caudacutus) have been found dead nine and five times respectively These numbers represent just a subset of the birds and bats that will have been killed at wind farms because many individuals will have been lost or scavenged in between monitoring events not detected during monitoring killed at turbines that are not monitored or killed after monitoring had been completed Accordingly further analysis is required to estimate actual annual mortality rates
Analysis of annual mortality rates Raw data was requested from the operators of six wind farms thought to potentially have sufficient data suitable for analysis A full list of the types of data needed was provided to the operators This list highlights the level of data required for comprehensive estimates of annual mortality rates Our assessment of the data that was available to us at the time of our analysis was that only two wind farms had sufficient data for rigorous analysis but that some of the data from three other wind farms could be included in the overall assessment of the searcher efficiency trials and the carcass persistence trials In general birds especially large or medium-sized birds were more likely to be found than bats Purpose-trained dogs were more effective at finding bats than human searchers however humans appear to have been marginally better at finding birds (although as the searcher trials were not truly blind trials there is some doubt regarding the accuracy of the human efficiency rates in particular) For both bats and birds there was a large amount of uncertainty in the mortality estimates as revealed by the large range in the 95 credible bounds The carcass persistence trials showed that birds remained on site and hence available to be found for much longer than bats (estimates of 33 vs 8 days) although again there was a high degree of uncertainty in the estimates Site-specific searcher efficiency estimates and carcass persistence rates were incorporated into the model of annual mortality rates for the two wind farms with sufficient data enabling an estimate of the number of individuals killed per year and the range of plausible values of this estimate The White-striped Freetail Bat had the highest annual mortality rate of any native species of bird or bat at both wind farms with estimates of 397 individuals killed per year (range 211ndash634) at one wind farm and 378 individuals killed per
Investigation of post-construction mortality monitoring at Victorian wind farms 3
year (range 168ndash672) at the other One Southern Bent-wing Bat was found dead at one of these two wind farms during mortality monitoring with the mortality model estimating an annual mortality rate of 14 individuals (range 0ndash70) at that wind farm Mortality estimates for the two bird species of interest found dead at one of the wind farms also had high levels of uncertainty
Comparisons of our estimates of mortality rates with those presented by the wind farms We compared our estimates of mortality rates for bats small birds medium-sized birds and large birds at the two wind farms where we undertook detailed analysis with those provided by the wind farm operators While some of the provided estimates were fairly similar to ours our analysis suggested that the wind farm operators had underestimated the uncertainty in the figures our confidence intervals were much larger In some cases the operatorsrsquo estimates differed significantly from ours but we were not able to explain these differences since the analyses were based on the same raw data Many of the other wind farms also undertook annual mortality estimates however based on the data made available to us we considered that it was insufficient to determine valid annual mortality estimates
Simulations to investigate the likelihood of detecting mortalities of different size classes of birds and bats These simulations indicated the proportion of turbines that would need to be searched each month to have confidence that if a certain number of individuals of particular size classes of birds or bats were killed at least one of them would be detected These simulations suggested that for most size classes a higher level of sampling than typically occurs at present would be needed in order to have confidence in the findings
Population and cumulative impacts Obtaining accurate estimates of annual mortality rates is just the first step in assessing whether wind farms are impacting the various species of birds and bats The next step is determining whether the mortality rates are having a negative impact on the Victorian population of the relevant species The third step is determining whether there is a cumulative impact on the relevant populations as a result of mortalities occurring at multiple wind farms These latter two issues are very difficult to resolve A range of modelling approaches (such as Population Viability Analysis Integrated Population Modelling and Potential Biological Removal Modelling) each with their advantages and disadvantages can be informative however for many species the required basic demographic data is lacking which would necessitate the use of more assumptions and hence reduce confidence in the findings For some key species the collection of additional demographic data is likely to be required Planning regulators have increasingly called for consideration of cumulative impacts from multiple wind farms however methods of assessing cumulative impacts are yet to be developed There are a number of challenges that need to be overcome before a sound assessment of the cumulative impacts of wind farms in Victoria can be made These include (i) the need for reduced uncertainties in the mortality estimates from individual wind farms (ii) the need for all assessments to be undertaken using an agreed set of standards (iii) the need for mortality estimates to be undertaken over the entire lifetime of a wind farm (iv) the need for greater understanding of the impact of other anthropogenic causes of declines in populations and (v) the need for the effects of all existing wind farms to be available before the likely effects of a new one can be predicted which requires a centralised coordinated repository for all relevant information
Conclusions and implications
Conclusions Examination and analysis of existing post-construction mortality monitoring data from Victorian wind farms found that monitoring undertaken at many wind farms was not designed or undertaken in a manner that would enable valid estimation of total mortalities The data available to us was deemed to be sufficient to enable statistical analysis to be validly applied in the estimation of total mortalities at only two of the 15 wind farms with mortality monitoring Even for those two wind farms the estimates had very large credible intervals due to factors that can introduce uncertainty even in well-designed monitoring programs especially in relation to the likelihood of detection of carcasses The capacity to detect carcasses is influenced by the frequency of searches the proportion of the turbines searched and how the searches are undertaken The likelihood of finding carcasses also varies according to the body size of birds and bats (it is greater for large birds than for small birds and bats) and it varies depending on whether dogs or humans undertake the searches There was marked variation in searcher efficiency and carcass persistence rates between wind farms indicating that trials need to be carried out at each wind farm and that findings cannot be transferred from one wind farm to another
Future options for assessing the impact of wind farms on birds and bats It is apparent from our analysis of the available data that it is currently very difficult to obtain accurate estimates of the total number of
4 Investigation of post-construction mortality monitoring at Victorian wind farms
mortalities caused by collisions with wind turbines If improvements are sought changes to the existing monitoring approach are required We outline seven potential options and list their advantages and disadvantages The options include abandoning the current practice of post-construction mortality monitoring at individual wind farms altogether continuing the existing approach but increasing efforts to ensure it is undertaken adequately and comprehensively either with greater guidance from the Department of Environment Land Water and Planning (DELWP) or being undertaken by DELWP just focus mortality monitoring on key species of concern replacing the current approach with a more comprehensive assessment aimed at addressing key unknowns at a selected sample of wind farms or implementing a centrally designed landscape approach to assessing population trends and all causes of mortality for each of the species of concern
Key knowledge gaps While our knowledge of the risk to birds and bats of collisions at wind farms has improved there remains much to be learnt before we have a full understanding of the impacts of wind turbines The gaps in knowledge fall into three categories (i) the need for a more comprehensive understanding of the rate at which species especially key species of concern (Lumsden et al 2019) are being killed by collisions with wind turbines (ii) the need for greater understanding of why particular species are being killed and what the key risk factors are and (iii) the need for a greater understanding of the impact of the annual mortalities on the viability of the populations of species of concern factoring in cumulative impacts as well as population-level impacts Filling these knowledge gaps would enable the impacts from wind farms to be put into context with other threats to the species and provide a better indication of whether wind farms are putting greater stress on threatened species and increasing their risk of extinction
Investigation of post-construction mortality monitoring at Victorian wind farms 5
1 Introduction
11 Context The Victorian Government is committed to growing the renewable energy sector and has set targets of 25 renewable energy by 2020 and 40 by 2025 Increased use of wind energy is a significant component of this commitment The assessment of potential impacts on birds and bats is now a routine consideration in commercial-scale wind energy projects in Victoria due to the possibility of in-flight collisions with wind turbines or associated infrastructure eg transmission lines High levels of mortalities have been recorded at some international wind farms (Frick et al 2017 Hayes 2013 Lehnert et al 2014) but the reported mortality rates are highly variable and there remains uncertainty about the impact of Victorian wind farms on bird and bat populations
The Victorian Government has published Policy and Planning Guidelines for Development of Wind Energy Facilities in Victoria These guidelines have been updated a number of times since their first issue in 2003 The most recent version was issued in November 2017 (DELWP 2017) The guidelines include an example set of permit conditions including conditions for the management of effects on birds and bats (Appendix 1) The permit conditions specify that the development and regulatory approval of a Bat and Avifauna Management Plan (BAM Plan) is required for each wind farm Previous iterations of the guidelines have contained example permit conditions that have differed somewhat from the 2017 version so the operating wind farms in Victoria have been subject to a variety of permit conditions Nonetheless approval of the majority of wind energy facilities in Victoria has routinely been subject to conditions that include requirements to monitor and report mortalities of birds and bats due to collisions with turbines As a consequence monitoring of collision mortalities has been carried out at most wind farms in Victoria but the details of monitoring programs have varied considerably over time and between wind farms with differences in the objectives design intensity frequency and duration of monitoring regimes
Collision mortality monitoring documents the numbers of bird and bat mortalities that are detected To estimate the total number of mortalities for a wind farm correction factors are developed to account for the frequency of monitoring proportion of turbines monitored site-specific detection factors individual searcher efficiency and the duration carcasses may persist in the environment (which is affected by scavenging and decay rates) Where the number of carcasses detected is small (as is often the case) derived estimates necessarily have very large confidence intervals
Despite the fact that monitoring has now been carried out at multiple wind farms in Victoria for a number of years and derived estimates of mortalities have been attempted at many of these wind farms it remains unclear whether turbine collisions are having a significant impact on fauna populations In addition while it is apparent that multiple wind energy facilities may have cumulative effects on populations and regulatory consent processes have increasingly recognised the potential for cumulative effects to occur this aspect has not yet been addressed
Therefore it is timely to conduct a review of the post-construction mortality monitoring undertaken to date to evaluate what can be drawn from this data and to outline options for future improvements
It is important that monitoring of fauna collisions at a wind farm is undertaken to meet clearly defined objectives The overarching purpose of monitoring fauna collisions is to determine whether the mortalities that occur are sufficient to result in a negative impact on the functioning of the Victorian population of any species of conservation concern either as a result of the total number of mortalities occurring at the particular wind farm alone or in combination with other wind farms
12 Report objectives and scope
This report has been prepared in order to evaluate the utility and effectiveness of collision monitoring at individual wind farms with respect to the requirement to monitor and report mortalities of birds and bats resulting from collisions with turbines The primary intention of the report is to highlight key learnings with a view to improving the capacity for investigations at wind farms to achieve or contribute to better
6 Investigation of post-construction mortality monitoring at Victorian wind farms
understanding of the effects of turbine collisions on important wildlife populations It also provides a discussion of population-level effects and of cumulative impacts outlining issues and requirements for achieving effective assessment of such effects
This report concentrates on the impact of the collisions of birds and bats with wind turbines There are a number of other potential effects of wind energy facilities on wildlife These include habitat loss disturbance due to the construction and subsequent operation of a wind farm (associated with turbines vehicles people etc) collisions with overhead powerlines and avoidance of the site because of the presence of turbines However a number of these effects are common to other types of development approvals (eg for urban development or other infrastructure) and most of these effects are not quantifiable in the way that collision mortalities are In addition permit conditions have placed particular emphasis on bird and bat mortality due to turbine collisions It is thus important to review this specific effect of wind energy
Consideration of turbine collisions in Victoria is focused on species of conservation concern The criteria for determining the relevant species are detailed in Lumsden et al (2019) Permit conditions and BAM Plans for many wind farms in Victoria have simply required monitoring and total mortality estimation for all bird and bat species Although many species recorded during the monitoring are thus not of conservation concern the information and learnings obtained from monitoring all species has provided a dataset that has been more useful for analyses of techniques and methods than would have been obtained by monitoring just selected species
Death of microbats from traumatic injury to the respiratory tract (barotrauma) was first described by Baerwald et al (2008) It is presumed to be associated with rapid changes in air pressure close to rotating turbine blades It has since been questioned as a real effect due to difficulties with accurate diagnosis from retrieved carcasses (Rollins et al 2012) Barotrauma is not known to have been diagnosed as a cause of death in bats at Victorian wind farms but for the purposes of this review all bat carcasses detected during monitoring of wind farms were treated as mortalities due to interactions with turbines
As noted by Masden et al (2010) it is useful to distinguish the terms lsquoeffectrsquo and lsquoimpactrsquo ldquoAn impact is the ultimate change due to an effect with the effect being the proximate response of an individual to an actionrdquo This distinction is of particular relevance in the present context where a turbine or a wind farm may have an effect on individual bats or birds but the focus of the impact assessment is on changes that may impact the species population
The specific objectives of this review are
to examine the existing post-construction mortality monitoring data to evaluate whether this data is adequate to estimate annual mortalities of birds and bats at wind farms and to assess the effectiveness of the BAM Plan monitoring designs in meeting the objectives outlined in the plans
to generate a list of all species known to have been killed by collisions with wind turbines
to discuss options for assessing cumulative and population-level impacts of multiple wind farms across the landscape
to develop options for future post-construction mortality monitoring for wind farms and discuss their advantages and disadvantages and
to identify key knowledge gaps that if filled would enable greater confidence in annual mortality estimates and cumulative and population-level impacts
13 Overview of approach In essence there are three potential steps required to obtain an understanding of the impact of mortalities on a population of concern
1 The first step is to accurately estimate total turbine-caused mortalities at a wind farm over a specific period determined on the basis of carcasses detected during a monitoring program incorporating the efficiency of the searches (Huso et al 2017)
Investigation of post-construction mortality monitoring at Victorian wind farms 7
2 The second step is to determine whether the mortality rates occurring at the wind farm might have a negative impact on the Victorian population of relevant species
3 The third step is to determine whether there is a cumulative impact on the relevant population as a result of mortalities occurring at multiple wind farms
To date monitoring at most wind farms in Victoria has attempted the first step only Steps 2 and 3 are not likely to be the responsibility of any individual wind farm operator but the objective of monitoring will only be met if they are addressed A consideration of the three steps is set out in this report
This report starts with a brief description of the processes used to monitor collisions and to apply the results to estimate total collision mortalities for a wind farm Our investigation of the data that has been collected to date from operating wind farms in Victoria is described A summary of the numbers of each bird and bat species reported dead at Victorian wind farms during post-construction mortality monitoring programs is provided including the numbers of threatened or migratory species mortalities recorded Analysis of the data used a hierarchical approach in which an initial assessment determined whether based on the data extracted from individual wind farm reports there was likely to be sufficient suitable data for subsequent statistical analyses The raw data was then requested from those wind farms The data from the wind farms that were found to have sufficient data were then analysed to estimate total mortalities These estimates were then compared with the annual mortality estimates provided by the wind energy operators and differences in the analytical approach taken or the assumptions made were considered
The primary purpose of the analyses was to obtain key learnings to inform the design of future monitoring and estimates of total mortalities at wind farms To that end a series of simulation exercises were undertaken to determine how incremental increases in monitoring effort particularly in the proportion of turbines searched might improve capacity to detect mortalities and reduce uncertainty in mortality estimation
The report also considers population-level and cumulative impacts on species of concern particularly to review what may be required to achieve such broader assessments It then outlines future potential options for assessing the impact of wind farms on birds and bats It concludes with a summary of what has been learnt to date and of the remaining key knowledge gaps
8 Investigation of post-construction mortality monitoring at Victorian wind farms
2 Analyses of data collected during post-construction
mortality monitoring at Victorian wind farms
21 Overview of methods used to estimate total mortalities for individual wind farms
The objective of investigating turbine mortalities must be explicit because it influences the design of the monitoring regimes and subsequent analyses of the results It can be reiterated as follows
The purpose of monitoring fauna collisions is to determine whether the mortalities that occur are sufficient to result in a negative impact on the functioning of the Victorian population of any species of conservation concern either as a result of the total number of mortalities occurring at the particular wind farm alone or in combination with other wind farms
Methods for detecting collision mortalities and for using the results of such monitoring to estimate total numbers of collisions have been developed and applied internationally A recent review of monitoring program designs and processes is provided in Huso et al (2017) and the concepts described there form the basis of techniques used for this purpose in Victoria
Since it is not feasible to detect every individual that collides with a turbine ndash or to be certain of having done so ndash any monitoring regime will necessarily be a sampling exercise Hence the objective requires that a monitoring regime must be designed in such a way that it has capacity both to detect the highest possible proportion of the mortalities of species of concern and to facilitate sound estimation of the total number of such mortalities that are occurring
There are three fundamental issues related to estimation of the number of collision mortalities that may occur at a wind farm It is important to recognise the potential influences of all three
1 A monitoring program must be designed for the purpose of estimating total numbers of mortalities A program that does not have inherent capacity to do so is of no value
2 A well-designed and appropriate program of monitoring will necessarily be a sampling exercise in that it is not feasible to detect every carcass Imperfect detection is due to a variety of factors and can result in an uncertain proportion of mortalities actually being detected Such factors include
searching a subset of the turbines rather than all of them
searching only a prescribed area under turbines with the potential for some animals to be flung outside the search area or to be injured and die later off site
carcass decay and loss due to scavengers or wind resulting in the need to do carcass persistence trials
the length of time between monitoring sessions resulting in some carcasses being lost before the next sampling session and
imperfect searcher detection resulting in not all carcasses that are present being found necessitating searcher efficiency trials
3 A further factor is the uncertainty associated with small numbers of relatively infrequent events Because it is not feasible to be certain of detecting every carcass the uncertainty around estimation of the total mortalities increases as the number of detections decreases Thus where a monitoring program finds no carcasses of a rare species this cannot be interpreted as demonstrating that no collisions have occurred
As a result of the limitations associated with issues 2 and 3 final estimates of total numbers of mortalities are usually imprecise and generally have large associated confidence intervals even when a study has been based on a sound design
Investigation of post-construction mortality monitoring at Victorian wind farms 9
Methods to account for the variables in issue 2 are essential components of monitoring studies They include trials to ascertain rates of carcass persistence and searcher detection rates and extrapolations to account for monitoring interval number of turbines searched and search area These methods are necessary and appropriate but must also be properly designed to achieve their intended purposes Of themselves they introduce further variables and uncertainties
22 Variability in methods used during post-construction mortality monitoring at Victorian wind farms
In an attempt to document the methods used for post-construction mortality monitoring at the currently operating Victorian wind farms information on sampling approach was collated from annual and final reports from each facility This information was collated in mid-2017
Surveys to detect carcasses resulting from turbine collisions have been undertaken at 15 wind farms Ararat Bald Hills Cape Bridgewater Cape Nelson North and Cape Sir William Grant Cape Nelson South Challicum Hills Chepstowe Hepburn Macarthur Mortons Lane Mt Mercer Oaklands Hill Toora Waubra and Yambuk Two other wind farms that were constructed in the early 2000s were not required to undertake post-construction mortality monitoring at that time So as to not identify the mortality results from any particular wind farm in this report wind farms have been de-identified by using letters (eg Wind Farm A) rather than names
Survey methods varied in numerous aspects across the 15 wind farms including the following
The length of the monitoring program Most post-construction mortality monitoring programs were run over 2 years although some extended to 3 or 35 years For at least one facility the monitoring was deemed insufficient at the end of the 2-year period and a further 2 years of monitoring was required
The proportion and the absolute number of turbines searched The number of turbines varies markedly between wind farms from 140 turbines at one wind farm to 2 at another In total there are 699 turbines across the 17 existing facilities with a mean of 41 turbines per facility For some wind farms it was not always possible to ascertain from the available data the proportion of turbines that were monitored resulting in uncertainty in the sampling effort at those facilities For the facilities where this information was available the proportion of the turbines monitored varied with the size of the facility with some of the smaller facilities monitoring all turbines while at the larger facilities approximately one-third of the turbines were typically monitored
Frequency of monitoring Where monitoring frequency was documented it was typically undertaken monthly with an increase in sampling frequency to twice a month or weekly at some facilities especially during periods of high bat activity
Monitoring undertaken by people or dogs At some facilities the searches have been undertaken by people including both ecological consultants and technicians from the facilities resulting in potential variability in adherence to searching protocols Increasingly trained dogs have been used to undertake the mortality searches but there appears to have been some variability in the specificity of training of the dogs with some dogs having been trained specifically to find bats while others appear to have been more generally trained For some wind farms it was unclear whether dogs or people were used for the monitoring
The area under the turbines searched and the search pattern Some searches extended out to 50 m from the base of the turbine whereas others extended to 100 m (circular search area) Others covered a rectangular area of up to 280 x 280 m in size Trained dogs were permitted to roam over a defined search area because they use olfactory cues to locate carcasses whereas transects were walked when searches were carried out by people Transects were mostly either 6 or 12 m apart The search area was not documented for some facilities
Searcher efficiency trials The thoroughness and documentation of searcher efficiency trials varied markedly between wind farms Despite this data being a critical component of the calculations for annual mortality rates many wind farm facilities did not document how many trials were undertaken what types and size classes of animals were used in the trials or the detection rate for each group In
10 Investigation of post-construction mortality monitoring at Victorian wind farms
contrast some wind farms undertook extensive trials (eg 457 carcasses were used for the searcher efficiency trials at Wind Farm B) As the size of a bird or bat can influence a searcherrsquos ability to locate it the more effective trials used four different categories of carcasses bats small birds medium-sized birds and large birds The wind farms allocated species to size classes broadly corresponding to those outlined in Hull and Muir (2010) It was often difficult for the wind farms to obtain sufficient carcasses to use in the searcher efficiency and carcass persistence trials and surrogates were often used Some of these roughly resembled the target animal ndash eg mice used as a surrogate for bats (although the smell of mice would be different to that of bats) However in other trials the sample did not resemble the target ndash eg chicken breasts ndash and this is likely to have affected the results of the trials significantly A key failing of most if not all trials was that the trials were not truly blind Many of the BAM plans specify that searcher efficiency trials are to be undertaken lsquoblindrsquo ndash ie without the knowledge of the person conducting the search However this appeared not to be the case because often the searcher was told that the trial was occurring with some being informed of the number of carcasses used resulting in the searchers continuing until all carcasses were found Even if not explicitly told of the trial this would have become apparent when chicken breasts or species not expected to be found (eg turkeys used as a surrogate for Brolgas) started to be located during a search In some instances the searchers undertaking the mortality searches were not the same people who undertook the efficiency trial with no information on the efficiency of those undertaking the actual searches When trained dogs were used for searches the dogs themselves would have been blind to whether or not a trial was occurring However it was not explicitly stated whether dog handlers conducted trial searches in an identical manner to routine searches Even if there was no conscious bias there was a potential for bias to be relayed to the dogs unconsciously
Carcass persistence trials We use the term lsquocarcass persistencersquo to indicate the period in which a carcass may remain present and lsquoavailablersquo to be detected Trials of carcass persistence have often been termed lsquoscavenger trialsrsquo but there are multiple potential influences on persistence of carcasses in addition to removal by scavengers including natural decay activities of livestock use of agricultural machinery wind and rain
As for the searcher efficiency trials there was considerable variability between wind farms in the scale and thoroughness of the carcass persistence trials There was variation in the number and type of carcasses used the intervals between carcass checks and how the trials were documented No documentation was provided for some wind farms data was amalgamated for others and some used a single value for all types and size classes of carcasses whereas others indicated the extent of persistence variability between categories Since the length of time the carcasses remain available to be found before disappearing from the site is a critical component in the overall mortality estimates when this information has been collected or reported inadequately the ability to accurately generate mortality estimates is severely limited
23 Numbers of bats and birds found dead during mortality searches at Victorian wind farms
The number of individuals of each species of bat and bird that have been found dead at wind turbines during mortality surveys (or as incidental observations) at wind farms in Victoria has been collated We extracted this information from the annual or final reports [or in some cases from spreadsheets sent to the Department of Environment Land Water and Planning (DELWP)] from the 15 wind farms where mortality monitoring has been undertaken These data span from February 2003 to February 2018 While relatively comprehensive the compiled list is based on the data available to us and it is possible that some data is missing
Although the main concern is for listed threatened or migratory species that are killed due to collisions with wind turbines we have collated the available data for all species for completeness and to enable comparisons between threatened and non-threatened species A science-based approach for determining species that should be considered lsquoof concernrsquo in relation to wind farm developments has recently been published (Lumsden et al 2019) The first step in this process was to define from a policy perspective a list of lsquospecies of interestrsquo from which a list of lsquospecies of concernrsquo could then be derived based on the likelihood and consequences of collisions lsquoSpecies of interestrsquo are considered to be any species of bird or bat on the
Investigation of post-construction mortality monitoring at Victorian wind farms 11
Advisory List of Threatened Vertebrate Fauna in Victoria (DSE 2013) or listed under either the Victorian Flora and Fauna Guarantee Act 1988 (the FFG Act) or the Commonwealth Environment Protection and Biodiversity Conservation Act 1999 (the EPBC Act) or any bird species listed as migratory under the EPBC Act irrespective of whether it is considered threatened or not The relative risk for each species of interest was assessed as the basis for developing the list of lsquospecies of concernrsquo (Lumsden et al 2019) however the list of lsquospecies of concernrsquo was not finalised at the time of preparing this report As a result in this report reference is made to the list of lsquospecies of interestrsquo rather than the list of lsquospecies of concernrsquo
231 Bats
A total of 446 bats were detected during the mortality surveys we had access to which represented 44 of all carcasses found This included at least 13 species of bats 15 individuals could not be identified (Table 1) The majority (67) of recorded bat mortalities were of the White-striped Freetail Bat (Austronomus australis) which typically flies higher above the ground than most other species of Victorian bats This species had the highest documented mortality of any species representing 29 of all recorded killed birds or bats One lsquospecies of interestrsquo the Critically Endangered Southern Bent-wing Bat (Miniopterus orianae bassanii) was recorded as a mortality on eight occasions (based on the available data as at February 2018 Table 1)
Although less than half of the carcasses found were bats when carcass persistence rates and searcher efficiency rates are factored into overall mortality estimates (see section 25) the actual number of bats killed is likely to have been much higher than that of birds potentially an order of magnitude or more higher
12 Investigation of post-construction mortality monitoring at Victorian wind farms
Table 1 The number of bats found dead at Victorian wind farms during post-construction mortality monitoring from 2003 to 2018 Note that the species names provided in the annual reports have been used with comments in the footnote where these are questionable or where the taxonomy has recently changed The lsquospecies of interestrsquo classification is taken from the list of threatened andor migratory species considered as the starting point for defining lsquospecies of concernrsquo for wind farm developments in Victoria (Lumsden et al 2019)
Common name Scientific name Total Species of Interest
Chocolate Wattled Bat Chalinolobus morio 5
East-coast Free-tailed Bata Mormopterus norfolkensis 1
Eastern False Pipistrelle Falsistrellus tasmaniensis 28
Little Red Flying-fox Pteropus scapulatus 1
Gouldrsquos Long-eared Bat Nyctophilus gouldi 1
Gouldrsquos Wattled Bat Chalinolobus gouldii 49
Large Forest Bat Vespadelus darlingtoni 16
Lesser Long-eared Bat Nyctophilus geoffroyi 6
Little Forest Bat Vespadelus vulturnus 9
Southern Bent-wing Bat Miniopterus orianae bassanii 8 Yes
Southern Forest Bat Vespadelus regulus 2
Southern Freetail Bat Mormopterus planicepsb 9
White-striped Freetail Bat Tadarida australisc 296
Bat ndash unidentified 15
Total 446
a This is likely to be a mis-identification as this species has not been recorded in Victoria ndash the animal was probably a Southern Freetail Bat or possibly an Eastern Freetail Bat (Ozimops ridei) b now Ozimops planiceps c now Austronomus australis
232 Birds
A total of 565 birds were found dead during mortality monitoring searches or incidentally at Victorian wind farms from 2003 to February 2018 representing 56 of all carcasses (Table 2) The 565 includes at least 58 species of birds (potentially more depending on some identifications) Approximately a quarter of bird carcasses were unable to be identified to species level The list in Table 2 is a slightly revised version of the collation of the lists in the annual reports due to combining records for a single species where it had been listed twice under different names otherwise it remains as reported Many individuals were reported using generic terms eg lsquocockatoocorellarsquo or lsquobird of preyrsquo rather than being identified to species For some individuals a descriptive term was used eg lsquogreen grass parrotrsquo
The most commonly recorded bird species found dead was the Australian Magpie (Cracticus tibicen) (20) followed by the Wedge-tailed Eagle (Aquila audax) (10)
Eight birds listed as lsquospecies of interestrsquo have been recorded dead at Victorian wind farms For six of these species (Black Falcon Falco subniger Fairy Prion Pachyptila turtur Fork-tailed Swift Apus pacificus Little Button-quail Turnix velox Spotted Harrier Circus assimilis and White-bellied Sea-Eagle Haliaeetus leucogaster) only a single individual has been found to date The remaining two species of interest which are listed under the provisions of the EPBC Act for migratory species the Short-tailed Shearwater (Ardenna tenuirostris) and the Vulnerable White-throated Needletail (Hirundapus caudacutus) have been found dead nine and five times respectively (Table 2)
Investigation of post-construction mortality monitoring at Victorian wind farms 13
Table 2 The number of birds found dead at Victorian wind farms during post-construction mortality monitoring from 2003 to 2018 The lsquospecies of interestrsquo classification is taken from the list of threatened andor migratory species considered as the starting point for defining lsquospecies of concernrsquo for wind farm developments in Victoria (Lumsden et al 2019)
Common name Scientific name Total Species of interest
Identified to species level
Australasian Pipit Anthus novaeseelandiae 2
Australian Hobby Falco longipennis 1
Australian Magpie Cracticus tibicen 115
Australian Raven Corvus coronoides 1
Australian White Ibis Threskiornis molucca 1
Barn Owl Tyto alba 1
Black-shouldered Kite Elanus axillaris 3
Black Falcon Falco subniger 1 Yes
Black Swan Cygnus atratus 1
Brown Falcon Falco berigora 48
Brown Goshawk Accipiter fasciatus 3
Brown Songlark Megalurus cruralis 1
Buff-banded Rail Gallirallus philippensis 1
Collared Sparrowhawk Accipiter cirrhocephalus 1
Common Bronzewing Pigeon Phaps chalcoptera 1
Common Starlinga Sturnus vulgaris 8
Crested Pigeon Ocyphaps lophotes 1
Crimson Rosella Platycercus elegans 1
Dusky Woodswallow Artamus cyanopterus 1
Eurasian Skylarka Alauda arvensis 42
European Goldfincha Carduelis carduelis 6
Fairy Prion Pachyptila turtur 1 Yes
Fluttering Shearwater Puffinus gavia 1
Fork-tailed Swift Apus pacificus 1 Yes
Galah Eolophus roseicapilla 3
Grey Teal Anas gracilis 1
Guinea Fowla Numida meleagris 2
Hoary-headed Grebe Poliocephalus poliocephalus 1
Horsfieldrsquos Bronze-Cuckoo Chrysococcyx basalis 1
House Sparrowa Passer domesticus 5
Little Button-quail Turnix velox 1 Yes
Little Eagle Hieraaetus morphnoides 1
Little Raven Corvus mellori 3
Magpie-lark Grallina cyanoleuca 13
Nankeen Kestrel Falco cenchroides 54
New Holland Honeyeater Phylidonyris novaehollandiae 1
Noisy Miner Manorina melanocephala 1
Pacific Black Duck Anas superciliosa 3
Peregrine Falcon Falco peregrinus 2
Purple Swamphen Porphyrio melanotus 1
Red-rumped Parrot Psephotus haematonotus 3
Sacred Kingfisher Todiramphus sanctus 1
Short-tailed Shearwater Ardenna tenuirostris 9 Yes
14 Investigation of post-construction mortality monitoring at Victorian wind farms
Common name Scientific name Total Species of interest
Silver Gull Chroicocephalus novaehollandiae
2
Silvereye Zosterops lateralis 1
Southern Fulmar Fulmarus glacialoides 1
Spotted Harrier Circus assimilis 1 Yes
Straw-necked Ibis Threskiornis spinicollis 3
Stubble Quail Coturnix pectoralis 1
Sulphur-crested Cockatoo Cacatua galerita 2
Swamp Harrier Circus approximans 6
Wedge-tailed Eagle Aquila audax 58
Welcome Swallow Hirundo neoxena 4
Whistling Kite Haliastur sphenurus 5
White-bellied Sea-eagle Haliaeetus leucogaster 1 Yes
White-throated Needletail Hirundapus caudacutus 5 Yes
Identified to a category of bird
Bird of prey 2
Corellacockatoo 7
Duck sp 2
Finch sp 1
Green grass parrot 2
Gull sp 1
Ibis 1
Ravencrow 41
Unknown bird 69
Total 565
a introduced species
Note that this data is based on the mortality monitoring which will have detected only a subset of the birds and bats that were killed at wind turbines because many individuals would have been lost or scavenged in between monitoring events In addition not all individuals present during the monitoring searches may have been detected all turbines are not usually searched and in some cases the areas searched under turbines were smaller than the potential fall zone Therefore the number of carcasses found is an underestimate of the actual number of individuals killed In addition if some species are more or less likely to be scavenged or found the relative proportions of each species detected may be misrepresented These figures also do not factor in the likelihood of species using the types of habitats within the vicinity of the existing wind farms Nevertheless these figures give at least a baseline list of the species known to have been killed In order to estimate actual mortality rates further detailed analysis is required
24 Suitability of the data for statistical analyses As outlined in section 22 there was considerable variability in the quality and quantity of the post-construction mortality monitoring data from the 15 wind farms for which monitoring data was available Based on our assessment it was considered that only six of these potentially had sufficient suitable data to validly attempt more detailed statistical analysis to estimate annual mortality rates Accordingly the raw data from all searches and trials was requested from these six wind farms So that the individual wind farms from which this data was obtained are not identifiable they are referred to as Wind Farms A B C D E and F in this report (Table 3)
Investigation of post-construction mortality monitoring at Victorian wind farms 15
The following data was requested
1 Turbine details ndash details of the location size height and proximity to potential wildlife habitat for each turbine within a wind farm development
2 Searcher efficiency trials ndash details of the methods and results of each searcher efficiency trial undertaken with different carcass types including if the trials were blind if dogs were used the configuration of the search area the area and pattern over which the carcasses were distributed and the vegetation cover at the time of the trial
3 Carcass persistence trials ndash details of the methods used and the results of trials including the types of carcasses vegetation cover number of checks weather in intervening period condition of carcasses when found and any pest control at the time
4 Mortality surveys ndash details of methods used and findings which turbines were searched if dogs were used weather conditions search area vegetation cover percentage of time each turbine was operational prior to the search condition of carcass and distance carcass was from the base of the turbine
5 Incidental finds of carcasses outside of the mortality surveys including turbine number date species condition vegetation cover distance from the base of the turbine and if the carcass was removed or left in place to be included in the mortality surveys
This list indicates the level of detail required to comprehensively and rigorously estimate annual mortality rates and is outlined in more detail in Appendix 2
All six wind farms provided their raw data for this analysis in November 2017 The raw data relating to mortality monitoring and searcher efficiency and carcass persistence rates varied in quality and quantity The following issues were identified with respect to the data collection process
The searcher efficiency trials were never blind
There were often insufficient searcher efficiency andor carcass persistence trials
Some estimates were provided for the searcher efficiency or carcass persistence rates rather than the raw data on which these estimates were based
The location of the carcasses was not consistently recorded in either the searcher efficiency trials or the mortality surveys
The distance from a turbine to where a carcass was detected was not consistently recorded
Searchers were not always specific in their naming of species detected
Surveys where no mortalities were observed were not always recorded
Potential variation in detection and carcass persistence rates were not explored thoroughly For instance investigation of differences in rates due to seasonality or substrate where the carcass was found was rarely attempted
Unsuitable carcass surrogates were used in some trials
16 Investigation of post-construction mortality monitoring at Victorian wind farms
Table 3 Total number of reported turbine surveys and numbers of individual carcasses used in searcher efficiency trials and carcass persistence trials at the six wind farms where raw data was requested for further analysis based on data received in November 2017 The raw data for the searcher efficiency and carcass persistence trials were not supplied for Wind Farm D The data from two wind farms (Wind Farms E and F) are combined into a single category because much of the data that was supplied had been combined
Wind farm Total turbine surveys
Total number of carcasses in searcher efficiency trials
Total number of carcasses in carcass persistence trials
Wind Farm A 799 136 79
Wind Farm B 1385 560 276
Wind Farm C 360 40 40
Wind Farm D 148 Not supplied Not supplied
Wind Farms E amp F 1504 74 46
25 Methods used to analyse mortality rates The raw data provided from the six wind farms was used to undertake statistical analysis to estimate searcher efficiency and carcass persistence rates and where possible annual mortality rates The approach used for these analyses is outlined below
251 Searcher efficiency trials
The raw data from the observer efficiency trials from five of the six wind farms were incorporated into a single analysis using a binomial model in a Bayesian framework (the Wind Farm D data could not be used as the raw data was not provided) The fixed effects in the model were the interaction of the type of carcass deployed (bat or bird) and the search method used (dog with handler or human only) Differences between searchers (and their ability to detect each carcass type) and wind farms were treated as random effects Birds of all sizes were combined for part of this analysis because not all wind farms distinguished size classes
Model estimates were constructed in the statistical program R (R Core Team 2018) and STAN using the package outlined in Buumlrkner (2017) Naiumlve (uninformative) priors were used for each parameter Four separate Monte Carlo Markov chains were run until they converged Once they had converged they were used to estimate the posterior distribution of each parameter The posterior distribution is an estimate of the distribution of the parameters of interest A parameter was considered to have strong evidence if its 95 credible interval did not include zero A credible interval in Bayesian analysis is similar to a confidence interval in frequentist statistics In Bayesian statistics there is a 95 probability that the true value of the parameter is within the 95 credible interval In frequentist statistics there is a 95 probability that when a 95 confidence interval is calculated for data of this sort the true value of the parameter falls within it
252 Carcass persistence trials
Carcass persistence rates from all locations were analysed as a group using a survival analysis model in a Bayesian framework The Weibull hazard rate used the type of carcass (bat or bird) as a fixed effect and the turbine nested within a wind farm as a random effect The survival analysis model allows for some right-censored data Right-censored data is where observations stopped before the event (in this case scavenging) occurred (Miller et al 1981) Model estimates were constructed in the same way as for the searcher efficiency trials
253 Mortality rate
The mortality rate (individuals killed per turbine per year) needs to take into account errors caused by the observation process A common formulation for adjusting the observed mortality rate is the following
120582119909
119901 119878 1
Investigation of post-construction mortality monitoring at Victorian wind farms 17
where 120582 is the adjusted mortality per turbine per year 119909 is the unadjusted mean number of mortalities per turbine per year 119901 is the probability of detecting the carcass and 119878 is the proportion of carcasses remaining since the last survey (Smallwood 2007) The probability of detecting a carcass may vary between species between searcher type (human or dog) and between individual searchers The searcher efficiency trials can be used to estimate the detection rates 119901 The probability that a carcass remains to be observed may vary between species and between turbines The carcass persistence trials can be used to estimate the proportion of carcasses that will remain 119878 One issue with this formulation is that if a species is killed but not detected then it is assumed that that species has zero mortality Bayesian models allow for the possibility that a species is killed but not detected in the surveys The details of how this possibility was included in the modelling are provided in Appendix 3
The model parameters were estimated using the program JAGS using the package ldquoR2jagsrdquo (Su and Yajima 2015) through the statistical program R (R Core Team 2018) Naiumlve priors were used for each parameter (ie an unconditional probability was assigned before any relevant evidence was taken into account) Four chains were run until they converged A parameter was considered to have strong evidence if its 95 credible interval did not include zero
The mortality rate model involves a series of assumptions These include
the probability of detecting a carcass of the same class (bat small bird medium-sized bird or large bird) is independent of species
the probability of detecting a carcass is independent of time and substrate
the probability of a carcass of the same class (bat small bird medium-sized bird or large bird) being scavenged or otherwise disappearing is independent of species
the probability of a carcass being scavenged or otherwise disappearing is independent of time
the distribution of carcasses under turbines is independent (ie carcasses are evenly spread over the area underneath the turbine) and
the area searched by the searcher is representative of the area where bats and birds would fall after colliding with the turbine
The formulation in equation 1 can be extended to include seasonal differences in mortality and carcass persistence rates decomposition rates background mortality rates crippling bias and search radius bias Decomposition rates refer to the numbers of individuals that decompose before they are able to be observed Background mortality refers to the underlying mortality rate in the area that is not related to wind turbines Crippling bias refers to individuals that are injured by the turbine but can move outside the search area before dying Search radius bias refers to individuals that are thrown by the turbine and land outside the search area However due to the way the data has been collected inclusion of these errors is not possible for many if any of the wind farms and therefore it was not able to be accounted for in the estimated mortality rates
26 Estimated mortality rates
261 Searcher efficiency trial results
There were searcher efficiency trial data from four of the wind farms where the raw data was obtained Wind Farm A Wind Farm B Wind Farm C and the combined Wind Farms E and F This combined data revealed differences in detection rates between bats and birds and differences between human observers and dogs The Bayesian detection model showed evidence that in general birds were more likely to be found than bats and that birds were found at a lower rate than expected when dogs were used (Table 4 Figure 1 and Appendix 4 Table A41) There was however a large amount of uncertainty in these figures as evidenced by the large range of values between the upper and lower 95 credibility bounds For example for human surveyors locating bats the median probability of detecting a bat was 57 however the range of plausible values was between 12 and 92 (Table 4) Additionally there was a reasonable amount of variation in the data from one searcher to another and from one wind farm to another The estimated standard deviation of
18 Investigation of post-construction mortality monitoring at Victorian wind farms
the random effects was 074 and 093 respectively (on the logit scale) which is large considering that the estimate for the largest fixed effect (where the observation trial was for a bird) was only 203 (in logit scale) This result indicated that there was a large difference between searchers and between locations hence extrapolating from particular searchers or specific locations to other searchers or locations without undertaking site-specific trials would not be reliable
Figure 1 Estimated detection probabilities (shown as percentages) for surveys undertaken using humans or dogs to locate bats and birds during the searcher efficiency trials (using the combined data from the four wind farms where the raw data was available)
Table 4 The probabilities (shown as percentages) of detecting a bat or a bird when present using either humans or dogs (using the combined data from the four wind farms where the raw data was available) Lower and upper bounds refer to the bounds of the 95 credible intervals for each estimate and indicate the precision of the estimate giving a range of plausible values
Species type Human or dog Detection probability Lower bound Upper bound
Bat Human 574 115 924
Bat Dog 729 184 970
Bird Human 911 493 990
Bird Dog 820 290 983
Wind Farm D was not included in this analysis because the raw data from the observer efficiency trials was not provided Instead a single figure for the average detection rate for birds and bats combined was provided which was 92 This estimate was similar to our estimated detection rate for birds using human searchers however it was different from our estimates for all the other combinations (Table 4)
Four different people and four different dogs were used in the searcher efficiency trials and the estimated detection rates varied between individual surveyors (Figure 2)
Investigation of post-construction mortality monitoring at Victorian wind farms 19
Figure 2 Estimated detection probabilities for four human surveyors and four dog surveyors undertaking searcher efficiency trials for bats and birds One dog was tested only on bats
262 Searcher efficiency trials discussion
The analysis of the searcher efficiency trials highlighted potential differences between human and dog detection rates and between the rates of detection of bats and birds (Table 5) There was strong evidence that human searchers were much better at detecting birds than bats There was less (but still substantial) evidence that dogs were better at detecting birds than they were at detecting bats (evidence ratio = 02) There was some evidence that birds were detected at a higher rate by humans than by dogs (evidence ratio gt 100) There was some evidence that bats were detected at a higher rate by dogs than by human searchers (evidence ratio = 13) This suggests that humans detect birds at a higher rate than dogs do whereas dogs detect bats at a higher rate than humans do which may be due to differences between humans and dogs in the use of visual versus olfactory cues
Complicating the matter further is the fact that none of the trials were true blind trials This means that searcher efficiency may have been increased (ie positively biased) because the searcher knew they were being assessed It is also likely that the bias was larger for human searchers than for dog searchers analogous to the differences between non-blind trials (human searcher knows) blind trials (handler knows so the dog could read cues) and double-blind trials (no-one knows) Comparing these results with those of a randomised blind trial for detection of bat carcasses in the UK (Mathews et al 2013) supports this contention of greater bias for human searches There the percentage of bat carcasses found by dogs (73) was very similar to the Victorian result (71 Table 5) but only 20 of carcasses were found by humans in the UK blind trial compared with over twice this rate (47) in Victoria where the searchers often knew they were being tested
In summary our analyses do not provide a clear indication of whether dogs or people provide better detection of bird or bat carcasses The relatively small amount of comparable data from Victorian wind farms and the lack of blind trials are likely to be principal reasons for this For the present it is probably best for future search regimes to use whichever is the most effective method for a particular site taking the target species into account
20 Investigation of post-construction mortality monitoring at Victorian wind farms
Table 5 A summary of the results of searcher efficiency trials for detecting bat and bird mortalities due to wind turbines (based on data from four wind farms)
Category HumanDog Carcasses deployed Carcasses found found
Bat Human 118 55 466
Bat Dog 110 78 709
Bat proxy Human 13 8 615
Bird Dog 6 5 833
Small bird Human 147 102 694
Small bird Dog 12 6 500
Medium bird Human 227 216 952
Medium bird Dog 60 49 817
Large bird Human 95 95 1000
Large bird Dog 21 18 857
Overall bird Human 469 413 881
Overall bird Dog 99 78 788
263 Carcass persistence trial results
There were detailed carcass persistence data available from four wind farms Wind Farm A Wind Farm B Wind Farm C and the combined Wind Farms E and F This combined data showed differences in carcass persistence rates between bats and birds The Bayesian survival model showed evidence that in general it took longer for birds to be completely scavenged or otherwise lost than it did for bats (Table 6 Figure 3 and Appendix 4b) Additionally there was some variation between wind farms and between individual wind turbines given that the random effects were non-zero The lsquoshapersquo parameter was less than zero (Appendix 4b) which indicates that the carcass persistence rate changed over time One factor influencing this result may be that fresh carcasses are more likely to be scavenged than older carcasses
Table 6 The estimated time carcasses remained on site before disappearing during carcass persistence trials Lower and upper bounds indicate the bounds of the 95 credible intervals for the estimates
Species type Estimated time remaining on site (days)
Lower bound Upper bound
Bats 79 49 120
Birds 331 209 497
The average time-to-disappearance that we calculated from the combined data from the four wind farms where raw data was available was substantially different to the single point estimate provided by Wind Farm D Wind Farm Drsquos Bat and Avifauna Mortality Monitoring (BAMM) report states that the carcass persistence rate had an average of 6 days with a standard error of 048 days which is considerably lower than the 33 days estimated for birds in our analysis (Table 6) However this estimate is similar to the period until the first evidence of disappearance of birds (estimated at 72 days) Given that we are interested in the probability of not detecting a bird (or bat) because it was scavenged or had otherwise disappeared recording partial disappearance of carcasses is not informative because there are still remains (eg feathers) present and available to be found
Investigation of post-construction mortality monitoring at Victorian wind farms 21
Figure 3 Estimated probabilities of carcass persistence for bats and birds during carcass persistence trials from the four wind farms where raw data was obtained
264 Carcass persistence trials discussion
Our analysis of the data from the carcass persistence trials showed clear differences between the persistence rates of bat and bird carcasses There was very strong evidence that bats were scavenged or otherwise lost at a much higher rate than birds with the average time-to-disappearance being over four times longer for birds This may be a result of there being more inedible parts of a bird eg feathers that could become dislodged and hence remain on the site for a longer time and also be recognisable In addition due to the small size of most bats the whole carcass may be more likely to be consumed leaving no remaining parts to persist in the landscape
265 Mortality rate analysis results
We had planned to run the mortality rate model for each wind farm from which the full raw data was requested (ie Wind Farms A B C D E and F) However once the supplied data was investigated it became clear that the data recorded at most of those locations was insufficient For instance carcass persistence trials at Wind Farm C had used only two small bird carcasses a very low number to make estimations from and only five large bird carcasses none of which were scavenged completely and hence the number of days to removal could not be calculated Therefore the carcass persistence rates could not be estimated for this wind farm without making bespoke assumptions about the farm Wind Farms E and F had a similar problem in their carcass persistence trials (only one large bird was used in the carcass persistence trials and it was not scavenged completely) in addition their searcher efficiency trials used searchers who were not used in the mortality surveys and so this data could not be used As our analysis has shown (sections 261ndash4) there was variation between wind farms in the carcass persistence rates and between wind farms and between searchers in the searcher efficiency rates so applying the rates from one wind farm when analysing the data from another wind farm is not valid Wind Farm D only supplied the estimated searcher efficiency and overall average time-to-disappearance In summary each of Wind Farms C D E or F had issues with their data which meant it was not suitable data to analyse for the mortality model As a result only Wind Farms A and B had data suitable for generating mortality rate estimates
22 Investigation of post-construction mortality monitoring at Victorian wind farms
Wind Farm A
The detection rates obtained from the searcher efficiency trials at Wind Farm A showed relatively large differences between the rates of detection of bats and the three size classes of birds (Table 7) Dogs were used for all trials2 The detection rate for bats was estimated to be 68 [95 credible interval (CI) 41ndash96] The credible interval covers 55 of possible values which indicates a high level of uncertainty Detection rates for small birds were even more uncertain with the estimated rate being 45 (95 CI 9ndash85) with the credible interval covering 76 of possible values The detection rate for medium-sized and large birds was higher (~90) and the credible intervals only covered 30 of the possible values (Table 7) Additionally there was extra uncertainty in the model due to differences between searchers The standard deviation of the difference between searchers was 08 (95 CI 02ndash21) which is not trivial
Table 7 The estimated detection rate obtained from the searcher efficiency trials at Wind Farm A for bats and three size classes of birds Lower and upper bounds refer to the bounds of the 95 credible intervals for the estimate
Size class Naiumlve detection Estimated detection Lower bound Upper bound
Bat 066 068 041 096
Small bird 040 044 009 085
Medium bird 083 086 065 099
Large bird 084 091 069 099
The carcass persistence rates obtained from the data from the trials at Wind Farm A also showed a relatively high level of variability (Table 8) The median time-to-disappearance for bats was estimated to be 49 days (95 CI 23ndash76 days) The median times-to-disappearance for small and medium-sized birds were estimated to be 143 and 136 days respectively However the large bird median time-to-disappearance was 68 days (95 CI from 00 to over 1000) This estimate was based on only two large bird carcasses one of which was scavenged on the first day while the other had not been scavenged by 30 days This resulted in a very unreliable estimate that may not be representative of a larger sample had that been taken The standard deviation of the difference between searchers was 03 (95 CI 0ndash06) which is quite small in comparison to that for other factors like size class The parameter estimates for the searcher efficiency trials and carcass persistence trials for Wind Farm A are provided in Appendix 5 Table A51
Table 8 The estimated carcass persistence rates based on data from trials at Wind Farm A for bats and three size classes of birds Lower and upper bounds refer to the bounds of the 95 credible intervals for the estimate
Size class Median time-to-disappearance
Lower bound Upper bound
Bat 485 227 761
Small bird 1429 680 2423
Medium bird 1360 686 2342
Large bird 680 000 gt100000
The estimated proportion of carcasses that were not scavenged or otherwise lost prior to a mortality survey (averaged over 30 days) at Wind Farm A varied between bats and the three size classes of birds (Table 9) We estimated that at Wind Farm A approximately half of the small and medium-sized birds were not
2 Note at the time of the analysis the data indicated that all monitoring at this wind farm was undertaken using dogs We have since
learnt that some of this monitoring was actually undertaken using human observers This may affect some of the results and interpretation presented here The bat detection rate in particular is likely to have been higher had the data collected by dogs only been used
Investigation of post-construction mortality monitoring at Victorian wind farms 23
scavenged and therefore would have been available to be detected and that only 40 of the large birds would have remained The estimated survival rate for bat carcasses was 23 and the estimated detection rate was 68 This means that at Wind Farm A less than 16 of bat mortalities were estimated to have been found and so the actual number of bat mortalities will be much higher than the relatively limited number of carcasses found
Table 9 The estimated proportion of carcasses that were not scavenged or otherwise lost prior to a survey (averaged over 30 days) at Wind Farm A Lower and upper bounds refer to the bounds of the 95 credible intervals for the estimate
Size class Estimated proportion of carcasses that did not disappear prior to survey
Lower bound Upper bound
Bat 023 014 034
Small bird 051 034 068
Medium bird 050 036 065
Large bird 040 002 090
Incorporating the searcher efficiency and carcass persistence rates into the mortality model for Wind Farm A enabled an estimation of the total number of individuals likely to have been killed These calculations have been undertaken for all species not just those considered lsquoof interestrsquo or lsquoof concernrsquo (for completeness and to enable comparisons between threatened and non-threatened species)
The mortality model showed that White-striped Freetail Bats had the highest mortality rate at 62 individuals per turbine per year (95 CI 33ndash99 Figure 4 and Table 10) The range of the 95 credible interval is large especially in view of the fact that this needs to be multiplied by the number of turbines at the wind farm to obtain the estimate for the overall annual White-striped Freetail Bat mortality at Wind Farm A With 64 turbines at this wind farm this equates to 397 individuals of this species being killed per year with the range of plausible values being between 211 and 634 individuals This is the highest number killed for any species of bird or bat at this wind farm It should be noted that each turbine each year also had an estimated 11 bat mortalities for which a bat carcass was found but the species could not be determined Additionally for a species that was not detected the mortality rate was estimated to be 01 individuals per turbine per year (95 CI 0ndash04)
Figure 4 Estimated mortality rate (individual deaths per turbine per year) for bat species at Wind Farm A Lines indicate the 95 credible intervals
24 Investigation of post-construction mortality monitoring at Victorian wind farms
Table 10 The estimated mortality rate (per turbine per year) at Wind Farm A Lower and upper bounds refer to the bounds of the 95 credible intervals for the estimate
Size class Common name Total observed
Naiumlve estimate
Estimated mortality rate
Lower bound
Upper bound
Bat Chocolate Wattled Bat 1 01 01 00 05
Bat Eastern False Pipistrelle 11 11 16 06 29
Bat Gouldrsquos Wattled Bat 7 07 10 03 21
Bat Large Forest Bat 9 09 13 05 25
Bat Little Forest Bat 5 05 07 01 15
Bat Southern Forest Bat 1 01 01 00 05
Bat Southern Freetail Bat 1 01 01 00 05
Bat White-striped Freetail Bat 43 44 62 33 99
Bat Bat (unknown species) 8 08 11 04 22
Bat Undetected bat species 0 00 00 00 03
Small bird Common Starlinga 2 02 02 00 07
Small bird Eurasian Skylarka 3 03 03 00 10
Small bird European Goldfincha 1 01 01 00 04
Small bird House Sparrowa 3 03 03 00 09
Small bird Brown Songlark 1 01 01 00 04
Small bird Undetected small bird 0 00 00 00 02
Medium bird Australian Magpie 21 22 11 06 18
Medium bird Black-shouldered Kite 1 01 01 00 02
Medium bird Brown Falcon 7 07 04 01 07
Medium bird Brown Goshawk 1 01 01 00 02
Medium bird Corvus sp 5 05 03 01 05
Medium bird Crow 1 01 01 00 02
Medium bird Galah 2 02 01 00 03
Medium bird Nankeen Kestrel 2 02 01 00 03
Medium bird Pacific Black Duck 1 01 01 00 02
Medium bird Raven 6 06 03 01 06
Medium bird Bird (unknown species) 23 24 13 07 20
Medium bird Undetected medium bird 0 00 00 00 01
Large bird Corella sp 1 01 01 00 04
Large bird Wedge-tailed Eagle 1 01 01 00 04
Large bird Undetected large bird 0 00 00 00 02
a introduced species
The mortality model shows that two introduced bird species the Eurasian Skylark and the House Sparrow have the highest mortality rates for small birds at 03 individuals per turbine per year each (95 CI 0ndash10 Figure 5 and Table 10) For a small bird species that is not detected the mortality rate is estimated to be zero individuals per turbine per year (95 CI 0ndash02)
Investigation of post-construction mortality monitoring at Victorian wind farms 25
Figure 5 Estimated mortality rates (individuals per turbine per year) for small bird species found at Wind Farm A Lines indicate the 95 credible intervals indicates an introduced species
The mortality model shows that Australian Magpies had the highest medium-sized bird mortality rate at 11 individuals per turbine per year (95 CI 06ndash18 Figure 6 and Table 10) The range of the 95 credible interval is large especially in view of the fact that these figures need to be multiplied by 64 to obtain an estimate for the annual Australian Magpie mortality It should be noted that each turbine each year had an estimated 13 medium bird mortalities for which the species could not be determined even though the carcass was found That is about the same as the number identified as Australian Magpies Additionally for a medium bird species that is not detected the mortality rate is estimated to be zero individuals per turbine per year (95 CI 0ndash02)
The mortality model shows that the two types of large birds found (Wedge-tailed Eagle and Corella species) each have mortality rates at 006 individuals per turbine per year (95 CI 002ndash041 Figure 7 and Table 10) For the Wedge-tailed Eagle this equates to an estimated 39 birds being killed annually with the plausible range between 1 and 26 individuals the large range reflecting the high degree of uncertainty in the large bird carcass persistence rate at this wind farm which was based on just two individuals Additionally for a large bird species that was not detected the mortality rate was estimated to be 003 individuals per turbine per year (95 CI 002ndash017)
26 Investigation of post-construction mortality monitoring at Victorian wind farms
Figure 6 Estimated mortality rates (individuals per turbine per year) for medium-sized bird species found at Wind Farm A Lines indicate the 95 credible intervals
Figure 7 Estimated mortality rates (individuals per turbine per year) for large bird species found at Wind Farm A Lines indicate the 95 credible intervals
Investigation of post-construction mortality monitoring at Victorian wind farms 27
Wind Farm B
The detection rates obtained from the data from the searcher efficiency trials at Wind Farm B showed a relatively high level of variability between bats and the three size classes of birds (Table 11) Human searchers were used for all trials The detection rate for bats was estimated to be 54 (95 CI 28ndash78) The credible interval covers 50 of possible values which indicates a high level of uncertainty Detection rates for small birds were similarly uncertain The estimate of the detection rate was 70 (95 CI 42ndash87) with the credible interval covering 45 of possible values The estimates of the detection rates for medium-sized and large birds was much higher (~100 for each) and the credible intervals covered less than 10 of the possible values (Table 11) There was additional uncertainty in the estimates generated by the model due to differences between searchers The standard deviation of the difference between searchers was 1 (95 CI 03ndash22) which is not trivial For instance if you had a searcher who was good at detecting bats (better than say 75 of searchers) the estimated detection rate would go from 54 (for the average searcher) to 70 A similar searcher would increase the estimated detection rate for small birds from 70 to 82
Table 11 The detection rates estimated from data from searcher efficiency trials at Wind Farm B for bats and for three size classes of birds Lower and upper bounds refer to the bounds of the 95 credible intervals for the estimate
Size class Naiumlve detection Estimated detection Lower bound Upper bound
Bat 045 054 028 078
Small bird 069 070 042 087
Medium bird 096 097 091 099
Large bird 100 099 097 099
The carcass persistence rate estimates based on data from the trials at Wind Farm B also showed a relatively high level of variability (Table 12) The median time-to-disappearance for bats was estimated to be 3 days (95 CI 15ndash47 days) the median time-to-disappearance for small birds was estimated to be 20 days (95 CI 09ndash32) and the median time-to-disappearance for medium-sized birds was estimated to be 36 days (95 CI 17ndash59) However the large bird median time-to-disappearance was 826 days (95 CI 337ndash2042) This estimate was based on 87 large bird carcasses of which 73 (84) did not disappear during the trial which increases the carcass persistence rate substantially compared with the other size classes The standard deviation of the difference between searchers was 05 (95 CI 03ndash08) which was quite small in comparison with the variability due to other factors such as size class The parameter estimates for the searcher efficiency trials and carcass persistence trials for Wind Farm B are provided in Appendix 5 Table A52
Table 12 The estimated carcass persistence rates estimated from data from trials at Wind Farm B for bats and three size classes of birds Lower and upper bounds refer to the bounds of the 95 credible intervals for the estimate
Size class Median time-to-disappearance
Lower bound Upper bound
Bat 298 145 470
Small bird 195 088 315
Medium bird 363 171 591
Large bird 8260 3373 20419
The estimated proportion of carcasses that had not disappeared prior to the survey (averaged over 30 days) at Wind Farm B varied between bats and the three size classes of birds (Table 13) It was estimated that more than 80 of large birds would not have been scavenged or otherwise lost and therefore most would have been available to be detected This percentage was much lower for the other size classes It was
28 Investigation of post-construction mortality monitoring at Victorian wind farms
estimated that only one in ten small birds would remain to be able to be observed during surveys Medium-sized birds fair better at one in five Bat carcass persistence was in between that of small and medium-sized birds with approximately one in seven carcasses remaining This means that at Wind Farm B bat small bird and medium-sized bird carcasses were rarely going to be observed even if mortalities occurred because they would be scavenged or otherwise lost relatively quickly
Table 13 The estimated proportion of carcasses that were not scavenged or otherwise lost prior to survey (averaged over 30 days) at Wind Farm B Lower and upper bounds refer to the bounds of the 95 credible intervals for the estimate
Size class Estimated proportion of carcasses that did not disappear prior to survey
Lower bound Upper bound
Bat 014 007 023
Small bird 009 004 014
Medium bird 021 012 031
Large bird 086 079 093
Incorporating the searcher efficiency and carcass persistence rates into the mortality model for Wind Farm B enabled estimation of the total numbers of individuals likely to have been killed The mortality model indicated that the White-striped Freetail Bat had the highest mortality rate of any native species of bird or bat at 27 individuals per turbine per year (95 CI 12ndash48 Figure 8 and Table 14) The range of the 95 credible interval was large especially considering that this needs to be multiplied by the number of turbines at the wind farm to obtain an estimate for the annual White-striped Freetail Bat mortality Wind Farm B has 140 turbines so this equates to 378 individuals killed per year with the range of plausible values being between 168 and 672 individuals One Critically Endangered Southern Bent-wing Bat was found dead at Wind Farm B during mortality monitoring The mortality model generated an estimate of the annual mortality rate of 01 individuals per turbine per year (95 CI 0ndash05 Figure 8 and Table 14) equating to a mortality rate of 14 Southern Bent-wing Bats annually for the whole wind farm with the range of plausible values being between zero and 70 individuals
Figure 8 Estimated mortality rates (individuals per turbine per year) for bat species found at Wind Farm B Lines indicate the 95 credible intervals
Investigation of post-construction mortality monitoring at Victorian wind farms 29
Table 14 The estimated mortality rates (per turbine per year) at Wind Farm B Lower and upper bounds refer to the bounds of the 95 credible intervals for the estimate
Size class Common name Total observed
Naiumlve estimate
Estimated mortality rate
Lower bound
Upper bound
Bat Little Red Flying-fox 1 00 01 00 05
Bat Gouldrsquos Wattled Bat 5 02 07 02 16
Bat Lesser Long-eared Bat 1 00 01 00 05
Bat Southern Bent-wing Bata 1 00 01 00 05
Bat White-striped Freetail Bat 18 08 27 12 48
Bat Undetected bat species 0 00 00 00 02
Small bird Common Starlingb 1 00 01 00 06
Small bird Eurasian Skylarkb 33 14 54 28 92
Small bird European Goldfinchb 3 01 04 00 11
Small bird Fork-tailed Swifta 1 00 01 00 05
Small bird New Holland Honeyeater 1 00 01 00 06
Small bird Skylark 2 01 03 00 08
Small bird Stubble Quail 1 00 01 00 05
Small bird Undetected small bird 0 00 00 00 03
Medium bird Australian Magpie 19 08 11 05 18
Medium bird Bird ndash unidentified 16 07 09 04 15
Medium bird Bird of prey 1 00 01 00 02
Medium bird Black-shouldered Kite 2 01 01 00 03
Medium bird Black Falcona 1 00 01 00 02
Medium bird Brown Falcon 10 04 06 02 10
Medium bird Duck spp 1 00 01 00 02
Medium bird Magpie-lark 12 05 07 03 12
Medium bird Nankeen Kestrel 19 08 11 05 19
Medium bird Pacific Black Duck 1 00 01 00 02
Medium bird Raven 9 04 05 02 09
Medium bird Red-rumped Parrot 3 01 02 00 04
Medium bird Undetected medium bird 0 00 00 00 01
Large bird Barn Owl 1 00 00 00 01
Large bird CorellaCockatoo 1 00 00 00 01
Large bird Corella sp 2 01 00 00 01
Large bird Guinea Fowl 2 01 00 00 01
Large bird Poss Whistling Kite 1 00 00 00 01
Large bird Purple Swamp Hen 1 00 00 00 01
Large bird Spotted Harrier 1 00 00 00 01
Large bird Straw-necked Ibis 1 00 00 00 01
Large bird Wedge-tailed Eagle 5 02 01 00 02
Large bird Undetected large bird 0 00 00 00 01
a species listed as a lsquospecies of interestrsquo in Lumsden et al (2019) b introduced species
30 Investigation of post-construction mortality monitoring at Victorian wind farms
The mortality model indicated that an introduced species the Eurasian Skylark had the highest mortality rate for small birds at 54 individuals per turbine per year (95 CI 28ndash92 Figure 9 and Table 14) For a small bird species that was not detected the mortality rate was estimated to be zero individuals per turbine per year (95 CI 0ndash03) One lsquospecies of interestrsquo the migratory Fork-tailed Swift has been recorded as a mortality at Wind Farm B with an estimate of 01 individuals killed per turbine per year equating to 14 individuals for the wind farm annually with the plausible range of values between zero and 70 (Figure 9 and Table 14)
Figure 9 Estimated mortality rates (individuals per turbine per year) for small bird species found at Wind Farm B Lines indicate the 95 credible intervals indicates introduced species
The mortality model shows that the Australian Magpie and the Nankeen Kestrel have the highest medium-sized bird mortality rates at 11 individuals per turbine per year for each species (95 CI 05ndash19 Figure 10 and Table 14) It should be noted that each turbine had an estimated bird mortality per year for which the species would not be determined if it was found That is about the same as the number identified as Australian Magpie or Nankeen Kestrel Additionally for a medium bird species that was not detected the mortality rate was estimated to be zero individuals per turbine per year (95 CI 0ndash01) One lsquospecies of interestrsquo in the medium-sized bird category the Black Falcon was recorded as a mortality at Wind Farm B with an estimate of 01 individuals killed per turbine per year equating to 14 individuals for the wind farm annually with the plausible range of values between zero and 28 (Figure 10 and Table 14)
The mortality model shows that the Wedge-tailed Eagle had the highest large bird mortality rate at 01 individuals per turbine per year (95 CI 0ndash02 Figure 11 and Table 14) equating to 14 for the whole wind farm with the plausible range of values between zero and 28 individuals Additionally for large bird species that is not detected the mortality rate is estimated to be zero individuals per turbine per year (95 CI 0ndash01)
Investigation of post-construction mortality monitoring at Victorian wind farms 31
Figure 10 Estimated mortality rates (individuals per turbine per year) for medium-sized bird species found at Wind Farm B Lines indicate the 95 credible intervals
Figure 11 Estimated mortality rates (individuals per turbine per year) for large bird species found at Wind Farm B Lines indicate the 95 credible intervals
32 Investigation of post-construction mortality monitoring at Victorian wind farms
266 Mortality surveys discussion
The detailed analysis of the searcher efficiency rates and carcass persistence rates for bats and the three size classes of birds revealed marked differences between Wind Farm A and Wind Farm B (Table 15) For example it was estimated that 44 of the small birds were found in searcher efficiency trials at Wind Farm A compared with 70 at Wind Farm B and there were similar although reverse differences for the bats In contrast the rates at which the medium and large birds were found were fairly similar The length of time that carcasses remained on site and hence available to be found also varied markedly between the two wind farms especially for the large birds (7 days vs 83 days for Wind Farms A and B respectively) (Table 15)
Table 15 Comparison between Wind Farm A and Wind Farm B of the modelled estimates for the detection rates based on the searcher efficiency trials and the length of time before disappearance The estimate figures are taken from Tables 7 8 11 and 12
This analysis has highlighted the importance of obtaining detailed wind farmndashspecific data for these two critical variables in the mortality estimates These figures may vary due to different searchers being used that have different efficiency rates or due to site-specific factors such as the vegetation structure within the search area seasonal patterns or land management practices Without undertaking considerably more detailed studies to determine patterns to enable extrapolation in the future it is currently not possible to use either the searcher efficiency rates or the carcass persistence rates from one wind farm in the mortality estimates for another wind farm unless there is very clear evidence that there would not be significant differences in these rates between the farms in question
There were also differences between the two wind farms in the annual mortality estimates Three lsquospecies of interestrsquo were recorded as mortalities at Wind Farm B whereas there were no lsquospecies of interestrsquo recorded dead at Wind Farm A For each of the species of interest killed at Wind Farm B just a single individual was found dead however this equated to an estimate of 14 individuals of each of these species with the range of plausible values for Southern Bent-wing Bats and Fork-tailed Swifts each being between zero and 70 individuals annually and those for the Black Falcon being between zero and 28 individuals annually
The annual mortality rates were higher for some of the non-threatened species At both Wind Farms A and B the White-striped Freetail Bat had the highest mortality rate for bats (63 and 27 individuals per turbine per year respectively) which was often an order of magnitude higher than that of other species At Wind Farm A this rate was also higher than for any bird species and at Wind Farm B it was higher than any native bird species When the number of turbines was factored in the estimated annual number of mortalities of this species was 397 (plausible range 211ndash634) individuals at Wind Farm A and 378 (plausible range 168ndash672) individuals at Wind Farm B These are very high numbers for both wind farms and although accurate density estimates for this tree hole-roosting bat are lacking they are likely to represent a significant proportion of the local populations of this species in these areas
The introduced Eurasian Skylark mortality rate at Wind Farm B was the highest of any bird species at 54 individuals per turbine per year Other bird species commonly killed included the Australian Magpie (11 per turbine per year at each of Wind Farms A and B) corella (presumably one or both of Little Corella Cacatua sanguinea and Long-billed Corella Cacatua tenuirostris) (11 at Wind Farm A) and Nankeen Kestrel (11 per turbine per year at Wind Farm B)
Size class Wind Farm A searcher
efficiency rate
Wind Farm B searcher
efficiency rate
Wind Farm A time to
disappearance (days)
Wind Farm B time to
disappearance (days)
Bat 068 054 485 298
Small bird 044 070 1429 195
Medium bird 086 097 1360 363
Large bird 091 099 680 8260
Investigation of post-construction mortality monitoring at Victorian wind farms 33
The accuracy of the estimated number of Wedge-tailed Eagles killed by turbines at each wind farm is difficult to determine given the data At Wind Farm A the rate was 01 individuals per turbine per year with the upper bound 04 individuals per turbine per year This uncertainty is a result of the very low number of large birds used in the carcass persistence trials One of the two large birds used in the carcass persistence trials at Wind Farm A was completely scavenged on the first day whereas the other was not completely scavenged by the end of the trial (30 days) resulting in a relatively high carcass persistence rate (median time-to-disappearance of 7 days) More large birds would need to have been included in the carcass persistence trials in order to achieve a more reliable estimate for the relevant carcass persistence rate At Wind Farm B five Wedge-tailed Eagles were detected during mortality monitoring surveys plus another 11 were found dead incidentally However the estimated mortality rate was only slightly greater at Wind Farm B than at Wind Farm A (ie 01 individuals per turbine per year) due to a much lower carcass persistence rate (median time-to-disappearance of 83 days)
The mortality estimates provided above are based on data from just two of the 15 wind farms at which mortality monitoring has been undertaken As outlined above it was considered that these two were the only ones for which there was sufficient data to validly undertake these estimations using the data available to us Mortality rates are likely to vary markedly between wind farms depending on their proximity to key habitat features (eg important cave roosts for Southern Bent-wing Bats) and a range of other variables Therefore it is not possible to extrapolate from the mortality estimates provided here to predict mortality estimates for other wind farms mortality estimates need to be determined for each individual wind farm based on the site-specific observed mortalities searcher efficiency trials and carcass persistence trials
27 Comparison of estimates of mortality rates with those undertaken by the wind farms
The mortality rate estimates outlined above have been undertaken independently from those conducted by the various wind farms To explore how our estimates compare with those provided by the wind farms in their mortality monitoring reports we compare our estimates for the two wind farms we examined in detail with those provided in the BAMM reports from those wind farms This enables an exploration of the estimated values as well as the confidence limits around these estimates and the assumptions underlying them
271 Wind Farm A
Bats Our estimated mortality rate for bats at Wind Farm A were similar to those in Wind Farm Arsquos BAMM report (Figure 12) The overall bat mortality rate (total bat deaths per turbine per year) was slightly higher in the BAMM report but within our confidence intervals However our model had much larger credible intervals for the estimated bat mortality rate indicating that there is a higher level of uncertainty in these figures than that indicated by the BAMM figures
34 Investigation of post-construction mortality monitoring at Victorian wind farms
Figure 12 Estimated bat mortality rate (bat deaths per turbine per year) at Wind Farm A from the Bat and Avifauna Mortality Monitoring report (orange) and from our model (termed lsquolegacyrsquo in blue)
Birds The BAMM report estimated mortality rate (total deaths per turbine per year) for birds at Wind Farm A was similar to but slightly higher than our model estimates (Figure 13) There was no confidence interval for the bird mortality rate given in the BAMM report This contrasted with our analysis which indicated that there was a moderate level of uncertainty around this estimate All size classes of birds were combined to obtain a single estimate for the bird mortality rate in the BAMM report despite there being marked differences in the mortality rates between size classes (see Table 10)
Figure 13 Estimated total bird mortality rate (total bird deaths per turbine per year) at Wind Farm A from the Bat and Avifauna Mortality Monitoring report (orange) and from our model (termed lsquolegacyrsquo in blue)
Investigation of post-construction mortality monitoring at Victorian wind farms 35
272 Wind Farm B
Bats Wind Farm B reported their estimated mortality rates separately for the first and second years of their mortality monitoring program Our estimated mortality rates for bats at Wind Farm B were similar to the BAMM reportrsquos second-year estimates (Figure 1414) In contrast their first yearrsquos bat mortality rates (total bat deaths per turbine per year) was much smaller Given our model is a combination of the 2 years of monitoring the comparison should be made to the combined average of the BAMM reports figures when that is done our model appears to indicate a higher bat mortality rate than that in the BAMM report Estimated annual mortality rates were not provided specifically for the Southern Bent-wing Bat in the BAMM report so no comparison can be made for this Critically Endangered species
Figure 14 Estimated bat mortality rate (bat deaths per turbine per year) at Wind Farm B from each year of their 2-year monitoring program taken from annual Bat and Avifauna Mortality Monitoring reports (orange) and from our analysis of their combined data (termed lsquolegacyrsquo in blue)
Birds overall Our estimated mortality rate for all birds at Wind Farm B was similar to the rates in the BAMM reports (Figure 15) The total bird mortality rate (total bird deaths per turbine per year) in the BAMM reports was marginally lower in the first year of monitoring Given our model is a combination of the 2 years of monitoring the comparison should be made to the combined average of the BAMM reports when that is done our model appears to indicate a similar bird mortality rate but with a larger 95 CI for the estimate indicating greater uncertainty in the estimate than is indicated in the BAMM reports
36 Investigation of post-construction mortality monitoring at Victorian wind farms
Figure 15 Estimated total bird mortality rate (total bird deaths per turbine per year) at Wind Farm B from annual Bat and Avifauna Mortality Monitoring reports (orange) and from our analysis of their combined data (termed lsquolegacyrsquo in blue)
Small birds As Wind Farm B provided mortality rate estimates for each size class of bird these rates can be compared with our estimates The first annual BAMM report small bird mortality rate (total small bird deaths per turbine per year) was significantly lower than that in the second report (Figure 16) Our model estimate (which combined both years) was in between the two annual estimates Our estimates had a much larger 95 credible interval potentially reflective of the differences between the mortality rates for the 2 years
Figure 16 Estimated small bird mortality rate (small bird deaths per turbine per year) at Wind Farm B from annual Bat and Avifauna Mortality Monitoring reports (orange) and from our analysis of their combined data (termed lsquolegacyrsquo in blue)
Medium-sized birds Our estimated mortality rate for medium-sized birds at Wind Farm B (total medium-sized bird deaths per turbine per year) was similar to that in the first BAMM report (Figure 17) however the medium-sized birds mortality rate was much smaller in the second yearrsquos BAMM report The estimates in our model which combines the data for the 2 years of monitoring were similar to the first year and slightly higher than the second year and contained greater levels of uncertainty
Investigation of post-construction mortality monitoring at Victorian wind farms 37
Figure 17 Estimated medium-sized bird mortality rate (medium-sized bird deaths per turbine per year) at Wind Farm B from annual Bat and Avifauna Mortality Monitoring reports (orange) and from our analysis of their combined data (termed lsquolegacyrsquo in blue)
Large birds Our estimated mortality rate for large birds at Wind Farm B was much larger than the estimates provided in that wind farmrsquos BAMM reports (Figure 18) Their second year BAMM report estimate was much larger than that in the first year BAMM report but their estimates for both years were much smaller than our estimate It is unclear where these large discrepancies came from
Figure 18 Estimated large bird mortality rate (large bird deaths per turbine per year) at Wind Farm B from annual Bat and Avifauna Mortality Monitoring reports (orange) and from our analysis of their combined data (termed lsquolegacyrsquo in blue)
38 Investigation of post-construction mortality monitoring at Victorian wind farms
273 Potential reasons for differences between mortality estimates in the BAMM reports and those obtained in our analysis
There are several potential reasons for differences between the mortality estimates given in the BAMM reports and those resulting from our analysis which generally relate to how the estimates were calculated In general our analysis suggested a higher level of uncertainty in the estimates than was indicated in the BAMM reports
Differences between the wind farms and between their analyses and ours in calculating and using the carcass persistence rates are likely to have resulted in a number of these dissimilarities There were low numbers of carcasses used in the persistence trials for specific bats and the three size classes of birds especially for seasonal estimates For large birds often only one or two trials were conducted with very low numbers of individual carcasses being used This may have caused the mortality rate estimates to vary greatly especially if the carcasses were not scavenged or otherwise lost within the allotted time Underestimating the median time-to-disappearance would cause the mortality rate estimate to decrease
Our analysis generated mortality rates for each species whereas the BAMM reports only reported mortality rate estimates at the level of class (sometimes split into size groups) To calculate group level mortality estimates in our analysis the cohorts were combined which may have resulted in larger credible intervals
The searcher efficiency trials and carcass persistence trials were sometimes carried out over different time periods Our analysis generally analysed all the data at once as did Wind Farm A whereas Wind Farm B provided estimates at the annual or even seasonal level This would produce different overall estimates if the estimates varied over time
274 Other wind farms
Mortality estimates have been calculated for most wind farms in their Bat and Avifauna Mortality Monitoring reports by extrapolating from the numbers found during the mortality searches using data from searcher efficiency trials and carcass persistence trials where available However in our view the data on searcher efficiency rates or carcass persistence rates were often not sufficient to make valid mortality estimates For some wind farms no indication of uncertainty in the estimates was provided with just a single value given From our analysis it is clear that even with the best-quality data available to us there was a high degree of uncertainty in the estimates of mortality rates so the uncertainty is likely to be even higher for the other wind farms
Investigation of post-construction mortality monitoring at Victorian wind farms 39
3 Simulations to examine the likelihood of detecting
mortalities of different species
To determine the level of monitoring required in order to significantly reduce the uncertainty in the estimates of annual mortalities a series of simulations were undertaken Using the searcher efficiency and carcass persistence rate data available from the six wind farms from which we obtained raw data for analysis several scenarios were constructed to examine the likelihood of detecting mortalities of different species The same four size classes were used ie bat small bird medium-sized bird and large bird Both human and dog searchers were included with their estimated detection rates for each size class being taken from the centre of the modelled distribution rounded to the nearest 005 (Table 16) For these simulations the wind farm was assumed to be of moderate size with 50 turbines operating Mortality surveys were assumed to occur monthly for 2 years For each size class of carcass the proportion remaining after a month was estimated using a combination of the data from Wind Farms A and B (Table 17) The variables used in the simulations were the number of turbines surveyed each month which was varied from 5 (10) to 25 (50) and the total wind farmndashwide mortalities which were set to range from 1 to 100 individuals per annum
Table 16 Detection rates from searcher efficiency trials for each size class and searcher type using data from Wind Farms A B C E and F
Searcher Bat Small bird Medium bird Large bird
Dog 075 05 085 09
Human 055 07 095 10
Table 17 Estimated proportion of carcasses that will remain to be observed for each size class using data from Wind Farms A and B
Size class Proportion of carcasses from the month available to be detected
Bat 025
Small bird 030
Medium bird 040
Large bird 080
31 Mortality estimates
From the simulations it can be seen that the mean estimated mortality rate is equal to the actual mortality rate as would be expected from an unbiased estimator (Figures 19 to 22) For example when there were 10 mortalities per year (the lower box in each figure) the number of mortalities found per turbine per year was 02 and with 50 turbines in the simulation this would be equivalent to a total of 10 mortalities per year (ie 02 x 50 = 10) This was the case irrespective of how many turbines are searched However what varies markedly in response to the number of turbines searched is the plausible range of this estimate The upper end of the estimate range is at least double the actual amount for most scenarios and even triple for some Using bats with human searchers as an example when 5 of the 50 turbines are searched the plausible range of the estimate is from zero to 15 While the estimate remains at 02 when 15 of the 50 turbines are searched the upper limit is increased to 08 The upper limit reduced to 06 if 20 turbines are searched and to 045 if all 50 turbines are searched This reduces the upper range of the estimated annual number of mortalities from 75 if five turbines are searched to 40 30 and 23 if 15 20 and all turbines are searched respectively Therefore undertaking searches at more turbines markedly reduces the uncertainty in the plausible range of the estimate In addition under many of the scenarios especially for the lower proportions of turbines searched the lower limit of the range of plausible values is zero indicating that there would be uncertainty in knowing if a species had actually been killed at all
40 Investigation of post-construction mortality monitoring at Victorian wind farms
Figure 19 The estimated mortality rates from the simulation with monthly surveys at 5 of the 50 turbines Mortality rates of 1 5 and 10 deaths per annum (pa) are considered The red circles and green triangles represent the means and the lines extend to the 95 confidence intervals
Investigation of post-construction mortality monitoring at Victorian wind farms 41
Figure 20 The estimated mortality rates from the simulation with monthly surveys at 15 of the 50 turbines Mortality rates of 1 5 and 10 deaths per annum (pa) are considered The red circles and green triangles represent the means and the lines extend to the 95 confidence intervals
42 Investigation of post-construction mortality monitoring at Victorian wind farms
Figure 21 The estimated mortality rates from the simulation with monthly surveys at 25 of the 50 turbines Mortality rates of 1 5 and 10 deaths per annum (pa) are considered The red circles and green triangles represent the means and the lines extend to the 95 confidence intervals
Investigation of post-construction mortality monitoring at Victorian wind farms 43
Figure 22 The estimated mortality rates from the simulation with monthly surveys at all 50 turbines Mortality rates of 1 5 and 10 deaths per annum (pa) are considered The red circles and green triangles represent the means and the lines extend to the 95 confidence intervals
32 Likelihood of detecting at least one individual
Overestimating the plausible range of the estimate by a factor of two or three may make it appear that more individuals may have been killed than actually were However underestimation suggesting that no mortalities may have occurred is also of concern In this simulation this happened frequently under the many scenarios in which total mortality rates andor survey rates were low To investigate this issue further the following simulations were run to explore the amount of survey effort required to detect at least one dead individual of a species The simulations all specified that surveys were conducted monthly for 2 years at each surveyed turbine and for simplicity assumed a constant mortality rate over that time The parameter values for detection and persistence rates are based on the survey data supplied It should be re-emphasised that none of the searcher efficiency trials were truly blind trials and therefore the estimates may be positively biased (too high) especially for human searchers which would influence the derived results
321 Bat species
Where the likely number of bat mortalities for a species is 100 or more annually across the wind farm then detecting at least one of these mortalities is almost guaranteed if at least 10 of the 50 turbines are surveyed (Figure 23) As the number of bat mortalities decreases the fraction of turbines surveyed needs to increase in order to maintain a reasonable chance of detecting any mortalities of the species Surveys using dogs are more likely to detect any bat mortalities If there are 10 bat mortalities for a species annually then even if using dogs and surveying half the turbines (ie 25 out of 50) there is a 15 chance that none of the mortalities would be detected over 2 years of monthly surveys (ie the green line in Figure 23 never reaches the value of one whereby at least one mortality would be detected although it comes close if all 50 turbines
44 Investigation of post-construction mortality monitoring at Victorian wind farms
are searched) Under the same scenario but with a bat mortality rate of one per year the chance that it is not detected in either year is 82 Even if monthly surveys were conducted at each turbine there is still a 65 chance that this one mortality would not be detected The likelihood of detection would be even lower if humans are used as the searchers
Figure 23 Probability that at least one bat of a particular species was detected during monthly surveys over 2 years given the total number of annual mortalities for that species
322 Small bird species
For a small bird species the likelihood of detecting at least one mortality is similar to that for bat species with the exception that human searchers based on the data available appear to be superior to dogs (although note the previously mentioned qualifier that most human trials were not blind) (Figure 24) At moderate to high numbers of mortalities per annum (50 or more total mortalities annually) surveying 10 of the 50 turbines per month would almost guarantee some detections As the number of mortalities decreases the fraction of turbines surveyed needs to increase to maintain a reasonable chance of detecting any mortalities of the species Surveying using humans would require fewer turbines to be surveyed If there is only a single mortality for a small bird species annually and if humans were used to survey half (25 out of 50) of the turbines in 80 of the time the single mortality would not be detected over 2 years of monthly surveys Even if monthly surveys were conducted at each turbine there is a 62 chance that the single mortality of that species would not be detected
Investigation of post-construction mortality monitoring at Victorian wind farms 45
Figure 24 Probability that at least one small bird of a particular species was detected during monthly surveys over 2 years given the total number of annual mortalities for that species
323 Medium-sized bird species
Where the likely number of medium-sized bird mortalities for a species is 50 or more annually across the wind farm then detecting at least one of these mortalities is almost guaranteed if at least 5 of the 50 turbines are searched (Figure 25) As the number of mortalities decreases the fraction of turbines surveyed needs to increase to maintain a reasonable chance of detecting any mortalities of the species Surveys using humans are more likely to detect any medium-sized bird mortalities If there are 5 mortalities for a medium-sized bird species annually using humans to survey half of the turbines (25 out of 50 turbines) 15 of the time none of those mortalities would be detected over 2 years of monthly surveys Under the same scenario but a lower mortality rate of one per year the chance that none of that species are detected in either year is 65 Even if monthly surveys were conducted at each turbine there is still a 40 chance that it would not be detected
46 Investigation of post-construction mortality monitoring at Victorian wind farms
Figure 25 Probability that at least one medium-sized bird of a particular species was detected during monthly surveys over 2 years given the total number of annual mortalities for that species
324 Large bird species
When the likely number of large bird mortalities for a species is 50 or more annually across the wind farm then detecting at least one of these mortalities is almost guaranteed if at least 5 of the 50 turbines are surveyed (Figure 26 in which both the 50 and 100 individuals lines are consistently at 10) As the number of mortalities decreases the proportion of turbines surveyed needs to increase to maintain a reasonable chance of detecting any mortalities of the species Surveys using humans appear to be marginally more likely to detect any large bird mortalities If there are 5 mortalities for a large bird species annually then using humans and surveying 10 turbines 20 of the time the species would fail to have been detected over 2 years of monthly surveys Under the same scenario but when the mortality rate was one per year the chance that it is not detected in either year is 70 If monthly surveys were conducted at each turbine however the chance that this one individual would not be detected declines considerably to just a 5 chance
Investigation of post-construction mortality monitoring at Victorian wind farms 47
Figure 26 Probability that at least one large bird of a particular species was detected during monthly surveys over 2 years given the total number of annual mortalities for that species
33 Discussion results of simulations Given the estimates derived from our analysis of the existing post-construction mortality monitoring data there are some clear concerns about the efficacy with which the assessment of bird and bat turbine collision mortalities is currently being implemented
The range of values obtained from the simulations above shows that even with moderate levels of mortality (01 to 02 mortalities per turbine per year) at a wind farm with a reasonably good coverage of surveys (eg sampling 25 of 50 turbines every month for 2 years) the derived total mortality estimates are highly variable
If a species is likely to be affected by even a single death a year across an entire wind farm then for anything other than large bird species the current methods are unlikely to detect it After large bird species medium-sized birds have the best chance of being detected However even for medium-sized birds with 2 years of monthly surveys at 25 of 50 turbines two-thirds of the time neither of the simulated single mortalities from each year would be detected For bats the simulation indicates that two-thirds of the time monthly surveys at all turbines over 2 years would not detect either of the bat mortalities
If post-construction mortality surveys are to continue careful consideration needs to be given to the nature of the surveys and what they are likely to be able to detect The critical issues relate to which species of concern are likely to be present in the area the best detection method for those species (dogs or humans ndash further investigations are required regarding this) and what level of risk of not detecting any given mortalities is acceptable
48 Investigation of post-construction mortality monitoring at Victorian wind farms
If the only species of concern for a given wind farm was a large bird such as the Brolga (Antigone rubicundus) where any mortalities may be considered important then monthly surveys by humans are likely to be required at 80 of turbines (ie 40 of the 50 turbines in our simulations) to achieve an 85 chance of a detection over 2 years The precision under this scenario would be reasonable with the 95 confidence intervals for the mortality rate per turbine per year ranging from 0 to 003 around the simulated actual mortality rate of 002 deaths per turbine per year
If the only species of concern for a wind farm was a small bird such as the Orange-bellied Parrot (Neophema chrysogaster) where any mortalities are important then according to our simulation monthly surveys would be required at all turbines (ie 50 in our simulation) to achieve a 30ndash40 chance of a detection over 2 years This detection rate is quite low and more frequent surveys may be required during the times of the year when individuals are known to be in Victoria The precision under this scenario was also poor with the 95 confidence intervals for the mortality rate per turbine per year ranging from 0 to 01 around the simulated actual mortality rate of 002 deaths per turbine per year The results of such monitoring (with a 60ndash70 chance of no detection) might readily be interpreted to mean that no mortalities are occurring and that therefore there is no concern On the other hand the same results could be interpreted to indicate that the turbines are killing up to five times as many birds as they actually are ie five individuals not one
If the only species of concern was a Southern Bent-wing Bat for which larger numbers of mortalities may occur in line with their larger population numbers the detection of at least one of these mortalities is effectively guaranteed if there were monthly surveys by dogs at a smaller proportion of turbines such as 15 of the 50 turbines in our simulation The precision under this scenario would be reasonable with the 95 confidence intervals for the mortality rate per turbine per year ranging from 09 to 34 around the simulated actual mortality rate of 20 deaths per turbine per year If however the actual number of mortalities is important not just recording at least one individual as is likely to be the case then a greater intensity of surveying would be required
The question remains what if there are multiple species of concern from a number of size classes andor where there are differing numbers of lsquoacceptablersquo mortalities The answer will depend on the combination of species involved For instance if the region has a small bird species for which any death would be problematic a bat species for which larger numbers of mortalities would be problematic and a large bird species for which any death is problematic then the appropriate monitoring design might be to search all turbines at least once a month Such a strategy would provide the best sampling for the small bird marginally too much sampling for the large bird and a lower detection rate for the bat which would be countered to some extent by sampling more turbines This is an illustration of how sampling regimes should be constructed factoring in which species are at risk in the particular area and how many deaths would make a meaningful impact on the population of the species
These conclusions are predicated on the analysis of the data that has been supplied to us Given the issues associated with some of this data the above simulations should be used for illustrative purposes only their applicability needs to be confirmed with data that has been collected in the appropriate fashion and with adequate replication
Investigation of post-construction mortality monitoring at Victorian wind farms 49
4 Population and cumulative impacts
41 Population-level impacts A fundamental objective of Victorian and Commonwealth planning law and policy is to maintain viable populations of indigenous fauna in the long term Assessments in relation to this should be framed in terms of population-level impacts because the population is the principal unit of conservation Obtaining an estimate of total mortality of a species of concern at a wind farm is not an end in itself but is a critical first step It is also important to know whether the level of mortality is likely to have an impact on the functioning of the Victorian population of the species particularly in light of the fact that wildlife populations experience natural variation and most have mechanisms to cope with minor fluctuations Thus after an estimate of the mortality rate of a species of concern has been determined for a wind farm an assessment of the likely influence of that mortality rate on the Victorian population of the species should be made
Population modelling offers a framework for understanding the effects of collision mortality on the viability of the population of the relevant species Population viability analysis (PVA) has sometimes been used for this purpose and potential biological removal (PBR) may be applicable where less precise demographic information is available Each of these models has data requirements that may limit their application to mortality estimates for single wind farms however their greater value is likely to be in assessment of the broader effects of the cumulative impacts of multiple sites (Diffendorfer et al 2015 Smales 2017) (see below)
411 Population modelling
PVA was developed as an approach to evaluate the various influences on a population and to quantify its viability in terms of altered extinction risk or more commonly quasi-extinction risk (ie the risk of reaching a population size that is insufficient to assure the long-term survival of the population) (Gilpin and Souleacute 1986) Because of the relatively small number of mortalities that usually result from collisions with wind turbines for many species and the typical expected lifespan of a wind farm (25ndash30 years) PVA results defined by the probability of extinction over much longer timespans (eg 50-100 years) are not particularly relevant to wind farm studies thus a PVA or similar population model is more usually undertaken to simply quantify population-level impacts
To date PVA has been used in the pre-approval processes of environmental impact assessments for a few wind farms to quantify the potential levels of impact on particular species as predicted by collision risk modelling but the approach is equally applicable to estimating the total number of mortalities that may be occurring based on monitoring of mortalities at an operational wind farm Examples of the use of PVA for investigating the impact of wind farm collisions on species include those done for the Brolga (DSE 2012) and for the Orange-bellied Parrot (Smales et al 2006) For Brolgas a species-specific PVA has been developed by McCarthy (2008) in order to quantify the appropriate measures needed to achieve a zero net effect on the Victorian population
It is important to note though that PVAs can only be used in situations where there is a relatively high level of demographic information for the taxon in question such as background age- and sex-specific survivorship and mortality rates density dependence and measures of population stochasticity Where these values are available a PVA undertaken to evaluate background population trends for an important taxon offers a valuable context for consideration of the impact of additional mortalities due to wind farm collisions Information sufficient to support a PVA is currently available for only some threatened species of birds and bats and it will be valuable to review the currency of that information and its availability for species deemed to be of concern in the context of potential for collisions at wind farms in Victoria Where relevant demographic data are not currently available for key threatened species it may be necessary to carry out appropriate studies to enable a PVA to be performed In this context it will be necessary to use a clear definition of the lsquopopulationrsquo of a particular species in question This may present a challenge in cases where the population of a species has a geographic range that is much broader than Victoria especially since many such populations have substantial dispersal and exchange of individuals over a number of states or even the entire continent Migratory and nomadic species that may be present in the state periodically
50 Investigation of post-construction mortality monitoring at Victorian wind farms
andor whose populations here may vary due to such movements or effects outside Victoria (even internationally) present additional challenges
Relative to population size estimates of total collision mortality for a wind farm are often quite low and within natural population cycles they are likely to be masked by population variability andor the imprecision of demographic values available for use in population models These factors may mean that it is simply beyond the functional capacity of PVA to assess the effects of collision estimates for a single wind farm
Where sufficient information about demography is not available integrated population modelling (IPM) (Besbeas et al 2002 Brooks et al 2004 Schaub and Abadi 2011) is an approach that permits various sources of data such as those from individual surveys to provide estimates of demographic parameters (Abadi et al 2010) and this approach may then permit more comprehensive analysis using PVA However this approach necessarily incorporates substantial uncertainty that is associated with the assumptions made
PBR is an approach that has been developed to assess effects at the population level when values for few demographic parameters are available PBR requires a value for the maximum annual recruitment rate an estimate of population size and a lsquorecovery factorrsquo of between 01 and 1 (Dillingham and Fletcher 2011 and authors cited therein) PBR has been used to evaluate population-level effects of collisions for some species at individual wind farms For example Sugitomo and Matsuda (2011) applied PBR for a population of approximately 3000 White-fronted Geese (Anser albifrons frontalis) inhabiting the site of a small wind farm in Japan where pre-construction collision risk modelling estimated an annual collision mortality of 0ndash2 birds In that case PBR indicated that the population could sustain a loss of 75 geese and thus that mortalities due to turbine collisions would have a negligible effect on the population Otherwise PBR has mainly been used in relation to assessments of species with quite large populations interacting with offshore wind farms (eg Natural England 2012)
PBR is reliant on assumptions where there are imprecise or unknown demographic values and Dillingham and Fletcher (2008 2011) caution against its use for very small populations For populations in which a specific recovery rate is uncertain Wade (1998) and Dillingham and Fletcher (2008 2011) provide suggested default values for recovery rates according to the conservation status levels for threatened taxa but these are arbitrary and all such assumptions would necessarily add to uncertainty about the real level of impact on a population
Assessment of population-level impacts using any method will have greatest value when applied to the cumulative effects of all relevant wind farms (see section 42) Wherever mortality estimates from wind farms and demographic information for a lsquospecies of concernrsquo (Lumsden et al 2019) are sufficient to support PVA that will be the best modelling approach to use in determining population-level impacts In summary the following will be required to achieve this
Review the availability and currency of demographic information needed to run a PVA for the lsquospecies of concernrsquo
For species where relevant demographic data are not currently available it may be necessary to carry out appropriate studies to collect this key information before it is possible to run a PVA
A clear definition of the lsquopopulationrsquo of the particular species in question is needed
42 Cumulative impacts Environmental impact assessment processes have historically been focused on the potential effects of a particular project or development that is the subject of a planning application However where mortalities of a particular species occur at more than one wind farm the cumulative effects of the wind farms involved are of potentially greater importance than those of any individual facility As a result there is now a heightened focus on the consideration of cumulative impacts and environmental impact assessment processes are increasingly calling for consideration of the extent to which an individual wind farm might add to the accumulated effects of similar developments However methods to assess cumulative impacts have not as yet been detailed in Victorian planning requirements
Investigation of post-construction mortality monitoring at Victorian wind farms 51
It is vital that we have a clear definition of lsquocumulative effectsrsquo Fauna populations are affected by all manner of anthropogenic activities Ideally all of these activities should all be taken into account in any comprehensive consideration of the cumulative impacts on populations of conservation concern However almost none of the negative effects of such activities are able to be quantified in a way that would allow them to be assessed cumulatively with those due to wind energy Masden et al (2010) have noted that reference to a lsquocumulative effectrsquo may mean different things in different contexts In particular they note that the term is applied at times to the combined effects of multiple wind farms and at other times to the accumulated effects over time at one wind farm In the present context the term lsquocumulative effectsrsquo is used to refer only to the combined effects of multiple wind farms
There is a growing body of international literature about the cumulative impacts of wind energy on wildlife populations and section 8 (References and Selected Further Reading) includes some of the more recent andor comprehensive publications The majority of the publications about cumulative impacts include discussion of conceptual approaches but it is worth noting that no published examples have been found of jurisdictions in which a program is in operation to determine the cumulative effects of mortalities at operating wind farms
421 Nature of cumulative impacts
Scottish Natural Heritage (2012) lists the following ways in which cumulative impacts may function
the effects of different wind farms may be additive (ie a multiple independent additive model) or
the effects of different wind farms may interact in ways that are antagonistic (ie the sum of impacts are less than in a multiple independent additive model) or
the effects of different wind farms may be synergistic (ie the cumulative impact is greater than the sum of the multiple individual effects)
To these we can add that for some species routine migration passage or nomadic movements might expose them to multiple wind farms in a sequence so that the cumulative risk may be a function of the probability of surviving one wind farm after another (Smales et al 2006)
As noted by Scottish Natural Heritage (2012) it may be difficult to demonstrate antagonistic or synergistic effects and it may be simpler at least initially to concentrate on the concepts of additive effects or those associated with movements that interact with one wind farm after another
422 Pre-requisites to assessment of cumulative impacts
At present there are a number of challenges to be overcome before sound assessment of the cumulative impacts of wind energy in Victoria can be made The following points document some of them and they may not be exhaustive This is provided to offer a realistic appraisal of what would be required in order to achieve a cumulative impact assessment for the effects of turbine collisions We view this list as a prompt for further discussion and consideration of the additional work required
Uncertainties about the effects of wind energy on fauna include those related to linguistic and decision-making issues (Masden et al 2014) in addition to uncertainties of knowledge Clear definitions and standards in language and details of required processes will need to be determined and prescribed
Almost no anthropogenic causes of impact on and decline in fauna populations other than from wind energy are numerically quantified or indeed quantifiable However it is certain that there are many such causes that they affect various species in different ways depending upon the ecology of the relevant species and that many are ongoing This means that the cumulative effects of wind energy are potentially only part of a much larger negative impact on populations Importantly it also means that impacts from other causes may overlap andor mask wind farm effects in ways that confound our capacity to consider the impacts of the wind energy sector
52 Investigation of post-construction mortality monitoring at Victorian wind farms
In order to ascertain the cumulative effects of wind farms the assessments of all relevant individual wind farms must be undertaken to an agreed set of uniform standards This will be vital to ensure the compatibility of the data for use in calculations of cumulative effects
Any consideration of cumulative impact should take account of the mortalities over the expected life of a wind farm However as various wind farms will have commenced operating at different times it will be important to use a standard metric which should be the annual rate at which mortalities of relevant species occur
It is a prerequisite that quantified values for the effects or potential effects of all other relevant wind farms are available before the effects of a new one can be added to determine an overall cumulative impact It will be necessary for government or the industry itself to establish and maintain a central coordinated repository for all relevant information
Investigation of post-construction mortality monitoring at Victorian wind farms 53
5 Key learnings and limitations of current assessment
processes
The limitations outlined in this section relate to the current situation in which an individual wind farm undertakes monitoring and then estimates total mortalities occurring at the site
The examination and analyses of the existing data from Victorian wind farms as described in this report found that the monitoring carried out at many wind farms was not designed or undertaken in a manner that would allow for analyses to validly or accurately estimate annual mortality rates In part this appears to be the result of prescriptions in permit conditions andor BAM Plans that were not designed to meet a clear objective andor were written without reference to the appropriate science Examples of these issues include prescriptions for monitoring using an arbitrary search interval or around a specific number of turbines without any indication of how these might influence the capacity to estimate a total number of collisions from carcasses detected They also include carcass persistence trials and searcher efficiency trials that did not use sufficient carcasses or an adequate number of trials to provide sufficient power for the required analyses
For two wind farms the monitoring program and results were able to provide a basis on which statistical methods could be applied in an effort to calculate total mortalities However the results presented here as estimates of total numbers of mortalities per turbine per annum have very large credible intervals due to factors that introduced uncertainty even in relatively well-designed monitoring programs
51 Detection of carcasses Current practices used to detect dead birds and bats at wind farms have the capacity to detect only a small but uncertain percentage of the mortalities that may be occurring Where few collision mortalities actually occur for a particular species current methods have a low probability of detecting any carcasses at all The capacity to detect carcasses is influenced by the frequency of searches the proportion of turbines searched and how searches are undertaken The likelihood of finding carcasses also varies according to the type and height of substrate (eg whether there is long grass) and the body size of the carcasses (it is higher for large birds than for small birds and bats) These issues related to the detection of carcasses are well known and have been documented internationally For example in many overseas studies searches are undertaken much more frequently (eg twice a week) than the typical frequency in Victoria Poorly designed or executed programs exacerbate these issues but in the Victorian context as elsewhere they are realities that present substantial limitations and uncertainty even for programs that have been designed and implemented in compliance with permit conditions for wind energy projects
The simulation exercise described in this report demonstrated that searching an incrementally greater proportion of turbines could improve the capacity to detect mortalities but that even if every turbine was to be searched the chance of detecting a given carcass remained low especially for small species It indicated that if every turbine was to be searched monthly the chance of detecting a present carcass at least once over 2 years would be 35 for a microbat 40 for a small bird 60 for a medium-sized bird and 95 for a large bird
Detection of carcasses also varied individually between searchers and according to whether people or trained dogs were used for searching The analyses provided here suggest that in general dogs may be better at detecting bats but that people may be better at detecting birds Capacity to detect carcasses is also influenced by the rate at which carcasses persist or are lost due to scavengers and other environmental factors Methods currently employed to determine rates of searcher efficiency and of carcass persistence have generally been limited by a lack of truly blind trials the small numbers of trials and the use of small numbers of carcasses of the various size classes of bats and birds
It is important to note that the limitations summarised here vary according to the species in question and that their effects have less influence for large birds than they do for bats and small birds If the species of concern
54 Investigation of post-construction mortality monitoring at Victorian wind farms
at a particular site is a large-bodied bird a current search regime may have the ability to adequately detect it but that is unlikely to be the case for a small-bodied species
The potential to improve overall detection capacity appears to be limited to increasing the amount of sampling Improvements to the design of monitoring programs would thus entail greater search frequency effort and intensity and searching of greater numbers of turbines The current practices are labour-intensive and costly and improvements intended to increase detection rates would inevitably entail additional effort and cost
There were some identification issues in the data provided with incorrect species being listed (eg for one species of freetail bat see Table 1 footnote) or descriptive terms being used (eg lsquoa green grass parrotrsquo) In addition many individuals were identified only to genus level or could not be identified at all From the data available to us it is not possible to determine whether the identification issues were due to lack of expertise of the people doing the searches or identifications or due to only partial remains that lacked diagnostic features being available
52 Estimation of total wind farm mortalities The factors influencing carcass detection involve uncertainties that significantly limit the ability to calculate precise estimates of total annual collision mortality for a wind farm Unless many carcasses are found for a particular species it is not presently possible to provide estimates of total mortalities without very large credible intervals around mean values In many cases the credible intervals are so large that the utility of the estimates themselves becomes questionable
Limitations on estimating total numbers of mortalities are largely due to uncertainties associated with carcass detection The mathematics used for such estimations is well developed however despite this our estimates and uncertainty levels differed from those presented in the BAMM reports even though they were based on the same raw data Therefore the underlying assumptions made must have differed It is important that all assumptions are clearly documented to enable a transparent understanding of the factors influencing the mortality estimates
53 Population and cumulative impact assessment
In order to determine the effects of bird and bat collisions on the populations of any species it is first necessary to understand the population dynamics of the animal Modelling with methods like PVA can be used only when there is a relatively high level of demographic information available for the species in question Such information includes background rates of age- and sex-specific survivorship and mortality density dependence and measures of population stochasticity But information sufficient to run PVA is unlikely to be available for many species of Victorian birds and bats This knowledge gap is a major limitation for determining whether collision mortalities result in a negative impact on populations of key species of concern
To date with the exception of the Interim Guidelines for Brolgas (DSE 2012) monitoring programs and the calculation of total mortalities for individual wind farms has been undertaken in the absence of uniform standards for any part of the relevant processes This represents a significant limitation on determining the possible effects particularly the cumulative effects of multiple wind farms on populations because at present the data from the various sites are not compatible and the results are not comparable A set of uniform standards is vital if understanding of collision effects is to be improved
Before the cumulative effect of a newly proposed wind farm can be considered it is first necessary for the effects of all other relevant wind farms to be quantified to a consistent standard and to be available At present they are not readily available If cumulative impact assessment is to be pursued it will be necessary for government or the wind energy industry to establish and maintain a central coordinated repository for all relevant information
Investigation of post-construction mortality monitoring at Victorian wind farms 55
6 Future potential options for assessing the impact of wind
farms on birds and bats
It is apparent from the current analysis of the existing post-mortality monitoring data that based on the quality and quantity of data collected to date it is very difficult to obtain accurate estimates of the total number of mortalities caused by collisions with wind turbines Therefore changes to the existing approach are required if improvements are sought
There are a range of options for future assessments of the impacts of wind farms on birds and bats We outline seven potential approaches and discuss the advantages and disadvantages of each in Table 18 This comparison only considers the advantages and disadvantages from the perspective of the data requirements and the degree to which the subsequent analysis can support valid conclusions and does not consider broader issues in detail There are likely to be differing resource implications associated with each option and we have not included these in the table below It may be more feasible to address some of the options on an industry-wide basis rather than at each individual wind farm
Table 18 The advantages and disadvantages of potential future options for assessing the impact of collisions of birds and bats at wind farms in Victoria
No Option Advantages Disadvantages
1 No post-construction mortality monitoring is required at individual wind farms with the assumption that there is either no significant impact on birds and bats from collisions with wind turbines or that careful placement of wind farms during the planning stage can avoid significant impacts
Reduces resource requirements for both developers and regulators
Contrary to the implied assumption there may be significant impacts on some species which would go undetected
Unable to detect totally unexpected impacts
Relies on having extensive understanding of the important areas for key species to facilitate an lsquoavoid and minimisersquo approach
Would be unable to quantify any impact so would not be able to use an offset approach
No ability to determine cumulative or population-level impacts
2 Continue the practice of BAM Plans and post-construction mortality monitoring (with broad sampling for a wide range of species) but increase efforts to ensure it is done adequately and comprehensively with the wind farms managing the
Continues to provide some mortality information to contribute to the overall understanding of which species are being killed
Provides information on both non-threatened species and threatened species not solely on species on the lsquospecies of
Even with greater guidance and oversight by DELWP based on the current experience where data collection is often not undertaken in adherence with permit conditions or best-practice guidelines it is likely that there will remain variability in the quality and completeness of the data collected
56 Investigation of post-construction mortality monitoring at Victorian wind farms
No Option Advantages Disadvantages
data collection and analysis to a set of uniform standards under guidance from DELWP
concernrsquo list to inform future reassessments of species at risk from wind farms
High risk that at least some of the searcher efficiency trials would not be undertaken as blind trials (although some BAM Plans currently specify that trials are to be blind it appears they are not truly blind) resulting in lower confidence in this aspect of the analysis
Difficulty in obtaining accurate estimates of overall mortalities due to risk of insufficient sampling since DELWP may only be able to provide guidance and not be able to enforce compliance
Mortality analysis could continue to be done in varying ways making it difficult to compare results between wind farms and it may not always be done to DELWP standards despite the provision of extra guidance
Sampling effort not necessarily targeted to the key species of concern and hence less effective in obtaining reliable mortality estimates of these species
It will remain difficult to estimate cumulative and population-level impacts
An efficient sampling design would need to be developed to facilitate each wind farmrsquos collection of data to a uniform set of standards that would be incorporated into BAM Plans to be approved by the responsible authority
3 Continue the practice of BAM Plans and post-construction mortality monitoring (with broad sampling for a wide range of species) but with DELWP undertaking the mortality analysis based on data collected by the
Analysis would be undertaken to a high standard and with consistency across all wind farms leading to greater confidence in the findings
Potential for there still to be a wide range in data quality and completeness if the data continues to be collected by the wind farm operators as illustrated by the present analysis even with greater guidance
Investigation of post-construction mortality monitoring at Victorian wind farms 57
No Option Advantages Disadvantages
wind farms but to DELWPrsquos specifications This would provide consistency in analysis and greater guidance on data collection to improve its quality
Greater likelihood of transparency should there be insufficient data to make valid conclusions if the analysis is carried out by DELWP than by the wind farm operators
Risk that at least some of the searcher efficiency trials would not be undertaken as blind trials resulting in lower confidence in this aspect of the analysis
Difficulty in obtaining accurate estimates of overall mortalities due to risk of insufficient sampling since DELWP may only be able to provide guidance and not be able to enforce compliance
Sampling effort not necessarily targeted at the key species of concern and hence less effective in obtaining reliable mortality estimates of these species
Will remain difficult to estimate cumulative and population-level impacts
An efficient sampling design would need to be developed to facilitate each wind farm to collect data to a uniform set of standards that would be incorporated into BAM Plans to be approved by the responsible authority
4 Continue to undertake post-construction mortality monitoring (with broad sampling for a wide range of species) but DELWP to undertake both the data collection and analysis of mortality rates through DELWP
Can ensure data is collected comprehensively to a high and uniform standard
Can ensure data is analysed rigorously consistently and to a high standard with all assumptions fully documented and a clear indication of the level of uncertainty in the conclusions
Likely to get a much clearer indication of true mortality rates providing greater confidence in assessments of impact
DELWP would need to develop an efficient sampling strategy for each wind farm
Sampling effort not necessarily targeted at the key species of concern and hence less effective in obtaining reliable mortality estimates of these species
Will remain difficult to estimate cumulative and population-level impacts
58 Investigation of post-construction mortality monitoring at Victorian wind farms
No Option Advantages Disadvantages
5 Modify the current practice of post-construction mortality monitoring to target just the key species of concern and only require monitoring at those wind farms where there is a risk for these species (Note that this approach has started to be used in some areas of
Victoria) This would require DELWP to specify the species of concern and to map the regions in which monitoring would be needed for each species
NB This approach could be applied to the collection and analysis of data using any of options 2 3 or 4 above with their advantages and disadvantages being additional to those outlined here
Monitoring can be more targeted to focus primarily on the species of concern in the areas where they are at most risk
Will still have the capacity to detect mortalities of species not of concern at wind farms where monitoring is undertaken if this information is recorded This would maintain some capacity to provide a lsquowatching briefrsquo over such species
Potential reduction in resource requirements for both the wind industry and DELWP
Requires a good knowledge of the key risk areas for each species of concern to enable the mapping of regions in which monitoring is required
If knowledge is incomplete and monitoring is not undertaken in areas where species of concern are in fact being impacted such impacts will go undetected and hence unmitigated
If threatened species considered to be at lower risk (and hence not on the list of species of concern) are being killed more often than expected this is likely to go undetected hence this data would not be available for future reassessments of species of concern
6 Replace the current approach of each individual wind farm undertaking mortality assessments with a comprehensive investigation of a selected sample of wind farms The investigation would be designed and managed by DELWP or an independent research body to a set of uniform standards The investigation would be designed to answer key agreed questions about the effects of turbine collisions Its intention would be to inform future decisions about the significance or otherwise of effects on populations of a sample of species and may need to include investigation of
Intention would be lsquoone-offrsquo studies aimed at answering key questions on a selection of key species to inform future planning decisions
Can ensure data is collected comprehensively to a high and uniform standard
Can ensure data is analysed rigorously consistently and to a high standard with all assumptions fully documented and a clear indication of the level of uncertainty in the conclusions
Likely to get a much clearer indication of true mortality rates and of the factors increasing the risk of collisions allowing
Selected study sites may miss some important species or some species that may later emerge as being of concern or important areas for those species
Likely that not all species of concern would be able to be studied in this level of detail and hence limited data would be available on the non-studied species
Relevance of results may change as wind energy technology develops
Substantial research effort required especially to obtain population information
Investigation of post-construction mortality monitoring at Victorian wind farms 59
No Option Advantages Disadvantages
demographics of selected species
greater confidence in assessments of impact
7 Replace the current approach of each individual wind farm undertaking mortality assessments with a centrally designed and implemented landscape approach to assess population trends and all causes of mortality for each of the species of concern
Could place mortalities from wind farms into context in relation to other threats
If done comprehensively could be less subjective than individual wind farm mortality estimates based on the current level of sampling
It would be difficult to isolate any declines in populations due to wind farm mortalities from those caused by other threats
Demographic and population-level data is lacking for many species reducing the ability to undertake PVA (or similar analyses) needed to assess overall population trends
Likely to be time lags between when mortalities occur and when declines are detectable in the population trend data
Likely to not be sensitive enough to detect localised significant impacts when considered at a statewide scale negating the ability to consider mitigations at individual wind farms
An individually designed landscape-scale monitoring program would need to be developed for each species of concern requiring in an extensive amount of work in the design data collection and data analysis stages
Seasonal and year-to-year variability in population numbers would need to be considered so as to factor in natural fluctuations (such as due to drought or seasonal activity patterns) thus requiring very long-term data collection
It is clear from Table 18 that there are a range of advantages and disadvantages to each option However the options that are likely to provide the highest quality data and hence give the greatest confidence in the mortality estimates for the widest range of species are those in which DELWP (or equivalent independent organisation) undertakes both the data collection and analysis (ie options 4 and 6) If a greater focus were to be given to the species of concern (ie combining option 5 with option 4) this would enable a more targeted data collection approach with the available resources being directed more effectively to these species However this would require a good understanding of the risk profile throughout the distribution of each species of concern which is not always available Where this is not available a precautionary
60 Investigation of post-construction mortality monitoring at Victorian wind farms
approach would be needed whereby any areas of potential risk would need to be considered for surveying All these approaches would require an increase in both the quantity and quality of the data collected during mortality assessments An example of the level of detail required is provided in Appendix 2
The approach outlined in option 6 of undertaking detailed studies on a limited number of species to address key knowledge gaps would greatly improve understanding of the impacts on those species but it may not be possible to study each species of concern at this level of intensity There is therefore a trade-off between understanding more about some species but little about others as opposed to obtaining a lower but more consistent level of information about all species of concern
The final option (option 7) is an alternative centralised approach with the aim of enabling land-use change impacts to be detected at the site region and landscape scales for key species of concern This would be a marked departure from the current approach and would require extensive consideration prior to any implementation If such an approach was to be considered the following principles would be required for an effective and workable program
A robust statistically valid sampling design would be required
Each species of concern would require its own sampling design because each species will occur in different areas and at different densities have different sampling requirements and be subject to different broader threats
Consistent standardised sampling methods would be required for each species
Variables that would enable assessment of changes in population numbers over time would need to be determined and measured
A power analysis would be needed to determine how much sampling would be required in order to detect a pre-determined rate of decline with a specified level of accuracy
The sampling design would need to factor in seasonal and yearly variation in activity patterns or numbers of individuals when determining population trends
A large sampling effort would be needed to detect changes at site region and landscape scales
Much greater information would be required on population parameters population trends and demographic variables because this is currently lacking for most species
There would be a need to assess the impact of other threats in order to put the impact of wind farms into context which could require further detailed studies
Investigation of post-construction mortality monitoring at Victorian wind farms 61
7 Key knowledge gaps
While our understanding of the risks of wind farm developments to birds and bats through turbine collisions has improved there remains much to be learnt before we have a full understanding of the impacts The gaps in our knowledge fall into three categories
First we need a more comprehensive understanding of the rate at which species especially key species of concern are being killed by collisions with wind turbines The analysis undertaken in this report has highlighted a number of gaps inadequacies and inconsistencies in the existing data collection and analysis process Improving this process would enable more confidence in annual mortality estimates and a clearer understanding of how many birds and bats are being killed
Second there remain many unanswered questions as to why these species are being killed what the key risk factors are and why some species are being killed more than others Having a greater understanding of these risk factors would enable wind farms to be sited or operated in such a way as to reduce the risk
Third we need a greater understanding of the impact of the annual mortalities on the viability of populations of species of concern factoring in cumulative impacts as well as population-level impacts This would enable the impacts from wind farms to be put into context with other threats to the species and indicate whether wind farms are putting greater stress on the conservation of threatened species and increasing their risk of extinction However for many species of concern there will be limited data available on which to base a PVA and expert elicitation may be required to provide estimates for some parameters However even with incomplete information developing PVAs can help to identify where the key knowledge gaps are so that future data collection can focus on these areas to enable subsequent versions of the models to be based on actual data While expert elicitation can be useful where data is lacking there are often high levels of uncertainty within this data thus reducing confidence in the findings from the models
Some of the key knowledge gaps within each of these three categories are outlined below
1 Improving estimates of annual mortality rates
Improved understanding of the full range of species impacted ndash while there is currently a long list of species that have been recorded killed this is not necessarily a complete list because not all individuals are found during mortality searches
Increased knowledge of the numbers of individuals killed by improving searcher efficiency and carcass persistence trials because both factors have a key impact on the uncertainty in estimates of annual mortality rates Knowledge of how detectability varies based on different substrates across different seasons (in which the vegetation density and height may vary) and between dogs and human searchers is needed As part of this it is critical to undertake blind trials
Increased understanding of carcass persistence rates and how this varies seasonally in different habitats across different wind farms and under different pest management regimes
Specific mortality assessments focused on addressing some of the key risk factors (see category 2) may be a more effective approach than broadscale mortality monitoring For example for the Southern Bent-wing Bat intensive mortality monitoring could be undertaken closer to key roost sites with sampling radiating out from these sites to determine the relationship between distance from a roost cave and mortality rates or undertaken more intensively during specific high-risk weather conditions
Greater understanding of the variability in mortality rates across the range of key species of concern especially for those species that congregate in large numbers in parts of the landscape For example some of the operating wind farms are outside the range of Southern Bent-wing Bats others are within the range but not close to key roost sites whereas some are near key roosts The expected mortality rates for this species are likely to vary markedly across these wind farms
62 Investigation of post-construction mortality monitoring at Victorian wind farms
Assessment of the numbers of birds or bats that are hit but flung outside the search area or are injured but die away from the vicinity of the turbines
2 Improving understanding of why individuals are being killed and what the key risk factors are
A greater understanding of the key areas within the range of species of concern to identify where there could be a greater risk to the species ndash for example where are the key roostingnesting sites where are the key foraging areas and what are the movement pathways between foraging and roostingnesting sites Developing a lsquoheat maprsquo showing the most important areas for each species of concern would be beneficial
Understanding how the pattern of use of these key areas changes seasonally based on resource availability for species that occupy different areas seasonally This information could also have a longer-term element based on changes between years For example in drought years animals may be concentrated at the remaining wetlands much more than in wetter years
Understanding nightlydaily activity patterns and whether some species are more at risk during certain weather conditions For example bats are less likely to fly in very windy conditions which may influence collision rates
Behaviour around turbines ndash some species may be attracted to the turbines as potential roosts or navigational markers whereas other species may avoid areas containing turbines thus reducing their collision risk but potentially resulting in restricting access to some areas of habitat Undertaking well-planned and strategic activity monitoring in conjunction with mortality monitoring would help to distinguish between whether a species is not being found dead because it is not using the area or is present but is avoiding being killed
Gaining an understanding of what a changing mortality rate may mean at a wind farm If there is a decline in mortalities over time is this a result of animals learning to avoid the turbines or due to the resident animals being killed with no recruitment leaving no animals left to be found during mortality monitoring
A greater understanding of flight heights and how these vary with habitat types in which turbines are sited would improve understanding of collision risks
How far from key habitat types (such as preferred roost or forage areas) do species fly Is there a standard buffer distance that could be applied to turbines thus keeping them apart from potential foraging habitat
Investigating why some species are more susceptible to collision risks than others that fly at similar heights This has been investigated to some extent interstate and overseas and there may be variation between bird guilds (Hull et al 2013) and between the sensory perceptions of different taxa (Martin 2011) It remains an area of substantial potential investigation for Victorian fauna
3 Improving understanding of population-level impacts
There is currently limited information available on population sizes and population trends for many of the key species of concern however such information is critical for understanding population-level impacts due to wind farms
PVAs can model trends in population numbers over time under different scenarios and help to put into context the mortality rates associated with wind farm collisions However for many species key demographic information will be lacking (eg survival rates for each cohort and sex fecundity rate longevity dispersal capability population growth rate) as will the impact of threats their responses to management actions and the use and availability of key habitat resources Where this information is lacking expert elicitation can provide a best guess however there is no substitute for real data and PVAs developed just using expert elicitation are likely to have high levels of uncertainty
Investigation of post-construction mortality monitoring at Victorian wind farms 63
PVAs can however be a useful tool with these being refined as new data becomes available The initial development of PVAs for the key species of concern should be seen as a first step in improving understanding of population-level impacts It is highly likely that there will be large areas of uncertainty in these models even if some data is available The models however will be useful for identifying the areas of greatest uncertainty which can then be the focus of targeted data collection in order to improve the models The models will only be as good as the data on which they are built and if there is a high level of uncertainty in the data going into the models the model output will reflect this
64 Investigation of post-construction mortality monitoring at Victorian wind farms
8 References and selected further reading
Abadi F Gimenez O Arlettaz R and Schaub M (2010) An assessment of integrated population models bias accuracy and violation of the assumption of independence Ecology 91 7ndash14
Baerwald EF DrsquoAmours GH Klug BJ and Barclay RMR (2008) Barotrauma is a significant cause of bat fatalities at wind turbines Current Biology 18(16) 695ndash696
Bastos R Pinhancos A Santos M Fernandes RF Vicente JR Morinha F Honrado JP Travassos P Barros P and Cabral JA (2016) Evaluating the regional cumulative impact of wind farms on birds how can spatially explicit dynamic modelling improve impact assessments and monitoring Journal of Applied Ecology 53 1330ndash1340
Besbeas P Freeman SN Morgan BJT and Catchpole EA (2002) Integrating markndashrecapturendashrecovery and census data to estimate animal abundance and demographic parameters Biometrics 58 540ndash547
Brooks SP King R and Morgan BJT (2004) A Bayesian approach to combining animal abundance and demographic data Animal Biodiversity and Conservation 27 515ndash529
Buumlrkner P-C (2017) brms An R Package for Bayesian Multilevel Models Using Stan Journal of Statistical Software 80(1) 1ndash28 doi1018637jssv080i01
Department of Environment Land Water and Planning (DELWP) (2017) Policy and Planning Guidelines for Development of Wind Energy Facilities in Victoria The State of Victoria
Department of Sustainability and Environment (2012) Interim guidelines for the assessment avoidance mitigation and offsetting of potential wind farm impacts on the Victorian Brolga population Revision 1 February 2012 Victorian Government Department of Sustainability and Environment Melbourne Victoria
Department of Sustainability and Environment (DSE) (2013) Advisory List of Threatened Vertebrate Fauna in Victoria Department of Sustainability and Environment Melbourne
Diffendorfer JE Beston JA Merrill MD Stanton JC Corum MD Loss SR Thogmartin WE Johnson DH Erickson RA and Heist KW (2015) Preliminary methodology to assess the national and regional impact of US wind energy development on birds and bats US Geological Survey Scientific Investigations Report 2015ndash5066 httpdxdoiorg103133sir20155066
Diffendorfer JE Beston JA Merrill MD Stanton JC Corum MD Loss SR Thogmartin WE Johnson DH Erickson RA and Heist KW (2017) A method to assess the population-level consequences of wind energy facilities on bird and bat species In Koumlppel J (Ed) Wind Energy and Wildlife Interactions Presentations from the CWW2015 Conference pp 65ndash76 Springer Cham Switzerland
Dillingham PW and Fletcher D (2008) Estimating the ability of birds to sustain additional human-caused mortalities using a simple decision rule and allometric relationships Biological Conservation 141 1783ndash1792
Dillingham PW and Fletcher M (2011) Potential biological removal of albatrosses and petrels with minimal demographic information Biological Conservation 144 1885ndash1894
Frick WF Baerwald EF Pollock JF Barclay RMR Szymanski JA Weller TJ Russell AL Loeb SC Medellin RA and McGuire JP (2017) Fatalities at wind turbines may threaten population viability of a migratory bat Biological Conservation 209 172ndash177
Gilpin ME and Souleacute ME (1986) Minimum viable populations processes of species extinction In Souleacute ME (Ed) Conservation Biology The Science of Scarcity and Diversity pp 19ndash34 Sinauer Associates Sunderland MA USA
Goodale MW and Milman A (2016) Cumulative adverse effects of offshore wind energy development on wildlife Journal of Environmental Planning and Management 59(1) 1ndash21
Hull CL and Muir S (2010) Search areas for monitoring bird and bat carcasses at wind farms using a Monte-Carlo model Australasian Journal of Environmental Management 17 77ndash87
Investigation of post-construction mortality monitoring at Victorian wind farms 65
Hull C Stark E and Muir S (2014) Indirect (disturbance) impact of wind farms on birds can it be measured Presentation to New Zealand Wind Energy Conference 2014 httpwwwwindenergyorgnzstoredoc2014NZWEC_CindyHullpdf
Hull CL Stark EM Peruzzo S and Sims CC (2013) Avian collisions at two wind farms in Tasmania Australia taxonomic and ecological characteristics of colliders versus noncolliders New Zealand Journal of Zoology 40(1) 47ndash62
Huso M Dalthorp D and Korner-Nievergelt F (2017) Statistical principles of post-construction fatality monitoring Perrow MR (Ed) Wildlife and Wind Farms Conflicts and Solutions Vol 2 Onshore Monitoring and Mitigation pp 84ndash102 Pelagic Publishing Exeter UK
Kahlert J Petersen I K Fox A D Desholm M and Clausager I (2004) Investigations of birds during construction and operation of Nysted offshore wind farm at Roslashdsand Annual status report 2003 82 pp NERI Report Roslashnde National Environmental Research Institute Denmark
Keacutery M and Schaub M (2012) Bayesian Population Analysis Using WinBUGS A Hierarchical Perspective Academic Press Waltham USA
Landscape Design Associates (2000) Cumulative effects of wind turbines Vol 3 Report on results of consultations on cumulative effects of wind turbines on birds Report for New and Renewable Energy Programme ETSU for Department of Trade and Industry UK
Lehnert LS Kramer-Schadt S Schonborn S Lindecke O Niermann I and Voigt CC (2014) Wind farm facilities in Germany kill noctule bats from near and far PLoS ONE 9(8) e103106 doi 101371journalpone0103106
Leopold MF Boonman M Collier MP Davaasuren N Fijn RC Gyimesi A de Jong J Jongbloed RH Jonge Poerink B Kleyheeg-Hartman JC Krijgsveld KL Lagerveld S Lensink R Poot MJM van der Wal JT and Scholl M (2014) A first approach to deal with cumulative effects on birds and bats of offshore wind farms and other human activities in the southern North Sea IMARES Report C16614
Lumsden LF Moloney PD and Smales I (2019) Developing a science-based approach to defining key species of birds and bats of concern for wind farm developments in Victoria Arthur Rylah Institute for Environmental Research Technical ReportSeries No 301 Department of Environment Land Water and Planning
Martin GR (2011) Understanding bird collisions with man-made objects a sensory ecology approach Ibis 153 239ndash254
Masden EA Fox AD Furness RW Bullman R and Haydon DT (2010) Cumulative impact assessments and birdwind farm interactions developing a conceptual framework Environmental Impact Assessment Review 30(1) 1ndash7
Masden EA Haydon DT Fox AD Furness RW Bullman R and Desholm M (2009) Barriers to movement impacts of wind farms on migrating birds ICES Journal of Marine Science 66 746ndash753 httpswwwresearchgatenetpublication249284301_Barriers_to_movement_Impacts_of_wind_farms_on_migrating_birds
Masden EA McCluskie A Owen E and Langston RHW (2014) Renewable energy developments in an uncertain world the case of offshore wind and birds in the UK Marine Policy 51 169ndash172
Mathews F Swindells M Goodhead R August TA Hardman P Linton DM and Hosken DJ (2013) Effectiveness of search dogs compared with human observers in locating bat carcasses at wind-turbine sites a blinded randomized trial Wildlife Society Bulletin 37(1) 34ndash40 doi101002wsb256
McCarthy M (2008) A model of population viability to assess impacts of wind farms on the Victorian Brolga population Final report 24 June 2008
Miller RG Gong G and Muntildeoz A (1981) Survival Analysis Wiley New York
Natural England (2012) The Planning Act 2008 The infrastructure planning (Examination procedure) Rules 2010 Triton Knoll Wind Farm Order Application Annex C Expert Report on Ornithology by Dr Alex Banks httpinfrastructureplanninginspectorategovukprojectseast-midlandstriton-knoll-offshore-wind-farmipcsection=docsampstage=4ampfilter=Written+Representations (accessed 24 February 2016)
66 Investigation of post-construction mortality monitoring at Victorian wind farms
Pearce-Higgins JW Stephen L Langston RHW and Bright JA (2008) Assessing the cumulative impacts of wind farms on peatland birds a case study of golden plover Pluvialis apricaria in Scotland Mires and Peat 4 1ndash13
R Core Team (2018) R A Language and Environment for Statistical Computing R Foundation for Statistical Computing Vienna Austria httpswwwR-projectorg
Rollins KE Meyerholz DK Johnson GD Capparella AP and Loew SS (2012) A forensic investigation into the etiology of bat mortality at a wind farm barotrauma or traumatic injury Veterinary Pathology 49(2) 362ndash371
Schaub M and Abadi F (2011) Integrated population models a novel analysis framework for deeper insights into population dynamics Journal of Ornithology 152 (Suppl 1) 227ndash237
Scottish Natural Heritage (2012) Guidance note ndash assessing the cumulative impacts of onshore wind energy developments httpswwwnaturescotassessing-cumulative-impact-onshore-wind-energy-developments
Smales I (2017) Modelling of collision risk and populations In Perrow MR (Ed) Wildlife and Wind Farms Conflicts and Solutions Vol 2 Onshore Monitoring and Mitigation pp 58ndash83 Pelagic Publishing Exeter UK
Smales I Muir S and Meredith C (2006) Modelled cumulative impacts on the orange-bellied parrot of wind farms across the speciesrsquo range in southeastern Australia Biosis Research report to the Australian Government Department of Environment and Heritage httpwwwenvironmentgovausystemfilesresources2d42fcbd-31ea-4739-b109-b420571338a3fileswind-farm-bird-riskpdf [accessed January 2007]
Smallwood KS (2007) Estimating wind turbine-caused bird mortality Journal of Wildlife Management 71(8) 2781ndash2791 httpwwwjstororgstable4496403
Su Y-S and Yajima M (2015) R2jags Using R to Run lsquoJagsrsquo httpsCRANR-projectorgpackage=R2jags
Sugimoto H and Matsuda H (2011) Collision risk of white-fronted geese with wind turbines Ornithological Science 10 61ndash71
Wade PR (1998) Calculating limits to the allowable human-caused mortality of cetaceans and pinnepeds Marine Mammal Science 14 1ndash37
Investigation of post-construction mortality monitoring at Victorian wind farms 67
9 Appendices
Appendix 1 Bat and Avifauna Management Plan requirements Extract from Example permit conditions for a wind energy facility (DELWP 2017)
Bats and Avifauna Management Plan
36 The Environmental Management Plan must include a Bat and Avifauna Management Plan (BAM Plan) which must
a include a statement of the objectives and overall strategy for minimising bird and bat strike arising from the operation of the facility
b include a mortality monitoring program of at least two years duration that commences when the first turbine is commissioned or such other time approved by DELWP (Environment Portfolio) The monitoring program must include
i procedures for reporting any bird and bat strikes to DELWP (Environment Portfolio) monthly
ii information on the efficacy of searches for carcasses of birds and bats and where practicable information on the rate of removal of carcases by scavengers so that correction factors can be determined to enable calculations of the likely total number of mortalities and
iii procedures for the regular removal of carcasses likely to attract raptors to areas near turbines
c be approved by DELWP (Environment Portfolio) prior to submission to the responsible authority
37 When the monitoring program required under the BAM Plan is complete the operator must submit a report to the responsible authority and DELWP (Environment Portfolio) setting out the findings of the program The report must be
a to the satisfaction of the responsible authority and DELWP (Environment Portfolio)
b made publicly available on the operatorrsquos website
38 After considering the report submitted under condition 37 and consulting with DELWP (Environment Portfolio) the responsible authority may direct the operator to conduct further investigation of impacts on birds and bats The further investigation must be undertaken by the wind energy facility operator to the satisfaction of the responsible authority and DELWP (Environment Portfolio)
68 Investigation of post-construction mortality monitoring at Victorian wind farms
Appendix 2 Data requirements for effective estimation of annual mortality rates The following list outlines the level of detail required to enable comprehensive rigorous analysis of annual mortality rates at wind farms in Victoria
This list was sent to request raw data from the six wind farms that were considered to potentially have sufficient data to warrant more detailed analysis for this project This request was sent in August 2017 to six wind farms (A B C D E and F)
Data required for an assessment of existing post-construction mortality monitoring data at Victorian wind farms
The following data is required to evaluate the effectiveness of the existing post-construction mortality monitoring data in estimating annual mortalities of birds and bats at wind farms
The required data is split into five categories
1 Turbine details ndash details of the location size and proximity to wildlife habitat for each turbine within a wind farm development
2 Searcher efficiency trials ndash details of each searcher trial undertaken with different carcass types
3 Carcass persistence trials ndash details of methods used and results of trials
4 Mortality surveys ndash details of methods used and findings
5 Incidental finds of carcasses outside of the mortality surveys
An excel spreadsheet is provided outlining the preferred format for the provision of data The information requested is provided in more detail below
Turbine details
For each turbine on each wind farm the following details are required
Turbine identification number
GPS location
Description of location of turbine ndash such as if turbine is located on edge or in the centre of the array availability of bird or bat habitat nearby eg native vegetation or scattered paddock trees wetlands
Blade length
Minimum swept height (metres above ground)
Maximum swept height (metres above ground)
Height of base
Hardstand area (square metres)
Date the turbine commenced operations
Turbine lit ndash if the turbine has lights and if it was lit during the previous month
Searcher efficiency trials
For each time searcher trials were undertaken at a wind farm the following information is required
Date of trial
Weather conditions on day of trial
Blind trial ndash were searchers aware that a trial was being undertaken on that day If aware of the trial were they aware of the number of carcasses
Investigation of post-construction mortality monitoring at Victorian wind farms 69
Name of the searcher
If a dog was used provide the name of the dog
Search transect ndash include total area searched distance walked and time spent searching and the number of turbines searched Was it done as part of the normal mortality survey or specifically as a trial Were the carcasses randomly spread To what distance from the base were they spread
For each type of carcass ndash large bird medium bird small bird and bat ndash provide the following
o Carcass ndash what species was used to simulate the carcass type
o Vegetation type (the density of the vegetation will influence detectability so it would be useful to determine detectability for a range of vegetation types)
Bare ground
Short or sparse vegetation ndash eg short grass
Long or dense vegetation ndash eg long grass or heath
o Number of carcasses deployed and the number found in each vegetation type
Carcass persistence trials
For each carcass used in a carcass persistence trial at a wind farm provide the following information
The category of carcass ndash ie large bird medium bird small bird bat
Carcass ndash the species of carcass
The date the carcass was put in place
The turbine it was closest to
Vegetation ndash virtually none short or sparse vegetation dense or long vegetation
Pest control etc ndash date and details of any pest control that could impact carcass persistence rates eg rabbit control fox baiting or other activities such as lambing under turbines carrion removal
The number of days the carcass was checked and frequency of checks
For each check
o Date
o Weather ndash general weather conditions since previous check ndash eg temperature and rainfall (as these will affect decomposition rates)
o Condition of carcass ndash eg intact partly scavenged remnants only (eg feathers) or completely removed
Mortality surveys
For each mortality survey undertaken at a wind farm provide the following data ndash include all surveys irrespective of whether carcasses were located
Date of survey
The number of turbines searched
Were turbines cleared of existing carcasses prior to commencement of scheduled searches If so how many days prior to the search
Pest control etc ndash date and details of any pest control that could impact observation rates eg rabbit control fox baiting or other activities such as lambing under turbines carrion removal
Weather conditions on the day of the survey
For each individual turbine searched
70 Investigation of post-construction mortality monitoring at Victorian wind farms
o Turbine number
o Searcherrsquos name
o Dogrsquos name if used
o Search method ndash describe the search method including duration of search transect width shape of search area distance out from base if GPS track was taken etc
o Search area ndash estimated total area searched in square metres
o of area searched that was bare ground
o of area searched that was short or sparse vegetation
o of area that was long or dense vegetation
o The percentage of time the turbine was operational over the past 5 days
o The percentage of time the turbine was operational over the past 30 days
o Total number of carcasses detected in this search at this turbine
o For each carcass
Species
Condition ndash injured intact carcass partial remains scavenged feathers only etc
Vegetation within general vicinity of carcass ndash bare ground short or sparse vegetation dense or long vegetation
GPS location
Distance to turbine base
Direction to turbine base (bearing)
Carcass identifier ndash who identified the species
Incidental finds
For any incidental finds outside of mortality surveys provide subset of above data
Turbine number
Date
Searcher
Species
Condition ndash injured intact carcass partial remains scavenged feathers only etc
Vegetation within general vicinity of carcass ndash bare ground short or sparse vegetation dense or long vegetation
GPS location
Distance to turbine base
Direction to turbine base (bearing)
Carcass identifier ndash who identified the species
Fate of carcass ndash was it removed or left in place to be included in mortality surveys
Investigation of post-construction mortality monitoring at Victorian wind farms 71
Appendix 3 Additional detail on the modelling approach for determining mortality rates Bayesian models allow for the possibility that a species is killed but not detected in the surveys (Keacutery and Schaub 2012) The formulation we used assumed that underlying mortality for each species followed a negative binomial distribution that the carcass persistence rate hazard rate followed a Weibull distribution and that the detection rate of the carcasses that remained followed a Bernoulli distribution Difference between searchers and between turbines were treated as random effects A Bayesian model using the equation outlined in section 253 (1) as the basis of the model was formulated using the following set of equations and distributions
119883 sim Pois 120583 120601 2
119884 sim Bern 119901 3
119879 sim Weibull 119903 120578 4
120583 120582 D ℎ
365 5
120601 119901 119878 6
logit 119901 120572 120598 7
119878 120564 120596
D 8
120596 Pr 119879 119896 9
log 120578 120573 120598 10
ℎ sim Gamma 120575 120575 11
120598 sim 119873 0 120590 12
120598 sim 119873 0 120590 13
From the turbine surveys 119883 is the number of individuals of species 119894 that were detected at observation 119895 120582
is the mortality rate for species 119894 per turbine per year From the searcher efficiency trials 119884 is 1 if the
carcass was detected and 0 if it wasnrsquot and 119901 is the probability that an individual of species 119894 is detected by
the searcher at observation 119895 From the carcass persistence trials 119879 is the time it takes for the carcass to
disappear
72 Investigation of post-construction mortality monitoring at Victorian wind farms
Appendix 4 Model estimates for the combined searcher and carcass persistence trials using the data from the four wind farms for which raw data was available Table A41 The searcher efficiency trial model estimates (on logit scale) combined for the four wind farms for which raw data was available Lower and upper bounds refer to the bounds of the 95 credible intervals for the estimate
Effect Parameter Estimate Lower bound
Upper bound
Fixed Bat detection using humans 0298 -2037 2499
Fixed Difference between bird and bat detection using humans
2029 1243 2805
Fixed Difference in bat detection between dogs and humans
0690 -2264 3761
Fixed Additional difference between bird detection using dogs and bat detection using humans compared with previous two estimates
-1499 -2704 -0251
Random sd Searcher 0740 0080 2000
Random sd Wind farm 0930 0020 4850
Table A42 The carcass persistence trial model estimates (on logarithmic scale) for the four wind farms where the raw data was available Lower and upper bounds refer to the bounds of the 95 credible intervals for the estimate
Effect Parameter Estimate Lower bound
Upper bound
Fixed Mean time to total disappearance for bats 2037 1594 2486
Fixed Difference between birds and bats for the mean time to total-disappearance
1440 1093 1787
Random sd Wind farm 0230 0010 1020
Random sd Turbine 0180 0010 0460
Shape 0720 0650 0790
Investigation of post-construction mortality monitoring at Victorian wind farms 73
Appendix 5 Parameter estimates for the searcher efficiency and carcass persistence trials at Wind Farm A and Wind Farm B Table A51 The parameter estimates for the searcher efficiency and carcass persistence rates from Wind Farm A Lower and upper bounds refer to the bounds of the 95 credible intervals for the estimate Detection estimates are in logistic scale non-shape carcass persistence estimates are in logarithmic scale
Model Estimate Estimate Lower bound
Upper bound
Detection Bat 0762 -0702 2384
Detection Difference between small bird amp bat -0235 -2151 1874
Detection Difference between medium bird amp bat 1794 0314 3635
Detection Difference between large bird amp bat 2269 0592 4473
Carcass persistence Bat -1810 -2572 -0889
Carcass persistence Difference between small bird amp bat -3184 -4772 -1955
Carcass persistence Difference between medium bird amp bat -2481 -3416 -1621
Carcass persistence Difference between large bird amp bat -1133 -3752 0837
Carcass persistence Shape parameter for bat 0911 0615 1193
Carcass persistence Shape parameter for small bird 1060 0619 1531
Carcass persistence Shape parameter for medium bird 0813 0577 1066
Carcass persistence Shape parameter for large bird 0336 0007 0954
Table A52 The parameter estimates for the searcher efficiency and carcass persistence rates from Wind Farm B Lower and upper bounds refer to the bounds of the 95 credible intervals for the estimate Detection estimates are in logistic scale non-shape carcass persistence estimates are in logarithmic scale
Model Estimate Estimate Lower bound
Upper bound
Detection Bat 0171 -0984 1236
Detection Difference between small bird amp bat 0848 -0343 1896
Detection Difference between medium bird amp bat 3432 2158 4608
Detection Difference between large bird amp bat 4546 3515 5000
Carcass persistence Bat -1328 -1945 -0731
Carcass persistence Difference between small bird amp bat -0954 -1560 -0350
Carcass persistence Difference between medium bird amp bat -1290 -1801 -0803
Carcass persistence Difference between large bird amp bat -4439 -5000 -3414
Carcass persistence Shape parameter for bat 0883 0699 1105
Carcass persistence Shape parameter for small bird 0887 0708 1102
Carcass persistence Shape parameter for medium bird 0717 0605 0838
Carcass persistence Shape parameter for large bird 0915 0630 1197
wwwdelwpvicgovau
wwwarivicgovau