aries cost account documentation - · aries cost account documentation ... current and future...
TRANSCRIPT

University of California, San Diego UCSD-CER-13-01
Center for Energy Research University of California, San Diego 9500 Gilman Drive La Jolla, CA 92093-0417
ARIES Cost Account Documentation
L. M. Waganer
June 2013

1
ARIES Cost Account Documentation
Purpose The purpose of this paper is to document the historical economic basis for the ARIES Systems Code costing analyses and develop/document an updated economic model for use in the Systems Code for future systems studies.
Background The costing information in prior fusion studies are used in this analysis to help understand and develop a better costing basis for the current and future fusion conceptual power plant studies. The Starfire conceptual design1 (1980) is the most detailed and best documented conceptual design and cost basis to date. The power plant had a very large power core, with high thermal output, relatively low thermal efficiency, and a net power of 1200 MWe. The Generomak reports2,3 (1986 & 1988) developed a basis for a parametric power plant design with modeling algorithms based largely on Starfire and a few other fusion conceptual plant designs. In 1992, four IFE power plant designs were completed, Prometheus-L4, Prometheus-HI4, Osiris5, and Sombrero5. An advisory commission for DOE developed a common set of costing guidelines for all four power plants to make sure all cost estimates were comparable and consistent. These studies are useful because the costing basis was well documented. Although these were inertial fusion energy (IFE) designs, much of the BOP and other systems are relevant to magnetic fusion energy (MFE). In the mid 90’s, the ARIES Project6 began a series of conceptual designs and costing analyses for fusion power plants, primarily commercial 10th-of-a-kind plants. These conceptual designs and cost data can be found on the ARIES web site6. ARIES adopted much of the prior costing guidelines and bases for their usage, primarily from the Starfire and Generomak studies. The ARIES designs are fairly consistent, design to design, but the level of detail and documentation of the cost basis has been somewhat lacking. ARIES-SPPS7 final report provided some additional costing algorithms that were applied to the ARIES series of designs.
Historical Cost Escalation Every cost estimate has to be relative to some particular time frame. All fusion conceptual studies with an associated cost estimate always related their estimate to a particular calendar year. Any prior estimate that was used for a cost scaling by analogy or similarity has been updated using some form of escalation factor. All capital costs (both direct and indirect) were referenced to a particular year, which was usually defined to be the start of construction. This is because all subcontracts are typically estimated at the start of construction. These total costs at the start of construction costs (overnight costs) are then escalated (to account for cost of money during construction including interest and escalation) and these costs are included as a part of the indirect costs.
There are several common measures of escalation that can be used. These are either very general to the entire economy (or some portion of the economy) or those specific to some sub-element of the economy, such as labor or construction materials. At the level of conceptual design studies, it

2
is more appropriate to adopt a general national escalation index, such as the U.S. Commerce Department Gross Domestic Product8 (GDP), which is a measure of the output of goods and services produced by labor and property located in the United States. These metrics are reported in current dollars and “real” dollars. Dividing the current dollars by the real dollars yields the GDP Implicit Price Deflator (IPD) that is currently normalized to the calendar year 2005 (BEA updated the base year in July 2009). The GDP IPD values for any two years can be used escalate or deflate a prior estimate basis to a different year basis. This approach will be used to adjust estimates in this paper, as well as being used in the ARIES and many prior fusion studies. Table 1 displays the current (circa, July 27, 2012) U.S. GDP IPD values for years from 1970 to 2011. The value assumed for 2012 is presently estimated to be a 2.0% increase by the author that reflects mid-year 2012 economics. Note, the yearly increase in the IPD is assumed to be a measure of annual inflation. The cost estimate bases provided in this document are usually given in both the year originally estimated as well as the common basis of 2009$.

3
Table 1. U.S. Gross Domestic Product Implicit Price Deflator8
Year IPD 1970 24.337 1971 25.554 1972 26.657 1973 28.137 1974 30.692 1975 33.591 1976 35.519 1977 37.783 1978 40.435 1979 43.798 1980 47.791 1981 52.269 1982 55.460 1983 57.652 1984 59.817 1985 61.629 1986 62.991 1987 64.820 1988 67.045 1989 69.577 1990 72.261 1991 74.824 1992 76.598 1993 78.291 1994 79.940 1995 81.606 1996 83.160 1997 84.628 1998 85.584 1999 86.842 2000 88.723 2001 90.727 2002 92.196 2003 94.135 2004 96.786 2005 100.000 2006 103.231 2007 106.227 2008 108.582 2009 109.530 2010 110.992 2011 113.359 2012 115.360

4
General Cost Account Information Predating the early fusion power plant conceptual designs, DOE commissioned Pacific Northwest Laboratory to define the standard cost accounts to be used to provide consistent data for the future power plant designs. This report, “Fusion Reactor Design Studies – Standard Cost Estimates”9 (1978), provided a common cost reporting format to assess the character of the fusion power plants. It was intended to aid designers in the preparation of the concept costs and to provide policy makers with a tool to appraise the more economically promising concepts using capital costs, operating costs and busbar electricity costs. All the cost accounts were defined, including the direct and the indirect costs, the operating costs and the cost of electricity (COE) elements. This cost account format has been used in all the MFE and IFE power plant design studies since this report was published.
Direct and Indirect Capital Costs The direct capital cost categories originally included in PNL report9 only had Accounts 20-26 as shown in Table 2, however the ARIES project6 felt the Heat Rejection Equipment account needed to be elevated to a higher level and included it as Account 25 with elevation of subsequent accounts. The earlier Starfire cost report1 generally followed the PNL recommendation of cost accounts. The Generomak report2,3 and ARIES project6 added more definition to the Indirect Capital Cost Accounts with the separation of the categories of Home and Field Engineering and Services and the addition of Process and Project Contingency. Specific definition of the items included in each account and the modeling of these accounts are discussed in following text sections.
Table 2. List of Cost Accounts Applicable to Fusion Power Plants Original Accounts9 Updated ARIES6 List of Accounts Direct Capital Cost Accounts Land and Land Rights (20) Land and Land Rights (20) Structures and Site Facilities (21) Structures and Site Facilities (21) Reactor Plant Equipment (22) Power Core Equipment (22) Turbine Plant Equipment (23) Turbine Plant Equipment (23) Electric Plant Equipment (24) Electric Plant Equipment (24) Heat Rejection Equipment (25) Miscellaneous Plant Equipment (25) Miscellaneous Plant Equipment (26) Special Materials (26) Special Materials (27)
Total Direct Cost (TDC) (90)
Indirect Capital Cost Accounts Constr. Facilities, Equip. and Serv. (91) Constr. Facilities, Equip. and Serv. (91) Engr. and Constr. Mgmt. Services (92) Home Office Engr and Services (92) Other (Owners) Costs (93) Field Office Engr and Services (93)
Owners Costs (94) Interest during Construction (94) Process (Design) Contingency (95) Escalation during Construction (95) Project Contingency (96) Interest during Construction (97) Escalation during Construction (98) Total Project Capital Cost (99)

5
The prior list of major accounts, shown in Table 2, is sufficiently complete and detailed to enable an economic assessment of any fusion power plant conceptual design. The more difficult element is the development of costing algorithms to estimate (or predict) the cost of a commercial fusion power plant component, subsystem or system that would be representative of a 10th of a kind (10th OAK) elements at some 50-80 years from the time the study report is published.
In the following sections, historical algorithms that were developed for each cost element will be reexamined and, if not sufficient, new ones developed. These new costing algorithms are defined in this document and are highlighted in light green. In 2007, L. Waganer updated the complete fusion cost accounts for ARIES to be more descriptive by revising the titles and account content to be more functional. For example, Account 22, Reactor Plant Equipment became Power Core Equipment and Account, 22.01, Reactor Equipment became Fusion Energy Capture and Conversion. The new fusion power plant cost account listing, down to 3 and 4 digit levels, have been adopted by the ARIES Studies project and this listing is provided in Appendix A, “New Recommended Cost Accounts.xls”.
In addition to the major direct, indirect and annual cost accounts, there are a few other general cost elements that need to be clarified, such as Spare Parts, Contingency and Level of Safety Assurance, which are discussed below.
Spare Parts The PNL report9 included provisions for spare parts at each major cost account level. No amount guidelines were provided, however the report did provide example spare parts allowances at 0.5% and 1% for the major accounts. The Starfire economic section1 provided an overall spare parts allowance at the 21 through 25 account level, specifically 2% for Accounts 21, 22, and 23, 4% for Account 24 and 3% for Account 25. The reported numbers in the Starfire report do not exactly equate to these values, so the reported numbers probably did not include the installation labor charges. Starfire recognized additional significant cost items in the Reactor Plant Equipment account that needed to be included in initial spares and these were addressed in the Starfire report1, Table 22.41. Those initial Starfire spares allowance of $50.69 M (1980$) or $116.18 M (2009$) for the power plant equipment were in addition to the nominal 2% allowance. Subsequent conceptual designs did not consider such additional spare parts except for the regularly replaced blanket and divertor replacements (in Account 50). Instead they included the spare parts in the initial cost of each sub-account, such as 21.xx, 22.xx, etc. It is recommended that ARIES include the nominal initial spare parts allowance in each of the major cost elements, which was done, but not as a separate account at the end of each major cost category, per Starfire. An allowance for routine spares is included in the Operations and Maintenance costs, Scheduled Component Replacement. The replacement spares for the more expensive and routinely replaced component replacement parts, such as the first wall, blanket, shield, and divertor modules are also included in Operating Cost Accounts.

6
Contingency The PNL report9 included provisions for contingency at each major cost account level, however its example the report included 10% for every account. Starfire1 and EBTR10 followed the same procedure and used a value 15% as a contingency allowance at each major cost account level. The early ARIES studies removed all major account contingencies and combined them into two indirect accounts, Account 95, Process Contingency, at 5% of total direct cost (TDC) and Account 96, Project Contingency, at 10% of TDC. In later ARIES studies, the Process Contingency was set to zero to reflect that all the process risk had been mitigated as the design should be representative of a 10th OAK.
Level of Safety Assurance The ESECOM11 and Generomak12 reports introduced the concept of Safety Assurance credits for buildings, power plant components, and indirect cost factors. As a cost basis, the Generomak study used much of the Starfire report1 cost estimates, primarily because it was the most extensively documented at that time. The Generomak and ESECOM (Senior Committee on Environmental, Safety, and Economic Aspects of Magnetic Fusion Energy) reports developed a Level of Safety Assurance (LSA) methodology, which allowed comparison of plants with different levels of inherent safety and hazards with respect to radioactive materials. Four levels of LSA were created as defined below for the direct capital costs in Table 3. Table 3. Level of Safety Assurance (LSA) Definitions11,12
LSA = 4 Denotes active protection (i.e., active engineered safety systems are required); the system does not meet minimum requirements for inherent safety. LSA = 3 Safety is assured by passive mechanisms of release limitation as long as severe violations of small-scale geometry are avoided (e.g., large coolant pipe breaks).
LSA = 2 Safety is assured by passive mechanisms as long as severe reconfiguration of large-scale geometry is avoided.
LSA = 1 Safety is assured by passive mechanisms of release limitation for any accident sequence; radioactive inventories and material properties preclude fatal release regardless of power plant’s condition.
The Generomak primary authors, Jerry Delene and John Sheffield, generated numerical LSA factors that applied to all direct and indirect costs, nominally with LSA = 4 associated with the current PRW and BWR N-Stamped designs. The direct capital cost factors at highest level accounts are shown in Table 4. As the LSA levels decreased and the level of passive safety increased, it was reasoned that the design, fabrication, quality assurance documentation, and the indirect labor could be decreased, therefore the direct and indirect costs could be reduced. Some systems had no decrease, but others might see as much as 40% reduction going from LSA of 4 to 1.
ARIES adopted this LSA methodology of quantifying the benefits of designing inherently safe plant concepts for many years. Listed below are the recommended LSA factors for the plant direct costs. The LSA factors for the indirect costs are shown in the section on indirect costs.

7
Table 4. ARIES LSA Factors for Plant Direct Cost Accounts Acct. Account Title LSA=1 LSA=2 LSA=3 LSA=4
20 Land and Land Rights 1.00 1.00 1.00 1.00 21 Structures & Site Facilities Power Core & Hot Cell Buildings 0.60 0.90 0.96 1.00 Turbine –Generator Building 1.00 1.00 1.00 1.00 Other Structures & Improvements 0.60 0.67 0.67 1.00 22 Power Core Equipment Fusion Energy Capture & Conversion 0.90 0.95 1.00 1.00 Plasma Confinement (TF, PF, CF) 0.90 0.95 1.00 1.00 Heat Transfer & Transport w/IHX (really need an intermediate loop) or He w/Double-Walled SG (Rankine) 0.60 1.00 1.00 1.00 Or, Heat Transfer & Trnspt, Other options 0.90 1.00 1.00 1.00 All Other Power Core Equipment 0.85 0.94 0.94 1.00 23 Turbine Plant Equipment 1.00 1.00 1.00 1.00 24 Electrical Plant Equipment 0.75 0.84 0.84 1.00 25 Heat Rejection Plant Equipment 1.00 1.00 1.00 1.00 26 Miscellaneous Plant Equipment 0.85 0.90 0.93 1.00 All Other Direct Cost Accounts 1.00 1.00 1.00 1.00
The cost bases for the Land and Land Rights (20), Structures and Site Facilities (21), Turbine Plant Equipment (23), Electric Plant Equipment, and Miscellaneous Plant Equipment (26) were generally derived from similar, then-current BWR and PWR power plants. This was the basis for the suggested cost algorithms published in the PNL report13, “Fusion Reactor Design Studies – Standard Unit Costs and Cost Scaling Rules”. Starfire1 built upon that database and had detailed facilities conceptual designs developed by the Ralph M. Parsons Company, which drew from their fission plant experience. Generomak and the early ARIES studies adopted most, if not all, the prior Starfire cost database, supplemented with the LSA methodology.
In 2010, the ARIES project decided to forgo the LSA factors and only estimate a baseline cost for each subsystem and system. If is felt that all new fusion plant designs will have requirements that impose strict environmental and hazardous waste limitations, so all new designs would inherently have to meet the essence of the LSA 1 criterion. Additionally, the ARIES project intends to apply additional cost factors on specific safety related subsystems to reflect the higher cost of these systems. At the present time, these additional cost factors have not been identified. When historical ARIES and Generomak algorithms are identified in the text, they are considered to be for an LSA of 4, unless specifically noted.
Detailed Capital Cost Accounts The cost accounting format used henceforth in the ARIES design studies conforms to the updated cost accounts shown in Appendix A of this document. This cost account systems is similar in content to that used by MFE in the most recent design studies, ARIES studies and several other MFE and IFE design studies. However, this new account format is arranged in a more functional manner with some relocation and renaming of former cost accounts. This format will assist in evaluating the plant systems relative cost impact. This will also allow commonalty
8
in comparison of other alternative energy concepts. The accounts reflect all the systems and facilities required to produce steady-state busbar electricity, thus energy storage systems are not considered.
The following sections will present a synopsis and rationale of the supporting cost basis for the presented costs. At the end of each algorithm discussion, a resultant cost will be provided to help validate the ARIES Systems Code using the ARIES-AT14 parameters.
Land and Land Rights, Account 20 The cost of the land, land rights, and relocation of buildings are the major costs in this account. The reference plant site was chosen to be 1000 acres in a Midwestern location, see the PNL report9, Appendix A, for more site details including topography, site access, population density, cooling water, public utility services, metrology/climatology, geology/seismology and sewage and radioactive waste disposal (subject to more current data). The land requirements for fusion power plants are less severe than for an LWR in regard to exclusion boundaries, therefore 1000 acres are deemed adequate. In the case of constructing multiple power plants at the common site, it is felt that sufficient space is provided. The cost associated with the land and privilege acquisition is estimated at 1000 acres times the cost per acre.
Most of the prior fusion studies estimated the cost of land escalating with general land values for a Midwestern site. Starfire1 assumed the 1000-A site and a land cost of $3000/A (in 1980$). Prometheus4 was estimated to need 2000 A (due to lengthy driver system) with a land cost of $5000/A in 1980 costs. ARIES-AT14 assumed a $10.589 M (1992$) land cost for their plant, probably with 1000A and a related land cost of $10,000/A. Using a nominal site of 1000 A and escalating the land value to 2009$, this equates to an escalated cost of $6876/A for Starfire1, $8694 for Generomak2,3, $7,319/1000 A for Prometheus-HI& L4 and $14,299 for ARIES-AT.
A comparison of 2006 good cropland values along the Missouri or Mississippi rivers were in the range of $2500/A to $3000/A in 2009$. Assuming there would be a sizable premium to obtain a contiguous site of 1000 A with water and land access, it is reasonable to assume that the current land price would be $20,000/A in 2009$. Further, it is assumed that plant sizes in excess of 1000 MWe would require slightly more land, this would suggest a land acreage scaling of (net electrical power/1000)0.3. Thus doubling of the plant capacity would require a 23% larger site size. The cost of Land and Privilege Acquisition, C20.01 is $20 M (number of site acres x $20,000/A) x (Pnet/1000)0.3 (in 2009$). The value of the land is really a non-depreciable asset, however following the recommendations in PNL report9, the cost of land will be treated as a depreciating asset to simplify the economic analysis.
The cost of the initial clearing of the land, demolition of existing structures and relocation of buildings, highways and railroads has been typically estimated to be 10% of the land cost. However, environmental concerns have increased these costs along with higher earth moving costs. Therefore it is recommended that the cost of land clearing, land preparation, and site access be increased to 20% of Account 20.01, i.e. C20.02 ~ $4.0 M. This is a reasonable value assuming the topography and site characteristics are amenable to the power plant requirements and the site access, i.e., roads, railway and barge facilities, are adequate. River access is mentioned above.
C20 = $24.0 M

9
Structures and Site Facilities, Account 21 This account covers all direct costs associated with the dedicated physical plant buildings such as power core, turbine, electrical equipment, cooling system structures, site improvements and facilities, miscellaneous structures and building work, and ventilation stack. All provisions for cooling, site access and security will be provided. The total cost will be the summation of the sub-accounts in this account, C21.
The facility is located in a secured area within the site as defined by Shulte9. The site is adjacent to the "North River" which supplies adequate water for cooling purposes. The river is assumed to be navigable by barge traffic throughout the year to provide a means to ship in the large modules and equipment. Highway access is also provided by eight kilometers of secondary road leading to a state highway. The secondary road requires no improvement to permit overland shipments. Railroad access will be provided by constructing a five-mile railroad spur from the main line to the plant site. Other site-related assumptions have been established as follows:
• Incoming power will be provided by two independent EHV power sources, probably 345-kV or high voltage lines.
• Power and water for construction are available at the site boundary.
• Communication lines will be provided at the site boundary.
• Sanitary sewage system will be available for tie-in at the site boundary.
• An auxiliary boiler furnishing plant auxiliary steam is included in the facility design.
• Plant utility systems including compressed air, inert gas storage and distribution, and portable and de-mineralized water are included in the facility design.
• Personnel parking will be located outside the facility perimeter close to the guard station that will control incoming and outgoing personnel, vehicles and rail cars.
• The facility will be located on level ground at an elevation unaffected by potential flooding.
• Seismic criteria Uniform Building Code, Zone 2, will be assumed for all structures.
The Starfire project1 hired Ralph M Parsons Company (RMP) to develop the design of the major building and develop supporting cost estimates. This cost basis is the most detailed that is available. The cost basis and assumptions used by RMP in this Account 21 and Accounts 23, 24 and 25 are as follows:
1. Major equipment costs are based on vendor quotations or on historical data for similar equipment. Quotations were received on the steam turbine-generator, condenser, heat exchangers, cooling tower and pumps, and other major mechanical equipment. Quotations for major electrical equipment and building services equipment were also received.
2. Concrete quantities were developed from takeoffs of the conceptual design drawings. Electrical and piping quantities were estimated from the single-line diagram, flow diagrams, and building layouts.
3. Pricing of bulk materials is based on the Kansas City, Missouri location.
10
4. The labor rates and fringe benefits for each craft were compiled from the union wage rates for the Kansas City, Missouri, area effective at the date of the Starfire project. The escalated craft labor rates and fringe benefit amounts for health and welfare, vacation, pension, apprentice training and other fringes, plus percentage allowance for Federal and State payroll taxes, employer-paid portion of the Social Security tax, and Workers Compensation, are compiled and summed to develop a total labor rate for each craft. The total labor rate for each craft and the Parsons standard composite crew mix breakdown for each class of work (as defined by the account codes used in the estimate) were used to develop a composite labor rate for each account code work classification. These crew mix composite labor rates were used in the estimate to determine the estimated labor costs.
5. The overall labor productivity factor used in this study results from an evaluation of the various factors affecting the productivity of labor, such as project site, working conditions, quality, and availability of labor. This evaluation reflects recent experience at approximately 20 large nuclear facility construction sites where productivity has varied from 30 to 50%. The value used in this study is 50%. Productivity associated with the construction of nuclear facilities has been steadily decreasing over the past two decades. However, it is felt that fusion has the opportunity and the requirement to pioneer new construction techniques, products and assembly procedures to lower the required man-hours and enhance the associated labor productivity.
6. The contingency allowance is to cover unknown costs and conditions, such as weather, labor problems, lack of firm pricing and the state of the design package (conceptual). An amount of 15% of the total cost was allocated for the contingency. A spare parts allowance was included at 2% of the subcontract and materials costs.
The direct cost for the Structures and Site Facilities represents a very significant portion of the total facility cost and maybe higher than that for a comparable PWR. However the cost increases can be identified and are reasonable. The Power Core Building much larger than a PWR containment building, but contains more equipment and must contain the generated tritium. The remote handling features in the Power Core and Hot Cell Building contributes to the buildings size and cost increase. The Fuel Handling and Storage (Tritium Reprocessing) Building is an additive factor as is the handling and containment of tritium. The premise that this facility should have very low release rates of tritium, low material activation and a very high factor of safety, greatly impacts the overall facility cost. The Hot Cell is another facility which is additive to a PWR system. Because of the large sizes of the components and large number of components handled within the Hot Cell, a large building is required.
Site Improvements and Facilities, Account 21.01
This account includes all site improvements and facilities necessary for the complete power plant. This includes the general site improvements including site work, fencing, storm sewer, earth moving equipment, tank and pump foundations, fire protection, and sanitary sewers. Transportation access is provided by highway and railway access, but no waterfront improvements were considered. In fusion conceptual studies, this is typically a fixed cost.
The prior estimates for this account, when escalated to 2009$, are Starfire at $25.54 M, Generomak at $25.74 M, Prometheus-L at $30.74 M and ARIES-AT at $26.75 M. Note that ARIES-AT used an LSA factor of 1.0 for Account 21.01 as compared to higher LSA numbers (lower factors) for the remainder of the Structures and Site Facilities Account. It is thought this
11
Site Improvement and Facilities account only scales weakly with land size, as evidenced by the moderately higher price for the Prometheus4 2000 A estimate. It is assumed that the cost of the site improvements and facilities should be $27 M x (site acres/1000 A)0.2. (Additional details on cost elements under this account are available in the Starfire or Prometheus reports).
C21.01 = $27.00 M.
Power Core Building, Account 21.02
The ARIES-AT Power Core Building (previously the Reactor Building) is a reasonably compact building design, namely a right circular cylinder that is 25.4 m inner radius, 28.0 m outer radius and a height of 54.3 m, with an inner volume of 110,000 m3 including a lower level coolant drain room that is circular, 12.5 m in radius and 8.7 m high. The main power core walls are 2.6 m thick for radiation shielding. This wall thickness is greater than prior fusion power plant designs to satisfy increased biological safety concerns. The volume to the exterior of the power core walls is about 140,000 m3. The maintenance corridor is included in these volumes as is the major component maintenance area above the power core. This latter area would be a moderate radiation zone used for unplanned vertical remote replacement of the major power core components. This building, as well as the Hot cell Building, has Atmospheric Tritium Recovery System (ATRS) units to cleanup tritium in the event of a leak or accident.
Several other fusion conceptual power plant designs were considered in determining the selected cost basis for Account 21.02, namely, Starfire, Generomak, Prometheus-L/-HI, ARIES-SPPS, and ARIES-AT. These have a range of volumes and related costs. Table 5 below contains the basic building volume and cost data. Figure 1 below allows a better visualization of the relative effects. Starfire was a very large power core building with a lot of lay-down space for power core components inside the Power Core Building. Its cost, determined by R. M. Parsons Company, was based on then-recent designs. Since that time, the tokamak power cores have become smaller and the power core buildings more compact. For comparison, the Prometheus-L and –HI and Osiris design data are also provided. The laser power core building for Prometheus-L is almost double the volume of the large Starfire design, but the cost per unit volume is the lowest of the buildings (less stringent design requirements). Prometheus designs used the scaling relationship of $283.88 M*Vol+$37.33 M in 2009$, which is a much more aggressive cost estimate (lower relative cost). The Prometheus constant cost of $37.33 M is due to a base cost associated with any size power core building. Osiris is a very low cost building, but is expensive per unit volume. In Figure 1 below, the volumes and costs of these six cost estimates are plotted, which illustrate a wide diversity of costs/volume.

12
Table 5. Comparison of Power Core Building Volume and Cost
Figure 1. Power Core Building Cost vs. Volume In the early 90’s, Ron Miller, of the early ARIES Project, started modeling the buildings, and evidently used the cost/unit volume of the Starfire power core building as a starting point, but applied a scaling factor of .62 on a normalized building volume of 80,000 m3. In 2008, Ron Miller15 updated this ARIES-AT power core building cost algorithm to be (Cost 21.02 = $111.661 M*(Vol/80,000)0.62) (presumably with an LSA=4) (in 2009$). The ARIES code internally calculates the Power Core Building costs separately, but these costs are not reported separately and are integrated within the Account 21 data. (Access to hidden code files indicated the power core building was $93.87 M in 1992$ or $137.41 M (in 2009$).) The ARIES algorithm lays between the Starfire and the Prometheus/Osiris algorithms. For the Power Core Building, LSA values are 0.6 and 0.9 for LSA values of 1 and 2 respectively. It is felt that these nominal costs are conservative enough without applying LSA factors to reduce them as there is a trend to have thicker walls for neutron shielding (Starfire and early ARIES designs had a wall thicknesses of 1.5 m and now it is 2.6 m). It is recommended that ARIES continue with the current ARIES costing algorithm ($111.661 M*(Vol/80,000)0.62) (with no LSA factor) for the Power Core Building, which estimates the building cost to be $157.98 M using the exterior dimensions. There is an existing building volume relationship that needs to be defined for each power core building design. LSA factors will not be used.
C21.02 = $157.98 M
13
Turbine – Generator Building, Account 21.03
The Turbine-Generator Building may be the largest building in the facility complex, except for the Power Core Building. It houses the turbines and all the auxiliary equipment for the turbines. The surface condenser may be located on the sub-grade level, the feed-water heaters on the ground level and the turbine generator on the upper level. The steel-framed, truss-roofed building is of a conventional construction consistent with current power plant installations. The steam generators or main heat exchangers are probably located in this building.
The Starfire Turbine-Generator building was estimated by The RM. Parsons Company, an A&E firm, at $35.92 M ($80$) or $82.33 M (09$).
All Prometheus Turbine-Generator building costs were developed by the Ebasco Company. The cost scaling relationship was adopted from ARIES and normalized for the Ebasco laser and HI turbine building costs, C = $53.9 M x (Pe gross/1246) 0.5 scaling to the gross electrical power (in 1991$) or $78.90 M x (Pe gross/1246) 0.5 (in 2009$). The Prometheus L and H designs had gross electrical powers of 1382 and 1189 MWe, respectively, and costs of $56.77 M in 1991$ (the published value was $57.18 M, which was an error) and $52.65 M in 1991$ (published value was $52.79 M, which was an error) for the laser and heavy ion options, respectively. Scaled to 2009$, these costs are $83.10 M and $77.07 M, respectively. If this algorithm were the basis, the ARIES-AT turbine – generator building would be $76.44 M (in 2009$).
The Generomak Turbine - Generator Building estimate is $47.8 M (1986$) or $83.12 M (2009$). The Generomak scaling3 of the Turbine Building was based on Starfire cost estimate, but it used the ratio of the gross thermal power, normalized to 4085 MW and this ratio raised to the 0.5 power. It is felt that the most relevant scaling parameter is the gross electric power, not the gross thermal power.
The ARIES Turbine – Generator Building cost scaling algorithm was been normalized to gross electrical power raised to the 0.75 power as documented by C. Bathke, et. al, ARIES II-IV Final Report, Systems Studies Chapter16 (1992). That ARIES costing relationship, was updated by Miller15 in 2008, continued to use the gross electrical power scaled to 0.75 power plus a constant value, C21.03 = 43.798 M * (Pe gross/1200)0.75 + 8.737 in 2009$. This yielded an ARIES-AT cost of $51.70 M in 2009$.
In Table 6, below, the cost bases of the different designs and respective costs for the turbine – generator building are summarized. On the bottom line of the table, all algorithms for each design are evaluated with the ARIES-AT parameters. Both Starfire and Prometheus used engineer/contractor firms to provide bottoms-up estimates, which would provide a high fidelity solution (both are in the $80 M class). Prometheus and ARIES used gross electrical power which is a good scaling parameter. Since it is the largest building, second only to the power core building, it is recommended ARIES adopt the Prometheus scaling relationship, C21.03 = $78.90 M x (Pe gross/1246) 0.5(in 2009$). This results in an ARIES-AT cost of $76.44 M in 2009$.
C21.03 = $76.44 M

14
Table 6. Comparison of Turbine Building Parameters and Costs
+++++++++++++++++++++++++++++++++++++++++ Heat Rejection Structures and Facilities (Account 21.04) This account has also been referred to as the Cooling Systems Structures. These structures support the heat rejection systems. The Cooling Towers are not included in this account, rather are covered in Account 23.03, Heat Rejection Systems. The main elements in this account are the Intake Structures, the Discharge Structures, the Unpressurized Intake and Discharge Conduits, the Recirculating Structures, and the Cooling Tower Earth Work.
The Starfire cost estimate is $7.96 M (1980$) and $18.243 M (2009$) and no scaling algorithms were used – instead they were based on prior Parson quotes. The Generomak assumed a scaling relationship related to gross thermal power raised to the 0.5 power. A more appropriate scaling relationship would be related to the power dissipated in the cooling system, which is gross thermal power less gross electrical power or gross thermal power times 1- the thermal conversion efficiency. Prometheus adopted the following scaling relationship, $16.804 M *((Pth*(1-eff))/1860)0.5 (in 2009$). ARIES-AT used $17.831 M*(Pe net/1000)0.3 (in 2009$) (LSA=4). The cooling function is only related to the net electrical power if the thermal conversion efficiency and all recirculating power are constant for all cases and conceptual plant designs being considered. Regardless of the algorithm used, all estimates are in the range of $11 M to $19 M. It is recommended to employ the Prometheus algorithm as it is related to the more appropriate parameter and produces reasonable values. This algorithm results in a cost of $11.11 M for ARIES-AT. The much lower cost is related to the high thermal efficiency (less power handled) as compared the Prometheus base case.
C21.04 =$16.804 M x (thermal power * (1-thermal efficiency)/1860)0.5
Or, C21.04 =$16.804 M x (thermal power –gross electrical power)/1860)0.5
C21.04 = $11.11 M
Electrical Equipment and Power Supply Building (Account 21.05) This building is a multi-story structure that houses the power supplies for all the magnetic coils, heating, current drive, and other power core equipment requiring large power supplies. Included are a small maintenance, repair and storage area and a small office and control room for the electrical equipment. All escalated costs for this building are very similar for most design studies, around $21-23 M in 2009$. The Starfire value represented a quoted estimate, Generomak was scaled from Starfire according to (Pthermal)0.5 and Prometheus scaled to (Pe,net)0.3 although no specific electric equipment building is identified in Prometheus report. ARIES II-IV16 estimated the building to be a constant value of $22.878 M (LSA=4). The size of this

15
building should be dependent on the electrical power handled and the type of electrical demands. If the design is similar, either Pthermal or Pe net should be equivalent. The scaling relationship should weakly scale, therefore it is recommended that the Prometheus scaling relationship be adopted with the ARIES constant value, C21.05 = $22.878 M *(Pe net/1000)0.3 (in 2009$), which yields $22.878 M for a 1000 MWe power plant.
C21.05 = $22.88 M
Plant Auxiliary Systems Building (Account 21.06) The Plant Auxiliary Systems Building houses the HX pumps for the closed loop cooling water systems. Also located on the ground level are the chillers, pumps, instrument air equipment and a maintenance area. The upper levels might contain the air handling equipment, plenums and the HVAC equipment. Starfire estimated this building to be $7.47 M in 2009$. Generomak has the same cost as it mirrored the Starfire values. Prometheus estimates are about triple this value to $22.75 M for Prometheus –L and $21.68 M for Prometheus –Hi in 2009$. ARIES and Miller15 lump this building in a Miscellaneous Building Account 21.6, therefore no data is available for ARIES. Both the Starfire and the Prometheus costs are credible, but since the Prometheus (Ebasco) estimate is more recent, it is recommended it be adopted, C21.06= $21.96 M x (Pe
gross/1246)0.3 (in 2009$), for a total of $21.55 M for the ARIES-AT gross electrical power of 1169.6 MWe.
C21.06 = $21.55 M
Hot Cell Building (Account 21.07) The Hot Cell Building is the second most expensive building in the facility and this is related to the design, safety and maintenance approach adopted and to the high level of detail involving the hot cell operations. The safety aspects require a carbon-steel lined, concrete-hardened structure designed for Design Basis Event (DBE) seismic loading. The typical 1.5 m thick external walls will withstand tornado and turbine missiles, tornado induced differential pressures and provide adequate shielding for the activated products handled and stored in the Hot Cell.
A wide variety of maintenance and decontamination functions are being accomplished within the Hot Cell, all in a remote operations mode. The activated blanket and divertor components are transported into the Hot Cell for inspection, disassembly and recycle or disposal. All solid and liquid waste products are processed in the Hot Cell and either shipped offsite or stored on site. Also included in the Hot Cell are remote maintenance and repair shops to work on blanket and divertor and other activated power core equipment. This building, as well as the Power Core Building, has Atmospheric Tritium Recovery System (ATRS) units to cleanup tritium in the event of a leak or accident.
In many ways the Hot Cell is very similar to the Power Core Building (shielding, pressure rating, seismic, and remote maintenance) and therefore it is understandable that the cost for this building is quite high. The two highest elements are concrete and liner which total approximately 75% of the total cost.
Interestingly, in Starfire, this building was estimated with a detailed cost estimate, which resulted in a cost of $123.67 M in 2009$. Generomak has a cost of $77.03 M and Prometheus-L has $68.68 M (both in 2009$). However there are no algorithms to relate the size and the cost of the Hot Cell building to a particular parameter. Rather it is probably better related to the maintenance approach, the size of the removed components (sectors or modules) and the
16
materials to be handled. The ARIES building costs are not separable. The best approach might be to scale the cost of the hot cell to the power core building. The ratio of the volume of the Starfire Hot Cell relative to the Power Core Building is 34%, Generomak is 35%, and Prometheus is 41%. As Prometheus is the lowest cost power core building and lowest hot cell, it is tending toward a higher relative cost hot cell. The new cost algorithm estimates the ARIES-AT Power Core Building at $157.98 M. If the Hot Cell Building is estimated to be 34% (Starfire value) of the Power Core Building, the estimated cost of the Hot Cell Building would be $53.71 M. Using the higher Prometheus percentage of 41% ratio would result in an estimate of $64.77 M. The 34% number is probably adequate as there is only a minimal containment requirement, fewer building requirements and a much smaller building. Therefore it is recommended the 34% ratio of the Power Core Building be adopted for the cost of the Hot Cell Building (C21.07 = 0.34 x C21.01).
C21.07 = $53.71 M
Power Core Service Building (Account 21.08) The Power Core Service Building is a ground-level high-bay area in close proximity to the Hot Cell, the Turbine - Generator Building and the Plant Auxiliary Building. The building is a steel framed building with concrete floors supported on steel framing. A railroad spur passes through the receiving end of the building. Storage spaces for new blanket segments and process modules are provided.
There are no parametric data available for this building and all escalated costs are nearly identical around $4.309 M (in 2009$) for Starfire, Generomak, and Prometheus. Probably Starfire developed the bottoms up estimate and all others copied that value. The ARIES cost is not separable. It is recommended the cost of the Power core Service Building be normalized to a net electric power of 1000 MWe and weakly scale to that power level, $4.309 M x (Pe net/1000)0.3 (in 2009$).
C21.08 = $4.31 M
Service Water Building (Account 21.09) The Service Water Buildings (fire water storage tank pump house) and the circulating water pump house are contained in this account. These buildings contain the pumps and the chlorinating facilities. The circulating water pump house is a steel framed structure with a truss roof. The fire water storage tank pump house is a concrete-hardened structure designed for DBE seismic loading.
There are no parametric data available for this building and all escalated costs are nearly identical around $1.513 M (in 2009$) for Starfire, Generomak, and Prometheus. Probably Starfire developed the bottoms up estimate and all others copied that value. The ARIES cost is not separable. It is recommended the cost of the Service Water Building be normalized to a net power of 1000 MWe and weakly scale to that power level, $1.513 M x (Pnet/1000)0.3 (in 2009$).
C21.09 = $1.51 M

17
Fuel Handling and Storage Building (Account 21.10) The Fuel Handling and Storage (FHS) Building, also referred to as the Tritium Reprocessing Building, houses the process equipment to reclaim and purify the tritium. Deuterium is also stored in this building and the two fuels are mixed and sent to the power core. The FHS Building is separated into areas subject to tritium contamination and areas which are not. Areas subject to contamination are carbon steel-lined and are within a concrete-hardened structure similar to the Power Core Building. An airlock separates the contaminated areas from the offices, a tritium equipment control room and HVAC equipment. Again, like the Power Core and Hot Cell Buildings, the tritium area requires a lower-than-atmospheric ambient pressure of clean air. A CO2 atmosphere is not required in the FHS building. Tritium cleanup of the building atmosphere is provided by the five ATRS units. In addition to the tritium processing area, sufficient areas are provided for storage of deuterium, maintenance and repair shops and a storage room. A uranium storage bed for the tritium is also required.
The cost of this building is likely to be highly variable depending on the degree of regulatory compliance necessary for handling and accounting for tritium in the power core and in the storage. Starfire (and Generomak) had a relatively simple building at a current cost of $19.78 M in 2009$. On the other hand Prometheus-L had a cost of $68.68 in 2009$ for a fuel processing and target facility. One might think this increase is due to the IFE target fabrication and it may be. It is noted OSIRIS and SOMBRERO only estimated the cost of their target fabrication buildings to be $10.1 M in 2009$. So it is the degree of conservatism that seems to make the cost variance. It is recommended that the cost should be closer to the higher Prometheus estimate as it must contain the tritium with contamination controls, containment enclosures and air detritiation systems. So it is thought the price would be around $25 M scaled either to the tritium usage or perhaps the fusion power with a rather flat scaling, such as 0.3 exponent. Therefore the total direct cost for the building is C21.10 = $25 M x (Pfusion/1759)0.3 (in 2009$) for a cost of $25 M.
C21.10 = $25.00 M
Control Room Building (Account 21.11) The Control Room Building is located near the Administration Building and the Site Service Building. It thought to be a separate two-level hardened structure, capable of withstanding DBE seismic loads and tornado induced pressures and tornado missiles. The lower area houses the main control room, auxiliary equipment, computer equipment maintenance and repair, tools and parts storage, offices, conference rooms and electrical equipment. The upper level contains electrical and HVAC equipment and an observation gallery above the main control room. The cable spreading areas beneath the control room are used with an access flooring system for use with a multiplexed communication system.
The cost of the Control Room Building is the same in Starfire, Generomak and Prometheus, namely $7.11 M, which is the recommended value. It should be invariant over the size of the plant.
C21.11 = $7.11 M
18
On-Site AC Power Supply Building (Account 21.12) The onsite AC power is provided by two gas turbine generators housed in a one-story, hardened building. Each unit has a control room and battery room. Additional hardening is provided in the walls to stop turbine generated missiles. An adjacent two story building is required for the switchyard control equipment and the cable spreading room. The foundations are designed to meet the gas turbine manufacturer vibration specifications.
The cost of the AC Power Supply Building is roughly the same in Starfire, Generomak and Prometheus, namely $4.70 M, which is the recommended value. It should be normalized to a net power of 1000 MWe and weakly scale to that power level, $4.70 M x (Pe net/10000.3 (in 2009$).
C21.12 = $4.70 M
Administrative Building (Account 21.13) The Administration Building is a two-story structure designed to accommodate up to 60 people. It consists of a reception area, conference/display room, offices, lunchroom, electrical and HVAC equipment for both this building and the Site Service Building. It is a steel framed structure with a supported floor of concrete resting on a steel decking.
Again, the cost of the Administration Building is roughly the same in Starfire, Generomak and Prometheus, namely $2.00 M (in 2009$), which is the recommended value. It should be invariant over the size of the plant.
C21.13 = $2.00 M
Site Service Building (Account 21.14) The Site Service Building is divided into a maintenance shop and a warehouse, both servicing the balance of plant functions. The building is combined with the Administration and the Control Room Buildings and share some building services.
Again, the cost of the Site Service Building is roughly the same in Starfire, Generomak and Prometheus, namely $2.00 M (in 2009$), which is the recommended value. It should be invariant over the size of the plant.
C21.14 = $2.00 M
Cryogenic and Inert Gas Storage Building (Account 21.15) The steel-framed structure is constructed with precast concrete panel walls that contains the helium and nitrogen compressors. The remainder of the cryogenics equipment is located in a fenced-in yard adjacent to the building. An enclosed mezzanine provides space for an electrical equipment room. This is a relatively low cost building with some components outside.
The cost of the Cryogenic and Inert Gas Storage Building is roughly the same in Starfire, Generomak and Prometheus, namely $2.09 M (in 2009$), which is the recommended value. It should be invariant over the size of the plant unless the fusion power is drastically changed.
C21.15 = $2.09 M

19
Security Building (Account 21.16) The Security Building is a single-level steel- framed structure similar to the Administration Building.
The cost of the Security Building is roughly the same in Starfire and Prometheus, namely $0.71 M (in 2009$), which is the recommended value. It should be invariant over the size of the plant unless the fusion power is drastically changed.
C21.16 = $0.71 M
Ventilation Stack (Account 21.17) The Ventilation Stack provides for disposal of low-level radioactive gases above ground level. It is a steel-lined, reinforced concrete outer shell structure, 100-m high and 14 m in diameter at the base. The concrete shell is slip-formed and is supported on an octagonal foundation. In light of tightening regulations of release of radioactive gases, this account may disappear.
The cost of the Ventilation Stack is roughly the same in Starfire, Generomak and Prometheus, namely $4.15 M (in 2009$), which is the recommended value. It should be invariant over the size of the plant unless the fusion power is drastically changed.
C21.17 = $4.15 M
Summary of Structures and Site Facilities, Account 21 The new estimate results for the ARIES-AT revised cost estimating algorithms were summed to provide a total account cost of $424.25 M (in 2009$), which seems to be reasonable. This result is lower than Starfire, slightly lower than Generomak, and about midway between LSA 1 and 2 for published ARIES-AT cost estimates. The LSA factors have been a confusing and misleading factor that will not be used in the future ARIES costing. The Account 21 for ARIES-AT, LSA =1 is $363 M, ARIES-AT, LSA = 2 is $480 M and ARIES-AT, LSA = 4 is $535 M, all in 2009$. The ARIES series of designs do not publish breakouts on the Account 21 estimates, but Miller15 provided algorithms for several of the buildings, but not all.
Starfire had the most detailed structures design and definition, was the physically largest tokamak plant since 1980 and produced most net electrical power (1200 MWe vs. a nominal 1000 MWe for most plants since 1980). Since the design of Starfire, the size of the power core island, buildings and the power core has been getting more compact. Also the trend is to higher efficiency thermal conversion systems, which reduces the thermal power, but at a higher temperature. The recirculating power fraction has been going down, hence lower gross electrical power while maintaining a constant net electrical power level. Also, the plants are being designed with inherently safer materials, so building confinement costs are reduced. The other extreme from Starfire is Osiris, which is a very simple power core and very optimistic cost estimates (the power core building is only estimated at $48 M in 2009$). Based on these comparisons, the revised structures and site facilities cost estimates seem to be reasonably compatible with prior studies and current building design criteria.
C21 = $424.25 M
20
Power Core Equipment, Account 22, Formerly the Reactor Plant Equipment
This account is the heart of the fusion power facility, the power core, and includes most of the expensive capital equipment. It is comprised of both equipment that is unique to the magnetic confinement concept (e.g., first wall/blanket and magnets) and the common equipment that can be used in any type of MFE or IFE fusion plant (e.g., power supplies, waste disposal or fuel processing). In a tokamak fusion plant, this account covers the power core (first wall/blanket, divertor, shielding, vacuum vessel, magnetic coils, heating and current drive, primary structure, vacuum system, power supplies and fueling and constituent control), the main heat transfer and transport system, cryogenic cooling, radioactive handling and storage, fuel handling and storage, maintenance equipment, I&C, and other miscellaneous plant equipment. All initial spares needed upon startup are included in the basic cost of the equipment. An allowance for the lower cost routine spares is included in the Operations and Maintenance costs. The replacement spares for the more expensive and routinely replaced component replacement parts, such as the first wall, blanket, shield, and divertor modules are included in Operating Cost Accounts, specifically the Scheduled Component Replacement costs.
Fusion Energy Capture and Conversion, Account 22.01
This account contains the core systems needed for the capture, conversion, and containment of the fusion reaction products. The innermost power core components are the first wall/blankets and the divertor assemblies. These components, with today’s material knowledge, will likely be replaceable units based on the local neutron and particle erosion environment. Behind these innermost blanket modules there might be a second blanket region may be used and this component will likely be life-of-plant. Not all designs may have these life-of-plant blanket components. Immediately outward (away from the plasma) are the high temperature shields and support structures for the blankets/divertors/HT shields. The hot structure may be included in the replaceable component to serve as a unifying structural unit for the blanket, shield and divertor module. These shields and support structures are normally life of plant, although there might be cases where some portion would be replaceable or refurbished with the blanket, divertor, and HT shield assembly. The HT shield and support structure might be combined as a single unit. In addition to the shielding around the primary power core, all the penetrations, such as vacuum ducts, need additional shielding, even though the biological shielding will also intercept the remaining few neutrons. In previous fusion plant cost accounts, the vacuum vessel was accounted in the Account 22.01. However, it was felt that the vacuum vessel’s primary function is to provide a vacuum for the plasma. Therefore, the power core vacuum vessel is included in the Power Core Vacuum WBS category.
Presently, the best method of estimating the Account 22.01 costs would be to do a bottoms-up estimate, knowing the design details, materials, and fabrication processes. The design details are still in the pre-conceptual stages and it would not be possible to develop a detailed cost estimate of any particular approach. The typical cost estimating approach for conceptual design studies is to develop representative installed component costs based on a unit cost basis, in this case, dollars per kg. A table of installed component costs (and initial spares costs) is provided in Appendix B based on cost per unit mass for a 10th-of-a-kind power plant designs. Costs are developed for a range of component and subsystem complexity and manufacturing approach. These costs estimates are updated using the Commerce Department Gross Domestic Product
21
Implicit Price Level Deflators8 to current dollar estimates. Liquid or gaseous heat transfer materials will not be included in these capital costs, rather they will be accumulated in Account 27, which is assigned for materials that are provided to the power core immediately prior to startup and are not subject to long-term finance charges.
One notable trend, in the U.S., is to transition from the solid breeding blankets to the liquid breeders. The solid breeding materials are an integral part of the blanket, therefore the breeder was considered as capital cost in the first wall blanket cost account. With the transition to liquid breeders, the breeding material is now considered as a Special Material, Account 27, which is a capital cost account, as it is procured just before the power core startup. The first wall and blanket structural material may be a low-activation ferritic steel. The other candidate structural material is SiC/SiC composite material, which is currently quite expensive and lacks verifiable properties and fabrication experience. It has a positive attribute of being relatively lightweight and low activation. It is hoped that as the material is being used in more applications, the unit cost will come down significantly. As a result of these changes, the cost of the first wall and blanket subsystem has decreased for the recent generation of fusion power plants.
In a like manner, the shielding subsystems have gotten more efficient. There is a trend in the ARIES designs to design both high temperature and low temperature shielding subsystems. The high temperature shields have become more costly than the low temperature shields, but the high temperature shields have benefited from the cost improvements in the blanket materials and cooling materials. The low temperature shielding systems commonly use low activation ferritic steels, cooled with helium.
The cost of ARIES-AT Fusion Energy Capture and Conversion subsystem, Account 21.01, was reported by Najmabadi14, et. al., to be $137.78 M (LSA = 1 and 1992$) or $197.01 M in 2009$. These data are for the FW/B, shield and divertor (impurity control).
First Wall and Blanket, Replaceable, Account 22.01.01 - This subsystem is the primary energy capture and conversion subsystem for the power core. The first wall and blanket (FWB) covers the majority of the surface of the tokamak power chamber, both on the inner and the outer regions of the chamber. The FWB is typically constructed in modular form to allow thermal expansion and contraction without adverse stress and deformations of the first wall surface. These modules consist of a first wall armor and structural material that is very durable to high energy particles (minimal erosion and sputtering) and high energy neutrons (acceptable atom displacements) and is sufficiently thermally conductive to transmit the surface and volume heating to nearby heat transfer fluids in the wall or the underlying blanket. The first wall may be a single material or a composite sandwich of different materials to meet the demanding requirements. The first wall may be separately cooled by the blanket heat transfer media or conductively cooled by the blanket structure. The most likely materials for the first wall structure are ferritic steel (FS) or silicon carbide (SiC/SiC) composite structure. The plasma facing surface of the FW can either be bare structural material or it may be covered with a thin layer of a more durable armor material, such as tungsten (W).
The underlying blanket module must remove almost all the heat transferred from the first wall and the volume heat generated by neutrons thermalized in all the blanket materials and breed tritium to sustain the tritium fuel used in the DT plasma power core and system losses. The breeding material is probably lithium or a lithium compound or mixture, either in solid or liquid form. If liquid, it may be nearly stagnant (breeder only) or moving (breeder and heat transfer
22
media). The blanket material will likely be FS or SiC/SiC because they are low activation materials that will provide the longest operating lifetime while producing only low-level radioactive waste. High quality fabrication techniques will be required to ensure high reliability. The thermal heat is removed with a high temperature heat transfer media that may be the liquid lithium, lithium mixture or a separate media, such as helium. If a liquid metal is used in the blanket and shield, an insulating layer may be used to reduce the magneto-hydro-dynamic (MHD) drag. Water is not a recommended heat transfer media as its operating temperature is too low for highly efficient thermal conversion and is incompatible with the preferred liquid metal heat transfer media, thus causing safety issues. In some designs, it might be possible to include a reflector or a conducting material or structure to modify the magnetic fields.
The FW and blanket would likely be fabricated as individual modules containing all the heat transfer media plumbing and manifolding as well as all mechanical attachments to the underlying shielding components. Due to the intense high energy particle bombardment and the high energy neutron flux, the lifetime of the FWB modules are limited, presently hoped to be as much as 4 years. Therefore, the modules must be designed to be easily and quickly removable and replaceable with autonomous remote handling equipment in keeping with a very mature design and operational philosophy of a 10th OAK power plant. The tokamak double-null configuration is symmetric about the horizontal mid-plane. Hopefully there might some commonality of modules, with considerations about local penetrations. Plumbing and manifolding complicates the part similarities as does the maintenance approach.
As stated earlier, the cost estimate for the conceptual design of the commercial power plant can only be roughly estimated by using a typical installed unit cost per kilogram for a similar component or subsystem with like features, performance and material composition. Needless to say, this is not an accurate estimate for the distant future power plant, but it will provide a relative and parametric comparison to other design options and studies. For the replaceable first wall and blanket components, unit costs are provided for the first wall material and surface armor (if used), blanket structural material, breeder material (if not a breeder/coolant), insulating material (if a liquid metal coolant is used), reflector material (if used), and any conducting coils or structures. These material unit costs for this component are provided in the Appendix B (typical for ARIES-AT and prior ARIES designs). As new designs and materials are developed, new materials will be added to this appendix.
Therefore the cost of this component will be estimated by the sum of the computed mass of each component element times the unit cost of that element material.
C22.01.01 = sum of products of unit cost per mass times the mass of the component element
Second Blanket, Life of Plant, Account 22.01.02 - Some magnetic confinement fusion conceptual power plant studies have employed a second blanket subsystem behind the replaceable FWB modules. These second blankets are designed to be life-of-plant with a useful life on the order of 40 or more years. The functionality is similar to the inner blanket in that the blanket has to capture the neutron energy and thermally convert that energy into high grade heat as well as breed tritium fuel. However, there is no requirement for a first wall. Also the reduced neutron damage within the second blanket will enable a longer operational lifetime.
The structural, breeding and heat transfer materials are likely to be similar to that in the replaceable blanket module. High quality fabrication techniques will be required. Thus the same

23
table of unit material costing algorithms will apply. Tungsten could be used, un-cooled, as the conducting wall material.
The same cost estimating approach as the replaceable first wall blanket will be used on this life of plant blanket. The unit costs are provided in Appendix B for the blanket structural material, breeder material (if not a breeder/coolant), insulating material (if a liquid metal coolant is used), reflector material (if used), and any conducting coils or structures. As the need arises, new materials and blanket designs costs will be added.
The cost of this component will be estimated by the sum of the computed mass of each component element times the unit cost of that element material.
C22.01.02 = sum of products of unit cost per mass times the mass of the component element
Divertor Assembly, Replaceable, Account 22.01.03 - This divertor subsystem is located in the upper and lower regions of the plasma chamber (for a double null divertor system) where the magnetic field lines cross, sweeping out the highly charged ionized fusion products onto the divertor plates. The thermal heat flux and particle erosion is much higher than on the first wall surfaces. The heat flux is expected to be in the range of 10 MW/m2 in the divertor region with some peak heating even higher. However, the neutron flux is less severe in the divertor region. This requires a higher level of cooling capability in this region with a lesser demand on breeding. In some cases, there may be no breeding at all in the divertor regions. In most designs, materials similar to the FWB are contemplated with a more complex design approach including a robust plasma facing surface and high heat flux cooling capabilities. High quality fabrication techniques will be required to provide system reliability.
To date, there have been few divertor designs that have a high level of integration with the plasma edge physics, hence the existing divertor designs remain highly tentative and preliminary. Therefore there are no detailed cost estimates. A reasonable assumption is to assume a similar technology basis as the first wall and blanket with a higher level of complexity and capability. As an approximation, the same costing methodology as the FWB will be used with an added cost complexity factor of 1.5 at present for the divertor subsystem. As the divertor designs are more viable and validated, representative cost bases will be developed.
C22.01.03 = sum of products of FWB unit cost per mass times the mass of the component element x 1.5
High Temperature Shielding, Both Replaceable and Life of Plant, Account 22.01.04 - This shielding subsystem provides shielding for the complete plasma chamber. The FWB and divertor modules intercept the majority of the neutron energy; however there is still a significant quantity of neutrons that pass through the blanket modules and into the shield region. The intent is to capture a significant fraction of this escaping neutron energy and convert it to useful high temperature thermal energy. The back face of the blankets is at high temperature and not insulated. This is why the innermost shield is designed to run hot, at the same temperature as the blanket and transfer its thermal energy to the energy conversion system. Efficient capture of this high temperature energy maximizes the plant thermal efficiency.
In some design concepts, the amount of neutron energy escaping the blanket and entering the shield will not allow the shield to be life-of-plant, so in these cases, the HT shield will be replaceable. There may also be a second HT shield that can be life of plant.
24
In some power core designs that employ segment removal, the shield also has the requirement to serve as the hot structural element that supports all the blanket and divertor modules within the vacuum vessel. In fact, this structural element may be a stand-alone component known as a structural ring. The shield may also have conducting element to provide magnetic fields to help modify the plasma conditions.
The structural and heat transfer materials are likely to be similar to that in the replaceable blanket module, but in different proportions. To increase the shielding effectiveness, bulk shielding materials, such as boron carbide or borated ferritic steel, will be used. Some tailoring of the shielding materials will be used to accommodate the neutron flux and waste considerations. High quality fabrication techniques will be required to achieve the reliability and lifetime requirements. If a conducting wall is required in the plasma chamber wall, it may be in the inboard region of high temperature shielding modules. Tungsten could be used, cooled or un-cooled, as the conducting wall material.
The shield subsystem unit costs are provided in Appendix B for the structural material, shielding materials, insulating material (if a liquid metal coolant is used), reflector material (if used), and any conducting coils or structures. As the need arises, new materials and shield designs costs will be added.
The cost of this component will be estimated by the sum of the computed mass of each component element times the unit cost of that element material.
C22.01.04 = sum of products of unit cost per mass times the mass of the component element
Low Temperature Shielding, Life of Plant, Account 22.01.05 – In some fusion plant designs, the high temperature shield(s) does (do) not sufficiently lower the neutron flux to adequately protect the outboard chamber elements and additional shielding is needed. At this low level of neutron flux, the energy level is insufficient for high temperature operation, thus a low temperature, actively cooled shield is used. This low temperature shield maybe permanently attached to the vacuum vessel or it might be an integral part of the vacuum vessel or it might be behind the vacuum vessel. The shield may be actively or passively cooled. If actively cooled, the coolant must be compatible with other materials in the area. Additional solid shielding filler materials may also be used.
The low-temperature shield subsystem unit costs are provided in Appendix B for the structural material, shielding materials, and any cooling components. The cost of this component will be estimated by the sum of the computed mass of each component element times the unit cost of that element material.
C22.01.05 = sum of products of unit cost per mass times the mass of the component element
Penetration Shielding, Life of Plant, Low Temperature, Active and Passive, Account 22.01.06 – In addition to the shielding around the bulk of the plasma chamber, there are a multitude of openings, ducts, and pipes that could allow neutrons to escape past the blankets and shielding. These neutrons, if not intercepted, would cause damage to equipment and injury to personnel outside the primary no-access areas. Therefore, all ducts, ports, beam-lines, cooling channels/plenums must be surrounded with shielding materials. Also in the maintenance ducts, actively cooled shield plugs will be provided where possible. In the RF ports, the RF launcher modules will be equipped with shielding. Areas with high neutron flux will require active
25
cooling whereas areas further away from the plasma, passive shielding might suffice. The material algorithm table will provide cost estimate guidance.
The penetration shield subsystem unit costs are provided in Appendix B for the structural material, shielding materials, and any cooling components. The cost of this component will be estimated by the sum of the computed mass of each component element times the unit cost of that element material.
C22.01.06 = sum of products of unit cost per mass times the mass of the component element
Plasma Confinement, Account 22.02
This account was previously considered to be the Accounts 22.01.03, Magnets. The functionality remains the same, namely the coils necessary to contain, confine and shape the plasma. The scope of these accounts has been increased to include the conductors and windings, cases, structural and anti-torque supports, cryogenic supplies and lines, cryostats, thermal shields and power supplies. Toroidal Field Coils, Account 22.02.01 – The toroidal field (TF) coils create the magnetic fields to confine the plasma. There are typically 12-18 toroidal field coils in generally a modified "D"-shape geometry (straight inner leg with smooth curve top, bottom and outer legs). The coils for power plants are not close fitting to the power core, but are much larger to allow access space between coils for maintenance of entire power core sectors (one sector per TF coil) or removal of large modules. The superconducting TF coils have superconducting windings, using low temperature or high temperature superconductors, insulation, coolant lines, support structure, and cryogenic dewars. There may be interconnecting structures for the out-of-plane loads. There will be some form of bucking cylinder or bucking structure to counteract the inward TF coil forces. This TF coil subsystem will require some structure to counteract torques or twisting moments on the TF coils. There will be thermal isolation struts to transmit the TF coil gravity and seismic loads to the lower support structures, yet conduct minimal thermal energy to the superconducting coils. Superconducting, cryogenic feeder lines and cryogenic plumbing are included. The refrigeration plant and storage facility for the TF coils will be included in this account. Power supplies for the coils are included. There are no TF coil spares provided in the capital costs as these elements are considered to be life of the plant with little likelihood of failure.
The superconducting coils may have integral cryostats and thermal shields around each coil and/or have a larger cryostat located at a larger radius, perhaps at the inner boundary of the bioshield. This will also be included in the TF coil costs.
Leslie Bromberg, of MIT, had been responsible for supplying algorithms for this TF field coil cost account. The cost estimate is related to the conductor and cable, structural elements, insulating elements, cryogenic equipment and storage, and power conditioning equipment. It is anticipated this cost element will be determined by the type of superconductor, cooling approach, winding technique, and structural support method. Further, the cost will be parametrically determined by the field strength and the current density. This sub-element cost element structure may change when the costing algorithms are documented.
C22.02.01 = determined by SC material, cooling, winding, structure, cryostat, thermal supports and anti-torque structure and is proportional to field strength, current density, and perhaps some volume or stored energy term.
26
Conductor and Cable, Account 22.02.01.01 – Both low temperature (around 4 K) and “high” temperature (around 70 K) superconducting (SC) coils are being considered for the TF coils. Low temperature superconductors are likely to be NbTi and NbSn3 with the former being used up to magnetic fields of 16 Tesla and NbSn3 being used from 16 Tesla up to 20 Tesla and slightly higher. Above that range, the high temperature SC materials would be used. Each of these materials has its own unique characteristics, structural needs, winding processes and fabrication processes, which results in separate costing algorithm sets for each material that is included in the subsystem cost algorithm.
Structural Coil Case, Account 22.02.01.02 – The unique structural requirements for the different SC materials will require different structural coil case designs, each with a separate costing algorithm considered at the subsystem level.
Bucking Cylinder, Account 22.02.01.03 – In many tokamak designs, the center of the power core is left hollow and uses a bucking cylinder to counteract the inward coil forces. ITER uses this approach. Likewise most ARIES designs used this bucking cylinder approach. ARIES Pulsar, IV, RS identified the use of a bucking cylinder and these bucking cylinders were shown in the CAD drawings and their masses reported in the systems code summaries. However, it is not evident that the cylinders are included in the structural volume, masses or costs.
In the ARIES-AT CAD drawings, the bucking cylinder is not identified, but it is considered to be an integral part of the inner leg of the TF magnet structure. However, in the systems code summary report, ARIES-AT provided a separate bucking cylinder mass of 130.649 tonnes, but no volume is provided.
It is not clear that the cost of this structural element was ever estimated in the past ARIES designs. In the future, this cost element should be physically defined, including its mass. This mass will be used with the unit material cost table to determine its cost. These costs will be included in the subsystem cost.
Cryostat and Thermal Shield, Account 22.02.01.04 – Starfire1 did not have a separate cryostat as such. It used the common dewar and individual TF and PF coil dewars to provide the cryostat function.
Per the ARIES-II, -IV Fusion Reactor Report16, Chapter 2 Systems Studies, ARIES-I, -II, -III, and -IV used a thin cryostat that completely enclosed the TF coils, see page 35 of the final report, and the cryostat was 0.050 m thick, see radial builds on pages 28-30. Further, it was indicated on page 45 of the final report, that each coil had a dedicated dewar. But it did not indicate that either the cryostat or the dewars were included in the cost of the coils when dedicated coil cryostats or dewars are used.
On the ARIES-RS17 and ARIES-AT14, the concept of individual cryostats was not adopted and a much larger common cryostat was used. It was a domed, cylindrical structure that completely enclosed the power core. From the ARIES-RS Design Book from the ARIES web site6, “the RS common cryostat uses double-walled welded construction in a "bell jar" configuration surrounding the vacuum vessel and all coils. The two 304L SS face sheets are stiffened with steel webs. The bottom of the cryostat consists of only a single 2-cm sheet. The outer cryostat is connected to the maintenance ports using bellows. There is no inner cryostat - the back side of the VV is used as a cryo boundary. There is no active coolant. Multilayer insulation is used on vacuum vessel, but there is no insulation on upper and lower cryostat lid. Either a cap or large
27
ports are provided on the top for TF coil removal.” It does not appear that any cryostat cost algorithm was ever included in the algorithms provided by Bathke16 or Miller15 or any ARIES cost estimate. In the ARIES-RS systems code output file, the cryostat volume was 958.586 m3 and the cryostat mass was 1345.855 tonnes, which equates to an effective density of 1403 kg/m3. This would equate to a cryostat thickness of approximately 0.35 m. The cost of the cryostat did not seem to be included anywhere. From the CAD drawings, ARIES-AT concept used an identical cylindrical structure with a dome. The cryostat volume and mass are only 7.88% of the RS data, namely 75.631 m3 and 106.185 tonnes. The AT code summary sheet also listed a cryostat side volume of 34.773 m3, but it sure what this meant or how it was used. There was no mention of the cryostat in the design book or in any of the technical papers. The cost of the cryostat did not seem to be included anywhere.
The ARIES-CS (Compact Stellarator) adopted a different cryostat approach. It attached a thin steel sheet structure to the inner surface of the bioshield wall and floor. Above the power core, the cryostat was attached to the upper truss structure. The cryostat also had thermal insulating blanket. Again, the cost of the cryostat was never reported.
It seems that the Cryostat and Thermal Shield structures have not been included in the ARIES cost estimates. The volume and mass of these structural elements should be computed and combined with appropriate material unit cost (suggest $43.44/kg in 2009$ for reduced activation ferritic steel) to yield a viable cost and these costs included and identified in the TF coil subsystem cost estimate.
Thermal Isolation Struts, Account 22.02.01.05 – The TF and PF coils are cryogenically cooled and need to be supported with thermal isolation supports. Various types of thermal isolation struts are used in all superconducting coil systems. Additionally, the hot power core structure also needs to be supported and thermally isolated from base support structure Starfire1 used twelve G-10CR glass-cloth/epoxy laminate to support the center-post. ARIES-CS and ARIES-AT used both a cold support system for the coils and a hot support for the hot power core components primarily through the vacuum vessel structure. ARIES-RS had support posts, but it appeared like they supported the hot structure only. ARIES-ST used normal conducting coils, but it illustrated a complex support system to enable the bottom removal of the center post.
Usually these thermal isolation struts are shown in the CAD drawings with varying degrees of fidelity, but loads, materials, and design details are not specified and no costs reported. These components should be better defined and their materials and costs identified. Anti-Torque Structure, Account 22.02.01.06 – During operation, there are forces on the TF coils that induce a torque on the coils, twisting them out of their plane. During certain off-normal events, the currents in the TF coils may be unequal and additional toroidal forces and torques may be applied to the TF coil cases that would cause additional toroidal deflections. One method is to provide bridging structure between individual coils to counteract the induced torques. Starfire1 used this approach with shear panels. Another approach is to connect the TF coils to a continuous restraining structure at the top and bottom of the coils, sometimes called an anti-torque frame or structure. This structure is usually not used in the outer regions as maintenance and other power core access is required in that area. This approach was used in the ARIES-AT and in some other ARIES designs, but it has not been well defined and documented.

28
Some of these anti-torque structure components were shown in the ARIES CAD drawings, but they are not well defined as to the loads being transferred, materials specified, design details, and component costs. These components should be better defined and their costs identified. If manufactured with reduced activation ferritic steel, a unit cost of $43.44/kg in 2009 might be appropriate for this structure.
Poloidal Field Coils, Account 22.02.02 - There is a central solenoidal field coil in the inner radius of the toroid that is included in the Poloidal Field (PF) coil subsystem. The central solenoid may be composed of multiple coils that provide a transformer action to start the plasma current and to provide some plasma shaping. There are also large poloidal ring windings that create the shaping magnetic fields to effectively modify and shape the magnetic fields to contain the plasma. These coils are generally located above, below, and outside the TF coils. In the case of the power core designs with horizontal sector removal, the outer PF coils may be movable during maintenance actions or the PF fields have been modified so the outer PF coils are located out of the way of the midplane maintenance ports and are never moved (ref, ARIES-AT coil system14). Since the lower PF coils are effectively trapped by the TF coils and the power core above them, additional spare PF coils are to be provided below the power core. Even though the PF coils are designed to be life of plant and replaceable, the downtime to replace these particular lower PF coils are so onerous, it is more cost effective to have spares installed during the initial build sequence.
The superconducting PF coils have superconducting windings (low temperature or higher temperature), support structure, cooling system, and cryogenic dewars. The PF coil structure supports the magnetic and gravity loads with minimal heat transfer to high temperature support elements. Superconducting, cryogenic feeder lines and cryogenic plumbing are included. There may be interconnecting structure for supporting out of plane loads. Superconductors, cryogenic feeder lines and cryogenic plumbing are included. Leslie Bromberg is supplying algorithms for this PF field coil cost account. The cost estimate is related to the conductor and cable, structural elements, insulating elements, cryogenic equipment and storage, and power conditioning equipment. The sub-elements would be similar to that of Account 22.02.01, except perhaps for an anti-torque structure.
C22.02.02 = determined by SC material, cooling, winding, structure, cryostat, and thermal supports and is proportional to field strength, current density, and perhaps some volume or stored energy term. Feedback Control Coils, Account 22.02.03 – The Feedback Control coils are active control coils that are likely to be normally conducting coils. It is intended these coils are usually quiescent, but when abnormal plasma conditions are sensed, these coils can quickly ramp up currents and fields to effectively control the plasma. Therefore, instantaneous power demands are likely to be substantial, i.e., expensive power supplies. These coils are probably located outside the power core shielding, but may be inside or outside the vacuum vessel. Their location, size, current capacity, and field are completely design dependent. Since they are likely normally conducting coils, no installed spares are necessary as they could be installed as segments and connected together. Chuck Kessel is supplying algorithms for this feedback control coils cost account. The cost estimate is related to the conductor and cable, structural elements, insulating elements, and cooling equipment for these normally conducting coils.

29
C22.02.03 = determined by conducting material, cooling, winding, structure, and insulation and is proportional to field strength, current density, and perhaps some instantaneous power requirement term. Cryogenics for Plasma Confinement Account 22.02.04 – This common account includes the cryogenics for the TF and PF coils. This would include helium and/or nitrogen refrigeration and liquefaction process equipment. Starfire1 had helium compressors, heat exchangers, expansion engines, and purifiers to deliver 20 kW of refrigeration at 4.2 K to 4.5 K at the supply rate of 26,500 liter/hr. The cost of the Starfire helium refrigeration and liquefaction was estimated to be $7.7 M in 1980 or $17.648 M in 2009$. This subsystem probably supplied all of the plant liquid helium. If this data is to be used as an estimate basis, it should be scaled to the supply rate. ARIES does not separately identify the helium liquefier and refrigerators. ITER has a separate cost account just for the cryo-plant, cryo-lines, and cryo-containers with a cost of $165.1 M with spares in 2009$. This seems to be a very high cost item. On the other hand, FIRE has a very low cost cryo cooling with liquid nitrogen subsystems. They only allocated $2.0 M in 2009$ for both liquid nitrogen and helium subsystems and piping. The ITER and FIRE cost values were obtained during the 2002 Fusion Summer Study (at Snowmass)18, however the data is not reported in this reference, but was in private data files of Lester Waganer, who was responsible for the Snowmass cost assessment.
C22.02.04 = determined by cooling capacity times the number of cryogenic supply units times unit cost. Power Supplies for Plasma Confinement, Account 22.02.05 – This account includes the conditioned power supplies, controls, and wiring for both SC and the normal coils. These power supplies provide a low voltage, high current conditioned electrical supply. Starfire1 estimated the cost of the TF power supplies to be $183/kW (in 2009$) including component costs, installation, and checkout. The corresponding Starfire PF power supplies were $183,000/MVA. The Starfire corrective field power supplies were capacitive storage, which was estimated as $458,000/MJ. (These cost estimates may be completely out of date now. Note: All of ITER’s Power Supplies with spares are estimated to be $372 M (2009$) from a 2002 Snowmass estimate.) The protective circuitry is included in the coil costs.
C22.02.05 = determined by power supply capacity times the number of units times unit cost. Plasma Formation and Sustainment, Account 22.03
The components in this subsystem account are associated with the initial formation of the plasma and the continued sustainment of the proper plasma condition for the steady-state productive output of the plasma. These subsystems can be various types of radio frequency (RF) or neutral beam (NB) energy injected into the plasma to heat or properly condition the plasma to achieve the necessary current drive. The subsystem will be subdivided into categories used to form and heat the plasma, drive the plasma current, stabilize the plasma, and provide fueling/constituent control. These will be further subdivided into types of subsystems that can accomplish that functionality. Each subsystem contains sources, amplifiers, power supplies, transmission, windows, launchers, and cooling provisions Heating and Current Drive, Account 22.03.01 – This subsystem or a combination of subsystems provides continuous heating and current drive for the plasma to sustain the nominal plasma condition for proper operation. This subsystem nominally operates in steady-state

30
condition. During startup and shutdown, there will be some transients in this subsystem to enable ramp up to steady state operating conditions or controlled dissipation of the plasma at plasma termination. The types of heating and current drive components may include Ion Cyclotron Resonance Frequency (ICRF) Fast Wave, Lower Hybrid (LH) Wave, Electron Cyclotron Resonance Frequency (ECRF), and Neutral Particle Beam. Some subsystems can do only plasma heating while others can do both heating and current drive. These subsystems may also supplement the plasma startup phase.
The ARIES-II, -IV Systems Studies Chapter16, Table 2.2-XII summarized the heating and current drive subsystems costing algorithms as shown below in Table 7. The desired plasma temperature is a primary parameter to select the type of current drive and heating system. Per Ron Miller, all ARIES designs continue to use heating and current drive (CD) unit costs from the Table 7 as extracted from Reference 16. These algorithms were not revised by Miller in his 2008 updating of the cost algorithms. This table and related text does not indicate what subsystem components are included in these unit costs, but it is presumed it includes both the amplifiers and the delivery components (cooled waveguides and launchers, etc). Each subsystem contains sources, amplifiers, power supplies, transmission, windows, launchers, and cooling provisions.
Table 7. Current Drive Subsystem Unit Costs16, (Table 2.2-XII)
Type of Current Drive Subsystem Efficiency Unit Cost, $/W (delivered?)
1992$ 2009$ 2 MeV Neutral Beam 0.68 3.45 4.93 Lower Hybrid (80 MHz)* 0.68 1.49 2.13 ICRF Fast Wave 80 MHz 0.84 1.15 1.64 158 MHz 0.72 1.15 1.64 250 MHz 0.65 2.30 3.29 800 MHz 0.63 2.30 3.29 2,500 MHz 0.63 2.30 3.29 8,000 MHz 0.63 2.30 3.29 *The value of 80 MHz may be incorrect as ARIES used 8 GHz and Starfire used 1.66 GHz
The ARIES-I final report19 describes the chosen heating and current drive subsystem as ICRF having a frequency of 141 MHz and a delivered power to the plasma of 96.707 MW (in CD Chapter19 it is shown as 92 MW) and a unit cost of ~$1/W (1988$). The wall plug power required was 134 MW. There was also an LHCD current drive system operating at 8 GHz that provided 5 MW of power to the plasma and required 7 MW of electrical power. The estimated cost of the ICRF and LH CD subsystem was $103.919 M in 1988$ or $118.707 M in 1992$. This would equate to a unit cost of $1.63/W in 2009$. Per the ARIES II-IV Systems Study Chapter16, Table 2.4-I, ARIES I was re-evaluated and optimized as ARIES-I’. The new resultant heating and CD power significantly increased to 202.5 MW and the subsystem cost was correspondingly increased to $231.36 M in 1992$ ($330.827 M in 2009$, LSA=4), which would equate to a unit cost of $1.63/W in 2009$.

31
Per an IAEA paper by F. Najmabadi, et.al.20 ARIES-II and –IV selected a combination of rf current drive options consisting of ion cyclotron resonance heating (ICRH) and lower hybrid (LH) with a combined delivered power to the plasma of 70 MW. This was composed of 19 MW of ICRF @ 124 MHz and 12 MW @ 8 GHz of LH delivered to the central region and 39 MW of LH @8 GHz delivered to the edge regions. Using the above table unit costs and the delivered CD power, this would suggest an ICRF cost of $21.85 M and an LH cost of $75.99 M for a total of $97.84 M in 1992. This reference also mentioned an additional 20 MW for startup CD power of an unspecified type might be required.
Per the ARIES II-IV Systems Study Chapter16, Table 2.3-I, ARIES II had a current drive power to the plasma of 66.1 MW and ARIES IV had a current drive power to the plasma of 68.0 MW. Both had a current drive efficiency of 54%, see Reference 16, Table 2.3-II. Assuming the same power split as before between ICRF and LH, dividing by the efficiency to obtain input power and multiplying by the appropriate LSA factor, this would yield for ARIES-II with an LSA = 4 a total cost of $171.09 M (1002$) (LSA = 4) or for an LSA = 2 $160.82 M (1992$). According to Reference 10, the reported Heating and Current Drive for ARIES-II is $194.3 M (LSA=2, 1992$). So there is quite a discrepancy. Even if the subsystem were estimated using the higher cost LH unit cost factors, there is still a sizable error. Likewise, the computed cost of the ARIES-IV with 68 MW of delivered power and the same efficiency yields a total cost of $176.01 M (LSA = 4) or for an LSA = 1 $149.61 M. According to Reference 10, the reported Heating and Current Drive for ARIES-IV is $175.1 M (LSA=2, 1992$). Still a sizable discrepancy remains. In ARIES-RS17, three heating and CD subsystems were employed: (1) ion-cyclotron-resonance-frequency (ICRF) fast wave, (2) high-frequency fast wave (HFFW) and (3) lower hybrid wave (LHW) subsystems. According to the ARIES-RS Data Book on the ARIES web, the 92 MHz ICRF has 43.8 MW, the 1 GHz LH has 27.2 MW and the 4.6 GHz LH has 27.2 MW. The wall plug to delivered power efficiency and wall plug power is not known. According to the full summary on the ARIES web, the ICRF has a higher frequency of 97.745 MHz and only 15.711 MW, the 1 GHz LH has 33.011 MW and the 4.6 GHz LH has 32.051 MW. The data file lists a CD efficiency of 0.56 and a unit cost of $1.322/W in 1992$. The reported Supplemental Heating and CD costs are $174.693 M (LSA 4), $164.211 M (LSA 2 and 3) (94% of LSA 4), and $143.981 M (LSA1) (which is 82.42% of LSA 4 but it should be 85% per Table 2.2-XVI of Reference 16). Reference 17, “Configuration and Engineering Design of the ARIES-RS Tokamak Power Plant” by M. Tillack, et.al., presents a more correct and detailed summary of the Heating and CD subsystem. The ICRF is at 98 MHz, power to plasma is 15.7 MW, and wall plug power is 23.2 MW. The HFFW frequency is 1 GHz, power to the plasma is 32.1 MW, and wall plug power is 61.6 MW. The LHW frequency is from 4.6 GHz to 3.5 GHz, the power to the plasma is 33.0 MW, and the wall plug power is 102.4 MW. These rounded numbers agree with the ASC data files and provide additional wall plug power. If the algorithms from Table 7 assume the delivered power, the estimated cost is less than the reported estimate. If the wall plug power is used, the estimated cost is greater than the reported estimate.
Neither the ARIES Systems Code printout, the design data book power values with the cost algorithm from the ASC printout or the suggested algorithms from Reference 16 (or Table 7) produce similar cost values. Also there is no HHFW algorithm in Table 7 although the frequency falls within the ICRF frequency band. The RS cost data for LSA = 1 does not match the recommended LSA discount of 85%.

32
Per the ARIES-AT design data book on the ARIES web, the ARIES-AT used two RF subsystems for heating and current drive: (1) ion-cyclotron-resonance-frequency (ICRF) fast wave and (2) lower hybrid wave (LHW). The ICRF frequency was 96 MHz, 15.0 MW to the plasma, 20 MW wall plug power (75% efficiency) and 3.3 MW current drive power. The LHW frequency is from 2.5 to 3.6 GHz, 48.7 MW to the plasma, 105.9 MW wall plug power (46% efficiency) and 34.1 MW current drive power. The total current drive power is 37.4 MW. Per the ARIES-AT ASC code output file, the heating and CD efficiency (delivered/wall plug) is 42.7%. The FW (ICRF) frequency is 95 MHz, power to the plasma is 3.284 MW, and the imputed wall plug power is 7.69 MW. The LH frequency is 3.5 GHz, power to the plasma is 34.149 MW, and the imputed wall plug power is 79.97 M. The total RF power to the plasma is 37.441 MW. The stated heating/CD unit cost is 1.164 $/W, which does yield the reported estimated cost of the Supplemental Heating and CD for LSA = 4 is $43.60 M in 1992$. (Note, this total power times the unit cost does not work for ARIES-RS which yields $106.86 M vs. $174.693 M). If the algorithms for ICRF and LH from Table 7 are used assuming power delivered to plasma, the heating and CD subsystem cost would be $86.11 M in 2009$.
C22.03.01 = determined by type of HCD subsystem times power delivered to plasma time the number of units times unit cost. Ion Cyclotron Resonance Frequency (ICRF) Fast Wave Heating and Current Drive, Account 22.03.01.01 – ARIES-I, -II, -IV, -RS, and –AT studies chose to use a combination of Lower Hybrid and ICRF heating and current drive. However, the reported costs are not separable so no detailed comparison could be made. The ARIES-II-IV Systems Studies16 did document a cost for the ICRF subsystem over a range of frequencies from $1.64/W to $3.29/W as shown in Table 7.
TK Mau recommended in 2008, based on estimates from the ITER U.S. team "including R&D and all staff salaries and contingency”, ARIES should use for ICRF heating $5 to $6 per watt delivered to the plasma as a rough rule of thumb. Since the technical requirements on the antenna for a DEMO-level device will be tougher than on ITER, it may be more." We should endeavor to remove the R&D cost elements and the salaries and contingency to obtain only the direct capital cost.
Lower Hybrid (LH) Wave Plasma Heating and Current Drive, Account 22.03.01.02 – Starfire1 used lower hybrid for heating and current drive. They used 432 cross field amplifiers at 1.677 GHz at 420 kW each to deliver 90 MW heating power to the plasma. In present 2009$, the 432 CFAs would cost $27.27 M, the grills and other delivery hardware would cost $49.61 M, and initial CFA spares and grills would cost $12.37 for a total of $89.25 M in 2009$.
ARIES-I, -II, -IV, -RS, and –AT chose to use a combination of lower hybrid and ICRF heating and current drive. The ARIES-I final report19 documented in the Cost Appendix B that the ICRF delivered 97 MW and the LH delivered 5 MW to the plasma, but in the CD Chapter it reported 92 MW and 5 MW respectively for a total of 97 MW. In the ARIES-II-IV Systems Studies16 report only the 96.7 MW of ICRF power was reported. In the remainder of the ARIES reports, the power and costs are not separable so no detailed analyses could be made. The ARIES-II-IV Systems Studies16 did document a cost for the LH subsystem at $2.13/W in 2009$ as shown in Table 7.
Electron Cyclotron Resonance Frequency (ECRF) Plasma Heating and Current Drive, Account 22.03.01.03 – None of the ARIES studies chose to use ECRF as a current drive or heating scheme. ITER has chosen to use ECRH as one of its systems for heating (not current drive).

33
Neutral Particle Beam Plasma Heating, Current Drive and Rotation, Account 22.03.01.04 – Several of the ARIES design concepts evaluated the NBI option for heating and current drive, but only ARIES-III chose implement that option. The ARIES-II-IV Systems Studies16 did document a cost for the NBI subsystem at $4.93/W in 2009$ subsystem as shown in Table 7.
Summary of Heating and Current Drive, Account 22.03.01 - There was a great deal of differing and conflicting information available regarding the power delivered to the plasma and the wall plug efficiencies. Also, the ARIES cost data was thought to be calculated for each type of heating and current drive, but only reported at the top level, which did not allow a more detailed analysis of the subsystem costs. A summary of the subsystem costs is shown below in Table 8. The first eight lines are a repeat of the data from Table 7. These data supposedly were used on all the ARIES cost estimates, however using these data would not reproduce the reported subsystem costs for any of the ARIES designs. This needs to be confirmed for accuracy.
Table 8 also contains the ARIES subsystem heating and current drive summary data including the types of heating and CD, the delivered power and the cost data available. The reported cost estimates were escalated from the original data to 2009$ and converted to unit costs for comparison (LSA = 4). Neutral particle beam heating and current drive is significantly more expensive and is used infrequently. ICRF is used in the lower frequencies as it is the least expensive. Lower Hybrid is somewhat more expensive, but is used usually in combination with ICRF. The power levels were around 90 MW with Starfire and ARIES-I and then the power level increased to ARIES-I at 202 MW, and decreased for the second stability plasmas of ARIES III, II, and IV at 163 MW, 66 MW, and 68 MW. ARIES-RS slightly increased to 81 MW, but ARIES-AT significantly decreased to 37 MW with the lowest subsystem cost of $62.32 M in 2009$ (LSA = 4). The ORNL ITER RF team provided an unofficial estimate of $5-6/W for ICRF, however this estimate includes R&D, personnel salaries, and contingency, all of which should be removed for inclusion in the direct capital cost algorithms. For future algorithm definition, each heating and CD subsystem option should be defined regarding type, frequency, source, and delivery components. Most of the ARIES designs described the launchers and other means to deliver the power, but it is not evident what was actually estimated.

34
Table 8. Summary of Heating and Current Drive Subsystem Costs
Startup, Account 22.03.02 – The startup subsystems are dedicated to bringing the plasma from inert plasma conditions up to full power, steady-state operation plasma conditions. This subsystem also may be used when transitioning from a partial power condition up to a higher level of power output. The candidate subsystems include Electron Cyclotron Resonance Frequency (ECRF) Wave for plasma breakdown, Ion Cyclotron Resonance Frequency fast wave for current initiation and ramp-up, and Lower Hybrid. Starfire employed its steady-state LH current drive subsystem as its plasma startup subsystem. ARIES-I used ICRF for plasma heating and ECRH as plasma breakdown. All other ARIES designs (including ARIES-I’) used ECRH as the plasma breakdown subsystem. ARIES did not technically document their startup subsystems, however they did include the ECRH plasma breakdown subsystems in their cost estimate.
C22.03.02 = determined by type of Plasma Startup subsystem times power delivered to plasma time the number of units times unit cost. Electron Cyclotron Resonance Frequency (ECRF) Wave Plasma Breakdown, Account 22.03.02.01 – The ARIES designs used ECRF for plasma breakdown with documentation as a separate cost account, but no details have been provided about the components used or the power delivered to the plasma. R. Miller16 provided a simple ECRH cost estimating relationship ($/W) for all ARIES designs prior to ARIES-AT as shown in Table 9. The constant was increased for ARIES-AT as shown in the second row. The delivered power levels for these designs were not documented. I think there is a mistake in the constants, perhaps they are still in 1980$, but even then the conversion is still incorrect and perhaps the quoted LSA factors for this subsystem.
Source Type,
Frequency Del Pwr,
MW Rptd Cost,
92M$ LSA4 Cost,
92M$ LSA4 Cost,
2009M$ $/W , 1992$
$/W, 2009$
ARIES Sys Studies NBI, 2 MeV NA $3.45 $4.93 ARIES Sys Studies LH, 80 MHz? NA $1.49 $2.13 ARIES Sys Studies ICRF, 80 MHz NA $1.15 $1.64 ARIES Sys Studies ICRF, 158 MHz NA $1.15 $1.64 ARIES Sys Studies ICRF, 250 MHz NA $2.30 $3.29 ARIES Sys Studies ICRF, 800 MHz NA $2.30 $3.29 ARIES Sys Studies ICRF, 2500 MHz NA $2.30 $3.29 ARIES Sys Studies ICRF, 8000 MHz NA $2.30 $3.29
Starfire LH, 1.667 GHz 90 62.32 89.11 $0.69 $0.99 ARIES-I (LSA=2) ICRF/LH 96.707 $118.725 126.30 180.61 $1.31 $1.87 ARIES-I' (LSA=1) ICRF (/LH?) 202.5 $236.5 278.24 397.86 $1.37 $1.96 ARIES-II (LSA=2) ICRF/LH 66.1 $194.3 206.70 295.57 $3.13 $4.47 ARIES-III (LSA=2) NBI 172 $528.8(90$) ARIES-III (LSA=2) NBI 172 $559.9 595.61 851.68 $3.46 $4.95 ARIES-III' (LSA=2) NBI 163.2 $529.2 562.98 805.02 $3.45 $4.93 ARIES-IV (LSA=1) ICRF/LH 68.0 $175.7 206.71 295.58 $3.04 $4.35 ARIES-RS (LSA=2) ICRF/HFFW/LH 80.773 $164.211 174.69 249.80 $2.16 $3.09 ARIES-AT (LSA=1) ICRF/LH 37.441 $37.060 43.60 62.35 $1.16 $1.67
US ITER Team ICRF Not specified First of a kind including R&D, salaries, and contingency $5-6

35
Table 9 ECRF Plasma Breakdown Subsystem Costs (M$) from ARIES Studies6,16
Ion Cyclotron Resonance Frequency (ICRF) Wave Current Initiation and Ramp-up, Account 22.03.02.02 – ARIES-I Cost Appendix19 documented the use of ICRF to heat the plasma to ignition. However, in the ARIES-I systems code documentation, ECRF was listed as the plasma breakdown subsystem.
Lower Hybrid (LH) Wave Current Initiation and Ramp-up, Account 22.03.02.03 – Starfire1 used Lower Hybrid for the primary heating and current drive as well as being used for the plasma startup with no additional cost. In ARIES-I, there was an LHCD startup system operating at 8 GHz that provided 5 MW of power to the plasma and required 7 MW of electrical power. In the re-assessment of ARIES-I’, the primary heating and CD power went from 96.7 MW to 202.5 MW of a factor of 2.09, so it is inferred the startup heating and CD power for ARIES-AT’ would be approximately 10.5 MW.
If these startup systems are additional costs above the steady-state heating and current drive, it is anticipated these subsystems would use the same costing algorithms as the steady-state subsystems. To conserve first wall space, it is hoped they can share the launcher components.
Stability Control, Account 22.03.03 – This subsystem is to ensure the stability of the steady-state plasma and is primarily a transient operation, with fast acting, high power feedback to the subsystems to actively control the plasma conditions. The candidate subsystems are Electron Cyclotron Resonance Frequency (ECRF) and Neutron Particle Beams. This is a new function added to the Plasma Formation and Sustainment account and it needs further investigation and definition.
C22.03.03 = determined by type of Plasma Stability Control subsystem times power delivered to plasma time the number of units times unit cost. Electron Cyclotron Resonance Frequency (ECRF) Wave Plasma Control, Account 22.03.03.01 - TBD
Neutral Beam (NB) Wave Plasma Control, Account 22.03.03.02 - TBD
Plasma Fueling and Constituent Control, Account 22.03.04 – These are the subsystems that provide the fueling, both steady-state as well as transient, to maintain the desired plasma fuel mixture. In addition to providing the nominal mix of deutritium and tritium, there may need to be some adjustment of the D-T mixture to fine tune the fuel mix in the plasma. There also may be some need to inject some other elements to adjust the radiation characteristics of the plasma. The subsystems considered are pellet injection fueling and constituent control and neutral particle beam injection, also for fueling and constituent control. These systems or a dedicated variation of
ECRF Del Power, MW 1992$,LSA 1, 2 1992$, LSA4 2009$, LSA4 Unit Cost, $/W ARIES Sys Studies, A-1 to A-RS $2.60 (Constant)
ARIES Sys Studies, A-AT $2.78 (Constant) ARIES-I' (LSA=2) Data Not Found $3.900 $4.149 $5.933 TBD ARIES-II (LSA=2) Data Not Found $4.300 $4.574 $6.541 TBD ARIES-III' (LSA=1) Data Not Found $4.300 $5.059 $7.234 TBD ARIES-IV (LSA=2) Data Not Found $3.900 $4.149 $5.933 TBD ARIES-RS (LSA=2) Data Not Found $4.334 $4.610 $6.592 TBD ARIES-AT (LSA=1) Data Not Found $3.975 $4.677 $6.688 TBD
36
these systems may also be used to inject “killer” pellets to rapidly quench the plasma, if necessary.
The costs for these plasma fueling subsystems on previous ARIES designs were included in Account 22.5 Fuel Handling and Storage. There were algorithms provided for these subsystems (see below), but for brevity, these cost data for Account 22.5 were never published. However their costs were included in the roll-up total costs. The new ARIES recommended cost account separates the function of Plasma Fueling and Constituent Control (Account 22.03.04) from Fuel Handling and Storage (22.10) that includes gaseous and liquid recovery, processing, and storage equipment as well as isotope separation.
C22.03.04 = determined by number of pellet injectors or neutral beam lines x the unit cost of these components. Pellet Injection Fueling and Constituent Control, Account 22.03.04.01 – ARIES-I used pellets to fuel the plasma at 2645 kg/d, 4-6 mm in diameter and injected at 1-5 km/s. ARIES-RS used a two-stage pneumatic injector with an injection velocity of 5 km/s and a repetition rate of 2.9 Hz, but this subsystem was marginal. Higher injection speeds are desired. No further technical documentation was found for the remainder of the ARIES designs.
The ARIES-II-IV Systems Studies16 provided an algorithm for the pellet injector (previous Account 22.5.1) as being $6.07 M (LSA = 4, 1992$) each with 2 injectors required. This algorithm applied from ARIES-1 to ARIES-RS. For ARIES-AT, Ron Miller15 updated the unit costs to $6.48 M (LSA = 4, 1992$) or $9.266 M in 2009$. Since the cost data were never published, these data is not confirmed. These costs would be unit costs times the number of units or a nominal unit cost scaled to fuelling rate.
Neutral (Particle) Beam Injection (NBI) Fueling and Constituent Control, Account 22.03.04.02 – If neutral beams are used in the current drive subsystem, altering the fuel mix in the particle beam may be a convenient and low or no cost way to fuel the plasma. These costs can be unit costs times the number of units or a nominal unit cost scaled to fuelling rate.
Vacuum, Power Core, Account 22.04 This account provides all the equipment and plumbing necessary to provide a high quality vacuum for the power core. It includes the vacuum vessel, refrigerators, primary high vacuum and roughing pumps, and vacuum ducts. It also includes the shielding materials in the vacuum vessel and the vacuum ducts. Vacuum systems for other subsystems, such as radiation materials treatment and coil systems are included in those subsystems. It is yet to be determined if vacuum leak detection subsystem is included in this account or in instrumentation. The Starfire report1 has the best documentation of the vacuum equipment subsystem. The Starfire vacuum system, including spares, would cost around $12.7 M in 2009$ plus the cost of the vacuum pumping ducts, which are dependent on their presently uncalculated mass and the vacuum vessel. See the following subsections for more specific details.
The Generomak reports2,3 did not provide any detailed information about the vacuum systems and generally adopted the Starfire baseline data.
Vacuum Vessel, Account 22.04.01 (formerly Account 22.01.07) - The vacuum vessel is typically the next outboard subsystem outside of the high temperature shielding. Its prime requirement is to provide and sustain a high level vacuum environment for the operation of the

37
plasma. Since it is a vacuum vessel, it will serve as a gaseous tritium boundary. It also serves as an additional shielding element to further reduce the neutron flux to all components outside the vacuum vessel, principally the TF coils. The vacuum vessel configuration and cooling are very design dependent on the power core configuration. It typically is as close fitting to the outside of the shield as practical to minimize the interior volume of the vacuum vessel and to make the TF coils as small as possible. Many contemporary fusion power plant designs employ larger outer legs of the TF coils that allow removal of entire power core sectors. Typically the TF coils have self-contained cryo-jackets or dewars, so they do not need to be contained within the power core vacuum boundary.
This account only is the structural elements of the vacuum system including the main vacuum vessel chamber, the port enclosures, the vacuum door assembly, bulk shielding inside the vacuum vessel walls, and any manifolding/plumbing. Depending on the shielding capability, the vacuum chamber may or may not be a cooled structure, dependent on the structural materials and the amount of energy deposited in the structure.
Historical cost data on the vacuum vessel is rather sparse and incomplete. The Starfire report1 and the EBTR report10 used the power core shields for the vacuum containment so there was no vacuum vessel as such. However, this particular design approach has been abandoned in favor of a separate vacuum vessel that contains the first wall, blankets, divertors, and shielding.
The ARIES studies6,7 used an algorithm for the cost of the ARIES vacuum vessel based on the mass of the vessel as shown in Table 10. Ron Miller15 documented and updated the leading coefficient for the AT power plant due to a revised escalation basis as shown in Table 10, last line.
Table 10. Older ARIES Vacuum Vessel Algorithms ARIES Designs 1992$ (LSA = 4) 2009$ (LSA = 4)
II-IV, SPPS, RS $24 x VV mass in kg $34.32 x VV mass in kg
AT $26 x VV mass in kg $37.18 x VV mass in kg
From the published ARIES-AT14 ASC engineering data, the vacuum vessel has a volume of 295.12 m3 and a mass of 1415.31 tonnes, which would equate to a cost of $36.80 M (1992$) or $52.62 M (2009$), using the $37.18/kg unit cost, for the vacuum vessel alone (LSA=4). Since the published data combines both the cost of the vacuum vessel and the vacuum equipment, no quantifiable value can be determined. For an LSA = 1 plant (applying the 0.85 factor), the ARIES-AT vacuum vessel cost would be estimated at $44.73 M (2009$).
Also in the ARIES-AT6 ASC code calculates the vacuum vessel components (inboard VV, outboard VV, O/B (UC) VV, divertor VV, and bottom VV) materials, volume fractions, fractional density, unit cost/kg and thickness. The quoted unit costs in the ASC summary are $65.604/kg for the inboard VV and $62.438/kg for the remaining VV components. It is not evident how these unit costs were used. If the mass of the vacuum vessel (1415.31 tonne) is used with the code documented unit cost, this would result in a cost of $132.77 M (2009$, LSA = 4) to $126.36 M (2009$, LSA = 4. The actual number may be closer the lower number.
In 2006, a detailed, bottoms-up vacuum vessel design and cost study21 was conducted by McDonnell Douglas Corporation (Waganer, et. al.) during the ARIES-AT study that provided the most current and extensive design and cost examination of a power plant relevant vacuum

38
vessel. This vacuum vessel design used a double-walled ferritic steel (F82H) that was filled with water and tungsten carbide (WC) spheres as additional shielding materials. (Note that the use of water in the vacuum vessel with a liquid metal-cooled power core is not favored presently.) The detailed costing results are listed in Table 11 for the vessel components. The cost estimate was prepared with the assumption that the construction corresponded with a LSA = 1 criteria.
Table 11. ARIES-AT Vacuum Vessel Detailed Costing Study Results4 Component 2000$ 2009$
Spool Assembly $30.16/kg $37.23/kg
Removable Doors $44.36/kg $54.76/kg
Door Frames $76.12/kg $93.97/kg
Port Enclosure $30.26/kg $37.36/kg
Composite Rate $35.13/kg $43.37/kg
The mass of the vacuum vessel in the detailed study (ARIES-AT) was estimated to be 1,113.451 tonnes with a total cost of $39.115 M (2000$) or $48.29 M (2009$) without the cost of the WC shielding. In comparison, ARIES-AT systems code data with $37.08/kg times 0.85 for an LSA = 1 plant and a calculated mass of 1415 tonnes would yield a cost of $44.73 M. Although the costs are similar, the systems code calculated mass is much larger and the unit cost is lower with an additional LSA factor.
The ITER Technical Basis Report22 documented the ITER vacuum vessel as a double-walled 316 LN stainless steel, cooled with water. The mass of the main vessel, port structures, ducts and 316 SS with boron shielding is 8448 tonnes. The preliminary ITER cost per the Snowmass cost analysis18 data ($330.3 M in 2002$) scaled to 2009$ is $392.40 M, which equates to $46.4/kg. This is very comparable to the ARIES detailed estimate. This estimate is probably equivalent to an LSA 2 facility.
The FIRE vacuum vessel and ports weighs approximately 50 tonnes plus and additional 80 tonnes of SS shielding and is estimated to cost $63.70 M in 2009$ per the Snowmass cost analysis23 data, which equates to $490/kg. Although this is for a smaller experimental machine, its cost estimate is quite high compared to the ARIES estimates. This cost does have design engineering and contingency included. This might be equivalent to an LSA 2 facility.
It is recommended that this composite rate of $43.37/kg in 2009$ from the detailed ARIES-AT vacuum vessel study (see Table 11) be adopted as the best cost basis for vacuum vessels (at LSA = 1) and a more accurate determination of the vacuum vessel mass be adopted for the computer code. This yields a 2009$ cost of $61.38 M for the computed mass of 1415.31 tonnes. This should include the cost of the main vacuum enclosure, the main ports for maintenance, ports for other purposes such as ECRH, and the vacuum doors for these ports. If this detail is provided, there are corollary material unit costs in Reference 21. However, the vacuum ducts to the vacuum pumping systems are included in the vacuum equipment (Account 22.04.05) as the size and configuration of these pumping ducts are highly influential on the pumping equipment requirements. Of course, using the results of the AT vacuum vessel study would have to be modified based on the actual design of the vacuum vessel being considered. Also, the cost of any boron carbide shielding spheres should be added to this account, if used, see the material cost

39
rates for WC (~$34.39/kg in 2009$). These shielding materials also might be added just before testing to decrease the interest and escalation charges.
C22.04.01 = $43.37 x mass of vacuum vessel + sum of products of shielding material unit costs per mass times the mass of shielding materials. No LSA factors should be applied. General Discussion of the Remainder of Account 22.04 (22.04.02 to 22.04.06) This account includes all the vacuum pumping equipment, including helium liquefier/refrigerators, primary vacuum pumps, roughing/backing pumps, vacuum pumping ducts and plumbing and storage for all vacuum cryogenic systems. The cryogenic systems for the superconducting coils are included with the coil accounts.
ARIES II-IV16 adopted or created the algorithm for the power core vacuum equipment cost based on the mass flow rate of the pumped gases. Ron Miller15 documented and updated costing coefficient for the AT power plant due to a revised escalation basis as shown in Table 12. Note that these data do not include the vacuum vessel costs contained in Account 22.04.01.
Table 12. Previous Vacuum Systems Algorithms15,16 ARIES Designs 1992$ (LSA = 4) 2009$ (LSA = 4) II-IV, SPPS, RS $4.09 x mass flow rate in kg/d $5.85 x mass flow rate in kg/d
AT $4.37 x mass flow rate in kg/d $6.25 x mass flow rate in kg/d
From the ARIES-AT full summary printout from the ARIES web site6, the exhaust mass flow rate is not provided. The ARIES-AT vacuum pumping speed is reported as 174.697 m3/s or 174,697 liters/sec for an unknown species of gas. This is probably meant to be the total gas load pumping speed, not just helium. This compares to the Starfire data of 200 m3/s total gas load or 125 m3/s helium.
ITER Technical Basis Report22 has a very detailed definition of their vacuum equipment subsystem that includes high vacuum pumping, roughing/backing pumping, and diagnostic/roughing subsystems. ITER has 10 cryopumps, either active or regenerating, during the long plasma pulses. Their anticipated steady-state helium pumping speed is 60 m3/s. The ITER vacuum pumping equipment total cost escalated to 2009$ is $69.97 M, per the Snowmass cost analysis28 of ITER and FIRE. ITER also has $165.13 M (2009$) for the cryoplant, cryo lines, and cryo containers. So the comparable ITER cost would be $235.1 M in 2009$.
The FIRE Engineering Status Report of 200123 reported that FIRE would use 16 cryopumps with an effective helium pumping speed of 32 m3/s. This report noted that the lower burn fraction would increase an equivalent torus pumping requirement from prior Starfire and ARIES conceptual designs. The related cost analysis of the Snowmass Summer study18 of FIRE vacuum equipment would be $19.41 M in 2009$ plus the cost of cryogenic cooling systems of $2.04 M resulting in a total vacuum pumping systems cost of $21.45 M.
This subsystem needs more clarity regarding pumping speeds and cryogenic requirements before any recommendations can be made. This subsystem should be related to the pumping speed needed, probably for helium, and the distance from the power core chamber and the cryogenic and roughing pumps. From Starfire data, it would seem the refrigeration and liquefaction is the

40
major cost. Cryopumps and roughing pumps should be a reasonable cost. The weight and cost of the pumping ducts should be added.
C22.04.02-.04 = sum of the products of the pumping parameters times the component unit costs. Helium Liquefier-Refrigerators, Account 22.04.02 – This subsystem is the helium refrigeration and liquefaction process equipment. Starfire1 had helium compressors, heat exchangers, expansion engines, and purifiers to deliver 20 kW of refrigeration at 4.2K to 4.5K at the supply rate of 26,500 liter/hr. The cost of the Starfire helium refrigeration and liquefaction was estimated to be $7.7 M in 1980 or $17.65 M in 2009$. This subsystem probably supplied all of the plant liquid helium. If this data is to be used as an estimate basis, it should be scaled to the supply rate.
ARIES does not separately identify the helium liquefier and refrigerators.
ITER22 has a separate cost account just for the cryo-plant, cryo-lines, and cryo-containers with a cost of $165.13 M in 2009$. This seems to be a very high cost item.
On the other hand, FIRE23 has a very low cost cryo cooling with liquid nitrogen subsystems. They only allocated $2.04 M for both liquid nitrogen and helium subsystems and piping.
This subsystem needs to be revisited to get current requirements and new cost estimates.
Primary Vacuum Pumps, Account 22.04.03 – These primary vacuum pumps could either be cryogenic pumps or turbo-molecular pumps. Starfire1 had a distributed vacuum subsystem with vacuum pumps located at each sector. It required 48 active cryopumps with a combined pumping speed of 125,000 liter/sec for helium and 200,000 liter/sec total gas load. In the 1980s, these sized pumps were not readily available, but it was estimated that the then-current price would be $100,000 per pump. With some learning experience to be gained before the future purchase with quantity purchase discount, these pumps could be purchased for $50,000 each. The total for the cryogenic vacuum pumps was $2.4 M + 0.24 M for installation and $0.05 for spares, which equals $2.69 M in 1980$ or $6.17 M in 2009$.
The ARIES-AT vacuum pumping speed is reported as 174.697 m3/s or 174,697 liters/sec. This is probably meant to be the total gas load pumping speed, not just helium.
If gyrotrons are used, they may need liquid hydrogen cooling. Starfire1 had 24 gyrotron magnet cryopumps, which were commercially available as 1000 liter/sec units for $3,000 ($6,875 in 2009$). The total for 24 pumps and installation would be around $165,000 in 2009$.
Roughing or Backing Pumps, Account 22.04.04 – Starfire1 had a single roughing pump system that served the complete torus. The then current cost was $120K (in 1980$) or $275 K (in 2009$) including installation.
Vacuum Ducts, Account 22.04.05 –The ARIES designs usually have multiple long vacuum ducts connecting the power core chamber with the cryogenic vacuum pumps. The details of the exterior vacuum pump design are not shown. These ducts will be cooled with chilled water or liquid nitrogen. A good approximation for the vacuum duct cost algorithm is $28.02/kg in 2009$, which is a 25% reduction from the detailed ARIES-AT vacuum vessel port enclosures ($37.36/kg) to account for smaller size and less complexity. This does not count the cost of shielding, which added to this account.
41
C22.04.05 = $28.02/kg x mass of vacuum ducts + unit shielding material cost times the shielding mass. Plumbing, Cryogenic, Account 22.04.06 – Starfire1 only provided some insight in to the plumbing for the vacuum subsystem. A small amount of liquid helium storage would be included in this account. None of the ARIES cost estimates included this account.
C22.04.06 = The cryogenic plumbing and temporary storage should be estimated based on the size and length of pipes and capacity and number of pumps.
Primary Structure and Support, Power Core, Account 22.05 This account defines the cost of the primary structure and support for the power core, which is very massive. Several of the main power core elements support each other. This subsystem transfers the gravity and seismic loads to the building support structures.
The Starfire1 report identified the technical approach, material, mass, unit cost, and the total cost of each primary structure element. The listed below are the third level accounts representative of those elements considered.
On the other hand, ARIES has a single algorithm for the entire primary structure and support. For ARIES-AT, the cost algorithm15 for the primary structure and support is $0.200 M x the volume of the primary structure (outside dimensions) in m3 (in $1992$ for a structure typical of an LSA=4 power core). The more valid parameter would be mass rather than volume as the material and fractional density will vary, design to design. The systems code summary listed a structural volume of 149.910 m3 and a mass of the fusion power core structure of 899.459 tonnes. It is not clear if these data refer to the same structural element and if the code related to a total structure volume or mass or if it is just a part of the total. If it is assumed these data refer to the same structural element (not sure what element), the effective density is 6000 kg/m3. If the structure is made of steel with a theoretical density of 7800 kg/m3, then the fractional density is 0.77. The material and fractional density is never reported.
Assuming that the provided ARIES-AT structural volume is accurate for the total primary structure, the algorithm15 would yield $0.20 M x 149.910 m3 for a total cost of $29.982 M (in $1992$ for LSA = 4 or 0.85 x 29.982 = $25.48 M in 1992$ for LSA = 1). This compares to a reported cost of $26.933 M (in $1992$ for LSA = 1). The reported cost divided by the fusion power core structural mass yields the unit cost of $35.22/kg, which is reasonable. However the basis still remains questionable, especially in light that all the bucking cylinder, anti-torque, cryostat/thermal shield, and thermal supports have been transferred to the TF coil cost account.
These data for the ARIES-RS has exactly the same formulation with much higher volume and mass values for the structure. I believe the structure algorithm for RS is the same as the one used for SPPS15, namely $0.184 M x volume of the primary structure (in 1992$), which is slightly lower than the AT version. With a structural volume of 271.132 m3, this would yield an LSA = 4 cost of $49.888 M as compared to the reported value of $56.86 M in 1992$. This set of data cannot be confirmed either.
We must confirm what these data really refer to (structural volume, mass of FPC structure and bucking cylinder mass. We must identify what element are really being considered and estimated. Do we need to add the volume to the volume algorithm? Perhaps a better algorithm
42
would involve the mass of the structure times a unit material cost rather than the non-descriptive volume.
C22.05= sum of products of unit cost per mass times the mass of the structural component element. Carry-Through Structure, Account 22.05.01 – Starfire1 identified this account but never actually had any components fitting into this category. It is probably a transition support structure that transmits loads from internal, high- or low-temperature, power core component down to the shield pedestal.
It is recommended ARIES do not define costing algorithms for this carry –through structure until such a common carry-through structural design is adopted. This component may indeed be used once the structural design is better defined.
Structural Pedestal, Account 22.05.02– The structural pedestal is a structural element that supports the entire power core. It may be a single monolithic element or it may be a set of elements all attached to the building concrete floor. A single piece may be more efficient to deal with seismic events. The Starfire1 report used a non-magnetic steel, NonMagne 30, for the structural elements. This pedestal had a mass of 418.4 tonnes.
It is recommended ARIES does not define costing algorithms for this pedestal structure until such a structural pedestal design is adopted. This component may indeed be used once the structural design is better defined.
Equipment Support Structure, Account 22.05.03 – This is a general set of structural support elements for the ancillary equipment. This structure will include large support structures for neutral beam equipment and diagnostic equipment as well as small instrumentation equipment and wiring. It is unrealistic to catalog all the ancillary equipment, so there will probably be a nominal allowance for this category.
Main Heat Transfer and Transport, Account 22.06 This account includes all the heat transfer piping, fluid circulation subsystem, intermediate heat exchangers, steam generators (if used), pressurizing or cover gas subsystem, and in-systems instrumentation and metering. This system interfaces between the high-temperature heat generating components in the power core and the turbine control and isolation valves (supply side) and the feed-water heating piping (return side). This is in agreement with the Starfire1 and GenIV24 definitions. The primary heat transfer loops interface with the high temperature energy production components, namely the first wall, blanket, divertor, and high temperature shields. The physical interface will likely be at the disconnection point at the back of the hot shield. There are several types of heat transfer loops possible depending on the technology involved and the temperature of the heat transfer media. Lower temperature systems would likely be pressurized water or organic coolants (OC). The next step up in higher coolant temperatures would involve liquid metals or metal salts. The next higher temperature step might be helium or carbon dioxide heat transfer media. It is recommended to have a good boundary between the primary loop and the turbine loop to minimize tritium migration to the turbine system and out to the environment. The MHTT system cost does not include the cost of the coolants as they are included in Account 27, Special Materials, which are loaded just prior to testing and operation.

43
Chuck Bathke and Ron Miller provided an updated set of algorithms16,15 listed below in Table 13 for several options of the Main Heat Transfer and Transport (MHTT) system for use with the previous ARIES studies and most recently, the ARIES-AT study. Note that the MHHT cost algorithms provided by Miller are higher for the AT than for the SPPS types for plant designs. The algorithms covered the primary loop, the intermediate loop, and a secondary loop, which was probably the turbine coolant loop (should not be in the MHTT cost account). The intermediate loop would probably be sodium or helium. If the power plant design used both helium and liquid metal primary loops, the cost of each loop would be determined by the thermal power transferred in each loop and the costs summed. Due to the exponential functions and subdividing the gross power, this dual coolant option will be more expensive, which is probably appropriate. The algorithm values were defined for an LSA = 4 plant. The MHTT system cost factors for an LSA = 1 was either 0.9 with water or OC or 0.6 with He or LM with an intermediate heat exchanger [or intermediate loop]. For all other LSA values, the factor would revert to 1.0.
Table 13. ARIES-AT Main Heat Transfer and Transport Cost Algorithms15 Primary loop Water and organic coolant: $108.60 M x (gross thermal power/3500)0.55 (in 2009$) $75.95 M x (gross thermal power/3500) 0.55 (in $1992) Liquid Metal (Li and LiPb): $380.32 M x (gross thermal power/3500)0.55 (in 2009$) $265.98 M x (gross thermal power/3500)0.55 (in $1992)
High Pressure Helium: $380.32 M x (gross thermal power/3500)0.55 (in 2009$) $265.98 M x (gross thermal power/3500)0.55 (in $1992) Intermediate loop Sodium or Helium: $70.41 M x (gross thermal power/3500)0.55 (in 2009$) $49.24 M x (gross thermal power/3500)0.55 (in $1992) Secondary (turbine) loop Helium or CO2: $114.53 M x (gross thermal power/3500)0.55 (in 2009$) $80.10 M x (gross thermal power/3500)0.55 (in $1992)
The reported costs of the MHTT systems for several of the prior system studies were escalated to 2009$ as shown in Table 14. The updated algorithms shown in Table 14 were used to estimate the system cost when the algorithm was used. The data is graphically illustrated in Figure 2.

44
Table 14. Comparison of Main Heat Transfer and Transport Reported Costs with the Updated ARIES-AT Cost Algorithms15 in M$
Figure 2. Main Heat Transfer and Transport System Costing Algorithms and Data

45
The two water primary system MHTT designs (Starfire and EBTR) were estimated by A&E contractors from then-current bids and reported costs 30-40% higher than the ARIES-AT algorithm would suggest, however these estimates are completely out of date now. The organic coolant ARIES-III estimate was probably made with the algorithm (no detailed estimate). If the tritium isolation is an issue, a double-walled steam generator (SG) may be required at an extra cost.
The two ARIES lithium systems with intermediate coolant loops (both were LSA = 2) had reported estimates less than the recommended algorithm, but perhaps they were estimated with an algorithm having a lower leading coefficient. The combination of the lithium primary and the sodium intermediate loop algorithms was a good choice to limit tritium migration and isolate the lithium from the steam turbine loop.
The single (no intermediate loop) high efficiency, high temperature coolant, such as helium or liquid metal, is represented by ARIES-AT (LiPb) or ARIES-I’ and ARIES-IV (helium). All three designs were considered to be very low activation designs and were assumed to be LSA=1, hence a LSA cost factor of 0.6 was applied. The ARIES-AT did not use an intermediate loop and the two helium-cooled ARIES designs probably did not use double-walled heat exchangers. From an unpublished ARIES-AT cost estimate, the estimate included primary, intermediate, and secondary (turbine) coolant loop costs, all related to the gross thermal power of 1982 MWth. Since there was no intermediate loop, this cost was an error. The secondary (turbine) coolant loop also should not be included in the MHTT estimate. It is not mentioned that either of the helium cooled designs used a double-walled heat exchanger for tritium isolation, which would have been a higher cost item. If the tritium isolation is an issue, a double-walled IHX or an intermediate coolant loop may be required at an extra cost.
The final combination is a dual-coolant design with a liquid metal and helium coolant as represented by ARIES-ST25 and ARIES–CS. These designs used helium for cooling the first wall and the divertor and LiPb for cooling the blanket and serve as the breeder. In the ARIES-ST design, the LiPb used a heat exchanger to interface with the helium Brayton cycle, but the helium primary coolant does not use a heat exchanger and the helium is used as both the power core coolant and the turbine fluid. So in the case of helium, the helium turbine is exposed to the power core tritium and contaminates. The power split is 1716 MWth for the helium and 1391 MWth for the LiPb.
In the case of ARIES-CS26, the high pressure, high-velocity helium cools the RAFS structure while the low pressure, low velocity LiPb breeds and absorbs the blanket nuclear heat. The power is roughly equally divided between helium and the LM. This power split with the exponential scaling of power increases the cost of the dual cooled system by 35-40%. The engineering data in the final report said there was no intermediate loop or double-walled HX. An ARIES-CS project meeting presentation in June 2005 by Raffray recommended an intermediate heat exchanger between the LiPb primary and the helium turbine loop with either refractory or SiC coolant tubes to reduce the tritium permeation. A vacuum tritum permeator should process all the primary LiPb coolant prior to the HX. However, the cost estimate was not detailed enough to tell if any of these features were included in the cost estimate. Additional tritium processing features and permeation barriers should be included in the cost estimate.
In late 2005 or early 2006, Siegfried Malang affirmed that a LiPb primary loop would need a Nb intermediate heat exchanger (IHX) to handle the higher temperatures present and have the proper
46
material compatibility. He estimated the price adder would be $0.0174 M for each MW of gross thermal power, = 0.0174 M x Pth (in MW). With 85% percent learning and 10th of a kind, the Nb IHX adder is = 0.010 M x Pth (in MW).
In the past, the LSA cost factors provided valuable insight into the cost benefits of more safe and environmentally friendly designs. However all the recent designs and, hopefully, all future designs will integrate these design features. Thus there is no advantage to use these LSA cost factors and their use should be discontinued.
After examining the MHTT subsystem costs from the prior designs having a wide variety of fluid options, it is evident the trend is away from high pressure, low temperature water systems and toward much higher temperature fluids, such as helium and liquid metals. Some of the current designs chose to use dual coolant subsystems using both liquid metals and helium. Intermediate coolant loops will likely be used with lithium systems. Perhaps dual-walled heat exchangers could also be used. Certainly the piping and heat exchanger materials will have to be compatible with the fluids and the temperatures anticipated.
The prior ARIES MHTT algorithms seemed to be reasonably correct relative to each other, but when evaluated with ARIES-AT Fusion Energy Capture and Conversion cost account values, the MHTT subsystem is quite a bit higher when no LSA factor is applied. It is felt that the MHTT subsystem should be adjusted to lower values to approximately half of the Fusion Energy Capture and Conversion account values. The reported ARIES-AT Fusion Energy Capture and Conversion subsystem cost (Acct 22.01) was $196.92 M in $2009$ (this includes the FWB, shield and divertor), whereas the MHTT cost (Account 22.06) was $180.13 M (LSA = 1) when scaled to 2009$. Applying the LM primary coolant algorithm in Table 13 with the thermal power of 1982 MW would yield a MHTT cost of $278.2 M in 2009$, then times the LSA factor of 0.6 yields $166.9 M (2009$), which is thought to be too high in relation to the more complex and demanding Fusion Energy Capture and Conversion cost. Therefore new algorithms in Table 15 are defined at the nominal ARIES-AT thermal power to bring the MHTT costs down to roughly 65-75% of previously estimated values, but more reasonable with respect to the AT Fusion Energy Capture and Conversion subsystem costs. No LSA factors are used. Further, it is thought that a high pressure helium system would be slightly less expensive than the liquid metal subsystems due to the MHD effects and more corrosive fluids. Again, a dual coolant system would be estimated using the sum of the appropriate algorithms and the respective power handled in each loop. It is recommended that this subsystem cost be defined in better detail to reflect the technologies being utilized.
Table 15. Revised ARIES Main Heat Transfer and Transport Cost Algorithms Primary and diverter loops Water and organic coolant: $50 M x (Pth gross/2000)0.55 (in 2009$) Liquid Metal (Li and LiPb): $125 M x (Pth gross /2000)0.55 (in 2009$) (adjust Pth for fraction of power handled) High Pressure Helium: $110 M x (Pth gross /2000)0.55 (in 2009$)(adjust Pth for fraction for power handled)
Adder for Nb IHX $0.010 M x Pth gross in MW (in 2009$) x fraction of Pth Intermediate loop Sodium or Helium: $50 x (Pth gross /2000)0.55 (in 2009$)

47
Primary (Water or Liquid Metal) Heat Transfer Loop, Account 22.06.01 – This primary loop account includes all the pumps and motor drives, insulated piping, tanks (dump, make-up, and clean-up), pressurizing equipment, interfaces with tritium extraction components, fluid clean-up system, and in-systems instrumentation and metering. The high-temperature heat transfer media for the primary loops may be pressurized water, liquid metals (Li, Pb), liquid metal mixtures (LiPb), molten metal salts (FLiBe, Flinabe), organic fluids, or gases (He, CO2). It is probably most convenient to group all the liquid primary loops in one category (22.06.01) because of the similarity of the components. Due to the unique piping and pumps, the gaseous primary loops will be covered in a second category (22.06.02).
Because of the complexities between water, liquid metals, and molten salt systems, there will be cost algorithms for each of these systems. In the case of dual coolants, perhaps a liquid metal and a helium coolant, both Accounts 22.06.01 and 22.06.02 will be used.
Starfire1 used pressurized water as the primary heat transfer media with a steam generator. They included the SG in the primary loop. The Cost Assessment of the Genromak2 and the Starfire Heat Transfer and Transport cost estimates compared very closely with the then-current BWR systems. Starfire also had a divertor loop and a residual heat removal, which were all water systems. The residual heat removal loop was for heat removal during maintenance or in the event of a primary loop failure. This is consistent with fission PWR experience. I do not think any other fusion conceptual design had such a system. It is reasonable to assume the primary loop has enough redundancy to take care of such emergencies. In 2009$, the Starfire primary water loop (3800 MWth) would be $145.97 M including steam generators. The four water/steam generators are estimated at $41.25 M, total. EBTR10 used a similar pressurized water to steam system with similar estimates.
Liquid metals (lithium, lithium lead, and flibe) and helium are higher temperature primary loop coolants that were used in recent ARIES designs, with and without an intermediate coolant loop, depending on the concern about tritium and other power core contaminants migrating to the turbine loop.
Prometheus4 was one of the first dual coolant designs that used helium to remove the heat from the blankets and liquid lead from the first wall. The Prometheus liquid lead first wall heat transfer media are sent to dual-walled steam generators. These SG are different as they transfer liquid lead to steam for the Rankine cycle, whereas the ARIES SG interface Li, LiPb or helium to helium for the Brayton cycle turbines. In 2009$, the Prometheus-L primary liquid metal loop (1267 MWth), without SG, would be $47.27 M. The liquid lead/steam generators are estimated at $43.24 M in 2009$ or $90.51 M for the total LM subsystem cost. See Account 22.06.02 for the helium primary loop.
ARIES-ST and ARIES–CS were more recent dual-cooled designs with LiPb and helium primary coolants. Neither of these designs used an intermediate loop, instead they relied on vacuum permeators in the primary LiPb loop and refractory or SiC HX tubes to limit tritium migration to the turbine loop.
For C22.06.01, Primary (Water or Liquid Metal) Heat Transfer Loop, see Account 22.06, Table 15 for applicable primary coolant algorithms.
Primary (Helium) Heat Transfer Loop, Account 22.06.02 – This helium primary loop account includes all the pumps and motor drives, insulated piping, tanks (dump, make-up, and clean-up),

48
pressurizing equipment, interfaces with tritium extraction components, fluid clean-up system, and in-systems instrumentation and metering. The temperature of the exit helium is probably high enough that the Brayton cycle will likely be used, not the Rankine cycle. The helium pumps can either be driven with motors or with helium turbines, depending on the design approach. Pumping efficiencies will reflect the design choice and the heat recovery from the motor or turbine. The cost algorithms depend on the thermal power handled and the type of pump drive motive power.
Prometheus4 used helium to remove the heat from the blankets (1782 MWth) and transferred it to a separate steam generator. Prometheus also had a second primary loop of lead to remove the thermal power. These Prometheus SGs are different as they transfer helium to steam for the Rankine cycle, whereas the ARIES SG interfaces helium to helium for the Brayton cycle turbines.
Recently, ARIES-I, -I’, and –IV used helium solely as the primary loop heat transfer media as well as in the dual coolant designs of ARIES-ST and –CS. Usually there was a heat exchanger to isolate the primary helium coolant from the turbine working helium fluid. However the ARIES-ST did not have an interfacing heat exchanger and used the same fluid (one loop) for both the power core and turbine.
For C22.06.02, Primary (Helium) Heat Transfer Loop, see Account 22.06, Table 15 for applicable primary coolant algorithms.
Limiter or Divertor Primary Heat Transfer Loop, Account 22.06.03 – This account is used if the divertor is a completely separate heat transfer loop from the primary loop. Although the divertor heat transfer loop may use the same heat transfer media as the blanket primary loop, if it is separate, it will have its own set of piping, pumps and other plumbing subsystems. It probably will tie into the same IHX as the blanket primary loop to separate the primary and intermediate or turbine loop. The Starfire limiter/divertor water system (200 MWth) is estimated at $14.19 M in 2009$. This is quite expensive as compared to the primary loop related to power handled.
This account includes all the pumps and motor drives, insulated piping, tanks (dump, make-up, and clean-up), pressurizing equipment, interfaces with tritium extraction components, fluid clean-up system, and in-systems instrumentation and metering.
For C22.06.03, Limiter or Divertor Primary Heat Transfer Loop, see Account 22.06, Table 15 for applicable primary coolant algorithms. The cost algorithms depend on the thermal power handled and the type of coolant. Table 15 shows algorithms that would be applicable for the limiter or divertor coolant loop with either liquid metal or helium coolants scaled to the appropriate power level.
Intermediate Heat Transfer Loop, Account 22.06.04 - This account represents the case where all or a portion of the heat from the power core elements are transferred to the intermediate coolant loop. The intermediate or secondary heat transfer loop isolates the migration of tritium within the primary loops from the turbine system. If this subsystem is used, it will contain the main steam generator (SG) (Rankine cycle) or intermediate heat exchanger (IHX) (Brayton cycle). The heat transfer media will likely be sodium for the lithium primary coolant and helium might be applicable for all primary coolants. The IHX or SG would be included in this subsystem as it can be a single common component and serve all primary loops. Tritium permeation and migration across the heat exchanger or steam generator will be a primary

49
requirement. This subsystem consists of steam generator/ intermediate heat exchanger, insulated heat transfer piping, fluid circulation subsystem, pressurizing subsystem, and in-systems instrumentation and metering. This system interfaces downstream with the turbine isolation valve and the feed-water heating subsystem.
For C22.06.04, Intermediate Heat Transfer Loop, see Account 22.06, Table 15 for applicable primary coolant algorithms. The cost algorithms depend on the thermal power handled and the type of coolant. Table 15 shows algorithms that would be applicable for the limiter or divertor coolant loop with either liquid metal or helium coolants scaled to the appropriate power level.
[Auxiliary Cooling System, Old Account 22.03] This old account generally was considered to be the cooling system for the cryogenic cooling for the magnets, reference Schulte9. It has been recommended that all cooling services be associated directly with the requiring account, in this case Account 22.02.04, Cryogenics for Plasma Confinement.
Radioactive Materials Treatment and Management, Account 22.07 This account includes all the equipment to treat and manage all the produced radioactive materials in off-line processes. This system would work in coordination with the handling and processing of radioactive materials in the Hot Cell. This system will also accept the gaseous, liquid, and solid impurities and difficult to process materials from the Fuel Handling and Storage system. The intent is to:
– Purify the liquid breeder and/or heat transfer media (such as Li or LiPb) to maintain the concentration of radioactive products below a specific limit
– Prepare the radioactive materials in the proper classification to either be recycled, cleared, or disposed of in the proper off-site repository as discussed by El-Guebaly, et al.27 in “Goals, Challenges, and Successes of Managing Fusion Active Materials”. This on-site treatment and management system is not the intended to accomplish intensive processing, nor is the system intended to be the primary on-line liquid or gaseous processing system to separate out the D and T fuel isotopes as that function would be handled in the Fuel Handling and Storage system (Account 22.08). However, any recovered tritium (e.g., from detritiation) that can be recovered in a cost-effective manner will be returned to the Fuel Handling and Storage system for further processing and refinement.
The location of the processing equipment would probably be in the Hot Cell building. The equipment will include remote handling tools, storage tanks, pumps, piping, valves, heat exchangers, heaters, condensers, gas strippers, compressors, chemical reactors, evaporator systems, ion exchange subsystems, filters, traps, and separators.
The function and content in the Radioactive Materials Treatment and Management account is not well defined at this time. The present functional definition is shown above, but materials handling interfaces may change and the functionality of equipment will likely significantly be modified and improved over the next few decades.
ARIES has used the same algorithm for calculating this subsystem since ARIES-I. The latest algorithm15 was updated for ARIES-AT. Using the updated algorithm for ARIES-AT would be approximately $5.9 M in 2009$ or with the 0.85 factor applied for LSA-1, the cost falls to $5.0 M. This probably significantly underestimates the real cost of this system. Pending more

50
system definition and a semi-detailed cost estimate, it is suggested to triple the cost of this system to around $15 M and normalizing to ARIES-AT fusion power raised to the 0.8 power as the system is strongly dependent on fusion power.
C22.07 = $15 M x (Pfusion/ 1758)^0.8 Recommend obtaining a more current estimate.
Liquid Materials Processing Equipment, Account 22.07.01 – Radioactive liquids for processing and/or disposal will be obtained from liquid streams, either as a steady stream or in a batch process and sent to the liquid materials processing system for separation, purification, and/or treatment. The sources could be the liquid breeders, Fuel Handling and Storage system, Hot Cell, vacuum pumping for the power core or Heat Transfer and Transport systems.
Gaseous Materials Processing Equipment, Account 22.07.02 – Radioactive gases for processing and/or disposal will be obtained from gaseous streams, either as a steady stream or in a batch process and sent to the gaseous materials processing system for separation and treatment. The sources could be the Fuel Handling and Storage system, Hot Cell, vacuum pumping for the power core during operation, shutdown, or bake-out, and Heat Transfer and Transport systems. This might include a line to recover activated cover gases around or within the power core.
Solid Materials Processing Equipment, Account 22.07.03 – Radioactive solids or mixes solids/liquids for processing and disposal will be obtained primarily from the Hot Cell in a batch process and sent to the solids materials processing system for separation, detritiation, and treatment. Radioactive solids can be generated in the power core by erosion and retrieved the vacuum pumps or during maintenance periods or within the breeder and heat transfer systems that can be removed with traps or filters.
Fuel Handling and Storage, Account 22.08 This account is the on-line processing for the extraction, recovery, purification, preparation, and storage of the fuel isotopes. Fuel injection is handled in a separate account (22.03.04). The sources of the liquids and gases for processing are the liquid breeders, chamber gases, purge and cover gases, primary and intermediate coolant streams, all tritium-bearing liquid and gas streams, and the atmospheric detritiation systems in the Power Core, Hot Cell and Fuel and Handling Storage Buildings. This system is also responsible for maintaining safe levels of tritium in all power core and heat transfer fluid streams and in the atmospheres in the detritiated buildings, for both normal and emergency conditions.
Most of the equipment is commercially available, however the reliability and integrity of the subsystems and components will require high standards and high cost because of the tritium-containing fusion materials. For instance, the cost of the atmospheric tritium recovery systems will be quite high due to the requirement to quickly and efficiently lower the tritium concentration to safe levels. The function and content in the Fuel Handling and Storage Equipment account is well known from several existing and under-construction fusion facilities. The set of function subaccounts are revised from prior versions. Some cost escalation will occur due to higher reliability requirements for power plant applications, but learning curve effects for 10th of a kind will tend to compensate. The previously recommended LSA factors for all accounts are 0.85 (LSA1) and 0.94 (LSA 2).
Comparisons with prior designs are difficult because of the lack of definition of the system although the overall function is the same. The available Fuel Handling and Storage cost estimates are illustrated in Table 16. Starfire1 and EBTR10 estimates were based on and scaled
51
from the Mound facility and TSTA, which were $87 M and $111 M (2009$), respectively. Some ARIES algorithms are based on constants and mass flow rates, but subsystem costs were not reported on most recent designs. Miller15 defined, in 2009$, the ARIES-AT fuel processing costs as $1.258 M times the mass per day ^.0.7 (for unknown material mass per day), fuel storage $9.266 M, atmospheric tritium recovery (ATR) $0.50 M x (m3/hr)0.7 (volume flow rate?), water detritiation at $12.50 M, blanket detritiation not provided, but reported at $8 M, and others not reported. Lyon26 reported the ARIES-CS fuel handling system cost at $41 M (2009$). ITER estimated cost is $123 M. The ARIES atmospheric tritium recovery subsystem algorithm costs seem very low, around $3-4 M as compared to most other designs around $38-$48 M. The cost algorithms and reported costs do not seem to be consistent or reflect reality.
I think ITER is a more correct present day estimate for the first of a kind system at $125 M (2009$). However the tenth of a kind at an 85% learning curve would bring the cost down to 58% (= 10^(ln(-0.85)/ln(2)) or $72 M.
C22.08 = $70 M x (fusion power/1758 MW)0.80 (normalized to ARIES-AT fusion power).
Table 16. Comparison of Fuel Handling and Storage Reported Costs in M$ with the Updated ARIES-AT Cost Algorithms15
Chamber Exhaust Gas Handling and Processing Equipment, Account 22.08.01 –This account is responsible for transferring the exhaust gases to a purification and isotope separation system to recover the fuel elements from the exhaust stream and send the remaining gases to the Radioactive Materials Treatment and Management system.
Purge and Cover Gas Handling and Processing Equipment, Account 22.08.02 – This account is responsible for transferring the purge and cover gases to a purification and isotope separation system to recover the fuel elements from the exhaust stream and send the remaining gases to the Radioactive Materials Treatment and Management system.
Primary Coolant Stream Handling and Processing Equipment, Account 22.08.03 – This account is responsible for removing the fuel elements and compounds from all the primary and intermediate coolant streams to a purification and isotope separation system to recover the fuel element from the exhaust stream and send the remaining gases to the Radioactive Materials Treatment and Management system.

52
Other Liquid and Gaseous Coolant Stream Handling and Processing Equipment, Account 22.08.04 - This account is responsible for removing the fuel elements and compounds from the remainder of the plant coolant streams to a purification and isotope separation system to recover the fuel element from the exhaust stream and send the remaining gases to the Radioactive Materials Treatment and Management system.
Purification and Isotope Separation Equipment, Account 22.08.05 –This account is responsible for purification of the separated tritium and deuterium gas and fluid streams. The purified streams are then introduced into an isotope separation system to produce streams of tritium and deuterium.
Tritium, Deuterium, and DT Storage Equipment, Account 22.08.06 – This account is responsible for the storage of the tritium, deuterium and a mixture of DT gases or liquids for use in the plasma fueling subsystem.
Atmospheric Tritium Recovery Equipment, Account 22.08.07 –This account is responsible for the atmospheric tritium recovery subsystems in the Power Core, Hot Cell and the Fuel Handling buildings. This subsystem is responsible to maintain an acceptable tritium partial pressure in normal operations as will as rapid detritiation of the building atmospheres in the case of a tritium leak.
Maintenance Equipment, Account 22.09 This account includes all the remote maintenance equipment necessary to install, service, remove and disassemble all the radioactive components and assemblies in the power plant for both routine and non-routine service needs. The maintenance equipment is subdivided into categories associated with the primary area where significant radioactivity will be present, namely the power core, hot cell, fuel handling and storage and other miscellaneous areas with lower activation levels. General purpose building cranes and hoists are included in the Account 26.01, Transportation and Lifting.
Maintenance equipment and processes have always been a key design and performance issue for fusion power plants that generate high energy neutrons. This is due to the high activation levels inside the power plant and the frequent replacement and service needs due to neutron and particle damage. However these maintenance systems have seldom been adequately defined or reported in the studies. Starfire1 and EBTR15 reported the maintenance equipment costs at the component level for the power core and hot cell as shown in Table 17. However these two studies did not include maintenance equipment for fuel handling and other plant maintenance equipment, which have been added to Table 17. The early ARIES studies normally did not report maintenance costs at all. ARIES-I19 and ARIES–CS26 did not estimate their maintenance costs and included those costs as a part of the Other Power Core Costs, the latter which cost $65 M and $69 M in 2009$, respectively, with no breakdown of subsystem costs. Maintenance equipment would probably the major cost in that account. The updated ARIES algorithm15 for Other Power Core Costs was $0.0019 M/MW x Pth in $1992 or $5.55 M (or $7.93 M in 2009$), although the reported ARIES-CS cost was $60.723 M ($68.7 M in 2009$) was an order of magnitude more than the algorithm predicted. The ARIES algorithm is deemed to be inadequate.

53
Table 17. Comparison of Maintenance Reported Costs, in M$
`
The radiation-hardened remote handling maintenance equipment is crucial to achieve high levels of availability, which is directly related to plant profitability. It would be wise to provide many sets of robust maintenance equipment, but the amount of maintenance equipment has to be tempered with the cost relative to other important systems. Starfire estimated maintenance costs of $154 M and ITER $179 M. Again, the learning curve for 10th-of-a-kind will bring the costs down to the neighborhood of $100 M. Suggest the following algorithm be used for ARIES until a better estimate can be obtained.
C22.09 = $100 M x (Pe net/1000)0.80
Power Core Maintenance Equipment, Account 22.09.01 – This subaccount includes the overhead manipulators supported by the building cranes, mobile casks, transporters, servo-manipulators, hoists, handling machines, end-effectors, inspection and surface metrology equipment, leak detection equipment, cutting/welding/cleanup tools, fixtures, supports and lighting equipment. These equipment classes will service all subsystems contained within the Power Core Building and power core. This equipment will be used in the initial assembly, operational service and repair/replacement, and end-of-life disassembly and decommissioning. Presently, much of the equipment is remote-servo manipulators, but it is likely these will be replaced with fully automated and autonomous equipment.
Hot Cell Maintenance Equipment, Account 22.09.02 – This subaccount includes the overhead manipulators supported by the building cranes, mobile casks, transporters, servo-manipulators, hoists, handling machines, end-effectors, inspection and surface metrology equipment, leak detection equipment, cutting/welding/cleanup tools, fixtures, supports and lighting equipment. These equipment classes will service all subsystems contained within the Hot Cell Building. This equipment will be used in the initial assembly, operational service and repair/replacement, and end-of-life disassembly and decommissioning. Presently, much of the equipment is remote-servo manipulators and glove box enclosures, but it is likely these will be replaced with fully automated and autonomous equipment in the time frame of interest.
Fuel Handling Maintenance Equipment, Account 22.09.03 – This sub-account includes the overhead manipulators supported by the building cranes, servo-manipulators, hoists, handling machines, end-effectors, inspection , leak detection equipment, cutting/welding/cleanup tools, fixtures, supports and lighting equipment. These equipment classes will service all subsystems contained within the Fuel Handling and Storage Building. This equipment will be used in the initial assembly, operational service and repair/replacement, and end-of-life disassembly and decommissioning. Presently, much of the equipment is remote-servo manipulators and glove box enclosures, but it is likely these will be replaced with fully automated and autonomous equipment.
54
Other Plant Maintenance Equipment, Account 22.09.04 – This subaccount is a catch-all account to include all other maintenance equipment to accomplish remote or hands-on maintenance. This might include special equipment for turbines, generators, electric plant and other miscellaneous systems and subsystems. This equipment will be used in the initial assembly, operational service and repair/replacement, and end-of-life disassembly and decommissioning.
Instrumentation and Control, Account 22.10 This account includes all the power core instrumentation and control (I&C). This would include plasma diagnostics. However for the 10th of a kind plant, plasma diagnostics should be a mature understanding of the plasma behavior and its control aspects. Therefore, all those diagnostic instruments will be incorporated into the plasma and power core instrumentation and control systems. It is anticipated that the I&C technologies will be much more advanced than current capabilities. This system will include the power core instrumentation and control, radiation and monitoring equipment, isolated indicating and recording equipment, data acquisition and recording, and communication equipment. The overall control function for the power plant probably will be included in this account although the WBS would indicate it is just for the power core.
The Instrumentation and Control (I&C) is notionally described, but the exact equipment content will not be known until the Demo has operated successfully. Significant technology advances are anticipated in this system. Most fusion I&C estimates were all were based on the Starfire estimate of $55 M in 2009$ - see Table 18 for the Starfire1 data and the ARIES reported costs and calculated algorithm data. The three ARIES algorithms of constant values have been escalated over the years, but still remain in the $50-$60 M class when expressed in 2009$. The instrumentation for a fusion power plant should be simpler than an experiment (ITER is $336 M), but it is still a very complex facility to control. ITER also is an experimental facility with lots of diagnostics and data gathering and analysis capability. The fusion plant I&C probably should cost in the $55 M-$60 M class to be consistent with the other plant systems. Suggest retaining the present constant cost of $60 M in 2009$.
C22.10= $60 M.
55
Table 18. Comparison of Instrumentation and Control Costs, In M$
Power Core Instrumentation and Control Equipment, Account 22.10.01 – This subaccount includes all the instrumentation and control equipment to monitor and manage the plasma and all its related functional equipment contained in the Power Core (includes all equipment in Account 22). There is also a high degree of linkage to all I&C functions for the remainder of the plant and this system may serve as the primary plant control system (to be determined).
Radiation Monitoring Equipment, Account 22.10.02 – Monitoring of all forms of radiation within and outside the plant is a critical function that is the responsibility of the equipment in this account. This monitoring equipment will insure that safe levels of radiation are maintained during routine plant operations, determining the tritium inventories in all plant components, and analyze/report any fault or accidental release of radioactive materials.
Isolated Indicating and Recording Equipment, Account 22.10.03 – This account includes all indicating and recording equipment that is physically isolated from the main power core, yet is necessary to monitor the performance and health of the power core and its related equipment.
Data Acquisition and Recording Equipment, Account 22.10.04 – The fusion power core is a highly complex facility, which generates enormous amounts of data to be acquired and recorded for analysis to properly control the fusion plasma and the plant. The access rate for the data acquisition will be very high to be able to adequately control the plasma real time. The data storage needs will be extremely high, necessitating the need for the most current data storage capabilities.
Communications Equipment, Account 22.10.05 – This communication equipment will handle all forms of communication both inter-and intra-plant. Communication will include audio, video, electronic forms.
Other Power Core Equipment, Account 22.11 This account encompasses all other power core equipment not specifically identified elsewhere. This includes the special heating systems, special cooling systems (low temperature shielding, vacuum vessel, and other systems), coolant receiving/storage/makeup system, gas systems and inert atmosphere systems. In earlier cost assessments, the maintenance equipment was included

56
in this account. However the plant maintenance is such an important element in the fusion plant, it was estimated under its own major account (22.09).
Starfire1 and EBTR10 provided a detailed breakdown of these subaccounts in roughly the $13 M range. Only ARIES-I and –CS were reported at the 22.11 level, however, all ARIES designs included the maintenance and all other power core equipment into a single algorithm. ARIES provided an algorithm based on Gross Thermal Power to estimate the cost of the Other Power Core Equipment, $0.002717 M x Pth. The data in the Table 19 would indicate that the algorithm is only estimating the cost of the Other Plant Equipment. The reported costs for ARIES-I and –CS probably had maintenance costs also included. A reasonable algorithm would be to baseline the cost at $8 M based on ARIES historical costs and scale to a normalized net electric power raised to 0.8 power. This new cost algorithm would not account for the maintenance costs, which are already included in Account 22.09.
C22.11 = $8 M x (Pe net/1000)0.80
Table 19. Comparison of Other Power Core Costs, in M$
Special Heating Equipment, Account 22.11.01 – Special heating systems are used for heating or preheating power core or plant equipment to clean plasma chamber surfaces or heat components up to operating temperatures. It will also prevent liquid metals from solidifying in the piping.
Special Cooling Equipment, Account 22.11.02 – Most of the nuclear energy will be captured in the high temperature components in the power core. However, some of the energy and heat will be captured in non-power producing elements, such as the vacuum vessel and low temperature shield. Other plant components will have to be cooled to remove waste heat or maintain proper operating temperature (pumps, cryogenic equipment, electronics, etc.). The special cooling equipment will provide heat removal for these systems. There is some possibility of tritium migration into the supported systems, therefore there probably be some monitoring and removal capability for tritium in this system.
Includes Maintenance Equipment costs
57
Coolant Receiving, Storage, and Makeup Equipment, Account 22.11.03 – This account will include the receiving, storage, and makeup equipment for all the power core systems. This would include the primary heat transfer fluid (water, helium, CO2, lithium, lead, lithium-lead or other fluid), secondary heat transfer fluid (helium or sodium), cryogenic fluids (helium, nitrogen, or argon), and specially treated waters.
Gas Systems Equipment, Account 22.11.04 – This account would include any gas not specifically associated with another system. This would include purge and cover gases in the power core and inert gas systems for the power core building.
Inert Atmosphere Equipment, Account 22.11.05 – The equipment in this system is intended to provide a sub-atmospheric pressure, inert gas environment in the buildings that have a potential to have a tritium leak. This would include the fans for maintaining the pressure differential, valves to seal the building, and monitoring equipment. When significant tritium concentrations are detected, the Atmospheric Tritium Recovery System will commence.
Summary of Power Core Equipment, Account 22 Many of the accounts within the Power Core Equipment, Account 22, have been revised and updated. However, not all Account 22 cost accounts are known to the author. So only those defined can be analyzed and compared to the published ARIES-AT cost estimates.

58
Turbine-Generator Plant Equipment, Account 23 This account defines the costs associated with the Turbine-Generator Plant Equipment (TPE), which takes the thermal energy from the fusion power core and other high temperature power plant facilities (e.g. inertial confinement driver systems) via the main heat transfer and transport system and converts it to electrical energy. The remaining thermal energy is transferred back to the fusion power core or to the Heat Rejection System.
In the earlier fusion plant designs, the turbine-generator plant has been based on the Rankine (steam) cycle. However, the search for higher efficiency energy conversion systems has introduced the Brayton cycle. In the fusion application, with the need to minimize tritium release to the workers and the general public, both cycles will be closed systems. The subaccounts are structured to accommodate both types of conversion systems with functionally similar categories. The subaccounts in this account are Turbine-Generators, Main Heat Transfer Fluid System, Condensing or Heat Sink Heat Exchanger, Feedwater Heating or Heat Recovery System, and Other Turbine Plant Equipment. The costs for the Rankine and Brayton systems will be different and probably be estimated at this upper level.
Costs for all fusion studies prior to ARIES-AT included the Heat Rejection System within TPE costs. However beginning with ARIES-AT study, Heat Rejection System is a separate account and this is consistent with Gen-IV and other fission plant accounting.
The TPE costs for Starfire1, EBTR10 and Prometheus4 were developed by their architect and engineer (A&E) contractors based on prior bids for similar equipment, so the cost basis should be sound, but very dated and applicable only to the Rankine cycle. Beginning in the ARIES-II-IV Systems Studies16, Bathke and Miller adopted TPE costing algorithms developed by J. Delene that was based on the type of primary coolant used and the gross electric power. These algorithms were updated for ARIES-AT and then documented by Ron Miller15 in 2008. Effectively there were no LSA cost factors for the TPE as all environmental levels had a cost factor of 1.0. It is now felt that there should be no correlation of the primary loop fluid to cost of the turbine-generator plant equipment because there will likely be an intermediate heat exchanger to separate the primary loop and the turbine loop. Additionally, there also may be a separate intermediate loop to further isolate the turbine loop from the primary loop. Thus, the choice of primary loop coolant should not be used to estimate the cost of the TPE. Data from prior studies were researched, but it is not relevant to show that data. The reported plant TPE system costs ranged from $350 M to $490 M in 2009$.
General Atomics agreed to provide new algorithms for the TPE account. In lieu of obtaining these new algorithms, it is recommended to temporarily use these approximate algorithms to estimate the Turbine-Generator Plant Equipment.
In the interim, the writer developed cost relationships based on the input thermal power and the efficiency of the turbine-generator set. In the Rankine cycle of interest, the current conversion cycle efficiencies are in the range of 43-45%, so due to the small range of Rankine cycle efficiencies there is no need to consider the efficiency as a performance parameter. For Brayton cycles, the thermal conversion efficiencies can range from about 43% up to 60% with a considerable range of heat transfer media and turbine temperatures. So the following equations were developed to span those ranges of costs and efficiencies and provide parametric scaling with respect to thermal power and gross thermal efficiency. Figure 3 illustrates these equations
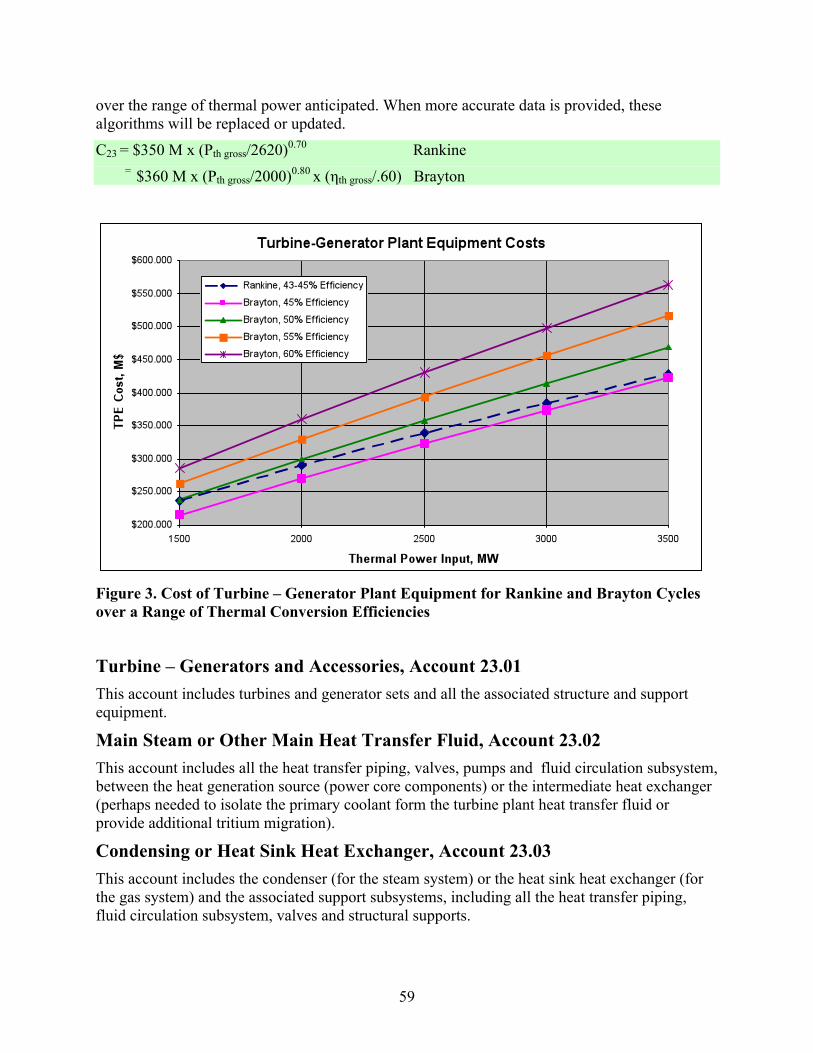
59
over the range of thermal power anticipated. When more accurate data is provided, these algorithms will be replaced or updated.
C23 = $350 M x (Pth gross/2620)0.70 Rankine
= $360 M x (Pth gross/2000)0.80 x (ηth gross/.60) Brayton
Figure 3. Cost of Turbine – Generator Plant Equipment for Rankine and Brayton Cycles over a Range of Thermal Conversion Efficiencies
Turbine – Generators and Accessories, Account 23.01 This account includes turbines and generator sets and all the associated structure and support equipment.
Main Steam or Other Main Heat Transfer Fluid, Account 23.02 This account includes all the heat transfer piping, valves, pumps and fluid circulation subsystem, between the heat generation source (power core components) or the intermediate heat exchanger (perhaps needed to isolate the primary coolant form the turbine plant heat transfer fluid or provide additional tritium migration).
Condensing or Heat Sink Heat Exchanger, Account 23.03 This account includes the condenser (for the steam system) or the heat sink heat exchanger (for the gas system) and the associated support subsystems, including all the heat transfer piping, fluid circulation subsystem, valves and structural supports.

60
Feedwater Heating or Heat Recovery System, Account 23.04 This account is associated with the recovery of lower grade heat to provide greater system efficiency with feedwater heating or heat recovery with a recuperator or reheater. This account will include heat exchangers, piping, valves, and support equipment.
Other Turbine Plant Equipment, Account 23.05 This account includes the turbine and generator auxiliaries, associated cooling systems, fluid makeup, chemical treatment and purification, and central lubrication systems.
Turbine Plant Instrumentation and Control, Account 23.06 This account includes the process instrumentation and control, automatic monitoring and control and the isolated indicating and recording instruments for the turbine plant.

61
Electrical Plant Equipment, Account 24 This account defines the costs associated with the Electric Plant Equipment (EPE), which takes the electrical energy from the turbine-generator sets and distributes to the plant power systems and to the grid connection.
The subaccounts in this account are switchgear, stations service equipment, switchboards, trace heating, protective equipment, electrical structures, wiring containers, power and control wiring, and electrical wiring. The power and control wiring are the largest cost component.
The EPE costs for Starfire1 and EBTR10 were developed by their A&E contractors based on prior bids for similar equipment, so the cost basis should be sound, but very dated. Beginning in the ARIES-II-IV Systems Studies16, Bathke and Miller adopted EPE costing algorithms defined by J. Delene that were based on gross electric power and the LSA factor. These algorithms were updated and documented for ARIES-AT by Ron Miller15 in 2008. Table 20 shows the reported and the calculated EPE costs using the Miller updated algorithms. The EPE algorithm is $182.98 M x (Pe gross/1200).0.49 (in 2009$) times the LSA factor (0.75 for LSA=1, 0.84 for LSA = 2,3 and 1.0 for LSA=4 (see Table 4 for more LSA values).
Table 20. Comparison of Electrical Plant Equipment Costs, in M$
There does not seem to any logical reason to link the LSA to the cost of the EPE system as the EPE is quite removed from the nuclear aspects of the power core. The capacity of the subsystems is not influenced by the nuclear characteristics. If the LSA factor is disregarded, the nominal EPE cost for a 1200 WMe gross plant would be $183 M in 2009$.
C24 = $182.98 M x (Pe gross/1200)0.50
Switchgear, Account 24.01 This account includes the cost of the switchgear for the generator circuits and the station service. The generator circuit switchgear includes the generator circuit breaker, grounding transformer, current limiting reactor, disconnect switch and outdoor oil circuit breaker. The station service switchgear includes switchgear lines for the electrical busses and all the major facility buildings

62
Station Service Equipment, Account 24.02 The Station Service Equipment includes the service and lighting transformer, the 480V load center and motor control center, the DC and UPS systems, battery systems for the Turbine Generator and the computer systems for the Electric Plant equipment.
Switchboards, including Heat Tracing, Account 24.03 This account includes the main control boards for the electrical systems, the auxiliary power and signal boards, electric heat tracing systems, and constant voltage regulation transformer.
Protective Equipment, Account 24.04 This account includes the cathodic grounding systems with grounding rods, lightning protection and miscellaneous cables, connector and supports.
Electrical Structures and Wiring Containers, Account 24.05 This account includes cable trays, metallic conduits, and supporting structures.
Power and Control Wiring, Account 24.06 This account is largely a labor intensive activity associated with the wiring and wiring installation for the generator circuits, the station service and control wiring, the instrument wiring and connections, the containment penetrations, and interconnections with the DC power supplies and coils.
Electrical Lighting, Account 24.07 This account is a subcontracted effort, which includes electrical lighting for the complete facility.
Heat Rejection Equipment, Account 25 This account defines the costs associated with the Heat Rejection Equipment, which takes the lower grade heat rejected from the turbine plant equipment and the closed coolant systems, turbine plant cooling systems, electrical component cooling loads, cryogenic systems and the I&C systems. This system dissipates this heat to the local environment. The ultimate heat sink is commonly a wet or dry cooling tower and/or groundwater.
The early fusion plant studies, Starfire1, EBTR10, and Prometheus-L4 relied on A&E estimates, which were quite high, as shown in Table 21. These studies as well as the early ARIES studies through ARIES-RS included the Heat Rejection subsystem in the Turbine Plant Equipment cost account. After those studies, starting with ARIES-ST, a series of algorithms were developed for the Heat Rejection Equipment based on the rejected power. The LSA cost factor was 1.0 for all LSA values.
• ARIES-I19 used an algorithm = $0.149 M x (Pth rej)0.8 (in 2009$)
• Delene3 had an algorithm = $89.51 M x (Pth rej/2300) (in 2009$)
• Prometheus4 used a scaling algorithm = $87.199 M x (Pth rej/1860)0.8 (in 2009$)
• ARIES-AT used an algorithm = $87.52 M x (Pth rej/2300) (in 2009$) that was upgraded by Miller15 from the prior ARIES-II-IV Systems Studies16 algorithm by Miller and Bathke. It is virtually identical to the Delene algorithm.

63
• Thompson28 had an algorithm = $2.400 x (Pth rej x106)0.8 (in 2009$)
These algorithms were calculated for several fusion power plants and compared to the reported estimates for this Heat Rejection Account, see Table X-14. The final ARIES-AT algorithm works fairly well to predict most of the reported costs.
C25 = $87.52 M x (Pth rej /2300)
Table 21. Comparison of Heat Rejection Equipment Costs, in M$
Water Intake Common Facilities, Account 25.01 This account includes facilities necessary to provide cooling and miscellaneous water needs for the entire plant. The plant is typically located near a large body of water to provide the necessary supply and release of the water. Environmental restrictions will apply to this system.
Circulating Water Systems, Account 25.02 This account includes piping, pumps, and heat exchangers for the circulating water systems throughout the plant.
Cooling Towers, Account 25.03 This account includes the natural draft cooling tower structures and the tower foundations. This does not include the heat rejection cooling tubes, which are included in Account 23.03, Condensing or Heat Sink Heat Exchanger. Other Heat Rejection Equipment, Account 25.04 This account includes other miscellaneous equipment associated with the heat rejection system.
No Data

64
Miscellaneous Plant Equipment, Account 26 This account defines the general equipment costs associated with all parts of the plant, including transportation and lifting equipment, air and water service systems, communication equipment, and furnishing and facilities.
Again Starfire1, EBTR10, and Prometheus-L4 relied on support from their A&E subcontractors for estimating expertise in their reported estimates as shown in Table 22. After those studies, a series of algorithms were developed for ARIES based on gross electrical power. The most recent algorithm15 for ARIES-AT was $88.89 M x (Pe gross /1200)0.59 in 2009$. The LSA cost factor was 0.85 for LSA1, 0.90 for LSA2, 0.93 for LSA3 and 1.0 for LSA4. I would recommend eliminating any LSA factors for the Miscellaneous Plant Equipment.
These algorithms were calculated for several fusion power plants and compared to the reported estimates for this Heat Rejection Account, see Table X-14. The final ARIES-AT algorithm works fairly well to predict most of the reported costs. Most costs were in the $80-85 M range for gross electric powers from 1200 to 1400 MW. ARIES-AT and ST did not seem to follow the provided algorithm. I recommend adopting a new algorithm to fit the existing data and no LSA factor. C26 = $88.89 M x (Pe gross/1200)0.6
Table 22. Comparison of Miscellaneous Plant Equipment Costs, in M$
Transportation and Lifting Equipment, Account 26.01 This account includes the transportation and lifting equipment for the entire plant. This account includes all the non-dedicated maintenance cranes and transportation systems. The cranes and some other equipment in high radiation areas (such as the power core, hot cell, and fuel handling and storage) will have to be radiation hardened.
Air and Water Service Equipment, Account 26.02 This account includes all the air and water service equipment not specifically required for other systems
Communications Equipment, Account 26.03 This account includes all the communication equipment and wiring for the entire plant.
65
Furnishing and Fixtures, Account 26.04 This account includes all the furnishing and fixtures for the entire plant.

66
Special Materials, Account 27
This account covers the special materials added to the fusion power plant just before testing and validation commences. The common categories for these materials are heat transfer fluids, cover gases for material handling systems and buildings, breathing air, and specialty gases or liquids not preloaded into the plant systems. These materials are considered to be capital equipment, but not be procured with the various plant systems and not subject to construction loans. Replenishment of these materials is considered to be an operational expense. The special materials will include specially treated water, liquid metals, cryogenic liquids, gases, and perhaps some solid materials.
As seen in Table 23, Starfire1 and EBTR10 (with H2O primary coolant) set aside a $0.57 M (in 2009$) allowance for Special Materials. Prometheus-L4 estimate was $1.93 M (in 2009$) for Pb coolant plus other materials. ARIES started using a mass-based algorithm beginning with ARIES-I. The helium-cooled plants estimated their Special Materials costs from $0.8 M to $1.0 M. With the change to a natural lithium coolant (ARIES-II and –RS), the special materials costs were significantly increased to $21 M and $16 M, respectively, in 2009$. With the highly enriched LiPb coolant, the costs skyrocketed to $119-171 M (ARIES-AT, ARIES-ST, and ARIES-CS). In the several ARIES design studies where enriched lithium is required, algorithms were developed and graphs/tables were shown, but all the data is attributable back to a 1982 University of Wisconsin – Madison conceptual study, UWTOR-M29, which included a graph of lithium and LiPb with enrichment from natural to 90% enriched 6Li. This study defined a linear relationship with enrichment, which indicated the mixing of pure 6Li with natural lithium to obtain the desired enrichment mixture. However, these data are now considered to be very dated with no present large-scale production capabilities. A notional price point and parametric algorithms are provided in a following paragraph.
Table 23. Comparison of Previous Special Material Costs, in M$
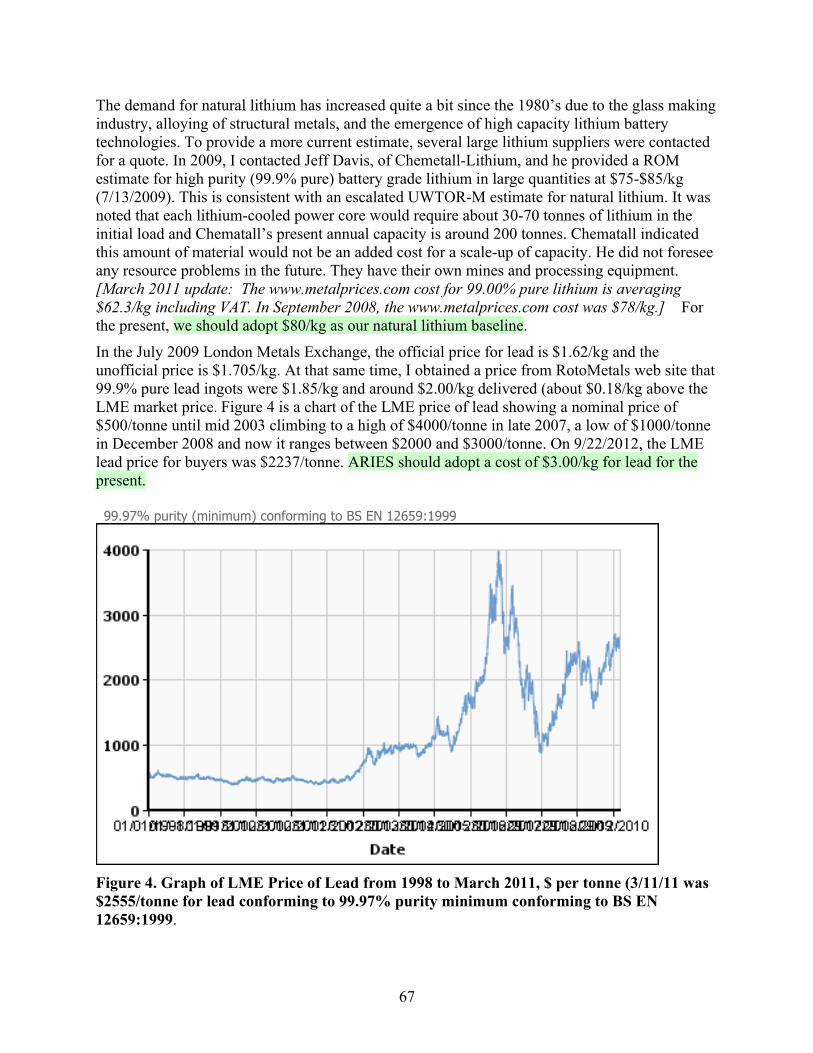
67
The demand for natural lithium has increased quite a bit since the 1980’s due to the glass making industry, alloying of structural metals, and the emergence of high capacity lithium battery technologies. To provide a more current estimate, several large lithium suppliers were contacted for a quote. In 2009, I contacted Jeff Davis, of Chemetall-Lithium, and he provided a ROM estimate for high purity (99.9% pure) battery grade lithium in large quantities at $75-$85/kg (7/13/2009). This is consistent with an escalated UWTOR-M estimate for natural lithium. It was noted that each lithium-cooled power core would require about 30-70 tonnes of lithium in the initial load and Chematall’s present annual capacity is around 200 tonnes. Chematall indicated this amount of material would not be an added cost for a scale-up of capacity. He did not foresee any resource problems in the future. They have their own mines and processing equipment. [March 2011 update: The www.metalprices.com cost for 99.00% pure lithium is averaging $62.3/kg including VAT. In September 2008, the www.metalprices.com cost was $78/kg.] For the present, we should adopt $80/kg as our natural lithium baseline.
In the July 2009 London Metals Exchange, the official price for lead is $1.62/kg and the unofficial price is $1.705/kg. At that same time, I obtained a price from RotoMetals web site that 99.9% pure lead ingots were $1.85/kg and around $2.00/kg delivered (about $0.18/kg above the LME market price. Figure 4 is a chart of the LME price of lead showing a nominal price of $500/tonne until mid 2003 climbing to a high of $4000/tonne in late 2007, a low of $1000/tonne in December 2008 and now it ranges between $2000 and $3000/tonne. On 9/22/2012, the LME lead price for buyers was $2237/tonne. ARIES should adopt a cost of $3.00/kg for lead for the present. 99.97% purity (minimum) conforming to BS EN 12659:1999
Figure 4. Graph of LME Price of Lead from 1998 to March 2011, $ per tonne (3/11/11 was $2555/tonne for lead conforming to 99.97% purity minimum conforming to BS EN 12659:1999.
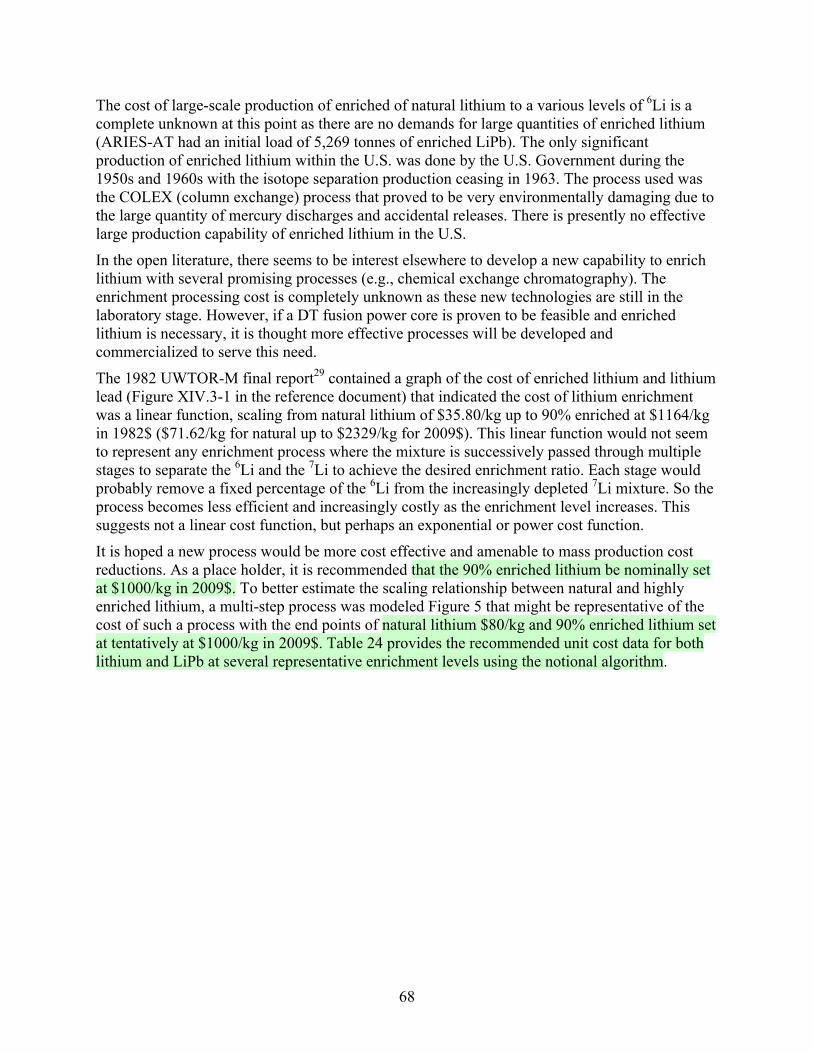
68
The cost of large-scale production of enriched of natural lithium to a various levels of 6Li is a complete unknown at this point as there are no demands for large quantities of enriched lithium (ARIES-AT had an initial load of 5,269 tonnes of enriched LiPb). The only significant production of enriched lithium within the U.S. was done by the U.S. Government during the 1950s and 1960s with the isotope separation production ceasing in 1963. The process used was the COLEX (column exchange) process that proved to be very environmentally damaging due to the large quantity of mercury discharges and accidental releases. There is presently no effective large production capability of enriched lithium in the U.S.
In the open literature, there seems to be interest elsewhere to develop a new capability to enrich lithium with several promising processes (e.g., chemical exchange chromatography). The enrichment processing cost is completely unknown as these new technologies are still in the laboratory stage. However, if a DT fusion power core is proven to be feasible and enriched lithium is necessary, it is thought more effective processes will be developed and commercialized to serve this need.
The 1982 UWTOR-M final report29 contained a graph of the cost of enriched lithium and lithium lead (Figure XIV.3-1 in the reference document) that indicated the cost of lithium enrichment was a linear function, scaling from natural lithium of $35.80/kg up to 90% enriched at $1164/kg in 1982$ ($71.62/kg for natural up to $2329/kg for 2009$). This linear function would not seem to represent any enrichment process where the mixture is successively passed through multiple stages to separate the 6Li and the 7Li to achieve the desired enrichment ratio. Each stage would probably remove a fixed percentage of the 6Li from the increasingly depleted 7Li mixture. So the process becomes less efficient and increasingly costly as the enrichment level increases. This suggests not a linear cost function, but perhaps an exponential or power cost function.
It is hoped a new process would be more cost effective and amenable to mass production cost reductions. As a place holder, it is recommended that the 90% enriched lithium be nominally set at $1000/kg in 2009$. To better estimate the scaling relationship between natural and highly enriched lithium, a multi-step process was modeled Figure 5 that might be representative of the cost of such a process with the end points of natural lithium $80/kg and 90% enriched lithium set at tentatively at $1000/kg in 2009$. Table 24 provides the recommended unit cost data for both lithium and LiPb at several representative enrichment levels using the notional algorithm.
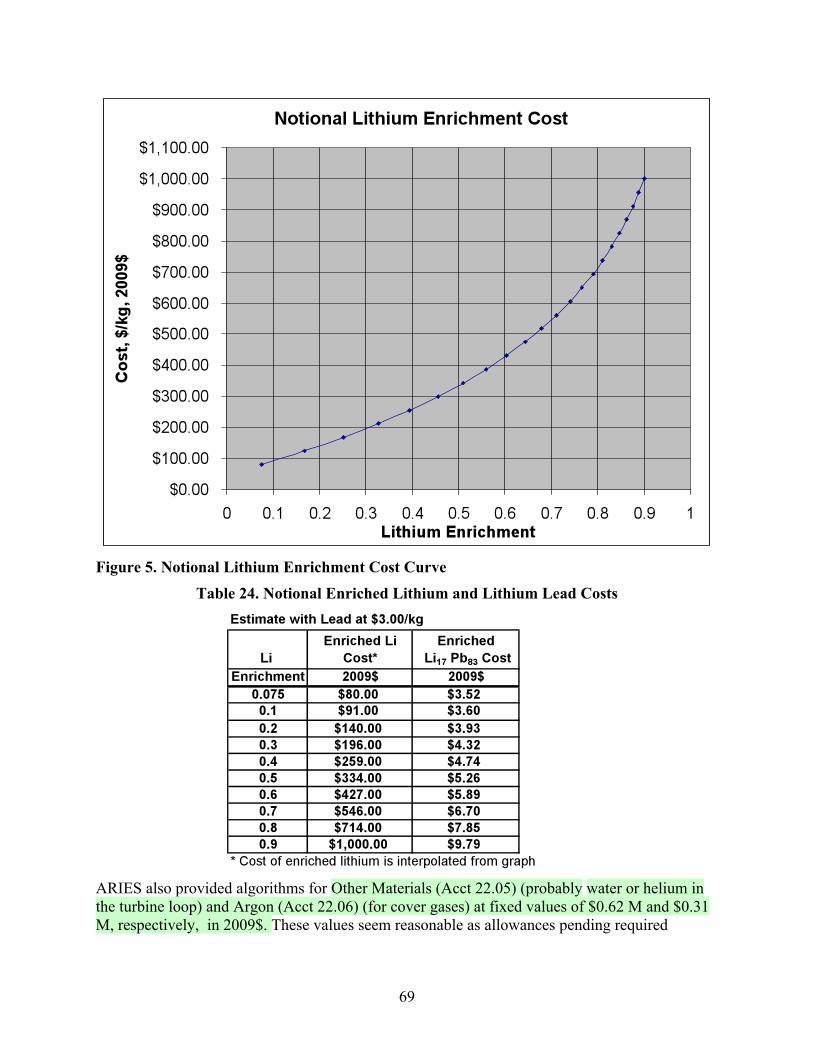
69
Figure 5. Notional Lithium Enrichment Cost Curve
Table 24. Notional Enriched Lithium and Lithium Lead Costs
ARIES also provided algorithms for Other Materials (Acct 22.05) (probably water or helium in the turbine loop) and Argon (Acct 22.06) (for cover gases) at fixed values of $0.62 M and $0.31 M, respectively, in 2009$. These values seem reasonable as allowances pending required
70
masses. The total Special Material account can be obtained by summing the liquid metals, argon and other special materials that are loaded just before startup.
The previous pages described the plant elements that are defined to be direct capital costs. The following pages describe the development and evolution of the fusion indirect cost accounts including the interest and escalation during construction and the annual costs accounts with the methodologies to convert annual costs to cost of electricity elements. The underlying financial assumptions are documented regarding the construction schedule, cash flow during the construction period, the methods to estimate the interest and escalation during construction, and the fixed charge rate. The annual cost factors are also documented. Various authors, over a period of 30 years, contributed to this body of knowledge. But it is time to revisit those assumptions and evolved methodologies to see if they are the best method to compare fusion plant concepts among themselves and to the current and future competing power source.
For C27, Special Materials to be installed just prior to testing and validation, = sum of material masses times the unit cost per mass.

71
Indirect Costs, Accounts 91-99 As a part of defining all the fusion power plant cost accounts, Schulte, et. al.9 prescribed the definition of the indirect cost accounts and recommended values for use in conceptual fusion power plant studies. The specific indirect cost accounts are shown below with suggested allowances as defined by Schulte:
Acct 91, Construction Facilities, Equipment, and Services 15% of Total Direct Cost
Acct 92, Engineering and Construction Management Services 15% of Total Direct Cost
Acct 93, Owners Cost 5% of Total Direct Cost\
In addition to these indirect cost accounts, other indirect costs will include contingency and the time-related indirect costs, such as interest and escalation costs accumulated over the construction period
Construction Facilities, Equipment, and Services; Engineering and Construction Management Services and Owners Costs, Accounts 91, 92 and 93 (+ new Account 94) The Schulte report9 referenced a prior Mc Donnell Douglas Astronautics report30 that compiled indirect cost data from several then recent fission plants, namely TFTR, GA EPR, Wash 1230, and the UWMAK studies.
L. Waganer, in the 1980 Starfire conceptual design1 study, developed a total plant cost estimate for a more modular approach and standardized design to make the plant more affordable and quicker to build (6 years) than the plants referenced in the McDonnell Astronautics report. This standardized design and modular construction with major assembly and checkout at an off-site location would also help reduce the indirect costs and this approach as been adopted by all subsequent fusion power plant conceptual designs. He reduced the indirect costs of Construction Services to 10%, Engineering and Construction 8%, and Owner (or Other) costs were estimated to be 5% (all are functions of direct capital costs). Thus the total indirect costs were reduced from 35% in the Schulte recommendation to 23% in Starfire. The 1981 ELMO Bumpy Torus Reactor and Power Plant10, also estimated by Waganer, adopted a shorter 5-year construction schedule (due to a higher degree of modularity) and retained the same indirect cost parameters as Starfire. Many other following fusion conceptual design studies retained this costing methodology until the Sheffield and Delene2 Generomak report reassessed many cost account bases and associated parameters. They recommended the construction time to be 8 years and the indirect costs increase to 15%, 25%, and 10% for a total indirect charge of 50%. Sheffield and Delene further proposed an indirect cost factor time-related algorithm in place of several separate indirect cost accounts that was normalized to the base construction time of 8 years:
fIND ~ (0.5 * (construction time/8) for construction times between 6 and 12 years.
The prior indirect cost models are shown in tabular form in the Table 25. The Generomak model recommended an indirect cost factor 0.375 for 6-year construction and 0.50 for 8-year construction time. For the 6-year construction, this would equate to 11.25%, 18.75%, and 7.5% for the three indirect cost accounts (91, 92, and 93).

72
Table 25. Early Plant Studies Estimates of Indirect Costs (% of Total Direct Cost)
Later, the Delene 1990 Generomak Cost Model Update31 further modified the indirect accounts by subdividing into four accounts and linking the values to the Level of Safety Assurance (LSA) (Table 26 reproduces the Delene table). (Note that this reference only defined values associated with LSA of 3 and 4.)
Table 26. Delene31 Indirect Cost Factors (% of Direct Costs) with LSA factors Account LSA = 4 LSA = 3
Acct 91, Construction Services 15.1 % 12.8 %
Acct 92, Engr and Home Office Services 5.2 % 5.2 %
Acct 93, Field Supervision & Services 8.7 % 6.4 %
Subtotal 29.0 % 24.4 %
Account 94 Owners Costs (15% of D + ID costs) 19.35 % 18.66 %
Total Indirect Costs 48.35 % 43.06 %
The LSA factors defined in the ESECOM Report11 represented potential cost savings in direct and indirect costs of fusion power plant during construction and operation. L El-Guebaly32 summarized the LSA philosophy and the cost implications as related to some ARIES design concepts. The LSA cost modifying factors were originally derived from fission AP600 advanced Westinghouse designs, claiming ~25 % cost reduction from passive-safety features and elimination of some active-safety components. In the 1980s, two sets of cost reduction factors were developed by Maya & Schultz (GA) for inertial fusion and by Perkins (LLNL) for magnetic fusion11 (ref. ESECOM study). The set of four LSA factors for MFE defined in the ESECOM study was then updated by Delene3, and used in the Generomak code. A standard PWR would have LSA=4 and a coal plant would have the environmentally friendly LSA=1 (now a coal plant might not be so environmentally friendly). An advanced PWR with passive safety features may fall into LSA=3 category. Subsequent updates and detailed breakdown of LSA factors were issued by Bathke, Delene and Miller in the 1990s for advanced fusion power plants 16,7,12].
The LSA cost credits represent:
– Savings for passive safety and simplifications resulting from elimination of active safety systems
– Reduction in cost of QA requirements
– Substitution of conventional components for nuclear-safety-grade (N-stamped) components, representing reduction of bulk materials and labor costs

73
– Considerations related to extreme loads (e.g., seismic, missiles, tornadoes, hurricanes, airplane crash, etc.)
– Investment protection considerations (e.g., no meltdown during severe accident, structural integrity during disruption/VDE/ELMs in fusion, etc.).
By definition:
LSA = 4 Denotes active protection (i.e., active engineered safety systems are required); the system does not meet minimum requirements for inherent safety.
LSA = 3 Safety is assured by passive mechanisms of release limitation as long as severe violations of small-scale geometry are avoided (e.g., large coolant pipe breaks).
LSA = 2 Safety is assured by passive mechanisms as long as severe reconfiguration of large-scale geometry is avoided.
LSA = 1 Safety is assured by passive mechanisms of release limitation for any accident sequence; radioactive inventories and material properties preclude fatal release regardless of power plant’s condition.
The ARIES studies from 1990 to 2009 used the Delene’s and Miller’s guidance for direct and indirect cost account values, indexed to LSA level 16,7. Table 27 below lists all the indirect cost factors with subtotals and total factors for the ARIES project6 from the recent ARIES-AT design14. The table also includes contingency (to be discussed in a later section) and interest during construction (IDC). The Owners Cost (Account 94) is defined as 15% of the prior total direct and indirect costs per the previous Delene and Miller guidance. However, ARIES chose to calculate all the indirect, contingency and interest during construction costs as a function of the Total Direct Costs as shown below in Table 27. If calculated in this manner, any changes in the other prior indirect costs would not be correctly reflected in the Accounts 94, 95, 96, and 97, therefore the latter approach is not recommended.
Table 27. ARIES-AT Indirect Cost Factors for LSA Ratings (% of Direct Costs)
The Gen-IV cost estimating guidelines24 defined a very detailed set of indirect costs, including field indirect, capitalized field management, capitalized owner operations, and capitalized supplementary costs. They provided one example algorithm for the nuclear island and BOP field indirect costs and suggested other indirect account algorithms could be developed.
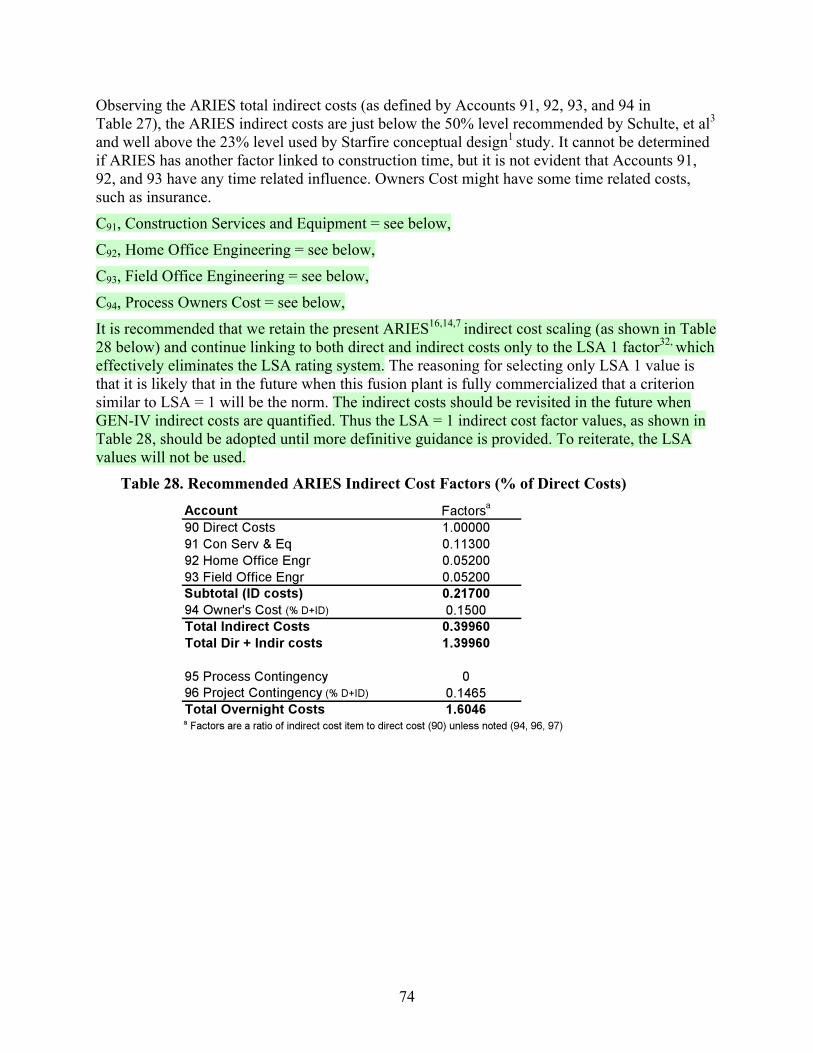
74
Observing the ARIES total indirect costs (as defined by Accounts 91, 92, 93, and 94 in Table 27), the ARIES indirect costs are just below the 50% level recommended by Schulte, et al3 and well above the 23% level used by Starfire conceptual design1 study. It cannot be determined if ARIES has another factor linked to construction time, but it is not evident that Accounts 91, 92, and 93 have any time related influence. Owners Cost might have some time related costs, such as insurance.
C91, Construction Services and Equipment = see below,
C92, Home Office Engineering = see below,
C93, Field Office Engineering = see below,
C94, Process Owners Cost = see below,
It is recommended that we retain the present ARIES16,14,7 indirect cost scaling (as shown in Table 28 below) and continue linking to both direct and indirect costs only to the LSA 1 factor32, which effectively eliminates the LSA rating system. The reasoning for selecting only LSA 1 value is that it is likely that in the future when this fusion plant is fully commercialized that a criterion similar to LSA = 1 will be the norm. The indirect costs should be revisited in the future when GEN-IV indirect costs are quantified. Thus the LSA = 1 indirect cost factor values, as shown in Table 28, should be adopted until more definitive guidance is provided. To reiterate, the LSA values will not be used.
Table 28. Recommended ARIES Indirect Cost Factors (% of Direct Costs)

75
Contingency, Accounts 95 and 96 Per Schulte, et al9, the contingency allowance is for unforeseen and/or unpredictable expenses that might be incurred during facility construction and startup. Contingency should reflect any cost uncertainty resulting from potential acts of nature and non-design related construction problems. Uncertainties from technical design should be accounted for in design allowances. It should be noted that fusion power plants are considered to be the 10th of a kind, so any design allowances should be minimal at that point in time for the 10th plant. No specific value for contingency was provided by Schulte, but he supplied an example of 10% contingency in each direct cost subaccount in Appendix I of his report. In 1989, a report13 by Schulte, et al. on Standard Unit Costs and Cost Scaling Rules (for fusion power plant studies) recommended a value of 15% of accounts 21 through 25 be provided as a contingency amount to account for unforeseen expenses. Starfire1 adopted these guidelines at 15% of the direct cost, but included this amount on each of the subaccounts (21-25), but omitted applying the contingency to the cost of spares.
The Sheffield and Delene2,3 Cost Assessment of Generomak did not address project contingency in detail, instead chose to continue to use an all-inclusive contingency allowance of 15% added to all the plant direct costs. On the other hand, the Delene 1990 Generomak Cost Model Update18
altered the contingency allowance to reflect changes relative to the LSA level (nuclear grade and/or high technology construction). The contingency factors for these assumptions were either 25% or 15%. Again, the 10th of a kind logic should significantly reduce the level of contingency imposed. Delene also redefined the project contingency to be a fraction not only the total direct cost, but also the indirect costs, which would effectively increase the contingency by as much as 50%. Delene continued, “In lieu of a comprehensive analysis, an overall contingency factor of 0.195 for LSA =4, 0.184 for LSA = 3, 0.173 for LSA = 2, and 0.15 for LSA = 1.” These LSA factors reflect ~25% reduction in the nuclear grade portion of fusion parts compared to fission according to Delene12. Although the LSA=1 factor (0.15) remains numerically the same as the prior guidance, the inclusion of the indirect costs effectively increases the contingency amount by 40% to 50% for the total indirect costs.
The ARIES-AT project6,16,7 had been using these contingency fractions as well as the philosophy of linking the contingency cost account to the LSA factors. However this practice will be review below.
A small, but important, difference has shown up in the published ARIES-AT contingency data. Per the Miller SPPS Systems Chapter7, Table 3.2-VIII, ARIES-AT was supposed to be following the Delene and Miller guidance noted above (contingency = 0.15 for an LSA = 1), but the actual ARIES-AT contingency data is different as shown in Table 28 above (0.1465). When the data is related back to the TDC and the prior indirect costs, the values are slightly lower, namely 0.1893, 0.1793, 0.1685, and 0.1452. The reason for this difference needs to be determined and resolved or documented.
The more recent Gen-IV cost estimating guidelines24 addressed contingency allowance very completely, including contingency on overnight costs, contingency on schedule impact, and contingency on power core performance. This is opposed to the fusion approach that contingency excludes design and performance uncertainties and focuses only on external uncertainties. The Gen-IV approach includes an allowance for indeterminate elements and is related to the level of design, degree of technological advancement, and the quality/reliability pricing level of given

76
components. This would appropriately equate to a sizable contingency for the prototype, demonstration, and first of a kind (FOAK) plant, as opposed to a low contingency for an nth of a kind (NOAK) fusion plant. This is exactly opposite to the philosophy adopted by Shulte9, Starfire1, and ARIES16,14.
The allowance for contingencies is a very controversial topic. On prototypical and early developmental plants, significant contingencies are certainly required for design changes, schedule extensions, and changes necessary to achieve performance goals, reflective of the Gen-IV guidance. On the other hand, contingencies for Nth OAK plants would likely be much lower and be related to outside influences, more aligned with the Schulte’s and Delene’s guidance. It is recommended ARIES continue to use the 0.1465 contingency allowance, pending more definitive guidance.
C95, Process (Design) Contingency = Zero for a 10 OAK power plant cost estimated.
C96, Project Contingency = 0.1465 times sum of Total Direct Cost and subtotal of prior indirect costs)

77
Financial Assumptions and Methodologies for Plant Construction The prior sections addressed the methodologies and algorithms for developing the direct and indirect capital costs for a fusion power plant. Those total costs are considered to be the total overnight costs (OC), thus no time-related interest or escalation (aka, inflation) effects are considered. This section addresses the assumptions, methodologies and algorithms associated with the financing of the procurement and construction of the plant and its facilities. These factors consider the cash flow necessary to procure and construct the facility, any inflationary effects on the cash flow and the accrual of interest and other factors charged to the incremental cash flow.
Cash flow First, the expected distribution of the cash flow during the construction period must be established. In actual practice, this expenditure curve would not be a continuous function; rather it would be composed of many unequal step functions depending on the timing of long lead items and the integrated procurement, construction schedule, and the contractual arrangements with suppliers and subcontractors. For simplicity, estimates that accompany conceptual and preliminary design studies for major projects assume a smooth and continuous skewed “S”-shaped expenditure curve. The “S”-shaped expenditure curve was postulated by NUS. Corporation in NUS-53133 with 50% of the cash flow occurring at 60% of the construction time. D. Phung34 further developed the methodology by developing the payout function and integrated payout function for the skewed S-shaped curves, as follows.
Payout function: p(t) = 0.5 a π /B (t/B) (a-1) sin [π (t/B)a]
Integrated payout function q(t) = 0.5[1-cos[π (t/B)a]
Factors: a is the skewness parameter; if a < one, the payout is skewed to the left;
if a is > than one, the payout is skewed to the right (most likely case).
Derivation: a = ln(0.5) / ln(0.6), where numerator is 50% of cash flow is achieved and denominator is percentage of time (e.g., 60%) when that amount of cash flow is achieved.
For a = 1.357, half the cash flow is achieved at 60% of the construction period.
B is the construction time in periods appropriate to the analysis
t is the incremental time parameter
During the conceptual Starfire design1, L. Waganer adopted the right skewed “S” curve cash flow and further refined the accuracy of the data provided by Phung34. Sheffield2 and Delene3 further modified the modeling of these financial analyses with the use of a generic fusion plant model with more detail involving taxes, insurance and depreciation during the construction period. Sheffield2 chose to modify the shape and modeling of the cash flow curve distribution with the peak spending slightly later. Sheffield modeled his cash flow curve with two separate equations that defined the early phase and the later phase of the construction schedule.

78
for Ψ between 0 º and 180º
for Ψ between 180º and 257.1º
Where j is the time step period, Ψ = j (257.1/B)deg and
The results of the two algorithms that describe the skewed cash flow are graphically illustrated in Figure 6. As mentioned earlier, the D. Phung34 algorithm can be continuously adjusted via the skewness parameter to any value. In 2009, L. Waganer modeled the Phung equation in an Excel spreadsheet (ESC) with 1000 time steps that closely approximates an integral function. It is commonly assumed that the cash flow curve reaches the 50% expenditure at 60% of the time period. The Sheffield algorithms are a curve fit, which could reformulated to describe any other 50% point, but the cash flow shape may not remain similar. The Sheffield curve yields the 50% cash flow at 62.5% in time, see below. Notice that the Sheffield curve does not approach zero at the end of construction.
Figure 6. Comparison of the Phung and the Sheffield Skewed S-Shaped Cash Flow Curves
Sheffield2, et. al. used an 8-year construction period as the baseline value. They also assumed the constant dollar inflation rate was 0.03% and the then-current dollar escalation rate was 6% and the inflation rate was 9%. The interest rate included the federal and state taxes, capitalization debt, preferred stock return, and equity return, yielding an effective interest rate of either 3% or 9%. Sheffield and Delene also incorporated a lower federal tax rate from 46% to 34% per the provisions of the U.S. tax Reform Act of 1986.
Per Chuck Bathke and Ron Miller in ARIES II-IV Final Report16, their economic analysis of the time-related financial elements largely adopted the Generomak2,3 methodology and data metrics. They felt that this approach more closely agrees with the U.S. utilities and independent power producers’ usage in the early 1990s. ARIES adopted the Sheffield cash flow curve approximation. However, ARIES adopted the shorter, 6-year construction period per the Starfire assumption. This Starfire assumption has also been adopted for most magnetic fusion power plant design studies since the 1990’s. The EBTR10 study construction period is one exception at 5 years as it was felt its highly modular design would allow a more expedited construction.

79
Another relevant set of power plant economic guidelines has provided more current and compelling guidance for assessing the fusion economic guidance. The Economic Modeling Working Group (EMWG) of the Generation IV International Forum has updated their “Cost Estimating Guidelines for Generation IV Nuclear Energy Systems”24 in September 2007. Several key guidelines are relevant to the methodology for fusion economic studies were identified. The Gen-IV EMWG specified the use of an S-shaped cash flow expenditure curve. However the skewness and algorithm for curve generation were not specified.
It is recommended for ARIES to adopt the traditional cosine or “S”-shaped cumulative cash flow curve defined by the Phung34 integral equations. These are continuous functions, not approximations. Moreover, the entire curve can be skewed to the right or the left by changing the “a” skewness parameter as desired. Using the integral forms, many discrete steps can be summed to approximate the integral functions. It is recommended the midpoint of the spending is defined to be at the 60% of the construction. The ESC code can be used to determine the spending profile with any skewness and construction duration.
Time Value of Money At the start of plant construction, the total overnight costs have been estimated that are necessary to procure and construct the plant. However, the plant cannot be procured or constructed overnight and requires some time for this process to be financed and completed. The prior section on Cash Flow identifies a prescriptive cumulative cash flow curve necessary to complete the project. There are two primary time-related analysis effects that determine the total cost of the plant at the end of construction: 1) escalation due to inflationary effects from the start of construction (and date of the estimate) and 2) interest compounded from the date of cash accrual to the start of plant operation. Other factors also contribute to the overall total cost and these will be discussed later.
There are two methodologies used to evaluate the time-related effects that occur during the construction period. One is called “Constant Dollars” defined by Phung34 and Harrnett and Phung35 which assumes the purchasing power of the dollar remains constant throughout the construction period - the cost for an item measured in money with the general purchasing power as of some reference date. Hence, there is no inflation assumed in this methodology. However there are costs associated with the true (or real) interest value. This will not be a realistic situation in the actual world as there are always inflationary (or deflationary) effects, however the “Constant Dollar” analysis provides a more easily understood economic metric that avoids making the assumptions about future inflationary/deflationary effects. The “real” rate of interest is usually in the range of 3 to 6% without inflation. Sometimes this is called real interest having no inflationary effects. Cumulative interest is referred to as Interest During Construction (IDC) and it is accrued throughout the construction period according to the cash flow curve. Phung34 defined these analysis models in his report in 1977.
The second evaluation methodology described by Phung34 and Harrnett and Phung35 is called “Then-Current Dollars”. Other authors may refer to this methodology as “nominal dollars”. The nominal dollar cost is the cost for an item measured in as-spent dollars and includes inflation effects. Nominal dollars are sometimes referred to as “current”, “year of expenditure”, or “as spent” dollars. Since this analysis technique includes both escalation (related to inflation) and interest, the total cost due to escalation at the end of construction is also dependent on the cash flow schedule. The interest rate, when stated in current or nominal dollars, inherently includes an

80
escalation factor. For instance, Starfire assumed a constant dollar interest rate of 5% and a then-current dollar inflation (escalation) rate of 5% that yielded an interest rate of 10% (5%+5%). The total capital investment required at the end of construction = initial capital investment x (1 + IDC + EDC) with appropriate interest and escalation rates applied over the cash flow schedule.
The Starfire economic analysis1, conducted by Waganer, was the first conceptual fusion power plant design study to adopt the concept of constant and then-current dollar and cash flow financial analyses. Figure 7 is a reproduced Starfire graphic that illustrates the differences between constant and then-current dollar analysis. In the Starfire economic analysis, the constant dollar interest was 5% (IDC = 0.1303) and in the then-current dollar analysis the escalation (inflation) was 5% (EDC = 0.1896) and inflated interest was 10% (IDC = 0.3164). These IDC and EDC values were determined from a numerical integration with a high number of steps that approximate a true integral function (see next few paragraphs for more details). This negates the argument that interest and escalation should be computed at the beginning, middle, or end of an incremental time period and the use of discrete accounting periods (months or quarters).
Figure 7. Comparison of Constant and Then-Current Dollar Accumulation
Phung34 formulated the equations for the total investment at the end of construction (start of
operation) as , where p(ti) is the continuous
function of t, B is the final period, y is the inflation rate, and x is the interest rate. Waganer called this additive factor to be the fEIDC factor to indicate the summation of both the IDC and EDC in the then-current dollar mode.
Phung34 further formulated the equations that separated the EDC and the IDC integral functions and provided tabular data that identified the relationships between the construction time (B), the interest rate (x) and the escalation rate (y).

81
, and
, and
Delene and Sheffield used the Phung methodology in their Generomak2,3 model with quarterly time increments. ARIES adopted the Delene and Sheffield formulation for its financial modeling, however in the Sheffield Fusion Technology paper2, rather than evaluate the integral EIDC (that is, EDC + IDC) equation, Sheffield developed an approximate solution, shown below.
Fcap-1 = FEIDC ~ [1.0840 +0.55(y-0.09) + 0.38(x-0.09)]B+0.61 -1
ARIES has continued to express their economic estimates in both constant and then-current (nominal) dollars. However, the constant dollar results are the only one used in published reports.
The Gen-IV guidance24 has recommended that only the constant dollar analysis approach should be used. Their pricing basis is currently in 2007 dollars. The Gen-IV IDC model in constant dollars is shown below is essentially the same as the prior Phung34 expression, which is evaluated to be 0.1303 for a skewed S-curve using 1000 time steps. The Gen-IV model uses discrete time steps of quarters or years.
Where Cj = cash flow value at the beginning of borrowing period
IDC = constant dollar IDC cost
J = Number of periods
j = period number
top = quarter or year of commencement of commercial operation
X = real discount rate expressed annually or quarterly
After reviewing these methodologies, all of them are really slight variations of the original Phung34 expressions. Sheffield used approximation methods to calculate the S-shaped cost flow schedule and the IDC/EDC factors. It is recommended ARIES affirm its usage of the skewed S-curves and the integral forms of the cash flow calculations. It is recommended that ARIES primarily use the constant dollar valuation methodology consistent with Gen-IV direction. Then-current dollars can be included if desired.
82
Evaluating Interest and Escalation, Accounts 97 and 98 In 1978, Pacific Northwest Laboratory issued a report9 authored by S. Shulte, et.al., “Fusion Reactor Design Studies – Standard Accounts for Cost Estimates,”. This report established a methodology for handling time-related costs using the constant and then-current dollar analyses. They also recommended the use of an interest rate of 5% for the constant dollar case and an interest rate of 10% and an escalation rate of 5% for the then-current dollar case. The example IDC and EDC values are very close, but not exactly the same as predicted with Waganer’s ESC Excel code to generate more accurate values for IDC and EDC. Starfire1 used the same methodology and data as the PNL report and the Phung34 paper.
Generomak2,3 originally assumed a real interest rate of 3% in the constant dollar analysis and an escalation rate of 6% and an interest rate of 9% in the current year analysis for an 8-year construction period. Using these interest and escalation values with the 8-year time period, the IDC and EDC values were in close agreement with results obtained with the current ESC code.
J. Delene significantly contributed to the Generomak modeling in the mid-80s to mid 90s. In 1989, he wrote a draft Generomak model update36 in which he increased the capacity factor from 65% to 75%, reduced the escalation rate from 6% to 5%, and changed the average cost of money from 5.1% and 11.4% to 6.05% (without inflation) and 11.35% (with inflation), respectively. These are used for the Allowance for Funds Used During Construction (AFUDC). He noted that the U.S. Tax Reform Act of 1986 decreased the federal tax rate from 45% to 34%. With this tax rate change, the AFUDC must use the average cost of money rather than the tax-adjusted cost of money, which is 9.7% nominal and 4.35% constant or real dollars. The ARIES ASC code14, 15, 7 is currently (circa 2009) using the cost of money as 6.05% (without inflation) and 11.35% (with inflation) average cost of money for its IDC and EDC computations.
The Gen-IV guidance11 recommends using the constant dollar analysis approach (2007 dollars is their pricing basis.). “The EMWG (Economic Modeling Working Group) decided to use 5% and 10% real (i.e., excluding inflation) discount rates because these rates bracket the cost of capital for most nuclear energy plant owners. The 5% real discount rate is appropriate for plants operating under the more traditional “regulated utility” model, where revenues are guaranteed by captive markets. The 10% real discount rate would be more appropriate for a riskier “deregulated” or “merchant plant” environment, where the plant must compete with other generation sources for revenues11”. “In the context of the GIF guidelines, the discount rate is equal to the real cost of money.11” Further, the EMWG decided to keep the economic groundrules as simple as possible. “Therefore, wherever possible, the modeling system and associated guidelines for economic data input had to be sufficiently generic, inclusive, and robust as to bound all possible cases that may require examination. In some areas, simplifications could be made, such as the elimination of taxes and tax credits as a factor in economic analysis, thus making the model more easily applicable in different countries11.” The EMWG defined the escalation rate as the rate of cost or currency change. This rate can be greater or less than the general inflation rate, as measured by the Gross Domestic Product Implicit Price Deflator. They chose to consider these two metrics to be equal for their estimate.
To help assess the evolution of the methodologies and baseline metrics L. Waganer developed an Excel code (ESC) to more accurately evaluate all the methodologies and metric changes to validate the assumptions and approaches. Table 29 illustrates the key metrics and results for the methodology perturbations. The reference data in the table is shown in black and the ESC code

83
results are shown in green. The Phung and Starfire data matches identically with the ESC code as the code is based on that formulation. Generomak, with preliminary interest and escalation values, matches reasonably well, usually to the second or third significant digit. Later Generomak and ARIES data did not match so well. If ARIES uses the regulated utility cost of money the ARIES AFUDC results will be reduced from the current ARIES results. On the other hand, if ARIES uses the deregulated utility cost of money the ARIES AFUDC results will be increased from the current ARIES results.
Table 29. Comparison of AFUDC Approaches and Results
The recommendation for ARIES is to adopt the GEN-IV simplified approach with only constant dollars shown with the average, real cost of money (interest) to be 5% for regulated utility customers and 10% for deregulated or merchant plant customers. This approach eliminates the need to estimate future tax rates, tax incentives, and other cost of money effects. The current estimates for future inflation are typically considered to be 3%. Table 30 provides the discrete IDC values for a combination of several interest rates and construction durations. The recommended interest rate of 5% from GEN-IV and a six-year construction duration yields an IDC value of 0.1303. The deregulated value of 10% interest rate would yield an IDC value of 0.2744.
C97 = 0.1303 times the sum of Total Direct Costs and the subtotal of prior indirect costs.
Table 30. Recommended ARIES-AT Interest During Construction (IDC) Cost Factors
84
Financial Assumptions and Methodologies for Annual Costs The busbar cost of electricity is the most important consideration for utilities or independent power producers in choosing an electrical generating power plant. The plant must be an affordable, reliable, maintainable energy source and all of these factors are contained in the cost of electricity. The busbar cost of electricity is computed as:
COE = [CAC + (CO&M + CSCR + CF) * (1 + y)Y] / (8760*Pe net* pf) + CD&D , where COE is measured in mills/kWh at the beginning of electricity production CAC is the annual capital cost charge = total direct and indirect capital cost x fixed charge rate (FCR)) CO&M is the annual operations and maintenance cost CSCR is the annual scheduled component replacement cost CF is the annual fuel costs y is the annual escalation rate (0.0 for constant dollar and y for current dollar basis) Y is the construction and startup period in years Pe net is the net, nominal electrical power capability (MWe) pf is the average plant capacity factor (~ plant availability) CD&D is the annual decontamination and decommissioning converted to mills/kWhr
The reason there is a factor (1+y)Y in the COE equation is that all estimated capital and other annual costs are evaluated based on their costs at the beginning of construction when all supplier estimates are developed and subcontracts are finalized. This escalation factor (y) is applied over the construction and startup period to determine the cost at the beginning of electricity production. This yields the advertized COE. However during the life of the plant, all costs, except for the initial capital cost, may continue to gradually increase due to inflationary effects. This effect is not considered.
Annual Capital Cost Charge, CAC The annual capital cost charge is determined by applying a fixed charge rate (FCR) to the total capital cost of the power plant including all direct and indirect costs as determined at the beginning of construction.
Fixed Charge Rate The genesis of the fusion definition of a fixed charge rate (FCR) stems from the NUS Guide for Economic Evaluation of Nuclear Power Plant Design33. Schulte9 elaborated on the fixed charge rate in the Fusion Reactor Design Studies – Standard Accounts for Cost Estimates report published in 1978. The fixed charge rate is a charge to total investment costs that is annualized over the operating life of the plant. Schulte included the cost of capital, depreciation, interim replacement, property insurance, and federal and state taxes for both constant and current (nominal) economic analysis approaches. Schulte assumed the annual fixed charge rate was 10% for the constant dollar and 15% for the current dollar analysis approach. Starfire1 used the same methodology and data as the Schulte9 guidance.
Sheffield and Delene, in the Cost Assessment of a Generic Magnetic Fusion Reactor3, adopted the economic and financial parameters from the Nuclear Energy Cost Data Base (NECDB)37 to establish a fixed charge rate to calculate the annualized capital cost charge. The Sheffield and

85
Delene analysis was a very extensive process involving tax rates, depreciation, salvage value, cost of money and construction period. The steady state FCR was determined by numerically integrating over the first 20 years (not the entire operating period). This levelized FCR was determined to be 0.1652 in current dollars and .0998 in constant dollars.
In a subsequent refinement of the Generomak2 cost modeling, Delene and Sheffield adopted a 6-year construction and startup period in place of the previous 8-year construction period and amortized the capital cost over the entire plant life of 30 years. They determined that the AFUDC is an imputed return on capital and is not applicable to tax credits or tax depreciation. The resulting FCR only differed slightly from the prior analysis, namely 0.165 for the current dollars and 0.0844 for the constant dollar analysis.
In 1989, Delene36 updated the FCR, based on a revised NECDB methodology, revised federal tax code changes (34%), and higher cost of money. This resulted in a revised FCR of 0.0966 in constant dollars.
The ARIES II-IV Systems Studies chapter16 followed the Delene Generomak model update36 fixed charge rate using the book life equal to the analysis period (30 years in that case). The FCR equation and list of variables is quite extensive, so it is best to refer back to Reference 16, page 2-55 and Table 2.2-XVII, page 2-58. Some of the significant parameters are listed below in Table 31 for ARIES-AT (the ARIES-II to ARIES-IV values are virtually identical). The inflation rate is assumed to be 5% and the constant dollar cost of money 0.0605, and the discount rates are .0435 and 0.0957 (constant and nominal dollars). Using these values, the FRC value is 0.1638 (or 0.1637) in current dollars and 0.0966 (0.0965) in constant dollars for ARIES II-IV16 through ARIES-AT14. The ARIES-AT construction time is 6 years and the economic plant life is 30 years, whereas the current operating lifetime of ARIES-AT is currently estimated to be 40 years.
Table 31. Current ARIES-AT Indirect Cost Factors Constant Nominal Construction lead time, y 6.00 6.00 Economic lifetime, y 30 30 Escalation (inflation rate) (%/y) 0.0000 0.0500 Average cost of money (AFUDC) (%/y) 0.0605 0.1135 Interest during construction, fIDC 0.1652 0.3178 Capitalization factor, fIDC + fEDC 0.1651 0.5614 Dollar discount rate 0.0435 0.0957 Fixed charge rate, FCR 0.0965 0.1637
The Gen-IV guidance24 takes a much more simplified approach in that tax and depreciation considerations are not considered at present. Thus the formulation for the FCR is much easier to compare to other power generation systems in other countries.
FCR = X/[1-(1+X)-Lecon] , where X is real discount rate of 5% and 10% in constant dollars.
And Lecon is the economic or regulatory life of plant (years) equal to commercial operation.
The Gen-IV assumes a 40-year economic and regulatory life, which results in the FCR values of 0.05828 for the 0.05 cost of money and a FCR of 0.10226 for the 0.10 cost of money.

86
It is recommended that the Fixed Charge Rate (FRC) of the Gen-IV formulation be adopted because of the simplified approach of not considering the changing aspects of the tax laws and depreciated assets. The use of the standardized constant year cost of money at 0.05 and 0.10 should be adopted. This approach will effectively halve the ARIES annual capitalization factor (0.0583 compared to 0.0965) for the 5% cost of money case and raise the 10% cost of money case slightly above the current ARIES capitalization factor (0.1023 compared to 0.965) for the constant dollar analysis. This capitalization factor is responsible for ~ 75% of the cost of electricity. Therefore the ARIES COE will fall roughly to half its current value. ARIES should also assume the 40-year economic life to be consistent with its technology baseline. This lifetime is also consistent with GEN-IV lifetime. This extension of the economic life will slightly lower the FCR.

87
Operations and Maintenance Costs, CO&M or Accounts 40-47
In the Fusion Reactor Design Studies – Standard Accounts for Cost Estimates report in 1978, Schulte9 established the standard accounts for the fusion power plant including the annual O&M accounts. The O&M accounts included salaries, supplies and equipment, outside support services, general and administrative costs, coolant makeup, fuel handling costs, and miscellaneous costs.
Estimating the operations and maintenance costs is a highly unpredictable process with little data known about how the fusion power plant will actually be operated and its level of maintenance consistent with the 10th of a kind plant some 50-80 years in the future. There have been two general O&M approaches - a detailed bottoms-up with projected staffing and maintenance needs as compared to a top-down approach at the upper O&M level. Neither approach has much validity, so the estimates have a sizable margin of error
Detailed O&M Estimate Approach Waganer, in Starfire1, adopted the Schulte accounting scheme, but chose to estimate the costs associated with each O&M cost category in a bottoms-up approach as shown in Table 32. It was felt that the fusion plant would be more highly automated than traditional fission plants, thus a full staff would only require 153 people providing around-the-clock coverage, not counting security personnel. The security needs were provided with supplemental, outsourced subcontracts, but these costs were included in the O&M personnel cost estimate.
Table 32. Starfire O&M Costs 1980$ 2009$ Acct 40. Salaries of Facility Personnel $8.71 M $19.96 M Acct 41. Annual Misc Supplies and Equipment $5.2 M $11.92 M Acct 42. Outside Support Services $0.792 M $1.82 M Acct 43. General and Admin. (15% of Accts 40, 41, 42) $2.205 M $5.05 M Acct 44. Annual Coolant Makeup (water) $0 $0 Acct 45 Annual Process Materials $1.00 M $2.29 M Acct 46 Annual Fuel Handling (handled by staff) $0 $0 Acct 47 Annual Miscellaneous $1.50 M $3.44 M Totals $19.41 M $44.48 M Sheffield and Delene, in the Cost Assessment of a Generic Magnetic Fusion Reactor2 recommended that the number of the operating staff be significantly increased from the Starfire staff of 153 (note that the Sheffield reference had this number in error) to 457 following a study of fission plants. Starfire had a 5-shift operation and Generomak assumed a 6-shift operation. Table 33 illustrates the Generomak recommended staffing for the plant. Note that a 50-person security staff was included in Generomak, so the comparable number would be 407 as compared to 153 in Starfire which accounted for $30.9 M (1983$) or $58.70 M (2009$). The table shows the remaining O&M cost accounts. Many subsequent O&M account estimates mimicked Starfire approach and values.
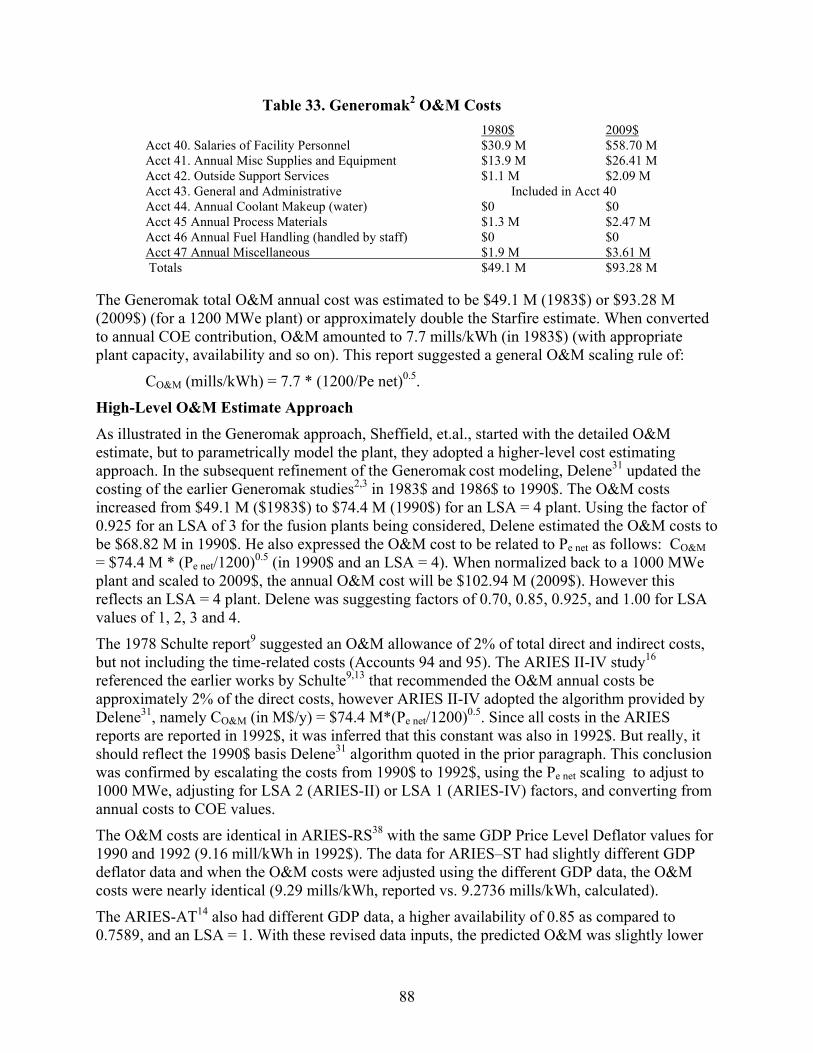
88
Table 33. Generomak2 O&M Costs 1980$ 2009$ Acct 40. Salaries of Facility Personnel $30.9 M $58.70 M Acct 41. Annual Misc Supplies and Equipment $13.9 M $26.41 M Acct 42. Outside Support Services $1.1 M $2.09 M Acct 43. General and Administrative Included in Acct 40 Acct 44. Annual Coolant Makeup (water) $0 $0 Acct 45 Annual Process Materials $1.3 M $2.47 M Acct 46 Annual Fuel Handling (handled by staff) $0 $0 Acct 47 Annual Miscellaneous $1.9 M $3.61 M Totals $49.1 M $93.28 M The Generomak total O&M annual cost was estimated to be $49.1 M (1983$) or $93.28 M (2009$) (for a 1200 MWe plant) or approximately double the Starfire estimate. When converted to annual COE contribution, O&M amounted to 7.7 mills/kWh (in 1983$) (with appropriate plant capacity, availability and so on). This report suggested a general O&M scaling rule of:
CO&M (mills/kWh) = 7.7 * (1200/Pe net)0.5.
High-Level O&M Estimate Approach As illustrated in the Generomak approach, Sheffield, et.al., started with the detailed O&M estimate, but to parametrically model the plant, they adopted a higher-level cost estimating approach. In the subsequent refinement of the Generomak cost modeling, Delene31 updated the costing of the earlier Generomak studies2,3 in 1983$ and 1986$ to 1990$. The O&M costs increased from $49.1 M ($1983$) to $74.4 M (1990$) for an LSA = 4 plant. Using the factor of 0.925 for an LSA of 3 for the fusion plants being considered, Delene estimated the O&M costs to be $68.82 M in 1990$. He also expressed the O&M cost to be related to Pe net as follows: CO&M = $74.4 M * (Pe net/1200)0.5 (in 1990$ and an LSA = 4). When normalized back to a 1000 MWe plant and scaled to 2009$, the annual O&M cost will be $102.94 M (2009$). However this reflects an LSA = 4 plant. Delene was suggesting factors of 0.70, 0.85, 0.925, and 1.00 for LSA values of 1, 2, 3 and 4.
The 1978 Schulte report9 suggested an O&M allowance of 2% of total direct and indirect costs, but not including the time-related costs (Accounts 94 and 95). The ARIES II-IV study16 referenced the earlier works by Schulte9,13 that recommended the O&M annual costs be approximately 2% of the direct costs, however ARIES II-IV adopted the algorithm provided by Delene31, namely CO&M (in M$/y) = $74.4 M*(Pe net/1200)0.5. Since all costs in the ARIES reports are reported in 1992$, it was inferred that this constant was also in 1992$. But really, it should reflect the 1990$ basis Delene31 algorithm quoted in the prior paragraph. This conclusion was confirmed by escalating the costs from 1990$ to 1992$, using the Pe net scaling to adjust to 1000 MWe, adjusting for LSA 2 (ARIES-II) or LSA 1 (ARIES-IV) factors, and converting from annual costs to COE values.
The O&M costs are identical in ARIES-RS38 with the same GDP Price Level Deflator values for 1990 and 1992 (9.16 mill/kWh in 1992$). The data for ARIES–ST had slightly different GDP deflator data and when the O&M costs were adjusted using the different GDP data, the O&M costs were nearly identical (9.29 mills/kWh, reported vs. 9.2736 mills/kWh, calculated).
The ARIES-AT14 also had different GDP data, a higher availability of 0.85 as compared to 0.7589, and an LSA = 1. With these revised data inputs, the predicted O&M was slightly lower

89
than reported, 6.87 mills/kWh vs. 6.819 mills/kWh calculated in $1992. This is less than 1% error, but something is not being computed correctly in the ARIES systems code. The reported O&M COE cost of 6.78 mills/kWh corresponds to an annual O&M cost of $51.15 M (in 1992$) or $73.14 M (in 2009$).
The Gen-V guidance24 assumes no escalation in their cost analysis, so the O&M estimate at the start of construction will be the same as when operation starts, that is the constant dollar case. The accounts identified are somewhat different, but the content is virtually the same. The categories of staff are identified along with suggested costs per staff member for 2007$, see page 99 of Reference 24. These are provided for a bottoms-up estimate with the total costs and COE values shown in Table 34. These data would be helpful to update the ARIES fusion database with the current thoughts on fusion plant staffing levels. For the top-down methodology, the GEN-IV EMWG adopted a levelized O&M algorithm that combines both fixed and variable costs, based on operating LWRs taken from IAEA data.
Table 34. GEN-IV 24 O&M Costs 1000 MWe GenIV plant, A = 0.90
Annual Cost (2007$) COE Component (2007$)
Fixed O&M cost $62 M 7.85 mills/kWh
Variable O&M cost $3.55 M 0.45 mills/kWh
Total $65.5 M 8.30 mills/kWh
Although not stated, it is presumed that the fixed O&M cost would be scaled to plant size by some factor, such as $62 M *(Pe net/1000)0.5 while the variable costs of $3.55 M would continue to scale with the produced power in kilowatt-hours. The $65.5 M in 2007$ would be $67.54 M in 2009$.
The above collection of O&M cost estimates would appear to be all over the map with costs dependent on total direct and indirect costs (Schulte), two attempts at bottom up estimates (Starfire (Waganer) and Sheffield), and several single expressions scaled to net power and LSA level. All of these estimates span a period of time approximately 30 years. All the ARIES studies were reported in 1992$. Table 36 below takes all the original O&M costs (sometimes computed out of the O&M COE data) and normalizes these data to 2009$ for a scaled 1000 MWe power plant. Availability values do not enter these cost data except to convert COE values back to absolute costs. If the data is sorted by LSA, the data groups in a more logical fashion. This is because ARIES had previously used the LSA scheme, which baselines the costs for an LSA of 4 and reduces O&M costs to 70% for the LSA 1 value. Also, Starfire O&M costs seem very low and GenIV is lower than any fusion plant estimate.

90
Table 36. Summary of Scaled O&M Costs from Tokamak Studies and GEN-IV
Until more detailed assessments of the O&M costs are conducted, ARIES should continue to employ a more general costing algorithm. The Delene algorithm scaling of a constant times (Pe net /1200)0.5 seems reasonable. Moreover, it would seem likely that the LSA 1 criteria would prevail in all future fusion plants with a continuing trend to minimize human labor. So with those assumptions, the following O&M algorithm should be adopted for ARIES:
CO&M = $80 M x (Pe net/1200)0.5 in 2009$.
Scheduled Component Replacement Costs, CSCR Schulte9, in the Fusion Reactor Design Studies – Standard Accounts for Cost Studies report, foresaw the need to identify and monitor the cost of those high cost power core components that have a life much less than the economic life of the plant. He especially identified the first wall and blanket modules, divertor modules, and heating and current drive components. In certain magnetic configurations, other components might also be in this costly replaceable category, such as an internal, unshielded coil elements. Schulte did include disassembly and reassembly labor in this account. In the constant dollar mode, no escalation is considered, so the annual cost is represented by the initial cost of the components divided by their lifetime with plant availability factored into the lifetime. In the constant or nominal dollar mode, the annual costs are multiplied by the escalation factor, (1+y)B, where y is the escalation rate and B is the construction and startup period in years.
Schulte did not specifically include the initial set of power core components in this category as the thought these components should be capitalized along with the other direct capital costs that are necessary for testing and initial operation for some period. Waganer, in Starfire1, adopted this approach and identified the components to be replaced and that replacement time interval as a part of the plant availability. All subsequent replaceable component hardware would be included in the Scheduled Component Replacement (SCR) cost account. The initial set of components is estimated in the direct capital costs as the initial hardware assembly. This precept was challenged by Sheffield, et al., in the Cost Assessment of a Generic Reactor2 because he felt the initial set of components should be integrated with the annual cost accounts. Later, Bathke and Miller in the ARIES II, IV reactor studies16, agreed with Schulte and Waganer that the initial set of hardware should be capitalized in the initial direct capital cost accounts, otherwise it would tend to underestimate the initial capital cost of the power core. This approach continues in the current ARIES economic models.
91
Waganer, in Starfire1, broke this SCR cost account into two pieces, Annual Reactor First Wall and Blanket Component Replacement and Annual Replacement of Other Reactor Components. The former consisted of the first wall and blanket modules, the limiter module (functionally similar to the divertor), and in-vessel portions of the heating and current drive systems. These components have a limited life of a few years based on material neutron damage limits. The annual cost is the sum of the component costs divided by the useful life of the components. Hopefully these effective lifetimes are similar, which would facilitate common replacement at regularly scheduled replacement periods. These materials may be recycled and those recycling costs would be generally offset by lower recycled material costs. Minor material expenses in the disassembly and reassembly would be handled under other miscellaneous cost accounts. In the case of liquid coolants or separate circulating liquid breeders, those items would not be installed until just before the power core is tested for operation. Therefore, they are handled under a Special Materials account, Account 26 that would not be subject to construction period interest or escalation.
Waganer1, in Starfire, assumed the labor associated with disassembly and reassembly would be highly automated and would be a part of the duties of the regular plant staff. If SCR operations occur on a regularly basis, this might be handled with contract labor. However, when an unscheduled failure occurs, it is necessary to immediately accomplish the repair, it becomes more likely the on-site staff would provide the required labor. This logic persists through Generomak and ARIES cost estimates.
The second category identified by Starfire1 was other replaceable components, such as crossed field (RF) amplifiers, vacuum isolation valves, ECRH gyrotrons, atmospheric tritium recovery system components, power supplies, LHe refrigerators, and shield door seals. These are replaced on very different schedules from the power core components. The replacement costs and replacement frequency for each item was reported and summed. These are generally lower cost items that may be replaced during normal operation (unless there is a radiation hazard).
Sheffield, et al, in the Cost Assessment of a Generic Reactor2 chose to aggregate the Scheduled Component Replacement items with the Fuel Cost. Schulte9 considered all fuel materials in this Fuel Cost category, such as deutritium, tritium, liquid breeders or multipliers and other fuel materials, for instance advanced fuel materials. However Schulte did not include the cost of the containing elements, such as the blankets or divertors to be a part of the fuel cost account. Sheffield had a very complex formula to determine the component cost accounting for radiation damage limits, wall loading, plant availability, spares, and a cost recovery factor.
Delene3 supported the Sheffield approach in that he thought the SCR cost items should be in the Fuel Cost account and be treated as a present worth item producing a revenue stream over their lifetime, with lifetime, depreciation, taxes, cost of money, and capital recovery factors used.
Bathke and Miller in ARIES II-IV study16 reverted back to separately identifying both the SCR and Fuel Cost items. They felt that excluding the SCR items from the initial power core construction unfairly diminished the cost of the power core. While the Starfire and ARIES-I did not amortize the cost of the replaceable items, ARIES-II-IV chose to calculate the present worth of these items over their periods of service, as shown below.

92
Present Worth, , where t is the effective tax rate = 0.3664/y, d
is the fraction of the cost that is deductible in the year n, and x (nominal cost of money) = 0.1135. For a 5-year depreciation schedule with respective depreciation values, the present worth, F, is 1.272.
Thus the SCR cost is
CSCR = (total direct costs FWB + divertors)*CRF*Present Worth*(1+contingency)/Lifetime, where CRF is the Capital Recovery Factor, see Bathke16
Note that this ARIES equation does not include any other replaceable items such as the heating or current drive in-vessel components or any other major replaceable items, such as gyrotrons.
GEN-IV does not have a comparable cost account that considers regular replacement of significant cost items. It only has fuel and fuel cladding to consider. However it is significant to note that GEN-IV EMWG has chosen to disregard for the moment the complexity of present worth, tax rates, and escalation. Instead, they simply sum up all annual expenditures to the levelized cost of the borrowed capital and divide by the annual power production.
The recommendation for the Scheduled Component Replacement cost account is to include the annual replacement costs for all the significant-cost replaceable hardware components plus some allowance for regularly replaceable minor equipment. These should not be placed in the fuel cost account. Also the cost should be reported as a simple annual expenditure with no consideration for present worth, tax status or depreciation. CSCR = Total cost of replaceable blankets, divertors, RF launcher plasma facing components and other regularly replaced items divided by their scheduled lifetime.
93
Fuel Cost, CF This fuel cost account is quite analogous to the SCR account. Schulte9 identified the fusion fuel elements to be considered in the fuel account. Schulte postulated that this is a 10th of a kind plant, which would indicate that the supply and demand of tritium from other operating fusion plants would force the cost of tritium to zero market value. Each plant would be tritium self-sufficient except for the initial tritium load, which is likely to be a loaned quantity. Purchase of deutritium would be a stable cost for a 10th of a kind power plant. The cost of tritium-breeding materials, such as lithium or lithium compounds, either natural or enriched, would be included in this account. Other costs may be neutron multipliers, cladding, other fuel materials that are consumed or depleted as well as annual offsite fuel processing and disposal costs.
Waganer, in the Starfire report1, built on the Schulte9 recommendations. Tritium would be considered as a no cost fuel element as it would be continuously bred in each plant in sufficient quantities for operations. The on-site facilities to process the fuel constituents are a capital cost item to the plant. Starfire had a quote for the cost of deuterium ($2175/kg in 1980$) and calculated needed quantities to account for usage and leakage. All other tritium breeding materials, cladding, neutron multipliers, etc., would be accounted in the SCR cost account. The annual cost of deutritium was $0.3 M (1980$) or $0.7 M (2009$).
As discussed earlier, Sheffield, et. al, in the Cost Assessment of a Generic Reactor2 included in the Fuel Cost account the cost of first wall/blankets, limiters/divertors, some heating and current drive components, fuel, some miscellaneous replaceable component costs, and decommissioning and disposal (combining Scheduled Component Replacement costs and Fuel Costs). Sheffield took the Starfire fuel (deuterium) costs and escalated it to $0.4 M. He assumed there was $30 M miscellaneous components that might be replaceable and chose to include 80% of these on an annual basis. So his subcategory of fuel cost was = (0.4 + 24*Fcro) M$, where Fcro is the related constant dollar FCR. Delene3 used the Sheffield fuel algorithm.
Bathke and Miller in ARIES II-IV study16 returned to the concept of separating the fuel elements from the SCR hardware elements. They affirmed that there should be no cost for tritium as the breeding blanket self-breeds tritium in sufficient quantities in the long term. ARIES estimated the cost of deutritium as $3700/kg (1992$). The fuel COE for both ARIES-II and –IV was 0.03 mills/kWh or an annual cost of $0.20 M (1992$) or $0.29 (2009$). ARIES-AT14 reported a similar fuel COE and annual cost. A higher availability would change the cost results, but the significant digits mask any changes.
It is recommended the annual fuel costs continue to be handled per the current ARIES approach to separate the fuel and scheduled component replaceable items. The cost of the initial supply of tritium for the first fusion power plant might be a sizable one-time cost, but within a very short period of time, the plant should be tritium-self sufficient and will produce an excess tritium to start another new power plant, per El-Guebaly and Malang39. In the long run, the net cost of tritium should be zero and any initial costs will be balanced with sale of tritium to another power plant starting operation after ~5 years. It might be wise to obtain a more current update on the cost of deuterium. For the moment, assume a nominal fuel cost, CF, of $1 M/y in 2009$ for the cost of deuterium as the ARIES-AT estimate seemed too low. Is this enough deuterium to also cover the cost of lithium burnup? Siegfried Malang estimated the burn up of lithium at 1 kg/day x $546/kg (for 70% enriched Li) = ~$546/day or $200,000/yr.

94
Decontamination and Decommissioning, CD&D Schulte9 and Waganer1 (Starfire) did not identify any annual cost charge for decontamination and decommissioning and this was an oversight that needed to be corrected. Sheffield2, et al, in the Cost Assessment of a Generic Reactor did add this cost item as a separate annual cost as a 0.5 mill/kWh based on fission experience in decommissioning power plants.
Delene3 in his update of the Generomak cost model introduced the concept of LSA reduction factors for power plants with lower activation materials. These factors were applied to the decommissioning annual costs. He acknowledged that the fission disposal costs are highly speculative. At that time, a 1.0 mill/kWh was being levied on fission power plants for decommissioning. In the Updated Generomak Model31, an LSA 4 plant would be charged 1.0 mill/kWh and LSA of 3 would be 0.75 mill/kWh. The ARIES-II and IV study16 adopted the Delene LSA approach and expanded the LSA coverage to 0.50 mill/kWh for LSA = 2 and 0.25 mill/kWh for the LSA = 1. This practice continued into the later ARIES studies14,26. The 0.25 mill/kWh escalated to 2009$ and converted to annual costs equates to $2.70 M/y or $108 M accumulated over the 40-year plant lifetime.
Gen-IV24 referenced typical D&D costs for nuclear plants including PWRs and BWRs ranging from $300 M to $450 M each. The EMWB recommended a typical value of $350 M in 2007$ ($360 M in 2009$) for radiological decommissioning a single water power plant at a nuclear site. This does not include the cost to restore the site back to unrestricted use. Also a set of costing rules, shown in Table 37, were developed by PNL (as noted in Reference 24, page 102) to release the site from U.S. NRC regulation:
Table 37. U.S.NRC Minimum Prescribed Decommissioning Costs, per GEN-IV24 Type Algorithm 1200 MWe Plant, 2009$ PWR Cost, 2007 M$ = 173 + 0.024 x (Pth-1200) $178 M BWR Cost, 2007 M$ = 220 + 0.024 x (Pth -1200) $226 M Other Cost, 2007 M$ = 197 + 0.024 x (Pth -1200) $203 M where Pth is MWthermal within the range of 1200 and 3400 MW
This money is collected during the plant’s economic life in an external sinking fund consisting of high-grade tax-free bonds for the final D&D.
It is recommended the annual decommissioning costs continue to be handled per the current ARIES approach until the ARIES project develops a new scheme, suggested by El-Guebaly25, linking the decommissioning cost to the waste volume with considerations for the Class A and Class C low-level waste classification and the recycling/clearance alternate approach to geological disposal. An assessment of 0.35 mill/kWh or $2.76 M/y is recommended in 2009$ for CD&D be held in escrow for decontamination and decommissioning of the plant at the end of its life.
A general recommendation is that all O&M, SCR, fuel, and decommissioning costs be reported in both annual costs in dollars as well as COE in mills/kWh data. This approach would allow direct comparisons without the steps of determining the power plant net electrical output and the plant capacity (or availability) factor for conversion.
It would also be prudent to advance the reported costs to a more current year for comparison purposes. It is convenient to have all ARIES reports in 1992$, but it is a bit dated. Instead, it is

95
suggested that 2009 be adopted as a reference year or one that is associated with the next major ARIES project.
Cost Document Summary As stated in the initial paragraph, Purpose, the intent of this document is to provide a historical record of how the ARIES costing analysis has evolved from the early conceptual power plant studies and the costing experts that contributed to this body of knowledge. Each study had a unique set of circumstances that guided its costing assumptions and results. Each study based their estimate on a particular costing year. This document attempted to bring all of these costing groundrules, algorithms and estimates to a common format and costing year for a comparative assessment.
After the normalization process, the writer recommended a complete set of costing algorithms for the capital costs and the annual costs that were presented to the ARIES Team, which reviewed and approved these costs for incorporation into the ARIES Systems Code (circa 2009-2010). That is not to say, the costing effort is complete as it is not. There are technical areas that are not adequately developed to enable a reasonable cost estimate. Other areas that have had some technical development, but are not sufficiently developed to enable a detailed cost estimate. This may sound appalling, but the intent of the ARIES Systems Code is not to provide a detailed design and cost estimate, but rather its main purpose is to provide a relative comparison between many alternate concepts and technologies in an integrated system assessment. These concepts and technologies are currently in a very early stage of development. Moreover, the time frame of the power plant operation is some 50-80 years in the future, which implies a great deal of uncertainty.
I hope this document provides future conceptual power plant developers, designers and cost estimators with the background and insight to make knowledgeable decisions based on the past experiences.
96
References 1. C. C. Baker, et al., “STARFIRE – A Commercial Tokamak Fusion Power Plant Study,” Argonne National Laboratory report ANL/FPP-80-1 (September 1980).
2. J. Sheffield, et. al., “Cost Assessment of a Generic Magnetic Fusion Reactor,” Oak Ridge National Laboratory report, ORNL/TM-9311, March 1986 or Fusion Technology, 9 (1986) 199.
3. J. G. Delene, R. A. Krakowski, J. Sheffield, and R. A. Dory, “GENEROMAK Fusion Physics, Engineering, and Costing Model,” Oak Ridge National Laboratory report, ORNL/TM-10728, June 1988.
4. L. M. Waganer, et. al, “Inertial Fusion Energy Reactor Design Studies, Prometheus-L, Prometheus-HI,” Final Report, DOE/ER54101, MDC 92E0008, March 1992.
5. W. R. Meier, et. al., “OSIRIS and SOMBRERO Inertial Confinement Fusion Power Plant Designs” Final Report, DOE/ER/54100-1, WJSA-91-01.
6. The ARIES (Advanced Reactor Innovation and Evolution Study) web site, http://aries.ucsd.edu/ARIES/.
7. R. MILLER and the SPPS Team, “The Stellarator Power Plant Study,” University of California San Diego Report UCSD-ENG-004 (1997).
8. U.S. Department of Commerce, Bureau of Economic Analysis, Gross Domestic Product Web Page, http://www.bea.gov/national/index.htm#gdp.
9. S. Schulte, T. Wilke, J. Young, “Fusion Reactor Design Studies – Standard Accounts for Cost Estimates”, Pacific Northwest Laboratory, PNL-2648, May 1978.
10. C. Bathke, et. al., "Elmo Bumpy Torus Reactor and Power Plant" (co-author), Los Alamos Report LA-8882-MS, August 1981
11. J. P. Holdren, et. al., “Report of the Senior Committee on Environment, Safety, and Economic Aspects of Magnetic Fusion Energy,” Lawrence Livermore National Laboratory report UCRL-53766 (Sept. 1989).
12. J. D. Delene, “Updated Comparison of Economics of Fusion Reactors with Advanced Fission Reactors, Fusion Technology Journal, 19(3), 807 (1991).
13. S. C. Schulte, et. al., “Fusion Reactor Design Studies – Standard Unit Costs and Cost Scaling Rules,” Pacific Northwest Laboratory report, PNL-2987, September 1979.
14. Farrokh Najmabadi, et. al., “The ARIES-AT Advanced Tokamak, Advanced Technology Fusion Power Plant,” Fusion Engineering and Design 80 (2006) 3–23.
15. R. L. Miller, Decysive Systems, Informal Memo, “ARIES Systems Code (ASC) Cost Database Update,” April 13, 2008.
16. C. Bathke, R. Krakowski, R. Miller, and K. Werley, Chapter 2. “Systems Studies” of "The ARIES-II and ARIES-IV Tokamak Fusion Reactor Study -- The Final Report," UCLA report UCLA-PPG-1461 (1992).

97
17 M. S. Tillack, S. Malang, L. Waganer, X. R. Wang, D. K. Sze, L. El-Guebaly, C. P. C. Wong, J. A. Crowell, T. K. Mau, L. Bromberg, and the ARIES Team "Configuration and Engineering Design of the ARIES-RS Tokamak Power Plant," Fusion Eng. & Des. 38 (1997) 87-113.
18. R. Bangerter, G. Navratil, N. Sauthoff, 2002 Fusion Summer Study (Snowmass) Report, Section 3.3.6, Technology Issues, Cost, posted on FIRE web site, http://fire.pppl.gov/snowmass02_report.pdf.
19, F. Najmabadi, R. W. Conn, et al., "The ARIES-I Tokamak Fusion Reactor Study -- The Final Report," UCLA report UCLA-PPG-1323, 1991.
20. F. Najmabadi, R. W. Conn, and the ARIES Team, "Directions for Attractive Tokamak Reactors: The ARIES-II and ARIES-IV Second-Stability Designs," Nuclear Fusion Supplement, 3, 295-420, (1993).
21. L. M. Waganer, et. al., “Design Approach of the ARIES-AT Power Core and Vacuum Vessel Cost Assessment,” Fusion Engineering and Design Journal 80 (2006) 181-200.
22. ITER Technical Basis, Report G A0 FDR 1 01-07-13 R1.0, July 2001
23. Fusion Ignition Research Experiment (FIRE) Engineering Status Report for Fiscal Year 2001, Issued January 2002, Report No. 81_010202_FireFYRpt_FT.do.c
24. “Cost Estimating Guidelines for Generation IV Nuclear Energy Systems”, The Economic Modeling Working Group of the Generation IV International Forum, GIF/EMWG/2007/004, Revision 4.2, September 26, 2007.
25. Najmabadi, et. al., “The ARIES-ST Study: Assessment of the Spherical Tokamak Concept as Fusion Power Plants,” Proc. of 17th IAEA International Conference on Fusion Energy, (Yokohama, Japan, Sept. 1998).
26. J. F. Lyon, et. al., “Systems Studies and Optimization of the ARIES-CS Power Plant,” Fusion Science and Technology, Vol. 54, Oct. 2008.
27. L. El-Guebaly, V. Massaut, K. Tobita, and L. Cadwallader, “Goals, Challenges, and Successes of Managing Fusion Active Materials,” Fusion Engineering and Design 83, Issues 7-9 (2008) 928-935.
28. S. L. Thomson, "Sys (Systems) Coded Cost Accounting", ORNL memo FEDC-M-SE-004, Feb 19, 1988.
29. B. Badger, et. al., “UWTOR-M – A Conceptual Modular Stellarator Power Reactor,” UWFDM-550, October 1982.
30. “Impact of Design Physics on Fusion Reactor Design and Economics,” McDonnell Douglas Astronautics Company – East 1977.
31. J. Delene, “Generomak Cost Model Update”, ORNL, draft note, June 4, 1990.
32. L. El-Guebaly, “LSA Factors and External Costs for ARIES Systems Code,” Presented at ARIES Project Meeting, March 3-4, 2008 @ UCSD. http://aries.ucsd.edu/ARIES/MEETINGS/0803/ElGuebalyLSA.pdf
33. “Guide for Economic Evaluation of Nuclear Power Plant Design", NUS. Corporation, NUS.-531, January 1969.
98
34. Doan L. Phung, “A Method for Estimating Escalation and Interest During Construction (EDC and IDC), Institute for Energy Analysis, Oak Ridge Associated Universities, ORAU/EA-78-7, 1978.
35. R. M. Harrnett, D. L. Phung, “The Three Modes of Energy Cost Analysis – Then Current, Base-Year, and Perpetual- Constant Dollar,” Technical Report, Institute for Energy Analysis, Oak Ridge Associated Universities, ORAU/IEA-78-10(M), 1978.
36. J. Delene, “Generomak Model Update”, ORNL, draft note, Feb 21, 1989 (mentioned in Miller’s “ARIES Systems Code (ASC) Cost Database Update 4/13/2008.)
37. “Nuclear Energy Cost Data Base – A Reference Data Base for Nuclear and Coal-Fired Power Plant Generation cost Analysis,” DOE/NE-0044/3, U.S. Department of Energy, Office of Nuclear Energy, August, 1985.
38. C. G. Bathke and the ARIES Team, “Systems Analysis in Support of the Selection of the ARIES-RS Design Point,” Fusion Engineering and Design, 38 (1977) 59-86. "Systems Analysis in Support of the Selection of the ARIES-RS Design Point," C. G. Bathke and the ARIES Team.
39. L. El-Guebaly and S. Malang, “Toward the Ultimate Goal of Tritium Self-Sufficiency: Technical Issues and Requirements Imposed on ARIES Fusion Power Plants,” University of Wisconsin Fusion Technology Institute Report, UWFDM-1330 (April 2008). Available at: http://fti.neep.wisc.edu/pdf/fdm1330.pdf.
.
99
Appendix A. Recommended Cost Accounts Refer to separate Excel file, New Recommended Cost Accounts Rev K.xls
Appendix B of Power Core Component and Material Cost Basis Refer to separate Excel Spreadsheet on Fabrication Costs per kg Ref R.xlsx
The details and logic for most accounts are documented in an Excel spreadsheet (Cost Algorm Comprsn (2009$)(-81212).xls. Various systems are documented in different worksheets. Probably do not want to include this spreadsheet in document.