arithmetic mean
DESCRIPTION
sdg sdg dgTRANSCRIPT

Arithmetic MeanThe arithmetic mean is the most common measure of central tendency. It is simply the sum of the numbers divided by the number of numbers. The symbol "μ" is used for the mean of a population. The symbol "M" is used for the mean of a sample. The formula for μ is shown below:μ = ΣX/Nwhere ΣX is the sum of all the numbers in the population andN is the number of numbers in the population.
The formula for M is essentially identical:M = ΣX/Nwhere ΣX is the sum of all the numbers in the sample andN is the number of numbers in the sample.
As an example, the mean of the numbers 1, 2, 3, 6, 8 is 20/5 = 4 regardless of whether the numbers constitute the entire population or just a sample from the population.Table 1 shows the number of touchdown (TD) passes thrown by each of the 31 teams in the National Football League in the 2000 season. The mean number of touchdown passes thrown is 20.4516 as shown below.μ = ΣX/N = 634/31 = 20.4516Table 1. Number of touchdown passes.37 33 33 32 29 28 28 23 22 22 22 21 21 21 20 20 19 19 18 18 18 18 16 15 14 14 14 12 12 9 6Although the arithmetic mean is not the only "mean" (there is also a geometric mean), it is by far the most commonly used. Therefore, if the term "mean" is used without specifying whether it is the arithmetic mean, the geometric mean, or some other mean, it is assumed to refer to the arithmetic mean.MedianThe median is also a frequently used measure of central tendency. The median is the midpoint of a distribution: the same number of scores is above the median as below it. For the data in Table 1, there are 31 scores. The 16th highest score (which equals 20) is the median because there are 15 scores below the 16th score and 15 scores above the 16th score. The median can also be thought of as the 50th percentile.Computation of the MedianWhen there is an odd number of numbers, the median is simply the middle number. For example, the median of 2, 4, and 7 is 4. When there is an even number of numbers, the median is the mean of the two middle numbers. Thus, the median of the numbers 2, 4, 7, 12 is (4+7)/2 = 5.5. When there are numbers with the same values, then the formula for the third definition of the 50th percentile should be used.ModeThe mode is the most frequently occurring value. For the data in Table 1, the mode is 18 since more teams (4) had 18 touchdown passes than any other number of touchdown passes. With continuous data such as response time measured to many decimals, the frequency of each value is one since no two scores will be exactly the same.
No. Mode Median Mean
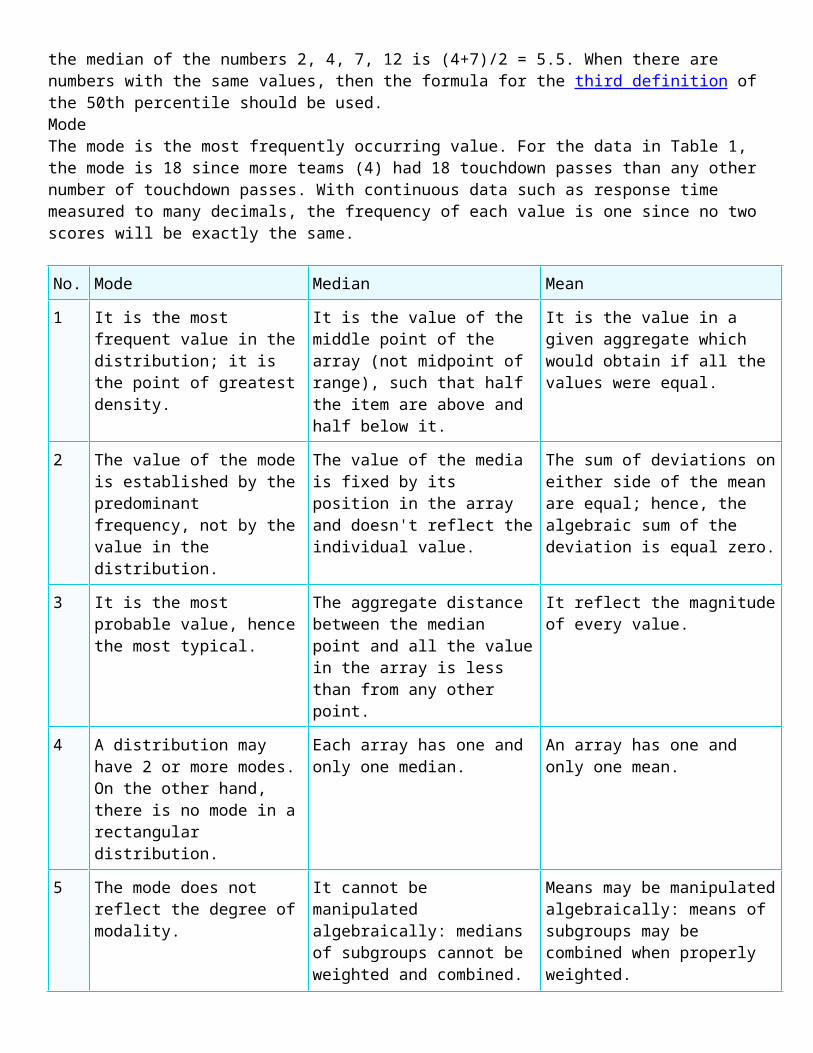
1 It is the most frequent value in the distribution; it is the point of greatest density.
It is the value of the middle point of the array (not midpoint of range), such that half the item are above and half below it.
It is the value in a given aggregate which would obtain if all the values were equal.
2 The value of the mode is established by the predominant frequency, not by the value in the distribution.
The value of the media is fixed by its position in the array and doesn't reflect the individual value.
The sum of deviations on either side of the mean are equal; hence, the algebraic sum of the deviation is equal zero.
3 It is the most probable value, hence the most typical.
The aggregate distance between the median point and all the value in the array is less than from any other point.
It reflect the magnitude of every value.
4 A distribution may have 2 or more modes. On the other hand, there is no mode in a rectangular distribution.
Each array has one and only one median.
An array has one and only one mean.
5 The mode does not reflect the degree of modality.
It cannot be manipulated algebraically: medians of subgroups cannot be weighted and combined.
Means may be manipulated algebraically: means of subgroups may be combined when properly weighted.
6 It cannot be manipulated algebraically: modes of subgroups cannot be combined.
It is stable in that grouping procedures do not affect it appreciably.
It may be calculated even when individual values are unknown, provided the sum of the values and the sample size n are known.
7 It is unstable that it is influenced by grouping procedures.
Value must be ordered, and may be grouped, for computation.
Values need not be ordered or grouped for this calculation.
8 Values must be ordered and group for its computation.
It can be compute when ends are open
It cannot be calculated from a frequency table when ends are open.
9 It can be calculated when table ends are open.
It is not applicable to qualitative data.
It is stable in that grouping procedures do not seriously affected it.