arizona energy assurance plan
TRANSCRIPT
Arizona Energy Assurance
Plan
August 31, 2017

Arizona Energy Assurance Plan Base Plan
The Arizona Energy Assurance Plan is a result of collaboration between state agencies and partners, led by the Arizona Department of Emergency and Military Affairs. For more information on this plan, contact:
Matt Heckard
Technological Hazards Branch Manager
602-464-6308

Arizona Energy Assurance Plan Base Plan
August 2017 BP-i
DEMA-EM maintains the Energy Assurance Plan as a living document intended to be continuosly reviewed and revised, with input from all stakeholders, to guarantee the most current plan possible.
PLAN REVIEW, EVALUATION, AND CHANGES
Date Summary of Activity Plan Section Recommendation By
Entry Made By

Arizona Energy Assurance Plan Base Plan
August 2017 BP-ii
DEMA-EM is committed to ongoing training, exercise, and engagement of the Energy Assurance Plan to validate capabilities of the state energy emergency consequence management and support effort.
TRAINING, EXERCISE, AND ENGAGEMENT ACTIVITY
Date Summary of Activity Partners Involved Entry Made By

Arizona Energy Assurance Plan Base Plan
August 2017 BP-iii
BASE PLAN INTRODUCTION .................................................................................................................BP-1
PURPOSE, SCOPE, SITUATION OVERVIEW, AND ASSUMPTIONS ..........................BP-2
PURPOSE ..........................................................................................................................BP-2
SCOPE ..............................................................................................................................BP-2
APPLICABILITY ................................................................................................................BP-2
SITUATION OVERVIEW ....................................................................................................BP-3
PLANNING ASSUMPTIONS ................................................................................................BP-7
PLAN STRUCTURE .............................................................................................................BP-8
BASE PLAN ......................................................................................................................BP-8
ANNEXES .........................................................................................................................BP-8
CONCEPT OF OPERATIONS .............................................................................................BP-8
COORDINATION WITH LOCAL GOVERNMENTS .................................................................BP-8
COORDINATION WITH OTHER STATE GOVERNMENTS ......................................................BP-9
COORDINATION WITH THE FEDERAL GOVERNMENT ........................................................BP-9
DIRECTION, CONTROL, AND COORDINATION .........................................................BP-10
ORGANIZATION AND ASSIGNMENT OF RESPONSIBILITIES ................................BP-11
EMERGENCY SUPPORT FUNCTION 12 – ENERGY ............................................................BP-12
FEDERAL GOVERNMENT SUPPORT .................................................................................BP-12
STRATEGIC PETROLEUM RESERVE ................................................................................BP-13
OFFICE OF ELECTRICITY DELIVERY AND ENERGY RELIABILITY (OE) ...........................BP-13
ENERGY INFORMATION ADMINISTRATION (EIA) ..........................................................BP-14
NATIONAL ASSOCIATION OF STATE ENERGY OFFICIALS (NASEO) ..............................BP-14
NATIONAL ASSOCIATION OF REGULATORY UTILITY COMMISSIONERS (NARUC) ........BP-14
FEDERAL ENERGY REGULATORY COMMISION (FERC) .................................................BP-14
THE NORTH AMERICAN ELECTRIC RELIABILITY CORPORATION (NERC) .....................BP-15
WESTERN AREA POWER ADMINISTRATION (WAPA) ....................................................BP-15
WESTERN STATES PETROLEUM ASSOCIATION (WSPA) ................................................BP-15
ARIZONA PETROLEUM MARKETERS ASSOCIATION (APMA) .........................................BP-15
INFORMATION COLLECTION, ANALYSIS, AND DISSEMINATION .......................BP-15
PLAN DEVELOPMENT AND MAINTENANCE.............................................................BP-16
TRAINING AND EXERCISING THE PLAN ..........................................................................BP-16
CONTEXT OF AUTHORITY FOR ENERGY ASSURANCE ..........................................BP-17

Arizona Energy Assurance Plan Base Plan
August 2017 BP-iv
ANNEXES ANNEX 1 - BLACK SKY AND ELECTRICAL GRID DISRUPTION ..............................A1-1
ANNEX 2 - TRANSPORTATION FUELS SHORTAGE AND DISRUPTION .................A2-1
ANNEX 3 - ELECTRICAL ENERGY IN ARIZONA .........................................................A3-1
ANNEX 4 - FUEL REDUCTION MEASURES ...................................................................A4-1
ANNEX 5 - PRIORITY END USER ....................................................................................A5-1
ANNEX 6 - ARIZONA FUEL SYSTEM VULNERABILITIES AND DISRUPTION CONSEQUENCES ................................................................................................................A6-1
ANNEX 7 – ENERGY ASSURANCE AND THE SMART GRID .....................................A7-1

Arizona Energy Assurance Plan Base Plan
August 2017 BP-1
INTRODUCTION
Arizona’s 2010 population of over 6,392,017 inhabitants is ranked 16th within the United States, as reported by the U.S. Census. Due to a period of rapid expansion, the population of the state has grown by 24.6 percent from the years 2000 to 2010. Despite much development and modern infrastructure, the state is strongly dependent on out-of-state petroleum and natural gas supplies. Most of the energy infrastructure in Arizona is privately owned. The private sector maintains a comprehensive inventory of their infrastructure and coordinates among industry partners during incidents through highly developed and tested emergency response protocols.
The State of Arizona supports this robust effort in order to facilitate communication and cooperation between the public and private sectors. Objectives include sharing of information, support for consistent messaging to the community, and when requested provide government resource support in order to help these private sector partners ensure a readily available supply of energy to maintain the economy, health, and wellness of the whole community.
The original Arizona Fuel Emergency Plan was written based on the recommendation of the federal Public Law 94-:163, Section 362, of 1975. This law called for the development of standby state energy conservation plans to reduce energy demand by regulating the public and private consumption of energy during a severe energy supply interruption. Although the State of Arizona does not have specific legislation that addresses energy emergencies, there are statutes that govern the declaration of emergencies within the state.
Within the State Emergency Response and Recovery Plan (SERRP), the Emergency Support Function (ESF) 12 – Energy Annex facilitates coordination and support for the restoration and re-establishment of damaged energy systems and components for state-level or regional incidents, and forms the basis of the strategy for the consequence management effort during an energy emergency. The State of Arizona Energy Assurance Plan (the Plan) is a supplementary document to the SERRP, and provides additional hazard-specific planning and consequence management considerations. The Plan provides an overall basis by which appropriate energy-related policies, procedures, and regulations may be applied by the state if an energy emergency occurs.
An "energy emergency" is an actual or impending shortage or curtailment of usable, necessary energy resources, such that the maintenance of necessary services; the protection of public health, safety, and welfare; or the maintenance of a basically sound economy is imperiled in any geographical section of the state or throughout the entire state.
The Plan is designed to provide a basic framework for statewide effort to support and assist in the coordination of private sector efforts with government partners to reduce the impacts of a shortage to the state’s economy and its citizens’ health, safety, and welfare. The Plan represents a specific hazard-specific application of the the SERRP and ESF 12 which relies on a mixed strategy to respond to varying degrees of an energy shortage. The basic philosophy calls for reliance on the market to the fullest extent necessary. The Arizona Department of Emergency and Military Affairs, Emergency Management (DEMA-EM) is the lead agency for the SERRP and will provide state-level support for the coordination of energy emergency contingency measures with private sector partners as described in the SERRP. The Governor may declare an state of emergency in the event of an energy emergency.
Arizona Energy Assurance Plan Base Plan
August 2017 BP-2
Energy infrastructure owners develop effective response measures informed by a comprehensive awareness of the how these energy resources can impact the community if disrupted and how interdependencies affect the operational sustainability of their assets. Under Arizona state law, public service utilities are regulated monopolies given the opportunity to earn a fair and reasonable return on their investments. These organizations maintain awareness of geographic and demographic trends that may affect supply and demand, and awareness of how their systems and assets may be identified as critical infrastructure within the framework of the emergency planning efforts developed by government. Government depends on these utilities and infrastructure owners to maintain situational awareness of potential vulnerabilities, provide key industry contacts, and understand how the structure and operation of the energy markets play a role in overall system design, and how it will respond to impacts that may affect the wider community.
When disruptions occur to energy infrastructure that results in impacts to the community, a coordinated effort may be required to respond and recover from incidents that are beyond the capacity of the local public utility or single infrastructure owner to resolve. Government may provide consequence management services, in the form of coordination of additional resource support, to these utilities and infrastructure owners. The objective of this effort is to support an expeditious repair effort to the impacted infrastructure and restore energy services to the community as safely and quickly as possible.
PURPOSE, SCOPE, SITUATION OVERVIEW, AND ASSUMPTIONS
Purpose Critical Infrastructure Protection (CIP) is the shared responsibility of the private sector, local and state governments, and the federal government. Balancing the need for critical infrastructure protection and the state philosophy of "free market approach" and minimum government intervention, the purpose of the Plan is to provide, as requested, a support function that acts as a resource for energy infrastructure owners. The Plan helps outline potential consequence management strategies to plan for an effective and rapid response to energy emergencies by providing assistance as requested to support coordination efforts aimed at enhancing the resilience of the response, reducing risk and vulnerability in critical energy infrastructure and recommending the appropriate actions to ensure adequate energy in the state of Arizona.
Scope The Energy Assurance Plan provides additional context and considerations designed to supplement the ESF 12 Energy Annex within the SERRP. ESF 12 is intended to the be the primary basis for State of Arizona response and recovery roles and responsibilites for state-level energy emergencies. ESF 12 is implemented when any energy emergency or disaster reaches a level that overwhelms local, county, or tribal resources, or is determined by the Governor to constitute a statewide emergency.
Applicability In the event demand for energy products/services exceeds the available supply in the state, or if disruption in supply of energy products or electricity distribution occurs, the primary responsibility for restoring service rests with the energy infrastructure owners and operators. An escalation of this situation that affects significant populations or key critical infrastructure that in

Arizona Energy Assurance Plan Base Plan
August 2017 BP-3
turn creates impacts across a wide area may prompt an expanded coordination effort that supports a larger scale of operations.
Under the ESF 12 structure outlined in the SERRP, DEMA will lead the coordination effort for all state government activities, as directed by the Governor of Arizona, in response to an energy emergency.
Situation Overview Arizona produces virtually none of the fossil fuels it consumes. There are a few oil and gas wells with small production, and only one power plant in the state powered by an Arizona coal mine. The result is a state that almost entirely relies on imported fossil fuel, either by pipeline for liquids and gas products, and railroads for coal. The entire western region has been called “an energy island” (Figure 1-2). This dependence represents one level of vulnerability. A second level of vulnerability is the relative isolation of the principal demand centers (metropolitan population centers in Maricopa and Pima counties) from the sources of imports.
Figure 1.2- The West Coast is an Energy Island. Source: California Energy Commission.
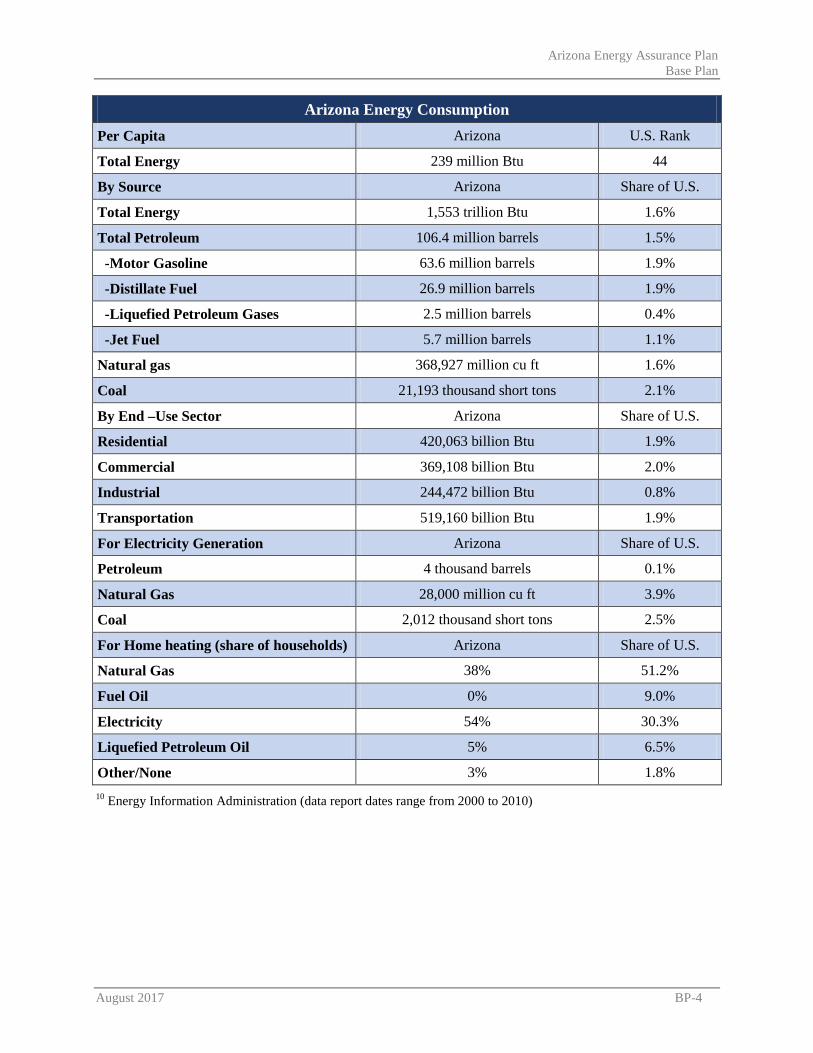
Aside from coal deposits concentrated in the Black Mesa Basin in the northeast part of the State, Arizona has few other fossil fuel resources. Palo Verde, a nuclear power plant west of the Phoenix metropolitan area generates a large part of electricity demand for the region, but only supplies about 20% of its output to Arizona directly. The State’s abundant sunshine offers some of the highest solar power potential in the country, and the Colorado River is a tremendous source of hydropower. Although per capita energy consumption is low, Arizona ranks near the middle of the States in total energy consumption. Arizona’s economy is not energy intensive. The transportation sector is the leading energy-consuming sector in the State. 10
Table 1.1- Arizona Energy Consumption
Arizona Energy Consumption
Arizona Energy Assurance Plan Base Plan
August 2017 BP-4
Arizona Energy Consumption Per Capita Arizona U.S. Rank
Total Energy 239 million Btu 44
By Source Arizona Share of U.S.
Total Energy 1,553 trillion Btu 1.6%
Total Petroleum 106.4 million barrels 1.5%
-Motor Gasoline 63.6 million barrels 1.9%
-Distillate Fuel 26.9 million barrels 1.9%
-Liquefied Petroleum Gases 2.5 million barrels 0.4%
-Jet Fuel 5.7 million barrels 1.1%
Natural gas 368,927 million cu ft 1.6%
Coal 21,193 thousand short tons 2.1%
By End –Use Sector Arizona Share of U.S.
Residential 420,063 billion Btu 1.9%
Commercial 369,108 billion Btu 2.0%
Industrial 244,472 billion Btu 0.8%
Transportation 519,160 billion Btu 1.9%
For Electricity Generation Arizona Share of U.S.
Petroleum 4 thousand barrels 0.1%
Natural Gas 28,000 million cu ft 3.9%
Coal 2,012 thousand short tons 2.5%
For Home heating (share of households) Arizona Share of U.S.
Natural Gas 38% 51.2%
Fuel Oil 0% 9.0%
Electricity 54% 30.3%
Liquefied Petroleum Oil 5% 6.5%
Other/None 3% 1.8% 10 Energy Information Administration (data report dates range from 2000 to 2010)

Arizona Energy Assurance Plan Base Plan
August 2017 BP-5
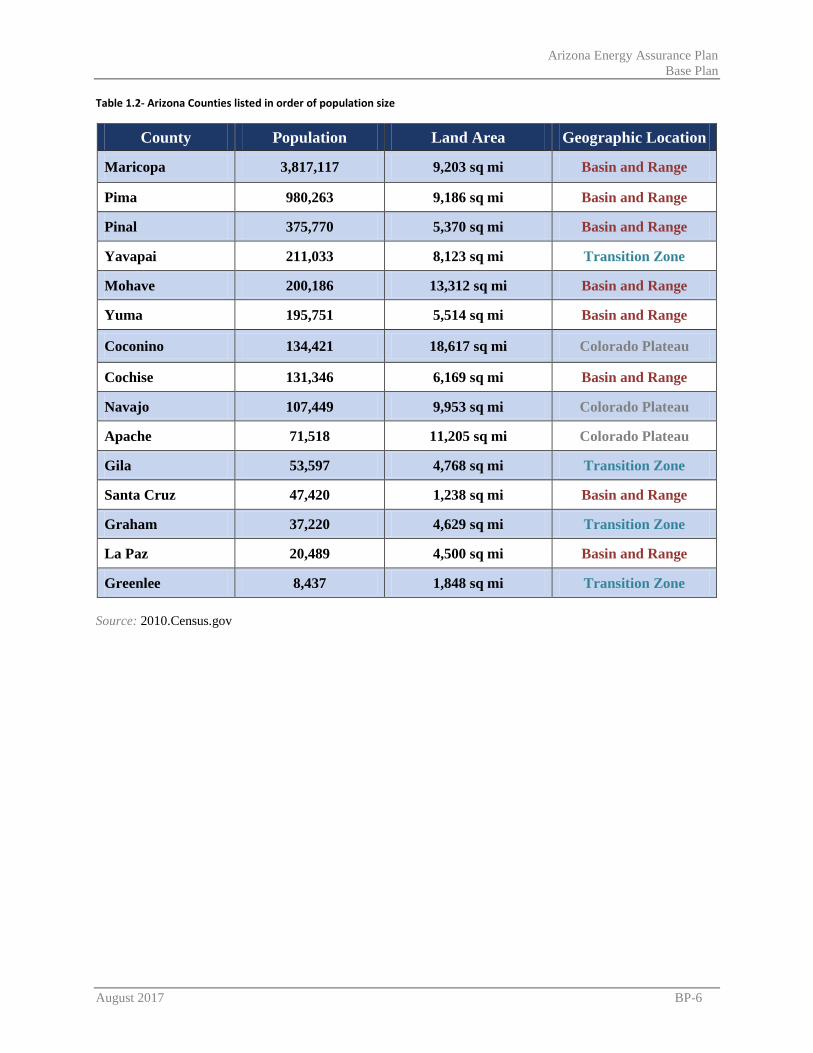
Maricopa, Pinal and Pima Counties are home to 80% of the Arizona population. These three counties, which cover about 21% of the states land area, are located in the Basin and Range geographical region in the southern-central area of the state. Public information management is especially critical in these densely populated areas. Additionally, energy shortages and curtailments in these counties may have severe economic impacts for the state of Arizona.
The remaining 20% of Arizona’s population live in the surrounding 12 counties spread over all geographical regions. Vulnerabilities associated with these counties are related to their isolation. If energy delivery were compromised, citizen health and welfare would be a primary concern.
Arizona’s geographical variance is noteworthy due to the wide range in climate. The states three geographical zones consist of, The Colorado Plateau, the Transition Zone (Central Highlands), and the Basin and Range. The higher elevations of the Colorado Plateau are susceptible to severe winter weather storms and thus can create high demand for home heating fuels as well as create delivery truck difficulties. The Basin and Range can have severe heat episodes throughout the summer season. Indoor air cooling becomes a necessity and can create an enormous strain on electricity demand.
Figure 1.2- Arizona Counties
Figure 1.3- Arizona Geography
Arizona Energy Assurance Plan Base Plan
August 2017 BP-6
Table 1.2- Arizona Counties listed in order of population size
County Population Land Area Geographic Location
Maricopa 3,817,117 9,203 sq mi Basin and Range
Pima 980,263 9,186 sq mi Basin and Range
Pinal 375,770 5,370 sq mi Basin and Range
Yavapai 211,033 8,123 sq mi Transition Zone
Mohave 200,186 13,312 sq mi Basin and Range
Yuma 195,751 5,514 sq mi Basin and Range
Coconino 134,421 18,617 sq mi Colorado Plateau
Cochise 131,346 6,169 sq mi Basin and Range
Navajo 107,449 9,953 sq mi Colorado Plateau
Apache 71,518 11,205 sq mi Colorado Plateau
Gila 53,597 4,768 sq mi Transition Zone
Santa Cruz 47,420 1,238 sq mi Basin and Range
Graham 37,220 4,629 sq mi Transition Zone
La Paz 20,489 4,500 sq mi Basin and Range
Greenlee 8,437 1,848 sq mi Transition Zone
Source: 2010.Census.gov

Arizona Energy Assurance Plan Base Plan
August 2017 BP-7
Planning Assumptions The State of Arizona, as the basic authority and the protector of the citizens’ health, safety, and welfare, maintains situational awareness of the potential for state-level events, and may activate appropriate ESFs under the SERRP. During an energy supply shortage or disruption, State government intervention occurs only to the extent necessary. In cooperation with other public institutions and the private sector, the state's primary goals in supporting the management of an energy shortage crisis may include:
• Situational awareness and common operating picture of accurate information between all partners in government and private sector during an energy shortage.
• Keep the public informed and advised about what is being done to address impacts and shortfalls in energy supply and resources, and clear explanations for how these impacts may affect them.
• Assist to identify and ensure essential services that support life safety or public safety are prioritized to receive reliable energy and vital energy provisions during an energy shortage.
• Effectively respond to specific requests for support and coordination assistance from utilities and energy infrastructure owners and providers.
• State intervention needs to be carefully applied, so it does not lead to unintended consequences that exacerbate market disruption.
• Assist in developing joint strategies with utilities and energy infrastructure owners and providers to consider reasonable efforts aimed at alleviating economic hardships caused by a long-term energy shortage.
• Prepare specific public messaging, as needed, that is designed to restrain demand and manage energy supply, particularly messages that rely on voluntary participation by the public in conservation strategies.
• Identify possible mechanisms to augment decreased mobility during a crisis, especially in the area of commuter travel; and support the coordination for implementation of these mechanisms as needed.
• If the magnitude of a crisis makes necessary temporary prohibition of certain uses of energy, all efforts shall be made to identify those uses prior to a crisis and plans prepared to lessen the burden on an equitable basis.
• Work with industries to identify opportunities, as appropriate, to balance any potential or actual inequities in the distribution of fuel, including petroleum-derived fuels, such as diesel and gasoline.
• Improve ongoing and continuous coordination and working relationships with all energy providers during both steady state and disaster state.
The Plan relies on a cooperative partnership between government agencies and private industry. DEMA will assist industry as requested and provide coordination services to all levels of government, including Tribal government, ensuring a coordinated state response to an energy shortage or disruption.

Arizona Energy Assurance Plan Base Plan
August 2017 BP-8
PLAN STRUCTURE
The Energy Assurance Plan is comprised of a Base Plan and seven (7) support Annexes. The Energy Assurance Plan references the SERRP as an overarching plan that collectively makes up the comprehensive foundation of energy emergency planning for the State of Arizona emergency management enterprise.
The Energy Assurance Plan does not include agency specific plans and procedures, however, it serves as the foundation for the development of respective local, county, tribal, state, and NGO plans and procedures in support of energy emergency response and “black sky” planning.
Base Plan The Base Plan serves as the foundation for all annexes and appendices in the Energy Assurance Plan. It describes the overall state structure, concept of operations, and roles and responsibilities comprising the statewide approach to energy emergencies. The Base Plan is designed to integrate the efforts and resources of local, county, tribal, state, private sector, NGOs, and, if necessary the federal government.
Annexes Annexes provide high-level overviews of concepts that support a comprehensive understanding and strategy for energy assurance planning. They are meant to provide an easy to use, simplified explanation of options that agencies can reference during stressful and rapidly developing energy-related incidents.
CONCEPT OF OPERATIONS
The Energy Assurance Plan is written as a Hazard-Specific reference. Technological hazards, by their very nature, often require complex and unique considerations to effectively meet the threat posed to the community by an incident of this type. The Plan is designed as a supplementary document to the SERRP and ESF 12 - Energy by providing a comprehensive reference that can be used as a resource within the SERRP all-hazards response framework.
Coordination with Local Governments County government applies to any of the 15 identified political subdivisions within the state. Local government means any incorporated community, unincorporated community and special district located within the counties. Tribal government refers to any of the 21 federally recognized tribal nations located within the State of Arizona.
Emergency response coordination includes those actions and activities that support efforts to save lives, protect public health and safety, and protect property. The identified support and coordination efforts in this plan, carried out under the ESF, are based on existing statutory authorities identified in the SERRP.
The Plan references state/federal recovery assistance programs as defined by the Robert T. Stafford Disaster Relief and Emergency Assistance Act (Stafford Act) 93 P.L. No. 288,88 Statute 143. Recovery activities may be conducted concurrently with response activities.
An emergency/disaster may result in a situation that affects the national security of the United States or termed an Incident of National Significance. For those instances, appropriate U.S.
Arizona Energy Assurance Plan Base Plan
August 2017 BP-9
Department of Homeland Security authorities and procedures will be utilized to address national security and response requirements.
Incidents that require international response and/or coordination will be managed via appropriate border county/local jurisdiction Memorandum of Agreements/Understanding (MOA/MOU) and the respective neighboring Mexican State and/or “sister city”. Any act or suspected act of terrorism utilizing weapons of mass destruction (WMD) will require coordination with federal Homeland Security agencies and the Federal Bureau of Investigation (FBI).
Coordination with Other State Governments The United States is divided into Petroleum Administration Defense Districts or PADDS. The states within PADD V (Alaska, Arizona, California, Hawaii, Nevada, Oregon and Washington) are closely linked by their oil supply network. PADD V is essentially a self-contained oil supply system and because of this isolation recognizes the need for cooperation and coordinated actions.
The U.S. Department of Energy (DOE), through its Office of Electricity Delivery and Energy Reliability (OE), and the office of Infrastructure Security and Energy Restoration (ISER) maintains a password-protected Energy Emergency Assurance Coordinators (EEAC) website that should be used to notify other states of any energy emergency. Authorized state energy emergency coordinators may access valuable energy security information, including daily news summaries, emergency situation reports, lessons learned from other states, links to outage and curtailment information, and the ability to email messages to colleagues in other jurisdictions.
Coordination with the Federal Government The State energy assurance effort is designed to be compatible with federal emergency planning activities. The DOE, through its OE, and the office of ISER is responsible for coordinating the protection of critical energy assets and assisting federal, state, and local governments with disruption preparation, response, and mitigation in support of Homeland Security Presidential Directives 7 and 8. ESF 12-Energy, when activated, will respond to specific and written DOE requests for information, including Situation Reports.
The State and Local Liaison Program within DOE's OE, and the office of ISER is a major means of heightening federal-state cooperation. DOE also provides an electronic mail system and data service that are used by the states on a regular basis as well during energy emergencies.

Arizona Energy Assurance Plan Base Plan
August 2017 BP-10
DIRECTION, CONTROL, AND COORDINATION
DEMA-EM coordinates statewide response and recovery support efforts by means of ICS. An energy emergency that results in activation of the SEOC and ESF 12 will operate under the structure outlined within the SERRP. ICS, as set forth in the SERRP, is consistent with the concepts and principles of NIMS. ICS provides standardized terminology and procedures, unified command, and an action planning process which identifies incident response strategies and specific tactical actions. Utilizing ICS, the SEOC provides direction, control, and coordination of state resources during emergency operations. The SEOC is comprised of five sections:
• Policy Section is responsible for the strategic direction of statewide emergency operations and decision-making. When this plan is activated, the DEMA-EM Director/designee assumes overall responsibility and DEMA-EM becomes the lead agency for the coordination of emergency response and recovery support resources and activities. In a catastrophic incident, the Director may elect to consult with the FEMA Region IX Administrator regarding when to request activation of the Region IX Arizona All-Hazards CONOPS Plan in order to expedite the ordering of federal resources.
• Plans Section coordinates elements of information to provide incident analysis and is responsible for monitoring and reporting the current situation status through available technical expertise, and projecting and planning for future contingencies through the development of the Emergency Operations Center Action Plan.
• Operations Section is responsible for state coordination and incident response assets. Operations Section monitors and assesses current operational conditions, shortfalls, and unmet human needs through state agencies and volunteer organizations. The Operations Section, via the Recovery Branch, also coordinates Governor and Presidential Emergency Declarations, damage assessments, mitigation projects, and the establishment of assistance centers, as appropriate.
• Logistics Section coordinates personnel, resources, communications augmentation, supplies, procurement, etc., required to support incident response.
• Finance and Administration Section coordinates the cost accounting aspects related to response and recovery, to include procurement approval, and collection of all related documentation.

Arizona Energy Assurance Plan Base Plan
August 2017 BP-11
ORGANIZATION AND ASSIGNMENT OF RESPONSIBILITIES
DEMA and the Arizona Corporation Commission (ACC) are responsible for coordinating state-level support and coordination actions, as requested, to assist energy infrastructure owners and operators responding to an energy emergency within the State. The political sub-division affected by the energy emergency is responsible for any initial declaration of an emergency or disaster. The Office of the Governor declares all state emergencies. Ultimate authority in any state emergency is vested in the Governor of Arizona.
Executive Order No. 91-5 was signed and put into effect on February 14, 1991. This executive order defines the energy policy for the state of Arizona. It tasked the Arizona Department of Commerce (later the Governor’s Office of Energy Policy, which was dissolved and the energy emergency response coordination responsibility was subsequently transferred to DEMA) with carrying out the planning process for the policy. Included as part of the executive order is the statement that it is “in the public’s interest to have a formal energy policy and implementation plan that … provides contingency plans in the event of supply disruptions”
Executive Order No. 2011-02 dated May 17, 2011, established the Governor’s Office of Energy Policy. The executive order included under “duties, powers, and authorities of the OEP” to include “coordinating and cooperating with federal and state agencies, departments and divisions, and local governments on issues concerning the State’s energy requirements, supply, transmission, management, conservation and efficiency efforts” and “pursuing and accepting federal delegation of responsibility and authority for matters that affect the energy supply, transmission, management, consumption, and conservation by the citizens of Arizona, other than energy codes and standards for buildings and those matters under the jurisdiction of the Arizona Corporation Commission;”
In 2013, Governor Janice K Brewer formed a Master Energy Plan Task Force to provide an updated assessment of energy production, generation, transmission, and conservation. Incorporating the considerable input provided to her, Governor Brewer created empower Arizona: Executive Energy Assessment and Pathways, the guide that was intended to help leaders make informed energy decisions to ensure Arizona has affordable and reliable energy resources. This plan is the formal implementation of Executive Order No. 91-5 which states “in the public’s interest to have a formal energy policy and implementation plan” as well as Executive Order No. 2011-02 which specifies “duties, powers, and authorities” to include “coordinating and cooperating with federal and state agencies, departments and divisions, and local governments on issues concerning the State’s energy requirements, supply, transmission, management, conservation and efficiency efforts.”
Energy emergency planning and contingencies are addressed under an “all hazards” framework, which in Arizona is contained within the SERRP. The SERRP recognizes the best practice of modern emergency management to use a consistent, scalable, universal coordination structure to guide the roles and responsibilities of the emergency management consequence management mission. Within the SERRP, the ESF 12 Energy Annex outlines the general structure of how coordination and support efforts are organized based upon a request to provide additional capability and resources to the emergency response effort.
The ACC requires each regulated utility to file, as part of its general tariffs, a procedural plan for handling severe supply shortages or service curtailments. In the event of a national emergency or
Arizona Energy Assurance Plan Base Plan
August 2017 BP-12
local disaster resulting in service interruptions, these plans are to provide for equitable treatment of individual customer classes. Regulated utility companies must have procedures developed to curtail service on a priority basis. Priorities vary with each utility; however, all utilities base their priority systems on giving service based on health, safety and welfare concerns.
Emergency Support Function 12 – Energy Emergency Support Function (ESF) 12 - Energy supports and coordinates the restoration and re-establishment of damaged energy systems and components for incidents requiring a coordinated statewide or regional response.
Activities within the scope of ESF 12 include the following:
• Collect, evaluate, and share information on energy system damage and provide estimations on the effect of energy system outages within affected areas.
• Provide information, through coordination with local energy providers, concerning the energy restoration process, including priorities, projected schedules, percent completion information, geographic impact data, conservation efforts, energy forecasts, and other information as appropriate.
• Facilitate energy restoration efforts by activating legal authorities and by facilitating the receipt of waivers.
• Provide technical expertise to energy asset owners and operators, conduct field assessments, and assist government and private sector stakeholders to overcome inherent challenges in restoring energy systems by providing appropriate supplemental state assistance and resources.
For more information, refer to the Emergency Support Function 12 – Energy Annex in the SERRP.
Federal Government Support The Arizona Energy Assurance effort corresponds to the federal government's energy emergency policy. The federal government's energy emergency policy is essentially to ensure that the United States has an adequate supply of energy at a reasonable cost. In support of this policy, the energy emergency preparedness program of the DOE is directed toward reducing our vulnerability to energy supply disruptions and enhancing our ability to respond should a disruption occur. DOE's responsibilities involve operations in both the domestic and international spheres. Only the domestic operations affect the states directly.
The current policy of the federal government is to rely on the market to resolve disruptions of crude oil supply. A lesson learned from the 1970s is that the price controls then in effect only exacerbated the shortages. The market would be supplemented, if necessary, by other measures that complement its functioning.
Specific information related to federal support can be found in the NRF. The Arizona All-Hazards CONOPS Plan, owned by FEMA Region IX, is used by Arizona and FEMA Region IX as a guide when FEMA assistance is needed in Arizona.
Arizona Energy Assurance Plan Base Plan
August 2017 BP-13
Strategic Petroleum Reserve The Strategic Petroleum Reserve (SPR) is the most important tool for use by the federal government in the event of a severe disruption of petroleum supplies. The SPR was authorized by Congress in the Energy Policy and Conservation Act of 1975. This legislation provided for the establishment of a reserve of up to one billion barrels of crude oil and/or petroleum products for the purpose of reducing the impact of disruptions in petroleum supplies, and to carry out the obligations of the United States under the International Energy Program.
The SPR refers to an emergency petroleum store maintained by the United States Department of Energy, although in recent years several other countries have created their own SPR: The US SPR is either the largest or the second largest emergency supply in the world with the current capacity to hold up to 727 million barrels of crude oil. According to the Department of Energy, as of August 4, 2006, the current inventory is 726.5 million barrels (292.5 million barrels of Sweet crude oil1 and 434 million barrels of Sour crude oil2. The current inventory is available on SPR's website. The United States consumes about 20 million barrels of oil a day; therefore, at maximum capacity, the SPR holds the equivalent of about 36 days of normal consumption. The President decides when to use the SPR and at what rate. Most of the oil would be distributed by sale through competitive bidding to the highest bidders. Buyers are responsible for transporting purchases or crude oil from the storage site.
Office of Electricity Delivery and Energy Reliability (OE) The Office of Electricity Delivery and Energy Reliability (OE) operate DOE's Emergency Management System, Headquarters Emergency Operations Center. OE insures integration and compatibility of all departmental emergency operations facilities. In order to meet its national security requirements and responsibilities contained in the Federal Response Plan, DOE has established mandatory reporting requirements for electric power system incidents or possible incidents. Such incidents are to be reported to the DOE through its EOC on a timely basis.
The OE is also responsible for Critical Infrastructure Protection. It manages Departmental activities that support DOE's role as lead agency for government interaction with the nation's energy sectors regarding critical infrastructure protection. In this role, OEA develops and manages the critical infrastructure protection R&D program, and leads and coordinates departmental efforts to work with industry, state and local governments and national and international entities in accordance with Presidential Decision Directive 63 (Policy on Critical Infrastructure Protection). This directive calls for a series of actions that are designed to defend our critical infrastructures from various threats. The directive also identifies lead federal agencies for each critical infrastructure.
1 Sweet crude oil is a type of petroleum. The adjective sweet refers to small amounts of hydrogen sulfide and carbon dioxide; sweet crude generally contains less than 0.5% sulfur. This high quality, low sulfur crude oil is commonly used for processing into gasoline and is in high demand, particularly in the United States and China. 2 Sour crude oil contains the impurities hydrogen sulfide (H2S) and carbon dioxide, or mercaptans. All crude oil contains some impurities. When the total sulfide level in the oil is > 1 % the oil is called "sour". The impurities will need to be removed before this lower quality crude can be refined into gasoline, thereby increasing the cost of processing. This results in a higher-priced gasoline than one made from sweet crude oil. Sour oil is toxic and corrosive, with high levels of hydrogen sulfide. The oil has the smell of rotten eggs, and at high concentrations the inhalation of hydrogen sulfide is fatal.

Arizona Energy Assurance Plan Base Plan
August 2017 BP-14
The DOE, through its OE, and the office of ISER maintains a password-protected EEAC website that should be used to notify other states of any energy emergency. Authorized state energy emergency coordinators may access valuable energy security information, including daily news summaries, emergency situation reports, lessons learned from other states, links to outage and curtailment information, and the ability to email messages to colleagues in other jurisdictions.
Energy Information Administration (EIA) EIA was created by Congress in 1977. It is a statistical agency of the DOE that provides policy-independent data, forecasts, and analyses to promote sound policy making, efficient markets, and public understanding regarding energy and its interaction with the economy and the environment. EIA distributes four types of information products: energy data, analyses, forecasts, and descriptive information about our products. Many of the products, such as the Petroleum Supply Monthly, deal with specific industries. Some of EIA’s forecasting models are available on their Web site at http://www.eia.doe.gov.
Other EIA products are descriptions of information products that include directories of survey forms, lists of publications, electronic products and models, a guide to energy education resources, and complete lists of energy data contacts to call who have answers to energy questions.
National Association of State Energy Officials (NASEO) The National Association of State Energy Officials (NASEO) and the OE cooperated in developing material for a handbook of guidelines for energy contingency planning (see Reference NASEO Guidelines).
National Association of Regulatory Utility Commissioners (NARUC) The National Association of Regulatory Utility Commisioners (NARUC) is the national association representing the State Public Service Commissioners who regulate essential utility services, including energy, telecommunications, and water. NARUC members are responsible for assuring reliable utility service at fair, just, and reasonable rates. Founded in 1889, the Association is an invaluable resource for its members and the regulatory community, providing a venue to set and influence public policy, share best practices, and foster innovative solutions to improve regulation.
Federal Energy Regulatory Commision (FERC) Congress provides a statutory foundation for the Federal Energy Regulatory Commission’s (FERC) oversight of power markets. While generation siting, intrastate transportation, and retail sales are generally regulated by state or local entities, wholesale sales and interstate transportation generally fall under federal regulation, primarily by FERC.
One of FERC’s strategic goals is to protect customers and market participants through vigilant and fair oversight of energy markets in transition. To pursue this goal, the Commission promotes understanding of energy market operations and assesses market conditions using objective benchmarks to create pro-competitive market structure. FERC’s Office of Market Oversight and Investigations is charged with assessing the competitive performance and efficiency of U.S. wholesale natural gas and electricity markets.

Arizona Energy Assurance Plan Base Plan
August 2017 BP-15
The North American Electric Reliability Corporation (NERC) The North American Electric Reliability Corporation’s (NERC) mission is to ensure the reliability of the North American bulk power system. NERC is the electric reliability organization (ERO) certified by the FERC to establish and enforce reliability standards for the bulk-power system. NERC develops and enforces reliability standards; assesses adequacy annually via a 10-year forecast, and summer and winter forecasts; monitors the bulk power system; and educates, trains and certifies industry personnel. ERO activities in Canada related to the reliability of the bulk-power system are recognized and overseen by the appropriate governmental authorities in that country.
Western Area Power Administration (WAPA) Western Area Power Administration (WAPA) markets and delivers reliable, cost-based hydroelectric power and related services within a 15-state region of the central and western U.S. One of four power marketing administrations within the DOE whose role is to market and transmit electricity from multi-use water projects. Their transmission system carries electricity from 57 power plants operated by the Bureau of Reclamation, U.S. Army Corps of Engineers and the International Boundary and Water Commission. Together, these plants have an installed capacity of 10,479 megawatts. Western and its energy-producing partners are separately managed and financed. In addition, each water project maintains a separate financial system and records. Western's administrator and staff focus on sound business practices and cost containment. Western States Petroleum Association (WSPA) The Western States Petroleum Association (WSPA) is a non-profit trade association representing twenty-six companies that explore for, produce, refine, transport and market petroleum, petroleum products, natural gas and other energy supplies in Arizona and five other western states.
Arizona Petroleum Marketers Association (APMA) The Arizona Petroleum Marketers Association (APMA) is an Independent Gasoline Distributors of Arizona with ten distributors. APMA is a non-profit trade association and is a member state of the Western Petroleum Marketers Association, the Pacific Oil Conference, and the Petroleum Marketers Association of America. APMA has over 100 members with 60 directly marketing petroleum products through over 500 locations across Arizona.
INFORMATION COLLECTION, ANALYSIS, AND DISSEMINATION
ESF 12 coordinates the collection, analysis, and dissemination of state agency support and coordination efforts during an energy emergency incident. This process is coordinated with local, county, tribal government, state, federal, NGOs, and the private sector based on the scope of the incident. Information coordination during an incident is managed by the Situation Unit in the Plans Section of the SEOC.
Most operational response and resource coordination will occur within the emergency response structures of the affected and partner energy infrastructure owners and operators. These mostly private sector entities share information with ESF 12 when appropriate based upon incident objectives established within those organizations. Operational level details, including the

Arizona Energy Assurance Plan Base Plan
August 2017 BP-16
individual metrics established by infrastructure owners and operators to monitor ongoing emergency response operations, are generally not shared outside the utility industry. Many of these organizations are prohibited from disclosing such information according to federal laws and tariff agreements in place to provide antitrust protection and protect undue influence on market speculation and pricing of these commodities.
ESF 12 partners utilize WebEOC, a web based situational awareness incident management system, GIS, and other technical tools to coordinate the information flow during incidents and to ensure a common operating picture among involved entities.
For terrorist incidents involving pre-incident intelligence, this may also include the Arizona Counter Terrorism Information Center (ACTIC), operated jointly by the Arizona Department of Public Safety (AZDPS), the Arizona Department of Homeland Security, and the FBI.
Public information activities will be conducted through ESF 15 - External Affairs to ensure the coordinated, timely, and accurate release of a wide range of information to the news media and the public about emergencies and other disaster related activities. These activities will utilize the Joint Information System (JIS) and may be carried out from the SEOC or the JIC, if established.
PLAN DEVELOPMENT AND MAINTENANCE
The Energy Assurance Plan is a living document, mean to be continuously reviewed and revised. All involvement with the Energy Assurance Plan follows the DEMA-EM efforts to plan, train, exercise, and operationalize. Following this cycle ensures that the Plan remains a current and dynamic plan.
Development and maintenance of the Energy Assurance Plan is coordinated by DEMA-EM, which also serves as the ESF 12 Primary Agency responsible for this plan. Maintaining the Energy Assurance Plan as a living document in the most current form possible requires continuous commitment from all involved agencies and departments under ESF 12.
DEMA-EM, in coordination with agencies and departments identified in ESF 12, review this plan on an on-going basis. Updates to the Energy Assurance Plan continuously occur based on organizational and policy changes, gaps identified during exercises and actual events, and changes in roles and responsibilities.
State agencies and departments identified under ESF 12 as Primary or Support Agencies are strongly encouraged to review and update their respective EOPs and SOPs in accordance with this and all future versions of the Energy Assurance Plan. Local, county, and tribal emergency management enterprise partners are welcome to familiarize their agencies with the Energy Assurance Plan and, if desired, incorporate elements of the document into their plans.
Training and Exercising the Plan DEMA-EM will provide planning, training and exercise advice, counsel, and technical assistance to local, county, tribal, and state agencies, Private Sector Partners, and NGOs as requested.
DEMA-EM will coordinate periodic trainings and exercises of the Energy Assurance Plan with ESF 12 partners to ensure operational capabilities. Exercises will adhere to the Homeland Security Exercise Evaluation Program (HSEEP) to ensure a comprehensive and continuing validation of State of Arizona enterprise all-hazards emergency planning.

Arizona Energy Assurance Plan Base Plan
August 2017 BP-17
A record of plan reviews, updates, and changes and training, exercise, and engagement activities is included in the introductory material of this plan.
CONTEXT OF AUTHORITY FOR ENERGY ASSURANCE
The general reference for energy assurance planning is based on Public Law 94-163, Part C – State Energy Conservation Plans, Section 362, of 1975. This specific provision was contained under a larger legislative act known as the “Energy Policy and Conservation Act (42 USC 6201). The Act included elements to grant specific standby authority to the President, subject to congressional review, to impose rationing, and to reduce demand for energy through implementation of energy conservation plans, as well as the creation of the Strategic Petroleum Reserve and introduction of motor vehicle and consumer product energy efficiency standards A number of these initiatives were tasked to the Federal Energy Administration, created to address the 1973 oil crisis, which eventually merged with the DOE in 1977 and included the creation of the Energy Information Administration as the primary authority on energy statistics and analysis.
As stated in this law under section (e): “The Governor of any State may submit to the Administrator [of the Federal Energy Administration] a State energy conservation plan which is a standby energy conservation plan to significantly reduce energy demand by regulating the public and private consumption of energy during a severe energy supply interruption, which plan may be separately eligible for Federal assistance under this part without regarding to subsections (c) and (d) of this section.”
The provision for conservation planning was introduced as a result of a feasibility report (contained in 42 USC 6322), which was created to address creation of guidelines for establishing a State energy conservation goal to facilitate reduction of the total amount of energy consumed in that state and, in turn, reduce the rate of growth of energy demand across the nation. This report was created based upon a finding by Congress, as stated in Section 361 of the Public Law 94-163, which included a statement that “the Federal Government has a responsibility to foster and promote comprehensive energy conservation programs and practices by establishing guidelines for such programs and providing overall coordination, technical assistance, and financial support for specific State initiatives in energy conservation.”
These elements form the basis for the federal government’s energy emergency policy, which essentially aims to ensure that the United States has an adequate supply of energy at a reasonable cost. In support of this policy, the Energy Emergency Management Program of the DOE is directed toward reducing national-level vulnerability to energy supply disruptions and enhancing national-level ability to respond should a disruption occur. DOE’s responsibilities involve operations in both domestic and international spheres.

Arizona Energy Assurance Plan Base Plan
THIS PAGE INTENTIONALLY LEFT BLANK
Arizona Energy Assurance Plan
ENERGY ASSURANCE ANNEXES

Arizona Energy Assurance Plan
THIS PAGE INTENTIONALLY LEFT BLANK

Arizona Energy Assurance Plan Annex 1 - Black Sky and Electrical Grid Disruption
August 2017 A1-1
ANNEX 1 - BLACK SKY AND ELECTRICAL GRID DISRUPTIONOverview of Black Sky The three major utilities of Arizona, SRP, APS and TEP, are responsible for supplying the bulk of electricity demand in the state. The peak demand is met by a combination of available generation and purchased power contracts. The Emergency Support Function (ESF)-12 helps to support the efforts by energy infrastructure owners and operators to meet customer demand during an emergency, and a robust Western transmission network enables utilities to access additional supply as needed.
The Arizona electric grid is very robust. The grid is designed to survive the loss of multiple components without cascading, wide area outages. Most major area outages are the result of severe weather, such as a hurricane or an ice storm, damaging the low voltage distribution system in a relatively localized area. These weather events, even if very severe, rarely result in power outages that last more than a few days. The overall design of the system and integration with regional components of the larger electrical grid provide some margin of resiliency against long term, extended power outages that curtail service to an entire area or region. This type of long term event is referred to as a Black Sky event.
There are a multitude of challenges during such an event. Arizona has very hot summers that bring a large reliance on central air conditioning. Due to Arizona’s relative isolation from energy supply sources, there is a challenge in supplying adequate amounts of fuel to critical transportation vehicles and emergency generators. Communications may be severely impacted by a Black Sky event, and situational awareness and the ability to control remote electrical components is critical to restarting the grid.
Beyond these immediate issues, several downstream dependencies also exist that complicate the response and recovery process for a Black Sky event. A potentially increased dependency on natural gas generation carries risks in that many gas pipeline compressors are driven by electricity. Pipeline operation, due to its presence in many remote areas of the state, depends on SCADA and communications. FERC regulated pipeline tariffs, designed to protect proper functionality of the commodity markets, create regulatory barriers against wider access to pertinent information on current status and operations during a Black Sky emergency event.
The impact of a Black Sky event also potentially affects the public water supply. Many water and wastewater systems are lacking in emergency generation. Water supply system operation, like pipelines and electrical grid systems, also depends on SCADA and communications systems to function properly. Within the Arizona desert climate, and especially during the summer, the prospect of a water supply outage could create even more immediate challenges to public health and safety than a electric power outage.
Black Sky Response Priorities During the early stages of a Black Sky event, the larger utilities in Arizona will begin implementing the Black Sky black start plans. To implement the plans, decisions will be required by the utility about which generation to start, which transmission cranking paths to energize, where personnel should be dispatched to inspect and repair equipment, and what communications systems can be relied on to provide situational awareness and control. The principle depends upon utilization of strategically located secure enclaves, in which power can be restored from a generator and then used to bring other components of the system back on line

Arizona Energy Assurance Plan Annex 1 - Black Sky and Electrical Grid Disruption
August 2017 A1-2
in series. Some of the critical components have undergone hardening to provide additional contingency for availability as part of these plans. Black start plans are closely held by the utilities to protect their operations and help ensure that Arizona’s critical infrastructure is less vulnerable to compromise.
Each of the major utilities has well-defined emergency operations plans and procedures, extensive and recurrent training for both management and response personnel, and regular exercises to validate the application of the training and adequate performance of the procedures. APS, SRP, and TEP all have their own emergency operations centers that are stood up for emergency situations to coordinate the response effort both internally and among each other. Each also maintains relationships with local first responders and emergency managers to facilitate better coordination in the event of a disruption.
Black Sky events are expected to carry significant hardware damage distributed over a wide region, and restoration efforts will typically require more engineering support and repair crews than what utilities ordinarily plan for. Specifically, impacts such as EMP damage to electronic equipment will likely be undetectable without skilled testing and special equipment, placing even greater demands upon available personnel. While some cross training and enhanced training efforts take place, large scale restoration will require the introduction of large amounts of outside personnel from surrounding unaffected regions in order to be successful.
Energy infrastructure owners and operators will focus their efforts on restoring service as quickly as possible, but this mission depends on assured support from other sectors to supply those services and resources that lie outside its normal capabilities. Utility-led efforts can be enhanced through cooperation with local, county, tribal nation, and state government.
• Agencies can assist utilities under emergency conditions to obtain and provide waivers for emissions standards, federal motor carrier laws, and other emergency temporary regulatory relief measures to support emergency response operations.
• Agencies can also provide assistance with obtaining personnel support through local mutual aid compacts and interstate mutual aid agreements. The overall purpose of ESF-12 is to provide a coordination structure for emergency response support needed to assist the utilities in their restoration efforts when needs exceed their individual capabilities.
During the restoration of the grid following a Black Sky event, it seems intuitive that the need for electrical power and lifeline facilities would override any regulation of any type, but this is not a realistic or universally held view. There are numerous regulations that address power system operations (NERC Standards), air quality (EPA), natural gas service priorities, trucking, and other issues that could affect Black Sky restoration.
State Role in Black Sky Response The state can play a more direct role under certain circumstances. There are three main components for energy emergency response in which the state has direct involvement:
Curtailment Plans
Regulated utilities have a curtailment plan in place that include but are not limited to load reduction, rotating outages, periodic switching of customers etc. The regulated utilities activate their curtailment plans, filed and approved by the ACC, when the shortage is
Arizona Energy Assurance Plan Annex 1 - Black Sky and Electrical Grid Disruption
August 2017 A1-3
serious enough to warrant it. The ACC oversees the application of the regulated companies’ curtailments plans.
Emergency Fueling Plan
The Arizona Department of Transportation (ADOT) maintains an emergency fueling plan designed to prioritize its fueling stations and supply towards first responders in the event of an emergency in the area. Contracts are in place to provide some measure of assurance of first priority access to supplies in an emergency. ADOT, however, is reliant upon the same trucking vendors and has no trucks of its own to be able to re-supply fueling stations independently.
State Government Emergency Conservation Program
Should the severity of the shortage worsen, the Governor could initiate and implement programs for energy conservation. The Department of Administration would mandate state agencies to institute conservation measures including temperature adjustments in state facilities, modified work schedules, and elimination of unnecessary lighting, equipment and appliances use.
Cyber Security and Vulnerabilities With the advancement of the electric power and automation system, a variety of communication networks are interconnected to the electrical grid for the purpose of sensing, monitoring and control. This increases the security risks including cyber threats and vulnerability. A cyber-attack can be an electronic intrusion into a power station, substation or a control center, for manipulation or disturbance of electronic devices. This can lead to adverse consequences ranging from loss of stability, damage to power system components or an outage. Cyber security ensures the confidentiality of data and information, the integrity and availability of data and commands received in substations and control centers, and the authentication of received data and commands. Power system cyber security involves three main components: computer, communication and power system, which are highly interdependent. FERC has approved standards that NERC has developed regarding cyber security and requirements for power grids. This is to reduce the risk from any compromise of critical cyber assets and improve the reliability of the bulk electric systems.

Arizona Energy Assurance Plan Annex 2 - Transportation Fuels Shortage and Disruption Annex
August 2017 A2-1
ANNEX 2 - TRANSPORTATION FUELS SHORTAGE AND DISRUPTION At the fundamental level, interruptions of transportation fuels can reasonably be addressed with a mix of response: reducing demand, tapping local reserves, and increasing supply. Demand reductions can come from some combination of mandatory and voluntary measures. Tapping into available local reserves is viable when stored fuel is readily accessible to demand centers. Increasing supplies, at least of liquid transportation fuels, requires switching to alternative fuels (when available), employing an alternative pipeline routing when possible, mobilizing large fleets of tanker trucks or rail tank cars, and requesting waivers to allow a broader supply of gasoline products to enter the state.
The recommended options listed below may need to be evaluated for feasibility and effectiveness within the Arizona marketplace. Statutory authority varies from state to state. A legal analysis may be needed to determine whether Arizona State statutory authority would need revisions in order to implement any mandatory approaches to response measures. The options are listed here in three categories:
• Supply and delivery management programs o Regulatory waivers- (Driver-Hour, Air quality-CBG)
o Retail station purchase management (waiting line reduction) etc...
• Demand reduction programs o Public information campaigns, Park and ride, Flex-time and telecommuting etc...
• Mitigation Efforts o Options that can mitigate the impacts of supply interruptions
Each fuel emergency or shortage will have unique characteristics such as the percentage of fuel supply reduced, geographic areas affected, expected duration of the shortage etc. The effectiveness of these plans starts with an aggressive public information plan. Since there is a voluntary nature to these measures, compliance will not be a 100% therefore the better informed the public, the greater chance for success. The Governor has jurisdiction over all State agencies and may order State government agencies and employees to observe the selected fuel emergency measures. A Governor’s Executive Order and Emergency Declaration may also include appeals to all residents, businesses, schools etc. to voluntarily observe and follow the selected fuel emergency measures. If a fuel shortage is projected to be severe and last for more than one month, the Governor may consider requesting the legislature to pass laws to provide appropriate agencies with temporary authority to strengthen the effectiveness of specified fuel shortage emergency measures. Many of the measures listed here are found in Annex 4 which includes a more detailed discussion of each measure’s advantages, disadvantages, implementation process etc.
Supply and Delivery Management Programs Driver Regulatory Waivers
Driver service limitation waivers provide exemptions allowing motor carriers to operate beyond the State and Federal limits regarding hours of service. State governors also may issue emergency Executive Orders to suspend other state regulations such as local truck

Arizona Energy Assurance Plan Annex 2 - Transportation Fuels Shortage and Disruption Annex
August 2017 A2-2
environmental permitting. (See exhibits A and B for examples of recent E.O. from Michigan and Wisconsin) Air quality (CBG) waivers
Waivers provide exemptions from federal and local air quality laws requiring a specific formulation of fuel. This allows a broader supply of gasoline products to enter the state. EPA requires specific CBG formulations in the air quality non-attainment areas. The Arizona Department of Environmental Quality (ADEQ) is the lead agency for coordination with the EPA. Please refer to the SERRP, ESF 12 Energy Annex for further explanation. Odd/Even Fuel Distribution Measure (see exhibit C; New Jersey Executive Order-108)
In a moderate shortage situation, the need for a method to alleviate the long lines at retail service stations may arise. To avoid the hardship and inconvenience to the motoring public often associated with long lines at the pumps, and to assure the equitable distribution of gasoline to all potential users, the Governor, through an emergency declaration, may authorize an Odd/Even Distribution Measure.
This measure is designed to assist in the equitable allocation of gasoline to consumers. It may additionally encourage the conservation of fuel by causing trips to be better planned. Minimizing waiting lines may also reduce consumption by saving fuel that is used while idling.
This plan would be mandatory for State agencies and voluntary for all other entities. Under this plan, gasoline may be purchased or sold in accordance with procedures that may include the following parameters:
On odd/numbered days of the month, gasoline should only be sold to and purchased by the operator of a vehicle with a license plate labeled with an odd number as the last number. Most Arizona license plates end with three letters. License plates with ending letters of A - M may purchase fuel on odd days.
On even-number days of the month, gasoline should only be sold to and purchased by the operator of a vehicle with a license plate labeled with an even number. License plates ending in ending letters with N – Z may refuel on even number days. Personalized license plates will follow ending letters of A - M on odd days and N - Z on even days. (Note: Personalized license plates ending in numbers will follow the schedule for license plate numbers.
This plan should be implemented in concert with the Minimum Fuel Purchase measure.
Minimum Fuel Purchase
The primary function of the minimum purchase requirement is to allocate the sale of gasoline and reduce or minimize gasoline lines by discouraging the making of frequent but small gasoline purchases by consumers.
This measure would be implemented should the retail service stations be unable to curtail the gasoline lines through their own activities and procedures. An appeal to service station owners is issued requesting gasoline stations to sell a minimum amount of fuel, i.e., 10 gallons minimum to each customer. Motorists would be required to pay for the

Arizona Energy Assurance Plan Annex 2 - Transportation Fuels Shortage and Disruption Annex
August 2017 A2-3
minimum amount mandated, whether or not that minimum amount of fuel was dispensed. (Exceptions are made for rental cars; motorcycles etc… see Annex 4)
Maximum Fuel Purchase
This contingency measure may be implemented during a severe shortage. Purchasers of transportation fuel will be requested to buy no more than a specified amount of fuel in a single transaction, with the amount (dollar or gallon) to be determined (see Annex 4 for more details).
Limited Hours of Operation by Transportation Fuel Retailers
Option A: The Governor and local governments may request, that retail gasoline and diesel outlets should reduce their hours of weekly operation by a fixed percentage of their normal operating hours. Unless evidence is offered to the contrary, all retail stations will be assumed to normally operate one hundred hours per week. Stations will post conspicuously upon their premises the exact times of operation.
Option B: Designated days of closure. The Governor may request retail gasoline and diesel outlets to not open for business on specified days of the week. The Governor and local governments may designate specific stations to remain open to provide emergency services.
Option C: Sunday closing with operating hour percentage limits for the remainder of week. The Governor and local governments may request retail gasoline and diesel outlets to not operate on Sundays of any week, and will also be asked to reduce their hours of normal operation on other weekdays. As in Option A above, the hours of operation will be posted upon the premises.
Petroleum Product Distribution Plans by Suppliers
Each of the primary suppliers of transportation fuel within the state may be asked to prepare a plan to assure a fair distribution of products within the state. Such plans must demonstrate that the distribution plan appears to fairly allocate petroleum products. Due to laws limiting the petroleum industry’s ability to share specific information publicly, government agencies must work with suppliers, on an individual, confidential basis to determine their capabilities relative to supply and distribution and then come up with a plan that suppliers can logistically meet.
Drive-Up Window Closures
The Governor may ask for voluntary restriction on operations of drive-up windows at banks, liquor stores, fast food and similar establishments. Exceptions may be made at facilities where only drive-up service is provided.
Demand Reduction Measures Programs which can be implemented in response to a fuel shortage The Governor may order all State agencies to implement all or parts of the following demand reduction measures. Some demand reduction measures may require further legal review to determine the limits of its applicability beyond a voluntary appeal to the general public.
Speed Limit Enforcement Measure

Arizona Energy Assurance Plan Annex 2 - Transportation Fuels Shortage and Disruption Annex
August 2017 A2-4
Option: Intensified speed limit enforcement by eliminating the use of warning tickets. Saves fuel through the lowering of operating speeds.
Parking and Alternative Transportation Management Measures
The Parking and Alternate Transportation Management Measure includes an intensified public information and training campaign to encourage travelers to shift from low-occupancy vehicles to higher-occupancy vehicles such as car pools, van pools and to mass transit. The activities introduced in this measure are intended to complement the Employer-Based Travel Measure discussed in Annex 4, but would be implemented at an earlier stage of a gasoline shortage. It would be suggested if this measure were implemented, that businesses and employers institute a strategy which involves:
• increasing the cost of parking through increased rates.
• replacing subsidized, low-cost or free parking provided by employers to their employees with parking charges at prevailing commercial rates.
• offering car and van pools reduced rates or preferential treatment.
• allocating the most conveniently located spaces in employer-provided lots for multiple-occupancy vehicles.
• reducing availability of on-street parking for local government employees. Employer-Based Travel Measures
The Employer-Based Travel Measure would involve state and local government officials working with companies that employ large numbers of workers at individual sites in the state, with the objective of increasing vehicle occupancy rates and/or cases on the job as well. Employer-based plans could involve local transportation planners working formally with selected large employers. The appeal of this approach is in its great demand reduction potential, and its relatively painless nature.
The Employer-Based Measure will apply to all employers operating with 50 or more persons employed at one site. Also subject to the measure will be all schools at post-secondary level (colleges, universities, and technical schools) with a total commuting student-faculty-staff population of 50 or more persons.
Employers who are subject to the plan will be asked to develop for each applicable work site a program to reduce work-related travel by employees.
The following activities will be necessary to implement the Employer-Based 'Travel Measure:
• Prepare staff to operate, monitor, and enforce the plan.
• Identify and notify affected employers of plan requirements.
• Assist employers with plan development and implementation.
• Conduct random site audits of employer work sites.
• Institute hearings/appeals proceedings for adjudication of: (a.) Exemption requests by employers and (b.) Citations of employers for noncompliance.

Arizona Energy Assurance Plan Annex 2 - Transportation Fuels Shortage and Disruption Annex
August 2017 A2-5
• Evaluate the effectiveness of the measure. Compressed Workweek Measure
The Compressed Workweek is a more stringent measure to be implemented only in the event of a more severe energy emergency. In such circumstances the compressed workweek could contribute significantly to energy savings. Work-hour policies include two possible changes in work schedules:
• The workweek can be shortened by one day.
• Flexible work-hour policies could be implemented. The first measure will save fuel by reducing the number of work trips. The second measure will save fuel by stimulating wider use of mass transit facilities and by spreading out the peak period of travel. Spreading out peak-period travel reduces fuel consumption through smoother flowing traffic and increased car/van pool potential.
Changes in Work Patterns – officials may encourage the use of flexible work hours for both short- and long-term demand reduction, improvement in fuel efficiency, and reduction in traffic congestion. Flexible hours can be instituted for ongoing cumulative transportation energy savings, or developed, held ready, and brought online quickly in the event of an energy shortage. This program allows employees to stagger their commute hours, while still working during core hours, usually from 10:00 am to 2:00 p.m. This program reduces peak hour congestion, improving fuel efficiency.
Arizona state agencies may encourage employees to reduce commute trips by greater use of ridesharing, mass transit and flexible work schedules.
The Compressed Workweek Measure is only appropriate for implementation in a moderately severe emergency, during which efforts will be made to persuade employees to experiment with a compressed workweek and flexible-work-hour policies, in order to save gasoline and forestall a more severe shortage. A mandatory Compressed Workweek Measure for State agencies is a more drastic step and will be implemented only in the event of a severe emergency. Flextime should be tried first.
School System Conservation Measure
The purpose of the School System Conservation Measure is to reduce the consumption of gasoline by reducing the number of trips made to and from school and/or by better planning school activities and transportation services. It also encourages students to ride to school only in car pools or other ridesharing modes of three persons or more.
A variety of modifications can be made in school schedules and activities depending on the extent of the motor fuel (diesel and gasoline) shortage. Today, most school districts are continuously assessing methods of reducing fuel costs. This annex is designed as a way to promote conservation activities in schools.
Transportation
• Training bus drivers in energy-efficient driving techniques.
• Replacing fuel tank caps on school buses with locking caps. Optimizing school bus scheduling and routing for fuel savings.
Arizona Energy Assurance Plan Annex 2 - Transportation Fuels Shortage and Disruption Annex
August 2017 A2-6
• Discouraging students driving cars to school unless they are needed for vocational activities.
Reducing Fuel Use for Special Events
• Measures to reduce fuel use by athletic officials include using the most efficient size vehicles for trips, conducting local school fuel saving clinics, promotion of carpooling among officials to local association meetings, assignment of officials from same area so that they can ride together and determining better meeting locations.
• Rescheduling of athletic events to reduce fuel used, including examining the possibility of reinstating the activity period and athletic practice during the school day. This would involve changing current athletic regulations restricting interscholastic school practices to after-school hours.
• Stress energy education in the schools.
• In addition, this plan suggests the schools consider rescheduling of all after-school activities, not only athletic events.
• More drastic schedule changes, i.e. the four-day school week; will be implemented only in a severe energy emergency and in conjunction with the compressed workweek. Education hours lost on the fifth day will be spread equally over the four days (with provisions made for additional exercise breaks during the school year), or, if it appears fuel shortages will be temporary, school schedules may be modified so that during the shortage, schools will operate an eight hour/four-day week, with lost time being made up during vacation periods.
Local schools are encouraged to continue energy conservation planning. During a mild shortage, at the discretion of the schools, many of the above suggestions will undoubtedly be implemented. During a severe shortage, the Superintendent of Schools may request all school districts to restrict traveling to school in cars. Also, a compressed school week will be implemented, subject to the condition of prior or simultaneous implementation of a compressed workweek.
Carpool/Vanpool, Mass Transit Promotion
Option A: Sponsor employee car and vanpools. Encourage car-and-vanpool programs by major employers of more than 50 persons include rider matching services, publicity, financing of vehicles, preferential parking for high occupancy vehicles and provision of other incentives for the use of car-and-vanpools. Saves fuel by improving the attractiveness of car-and-vanpools, with consequent improvement in vehicle occupancies and person miles of travel per gallon of fuel consumed.
Option B: More transit frequency and coverage. Assist local agencies in expanding new transit service, reduced transit fare and free transit fare zones.
Flexible Work Hours
Option A: Staggered work hours. Mandate State agencies and request employers to stagger start and quit times over a two-hour period. The private sector response would

Arizona Energy Assurance Plan Annex 2 - Transportation Fuels Shortage and Disruption Annex
August 2017 A2-7
apply to all employers of 50 or more persons. Saves fuel by spreading daily work travel over a longer peak period. Increases access to mass transit and other transportation modes.
Option B: Flextime. Replaces fixed starting and quitting times with a range of times set at the discretion of each employee. The initial goal of such an effort would be a 10-percent shift of the workforce from fixed times to flex-times. Saves energy by spreading work travel over a longer peak period, making it easier to use mass transit, car and vanpools, telecommuting or other alternative transportation modes.
Option C: Four-day work week. Mandate State agencies and request employers to observe a four-day workweek. The private sector response would apply to all employers with 50 or more persons. Saves energy by reducing work travel (if it is not replaced by increased recreational travel), which generally occurs during periods of peak congestion.
No Drive Day
Option A: Voluntary. The public may be asked to leave cars at home one day a week, or the equivalent. The equivalent would be defined as a personal strategy that saves as much fuel as would a car-less day -- 15 miles per week. This could be done through carpooling, vanpooling, busing, biking, motorcycling, biking or walking to work.
Option B: Mandatory. State employees would be required to leave each car they own home one day a week. The requested response from the private sector would be voluntary.
Parking Facility Limitations
Option A: State agencies would limit occupancy, at 40-percent for all State owned parking areas, until after 10:00 a.m. daily. Limitation at private sector provided parking would be requested. High occupancy vehicles would be exempt. Encourages use of high occupancy vehicles and public transit, resulting in energy savings.
Option B: The Governor’s Office may request all employers of more than 50 persons to initiate daily parking charges or increasing the daily parking charge for single occupancy vehicles. This measure could be adopted by all parking lot owners. Serves as an incentive for carpools, vanpools and public transit use and saves energy by encouraging more energy efficient travel methods.
One-Day Closure of Retail Stores
Option A: Voluntary closing of large retail outlets one day a week, probably Sunday. This would require considerable coordination and cooperation even though some retail representatives already have expressed interest in closing for a day.
Option B: Privately owned parking facilities may implement a graduated parking fee structure that charges higher fees for low occupancy vehicles and lower or no fees for high occupancy vehicles.
Reduced Usage by Fleet Managers
Arizona state agencies and local governments must take the lead in reducing energy consumption to set an example and to make a significant impact on conservation of fuels. Fleet managers monitor use of vehicles.

Arizona Energy Assurance Plan Annex 2 - Transportation Fuels Shortage and Disruption Annex
August 2017 A2-8
Vehicle Tire Pressure Inspection
It is estimated that over 50 percent of the vehicles on the road are run on under--inflated tires. Furthermore, tests have shown that for every pound of under-inflation, fuel efficiency is cut by as much as two percent. A vehicle tire pressure program would rely on a public education campaign and a voluntary partnership with retail service stations. Tire pressure inspection and education could also be included in the emission inspections process.
Mitigation Efforts Several options exist that can mitigate the impacts of supply interruptions. Each one focuses on increasing supply security. Please refer to Annex 4 for additional information.
Increase Utilization:
The existing tank farms operate with substantial excess capacity. The existing tankage in Phoenix is more important than ever and utilization of that tankage is one solution to the imbalance. With ownership consolidation at the terminals it will become increasingly more difficult to increase utilization of existing storage, according to the Arizona Department of Weights and Measures (2010).
Trucking Contingency:
Arrange with trucking companies an emergency response contingency, assuming the disruption of supplies is an Arizona-based issue and not a regional emergency. These companies could be Arizona carriers or carriers from nearby states. Delivery of over 6 million gallons a day by 8,000-gallon trucks would require 800 trucks, if they all made just one delivery. If they make, on average, two deliveries per day, one could envision the need of 400 trucks. This may exceed the number tanker trucks available; reduced demand would necessitate fewer trucks. It is possible that National Guard tankers could be pressed into service for this purpose; there are 4 Army National Guard transportation company sized units in Arizona. These fall under the jurisdiction of the Governor. The units are the 222nd, 2220, 1404 and 2222 transportation companies. The issue would be to ensure that the tanker trucks have technical and plumbing requirements that are important for loading. At present, however, the National Guard has not changed over or added compatible loading equipment. Their fuel trucks have a different connection set-up than the typical commercial tanker trucks/loading racks. This came to light during the 2003 shortage and exploring the potential for adding or changing over National Guard trucks to a compatible set-up was listed as a recommendation in the lessons learned report.
Adjusted Tank Farm Operation:
Terminal operators might be able to change the ‘sellable bottom of the tank’ to decrease the amount of fuel that could be sold out of a tank to leave a surplus. However, terminal operators have custody but do not own the product stored in tanks. The terminal operator’s customers (owners of the product) have access to their inventories on a daily (as needed) basis. Consequently, terminal operators could not arbitrarily change the sellable bottom of the tank and decrease the amount of fuel that could be taken from the tank. This potential option needs further consultation with petroleum industry representatives.

Arizona Energy Assurance Plan Annex 2 - Transportation Fuels Shortage and Disruption Annex
August 2017 A2-9
State-Supported Reserve Program:
The state could maintain an emergency fuel reserve either by utilizing unused storage capacity in the existing tank farms or leasing a separate storage tank. These tanks are much larger than would be needed, so a separate tank would be an extremely expensive proposition. Additionally, the gasoline would need to be turned over every 18 to 24 months. Utilizing unused storage capacity in the existing tank farms would rest largely on whether it is possible to be assured a certain amount of fuel would remain in the tanks. The cost of acquisition of one day of supply of 150,000 barrels of regular gasoline is $18.9 million at a spot price of $3.00 per gallon. Storage costs would be roughly $0.02 per gallon per month or another $1.5 million per year if the space was leased within the existing capacity. The state would also have to establish a program to administer the reserve.
Resupply from Other States
Tanker trucks and rail cars from other states may service Arizona. But, they must have the proper permits from the agencies that regulate them, including the air pollution control agencies. As a practical matter, trucks will not travel far from the terminals because of the cost of hauling over long distances. That is one of the reasons gas costs more in some cities. It is also not feasible to expect trucks from other states to keep the major hubs of Tucson and Phoenix fully supplied if the pipelines go out. During a prolonged shortage, this option may be necessary to keep priority end users supplied, regardless of cost.
Solar backup:
Solar-based backup systems can be installed for the critical parts of the delivery and notification system that might be affected by an electricity outage. This would include pumping, control, and communication systems.
Set-Aside Program:
This may not be feasible in Arizona for a number of reasons, but it worth noting that several other states have implemented set-aside programs. Arizona has statute authorizing a set-aside program to help provide CBG during winter months. The authority is found at A.R.S. Section 28-482 and is undergoing a statutory review process to determine applicability, if any, to emergency fuel shortage response. Rules to implement the set-aside program have not been adopted. Even in the event that Arizona does not adopt a set-aside strategy, such plans help identify elements that can be incorporated in other parts of contingency planning.
Delaware and Mississippi have set aside programs that could be considered. To achieve maximum flexibility in the set –aside program individual elements within the program do not automatically become effective when the set –aside program is implemented. In addition, some parts of the program will be implemented only if the federal government institutes price and allocation controls. The four set –aside program elements are:
• Basic set –aside element – the program’s Basic Set –Aside Element redistributes fuel supplies to bulk consumers who are considered priority users and who are experiencing difficulty obtaining sufficient fuel supplies at any price.

Arizona Energy Assurance Plan Annex 2 - Transportation Fuels Shortage and Disruption Annex
August 2017 A2-10
• Community Hardship Element – the community hardship element allows a community to request fuel supplies from the state set-aside program when it is experiencing an emergency or hardship caused by a shortage of fuel, or is receiving less than 80% of allocation fraction. Community Hardship is the only program element whereby retail service stations may be eligible for a set –aside allocation.
• Assignment and Adjustment Element is intended for use only after the federal government institutes a price and allocation control program. Those bulk purchasing end users who do not have a record of fuel receipts for the base period mat request that they be assigned a prime supplier. Those end-users who have substantially increased their use since the time of the base period, may apply for an adjustment of supply volume in increase the amount of their supply.
• Certification Element – allows emergency, health, safety and essential services to apply for certification-of-need to receive their supplies. The certification, once approved, will remain valid as long as this element of the program is operational.
Less-Dependent Vehicles:
Through the use of policy mechanisms, reduce demand by increasing the use of high-mileage and electric vehicles. These would lower our reliance on a constant flow of transportation fuels and allow greater flexibility in the event of interruptions in delivery. The State could take a leadership role with its own fleet of vehicles.
Fleet Conversions
Natural gas is both plentiful and inexpensive. Already some vehicles in Arizona have been converted to its use. Larger-scale conversion of vehicles from gasoline and diesel to natural gas would have several advantages. It comes into Arizona on different pipelines than oil. In other words, using natural gas would provide an alternative supply of fuels to satisfy our transportation needs. In addition, it also burns more cleanly than the traditional fuels, so its greater use would help reduce air pollution. Importantly, however, there is currently no natural gas storage in Arizona to provide reserves.
Arizona Energy Assurance Plan Annex 3 – Electrical Energy in Arizona
August 2017 A3-1
ANNEX 3 - ELECTRICAL ENERGY IN ARIZONA Electrical Energy Suppliers in Arizona Arizona has a well-developed and highly reliable Electrical Supply System, anchored by three major suppliers: Arizona Public Service, Salt River Project and Tucson Electric Power Company. In addition, 46 local municipalities and tribal utilities provide electricity to the public. The five largest major suppliers provide more than 90% of the electrical energy in Arizona.
The major causes of outages in Arizona are storms, forest fires and high wind in addition to occasional component failure. The power companies are well prepared to minimize the adverse effect of outages caused by natural disasters. The first response to a failure in the electrical system is by the local electrical energy supplier. The major suppliers have well developed and tested plans.
Interconnection with Neighboring Systems Interconnections of electrical power systems with high voltage transmission lines improve the system’s reliability significantly, because the neighboring systems can provide power in case of a generation shortage or multiple outages of transmission lines or generators. Large-scale interconnection of the electric systems began in the 1970s to allow assistance between utilities. The regulated interconnections permit the transfer of energy in normal operation and in case of an emergency, but blocks system oscillation and the cascading outages between interconnections.
The Arizona electric system resides in the Western Interconnection, which interconnects all utilities in the eleven western states, two Canadian provinces and the northern part of Baja of Mexico. Within the Western Interconnection, Arizona is interconnected to the utilities in neighboring states through high voltage transmission lines. These interconnections permit power transactions to occur amongst the interconnected parties and also allows for emergency assistance in case of a failure.
Continuity of Electric Service The larger utilities in Arizona are members of the of the Western Electricity Coordinating Council (WECC), which is one of the ten regional reliability councils that makes up the North American Electricity Reliability Corporation (NERC), the Reliability Organization selected by the Federal Energy Regulatory Commission to oversee the power grid.
The primary objective of NERC is to promulgate and enforce standards for the electric industry that will result in continuity of service of the electrical system. The goal is that an outage in one area of the electric system does not adversely affect the neighboring systems. Since the 2003 Northeast Blackout, NERC has reformatted its reliability standards and requires mandatory compliance with the standards from the member utilities. In Arizona, all transmission owners and operators must follow the NERC reliability standards and design their systems accordingly.
The ACC monitors the quality of the service provided by the regulated Arizona utilities. The regulated utilities report the frequency, duration and number of customers affected by every outage that result in significant loss of service to customers. Low quality of the provided service can result in an investigation by the ACC. The ACC, every two years, reviews both the transmission plans of the utilities (Biennial Transmission Assessment) and resource plans (beginning in 2012) of these utilities (Integrated Resource Plan) to determine adequacy of both

Arizona Energy Assurance Plan Annex 3 – Electrical Energy in Arizona
August 2017 A3-2
supply and transportation for electricity. These two documents contain supplementary information for the state Energy Assurance document. The Salt River Project (SRP), based in Phoenix, Arizona, is the third-largest public power utility in the United States; SRP is not regulated by the ACC, but does participate in the ACC biennial assessment. Each utility adheres to the same reliability standards to ensure continuity of the electrical system.
Generation, Transmission and Distribution The transmission system contains lines forming a network that interconnects the generation and loads. The generation consists of multiple power plants, which are connected to the network through transformers. Large coal and natural gas fired and nuclear power plants are interconnected by extra high voltage transmission lines. Smaller, mostly natural gas fired power plants are connected to the sub-transmission and transmission system. Renewable generation (wind and solar) is injected into the system at all levels including directly into the distribution system or sub-transmission network.
The loads are connected to the substations bus through circuit breakers and transformers. The circuit breakers protect the system against short circuit by switching off the line if the current is higher than a predetermined safe value. They also provide a means for isolating portions of the system for maintenance, etc. The transformers reduce or increase the voltage. Typically, the loads require lower voltages and because of the limited space in large towns, the building of extra high voltage transmission lines within a city is expensive and difficult. Generally, the extra high voltage lines are terminated at the outskirts of the town using an extra high voltage substation. High voltage and/or sub-transmission lines (in Arizona 34.5, 46, 69, 138 or 230 kV) distribute the power within the city. The lines are terminated in a distribution substation, where the voltage is further reduced. The distribution lines supply the industrial and residential loads. The residential loads are supplied by transformers connected to the distribution line. Each transformer reduces the voltage to 120V/240V and supplies 2-5 houses.
Generation The figure below shows the summer generation capacity mix in Arizona. The pie chart indicates that the major sources of energy are natural gas, coal and nuclear. Natural gas capacity shown here is due to a large number of smaller natural gas plants that are used for short periods of time, during peak load periods.

Arizona Energy Assurance Plan Annex 3 – Electrical Energy in Arizona
August 2017 A3-3
Source: U.S. Energy Information Administration, “Electric Power Industry Net Summer Capability" http://205.254.135.7/state/state-energy-profiles-data.cfm?sid=AZ#Reserves The next figure below shows a typical daily load curve and generation mix. The graph shows that base load power is generated by large nuclear and coal fired plants. These large power plants operate with practically constant load. After the shutdown of a unit in a nuclear power plant, 2-3 days is required to restart to 100% full power operation; similarly more than a day is needed to restart a large coal fired generator. The smaller units can start within a few hours and can supply variable loads.
The dependence on natural gas and coal makes the state vulnerable to a shortage of these commodities due to an interruption of coal transportation or gas pipeline failures.
Coal 23.6%
Hydroelectric 10.3%
Other Renewables 1.5%
Nuclear 14.9% Petroleum
0.4%
Natural Gas 49.3%
Electric Power Industry Generation by Primary Energy Source

Arizona Energy Assurance Plan Annex 3 – Electrical Energy in Arizona
August 2017 A3-4
Smaller coal fired power plants and large numbers of gas-fired power plants provided the energy needed during the load variation. In the morning, gas fired plants pick up the load. The older plants have gas-fired boilers and steam turbines, the newer plants are combined cycle units. The combined cycle plant contains a gas turbine, which drives the first generator. The hot exhaust gas of the gas turbine is used to produce steam, which drives the second generator. The combined cycle plants have significantly better efficiency than the other plants. The gas-fired power plants can be easily regulated and started after shutdown within half a day.
The short duration peak load is provided by gas turbines, which can be started within a half hour. The generated wind and solar power is fully used when they are available. The pumped storage plants also generate electricity during the peak hours and consume electricity during the nighttime.
Arizona has sixty-three (63) power plants with 225 generators. In 2008, according to the EIA 860 Annual Electric Generator Report, the total summer generation capacity was 25,861 MW. This summer capacity is divided between Arizona utilities, (19,717 MW or 76.24%) and independent power producers, and combined heat and power (6144 MW or 23.75%).
In 2008, Arizona generated 119 billion kWh; using 82 billion kWh with the remaining 37 billion kWh being exported. Of the total Arizona generation, 79% is from electric utilities and 21% is from independent power producers and combined heat and power.
It is noteworthy that some of the power plants owned by Arizona utilities are physically located in the nearby states (see Figure below). In particular, the large 2040 MW coal-fired Four Corners Power Plant operated by the Arizona Public Service Company (APS) is located in northwest New Mexico.
The Central Arizona Project (CAP), which delivers Colorado River water to Arizona customers, is the biggest user of electricity in the state—in 2008, CAP used 2.8 million MWh to deliver more than 1.6 million acre-feet of river water; and has a 24.3% entitlement to the output of the Navajo Generating Station.

Arizona Energy Assurance Plan Annex 3 – Electrical Energy in Arizona
August 2017 A3-5
APS operates the five-unit, 2040 MW Four Corners Power Plant, located on the Navajo Indian Reservation west of Farmington, New Mexico. APS is presently seeking approval from state and federal regulators to purchase Southern California Edison’s ownership in Units 4 and 5 of the Four Corners plant. If the transaction gains approval, then APS plans to close the plant’s older, less efficient Units 1, 2 and 3 (550 MW total). At that point, the Four Corners plant would have a generating capacity of 1490 MW, of which APS would own 940 MW.
Though natural gas units are relatively expensive to operate, they usually provide the primary frequency support in an event of rapid change in demand. The Table below lists the operating power plants, their location and capacity. This table can be used for the first assessment of the importance of a power plant outage based on the plant output.
System Vulnerability While the Arizona system is very robust, hazards and disruptions are a feature of any large, distributed supply system. Some of the most common scenarios for Arizona to experience a short term disruption or Grey Sky event are:
• Transportation accidents, forest fires, storms and high wind can cause simultaneous outages of major transmission lines that can produce a severe shortage of electricity. However, each part of the high voltage and extra high voltage electrical system can withstand at least a single contingency; consequently, the failure of one line or a substation will generally not cause customer outages.
• The simultaneous outage of the Palo Verde Nuclear Generating Station and a major transmission line that interconnects Arizona with the neighboring states could generate shortages of electricity, because the loss of interconnection prevents power purchase.
• Rupture or disabling of a natural gas pipeline supplying gas turbine generators. The interruption of natural gas supply produces shortages of electricity during the daily peak period. Arizona is particularly vulnerable during the summer months, when the loss of air-conditioning can endanger the public. During the winter, more than 50% of homes are heated with electricity and only around 40% with natural gas. The shortage of these basic commodities adversely affects both business and residential customers.
• The long-term curtailment or disabling of train service by terrorist act, flood or snowstorm in the Wyoming Powder River Basin endangers the operation of large coal fired power plants. Many rail lines are congested as the demand for coal increases. Shipping contracts for coal delivery are always being negotiated. If a labor problem was to occur, the trains could slow-down the delivery. Being alert to the sensitive coal delivery is very important. These plants keep 90 days of coal reserve. Consequently, only the long-term delay of train services produces electricity shortages.
• Because of redundancy, an individual terrorist act will most likely not paralyze the electricity supply in Arizona. The major danger is a concentrated cyber-attack against the utility communication systems. Most substations are controlled remotely by computers. Authorized operators can access the supervisory control and data
Arizona Energy Assurance Plan Annex 3 – Electrical Energy in Arizona
August 2017 A3-6
acquisition (SCADA) system remotely to perform switching as needed. Cyber terrorists or hackers may do switching of loads or status of power plants thus causing widespread outages. The vulnerability of the system increases by the conversion of the present electrical network for the smart grid, which depends on remote computer control for operation.
• Throughout Arizona, the high voltage and extra high voltage transmission lines are built in transmission line corridors, where the lines are separated only with a short distance. A terrorist attack against the congested corridor could produce a wide range of outages.
While not comprehensive, most of these scenarios are well within the ability of the energy infrastructure owners and operators to address, utilizing their own resources and sources of additional support. Beyond these types of events, a larger more regional long term outage, termed a Black Sky event, requires a more substantial planning effort and advanced levels of investment. Black Sky events in Arizona are covered in Annex 1 of this plan.

Arizona Energy Assurance Plan Annex 3 – Electrical Energy in Arizona
August 2017 A3-7
Name of Power Plant Type of Fuel No. of
Units County State MW Participating Utilities
Palo Verde Nuclear 3 Maricopa AZ 4209.3 APS-29.1%, SRP-17.5%, EL Paso-15.8%, SCE-15.8%, Public Service Co. of NM-10.2%, Southern CA Public Power Authority-5.9%, LADWP-5.7%
Gila River Power LP
Natural Gas CC
12 Maricopa AZ 2476 Gila River Power, L.P. owns and operates
Navajo Coal 3 Coconino AZ 2409.3 US Bureau of Reclamation-24.3%, SRP-21.7%, LADWP- 21.2%, APS-14%, Nevada Energy-11.3%,TEP-7.5%
Four Corners Coal 5 San Juan NM 2269.6 Units 1, 2 & 3-APS; Units 4 & 5, SCE-48%, APS-15%, P.S.C. of New Mexico- 13%, SRP-10%, TEP-7%, EL Paso Electric-7%
Springerville Coal 4 Apache AZ 1560 Units 1 & 2 by TEP; Unit 3 by Tri State Generation & Transmission; Unit 4 by SRP
Harquahala Generating Project
Natural Gas CC
6 Maricopa AZ 1346 New Harquahala Generating Project , LLC owns it
West Phoenix Natural Gas CC
7 Maricopa AZ 1326.3 APS-100%
Glen Canyon Dam
Hydro 8 Coconino AZ 1296 Owned by US Bureau of Reclamation. SRP receives 100 MW power (less in winter) through contract power purchases.
Craig Coal 3 Craig CO 1283 SRP- 29% each of Units 1 & 2 Mesquite Generating Station
Natural Gas CC
6 Maricopa AZ 1250 Mesquite Power LLC-100%
Santan Natural Gas CC
6 Maricopa AZ 1225 SRP-100%
Redhawk Natural Gas CC
2 Maricopa AZ 1136 APS-100%
Cholla Coal 4 Navajo AZ 1128.8 Units 1, 2 & 3 by APS; Unit 4 by PacifiCorp (PAC)
Hoover Dam Hydro 10 Mohave AZ 1039.4 US Bureau of Reclamation Coronado Coal 2 Apache AZ 821.8 SRP-100% Arlington Valley Energy
Natural Gas CC
3 Maricopa AZ 713 Duke Energy-100%
South Point Energy Center
Natural Gas CC
3 Mohave AZ 708 Calpine-100%
Apache Station Coal/Natural Gas CC
7 Cochise AZ 601.4 Arizona Electric Power Coop- 100%
PPL Griffith Energy Project
Natural Gas CC
2 Mohave AZ 654.4 Griffith Energy, LLC
Desert Basin Natural Gas CC
3 Pinal AZ 646.1 SRP-100%

Arizona Energy Assurance Plan Annex 3 – Electrical Energy in Arizona
August 2017 A3-8
Name of Power Plant Type of Fuel No. of
Units County State MW Participating Utilities
Agua Fria Natural Gas CC/Oil/Solar
7 Maricopa AZ 613.5 SRP-100%
Kyrene Natural Gas/Oil
7 Maricopa AZ 573.7 SRP-100%
H Wilson Sundt Generating Station
Coal/Natural Gas
6 Pima AZ 558.5 TEP-100%
Sundance Natural Gas 10 Pinal AZ 450 APS-100% Hayden Coal 2 Hayden CO 446 Unit 1, PSC-75.5%, PAC-
24.5%; Unit 2, SRP-50%, PSC-37.4%, PAC-12.6%
Saguaro Natural Gas 5 Pinal AZ 434.5 APS-100% Salton Sea Geothermal 10 Calipatria CA 340 Owned by CalEnergy
Generation, LLC. APS receives 10 MW through a purchase power agreement.
Ocotillo Natural Gas/Solar
7 Maricopa AZ 334 APS-100%
Yucca Natural Gas 6 Yuma AZ 264.5 APS Davis Dam Hydro 5 Mohave AZ 254.8 US Bureau of Reclamation
owns it. SRP purchases a part through contract purchase.
Horse Mesa Hydro 4 Maricopa AZ 129.5 SRP-100% Parker Hydro 4 Parker AZ 120 US Bureau of Reclamation
owns it. SRP purchases a part through contract purchase.
North Loop Natural Gas 4 Pima AZ 107.8 TEP High Lonesome Mesa Wind Energy
Wind 40 Torrance NM 100 APS receives all the power through power purchase agreement
Aragonne Mesa Wind Energy
Wind 90 Guadalupe NM 90 Owned by Arragone Wind, LLC. APS has a 20-year agreement to purchase all the power.
Demoss Petrie Natural Gas 1 Pima AZ 85 TEP-100% Abitibi Consolidated Snowflake
Coal 2 Navajo AZ 70.5 Abitibi Consolidated Sale Corp
Valencia Natural Gas/Oil
4 Santa Cruz AZ 65 UNS Electric Inc. owns and operates
Mormon Flat Hydro 2 Maricopa AZ 63.5 SRP Dry Lake Wind Power Project
Wind 30 Navajo AZ 63 SRP-100 %
Yuma Cogeneration Associates
Natural Gas 2 Yuma AZ 62.6 Yuma Cogeneration Associates
New Cornelia Branch
Natural Gas 7 Pima AZ 41.5 Phelps Dodge Mining Co
Waddell Hydro 1 Maricopa AZ 40 US Bureau of Reclamation Roosevelt Hydro 1 Maricopa AZ 36 SRP Crosscut Hydro 1 Maricopa AZ 33 SRP

Arizona Energy Assurance Plan Annex 3 – Electrical Energy in Arizona
August 2017 A3-9
Name of Power Plant Type of Fuel No. of
Units County State MW Participating Utilities
Snowflake Biomass Snowflake AZ 24 APS Yuma Axis Natural Gas 1 Yuma AZ 23.4 Imperial Irrigation District Douglas Natural Gas 1 Cochise AZ 21.4 APS-100% Headgate Rock Hydro 3 La Paz AZ 19.5 Owned by Colorado River
Indian Irrigation Project, Operated by US Bureau of Reclamation
Stewart Mountain
Hydro 1 Maricopa AZ 13 SRP-100%
Coolidge Dam Hydro 2 Gila AZ 10 San Carlos Project
Nuclear for Electricity Generation The largest power plant in Arizona and in the USA is the Palo Verde Generating Station (PVGS) with capacity of 4020 MWe net. Palo Verde was the only U.S. generating facility to ever produce more than 30-million megawatt-hours (six times) with Unit 1 being the top producer in the world in 2009 and Unit 2, the top producer in the world in 2010.
This nuclear station was completed in 1988 and provides electrical power for 4 million people. PVGS is a zero emission facility that occupies around 4000 acres. The plant is cooled by treated effluent, which is continuously recycled using cooling towers. The plant recycles 20 billion gallons of wastewater in each year.
Natural Gas for Electricity Generation Natural gas power plants are well distributed for electricity generation in Arizona. Though Arizona does not have natural gas production facilities, supplies of gas are transported through neighboring areas such as Wyoming, Colorado, New Mexico and Texas. Most of the natural gas plants are combined cycle (CC) units, which make these plants more efficient. Though natural gas plants are relatively more expensive to operate, they have a quick response time and thus are mostly used to meet peak demands, changing rapidly with time.
Coal for Electricity Generation Coal is the most abundant and secure fossil fuel in the United States. Nine out of every 10 tons of coal mined in the United States today is used to generate electricity, and more electricity is generated from coal than from any other resource.
In terms of supply, coal has a clear advantage. The United States has nearly 300 billion tons of recoverable coal, and it is widely distributed. In addition, coal is a versatile fuel. It can be used as a solid fuel or it can be converted to a gas to replace expensive imported fuels. Arizona has substantial, low-sulfur coal, located on Black Mesa in the northeast corner of the state. It is mined by Peabody Western, the nation's largest coal producer. The coal on Black Mesa is subbituminous with an average quality of 11,000 Btu, 0.5 percent sulfur, and 10 percent ash. The Kayenta Mine produces about eight million tons annually, all destined for the Navajo Generating Station near Page, Arizona.
Even larger reserves of coal are found in all the other “Four Corner” states, with the San Juan Basin of New Mexico being the most important for Arizona as it is the source of supply for several power plants in the state, including Cholla, Springerville, Coronado, Apache, and Sundt.
Arizona Energy Assurance Plan Annex 3 – Electrical Energy in Arizona
August 2017 A3-10
Other coal-fired power plants (notably Four Corners, near Farmington, NM) generate electricity for Arizona markets. When everything is included, the average generation in Arizona from coal is about 35.5 percent. This means that Arizona is importing substantial amount of coal fuel and coal-generated electricity from out of state, by contract. Additional amounts could be imported on an as-needed basis.
Arizona’s reliance on coal-fired power plants for a dominant portion of its electricity will continue into the foreseeable future for several reasons. First, coal provides base load electricity at a relatively low cost. Indeed, it is the large contribution of coal to the electrical demands of Arizona that helps keeping Arizona’s utility rates among the lowest in the nation.
The cost of using coal should continue to be even more competitive, compared with the rising cost of other fuels. In fact, generating electricity from coal is cheaper than the cost of producing electricity from natural gas. In the United States, 23 of the 25 electric power plants with the lowest operating costs are using coal. Inexpensive electricity, such as that generated by coal, means lower operating costs for businesses and for homeowners. This advantage can help increase coal's competitiveness in the marketplace.
Transmission The role of the transmission system is to interconnect the power plants and loads. The system contains transmission lines and substations. In Arizona, the transmission system divides into three networks: Extra High Voltage Network, High Voltage Network and Sub-transmission Network.
The Extra High Voltage Network (EHV) contains 500 kV and 345 kV transmission lines. This network interconnects large power plants and load centers in such a way that the loss of any of the EHV lines does not produce an outage. This is a looped network that can withstand double contingency. Also, the network provides interconnections with the neighboring states within the Western Interconnection.
The High Voltage Network operates 230 kV, 138 kV and 115 kV transmission lines, which serves load between cities and interconnects loads and smaller power plants inside the city. The High Voltage Network serving the Phoenix-Tucson area also has a looped network. Small power plants and gas turbines are also connected to the HV network.
The sub-transmission network distributes the electricity within local areas. This is typically a looped network within cities/towns that can withstand a single contingency. The loss of one line or substation does not produce customer outage. In rural areas, the sub-transmission system may be radial and can cause customer outages.
Distribution System The distribution system is a radial system with voltage levels less than 24 kV. In urban areas, both underground cables and overhead lines are used. The short lines (feeders) supply a large number of customers (30-80) and terminate at a substation or at main feeder. This permits the supply of the line from either end. Both ends of the line have a switch. In case of loss of the supply from one side, the customers are switched to the supply at the other side. The feeder operates as a radial circuit but can be supplied from two different sources.
In a rural system, long overhead lines with fewer customers are used. However, overhead lines being readily exposed to the environment are more vulnerable to disturbance by natural disasters

Arizona Energy Assurance Plan Annex 3 – Electrical Energy in Arizona
August 2017 A3-11
than underground cables. Multiple feeders are supplied by one transformer. Short circuit on the feeder or the loss of the transformer interrupts the service.
Approximately 80% of the load is in urban areas like the greater metropolitan Phoenix area and Tucson. These customers are served by the Arizona Public Service Company (APS), the Salt River Project (SRP), the City of Mesa, and Tucson Electric Power Company (TEP).
The remaining 20% of Arizona's electric customers live in rural areas, which include Native American lands, and smaller Arizona communities. The service providers are Arizona Public Service (APS); Unisource Energy Services (UES), US Bureau of Indian Affairs (BIA), Navajo Tribal Utilities Association (NTUA), San Carlos Irrigation Project (SCIP), numerous electric cooperatives, numerous Arizona electric districts and several small municipal utilities.
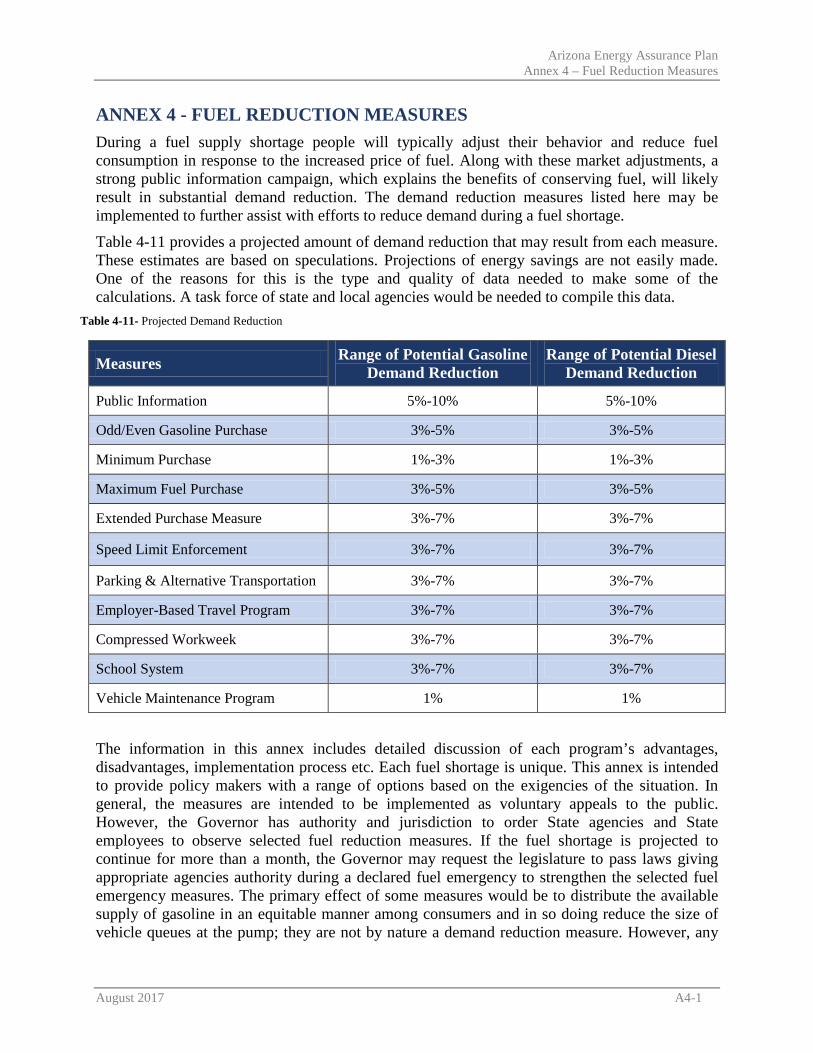
Arizona Energy Assurance Plan Annex 4 – Fuel Reduction Measures
August 2017 A4-1
ANNEX 4 - FUEL REDUCTION MEASURES During a fuel supply shortage people will typically adjust their behavior and reduce fuel consumption in response to the increased price of fuel. Along with these market adjustments, a strong public information campaign, which explains the benefits of conserving fuel, will likely result in substantial demand reduction. The demand reduction measures listed here may be implemented to further assist with efforts to reduce demand during a fuel shortage.
Table 4-11 provides a projected amount of demand reduction that may result from each measure. These estimates are based on speculations. Projections of energy savings are not easily made. One of the reasons for this is the type and quality of data needed to make some of the calculations. A task force of state and local agencies would be needed to compile this data.
Measures Range of Potential Gasoline Demand Reduction
Range of Potential Diesel Demand Reduction
Public Information 5%-10% 5%-10%
Odd/Even Gasoline Purchase 3%-5% 3%-5%
Minimum Purchase 1%-3% 1%-3%
Maximum Fuel Purchase 3%-5% 3%-5%
Extended Purchase Measure 3%-7% 3%-7%
Speed Limit Enforcement 3%-7% 3%-7%
Parking & Alternative Transportation 3%-7% 3%-7%
Employer-Based Travel Program 3%-7% 3%-7%
Compressed Workweek 3%-7% 3%-7%
School System 3%-7% 3%-7%
Vehicle Maintenance Program 1% 1%
The information in this annex includes detailed discussion of each program’s advantages, disadvantages, implementation process etc. Each fuel shortage is unique. This annex is intended to provide policy makers with a range of options based on the exigencies of the situation. In general, the measures are intended to be implemented as voluntary appeals to the public. However, the Governor has authority and jurisdiction to order State agencies and State employees to observe selected fuel reduction measures. If the fuel shortage is projected to continue for more than a month, the Governor may request the legislature to pass laws giving appropriate agencies authority during a declared fuel emergency to strengthen the selected fuel emergency measures. The primary effect of some measures would be to distribute the available supply of gasoline in an equitable manner among consumers and in so doing reduce the size of vehicle queues at the pump; they are not by nature a demand reduction measure. However, any
Table 4-11- Projected Demand Reduction

Arizona Energy Assurance Plan Annex 4 – Fuel Reduction Measures
August 2017 A4-2
restrictions on gasoline purchase tend to reduce the number of trips made for various purposes and possibly overall travel. Therefore these measures will likely cause a slight reduction in demand.
ODD/EVEN FUEL DISTRIBUTION MEASURE
Description In a moderate shortage situation, the need for a method to alleviate the long lines at retail service stations may arise. To avoid the hardship and inconvenience to the motoring public often associated with long lines at the pumps, and to assure the equitable distribution of gasoline to all potential users, the Governor, through an emergency declaration or executive order, implement an Odd/Even Distribution Measure. This demand reduction option would be strongly encouraged for State employees and issued as a voluntary appeal to the general public.
Purpose and Objectives This measure is designed to assist in the equitable allocation of gasoline to consumers. It may additionally encourage the conservation of fuel by causing trips to be better planned. Minimizing waiting lines may also reduce consumption by saving fuel that is used while idling.
Implementation Procedures This plan may include provisions whereby gasoline may be purchased or sold only in accordance with the following procedures:
• On odd/numbered days of the month, gasoline should only be sold to and purchased by the operator of a vehicle with a license plate labeled with an odd number as the last number. Most Arizona license plates end with three letters. License plates with ending letters of A - M may purchase fuel on odd days.
• On even-number days of the month, gasoline should only be sold to and purchased by the operator of a vehicle with a license plate labeled with an even number. License plates ending in ending letters with N – Z may refuel on even number days. Personalized license plates will follow ending letters of A - M on odd days and N - Z on even days. (Note: Personalized license plates ending in numbers will follow the schedule for license plate numbers.
• This plan should be implemented in concert with the Minimum Fuel Purchase Measure.
Exemptions Exemptions to the Odd/Even Measure may be made for the following vehicles:
• Vehicles used in agriculture. • Police, fire, ambulance, or other emergency vehicles. • Vehicles operated as common carriers or contract carriers. • Energy production and distribution vehicles. • Vehicles rented for less than thirty days. • Telecommunications vehicles. • Sanitation services vehicles. • Motorcycles and mopeds.
Arizona Energy Assurance Plan Annex 4 – Fuel Reduction Measures
August 2017 A4-3
• Funeral hearses and limousines. • Postal carriers. • Vehicles operated by or on behalf of the handicapped or disabled. • Vehicles used in authorized vanpools and carpools. • Such other vehicles as the GOEP may determine.
Requirements for Retail Gasoline Outlets Operators of retail gasoline sales outlets are encouraged to continue the sale of motor gasoline a prudent manner, while attempting to pace the sales so that the available fuel is not exhausted prior to the end of the month. Retail sales outlets in the same general area are encouraged to stagger the days or hours they will close. In order to minimize inconvenience to motorists caused by weekend closings, all retail having sales volume in excess of 100,000 gallons annually will be encouraged to participate in the following voluntary system for ensuring staggered hours of operation among stations located in the same area:
• Those retail service stations having a sales tax number ending in an even digit would remain open and pumping gasoline on Saturday.
• Those retail service stations having a sales tax number ending in an odd digit would remain open and pumping gasoline on Sunday.
• All participating stations would be asked to remain open and pumping gasoline for at least four hours on their respective day of weekend operation. However, no service station would be required to sell more than one-sixth of its weekly allocation. Service stations would be requested to post their days and hours of operation clearly and prominently. In addition, officials may encourage the adoption of a flag system to indicate availability of various services. A green flag would indicate selling of gas; the red flag would mean station closed, and the yellow flag would mean the gas station is open for service only.
Advantages and Disadvantages There are a number of advantages to using the Odd/Even Distribution Measure. An important advantage is that this measure helps to space purchases of gasoline and aids in its equitable distribution. The measure has the potential effect of shortening lines at gasoline retail outlets by cutting in half the number of customers that may attempt to get gasoline on any given day. As far as the public is concerned, this measure probably is the most familiar and the easiest to understand. The Odd/Even Distribution Measure may also provide a psychological benefit by reducing uncertainty regarding fuel availability.
The Odd/Even Measure combines minimum costs and easy implementation requirements. The expenses involved would be limited to the administration of exemptions and the dissemination information.
The major disadvantage to the Odd/Even Measures is that it does not directly save any calculable amount of gasoline; it is designed as a distribution aid and not a conservation measure. This measure would be difficult to enforce; the bulk of the enforcement responsibility rests with service station personnel. It is believed that service station personnel do not want to enforce this measure for fear that it might expose them to personal physical harm. Enforcement may also be

Arizona Energy Assurance Plan Annex 4 – Fuel Reduction Measures
August 2017 A4-4
difficult due to the large number of self-service and automatic gasoline pumps. These stations may find it hard determine if a customer is in compliance with the measure without changing their system of operation. The measure could potentially produce adverse psychological effects. There is the chance that it could increase the incidence of "tank-topping" and in this way complicate the shortage. The implementation of this measure may actually increase lines by having the public habitually purchase gasoline every other day.
A local problem may result where there is a high concentration of vehicles registered in other states. This would generally be limited to areas that contain major universities or military bases Out-of-state vehicles (except for those registered in contiguous states), although primarily driven in the local area or the state, would be exempt from the Odd/Even restrictions. This would give them an unfair advantage over other local consumers.
Estimated Energy Savings The primary effect of an Odd/Even measure would be to distribute the available supply of gasoline in an equable manner among consumers and in so doing reduce the size of vehicle queues at the pump; it is not by nature a fuel-conserving measure. The effects of the Odd /Even Measure on the economy of Arizona would be due in large part to the allocation action that would be served by the measure. Restrictions on time and amount of gasoline purchase tend to reduce the number of trips made for various purposes and possibly overall travel. Their effects on various sectors of the state's economy would be roughly in proportion to the importance of the trip contemplated, which is, in turn, dependent on the priorities individuals would assign to possible trip purposes.
Private Sector Costs The impact on the industrial, professional, and governmental sectors would be relatively minimal, with respect to both employment and productivity, and in the case of industry, the transport of goods. Travel to place of employment is generally considered a high-priority trip purpose. Therefore, the use of gasoline for work trips would likely take precedence over the use for other trip purposes. Impacts on the transport of goods would be small due to the fact that the measure makes allowances for commercial vehicles. It is not likely that the measure will appreciably affect the retail/commercial sector, since it contains no restrictions on the amount of fuel that could be purchased. Any impact on consumer purchases would probably be limited to a rearrangement or combination of trips, an act, which would not in any way affect actual sales.
The sector which would probably be most affected would be the recreation and tourism business. Relatively long travel distances and a relatively low priority ranking among consumers characterize recreational travel. The extent to which such travel would be affected is dependent on the perceptions of individual motorists regarding the availability of gasoline for a proposed trip. Uncertainty may compel a motorist to forgo pleasure travel rather than risk the possible inconveniences of long lines, frequent stops, or being unable to obtain gasoline in a particular area. On the other hand, if uncertainty could be reduced or eliminated in some manner, for example through a regulation requiring the staggering of operating hours of retail service stations, then the impact of the Odd/Even Measure on recreational travel would be minimal.
Implementation The Governor is empowered to declare an energy emergency (fuel shortage) and to effectively declare any emergency orders, rules and/or regulations as necessary. The affected retail facilities

Arizona Energy Assurance Plan Annex 4 – Fuel Reduction Measures
August 2017 A4-5
shall be notified that the measure is in effect. The retailers must be informed of all requirements and provisions set forth in the measure, including the guidelines for allocation by license plate number, as well as the plan for staggering weekend operating hours among stations in the same area on the basis of sales tax numbers. It should be reiterated that weekend operation on a staggered basis is to be recommended, but not required. The Arizona Petroleum Marketers Association (APMA) could assist in the above tasks.
Enforcement and Compliance Problems are likely to arise in the enforcement of the measure, one being the added burden that will be placed on law enforcement agencies. Enforcement may be requested as part of a declaration of emergency. If additional law enforcement personnel are hired to assume the added responsibility, this will be costly. These costs should be estimated and provisions made for allocating additional funds to local law enforcement agencies through a declaration of emergency.
MINIMUM FUEL PURCHASE REQUIREMENT
Purpose and Objectives The primary function of the minimum purchase requirement is to allocate the sale of gasoline and reduce or minimize gasoline lines by discouraging the making of frequent but small gasoline purchases by consumers.
Implementation Procedures In this measure, each motorist would be requested to purchase a specified minimum amount of gasoline per visit to a retail fuel sales facility.
Exemptions This measure may not apply to:
• Vehicles used in agriculture. • Police, fire, ambulance, and other emergency vehicles. • Vehicles operated as common carriers or contract carriers. • Energy production and distribution vehicles. • Van pool vehicles as designated by the exemption procedures. • Sanitation service vehicles. • Telecommunication vehicles. • Passenger transit or Para-transit vehicles (Para-transit Service for individuals with
disabilities that prevent them from riding the fixed route buses). • Vehicles rented for less than thirty days. • The filling of portable containers
In addition to the exemptions listed, vehicles used routinely and primarily in the conveyance of handicapped persons and vehicles determined to be essential to community wellbeing and health will be exempted from the plan. In addition to the exemptions listed, vehicles used routinely and primarily in the conveyance of handicapped persons, and vehicles determined to be essential to community well-being and health, may be exempted from the plan.
Stage of Implementation
Arizona Energy Assurance Plan Annex 4 – Fuel Reduction Measures
August 2017 A4-6
Minimum fuel purchase may be implemented during a Moderate or Severe shortage emergency. This conservation measure should be implemented in conjunction with the Odd/Even Distribution Measure.
Advantages and Disadvantages The primary advantage of the Minimum Purchase Measure is that of discouraging tank topping. Thus it is useful in reducing gasoline queues, preventing the additional consumption of gasoline that results from waiting in a queue. Another advantage of the Minimum Purchase Measure is its low cost and ease of implementation relative to odd-even conservation. One major disadvantage of the Minimum Purchase Measure is the difficulty of effectively enforcing the measure, especially at self-service facilities. Service station personnel are particularly likely to be unwilling to demand compliance from customers. Another negative aspect of the measure is that it places an inequitable burden on low-income drivers and drivers of vehicles having relatively small fuel tank capacities.
Estimated Energy Savings For the purpose of determining energy savings, the Minimum Fuel Purchase Measure will be combined with an Odd/Even Measure, which follows essentially the same format as the Odd/Even Measure being treated individually. There are two reasons for making this modification. First, the Minimum Purchase Measure itself simply does not save gasoline; it is intended as a means of reducing vehicle queues at the pump by discouraging the making of frequent but small gasoline purchases Therefore, it would be pointless to consider Minimum Fuel Purchase by itself from the standpoint of gasoline savings. The second reason for creating the composite measure is that while Minimum Purchase alone does not save fuel, and use of the Odd/Even Measure alone probably would yield at most only a minimal saving, the combined effect is not necessarily quantitative. Thus, it is necessary to consider the effect that implementing both approaches simultaneously would have on gasoline consumption.
Theoretically, a combined Minimum Purchase - Odd/Even Measure could produce a certain level of gasoline savings by making “tank-topping” difficult while at the same time restricting the amount of time during which gasoline purchases can be made. However, this same configuration could well result in an increase in consumption if, for example, the minimum purchase requirement caused motorists to engage in unnecessary driving so as to make room for the minimum purchase amount on a purchase day. Such action might arise if a good deal of necessary driving was anticipated for the following (non-purchase) day. Estimation of gasoline savings resulting specifically from a Minimum Purchase - Odd/Even Measure would be a highly subjective procedure, but the very nature of a Minimum Purchase – Odd/Even Measure sure precludes the use of a purely quantitative technique.
Private Sector Costs The effects of the combined Minimum Purchase and Odd/Even Measures on the economy of the state would be due in large part to the allocation function that would be served by the measure. Restrictions on time and amount of gasoline purchase tend to reduce, if not overall travel, the number of trips made for various purposes. Their effects on various sectors of the State’s economy would be roughly in proportion to the importance of the trip contemplated, which is, in turn, dependent on the priorities individuals would assign to possible trip purposes.

Arizona Energy Assurance Plan Annex 4 – Fuel Reduction Measures
August 2017 A4-7
The impact on the industrial, professional, and governmental sectors would be relatively minimal, with respect to both employment and productivity, and in the case of industry, the transport of goods. Travel to place of employment is generally considered a high-priority trip purpose; therefore, the use of gasoline for work trips would likely take precedence over its use for other trip purposes. Impacts on the transport of goods would be small due to the fact that the measure makes allowances for commercial vehicles.
Some impact on the retail and commercial sector could occur since discretionary travel, which includes shopping trips, is more flexible than home-to-work travel, and travel reductions could be more feasibly made in this category. Even so, the significance of this impact is questionable, as consumer response might simply be to rearrange or combine trips, rather than eliminate them outright. Probably some consumers affected would be those in which the consumer purchase decision was spontaneous or unplanned; such sales probably make up only a small percentage of total retail sales. The minimum purchase aspect of the measure could conceivably stimulate sales by encouraging motorists to make nonessential trips on gasoline purchase days for the purpose of reducing gasoline in the tank to a level, which would permit.
The sector which would probably be most affected would be the recreation and tourism business. A fair amount of travel within the state is for the pursuit of leisure or vacation activities. Relatively long travel distances and relatively low priority ranking among consumers characterize recreational travel. The extent to which such travel would be affected is dependent on the perceptions of individual motorists regarding the availability of gasoline for proposed trip. Uncertainty may compel a motorist to forgo pleasure travel rather than risk the possible inconveniences of long lines, frequent stops, or being unable to obtain gasoline in a particular area. On the other hand, if uncertainty could be reduced or eliminated in some manner, for example, through a regulation requiring the staggering of operating hours of retail service stations, then the impact of the Minimum Fuel Purchase - Odd/Even Measure on recreational travel would be minimal.
Implementation The responsibility for implementation of the Minimum Fuel Purchase Measure will be a process of an energy emergency declaration by the State of Arizona.
Upon declaration of an energy emergency by the Governor, the Governor, through an emergency declaration, may authorize the notification of all affected retail facilities that such a plan is in effect and inform them of all requirements and provisions set forth in the measures. This will include the smallest allowable minimum purchase amount that the retailer may set, as well as the action of staggering of weekend operating hours among stations in the same area, on the basis of sales tax numbers. It should be reiterated that weekend operation on a staggered basis is to be recommended, but not required.
MAXIMUM FUEL PURCHASE MEASURE PURPOSES AND DESCRIPTION
The Maximum Fuel Purchase Measure (MFPM) is intended as a means of ensuring that, in the event of a shortage of gasoline and/or diesel supplies, some gasoline will be available to all motorists located or traveling through the state. The rationale behind the measure is that limiting the amount of gasoline that one motorist can purchase during a particular visit can be expected to

Arizona Energy Assurance Plan Annex 4 – Fuel Reduction Measures
August 2017 A4-8
prevent the supply of gasoline allocated to a particular retailer from being exhausted prematurely.
Procedure Under the MFPM, each purchaser will be requested to purchase a certain maximum quantity of gasoline upon each visit to a service station. The maximum purchase quantity will be set, and may be set lower at the discretion of the retailer. Market forces may act in such a way to compel service station and other gasoline retailers to set maximum purchase limits on their own in the event of a gasoline/diesel shortage. It is suggested that the restriction be based on quantity of gasoline/diesel rather than purchase price in order to eliminate the need for continual revision of limits to reflect price increases. This measure is intended to be implemented on a voluntary basis.
Exemptions This measure shall not apply to:
• Vehicles used in agriculture. • Police, fire, ambulance, and other emergency vehicles. • Vehicles operated as common carriers or contract carriers. • Energy production and distribution vehicles. • Van pool vehicles as designated by the exemption procedures. • Sanitation service vehicles. • Telecommunication vehicles. • Passenger transit or Para-transit vehicles (Para-transit Service for individuals with
disabilities that prevent them from riding the fixed route buses). • Vehicles rented for less than thirty days.
In addition to the exemptions listed, vehicles used routinely and primarily in the conveyance of handicapped persons and vehicles determined to be essential to community well-being and health will be exempted from the plan.
Stage of Implementation Maximum Fuel Purchase should only be implemented under conditions of a moderate or severe shortage. A significant disadvantage of the measure is the difficulty involved in monitoring compliance and enforcement. Service station operators are likely to be unwilling to enforce the measure, and few if any law enforcement agencies have the staff or resources necessary to ensure a high rate of compliance.
Estimated Energy Savings For the purpose of considering possible energy savings, the MFPM will be combined with an Odd/Even Measure, which follows essentially the same form as the Odd/Even Measure being treated individually for this plan. There is a potential for gasoline savings inherent in a combined Maximum Purchase - Odd/Even Measure in that it would limit both the quantity of fuel that could be purchased and the amount of time during which a purchase could be made. However, skepticism and uncertainty on the part of the motorist regarding gasoline supplies and operating hours of individual stations may encourage tank-topping, particularly in cases where the motorist wants to be certain of having an adequate supply of fuel stored in the tank going into a non-purchase day.
Private Sector Costs

Arizona Energy Assurance Plan Annex 4 – Fuel Reduction Measures
August 2017 A4-9
The effects of the combined Maximum Purchase - Odd/Even Measure on the economy of Arizona would be due in large part to the distributive function that would be served by the measure. Restrictions on time and amount of gasoline purchase tend to reduce, if not overall travel, the number of trips made for various purposes. Their effects on various sectors of the state's economy would be roughly in proportion to the importance of the trip contemplated, which is in turn, dependent on the priorities individuals would assign to possible trip purposes.
The impact on the industrial, professional and governmental sectors would be relatively minimal, with respect to both employment and productivity, and in the case of industry, the transport of goods. Travel to place of employment is generally considered a high-priority trip purpose. Therefore, the use of gasoline for work trips would likely take precedence over its use for other trip purposes. Impacts on the transport of goods would be small due to the fact that the measure makes allowances for commercial vehicles.
The impact on the retail and commercial sectors could be expected to be slightly greater since travel in this instance is more of a discretionary nature. The actual extent to which sales would be affected is dependent on whether consumers choose simply to combine or rearrange trips or to eliminate them altogether under a Maximum Purchase - Odd/Even restriction. Even so, the only sales likely to be affected are that made to consumers whose decision to purchase is spontaneous or unplanned. Such sales probably make up only a small percentage of total retail sales.
The sector which would probably be most affected would be the recreation and tourism business. A fair amount of travel within the state is for the pursuit of leisure or vacation activities. Relatively long travel distances and relatively low priority ranking among consumers characterize recreational travel. The extent to which such travel would be affected is dependent on the perceptions of individual motorists regarding the availability of gasoline for a proposed trip. Uncertainty may compel a motorist to forgo pleasure travel rather than risk the possible inconveniences of long lines, frequent stops, or being unable to obtain gasoline in a particular area. In the case of a maximum purchase amount restriction, the prospect of having to make frequent stops on a long trip may be particularly influential on the motorist's decision. On the other hand, if uncertainty could be reduced or eliminated in some manner, for example through a regulation requiring the staggering of operating hours of the retail service stations, then the impact of the Maximum Purchase - Odd/Even Measure on recreational travel would be lessened.
EXTENDED PURCHASE MEASURE
Purpose and Objectives The Extended Purchase Measure (EPM) may be implemented to aid in the equitable distribution of motor fuels to consumers, to alleviate the long lines at retail service stations, or in the event that the Odd/Even Distribution Measure does not mitigate these conditions. Most likely, EPM will be implemented in a severe emergency as an extension of the Odd/Even Measure. In addition, it may encourage the conservation of fuel by exemplifying to consumers the severity of the situation.
This measure operates in many ways like the Odd/Even Measure in that it is designed to allow for the equitable allocation of motor fuels to consumers. With the implementation of EPM, motorists would be requested to make fuel purchases every fourth day based on the vehicle's license plate number.

Arizona Energy Assurance Plan Annex 4 – Fuel Reduction Measures
August 2017 A4-10
Implementation Procedures Under this plan, motor fuels may be purchased or sold only in accordance with the following procedure:
• On odd/numbered days of the month, gasoline should only be sold to and purchased by the operator of a vehicle bearing license plates of which the last number is odd. Most Arizona license plates end with three letters. License plates with ending letters of A - M may purchase fuel on odd days.
• On even-number days of the month, gasoline should only be sold to and purchased by the operator of a vehicle bearing Arizona license plates with license plates ending letters with N - Z. Personalized license plates will follow ending letters of A - M on odd days and N - Z on even days. (Note: Personalized license plates ending in numbers will follow the schedule for license plate numbers.
This plan should be implemented in accordance with the Minimum Fuel Purchase Measure.
Exemptions Exemptions to the EPM will be the same as those for the Odd/Even Measure. These include the following:
• Vehicles used in agriculture. • Police, fire, ambulance, or other emergency vehicles. • Vehicles operated as common carriers or contract carriers. • Energy production and distribution vehicles. Vehicles rented for less than thirty days. • Telecommunications vehicles. • Sanitation services vehicles. • Motorcycles and mopeds. • Funeral hearses and limousines. • Postal carriers. • Vehicles operated by or on behalf of the handicapped or disabled. • Vehicles used in authorized vanpools and carpools.
In addition, vehicles in Arizona that are licensed in contiguous states are not exempt from this measure. In the event this measure is implemented, the state should coordinate its efforts with other state energy offices to make them aware of the provisions of this measure since it would apply to contiguous states and cities vehicles coming into Arizona.
Requirements for Retail Motor fuels Outlets Operators of retail motor fuels sales outlets are encouraged to continue the sale of motor fuels in a prudent manner, while attempting to pace the sales so that the available fuel is not exhausted prior to the end of the month. Retail sales outlets in the same general area are encouraged to stagger the days or hours they will close.
In order to minimize inconvenience to motorists caused by weekend closings, all retail stations having sales volume in excess of 100,000 gallons annually will be encouraged to participate in the following voluntary system for ensuring staggered hours of operation among stations located in the same area. Retail service stations having a sales tax number ending in an even digit should

Arizona Energy Assurance Plan Annex 4 – Fuel Reduction Measures
August 2017 A4-11
remain open and pumping motor fuels on Saturday. Retail service stations having a sales tax number ending in an odd digit should remain open and pumping motor fuels on Sunday.
All participating stations would be asked to remain open and pumping motor fuels for at least four hours on their respective day of weekend operation. However, no service would be asked to sell more than one-sixth of its weekly allocation. Stations may be asked to post their days and hours of operation clearly and prominently.
SPEED LIMIT ENFORCEMENT MEASURE PURPOSE AND OBJECTIVES
The overall goal of the speed limit enforcement measure is to achieve maximum energy savings through increased compliance with existing speed limits and to make use of the conservation potential of further reductions in driving speeds by trucks, buses and autos. After the OPEC oil embargo of 1973-1974, the Congress enacted, in January 1974, the Emergency Highway Transportation Act (Public Law 93-239), which required each state to adopt and enforce a 55 mile-per-hour (MPH) speed limit law. States, which failed to enforce the law to achieve designated levels of compliance, faced the loss of funding for federal highway construction. As a result, all states adopted this 55 MPH speed limit during 1974-1975
After passage of the law by the states, average speed reductions across highway types were evidenced, particularly on the Interstate system. The average speed reductions led to corresponding savings in fuel. However, these fuel savings have been eroding somewhat over time, as average highway speeds have been gradually climbing (National & and Highway Traffic Safety Administration, 55 MPH Fact Book, 1978), although not to pre-embargo levels.
Thus, the idea behind this measure is to regain this source of energy savings by an increased level of enforcement activity to assure targeted levels of compliance. Most of the state and federal publications dealing with this issue have set the target at 70 percent compliance across all road types. Because of the extremely low probability of apprehension even with increased enforcement manpower, it is felt that the 70 percent goal is reasonable. Full compliance is probably not achievable, and the enforcement costs associated to achieve such a target would almost certainly render this degree of compliance non-cost-effective.
Implementation Procedures Operating Agencies If the decision is made to implement this Speed Limit Measure, either by the state or by the federal government, then Arizona is in a position to act positively and quickly. Because of the state's many miles of rural paved roads, the great majority of the 55 MPH enforcement responsibility would revert to the Arizona Department of Public Safety (DPS). Most of the necessary manpower would already be in place. Increased effort by local government police departments could also assist in the measure. Additional Considerations are:
• Increase enforcement of the speed limit laws • Impose no constraints on the DPS and local government police departments
insofar as use of the most modern enforcement tools or techniques is concerned.

Arizona Energy Assurance Plan Annex 4 – Fuel Reduction Measures
August 2017 A4-12
• Clarify or streamline state laws to allow for rapid and equitable prosecution of the increased number of violators that will likely arise. With court dockets already extremely burdened, this is no small issue.
Public Information and Education
Along with all of the above, it is imperative that the public be kept completely informed of the changes that are to take place, especially in regard to enforcement levels and techniques and any changes in the penalties associated with speed limit violation. However, it is hoped that the thrust of any public information and education (PI&E) campaign would focus on the seriousness of the fuel shortfall and what can be gained through compliance, rather than on the sanctions that will be imposed. As an example, the benefits of reducing motoring costs and reduced number of accidents should be cited. The DPS is well equipped to handle such a public information effort, since the DPS and ADOT all have components that engage regularly in this activity. In addition, these agencies regularly use a variety of media, such as television, radio, newspapers, billboards, etc., to carry their messages.
Exemptions This measure should be viewed as equitable, since it affects nearly everyone using the roadways in Arizona. Thus, individuals and businesses are treated alike. Those most adversely affected are the people who routinely travel long distances as function of their work, such as salesmen and truck drivers. Arizona and the nation have had considerable exposure to the 55 MPH speed limit law. It was in effect for several years without the granting of any exemptions Therefore, it would be unnecessary and indeed counter-productive to grant any exemptions as a result of an increased enforcement activity.
Advantage The law enforcement mechanism is already in place. Accidents will be reduced through lower speed limits.
Disadvantages Although the extent of reduction is difficult to predict, various projections indicate that the savings are not great. Considering the system costs necessary to increase speed limit enforcement, including the burden on both law enforcement and the court system to handle the increased citations and prosecution, it is questionable whether the overall effort would be cost effective. The public would likely be discontented with such an approach, unless a very effective public information campaign was instituted. Many would likely feel that more of their individual liberties were being infringed on. Transportation costs could increase to industries involved in cargo hauling (i.e., increased vehicle-miles). Drivers paid on the basis of vehicle-miles rather than hours of operation would be particularly affected. On the positive side, truck mileage figures would improve. Loss of productivity would result for those workers whose work requires large amounts of travel, since longer travel time to and from work sites would detract from regular productive time.
Estimated Energy Savings Projections of energy savings, whether for the Speed Limit Enforcement Measure or others, are not easily made. One of the reasons for this is the type and quality of data needed to make some

Arizona Energy Assurance Plan Annex 4 – Fuel Reduction Measures
August 2017 A4-13
of the calculations. Examples of needs include speed limit compliance data, the distribution of vehicle miles of travel (VMT) by road type and travel speed, the reduction in fuel demand resulting from full compliance, etc. A task force of state and local enforcement agencies would be needed to compile this data.
Private Sector Costs Impacts on Importing of Gasoline
Gasoline and diesel fuel used in Arizona comes from out of state refineries by truck or pipeline. Increased compliance with the 55 MPH speed limit could affect the amount of fuel imported in Arizona.
Impacts of the Measure on the State and Local Economy
• The Speed Limit Enforcement Measure could result in both positive and negative impacts to the State's overall economy.
• Moving toward targeted energy savings can certainly result in some beneficial changes. Savings cause less demand, and less demand could certainly lower the price at the pump as gasoline stations attempt to sell allocations. Lower gasoline prices should bring more purchasing power to the consumer, which can obviously be used in a variety of ways. One result might be an increase in sales of new automobiles, especially those that are energy-efficient. Highway safety effects related to increased 55 MPH compliance are hard to quantify accurately, in that many other interacting variables simultaneously
Social Impacts
• The Speed Limit Enforcement Measure is generally viewed as being equitable, in that all individuals and businesses are required to comply. However, the measure has a greater effect, both economically and socially, on those who routinely travel long distances in their jobs.
• There is probably some general annoyance associated with longer travel times. For example, more time spent driving means less time for leisure. Nonetheless, opinion polls have indicated public acceptance of the 55 MPH maximum speed limit.
PARKING AND ALTERNATIVE TRANSPORTATION MANAGEMENT MEASURES
Purpose and Objectives The Parking and Alternate Transportation Management Measure includes an intensified public information and training campaign to induce travelers to shift from low-occupancy vehicles to higher-occupancy vehicles such as car pools, van pools and to mass transit. The activities introduced in this measure are intended to complement the Employer-Based Travel Measure, but would be implemented at an earlier stage of a gasoline shortage. All employers are requested to institute a strategy which involves:
• increasing the cost of parking through increased rates. • replacing subsidized, low-cost or free parking provided by employers to their
employees with parking charges at prevailing commercial rates.

Arizona Energy Assurance Plan Annex 4 – Fuel Reduction Measures
August 2017 A4-14
• offering car and van pools reduced rates or preferential treatment. • allocating the most conveniently located spaces in employer-provided lots for
multiple-occupancy vehicles. • reducing availability of on-street parking .
Implementation Procedures The parking management and transit strategies are supportive efforts to increase the number of people using car and vanpools, implementation of increased parking rates and restrictions would closely parallel the Employer-Based Travel Measure.
Exemptions Because of the difficult task of enforcing employer-based rate increases, parking restrictions, and preferential parking in a large number of small firms, these measures may be considered applicable only to public and private organizations employing 100 or more people at one site, and to government employment locations with more than 50 people. Small firms may use parking facilities jointly; many provide no parking at all.
Several Arizona local governments are served by public transit. In these cities, public transportation is good and parking rates increases for single-occupant vehicles may increase transit rider-ship and car-pooling. Therefore, parking strategies combined with other energy conservation measures (ridesharing programs, transit service improvements) can result in a reduction in vehicle miles traveled greater than the sum of the individual measures.
Stages of Implementation Preferential parking for car and van pools, provided through prime location or reduced price, reinforces other ridesharing incentives. Therefore, it should continue to be encouraged during the pre-emergency stage where efforts to increase vehicle occupancy are underway. Intensified parking management should be implemented in a Moderate motor fuel shortage. Increased parking rates and restrictions on available parking may result in reduced sales by businesses.
Advantages and Disadvantages The primary advantage of the Parking and Alternative Transportation Management Measure is in its supportive action for other ridesharing incentives, resulting in increased ridesharing, increased transit rider ship, and gasoline savings in private motor vehicles. Other indirect benefits are modest improvements in traffic congestion, air quality, and traffic safety. Measures to restrict on-street parking can be particularly effective in improving peak-hour vehicle capacity and traffic flow patterns. Parking controls are relatively quick and easy to implement and to dismantle when the need for them diminishes. Their administrative mechanisms already exist and little or no hardware is needed.
However, the Parking and Alternative Transportation Management Measure may have little impact on transportation fuel usage when implemented without complementary car and vanpool programs. Efficient, alternative modes of transportation are needed to gain full benefit from the disincentive to single-occupant vehicle travel which parking controls provide. Another disadvantage may be that the choice of mode of travel to work is insensitive to measures, which make parking more expensive or inconvenient. Therefore, a more severe but long-term strategy of limiting the number of parking spaces may prove necessary.

Arizona Energy Assurance Plan Annex 4 – Fuel Reduction Measures
August 2017 A4-15
If parking restraints are severe, vehicle miles of travel (VMT) may be increased by workers riding to work with a family member who then drives home, returning to the work place at the end of the day for the trip home - thus doubling the number of daily round trips - or by an increased use of taxis. This behavior would consume more gasoline and create more air pollution than before
EMPLOYER-BASED TRAVEL MEASURES
Purpose and Objectives Potentially one of the most fruitful and desirable ways of reducing gas demand is by increasing average vehicle occupancy rates. In that way more travel (in terms of person-miles) can be accomplished with fewer vehicle-miles and therefore less fuel consumption. The appeal of this approach is in its great demand reduction potential, and its relatively painless nature.
The great demand reduction potential of this approach derives from the fact that current auto occupancy rates are very low (overall nationwide they are 1.7 persons per vehicle trip). These rates are particularly low for travel to work (average occupancy of 1.2 per auto), which is precisely when and where the physical and economic opportunities for ridesharing and alternative transportation are the greatest. Furthermore, commuter travel represents a very significant proportion of all gas consumption (estimated at over 30 percent of the total). By focusing on increasing the average vehicle occupancy of the work trip, therefore, it should be possible to obtain significant reductions in gasoline demand. The relatively painless nature of increased vehicle occupancy is its second favorable feature. Increased vehicle occupancy does involve significant changes in travel behavior because it calls for a change in the mode of some travel from single-occupant auto to shared-ride, public transit or Paratransit modes. However, this change in travel behavior involves minimal, if any, loss in mobility since travel itself (person trips) need not be reduced. It is this maintenance of mobility, with all the personal, social and economic benefits it entails, that makes increasing vehicle occupancy such an attractive demand reduction approach. This is not to say that there are not obstacles involved in changing occupancy rates, for any travel behavior change is difficult to achieve, especially on a permanent basis.
The Employer-Based Travel Measure would involve state and local government officials working with companies that employ large numbers of workers at individual sites in the state, with the objective of increasing vehicle occupancy rates and/or cases on the job as well. Employer-based plans could involve local transportation planners working formally with selected large employers.
Implementation Procedures The Employer-Based Travel Measure allows for a great deal of flexibility to affected employers. The measure's flexibility makes it a good candidate for implementation at any or all stages of fuel shortfall. Several Arizona local governments are operating a number of programs that would fall under the category of Employer-Based Travel Measures. These programs are being conducted on a voluntary basis in a non-shortage situation. These efforts should be continued and promoted. Other efforts to increase vehicle occupancy through employer-based actions on a voluntary basis should be encouraged by the city at this time. As the severity of the motor fuel

Arizona Energy Assurance Plan Annex 4 – Fuel Reduction Measures
August 2017 A4-16
shortage increases, the continued encouragement of the voluntary efforts will intensify. The general procedures for this measure are as follows:
Affected Organizations and Individuals
The Employer-Based Measure will apply to all employers operating with 50 or more persons employed at one site. Also subject to the measure will be all schools at post-secondary level (colleges, universities, and technical schools) with a total commuting student-faculty-staff population of 50 or more persons.
State, county, and municipal organizations may also be encouraged to participate in the plan, at all sites where 50 or more persons are employed. For this purpose, “employer" will be defined as any level of government (i.e., state or local) rather than the particular agency. Employees of one government level will be counted with the group with which they are listed for payroll purposes, even though they may be supported with grant funds from a higher government level. In addition, all smaller employers, private and public, will be requested to comply voluntarily with the measure to the maximum extent possible.
Plan Requirements Employers who are subject to the plan will be requested to develop for each applicable work site a program to reduce work-related travel by employees. In a severe shortage, the Governor’s Office may request employers affected by the measure to implement strategies according to the following formula:
• Large employers (50 or more employees at one site) would select a total of four strategies: either one strategy from Category I and three strategies from Category II; or, two from Category I and two from Category II.
• Mid-size employers (100 to 300 employees at one site, 50 to 300 for government employers) would select a total of 3 strategies: one from Category I, and two from Category II.
• Employers will be credited with travel reduction actions which they have undertaken prior to implementation of the measure and which meet the requirements of the measure (e g., an employer who already operates a car pool program will not be required to institute another Category I action).
With increasing severity of shortfall, the state officials may request affected employers to reduce employee travel to a target level at which not more than 50 percent of all employees at the work site commute alone. Also, when the shortage is Severe, affected employers may be required to:
• Designate and publicize an "internal transit/paratransit coordinator", in charge of establishing a central source of information on transit and paratransit services available to employees.
• Use internal communications media (e.g., newsletters and other internal electronic means) as a tool to keep employees informed of the employer's efforts in providing or promoting alternative travel means, and to assist in the organization of car pools, van pools, charter buses, and the like. Employer-based travel actions must be developed and implemented within 30 days of a decision by the Governor to implement the plan. Employer efforts must be sustained for the duration of the emergency. No formal reporting requirements will be included in the Employer-

Arizona Energy Assurance Plan Annex 4 – Fuel Reduction Measures
August 2017 A4-17
Based Travel Measure. Instead, employer compliance with the measure may be monitored through voluntary web-surveys.
The state, along with local government officials, will encourage greater use of mass transit facilities.
Stages of Implementation The Employer-Based Travel Measure can be implemented to varying degrees of a motor fuel shortage. In a mild level of motor fuel shortage, voluntary ridesharing and parking management programs should be continued and promoted.
Advantages and Disadvantages It is estimated that travel to from work accounts for over 30 percent of personal vehicular travel in the U.S. More significantly, although business trips represent a trip purpose which is very amenable to various forms of ridesharing, national average auto occupancy statistics show the lowest value for the work trips, 1.2 persons per vehicle, compared with 1.6 for shopping trips and 2.1 for social-recreational trips. Thus, increasing ridesharing will reduce demand without having a disruptive impact on the economy.
By focusing on work-related travel, the measure allows other kinds of travel to continue, thereby helping to maintain to ism, recreation, retail activities, and other key elements of the city's economy during a shortage. This represents a major economic benefit, which is the most important result of the Employer-Based Travel Measure. It does not impose direct costs, in the form of a loss, ultimately on consumers, as do measures, which mandate restrictions on individual travel. Largely because of this, the benefit-cost calculations performed for this sure show it to be among the most cost-effective of all the conservation measures considered.
Another advantage offered by this measure is the flexibility allowed, not only to the state, but also to the affected employers and ultimately to the commuters. The state has flexibility in implementing the measure either voluntarily or with various degrees of compulsory requirements. The employers have the opportunity to choose from a list of alternatives and mold a plan to fit there needs and capabilities. The commuters retain the ability to decide what mode of travel they will use to get to work in the event of a motor fuel shortfall. The plan also has an important symbolic value, and may stimulate long-term conservation behavior.
The Employer-Based Travel Measure can be implemented quickly depending on the scope and complexity of the measure an e amount of preplanning and preparation done. A period of at least four to six weeks would be required to get services operating to a point where results would be significant.
The Employer-Based Travel Measure represents an equitable means of enlisting the support and cooperation of those employers most in need of, and most capable of supporting, auxiliary transportation in an emergency. The large employers singled out by the measure may find voluntary implementation of the measure advantageous to their firms. Ridesharing efforts may reduce a potential loss of productivity that could result when employees are unable to get to work in motor fuel shortage.
Implementation Several Arizona local governments have ongoing programs similar to the requirements of the Employer-Based Travel Measure (i.e., ridesharing program and technical assistance for transit

Arizona Energy Assurance Plan Annex 4 – Fuel Reduction Measures
August 2017 A4-18
and parking management). Through intensification and expansion of these existing programs, the city is most capable for implementation of this measure. The following activities will be necessary to implement the Employer-Based 'Travel Measure:
• Prepare staff to operate, monitor, and enforce the plan. • Identify and notify affected employers of plan requirements. • Assist employers with plan development and implementation. • Conduct random site audits of employer work sites. • Institute hearings/appeals proceedings for adjudication of: (a.) Exemption requests by
employers and (b.) Citations of employers for noncompliance. • Evaluate the effectiveness of the measure.
Strategies for Employee Travel Reduction Category I:
A. Initiate a carpool program for employees, either in-house or through participation in a regional carpool program. Regardless of which approach is used, however, the program must be in full operation within 30 days after implementation of the requirement by the Governor.
B. Provide access at the employment site to some form of prepaid transit, where applicable, preferably through payroll deduction.
C. Sponsor an employee vanpool program involving at least one operating van (purchased or leased) per 200 employees; or demonstrate an equivalent Level of employee participation in a third-party vanpool program.
D. Any other strategy approved by the Governor as meeting the requirements of this category
Category II:
A. Adopt and enforce one parking management strategy from the following choices: (1) Reduction in employer-provided parking of 20 percent; (2) Preferential parking for high-occupancy vehicles in employer-provided
parking lots 20 percent of available spaces; (3) Another parking strategy approved by the Governor
B. Introduce one or more work schedule variation measures, involving at Least 20 percent of site employment from the following choices:
(1) Staggered work hours (in conjunction with I.B above, II.D or II.E below); (2) Flexible work hours (in conjunction with I.A or I.C above, II.C, II.F, or II.G
below; (3) Some combination of the above.
C. For employers with at least 20 company-owned vehicles, prohibit the use of those vehicles for single-occupant commuting and adopt a policy of allowing these vehicles to be used as employee carpool vehicles.
D. Provide one company-sponsored auxiliary transportation service (e.g., subscription bus or shuttle bus service); or participate in a consortium of two or more employers to provide such a service, according to city guidelines.
E. If at least 20 percent of all employees at the work site are using public transit to commute to work, subsidize at Least 10 percent of transit commuting costs.

Arizona Energy Assurance Plan Annex 4 – Fuel Reduction Measures
August 2017 A4-19
F. Sponsor an emergency work-at—home program involving at Least 5 percent of the total site employment.
G. Subsidize the employee vanpool program described in I.C. (above) to the degree that the cost per employee for participating in the van—pool is reduced by 10 percent.
H. Any other strategy approved by the Governor as meeting the requirements of this category.
The activities should be categorized into the shortages as follows:
Moderate Fuel Shortage
• Intensify existing efforts to provide information and assistance to local governments, large employers and private individuals interested in car-pooling, vanpooling and parking management.
• Compile a list of employers who will be affected by the compulsory implementation of the measure.
• Notify potentially affected employers that this measure may be implemented if the motor fuel supply situation deteriorates in order to prompt early planning.
• Compile a file of resources - local service, institutions and ongoing programs - which might facilitate or tie into employer efforts.
• Provide technical assistance to employers who may wish to develop plans in advance of compulsory requirements.
Severe Fuel Shortage
• Verify that administrative structure is in place and operating. • Notify employers of the requirements of the measure. • Provide technical assistance to employers in plan development and plan
implementation. • Conduct random site audits to determine compliance with the measure. • Institute hearing and appeal procedures for review of exemptions and warnings. • Compile and evaluate data on types of employer strategies selected and effectiveness
of strategies.
COMPRESSED WORKWEEK MEASURE
Purpose and Objectives The Compressed Workweek is a more stringent measure to be implemented only in the event of a Severe energy emergency. In such circumstances the compressed workweek could contribute significantly to energy savings. Work-hour policies include two possible changes in work schedules:
1. The workweek can be shortened by one day. 2. Flexible work-hour policies could be implemented.
The first measure will save fuel by reducing the number of work trips. The second measure will save fuel by stimulating wider use of mass transit facilities and by spreading out the peak period of travel. Spreading out peak-period travel reduces fuel consumption through smoother flowing traffic and increased car/van pool potential.
Changes in Work Patterns

Arizona Energy Assurance Plan Annex 4 – Fuel Reduction Measures
August 2017 A4-20
The use of flexible work hours for both short- and long-term demand reduction, improvement in fuel efficiency, and reduction in traffic congestion should be encouraged. Flexible hours can be instituted for ongoing cumulative transportation energy savings, or developed, held ready, and brought online quickly in the event of an energy shortage. This program allows employees to stagger their commute hours, while still working during core hours, usually from 10:00 am to 2:00 p.m. This program reduces peak hour congestion, improving fuel efficiency.
Arizona state agencies may be required to to have their employees reduce commute trips by greater use of ridesharing, mass transit and flexible work schedules.
Implementation Procedures Local governments and state government should lead in any program to conserve fuel. Under the Compressed Workweek Measure, with the exception of those exempt employers described in the next section, all will be required to reduce their workweek by one day. An end-of--weekday is preferable to a midweek day because of the expense of two start-up days per week. The term "compressed workweek" is used rather than "four-day-week" to emphasize that a shortened workweek could be established in some sectors and activities operating six or seven days a week. The closing day will be uniform to the extent practicable to make endorsement easier, since noncompliance would be more apparent, and to insure that all activities can continue on a reliable schedule.
All local agencies and companies will be encouraged to readjust schedules for the balance of the workweek to avoid reduction in production and employee income. The measure will leave to the discretion of each agency/company and its work force, however, whether and in what manner to make up the work time from the specified closing day. Many organizations have found it beneficial, for example, to adopt a workweek of four ten-hour days for reasons apart from energy conservation. Day-care centers serving the children of working parents should be encouraged or directed to adjust or extend their hours to conform to the compressed workweek. Under flexible work-hour policies, employers have the option of designating start and stop times. This measure will be particularly effective at employment centers well served by transit facilities.
Industries or Activities Exempt From the Measure
• The entire agricultural sector. • The energy-producing industries. • Part of the manufacturing sector, exempt because continuous industrial processes are
involved. • Electric utilities. • All of the public transportation, communications and utility services sector. • Part of the wholesale trade sector such as: groceries and related products; petroleum
and petroleum products). • Part of the retail trade sector: food stores; gasoline service stations; eating places;
drugstores; and fuel and service dealers).
Industries or Activities Covered by the Plan
• Remainder of the manufacturing sector. • The entire wholesale trade sector. • Remainder of the retail trade sector.

Arizona Energy Assurance Plan Annex 4 – Fuel Reduction Measures
August 2017 A4-21
• All have the finance, insurance and real estate sector. • Remainder of the services sector. • Remainder of the government sector.
It is understood that many specific cases will request exemption from the Compressed Workweek Measure.
Status in Other Areas and Agencies Reducing the workweek by one day would reduce gasoline consumption by reducing the number of commuting trips made. Minor reductions in space heating and cooling in affected establishments may also be achieved. It has been estimated that four percent of total gasoline consumption or 310,000 barrels a day would be saved nationwide.
Stages of Implementation The Compressed Workweek Measure is only appropriate for implementation in a moderately severe emergency, during which efforts will be made to persuade employees to experiment with a compressed workweek and flexible-work-hour policies, in order to save gasoline and forestall a more severe shortage. A compulsory Compressed Workweek Measure is a more drastic step and will be implemented only in the event of a severe emergency. Flextime should be tried first.
Advantages and Disadvantages Flextime: Many companies have experimented with flexible-work-hour schedules in the past. Usually, the programs have been well received. The advantages are as follows:
• Ease of application and acceptance by workers • More even peak-hour traffic flows, stimulating gasoline savings • Support for the measure from organized labor, unless the stagger is imposed • Increase in productivity because many workers choose to work during hours they are
more alert A major disadvantage is that decreased auto-highway congestion may make driving a more attractive alternative to more fuel-efficient modes.
Compressed Workweek: The compressed workweek would alter the daily routine of most of the population. Therefore, its impact in social terms is extensive. The advantages of a compressed workweek include the following:
• Rapid payoff in gasoline savings by reduced trips • Increased employee morale (already found in places where such measures have been
experimented with). • Easing of commuting problems. • Increased time to devote to home-related activities. • Possible decreases in heating and lighting, but also possibly offset by an equal increase in
home use. Disadvantages include the following considerations:
• Because the 5-day week is deeply ingrained, the adjustment process can be expected to be difficult, particularly if the changes are mandated.

Arizona Energy Assurance Plan Annex 4 – Fuel Reduction Measures
August 2017 A4-22
• Early experiments have indicated that the compressed workweek increases scheduling and communications difficulties and makes managers’ work more difficult; these have been some of the reasons why some firms have dropped the idea.
• Productivity may decline due to increased fatigue, and industrial accidents may be expected to increase for the same reason.
Changing work pattern may entail setup costs.
• The Compressed Work Week Measure could cause loss of income to some or all employees of the organizations due to closing was not made up in the balance of the week.
• A compressed or week initially may be disruptive to families. Coordinating the activities of various family members may prove difficult. Once adjustments are made, however, the additional day of leisure may benefit many families. A uniform closing day should minimize the disruption to families with children or working spouses.
• If a compressed workweek is promoted on a voluntary basis when supplies of motor fuel are less scarce, additional personal travel may result. However, under conditions calling for compulsory compressed workweek, motor fuel for such personal travel would be less available.
• This measure will be extremely difficult to enforce.
Acceptability Public acceptance of a government program may not be assumed. In fact it can be argued that a population faced with a serious crisis would prefer rather drastic corrective measures, even if the measures involved significant and immediate sacrifices or inconveniences, as long as it is convinced the measures will work. Public acceptance of the Compressed Workweek Measure as an emergency measure in the event of a national energy emergency could depend upon:
• The ability of the state to provide adequate and convincing information to the public. • The absence of conflicting information. • The public's trust in the government information and in the government efforts to ensure
the effects of the program would be as equitable as possible. • Organized labor generally does not support the 4-day, 40-hour workweek, but supports
the 4-day, 32-hour week as long as there would be accompanying reduction in productivity.
• Employers are least enthusiastic about alternative work schedules for fear of a decline in productivity and a rise in overhead costs. Thus, for the measure to succeed on a voluntary basis would require that substantial tax benefits or other economic incentives be offered. However, since the measure will not be implemented under normal conditions, reactions of employers could be considerably different than expected.
Estimated Energy Savings The estimated energy savings will require monitoring of the measure.
Private Sector Costs It is difficult to separate the effects of a compressed workweek from the corresponding economic developments likely to arise from the fuel shortage emergency itself. Employment may even increase slightly if a decrease in productivity results from the energy shortage and additional

Arizona Energy Assurance Plan Annex 4 – Fuel Reduction Measures
August 2017 A4-23
workers are needed to maintain output levels. It is unlikely that the retail sector will experience a decrease in demand. A study done on the effects of "blue Laws" on aggregate retail sales has shown the total weekly retail companies are not affected by Sunday closings. These results suggest that where patterns of consumption will change, overall demand will not decrease. An exception to this may be restaurants located in the downtown areas, where shortened lunch breaks and an additional day off for employees may decrease/business in establishments catering to lunchtime traffic. Costs to employees such measure might be as follows:
• Costs in child care arrangements for those exempt from the compressed workweek • Costs to workers who normally receive over-time or additional pay for working night
shifts. • Costs to individuals whose income depends on second jobs that would be reduced
because of longer working hours. • It has been suggested that productivity may decline when the workday is lengthened
resulting substantial costs employers. There may also be costs associated with the rescheduling of employees and materials. Although employers may incur costs in rescheduling their operations, these costs may be offset by increased employee morale resulting in reduced absenteeism and reduced turnover rates among their employees.
Local Government Responsibilities Each agency/company covered by the measure will be responsible for setting up a plan for day-to-day implementation of a compressed workweek, as well as coordination with other area employers and area transit authorities to promote flexible work hours.
Severe Fuel Shortage: Because of the legal issues involved, the potentially disruptive social and economic effects, and the need for careful consideration of equity issues, the planning phase of this measure is of the utmost necessity. A long-term fuel shortage of several months may require adoption of additional legal authorities through the legislative process.
State and/or local laws/ordinances concerning days of the week businesses may operate also must be examined.
Data Collection and Analysis Required for Evaluation In order to evaluate the effects of the measure, it may be necessary to obtain further cooperation from the affected employer employees.
It is hoped that flextime hours will reduce gasoline demand by stimulating greater use of mass transit and reducing peak-hour traffic congestion. To obtain data analyzing the effects of this measure, it may be necessary to survey employees on changes in their habits of getting to and from work and changes in their consumption of motor fuel.
It is hoped that a compressed workweek will decrease miles traveled weekly to work. It has been suggested that the additional free day will actually increase miles traveled. Therefore, employees may be surveyed not only on changes in their work miles traveled, but also on what was done in their free time. In addition, if employers express concern that a compressed workweek will decrease productivity and incur additional operation costs it must be considered. Therefore, employers also need to supply survey information. To carry out data collection, the city may surveys to be distributed to employers in the area. Employers could furnish the surveys to their employees. Although these methods will require further effort on the part of the employer, they

Arizona Energy Assurance Plan Annex 4 – Fuel Reduction Measures
August 2017 A4-24
are essential so the city can assess fairly the impacts and costs of implementing the measure. These efforts will also help in future fuel management planning.
SCHOOL SYSTEM CONSERVATION MEASURE
Purpose and Objectives The purpose of the School System Conservation Measure is to reduce the consumption of gasoline by reducing the number of trips made to and from school and/or by better planning school activities and transportation services. It also encourages students to ride to school only in car pools or other ridesharing modes of three persons or more.
General Procedures and Status of Current Programs A variety of modifications can be made in school schedules and activities depending on the extent of the motor fuel (diesel and gasoline) shortage. Today, most school districts are continuously assessing methods of reducing fuel costs. This annex is designed as a way to promote conservation activities in schools.
Transportation
• Training bus drivers in energy-efficient driving techniques. • Replacing fuel tank caps on school buses with locking caps. Optimizing school bus
scheduling and routing for fuel savings. • Discouraging students driving cars to school unless they are needed for vocational
activities.
Reducing Fuel Use for Special Events
• Measures to reduce fuel use by athletic officials include using the most efficient size vehicles for trips, conducting local school fuel saving clinics, promotion of carpooling among officials to local association meetings, assignment of officials from same area so that they can ride together and determining better meeting locations.
• Rescheduling of athletic events to reduce fuel used, including examining the possibility of reinstating the activity period and athletic practice during the school day. This would involve changing current athletic regulations restricting interscholastic school practices to after-school hours.
• Stress energy education in the schools. • In addition, this plan suggests the schools consider rescheduling of all after-school
activities, not only athletic events. • More drastic schedule changes, i.e. the four-day school week; will be implemented
only in a severe energy emergency and in conjunction with the compressed workweek. Education hours lost on the fifth day will be spread equally over the four days (with provisions made for additional exercise breaks during the school year), or, if it appears fuel shortages will be temporary, school schedules may be modified so that during the shortage, schools will operate an eight hour/four-day week, with lost time being made up during vacation periods.
Arizona Energy Assurance Plan Annex 4 – Fuel Reduction Measures
August 2017 A4-25
Stages of Implementation Local schools are encouraged to continue energy conservation planning. During a moderate shortage, at the discretion of the schools, many of the above suggestions will undoubtedly be implemented. During a severe shortage, students will be restricted from traveling to school in their own cars unless they can present reasons to the principal for doing so. Also, a compressed school week will be implemented, subject to the condition of prior or simultaneous implementation of a compressed workweek.
Advantages and Disadvantages The advantages of the School System Conservation Measure include the following:
• There would be a rapid payoff in terms of reduced consumption of fuel for school buses and transportation for school personnel.
• The measure is easy to implement and enforce. The disadvantages of the school schedule modification aspect of the measure include the following:
• Modification of school schedules could adversely affect learning. Longer school days could fatigue students and teachers, decreasing amount learned and increasing discipline problems.
Curriculum Changes
• Schools provide many services, such as meals for children from low-income families and training for handicapped children, which might be reduced by schedule modification.
• The economic impact on parents exempt from compressed workweek could be adverse. This includes lost work time and/or cost of childcare for working parents.
• Some high school students who work after school may have to give up their jobs if a longer school day was compulsory.
• Undoubtedly, most high school students who drive will protest not being allowed to drive their own vehicles to school.
• A longer school day in winter might necessitate some students leaving for and/or returning from school in the dark.
• Extracurricular activities would be disrupted by implementation of any of the variations of the measure. The impact of this loss needs to be evaluated.
• Restrictions on students driving to school may increase busloads to the extent that additional buses will have to be operated.
• The plan considers only fuel savings. Overall savings are uncertain and will depend on what students do with their free time.
Estimated Energy Savings The implementation of current suggestions could possibly reduce fuel consumption by 20 percent. The schools are encouraged to collect data and supply accurate estimate savings as they occur.
Shortening the school week and making up lost days during scheduled vacation periods would not achieve energy savings on a long-term basis. This measure could be used during a short-term energy emergency to shift energy consumption to a later period of the same school year.

Arizona Energy Assurance Plan Annex 4 – Fuel Reduction Measures
August 2017 A4-26
Gasoline consumption for students and employee travel during the reduced school week period would follow the pattern described below. National estimates have been made of savings of 37 KB/day of gasoline by closing the schools one day per week.
Private Sector Costs In assessing the private sector costs of a four-day school week and/or curtailment of after school activities, it is important to keep in mind that these measures will be implemented only in the event of a severe shortage (Level 3) and in conjunction with the compressed workweek. Therefore, private sector costs for a compressed school week will be less than might be expected.
The students will bear costs in the following ways: - Students may learn less because the school day is lengthened. This may also result in fatigue, especially among younger children. Going to school longer hours may result in students having to give up after school jobs. The impact on students from curtailing after-school activities will require more detail. Because the measure will be implemented with the compressed workweek, families should not be subject to severe adjustments. An exception will be those families whose members are exempt from the compressed workweek measures.

Arizona State Emergency Response and Recovery Plan Annex 5 – Priority End User
August 2017 A5-1
ANNEX 5 - PRIORITY END USER Energy assurance planning includes assisting priority end-users to develop strategies to ensure that they will receive a steady amount of fuel needed to maintain critical services. States may reduce or eliminate the need for reactive emergency actions by supporting and recommending proactive methods that reduce the risk associated with disruption or shortage of petroleum supplies. The methods noted in this section are:
• Contractual solutions to assure fuel supplies during a fuel shortage o By entering into contracts with local retail sites in advance, state and local
agencies can choose to utilize retail supplies preserving their own storage of fuel supplies
o Evaluate suppliers position in supply chain (spot-market vendor or direct supplier) o Firm contract language ensuring priority delivery using standard methods
• State-supported emergency reserve storage program o Utilize/Expand on existing storage capacity
o Investment in fuel storage that can provide an emergency reserve of gasoline and diesel fuel
• Fleet Management Options o Incorporating alternative fueled vehicles to critical services fleets
In the event of a shortage of petroleum products, the petroleum industry and the marketplace will take action to increase petroleum supplies before, during, and after the event. However, it is the responsibility of State and local officials to work with energy providers and stakeholders from other jurisdictions, government agencies, businesses, and related organizations, to ensure the wellbeing and progress of our communities. The objective is to ensure that critical service providers have the necessary fuels to maintain public order and safety. These services include but are not limited to health care, police and fire, sanitation, public transportation utility companies and aviation ground support. A significant goal for this effort is to increase the coordination and cooperation among all entities involved in the energy assurance planning process.
CONTRACTUAL SOLUTIONS
Retail Purchase Option Arrange contracts with local retailers in advance so purchases can be made with purchase orders/credit cards. This can provide priority-end users the option to fill up vehicles at nearby retail stations. During an actual or impending shortage this option extends access to supply rather than depleting their onsite reserves.
Direct Supplier Contracts Supply may be enhanced during a shortage by securing firm contracts with directly supplied vendors. Many large consumers, including public entities, have opted to reduce the cost of fuel through spot market-based contracts or by contracting for fuel from spot-market dependent
Arizona State Emergency Response and Recovery Plan Annex 5 – Priority End User
August 2017 A5-2
vendors. The energy assurance problem related to such purchases is that spot-market fuel availability diminishes rapidly during a shortage. As a fuel shortage affects refiners and primary suppliers, such entities will move to protect customers with firm contracts based on direct supply from the supplying company’s primary sources. This means essential public services, supplied by companies that purchase from the spot-market without a direct contract or through a vendor who acquires fuel in that manner, could see supply severely reduced or cut off.
Public entities with critical services relying on steady delivery of fuel should consider the costs and benefits of securing firm contracts with directly supplied vendors.
Priority Delivery Contracts Adjusting the terms of the contract that government agencies and critical services providers enter into with fuel suppliers is also a way to improve assurance of fuel delivery. Provisions can be added which call for the fuel supplier to maintain sufficient inventory as well as make delivery to the critical servicers a priority over all other customers. Procurement officials working for government and critical service providers should meet with petroleum companies and association representatives to:
• Discuss aspects of how critical service providers contract for liquid fuel
• Determine how state and local laws pertain to government agency procurement or may affect private sector procurement
• Develop a state-wide petroleum fuel contract template that can be used by public and private sector critical service providers
• Explore contractual arrangements with a Card –lock (retail) firm for a credit card type of purchase for critical service vehicles. Under this arrangement priority vehicles would have access to all retail sites and their inventory of transportation fuels which if used first could prolong the supply at ADOT and state owned fuel sites.
• Discuss benefits of a contractual arrangement with fuel transportation carriers for a dedicated number of trucks that would be in priority service to pick-up product at terminals and deliver it to critical service organizations. Typically, there is a premium cost associated with such arrangement.
The City of Chicago has included the following provisions in its gasoline and diesel fuel supply contracts:
Inventory Lead Time
The Contractor will maintain an Inventory of sufficient diversity and quantity to ensure the delivery of any Gasoline/Diesel listed in the Proposal, which is ordered by the City within 24 hours after receipt of a City department's order. In lieu of the inventory, the Contractor must be able to arrange such prompt delivery. Repeated failures of the Contractor to meet the above stated delivery requirement may be used by the City as grounds for the termination of this contract, and may further affect the Contractor’s eligibility for future contract awards.
Priority Service
Arizona State Emergency Response and Recovery Plan Annex 5 – Priority End User
August 2017 A5-3
Notwithstanding any other provision of this contract, except where expressly limited by applicable law or regulation, the City's orders for the purchase of E-l0 and E-85 Gasoline must take precedence over those of any other customer. In an emergency situation, or where Contractor’s supply of Gasoline/Diesel is low; Contractor must fill the City's order before filling the orders of any of its other customers. If the Contractor is aware that his supplies are running low, the Contractor must notify City immediately upon receipt of such knowledge and must allow the City the right to place an order before filing the orders of its other customers.
Exceptions
Any deviations from these specifications must be noted on the Proposal Page or pages attached thereto, with the exact nature of the change outlined in sufficient detail. The reason for which deviations were made should also follow if not self-explanatory. Failure of a bidder to comply with the terms of this paragraph may be cause for rejection.
The City reserves the right to disqualify bids which do not completely meet outlined specifications. The impact of exceptions to the specifications will be evaluated by the City In determining its need.
STATE-SUPPORTED STORAGE RESERVE PROGRAMS
Utilize/Expand on Existing Storage Capacity ADOT and many other agencies and jurisdictions have bulk fuel storage locations which are used to refuel fleets. Where government-owned storage exists, it may be possible to increase utilization of storage capacity or add additional storage. The state may wish to explore expanding bulk storage at such locations. Here are some suggestions related to storage expansion:
• Meet and coordinate with state and local agencies that already have storage to determine existing volumes and protocols and explain the need for expansion.
• Determine the potential volumes that might be needed for critical end users during a shortage.
• Relate potential expansion (i.e., size or volume of new tanks) to existing agency and potential priority user requirements.
• Determine current usage per day for all vehicles that are normally fueled from this fuel storage location, and the subset that are priority vehicles essential for public safety under normal operations.
Maintain a Reserve in Tank Farm System This would rest largely on utilizing unused storage capacity in the existing tank farms. According to the 2009 ADWM Transportation Fuels report, Arizona tank farms typically operate at significantly less than 100% capacity. Under this proposal, the state would acquire and maintain for emergencies a portion of the excess capacity in the tank farms. No new tanks would be required. The State (or any other entity such as a city or utility company) would need to negotiate an agreement with the tank farm and tank owners to make arrangements for a stockpile of fuel. There is enough capacity for this option to be effective. An additional part of this plan must include a truck based fuel delivery service committed to priority end users facilities during a shortage.

Arizona State Emergency Response and Recovery Plan Annex 5 – Priority End User
August 2017 A5-4
FLEET MANAGEMENT
Incorporating Alternative Fueled Vehicles Incorporating alternative fueled vehicles into critical service organization fleets will diversify transportation fuel sources. Alternate fuel vehicles can provide greater resiliency to endure a fuel shortage. Some of these alternative fuel vehicles include flexible fueled vehicles which can use gasoline with ethanol concentrations ranging up to 85 percent (E-85), Compressed Natural Gas (CNG) and propane fueled vehicles that can use CNG or propane, and hybrid electric, plug-in hybrid and all electric vehicles.

Arizona Energy Assurance Plan Annex 6 – Arizona Fuel System Vulnerabilities and Disruption Consequences
August 2017 A6-1
ANNEX 6 - ARIZONA FUEL SYSTEM VULNERABILITIES AND DISRUPTION CONSEQUENCES Arizona consumes well over 3 billion gallons of gasoline and diesel fuel each year. All of this fuel is imported. The state has no natural petroleum reserves, no production, no refineries, and no ports. In short, it is completely dependent upon the consistent operation of pipelines, trucks, and railroads to meet the demands of its citizens.
Such limited means of supply, especially in light of growing gross and per-capita demand, renders those who live here more vulnerable to many types of supply interruptions than they would be if they lived in many other parts of the country. Such interruptions conceivably could result from accidents, natural disasters, work stoppages, or sabotage anywhere in the supply chain. The present report addresses these vulnerabilities in terms of demand, supply, reserves, disruption causes, consequences, and responses.3
Statewide Demand Arizona, by the end of 2011, was using approximately 9 million gallons per day of fuel. Of this total, approximately 2 million gallons are of diesel grade and 7 million gal/day of gasoline (Figs 1-3). This demand varies by season, and metropolitan Phoenix and Tucson together account for a bit over 75% of the demand. Arizona Cleaner Burning Gasoline (CBG)4 accounts for about 60% of the state’s demand. After a drop in demand during the recent recession, it is rising again. As economic activity rebounds it—along with an increase in population—is expected drive up demand. Eventually, however, the per capita fuel consumption should start to drop, as more efficient vehicles become more common and higher federal mileage requirements take effect.
State Agency Demand State agency consumption–that is, the portion of demand that would fall under the direct authority of the Governor – is approximately 7,400 gallons of diesel per day and 5,000 gallons of gasoline per day. This is a relatively small amount in the scheme of things. ADOT, the agency that manages fuel service facilities throughout the state, indicates that most of this gasoline is supplied to DPS, while much of the diesel is used for large construction vehicles and equipment. A small portion of fuel may occasionally be sold to local agencies; however, local municipalities typically obtain their fuel elsewhere.
3 Supporting details are available in Arizona Department of Weights and Measure Transportation Fuels Report for 2009. 2010; and the latest assurance plan submitted to GOEP. 4 Maricopa County and portions of Pinal and Yavapai) requires CBG year round. The western portion of Pinal County requires CBG May 1 – Sept 30 of each year. Tucson requires 1.8% by weight oxygenate from Sept 30 to March 31 each year.
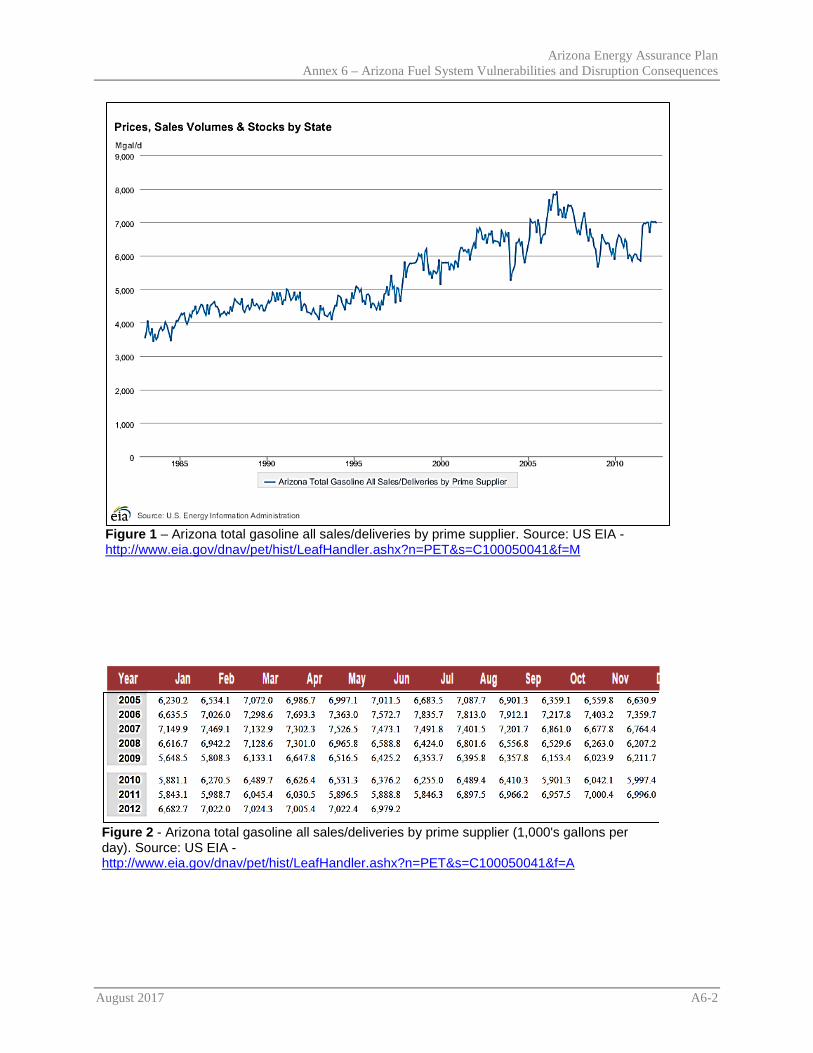
Arizona Energy Assurance Plan Annex 6 – Arizona Fuel System Vulnerabilities and Disruption Consequences
August 2017 A6-2
Figure 1 – Arizona total gasoline all sales/deliveries by prime supplier. Source: US EIA -http://www.eia.gov/dnav/pet/hist/LeafHandler.ashx?n=PET&s=C100050041&f=M
Figure 2 - Arizona total gasoline all sales/deliveries by prime supplier (1,000's gallons per day). Source: US EIA - http://www.eia.gov/dnav/pet/hist/LeafHandler.ashx?n=PET&s=C100050041&f=A

Arizona Energy Assurance Plan Annex 6 – Arizona Fuel System Vulnerabilities and Disruption Consequences
August 2017 A6-3
Demand for Alternative Fuels Although petroleum products currently make up a large majority of transportation fuel demand, the demand for alternative fueled vehicles (AFV) has been, and will likely continue, rising (Figure 3). Natural gas continues to be the most common alternative transportation fuel used. LNG (Liquefied Natural Gas) and CNG (Compressed Natural Gas) account for about half of all alternative fuels used5. Other common alternative fuels include LPG (Liquid Propane Gas), E-85 (ethanol), biodiesel and electricity. Diversification of transportation fuels can increase options and thus improve overall transportation fuel assurance; however, as we become more dependent on these alternative fuels, we must broaden the scope of fuel assurance planning to include assessment of other vulnerabilities and consequences. For example, many large fleets such as transit buses and sanitation trucks have switched to LNG and CNG. A disruption within this alternative fuel system could render these services without fuel and could create a crisis within those specific service sectors.
5 http://www.eia.gov/renewable/afv/
Figure 3-Estimates of (AFV) in Arizona and fuel consumption in gasoline-equivalent gallons (geg). http://www.eia.gov/renewable/afv/users.cfm?fs=a&uyear=2010%2c2009%2c2008%2c2007%2c2006%2c2005%2c2004%2c2003&ustate=az
Arizona Energy Assurance Plan Annex 6 – Arizona Fuel System Vulnerabilities and Disruption Consequences
August 2017 A6-4
Supply and Delivery All told, the supply and distribution of liquid products in Arizona involves hundreds of miles of pipelines, major tank farms in Phoenix and Tucson, hundreds of delivery trucks and thousands of retail stations. Arizona currently has no significant oil production and no oil refineries. Delivery relies on a supply chain involving five oil industry sectors: 1) refineries, 2) pipelines, 3) terminals/tank farms, 4) transport trucks, and 5) retail stations.
A limited number of refineries produce the particular gasoline formula, known as Arizona Cleaner Burning Gasoline (CBG), which the federal government requires to help ensure that the air quality in Phoenix stays within healthful levels. Most of these refineries are located in southern California, western Texas and New Mexico.
As reported in the Transportation Fuels Report for 2009 (Arizona Department of Weights and Measures, 2010), 91% of transportation fuels entering the State are delivered through two pipelines owned and operated by Kinder Morgan Energy Partners. A small amount still enters the state by rail car deliveries, and some product is brought in from New Mexico, Nevada and California by truck.
The “West Line”, originating in Los Angeles, CA, is a 20-inch line with an operating capacity of 200KBD (thousand barrels per day). Products enter the west line in Watson, CA. where it goes to breakout tankage in Colton, CA. The product then moves toward Phoenix. There is another segment of the pipeline that will move fuel products into Imperial, CA, and into Yuma for military jet fuel.
The second set of pipelines, the “East Line” originates in El Paso, TX, and consists of two lines, a line delivering fuel to storage in Tucson, and a line bringing fuel products into the Phoenix area. The 12-inch line to Tucson has a rated capacity of 60KBD. The second line is a combined 16-inch and a 12-inch line delivering products into Phoenix with a capacity of 140KBD. It starts as a 16-inch line in El Paso TX, and is reduced to a 12-inch line along the way.
Over the last four years the East Line serving Phoenix went through a several improvements and expansions. Phase I expansion was completed in July, 2006. New breakout tankage was constructed in El Paso TX., along with an increase in capacity. In Phase II pumping capacity was increased and brought on line in December 2007. The two-phase expansion of the East Line increased its total rated capacities to 200KBD per day, 60 KBD capacity for the Tucson line and 140KBD to the Phoenix line.
An important element of the Arizona transportation fuels picture is the section delivering product from Gulf Coast to the Magellan Terminal in El Paso, TX. These pipelines are owned and operated by Magellan Pipeline Company, L.P. (Magellan). Magellan reversed the eastern Longhorn Pipeline in 2012 which previously transported refined petroleum products from east to west (Houston to El Paso). Now the segment of the Longhorn Pipeline from Crane, Texas to Houston, Texas delivers crude oil from west to east (Crane to Houston). The refined products now enter the Longhorn Pipeline via an existing pipeline segment that connects the Longhorn Pipeline to the existing Orion West Pipeline located to the north of the Longhorn Pipeline. The Orion West Pipeline runs from Frost, Texas to El Paso and is also owned and operated by Magellan. The western portion still carries refined products, delivering up to 75 KBD to El Paso. From El Paso, fuel can be placed on the Kinder Morgan east pipeline and delivered to Phoenix and Tucson.

Arizona Energy Assurance Plan Annex 6 – Arizona Fuel System Vulnerabilities and Disruption Consequences
August 2017 A6-5
Based on Kinder Morgan data, in 2011 the east line delivered 56% on average of all types of transportation fuels into Arizona, while the west line delivered 44%. The east line delivered approximately 71% of all gasoline and 29% came off the west line, showing a significant imbalance. The trend of increased gasoline supply coming from the east line appears to have continued from 2009 (Figs 4 and 5). Refineries supplying the East Line have lower crude oil feedstock costs than refineries in California which results in lower cost fuel supplies from the east.
Figure 4 – All gasoline products by pipeline. Source: Arizona Department of Weights and Measures, Transportation Fuels Report for 2009. (2010)
Ethanol is a critical component of the Arizona fuel supply system6. It is a necessary additive to the gasoline to meet air quality and renewable fuel standards. Ethanol is delivered to Arizona by railway. The federal Renewable Fuel Standard (RFS) is, effectively, a mandate to blend ethanol into gasoline at a 10% level. Ethanol is blended with “blendstock” often referred to as Blendstock for Oxygenate Blending (BOB), or in the case of the AZCBG market—AZBOB.
Pipeline operators deliver products to the terminals on a nominal seven day cycle. During this cycle the pipeline will generally deliver gasoline batches (Premium and Regular grades, Conventional and CBG types) followed by ULSD followed by gasoline and then followed by jet fuel. Military jet and diesel is also delivered by the pipeline. The products are shipped from their origin in batches. For example, the pipeline may pump a batch of Regular Conventional gasoline followed by Regular AZBOB followed by Premium AZBOB followed by Premium Conventional followed by Ultra Low Sulfur Diesel followed by AZBOB followed by civilian jet fuel followed by military jet fuel, all over a seven day cycle. The cycles on the East Line are not synchronized with the West Line cycle.
Transportation fuel transport trucks are the workhorses of the Arizona gasoline distribution system, delivering gasoline to retail stations every day, around the clock. Loading racks at the terminals are used to fill tanker trucks with gasoline and other transportation fuels. A typical tanker truck carries 7,500-8,000 gallons of transportation fuel per load. Most transport truck tanks are divided into several compartments to segregate the different fuels being loaded. Trucks
6 Ethanol is a renewable fuel made from various plant materials collectively known as "biomass. In the U.S., grain and corn crops from the Midwest are a major source of the biomass used to produce ethanol. http://www.afdc.energy.gov/fuels/ethanol_fuel_basics.html

Arizona Energy Assurance Plan Annex 6 – Arizona Fuel System Vulnerabilities and Disruption Consequences
August 2017 A6-6
configured for retail station deliveries may carry two or three grades of gasoline (87, 89, and 91), as well as diesel fuel, depending on the customer.
Smaller fuel delivery trucks (bobtails) are capable of delivery to construction sites, emergency generator fuel tanks, and refueling fleets at night. Most of these trucks have hose reels and special pumps to fill tanks in a hurry. Most fuel transport trucks have a built-in power take off (PTO) to remove fuel from underground tanks and pump off to above ground tanks. This feature can be used in an emergency power outage to refuel the bobtails with transportation fuel for critical service providers.
The diesel fuel picture, which has special significance for Arizona’s truckers and heavy equipment operators, displays the benefits of a better balance between the east line and the west line. Ultra Low Sulfur fuel (“ULSD”) has become the primary fuel for the trucking industry due to EPA mandates. Diesel fuel with sulfur concentrations exceeding the ULSD requirements can only be used in locomotive and marine fueling systems. About 56% of Arizona’s ULSD came from the east line, while the west line delivered 44%. This relative balance makes ULSD less sensitive to supply disruptions, according to the Arizona Department of Weights and Measures in their 2010 report. ADWM also reports that federal efforts to encourage the use of renewable fuel are having an effect by diversifying supply, as seen in the development of a biofuels delivery infrastructure in the state. This will also impact demand for traditional transportation fuels.
Figure 5 - Source: Kinder Morgan Energy Partners Pipeline Data as reproduced in Arizona Department of Weights and Measure Transportation Fuels Report for 2009. 2010
Completed early in 2012, the UNEV pipeline has the potential to aid in the energy assurance initiatives for Arizona. UNEV is a 400-mile, 12-inch buried, common-carrier-products pipeline that originates near the refineries in North Salt Lake City and moves product from there to a distribution terminal in Iron County, Utah, and a terminal in Las Vegas. The pipeline carries approximately 62,000 barrels per day of petroleum products and may be expanded to a capacity to run 118,000 barrels per day. The tanks at the terminal for the pipeline can hold approximately 330 KB. The terminal will be the distribution mechanism that allows product to be delivered to the end-users and retail outlets in Southern Nevada. Holly Corporation owns 75 percent interest and Sinclair owns 25 percent interest. As the majority shareholder, Holly is the operator of the pipeline.

Arizona Energy Assurance Plan Annex 6 – Arizona Fuel System Vulnerabilities and Disruption Consequences
August 2017 A6-7
The transportation fuel supply chain includes more than gasoline, jet fuel, diesel, and ethanol. Today’s transport is also fueled by Liquefied Natural Gas, Compressed Natural Gas, propane, and biodiesel. The supply chain of these products has not been studied in this report.
Reserves Arizona’s fuel reserves are concentrated in the state’s two large tank farms, one in Phoenix and the other in Tucson. There are some smaller terminal storage facilities spread throughout the state. Apart from these reserves, additional capacity is scattered throughout the state in the storage tanks of the 2080 retail outlets. According to the Arizona Department of Weights and Measures (2010), their total capacity was roughly 1.4 million barrels of retail gasoline in 2008 and about 1.6 million barrels in 2009, an increase of 9.2%.
Table 3 - Total reserve capacity are summarized in the following table. Source: AZ Department Weights and Measures.
Product Terminal Storage
Capacity- Phoenix
(KB)
Terminal Storage
Capacity- Tucson (KB)
Terminal Storage
Capacity- Total (KB)
Statewide Retail
Station Capacity
(KB)
Total Storage Capacity
Statewide (KB)
CBG* 923.4 0 923.4 705.5 1628.9 Conventional 283.9 398 738.4 618.7 1357.1
Diesel** 630.5 192.5 877.1 221.1 1098.2 * Includes retail storage in Maricopa County (does not include any for Pinal or Yavapai) **Includes LSD and ULSD Terminal storage in Arizona has a total safe-fill storage capacity of about three million barrels of transportation fuels. This includes:
• 923.4 KB dedicated to CBG • 738.4 KB to Conventional Gasoline • 877.1 KB to Diesel, both LSD and ULSD.
Total; 2,539 KB
Not all capacity is necessarily used. For example, in 2009 the average daily inventories were:
• 419 KB for CBG. • 278.7 KB for conventional gasoline. • 78.2 KB for diesel.
Total: 776 KB
Table 2 - Percentages of total capacity being used are summarized in the following table. Source: AZ Department Weights and Measures.
Product Average Daily Terminal
Inventories (KB)
Terminal Storage Capacity- Total
(KB)
Terminal Storage Capacity
Utilization %
CBG 419.0 923.4 45%

Arizona Energy Assurance Plan Annex 6 – Arizona Fuel System Vulnerabilities and Disruption Consequences
August 2017 A6-8
Conventional 278.7 738.4 38% Diesel** 78.2 877.1 9%
**Includes LSD and ULSD In other words, the tank farms have reserve capacity to store nearly twice as much CBG and nearly three times the conventional gasoline than is stored on average. An increase in the use of existing capacity could provide an additional cushion in case of a supply interruption.
Disruption Causes Interruptions have many causes and various degrees of severity. The total cost of mitigating and preventing all interruptions, including the most unlikely is prohibitive. This is true for most hazards that we face in life including driving. It is reasonable, however, for emergency planners to consider all threats to transportation fuel supply, and prepare for as many as the public will support.
Disruption of transportation fuels can occur due to various interruption incidents within the supply and delivery system. This section considers vulnerabilities by evaluating each component of the system; refineries, pipelines, terminals, delivery-trucks and retail fueling stations, and the various hazards that are present.
Refineries can, as they have in the past, experience interruptions due to various reasons including but not limited to: earthquake, fire and unusually cold weather. A strong earthquake in Los Angeles may damage refineries, reducing production and slowing the delivery of product off the West Line. Similarly, sustained winter time very cold weather in West Texas can cause production problems for the refineries supplying the East Line. Although there are a limited number of refineries that produce AZCBG, most common incidents will be localized and refineries from other areas are capable of making up for product shortages.
Although less likely, a prolonged interruption of the pipeline which transports product from the refineries to the terminals would have a greater impact of the many possible events. The pipeline is hundreds of miles long and crosses fault lines, stream beds and other somewhat unstable areas. Although normally buried and regularly maintained, a pipeline may be subjected to many possible single and combined events that can cause a rupture.
Such breaches can occur for many conceivable reasons, including human error, undetected weaknesses, improper installation and operation, earthquakes, weather events, accidents, and even sabotage. Of these, issues of maintenance and installation should be considered the most common, but earthquakes can produce some risks as well, especially along the west line, which crosses many active faults. Earthquakes strong enough to disrupt delivery on the east line—which delivers most of Arizona’s gasoline and diesel fuel—are far less likely (Fig. 6).
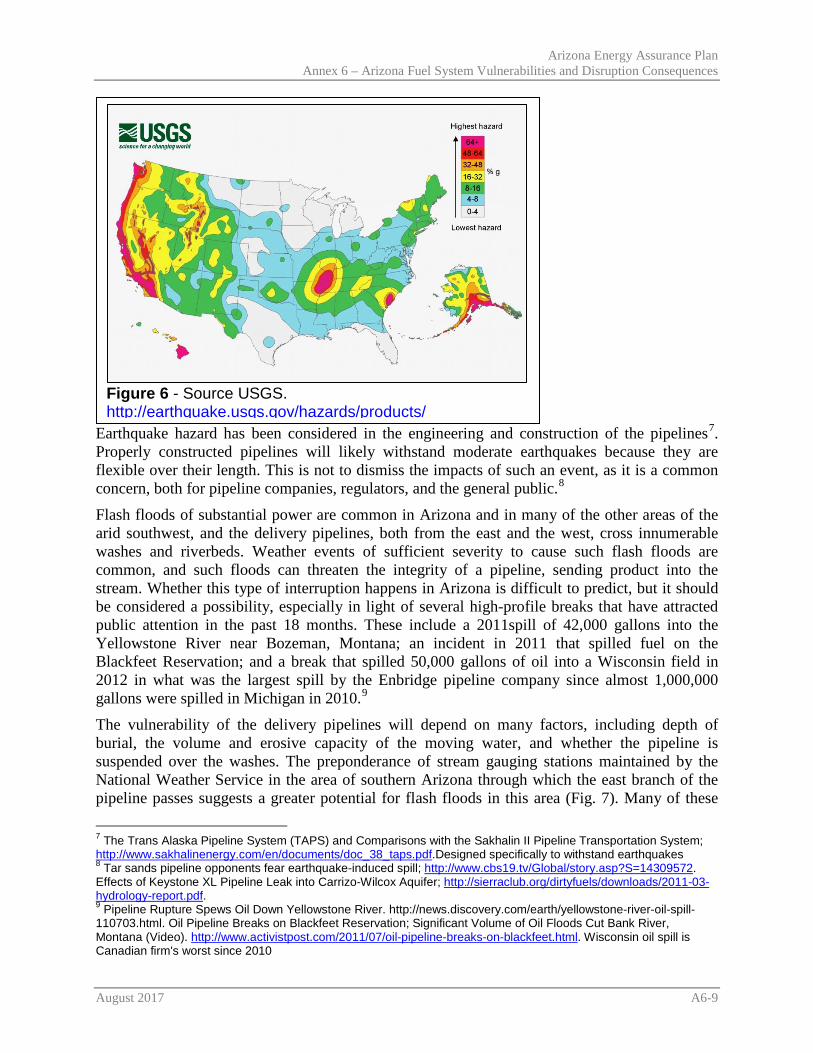
Arizona Energy Assurance Plan Annex 6 – Arizona Fuel System Vulnerabilities and Disruption Consequences
August 2017 A6-9
Earthquake hazard has been considered in the engineering and construction of the pipelines7. Properly constructed pipelines will likely withstand moderate earthquakes because they are flexible over their length. This is not to dismiss the impacts of such an event, as it is a common concern, both for pipeline companies, regulators, and the general public.8
Flash floods of substantial power are common in Arizona and in many of the other areas of the arid southwest, and the delivery pipelines, both from the east and the west, cross innumerable washes and riverbeds. Weather events of sufficient severity to cause such flash floods are common, and such floods can threaten the integrity of a pipeline, sending product into the stream. Whether this type of interruption happens in Arizona is difficult to predict, but it should be considered a possibility, especially in light of several high-profile breaks that have attracted public attention in the past 18 months. These include a 2011spill of 42,000 gallons into the Yellowstone River near Bozeman, Montana; an incident in 2011 that spilled fuel on the Blackfeet Reservation; and a break that spilled 50,000 gallons of oil into a Wisconsin field in 2012 in what was the largest spill by the Enbridge pipeline company since almost 1,000,000 gallons were spilled in Michigan in 2010.9
The vulnerability of the delivery pipelines will depend on many factors, including depth of burial, the volume and erosive capacity of the moving water, and whether the pipeline is suspended over the washes. The preponderance of stream gauging stations maintained by the National Weather Service in the area of southern Arizona through which the east branch of the pipeline passes suggests a greater potential for flash floods in this area (Fig. 7). Many of these
7 The Trans Alaska Pipeline System (TAPS) and Comparisons with the Sakhalin II Pipeline Transportation System; http://www.sakhalinenergy.com/en/documents/doc_38_taps.pdf.Designed specifically to withstand earthquakes 8 Tar sands pipeline opponents fear earthquake-induced spill; http://www.cbs19.tv/Global/story.asp?S=14309572. Effects of Keystone XL Pipeline Leak into Carrizo-Wilcox Aquifer; http://sierraclub.org/dirtyfuels/downloads/2011-03-hydrology-report.pdf. 9 Pipeline Rupture Spews Oil Down Yellowstone River. http://news.discovery.com/earth/yellowstone-river-oil-spill-110703.html. Oil Pipeline Breaks on Blackfeet Reservation; Significant Volume of Oil Floods Cut Bank River, Montana (Video). http://www.activistpost.com/2011/07/oil-pipeline-breaks-on-blackfeet.html. Wisconsin oil spill is Canadian firm's worst since 2010
Figure 6 - Source USGS. http://earthquake.usgs.gov/hazards/products/

Arizona Energy Assurance Plan Annex 6 – Arizona Fuel System Vulnerabilities and Disruption Consequences
August 2017 A6-10
streams, such as the Santa Cruz River must be negotiated by the east pipeline (Fig. 8). Such events, whether from floods or earthquakes, could be difficult to repair quickly. Deliveries along pipelines involved in such incidents must be suspended during any repairs.
Figure 7 – Stream gauges in Arizona. Source: NOAA. http://water.weather.gov/ahps/region.php?state=az
Figure 8 – Strong flood water along Santa Cruz River from St. Mary's Bridge, Tucson, Oct 2, 1983. Credit: Peter Kresan. Source: USGS. Unfortunately, in these modern times, sabotage and other willful actions should be considered as a possible cause of a supply disruption. To date, there have been no reported events of this type in Arizona. A 2005 article written by the Institute for the Analysis of Global Security, however, states that pipeline sabotage is a ‘weapon of choice’ by insurgents in Iraq.10 There have been incidents of pipeline tampering in the US, and Canada is stepping up its vigilance against such attacks.11 Although there are many other potential targets for terrorists in addition to pipelines, emergency planners should include this risk in their contingency plans.
10 Pipeline sabotage is terrorist’s weapon of choice. http://www.iags.org/n0328051.htm 11 Gas Wells Are Not Our Friends: Pipeline Sabotage In Bradford County, PA; http://dearsusquehanna.blogspot.com/2012/04/pipeline-sabotage-in-bradford-county-pa.html. Canada's pipelines vulnerable to sabotage, expert says. http://cnews.canoe.ca/CNEWS/Politics/2012/07/31/20050056.html
Arizona Energy Assurance Plan Annex 6 – Arizona Fuel System Vulnerabilities and Disruption Consequences
August 2017 A6-11
All the causes for supply interruption mentioned above involve some form of pipeline break, but there are other causes for interruptions that do not, such as labor shortages and tank farm accidents. Labor shortages could occur from organized labor disputes as well as from disease pandemics or crisis conditions which may limit the availability of workers. These labor shortages can affect any of several links in the supply chain. These include delivery of crude to the refineries (e.g. shipping strike), a labor strike at critical refineries, and delivery of the stored fuel from local tank farms (e.g. drivers’ strike). Labor actions of these types have not happened in recent memory at any step in the Arizona delivery of transportation fuels. While they should not be entirely discounted, a lengthy supply disruption from labor strikes is not likely and may be corrected by judicial order. Further, a pandemic or other crisis may cause a large portion of drivers or workers to fail to show up for work. Whether for being too ill themselves or caring for family members who are seriously ill, workers may not be able to perform their duties. Finally, if a major crisis were to occur in another part of the country, drivers may be called to other locales to assist, creating a labor shortage here.
Another vulnerability lies within the blending procedures required to create a finished CBG gasoline product which occurs at the terminals. The “blendstocks” are often referred to as Blendstock for Oxygenate Blending (BOB), or in the case of the CBG required areas —AZBOB. The pipelines deliver the AZBOB to the terminals as an unfinished product. This is where ethanol is added. The AZBOB does not meet octane specifications until it is blended with the ethanol. Consequently, a disruption in ethanol supply or deliveries will result in a disruption of finished CBG gasoline products. Essentially, if Phoenix terminals are out of ethanol, they cannot blend CBG, so the market is effectively out of gasoline. There have been cases where rail deliveries of ethanol have not kept up with demand, creating spot outages.
Conventional gasoline (CG) is also blended with ethanol to meet RFS requirements, but can be delivered to service stations without ethanol because the CG met finished product specifications when it was produced in the refinery. The industry cannot deliver CG to stations in CBG areas unless the EPA has granted a waiver to Arizona’s State Implementation Plan (SIP) for air quality. However, even with an EPA waiver, industry would likely not offer unfinished CG due to the low quality failing to meet various standards and the potential liabilities that could arise. Therefore, ethanol should be considered a critical component for delivery of both CBG and CG.
Another possible cause for interruption would be the unlikely event of a devastating fire at one or more of the tank farms. Such fires have occurred in the past, although not in Arizona. Moreover, fires of this type are usually confined to a single tank (Fig. 9). The existence of two widely separated large tank farms in Arizona would seem to provide additional security in the event of such an unlikely event, thus insuring against the remote possibilities of large losses in reserves.

Arizona Energy Assurance Plan Annex 6 – Arizona Fuel System Vulnerabilities and Disruption Consequences
August 2017 A6-12
An electricity supply outage would affect many aspects of the fuel supply system. Outages usually do not exceed one or two hours. In 2011, a grid failure resulted in electricity interruption for 12 hours in Yuma, Arizona. Storms during the summer of 2012 caused outages lasting up to seven days in some areas of the U.S. It is important to note that during an electric power outage, Arizona pipeline pumping mechanisms and tank farm/terminals do not have emergency generators. When the electricity fails, the built-in safety measures and electric interlock devices will shut off all fuel valves and pumping. This is a safety feature that prevents accidental fuel discharge and environmental damage at these facilities.
Most retail transportation fueling stations lack emergency power for the underground submersible pumps in the storage tanks. Without electricity, they cannot pump fuel, process credit card or cash transactions. Critical service providers may not be able to get fuel for generators, emergency service vehicles, food delivery trucks, mail service, and utility repairs.
Figure 9 - A gasoline storage tank at the Colonial Pipeline Tank Farm, at 411 Gallimore Dairy Road in Greensboro, is left a heap of melted metal after a lightning-sparked fire early Sunday, June 13, 2010. (Photo courtesy of WFMY)

Arizona Energy Assurance Plan Annex 6 – Arizona Fuel System Vulnerabilities and Disruption Consequences
August 2017 A6-13
Consequences As of July 2012, there were about 6 million registered vehicles in Arizona, or about one for every man, women, and child in the state (Table 2). Almost each one of them operates on gasoline or diesel fuel. Just for gasoline, the latest figures show that Arizona uses about 7 million gallons per day. With between 3-10 days of reasonable expected storage available for gasoline in the two tanks farms, the effects of an interruption of gasoline fuels will be quickly felt, absent fuel reduction measures. But it would not be just commuters who would be affected. Most consumer products are brought into the state by truck, so an interruption of fuels to these trucks would have quick impact on most supplies, particularly perishables such as food. It is well-known that grocery store chains, like most other consumer businesses, operate under a just-in-time supply chain. There is probably not more than 3-4 days of food supply at any one time. With these facts in mind, it is not an exaggeration to say that Arizona’s economy and way of life depends on motor vehicles, and that an interruption of transportation fuels that power them would have quick and inconvenient impacts on commuters, strong impacts on truckers and the products they transport, and critical impacts on first responders.
It should be noted that as a result of the fluid nature of the free market many variables come into play, which affect supply and demand. This makes it nearly impossible to pinpoint exactly how many days of supply are on hand at any specific time. Particularly during a crisis, substantial demand shifts can occur, which vary greatly from normal conditions. Additional supply will likely come in from multiple sources outside our traditional delivery sources, thus adding an undeterminable amount of supply. However, all things remaining constant, one can estimate days
Table 3 - Arizona Registered Vehicles by Category. Source: ADOT

Arizona Energy Assurance Plan Annex 6 – Arizona Fuel System Vulnerabilities and Disruption Consequences
August 2017 A6-14
of supply on hand by evaluating average inventories and average demand. Table 4 shows AWDM data from 2009 that can provide an estimate of average days of supply.
Table 4 –Average inventories and demand by product. Source: AZ Department Weights and Measures.
Product Average Daily Retail
Inventories (KB)
(Estimated**)
Average Daily
Terminal Inventories
(KB)
Average Daily
Inventories Total (KB)
Average Daily
Demand (KBD)
Average Days of Supply (days)
CBG 211.7 419.0 630.7 99.7 6.3 Conventional 185.6 278.7 464.3 72.8 6.4
Diesel* 66.3 78.2 144.5 49.4 2.9 *Includes LSD and ULSD ** Assumes average inventory of %30 of capacity as most stations run with the least amount of fuel needed the meet their sales volumes. Figures 10 and 11 summarize recent data from the Energy Information Administration which supports the average days of supply estimates of 3-7 days for regular gasoline. EIA data for June, 2012, shows the average blendstock supply was 962KB and finished gasoline supply, 96KB, giving a total of 1,058KB. To this amount the 10% ethanol is added, resulting in about 49 million gallons of average gasoline supply. With demand at 7 million gallons per day, this is about 7 days of supply. For CBG, ADWM receives batch reports from suppliers shipping the CBG into Maricopa County. The latest data received from the end of August, 2012 showed a 2.4 – 2.9 day supply of CBG. This is also consistent with earlier reports, indicating we typically have about a 3.5 day supply of CBG. In summary, it appears supply can vary due to a variety of factors; however, it can be concluded that days of supply in storage can range from 2.4 to 7 days.

Arizona Energy Assurance Plan Annex 6 – Arizona Fuel System Vulnerabilities and Disruption Consequences
August 2017 A6-15
Because Arizona lacks petroleum supply diversity and redundancy—with most of its transportation fuels delivered through a single pipeline—the State is vulnerable to supply interruptions. Many other factors are also in play, including the (1) duration of the interruption, (2) how much fuel is in reserve at the time, and (3) how much consumption can be reduced through voluntary and mandatory measures. The first factor will depend upon the extent of the interruption and the response capabilities of the pipeline companies. The second factor is influenced by market factors and timely actions by the state to maintain reserves. The third factor
Figure 11 – Arizona Gasoline Blending Components Stocks at Refineries, Bulk Terminals, and Natural Gas Plants (Thousand Barrels). Source: EIA. http://www.eia.gov/dnav/pet/hist/LeafHandler.ashx?n=PET&s=E_EPOBG_STR_SAZ_MBBL&f=M
Figure 10 – Arizona Finished Transportation Gasoline in Bulk Terminals (monthly). Source: EIA. http://www.eia.gov/dnav/pet/hist/LeafHandler.ashx?n=PET&s=MGFSXAZ1&f=M

Arizona Energy Assurance Plan Annex 6 – Arizona Fuel System Vulnerabilities and Disruption Consequences
August 2017 A6-16
will depend upon an effective response plan. The good sense of preparing a carefully considered response plan in advance is to insure against the uncertainties of duration and to bolster public confidence and reduce public anxiety should another interruption occur.
The 2003 pipeline break caused a partial interruption in supply but did not create an emergency. Judging from the 2003 break, adaptions were affected quickly enough to prevent an emergency situation, despite the widespread public fuel buying reaction to news of the break. There remained substantial reserves at the tank farms throughout the interruption.
A report12 prepared by members of the Governor Napolitano’s Essential Services Task Force revealed that while the 2003 pipeline break reduced capacity of the pipeline and reserves, there was enough supply on hand at the terminals to maintain typical supply and demand. It was actually a public panic buying frenzy which ultimately triggered the supply and deliver issues. This created a logistical bottle neck within the retail supply chains. Delivery trucks were having difficulty making deliveries to retail stations. At this point some shippers and retailers (particularly spot-market purchasers) began to run dry. “News media reports of closed stations and long lines of frustrated customers added to the growing unease.” Further exacerbating the problem, industry practices of inflexible contracts prevented some shippers from receiving fuel from outside of their traditional contracts. Gov. Napolitano prepared messages urging citizens to refrain from panic buying; however, due to laws limiting the petroleum industry’s ability to share specific information publicly, information sharing was limited. This “compromised her ability to keep the public fully informed about the available gasoline supply and to alleviate the perception of crisis.”
Perhaps the most valuable lesson learned from the 2003 incident, was the need for improved communication and coordination among the industry and government. A clear assessment of the situation can lead to better management of public information messages. Today, ADWM has been granted statutory authority to prevent the release of competitively sensitive information. Reports from ADWM will be composed of aggregated data compiled from suppliers so as to maintain confidentiality. This ability to fully share information is vital to efforts to keep the public fully informed with clear media messages about the availability of gasoline supply and alleviate the perception of a crisis.
The goal of energy assurance planning is to achieve a robust, secure and reliable energy infrastructure that is also resilient — able to restore services rapidly in the event of any interruptions. Our nation's energy infrastructure is potentially vulnerable to a variety of hazards. Stretching across jurisdictions and states to national borders, this "system of systems" can be disrupted by severe weather events and other natural disasters, systems failures, and deliberate physical, cyber13, or actions such as transpired when OPEC curtailed supplies in the 1970s.
Each type of event carries different levels of uncertainty. In most instances, one can assume that interruptions from weather events, natural disasters, systems failures and even sabotage would be relatively short-lived. The length of interruptions from cyber attacks, labor disputes, and political actions are less predictable. 12 August 2003 Kinder Morgan Pipeline Disruption, Prepared by Governor Napolitano’s Essential Services Task Force, May 2004. 13 A nervous China plans to drastically accelerate its spending on security for its growing electricity infrastructure over the next several years. A new report from GlobalData says China's security spending will increase from $1.8 billion in 2011 to $50 billion by 2020. Cyber attacks that take electricity out of service will affect transportation fuel delivery options. Source: http://www.smartgridnews.com/artman/publish/.

Arizona Energy Assurance Plan Annex 6 – Arizona Fuel System Vulnerabilities and Disruption Consequences
August 2017 A6-17
Evaluation of Planning and Response For purposes of comparisons, this section reviews the transportation fuel shortage plans in several other states. The transportation fuels shortage plans of eight states were reviewed to help identify measures adopted in other states for possible applicability in Arizona. The chosen states of California, Colorado, Nevada, Oregon along with Maine, Delaware, Mississippi and Maryland represented a variety of geographic regions or compare favorably with some aspect of Arizona’s natural and human environment (e.g. aridity, isolation, size). We also considered some recent examples of government action in Michigan and Wisconsin that support contingency planning.
We found that most of the plans have similar sub-plans to deal with interruptions in transportation fuels, specifically gasoline and diesel fuel. The overlapping measures include terms like Set Aside Programs, mandatory and voluntary measures, demand reduction, information acquisition, and public information.
Set Aside Programs or Priority End User Plans vary in degree but all attempt to achieve maximum flexibility for the individual elements within the program. Not all elements automatically trigger implementation. In addition, some parts of the program will be implemented only if the federal government institutes price and allocation controls. Arizona has statute authorizing a set-aside program to help provide CBG during winter months. The authority is found at A.R.S. Section 28-482 and is undergoing a statutory review process to determine applicability, if any, to emergency fuel shortage response. Rules to implement the set-aside program have not been adopted. Even in the event that Arizona does not adopt a set-aside strategy, such plans help identify elements that can be incorporated in other parts of contingency planning.
For example, in Delaware and Mississippi, the four set aside program elements are:
• redistribution of fuel supplies to bulk consumers who are considered priority users and who are experiencing difficulty obtaining sufficient fuel supplies at any price,
• community hardship element, • assignment and adjustment element is intended for use only after the federal government
institutes a price and allocation control program, • certification element that allows emergency, health, safety and essential services to apply
for certification-of-need to receive their supplies. For mandatory measures, many states implement gasoline queue management controls, stricter speed enforcement, rideshare, flexible work patterns and encourage alternative fuels. Many state plans have voluntary measures that include efforts to reduce nonessential automobile use; increase ride sharing, public transportation and bicycle use, along with observance of speed limits and flexible work patterns.
Demand reduction plans may come in the form of government waivers as in the 2012 Wisconsin and Michigan exemptions for motor carriers to operate beyond the State and Federal limits regarding hours of service. State governors may issue emergency Executive Orders to suspend other state regulations such as truck overweight limits and local truck environmental permitting. Federal weight limits are never given waiver for safety reasons, however since Arizona’s limits are below the Federal limits, state waivers can allow an increase to meet the federal regulation. Maine’s formal demand reduction plan along with hours of service waivers includes the employers/school plans, drive up window prohibitions, waivers for RVP and off road diesel, minimum fuel purchase and driverless days.
Arizona Energy Assurance Plan Annex 6 – Arizona Fuel System Vulnerabilities and Disruption Consequences
August 2017 A6-18
Information acquisition systems contribute to the plan by providing early warning data and monitor supplies at bulk terminals, pipeline receipts and retail activity. The most comprehensive plans have detailed measures for public information. Probably the most important action to reduce public fear and uncertainty is effective joint communication from the stakeholders to the public to the extent allowed by law and protocols of confidentiality. Most states with a plan have provisions to establish a JIS to organize regular news releases, media responses, fact sheets, Public Service Announcements (PSA), and TV and radio spots. The most detailed plans we reviewed came from the states of Delaware, Mississippi, California and Maine. Finally, not all states have Energy Assurance Plans for transportation fuels and some states have no Energy Assurance plan at all.
Reducing the Consequences of a Transportation Fuels Shortage While the owners and operators of the transportation fuels infrastructure are responsible for their energy supply systems, it is the responsibility of State and local officials to work with energy providers and stakeholders from other jurisdictions, government agencies, businesses, and related organizations, to ensure the wellbeing and progress of our communities. This includes planning to ensure critical service providers have the necessary fuels to maintain public order and safety. These services include, but are not limited to health care, police and fire, sanitation, public transportation and aviation ground support.
Alternative fuel vehicles, independent from the traditional petroleum fuels, can play a role in reducing consequences from a disruption of pipeline supply. Many of the alternative fuel vehicles are multi-occupancy which may serve invaluable to the public during a shortage. Valley Metro operates 1,000 buses on LNG. LNG is liquefied natural gas which is brought in by rail or truck. Sky Harbor employs some 200 transit buses operating on CNG. CNG is compressed natural gas and comes in via the natural gas pipeline. SuperShuttle runs 60 vans on propane. LPG is liquid propane gas and is delivered by rail or truck. AAA Yellow Cab has 180 cabs operating on E85 Ethanol. E85 Ethanol is produced locally. Other sources on alternative fuels are biodiesel and electricity. Alternative fuel is used extensively every day throughout Arizona offsetting demand for traditional fuel, which could help meet some critical needs such as fire, police and emergency medical.
At the fundamental level, interruptions of transportation fuels can reasonably be addressed with a mix of three categories of response: reducing demand, tapping local reserves, and increasing supply. Demand reductions can come from some combination of mandatory and voluntary measures. Tapping into available local reserves is viable when stored fuel is readily accessible to demand centers. Increasing supplies, at least of liquid transportation fuels, requires switching to an alternative pipeline (when available), mobilizing large fleets of tanker trucks or, conceivably, using rail tank cars.
Demand reduction also occurs when prices rise. People work from home, short fill instead of fill up, car pool, bike to work or get on the bus. Pricing has a more immediate effect on demand than government action because individual consumers make their own choices. Government imposed demand controls are limited, and difficult to implement.
In summary, transportation fuel delivery is vulnerable. It can be interrupted for an unpredictable amount of time by any of several causes. Without a more detailed probability analysis, one could at least list the most likely causes: (I) human error and accident, including improper or insufficient maintenance; (II) weather and tectonic events, and (III) a willful action. In response

Arizona Energy Assurance Plan Annex 6 – Arizona Fuel System Vulnerabilities and Disruption Consequences
August 2017 A6-19
to these possibilities, we can suggest several measures to reduce the chance and impacts from an interruption should any such event occur. These actions could include (I) emergency fuel storage, (II) contingency planning (from voluntary to mandatory) to reduce consumption for an agreed period of time (e.g. days, weeks, etc.), (III) redundant avenues of transportation supply, (IV) development of local alternatives, (V) further preparation for quick repairs, (VI) increased security and maintenance of existing infrastructure. These options should be a starting point for preparing state priorities. Whatever response is given highest priority, it should be accompanied by a clear public communication structure.

Arizona Energy Assurance Plan Annex 7 – Energy Assurance and the Smart Grid
August 2017 A7-1
ANNEX 7 – ENERGY ASSURANCE AND THE SMART GRID
INTRODUCTION
The Smart Grid is an initiative by government and industry to improve the efficiency and reliability of the electrical power grid. It is characterized by the use of information generated by components within the system to efficiently maximize power system assets while minimizing consumption. In addition to improved reliability, the Smart Grid will provide flexibility and offer financial rewards for all stakeholders. The success of the Smart Grid hinges on the ability to communicate the flow of information and make decisions based on that information.
Control of the current power grid is restricted to a select number of users, who take part in the delivery of electricity to consumers. There are over 130 million electricity consumer in the United States, and over 3,000 electric utilities. i The Smart Grid by contrast will require the input and control of nearly every stakeholder, from utility companies to regulatory entities to power consumers, both commercial and residential. Millions of participants will have the potential to be both a generator and consumer, complicating the functioning of grid operations. This analysis is intended to describe the basic characteristics of the Smart Grid, identify the current initiatives to promote Smart Grid implementation, and recommend what needs to be done to enable the Smart Grid to contribute to energy assurance.
BENEFITS
The benefits of the Smart Grid are centered on its flexibility to adapt to changes in generation, consumption, and disruptions.
Reliability Through the use of information communication and control, the Smart Grid will provide reliable power with fewer and shorter outages. The grid will have the ability to heal itself, by detecting problems in real-time, and isolating the problem while keeping the rest of the grid operational. Problems can be repaired without impacting the rest of the grid, and allow fast recovery to normal conditions. It will also be able to isolate select areas or groups of users in an emergency, such as a hurricane or terrorist attack.
Safety The Smart Grid will continuously monitor itself to detect unsafe conditions. Cybersecurity features will be incorporated into all devices to prevent malicious attacks and losses of data due to power disruptions. Protection will include physical defenses, electronic defenses, and safety procedures and protocols.
Distribution Management Power distribution systems are complex to control, with numerous transformers, switches, and controlling devices. The Smart Grid will automate the distribution process, improving response times to disruptions and therefore reducing losses. It will also allow for the implementation of microgrids. Microgrids coordinate the generation and distribution of electricity to end users, but on a local level. For example, a microgrid could tie a select number of power sources and consumers on a common electrical framework, which would in turn be tied to the larger

Arizona Energy Assurance Plan Annex 7 – Energy Assurance and the Smart Grid
August 2017 A7-2
electrical grid at a single point. In the event of a disturbance to the larger grid, the microgrid would isolate itself while maintain power continuity to its select sources/consumers. When the larger grid returns to normal, the microgrid would reconnect. Microgrids can connect power resources and/or customers who have similar capabilities, threats, or distance proximity.
Demand Response The Smart Grid will offer financial benefits to consumers. They will have access to the real-time data of their home or business power use and possess the ability to adjust activities in response to this information. The framework needed to allow this to happen will include smart meters, smart appliances, and peak demand pricing.
Energy Resource Integration Most power generation will continue to come from fossil fuels and nuclear power plants. Renewable generation currently accounts for only 4% nationally, but is forecast to rise to 10% by 2035. ii One of the main goals of the Smart Grid is to allow for the integration of multiple forms of power generation, including conventional technologies such as coal, gas, and nuclear power, as well as newer technologies such as wind, solar, hydrokinetics, geothermal, and biomass. The strength of the Smart Grid is it can incorporate these various forms of power generation as they become viable and available. A traditional problem with renewable energy, such as wind and solar, is they provide intermittent power, causing rapid power fluctuations. When a power source is not available other sources must be able to be ramped up to meet demand. By using real-time data from sensors and monitors throughout the system, the Smart Grid will be able to control the variable nature of new energy technologies. It will also be able to control insufficient transmission capacity, such as that coming from a remote wind farm.
CHALLENGES
Challenges to the progress of the Smart Grid can be separated into 4 areas: education, regulation, privacy, and security.
Education
Large industrial customers are familiar with peak demand pricing, with knowledgeable and experienced personnel assigned to save the operation money. However the vast majority of customers, especially residential, will have difficulty adjusting to the ability to control their energy usage. There will be a need to educate customers on how to be an active participant in the Smart Grid. They will need to be shown how the Smart Grid can be a means for putting control in their hands and savings in their pockets. iii Education programs will need to be rolled out along with the issuance of smart meters and appliances.
Regulation State regulatory bodies are responsible for ensuring the utilities they oversee make investments that keep the prices of electricity low for consumers. During the initial implementation of the Smart Grid, the resiliency, reliability, and safety of the system will be difficult to quantify. Regulators will be hesitant to accept large investments in grid improvements from utilities, which will ultimately be passed on to consumers. Regulators will need proof that grid improvements will deliver the promised benefits and cost savings.
Privacy
Arizona Energy Assurance Plan Annex 7 – Energy Assurance and the Smart Grid
August 2017 A7-3
Because the fundamental aspect of the Smart Grid is the communication and control of information, there is concern that the confidential information of users could get into malicious hands. This violation of privacy could be used for identity theft, monitoring of daily activity, and the marketing of unsolicited services based on home or business energy usage. Privacy of system information will be tantamount to public acceptance.
Security As more devices and new technologies are added to grid, there are concerns about how to protect that infrastructure. It is naïve to believe that the Smart Grid will be self-healing. See the following chapter on Cybersecurity.
KEY TECHNOLOGIES
The Smart Grid will not replace existing infrastructure with new and improved devices. Rather it will integrate new technologies into the framework of the current grid. Advanced technologies will come from one of the following areas:
Integrated Communications High-speed, 2-way communication will make the Smart Grid an interactive platform for real-time information exchange. Open lines of communication will allow all components to communicate and interact with each other. Smart meters at the end user junction will make the consumer a stakeholder in the process.
Sensing, Measurement, and Control Measurement and detection devices throughout the grid will evaluate the status of equipment and the integrity of the system. The control system will be automated, decreasing response times and reducing user-error. Control components will have to handle an ever increasing number of devices, such as the rollout of electric vehicles, in which every vehicle can be both a power consumer and power generator. Compared to conventional controllers, controllers will have to address the intermittency of renewable energy sources, shift power consumption away from peak hours, and improve power quality.iv
Interfaces and Decision Support While improvements to the Smart Grid will be due mostly to automated control and response, there still exists the need for hands-on management capabilities by utility personnel. The utilities must be able to manage a diverse set of generating sources, control points, and customers. Specialized computer hardware and software will be developed to handle the dynamic flow of information.
Consumer Devices The improved grid will fundamentally change the way people manage their power use, by providing the end-user with the ability to control consumption as well as from whom to purchase power. Real-time data from appliances and power consumption devices throughout the home or business and instant data on power prices will enable consumers to become active players in grid management. This will be an opportunity for industry to develop products consumers demand.

Arizona Energy Assurance Plan Annex 7 – Energy Assurance and the Smart Grid
August 2017 A7-4
INFORMATION AND THE SMART GRID
The basic concept of the Smart Grid is to use information generated by the system to efficiently maximize power system assets while minimizing consumption. In addition to improved reliability, the Smart Grid will offer financial rewards and provide flexibility. The success of the Smart Grid hinges on the ability to communicate and control this information. Protection of this flow of information will need to be incorporated in every stage of design and implementation.
The current power grid is restricted to a select number of users. The Smart Grid by contrast will require the input and control of nearly every stakeholder, from utility companies to regulatory entities to power consumers, both commercial and residential. All stakeholders expect the new grid to keep them informed, empowered, and secure. (Fahimi, 2011) The open-nature of the system makes it more vulnerable to failure, whether from direct attack or inadvertent activity. Although the Smart Grid is in the initial stages of development, there have already been documented cyberattacks.
CYBERSECURITY
As Smart Grid technologies are developed and implemented, a critical component of energy assurance will be the security of the system’s information flow and control capability. Cybersecurity will include protecting the communication and control elements against both direct threats such as terrorist attacks, espionage, and disgruntled employees, as well as indirect threats such as natural disasters, equipment failure, and user error. Society’s dependence on electricity poses a ripe target for malicious attacks. Since a system-wide failure would entail financial and social disaster, investments will need to be made to enhance its resiliency and protection. Types of threats to the system will be examined and the security model recommended to protect against them. The U.S. government is heavily investing in the Smart Grid system as it modernizes the country’s electrical network. Many countries view the Smart Grid as a key tool in energy independence, global warming efforts, and emergency resilience.v Utility companies around the world are forecast to spend $21 billion by 2015 to improve Cybersecurity, accounting for 10% of the cost of implementing the entire Smart Grid infrastructure.vi
Cyber security is part of a very large effort to protect critical infrastructure with many initiatives underway. DHS and Federal agencies are currently responding to the tasks assigned in the Presidential Policy Directive-21: Critical Infrastructure Security and Resilience and the corresponding Executive Order 13636: Improving Critical Infrastructure Cybersecurity which were released in tandem February 2013.
In an effort to strengthen critical infrastructure security and resiliency the PPD-21 replaces Homeland Security Presidential Directive-7. The directive identifies 16 critical infrastructure sectors and designates associated Federal Sector-Specific Agencies (SSAs). The Department of Energy (DOE) is the designated SSA for the Energy Sector. The Energy Sector is identified as uniquely critical because it provides an “enabling function” across all critical infrastructure sectors.
Another major goal has been assigned to National Institute of Standards and Technology (NIST). NIST will develop a Cybersecurity Framework for standards and best practices. NIST is seeking to get stakeholders from all sectors involved in the Framework development process through a
Arizona Energy Assurance Plan Annex 7 – Energy Assurance and the Smart Grid
August 2017 A7-5
variety of forums and workshops. NIST must develop a preliminary framework within 240 days and a final framework within one year of the executive order (Feb, 2013).
The directive establishes two national critical infrastructure centers operated by DHS – one for physical infrastructure and another for cyber infrastructure. Functioning in an integrated manner they will serve partners to obtain situational awareness and actionable information to protect the physical and cyber aspects of critical infrastructure. An integration and analysis function will reside at the intersection of the two national centers and will include the capability to assess and integrate vulnerability and consequence information.
Implementation of the directive calls for the Secretary of Homeland Security to lead the coordination with all appropriate Sector-Specific Agencies (SSAs) and partners to implement a list of initiatives:
• Develop a situational awareness capability that addresses both physical and cyber aspects of how infrastructure is functioning in near-real time
• Understand the cascading consequences of infrastructure failures • Evaluate and mature the public-private partnership • Update the National Infrastructure Protection Plan • Develop comprehensive research and development plan
With the energy sector being such an essential part of critical infrastructure, policy changes can be expected. Existing standards and regulations from DOE, FERC, NERC, and other energy industry organizations should be anticipated.
THREATS
The Smart Grid will be composed of numerous sources of power generation, a highly complex web of transmission and distribution lines, end user devices to monitor and control consumption, and countless sensors and monitors throughout the entire system. Nearly all of these components will have computer processors, memory, and software which will gather and process data, and making decisions based on that data. All of these devices offer an opportunity for a cyberattack. Regardless of the entry point, once in the system an attacker has the potential to cause system-wide failure.
As the number of generation point sources increases, so does the potential for the number of attacks. The resiliency of the Smart Grid is rooted in the concept that a portion of generating sources can fail, but which won’t sacrifice the operation of the entire system. While existing power plants have highly capable protection mechanisms, new technologies will have to be developed that can handle the wide array of generating technologies, and at a reasonable cost to system designers. Especially when new storage technologies are implemented, along with electric vehicles inputting power to the grid, it is expected that every home and business could become a generating source, thereby offering millions of points of entry for cyberattacks.
Sensors and Monitors Devices throughout the grid will measure the status, sending data to the management systems. They include smart meters at customer locations and sensors on transmission and distribution lines. Many of these devices can be in remote locations which are hard to physically protect. An

Arizona Energy Assurance Plan Annex 7 – Energy Assurance and the Smart Grid
August 2017 A7-6
attacker could easily modify and/or replace a device with a malicious one through which a cyberattack could enter the Smart Grid. For example, attackers could tamper with a set of monitors on the distribution network near a city or particular customer, sending erroneous data to the management system. The control mechanisms would then be making decisions on faulty information, possibly shutting down power to areas that in fact are operating correctly.
Controls Control systems in the Smart Grid will gather data from sensors and monitors, evaluate the data, and make decisions to prevent failure. There are existing systems which control the current grid, such as Energy Management Systems (EMS), Supervisory Control and Data Acquisition (SCADA), and distributed control systems. However, there are a limited number of existing controlling devices. As the Smart Grid is implemented with exponentially more devices, the control systems needed to manage the data will need to be increased, as well as the software needed to control vast amounts of data and devices. If attackers are able to manipulate a control device, they can enter the EMS or SCADA system and therefore influence the entire grid. More control devices allow for more points of entry. For example, as electric vehicles are rolled out, every charging station will have a smart meter which will allow for the gathering of information and the 2-way flow of electricity. It will be a source of recharging the vehicle’s battery, but also for putting power on the grid from the vehicle. This will require the ability to communicate with the grid management system. If an attacker has control of the charging station or smart meter, he could launch an attack on the system.
SYSTEM SECURITY
Securing the Smart Grid will require a set of standards by which designers will adhere. The U.S. government has already initiated this process, with standards being developed by the National Institute of Standards and Technology (NIST). On August 2, 2011, NIST released the first 6 standards into its Catalog of Standards, a technical document now available as a guide for all involved with Smart Grid-related technology.vii Rules and regulations are also forthcoming from the DOE, the FERC, and the DHS. These standards and regulations are intended to ensure the system is designed with appropriate security measures.
Cybersecurity will be designed with multiple defenses spread over the entire network. Defense mechanisms for all devices will include physical protection, electronic protection, detection, and monitoring. Field devices such as sensors, monitors, and meters will have antitampering technology to prevent attackers from manipulating devices directly. Any device with computing capability will have protocols to encrypt data and authenticate communication. Detectors and monitors will be installed at various points along the system, making security a constant function versus an entry point opportunity. Detectors will identify malicious items and monitors will observe system behavior, identifying abnormalities. With multiple lines of defense and various methods, attackers will have to employ more resources and methods to successfully enter the system. Cybersecurity will allow attacks to be mitigated as soon as possible and at any point in the system.
The multiple defense strategy will protect against attackers trying to enter the system, but it won’t protect against an attack within the system, such as that from a disgruntled employee. To

Arizona Energy Assurance Plan Annex 7 – Energy Assurance and the Smart Grid
August 2017 A7-7
protect against this, the control system will have a specialized access and authentication framework. To successfully operate the Smart Grid there will need to be many individuals involved with monitoring and control. A simple policy can be employed for the framework called role-based Access Control (RBAC). viii RBAC assesses permission to perform specific functions and enter system areas to certain individuals, with unique passwords or authentication credentials to enter each control area. No individual will have permission to enter all areas. Therefore, to affect critical systems there will need to be participation and collaboration from multiple individuals, increasing the difficulty of coordinating a cyberattack.
IMPLEMENTATION
Implementing the Smart Grid and overcoming the hurdles described will be tasks shared by multiple communities and industries. Making the grid truly “smart” could take many years. Smart meters and appliances will take billions of dollars in industry innovation to develop and a decade to gain acceptance by the public at large. However, the eventual implementation of the Smart Grid and the integration of new technologies into the existing grid framework will provide some unique challenges, requiring the coordination and input from several government and industry groups. Areas needing collaboration to specifically address issues relating to energy assurance in times of emergency include:
Distributed Generation Over time new power generation technologies will be seamlessly integrated into the grid. Critical to the process will be to ensure that the balance between supply and demand can be met during disturbances to the system. To do this utility companies and government entities will have to intelligently plan on where to install new transmission capacity and control devices, based at both the points of generation and the location of consumers, taking into account the variable nature of renewable energy methods. This will require the coordination between states with different natural resources at different times of the year.
Power Sharing via Microgrids The United States has first-hand experience in the interdependence of the grid. The recent history of multiple hurricanes, tornadoes, and earthquakes has highlighted the need to provide transmission flexibility. Although many industrial facilities have cogeneration ability, they lack a Smart Grid to coordinate generating assets. States need a smarter electric grid to power disaster recovery and emergency evacuation needs, and to improve the resiliency of industries. Per the strategy described previously, cogenerating facilities could provide adjacent facilities with redundant power during a catastrophic event. Many facilities in a geographic area share common supply chains, such as raw materials and logistics infrastructure. They should then be able to share power generation assets in an emergency as well.
What is needed to unleash this potential for improved energy assurance is the establishment of a public policy to waive transmission regulations that interfere with industrial microgrids during emergencies. During a catastrophic incident industrial microgrids would not threaten the public utility customer base because public utilities cannot supply power during this period anyway. With the knowledge that these regulations would be routinely waived during natural disasters the potential members of industrial microgrids would then be willing to change their current standard operating procedures and make the investments needed.

Arizona Energy Assurance Plan Annex 7 – Energy Assurance and the Smart Grid
August 2017 A7-8
Emergency Management Policies While the entire system is less vulnerable with multiple small generating points versus a few large ones, it is more complex in attempting to coordinate participants including power generators, electric service providers, regulatory agencies, law enforcement, and consumers. Policy guidance is needed to clarify roles and responsibilities during an emergency. This will need to be a concerted effort to coordinate regulations between federal, state, and municipal entities.
Electricity Storage Several technologies are being designed to improve the ability to store power, both to reduce peak load requirements and power quality disturbances but also to supply power to critical infrastructure during a catastrophic event. Storage capacity should be located at all locations through the Smart Grid: power generating points, the distribution system, and at the consumer’s location. Efficient siting of storage capacity will minimize the consequences of power emergencies.
Standards The NIST is the government entity responsible for formulating the standards by which the Smart Grid will operate. NIST is working closely with the Institute of Electrical and Electronic Engineers (IEEE), the leading professional organization related to the electric power, communication, and computer industries. To date more than 100 Smart Grid standards have been developed and incorporated into the NIST Smart Grid Interoperability Standards Framework. The framework defines a standard under one of seven domains: bulk generation, transmission, distribution, customers, operations, markets, and service providers. As the Smart Grid improves and is expanded, new standards will be incorporated into the framework. ix
Rules and Regulations As the Smart Grid is rolled out, new rules/regs must be implemented with government oversight by which all participants must adhere for the Smart Grid to operate efficiently. The primary regulatory authority for electrical power generation in the United States is the FERC. Part of FERC’s mission is to regulate the interstate transmission of electricity. “Smart Grid responsibilities in this area derive from its authority over the rates, terms and conditions of transmission and wholesale sales in interstate commerce, its responsibility for approving and enforcing mandatory reliability standards for the bulk power system in the United States, and a recently enacted law requiring the Commission to adopt interoperability standards and protocols necessary to ensure Smart Grid functionality and interoperability in the interstate transmission of electric power and in regional and wholesale electricity markets.” x
Training Training will be conducted and funded at various stages, via both private companies and public programs. The Department of Energy has already appropriated millions of dollars for training, with $100 million distributed to 54 training programs around the country in 2010.xi This money will be used to train multiple participants in grid activities, including lineman, engineers, energy managers, and other utility personnel. Fifty thousand individuals will get Smart Grid training in 2011 alone. Training programs will have to adapt to new technologies and the changing policy structure.

Arizona Energy Assurance Plan
ENDNOTES
i Grid 2030, A National Vision For Electricity’s Second 100 Years. U.S. Department of Energy.
Office of Electric Transmission and Distribution. July 2003.
ii Annual Energy Outlook 2011. U.S. Energy Information Administration. Retrieved on July
2, 2011 from http://www.eia.gov/forecasts/aeo/chapter_executive_summary.cfm
iii Johnson, Dr. Kristina, Smart Grid: Building a Wireless Connection, October 7, 2010
http://energy.gov/articles/smart-grid-building-wireless-connection
iv Fahimi, Babak, Alexis Kwasinski, Ali Davoudi, Robert S. Balog, and Morgan Kiani. Charge It! Powering a More Electrified Planet. IEEE Power and Energy Magazine. Volume 9,
Number 4, July/August 2011. Page 59
v Seo, Jung-taek and Cheolwon Le. The Green Defenders, Smarter Cybersecurity for the Smart
Grid. IEEE Power and Energy Magazine. Volume 9, Number 1, Jan/Feb 2011. Page 82
vi Grant, Rebecca L., Ph.D. Smart Grid Impementation, Strategies for Success. The Lexington
Institute. May 2010.
vii National Institute of Standards. Smart Grid Panel Approves Six Standards for Catalog. August
2, 2011. http://www.nist.gov/director/smart-grid-six-standards.cfm
viii Seo, Jung-taek and Cheolwon Le. The Green Defenders, Smarter Cybersecurity for the Smart
Grid. IEEE Power and Energy Magazine. Volume 9, Number 1, Jan/Feb 2011. Page 82
ix National Institute of Standards. NIST and the Smart Grid. www.nist.gov September 2011.
x Federal Energy Regulatory Commission. Smart Grid. ferc.gov. September 2011.
xi Department of Energy. Obama Administration Announces Nearly $100 Million for Smart Grid Workforce Training and Development. energy.gov. April 2010.