arizona state university strategic enterprise plan strategic... · arizona state university...
TRANSCRIPT

Arizona State University
Strategic Enterprise Plan: 2015 Update & Operational and Financial Review
Arizona Board of Regents
April 9, 2015

ASU Charter
2
ASU is a comprehensive public research university,
measured not by whom it excludes, but by whom it
includes and how they succeed; advancing research and
discovery of public value; and assuming fundamental
responsibility for the economic, social, cultural, and
overall health of the communities it serves.
Responsibility and The Public Trust
The charter is a promise to the citizens of Arizona.
ASU has a responsibility to fulfill the requirements of the Arizona Constitution to provide public education.
The responsibility is not one that is conditional upon the actions of the legislature; it is ASU’s responsibility to find the means to fulfill its charter.
3

Performance and Metrics
4
Who We Include
5
40,000
42,500
45,000
47,500
50,000
52,500
55,000
57,500
60,000
62,500
65,000
67,500
70,000
2002 2003 2004 2005 2006 2007 2008 2009 2010 2011 2012 2013 2114 2015 2016 2017 2018 2019 2020
Tota
l In
-Pe
rso
n U
G E
nro
llme
nt
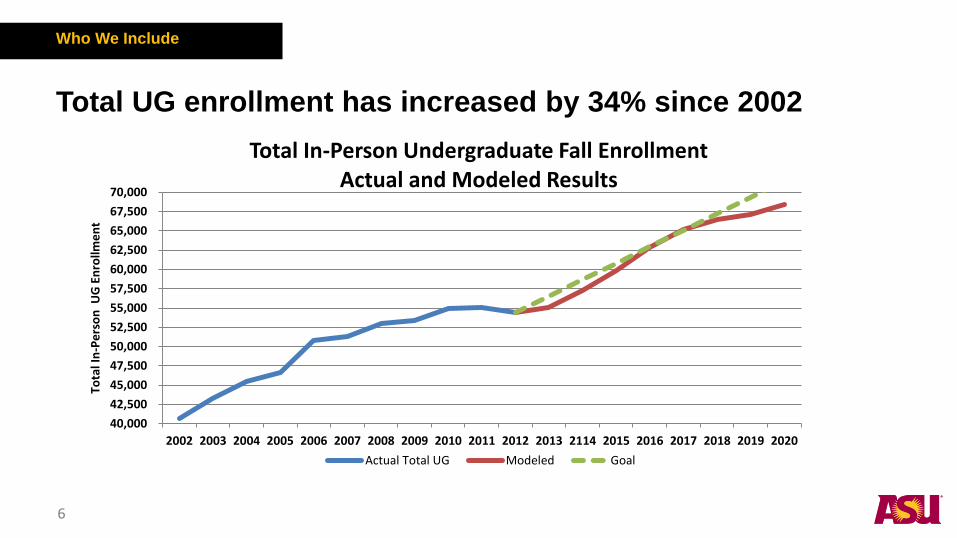
Total In-Person Undergraduate Fall Enrollment Actual and Modeled Results
Actual Total UG Modeled Goal
6
Who We Include
Total UG enrollment has increased by 34% since 2002

0
100
200
300
400
500
600
700
800
900
1,000
Financial aid and recruitment practices have resulted in substantial growth in enrollment of freshmen from families of lesser since 2002
Fall 2002
Fall 2007
Fall 2012
Only includes first-time, full-time freshman
ASU Freshman Enrollment by Annual Family Income
7
Who We Include
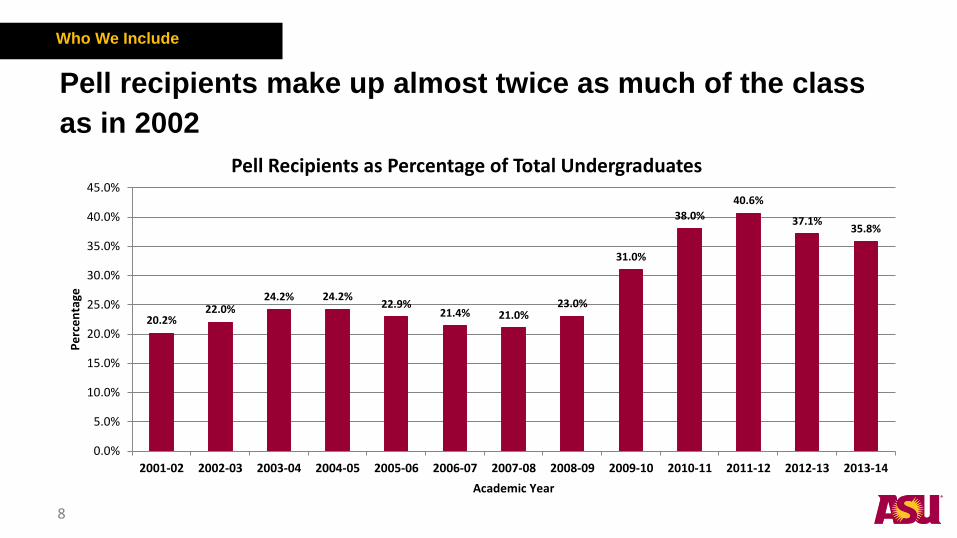
Pell recipients make up almost twice as much of the class
as in 2002
Pell Recipients as Percentage of Total Undergraduates
20.2% 22.0%
24.2% 24.2% 22.9%
21.4% 21.0% 23.0%
31.0%
38.0%
40.6%
37.1% 35.8%
0.0%
5.0%
10.0%
15.0%
20.0%
25.0%
30.0%
35.0%
40.0%
45.0%
2001-02 2002-03 2003-04 2004-05 2005-06 2006-07 2007-08 2008-09 2009-10 2010-11 2011-12 2012-13 2013-14
Pe
rce
nta
ge
Academic Year
8
Who We Include
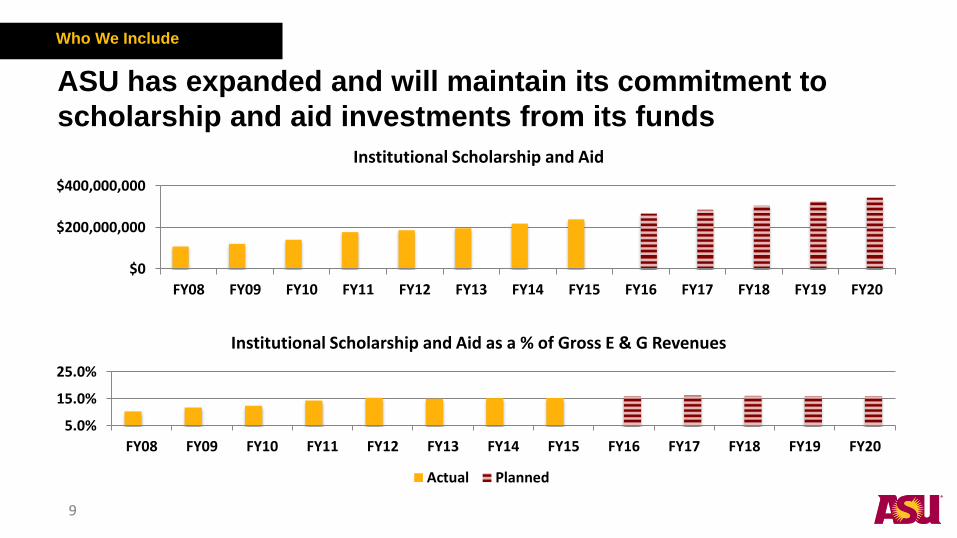
ASU has expanded and will maintain its commitment to
scholarship and aid investments from its funds
9
Who We Include
$0
$200,000,000
$400,000,000
FY08 FY09 FY10 FY11 FY12 FY13 FY14 FY15 FY16 FY17 FY18 FY19 FY20
Institutional Scholarship and Aid
5.0%
15.0%
25.0%
FY08 FY09 FY10 FY11 FY12 FY13 FY14 FY15 FY16 FY17 FY18 FY19 FY20
Institutional Scholarship and Aid as a % of Gross E & G Revenues
Actual Planned
How They Succeed
10
76.7% 76.8%
79.0% 78.5%
77.2%
79.5%
81.2%
84.0% 83.5%
80.0%
83.8%
84.1%
76.0%
78.0%
80.0%
82.0%
84.0%
86.0%
88.0%
90.0%
Cohort Year
Total Freshmen First Year Retention
78.0% 79.1%
80.8% 81.2%
80.4%
82.5%
84.3%
87.1% 86.9%
83.7%
86.2% 87.1%
76.0%
78.0%
80.0%
82.0%
84.0%
86.0%
88.0%
90.0%
Cohort Year
Arizona Freshmen First Year Retention
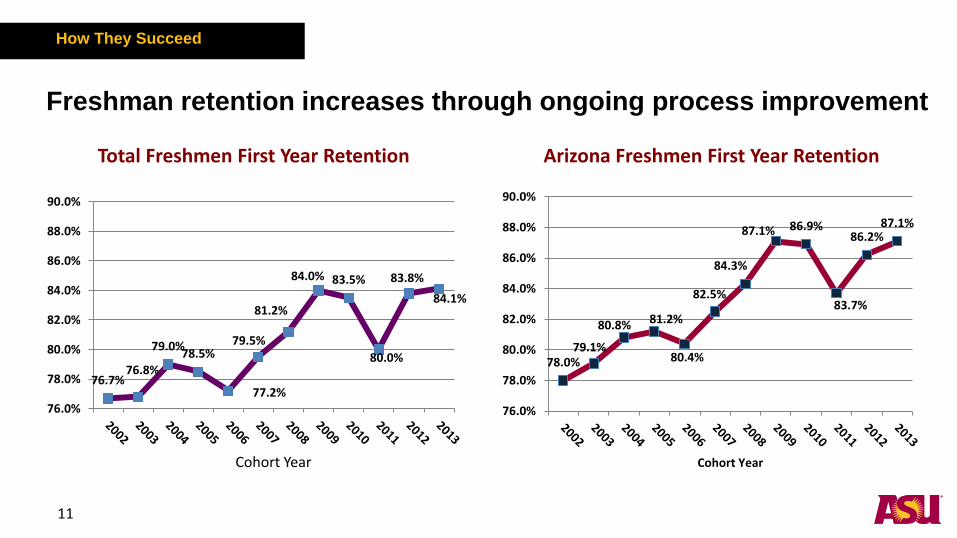
Freshman retention increases through ongoing process improvement
How They Succeed
11
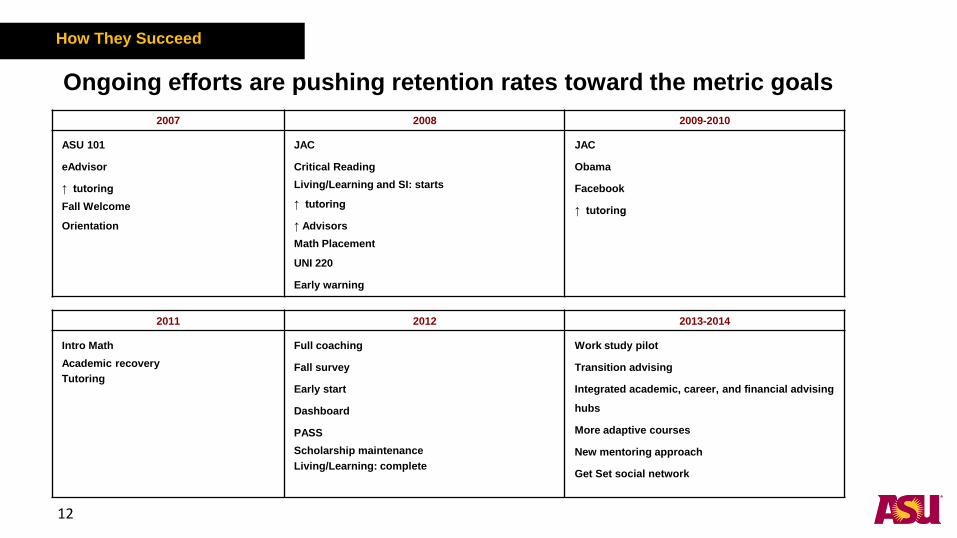
Ongoing efforts are pushing retention rates toward the metric goals
2007 2008 2009-2010
ASU 101
eAdvisor
↑ tutoring
Fall Welcome
Orientation
JAC
Critical Reading
Living/Learning and SI: starts
↑ tutoring
↑ Advisors
Math Placement
UNI 220
Early warning
JAC
Obama
↑ tutoring
2011 2012 2013-2014
Intro Math
Academic recovery
Tutoring
Full coaching
Fall survey
Early start
Dashboard
PASS
Scholarship maintenance
Living/Learning: complete
Work study pilot
Transition advising
Integrated academic, career, and financial advising
hubs
More adaptive courses
New mentoring approach
Get Set social network
12
How They Succeed
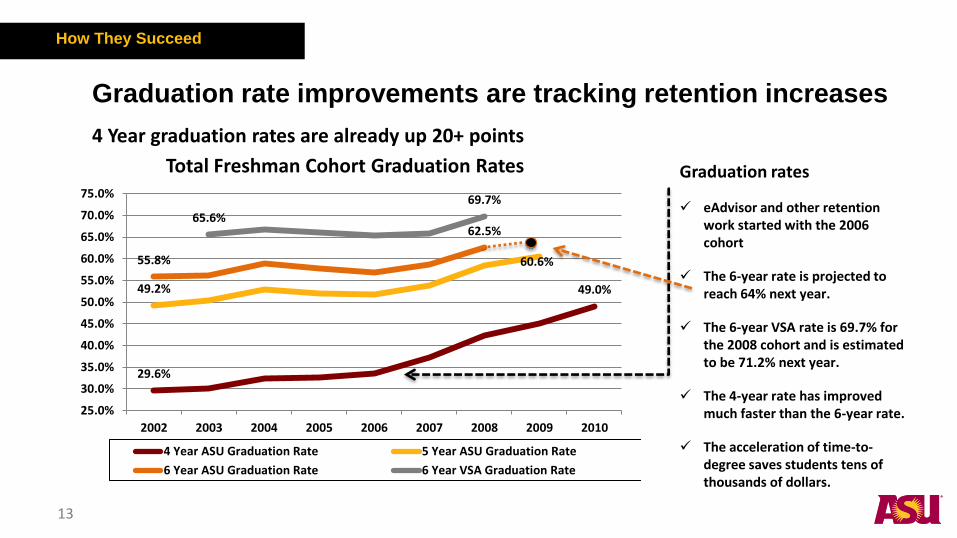
Graduation rate improvements are tracking retention increases
4 Year graduation rates are already up 20+ points
Graduation rates
eAdvisor and other retention work started with the 2006 cohort
The 6-year rate is projected to reach 64% next year.
The 6-year VSA rate is 69.7% for the 2008 cohort and is estimated to be 71.2% next year.
The 4-year rate has improved much faster than the 6-year rate.
The acceleration of time-to-degree saves students tens of thousands of dollars.
Total Freshman Cohort Graduation Rates
29.6%
49.0% 49.2%
60.6% 55.8%
62.5% 65.6%
69.7%
25.0%
30.0%
35.0%
40.0%
45.0%
50.0%
55.0%
60.0%
65.0%
70.0%
75.0%
2002 2003 2004 2005 2006 2007 2008 2009 2010
4 Year ASU Graduation Rate 5 Year ASU Graduation Rate
6 Year ASU Graduation Rate 6 Year VSA Graduation Rate
13
How They Succeed

Arizona students show the highest rates and the greatest
improvement Arizona Graduation Rates
28.4% 28.7% 31.0% 32.2%
34.2%
38.8%
43.6%
47.3% 50.7%
49.3% 51.2%
53.0% 53.2% 54.5% 56.9%
61.4% 63.8%
57.0% 58.1% 60.2% 60.3% 60.8%
62.5%
66.3%
25.0%
30.0%
35.0%
40.0%
45.0%
50.0%
55.0%
60.0%
65.0%
70.0%
2002 2003 2004 2005 2006 2007 2008 2009 2010
Fres
hm
an C
oh
ort
Gra
du
atio
n R
ate
Cohort Year
4-Year Graduation 5-Year Graduation 6-Year Graduation
14
X Purdue
49.2%
UT Austin 55.1%
X
Iowa State X 43.3%
How They Succeed
X 4-Years rates
at peers

ASU is achieving its targets for degree production
10,706 11,149 11,604 11,805 12,611 12,922 12,985 12,570 12,707 13,501 14,495 15,189 15,751
- 80 206 389 599 991 1,396 1,817 2,396
3,105 3,520 3,899 4,188
3,738 4,166 4,241 4,479 4,241 4,278 4,308 4,483 4,781 5,098
5,449 5,787
6,110
- 215 329 417 594 725 1,072 1,196
1,445 1,766
2,006 2,325
2,616
14,444 15,610 16,380 17,090
18,045 18,916 19,761 20,066 21,329
23,470 25,470
27,200 28,665
-
5,000
10,000
15,000
20,000
25,000
30,000
FY08 FY09 FY10 FY11 FY12 FY13 FY14 FY15 FY16 FY17 FY18 FY19 FY20
Undergraduate and Graduate Degrees Awarded Actual and Projected
UG Degrees Online UG Degrees Graduate Degrees Online Graduate Degrees Total
How They Succeed
15

ASU ranks 18th among Carnegie Doctoral Research Public
Universities
ASU Peer comparisons (low score is best)
Indiana U-BloomingtonU Iowa
Rutgers U-New BrunswickU Connecticut
Penn State UFlorida State U
U of ArizonaU Maryland-College ParkU Minnesota-Twin Cities
Michigan State UArizona State U
U Illinois Urbana-ChampaignU Texas Austin
Ohio State U-Main CampusU Wisconsin-MadisonU Washington-Seattle
U California-Los AngelesWashington Monthly’s rating
of national universities best
corresponds to the course set
by ASU, identifying three
categories for ratings:
• Scientific and
humanistic research
• Fostering social
mobility
• Promotion of
community service
Quality of Programs
16
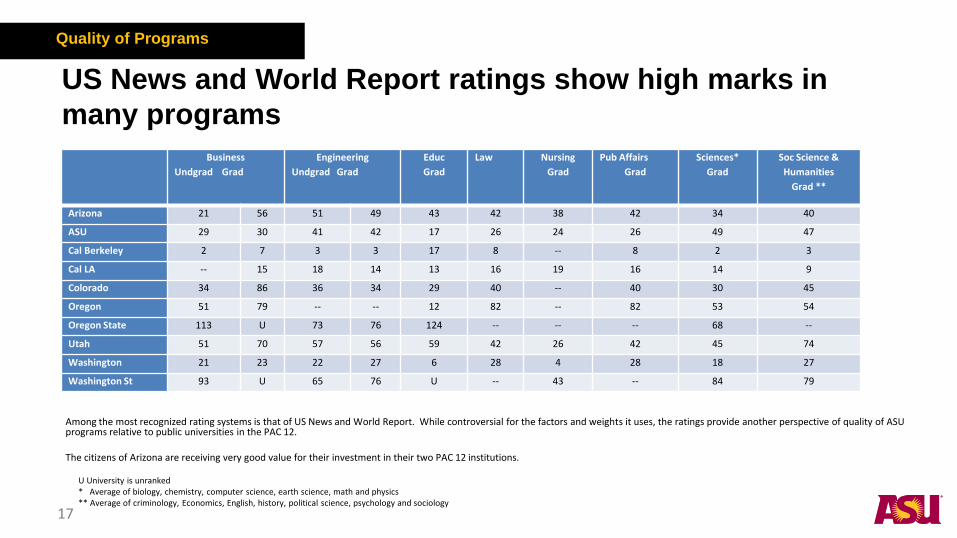
US News and World Report ratings show high marks in
many programs
Among the most recognized rating systems is that of US News and World Report. While controversial for the factors and weights it uses, the ratings provide another perspective of quality of ASU programs relative to public universities in the PAC 12. The citizens of Arizona are receiving very good value for their investment in their two PAC 12 institutions. U University is unranked * Average of biology, chemistry, computer science, earth science, math and physics ** Average of criminology, Economics, English, history, political science, psychology and sociology
Business
Undgrad Grad
Engineering
Undgrad Grad
Educ
Grad
Law Nursing
Grad
Pub Affairs
Grad
Sciences*
Grad
Soc Science &
Humanities
Grad **
Arizona 21 56 51 49 43 42 38 42 34 40
ASU 29 30 41 42 17 26 24 26 49 47
Cal Berkeley 2 7 3 3 17 8 -- 8 2 3
Cal LA -- 15 18 14 13 16 19 16 14 9
Colorado 34 86 36 34 29 40 -- 40 30 45
Oregon 51 79 -- -- 12 82 -- 82 53 54
Oregon State 113 U 73 76 124 -- -- -- 68 --
Utah 51 70 57 56 59 42 26 42 45 74
Washington 21 23 22 27 6 28 4 28 18 27
Washington St 93 U 65 76 U -- 43 -- 84 79
Quality of Programs
17

Pass rates in licensure exams significantly exceed
national averages • 100% of ASU Clinical Psychology graduates who sat for the exam passed.
• 60% pass rate on the CPA exam. (National average is 48.2%)
• 86% of ASU graduates pass the Arizona bar the first time (statewide average is 80%)
• Nursing licensure examination rates exceed the national average in all categories (NCLEX = 92%; Adult Nurse Practitioner =
92%; Pediatric Nurse Practitioner = 93%; Family Nurse Practitioner = 95%; Adult Psychiatric Nurse Practitioner = 100%), all
exceeding the national standard of 80%.
• 94% of ASU's graduates of the Mary Lou Fulton Teachers College passed the state teacher certification test last year.
• 100% of In the School of ASU dietetics program pass the National Examination for Registered Dieticians in 2013 (national
average is 79%).
• Over 90% of graduates of the MAS degree in Marriage and Family Therapy in The Sanford School who have taken the
AMFTRB exam pass.
• 96% pass the National Counseling Exam on their first try. The average score of ASU's graduates is 1.5-2 standard deviations
above the national average.
Quality of Programs
18

Quality and Competiveness
19

72.8
64.4 64.7 64.3 64.1
58
60
62
64
66
68
70
72
74
ASU Gallup Study National GPI Public Universities Large, Public Universities(>10,000)
Private Universities
ASU Gallup Study-Alumni Full-time Employment
ASU alumni – recent and past -- enjoy employment rates that are superior to national averages and peers
20
How They Succeed

ASU Gallup Study-Alumni Sense of Social Well-Being
0
10
20
30
40
50
60
Purpose Social Financial Community Physical
Arizona State University % National GPI % Public University %
Large Public University % Private University %21
How They Succeed

ASU Gallup Study-Alumni Engagement at Work
47.4
39.4 39.2
29.7
39.9
0
5
10
15
20
25
30
35
40
45
50
Arizona State University % National GPI % Public University % Large Public University % Private University %
22
How They Succeed

Advancing Research
23
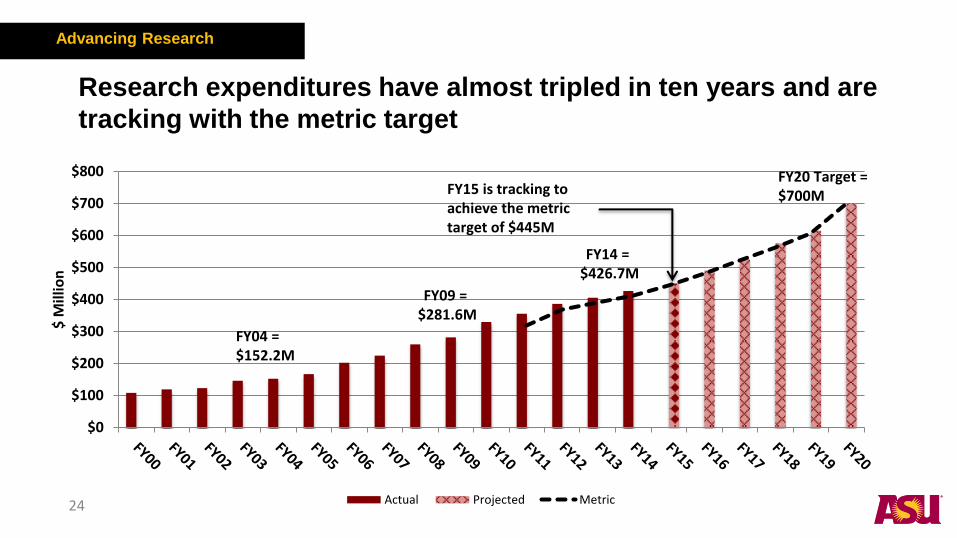
Research expenditures have almost tripled in ten years and are
tracking with the metric target
$0
$100
$200
$300
$400
$500
$600
$700
$800
$ M
illio
n
Actual Projected Metric
FY14 = $426.7M
FY09 = $281.6M
FY04 = $152.2M
FY20 Target = $700M FY15 is tracking to
achieve the metric target of $445M
Advancing Research
24

The key to increasing funded research is increasing proposals
0.92 0.82
1.03 1.05
1.37
1.61
1.18
1.36 1.25
1.78
$0.0
$0.2
$0.4
$0.6
$0.8
$1.0
$1.2
$1.4
$1.6
$1.8
$2.0
2005 2006 2007 2008 2009 2010 2011 2012 2013 2014
Billi
on
s
Total Value of ASU Proposals by Calendar Year
ARRA No ARRA Yes
Advancing Research
25
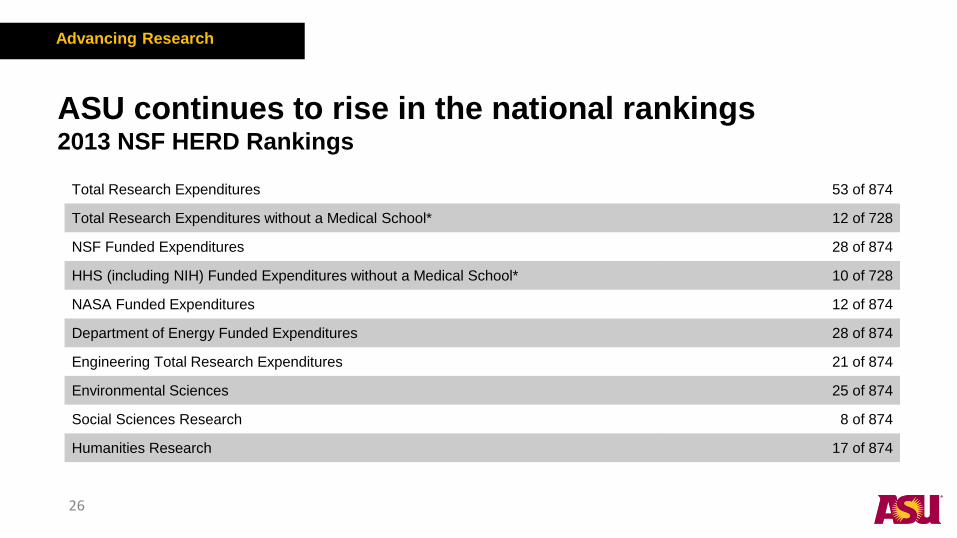
ASU continues to rise in the national rankings 2013 NSF HERD Rankings
Total Research Expenditures 53 of 874
Total Research Expenditures without a Medical School* 12 of 728
NSF Funded Expenditures 28 of 874
HHS (including NIH) Funded Expenditures without a Medical School* 10 of 728
NASA Funded Expenditures 12 of 874
Department of Energy Funded Expenditures 28 of 874
Engineering Total Research Expenditures 21 of 874
Environmental Sciences 25 of 874
Social Sciences Research 8 of 874
Humanities Research 17 of 874
Advancing Research
26
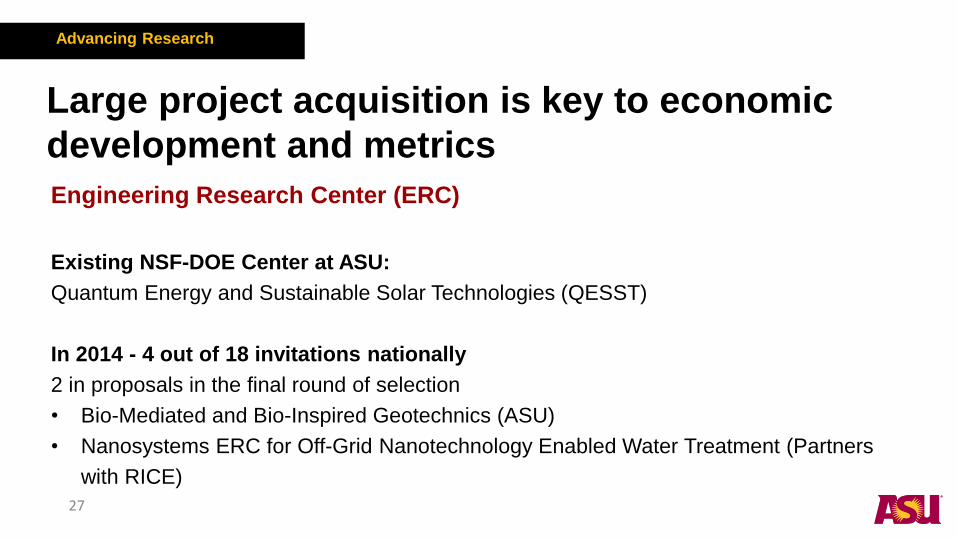
Engineering Research Center (ERC)
Existing NSF-DOE Center at ASU:
Quantum Energy and Sustainable Solar Technologies (QESST))
In 2014 - 4 out of 18 invitations nationally
2 in proposals in the final round of selection
• Bio-Mediated and Bio-Inspired Geotechnics (ASU)
• Nanosystems ERC for Off-Grid Nanotechnology Enabled Water Treatment (Partners
with RICE)
Advancing Research
Large project acquisition is key to economic
development and metrics
27

International projects are an important new
emphasis
PCASE Program
The Partnership Center for Advanced Studies in Energy (PCASE)
Designed to jumpstart training, research and innovation in renewable energy in
Pakistan
• USAID funded centers ($48M)
• ASU coordinated and managed program development
• National University of Sciences and Technologies (NUST, Islamabad)
• University of Engineering and Technology (CET-Peshawar)
Advancing Research
28

Age
57 53 49 45 41 37 33 29 25 61
$160,000
$140,000
$120,000
$100,000
$80,000
$60,000
$40,000
$20,000
0
$180,000 E
arn
ing
s
Professional degree
Doctoral degree
Master’s degree
Bachelor’s degree
Associate degree
Some college
High school
Mean Earnings by Age
2009 American Community Survey (ARC) Integrated Public Use Micro Sample
29

Educational Attainment and Public Assistance
Pe
rcen
tage P
art
icip
atin
g
0%
10%
20%
30%
40%
50% 43%
24%
19% 17%
9%
22%
11% 9% 7%
2%
24%
12% 10%
7%
2%
Medicaid School Lunches SNAP
Less than a
High School Diploma High School Diploma Some college,
No degree Associate Degree Bachelor’s degree
or higher
Percentage of individuals 25 and older living in households participating in selected public
assistance programs by education level
Education Pays 2013: The Benefits of Higher Education for Individuals and Society, College Board 30

60%
70%
80%
90%
100%
110%
120%
1997 1999 2001 2003 2005 2007 2009 2011 2013
Per Capita GDP Relative to US Average
Arizona
Colorado
Nevada
New Mexico
Oregon
Utah
Washington
31

-20%
-10%
0%
10%
20%
30%
40%
50%
4% 8% 12% 16% 20% 24% 28% 32%
Pe
rce
nt
Inc
rea
se
in
Pe
r
Ca
pit
a G
DP, 2
00
0-1
0
Change in Percent of 25 Year or Older Having Attained a Bachelors Degree or Higher, 2000-10
Relationship between Change in Educational Attainment and Economic Development in US States, 2000-2010
Data Sources: US Census Bureau,
North Dakota
Arizona
Utah
South Dakota
32

Responsibility to the
Community
33

Higher education needs to be available to all Arizonans
Responsibility to the Community
34

0
10
20
30
40
50
60
70
MA
SD
NJ
MN
ND
CT IA NE
NH
WI
PA
VA
NY
KS RI
MA
OH
MS
MO IN NC
AR
DE
US HI
CO
CA IL
TN
AL
MI
WV
GA
KY
NM
ME
WY
OK
SC
UT
VT
MT
TX
LA
FL ID
WA
AZ
OR
AK
DC
NV
Percentage of All Youths Enrolling in Postsecondary Education
Responsibility to the Community
35

ASU Prep Academy demonstrates that all students can
succeed
Phoenix K-12 (Downtown Phoenix)
• 76% of students qualify for free or reduced lunch
• Was inherited as a “failing” school; is now rated B
Polytechnic K-12 (Mesa)
• A rated
Graduation Results
• 100% of its first senior class will graduate in June
• 72% have been accepted at a four-year university
• 92% have been accepted at a college or university: average rate of graduating Arizona seniors is 54%
36
Responsibility to the Community

ASU Prep Academy demonstrates that all students can
succeed
0
20
40
60
80
100
2009–2010 2010–2011 2011–2012 2012–2013 2013–2014
ASU Prep Academy % of Students with a Passing Score on AIMS Reading Tests
Poly K-8 Phoenix K-8 State K-8 Poly HS Phx HS State HS
37
Responsibility to the Community

0
10
20
30
40
50
60
70
80
90
100
2009–2010 2010–2011 2011–2012 2012–2013 2013–2014
Poly K-8 Phoenix K-8 State K-8 Poly HS Phx HS State HS
ASU Prep Academy % of Students with a Passing Score AIMS Math Tests
38
Responsibility to the Community
ASU Prep Academy demonstrates that all students can
succeed

Enterprise Plan Review
39

Enterprise and Charter in the 21st Century
Public University
The goals of the Charter are not conditional.
ASU’s responsibilities under the Charter are not conditional.
The declining willingness of the State to invest in higher education does not mean that the need for public universities has decreased. In fact, 21st century advancement requires greater higher educational attainment than in previous generations.
An enterprise model is the only pathway to fulfilling the Charter.
40
ASU as Enterprise
ASU takes responsibility for finding the means to accomplish
all aspects of its Charter.
The ASU enterprise model requires obtaining resources from
a wide range of sources, developing the means for highly-
efficient and highly effective program delivery, and creating
partnerships of mutual benefit with like-minded public and
private entities, while respecting its public purpose and its
responsibilities to the citizens of Arizona.
41

The Charter, the Enterprise Plan and the
ABOR 2020 Metrics
ABOR’s metrics for performance were outlined in 2010 in the Vision 2020 plan.
The metrics provide the formal and measurable goals for ASU’s performance and are entirely consistent with its Charter.
The enterprise plan was developed as a means of achieving the metric targets.
The Enterprise plan changes motivated by the public disinvestment may impact the speed at which targets will be achieved. 42

ASU’s Strategic Enterprise Plan
The principal elements of the enterprise plan have been consistent for five years
• First presented in January 2010
• Updates presented in February 2011, February 2012, February 2013, and February 2014
ASU has been operating under the elements of the plan that have been presented and approved.
Alternations are now needed. 43
The ASU Enterprise Plan: Goals
1. Provide capacity (with quality) to enroll all qualified Arizona residents in all programs of interest
2. Modest and predictable resident tuition increases
3. Maximize educational quality, graduation performance and student outcomes
4. Achieve ABOR metrics in research areas
5. Maintain cost effective program delivery
44

ASU Share of Degree and Enrollment Metrics
0% 10% 20% 30% 40% 50% 60% 70%
NAU
UA
ASU
Share of Bachelor Degrees
2020 metric share Fall 14 share
0% 10% 20% 30% 40% 50% 60% 70%
NAU
UA
ASU
Share of Master's Degrees
2020 metric share Fall 14 share
0% 10% 20% 30% 40% 50% 60%
NAU
UA
ASU
Share of Undergraduate Enrollment
2020 metric share Fall 14 share
0% 10% 20% 30% 40% 50% 60%
NAU
UA
ASU
Share of Total Enrollment
2020 metric share Fall 14 share
45

ASU has been able to implement a predictable low tuition
plan since FY12
30.3%
46.1% 42.1%
4.5% 3.0% 3.0%
6.2% 6.8%
0.0%
5.0%
10.0%
15.0%
20.0%
25.0%
30.0%
35.0%
40.0%
45.0%
50.0%
FY05 to FY07Actual
FY08 to FY10Actual
FY11 to FY13Actual
FY14 to FY16Proposed
FY17 to FY19Range
FY20 to FY22Range
Resident UG Tuition Rate Increases
Higher range
Projected
Actual
46
Resident Undergraduate Tuition

Total tuition and fee increases have been $435 over the
last 3 years
$0
$200
$400
$600
$800
$1,000
$1,200
$1,400
$1,600
$1,800
FY00 FY01 FY02 FY03 FY04 FY05 FY06 FY07 FY08 FY09 FY10 FY11 FY12 FY13 FY14 FY15 FY16 FY17 FY18 FY19 FY20
Annual Resident Undergraduate Tuition Increases
New Resident UG tuition & fees (actual) New Resident UG tuition and fees (goal)
New Resident UG tuition and fees (high)
47
Resident Undergraduate Tuition

Enterprise Plan: Resources
1. Build new enrollments with tuition at market rates
2. Build total enrollments via improved retention
3. Grow ASU Online
4. Grow new educational modalities
5. Stabilize state investment and gain some performance-based funding
6. Leverage partnerships
Many resource strategies also provide opportunities to develop improved educational services for our students
48

30,000
32,500
35,000
37,500
40,000
42,500
45,000
47,500
50,000
52,500
55,000
2002 2003 2004 2005 2006 2007 2008 2009 2010 2011 2012 2013 2014 2015 2016 2017 2018 2019 2020
To
tal R
esid
en
t U
G E
nro
llm
en
t
Total Resident Undergraduate Fall Enrollment Actual and Modeled Results
Actual Resident UG Modeled Goal
49
Resident Enrollment
Growth has resumed after the recessionary downturn
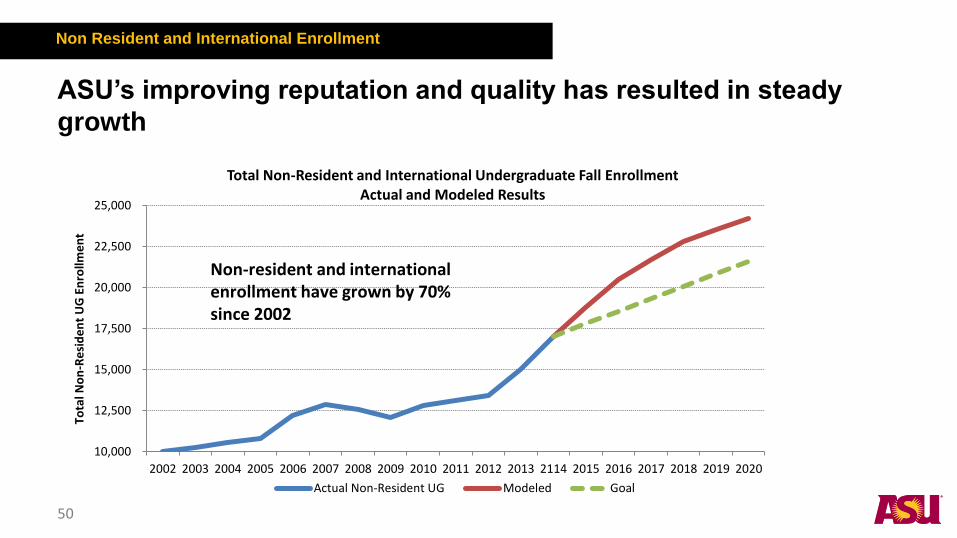
ASU’s improving reputation and quality has resulted in steady
growth
10,000
12,500
15,000
17,500
20,000
22,500
25,000
2002 2003 2004 2005 2006 2007 2008 2009 2010 2011 2012 2013 2114 2015 2016 2017 2018 2019 2020
Tota
l No
n-R
esi
de
nt
UG
En
rollm
en
t
Total Non-Resident and International Undergraduate Fall Enrollment Actual and Modeled Results
Actual Non-Resident UG Modeled Goal
Non-resident and international enrollment have grown by 70% since 2002
50
Non Resident and International Enrollment

Enrollment will reach 17,000 students in FY16
- 294 894 1,655 3,314
5,016 7,026
9,200
12,701 14,621
16,481 18,038 19,072
-
700 932 1,368
1,780
2,428
2,933
3,575
4,661
5,399
6,515
7,627 8,722
-
994 1,826 3,023
5,094
7,444
9,959
12,775
17,362
20,020
22,996
25,665
27,794
-
5,000
10,000
15,000
20,000
25,000
30,000
FY08 FY09 FY10 FY11 FY12 FY13 FY14 FY15 FY16 FY17 FY18 FY19 FY20
ASU Online Headcount Enrollment )Actual and Projected)
Online UG Heads Online Grad Heads Total
Note: Starbucks College Achievement Plan enrollments are not included in the headcounts
51
ASU Online

33% 41%
34% 29% 26% 24%
38% 30%
31% 34% 36% 38%
15% 14%
13% 13% 13% 13%
14% 10%
14% 12% 11% 11%
5% 8% 12% 14% 15%
0%
10%
20%
30%
40%
50%
60%
70%
80%
90%
100%
FY08: $.5B FY12: $.80B FY14: $1.0B FY16: $1.2B FY18: $1.4B FY20: $1.6B
Revenue Sources: Gross Tuition and Fees
ASUOnline(gross)
Fees and summersession
Graduate tuition
Non-Resident UGtuition
Resident UGtuition
52

47%
25% 23% 18% 16% 14%
4% 6%
15%
28% 24%
22% 19% 18%
17%
20%
21%
25% 27% 28%
7%
9%
9% 10% 10% 10%
7% 7%
10% 9% 8% 8%
4% 6% 9% 10% 11%
7% 7% 8% 7% 6% 6%
0%
10%
20%
30%
40%
50%
60%
70%
80%
90%
100%
FY08: $1.1B FY12: $1.2B FY14: $1.4B FY16: $1.6B FY18: $1.9B FY20: $2.1B
Education & General Revenue Sources Total other
ASU Online tuition(gross)
Total fees andsummer session
Graduate tuition
Non-Resident UGtuition
Resident UG tuition
Shortfall
General Fund
53

35%
19% 17% 13% 11% 10%
3% 4%
12%
20% 18%
16% 14% 12%
13%
14% 16%
19% 19% 20%
5%
7% 7% 7% 7% 7%
5%
5% 7% 7% 6% 6%
0% 3% 4% 7% 8%
8%
0% 0% 0% 1% 1% 2%
5% 4% 5%
5% 5% 5%
3% 4% 3% 3% 3% 3%
10% 6% 7% 7% 6% 6%
10% 17% 14% 14% 15% 17%
0%
10%
20%
30%
40%
50%
60%
70%
80%
90%
100%
FY08: $1.4B FY12: $1.7B FY14: $1.9B FY16: $2.2B FY18: $2.6B FY20: $3.0B
Gross Revenue Sources: All Funds
Research including F&A(external only)**TRIF**
Auxiliary *
Gifts *
Other E&G sources
New revenue sources
Online tuition (gross)
Fees and summersessionGraduate tuition
Non-Resident UGtuitionResident UG tuition
Shortfall
State appropriations
54

Enterprise Plan: Cost Effectiveness
Resources per degree at low end of the public universities
Employees per student ratio at the low end of public universities
Leadership in application of technology to improved educational effectiveness with lower costs
Leadership in innovative organizational structure
Intensive facility use
55
$0
$20,000
$40,000
$60,000
$80,000
$100,000
$120,000
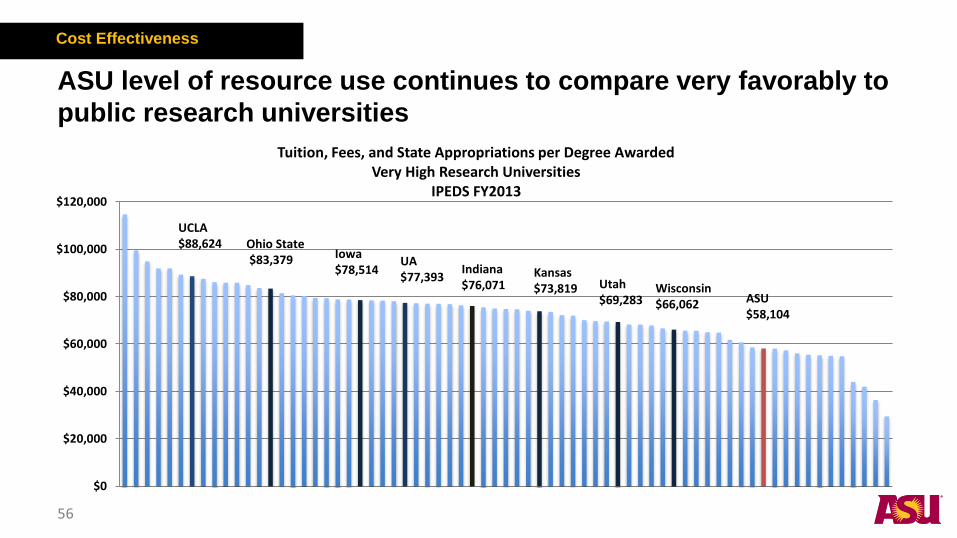
Tuition, Fees, and State Appropriations per Degree Awarded Very High Research Universities
IPEDS FY2013
UA $77,393
ASU $58,104
UCLA $88,624 Ohio State
$83,379
Utah $69,283
Indiana $76,071
Iowa $78,514
Wisconsin $66,062
Kansas $73,819
ASU level of resource use continues to compare very favorably to
public research universities
56
Cost Effectiveness
-
20,000
40,000
60,000
80,000
100,000
120,000
140,000
Ru
tge
rs
Pu
rdu
e
NC
Sta
te
Ge
org
ia…
UC
…
Ne
bra
ska
ND
Sta
te UC
…
LSU
Ind
ian
a
Um
ass
Iow
a St
ate
UI u
rban
a
VP
I
Mo
nt…
Mar
ylan
d
Ge
org
ia
UC
San
ta…
Ark
ansa
s
Ore
gon
…
Mis
s St
ate
Texa
s…
UC
San
ta…
WSU
Ore
gon
Okl
aho
ma
Co
lora
do
ASU
Texa
s
AL…
Ho
ust
on
Alb
any
GSU
CSU
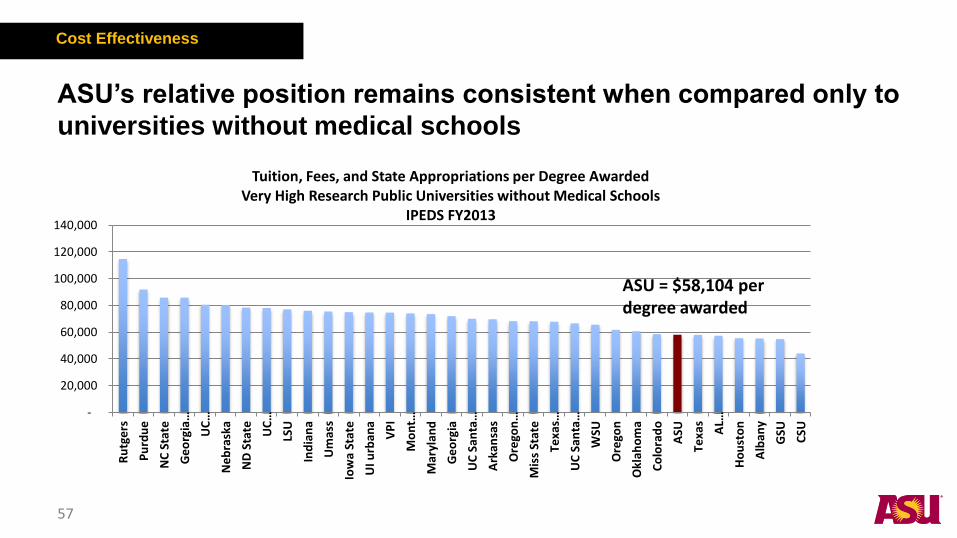
Tuition, Fees, and State Appropriations per Degree Awarded Very High Research Public Universities without Medical Schools
IPEDS FY2013
ASU = $58,104 per degree awarded
ASU’s relative position remains consistent when compared only to
universities without medical schools
57
Cost Effectiveness

ASU’s revenue per degree has consistently been at the low end
among research universities
$54,670 $55,101 $59,023
$62,730
$67,180 $68,048
$61,773 $61,163 $61,912 $59,934
$58,104
$76,955 $76,317 $74,893 $75,691 $79,790 $81,335
$77,898 $76,544 $75,582 $71,628
$74,791
$30,000
$40,000
$50,000
$60,000
$70,000
$80,000
$90,000
FY03 FY04 FY05 FY06 FY07 FY08 FY09 FY10 FY11 FY12 FY13
Tuition, Fees, and State Appropriations per Degree Awarded ASU and Median of Very High Research Universities
FY03 to FY13 IPEDS in Constant FY13 Dollars
ASU
Very High MedianASU used 22% less in resources per degree produced than the median of similar universities nationally. ASU’s use is 15% lower in constant dollars than at the FY08 high point in funding.
58
Cost Effectiveness

-
5,000
10,000
15,000
20,000
25,000
30,000
35,000
Tuition, Fees, and State Appropriations per FTE Student Very High Research Public Universities
IPEDS FY2013
UA $19,212
ASU $16,093
UCLA $26,006
Utah $18,349
Wisconsin $21,295
Colorado $16,762
Washington $22,609
Per FTE measurements are less valid measures since they measure input and not results, but ASU remains at the low end of universities
59
Cost Effectiveness

-
5,000
10,000
15,000
20,000
25,000
30,000
Ru
tge
rs UC
…
NC
Sta
te
Mar
ylan
d
Pu
rdu
e
Ge
org
ia…
Ind
ian
a
UC
…
Ge
org
ia
Ne
bra
ska
Um
ass
UC
…
UI u
rban
a
UC
…
VP
I
Texa
s…
ND
Sta
te
Iow
a…
LSU
Alb
any
Co
lora
do
Okl
aho
ma
Texa
s
Ore
gon
WSU
ASU
Ark
ansa
s
AL…
Mis
s St
ate
Ore
gon
…
Mo
nt…
Ho
ust
on
GSU
CSU
Tuition, Fees, and State Appropriations per FTE Student Very High Research Public Universities without Medical Schools
IPEDS FY2013
ASU = $16,093 per FTE
Similar results are seen in per FTE resources compared to
publics without medical schools
60
Cost Effectiveness
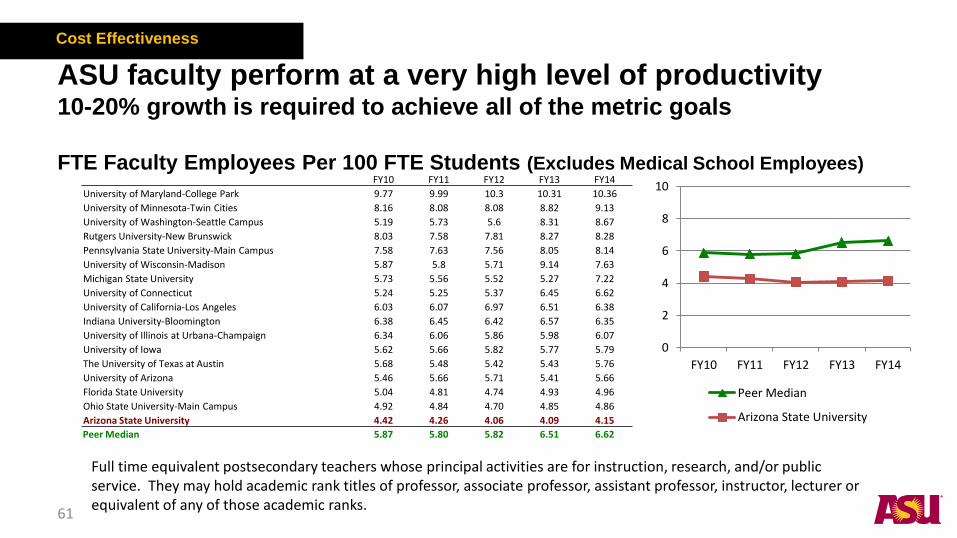
ASU faculty perform at a very high level of productivity 10-20% growth is required to achieve all of the metric goals
FTE Faculty Employees Per 100 FTE Students (Excludes Medical School Employees)
Full time equivalent postsecondary teachers whose principal activities are for instruction, research, and/or public service. They may hold academic rank titles of professor, associate professor, assistant professor, instructor, lecturer or equivalent of any of those academic ranks.
61
FY10 FY11 FY12 FY13 FY14
University of Maryland-College Park 9.77 9.99 10.3 10.31 10.36
University of Minnesota-Twin Cities 8.16 8.08 8.08 8.82 9.13
University of Washington-Seattle Campus 5.19 5.73 5.6 8.31 8.67
Rutgers University-New Brunswick 8.03 7.58 7.81 8.27 8.28
Pennsylvania State University-Main Campus 7.58 7.63 7.56 8.05 8.14
University of Wisconsin-Madison 5.87 5.8 5.71 9.14 7.63
Michigan State University 5.73 5.56 5.52 5.27 7.22
University of Connecticut 5.24 5.25 5.37 6.45 6.62
University of California-Los Angeles 6.03 6.07 6.97 6.51 6.38
Indiana University-Bloomington 6.38 6.45 6.42 6.57 6.35
University of Illinois at Urbana-Champaign 6.34 6.06 5.86 5.98 6.07
University of Iowa 5.62 5.66 5.82 5.77 5.79
The University of Texas at Austin 5.68 5.48 5.42 5.43 5.76
University of Arizona 5.46 5.66 5.71 5.41 5.66
Florida State University 5.04 4.81 4.74 4.93 4.96
Ohio State University-Main Campus 4.92 4.84 4.70 4.85 4.86
Arizona State University 4.42 4.26 4.06 4.09 4.15
Peer Median 5.87 5.80 5.82 6.51 6.62
0
2
4
6
8
10
FY10 FY11 FY12 FY13 FY14
Peer Median
Arizona State University
Cost Effectiveness
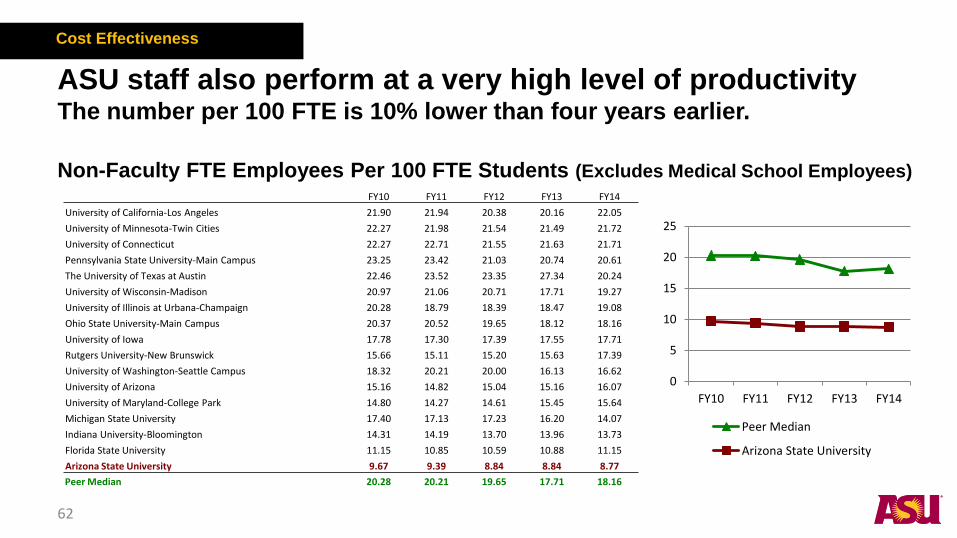
ASU staff also perform at a very high level of productivity The number per 100 FTE is 10% lower than four years earlier.
Non-Faculty FTE Employees Per 100 FTE Students (Excludes Medical School Employees)
62
FY10 FY11 FY12 FY13 FY14
University of California-Los Angeles 21.90 21.94 20.38 20.16 22.05
University of Minnesota-Twin Cities 22.27 21.98 21.54 21.49 21.72
University of Connecticut 22.27 22.71 21.55 21.63 21.71
Pennsylvania State University-Main Campus 23.25 23.42 21.03 20.74 20.61
The University of Texas at Austin 22.46 23.52 23.35 27.34 20.24
University of Wisconsin-Madison 20.97 21.06 20.71 17.71 19.27
University of Illinois at Urbana-Champaign 20.28 18.79 18.39 18.47 19.08
Ohio State University-Main Campus 20.37 20.52 19.65 18.12 18.16
University of Iowa 17.78 17.30 17.39 17.55 17.71
Rutgers University-New Brunswick 15.66 15.11 15.20 15.63 17.39
University of Washington-Seattle Campus 18.32 20.21 20.00 16.13 16.62
University of Arizona 15.16 14.82 15.04 15.16 16.07
University of Maryland-College Park 14.80 14.27 14.61 15.45 15.64
Michigan State University 17.40 17.13 17.23 16.20 14.07
Indiana University-Bloomington 14.31 14.19 13.70 13.96 13.73
Florida State University 11.15 10.85 10.59 10.88 11.15
Arizona State University 9.67 9.39 8.84 8.84 8.77
Peer Median 20.28 20.21 19.65 17.71 18.16
0
5
10
15
20
25
FY10 FY11 FY12 FY13 FY14
Peer Median
Arizona State University
Cost Effectiveness

Service partnerships are important elements in controlling
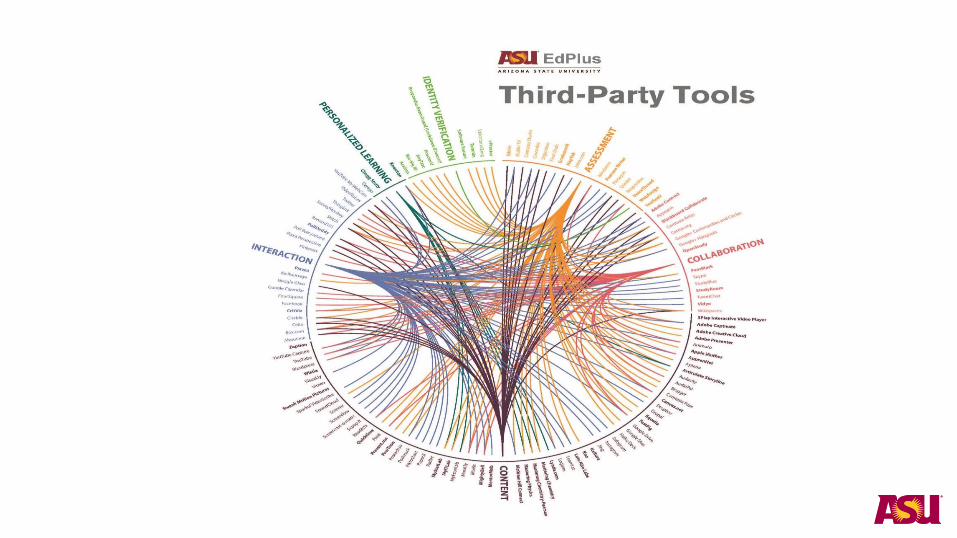
costs and providing high quality service
Numerous educational technology partner provide tools for curricular development
Online services provided by Pearson
Public-private partnerships deliver state-of-the art student housing without ASU capital investment
Jointly managed help desk support with Blackboard
Privately-capitalized and constructed solar power plants producing almost 25MW of electricity on campus
Management services agreements providing bookstore management, custodial services, food service, event management, data center support, and other functions cost-effectively.
63
Cost Effectiveness

Why Changes to the
Enterprise Plan are
Needed
65
Why Do We Need to Modify the Enterprise Plan? State resources had been a moderate but crucial component of the prior plan.
The plan assumed a stable base post the 2009-2012 reductions with adjustments due to parity. This was accomplished.
The plan assumed modest additional growth due to performance
($75 million over five years).
FY16 reduction reversed the entire parity adjustment ($45M) plus and additional $8M
Can no longer assume stable, modestly increasing State investment, and must find new pathways to preserve low tuition/high aid predictability
66
The ASU Enterprise Plan
Resource investment needs do not change
Teaching resources to properly support growth in enrollment demand
Faculty and facilities to achieve research growth and diversification
Technology to advance cost-effective teaching and retention
improvements
Investments in financial aid to assure affordability
67
The ASU Enterprise Plan
0.0%
20.0%
40.0%
60.0%
80.0%
100.0%
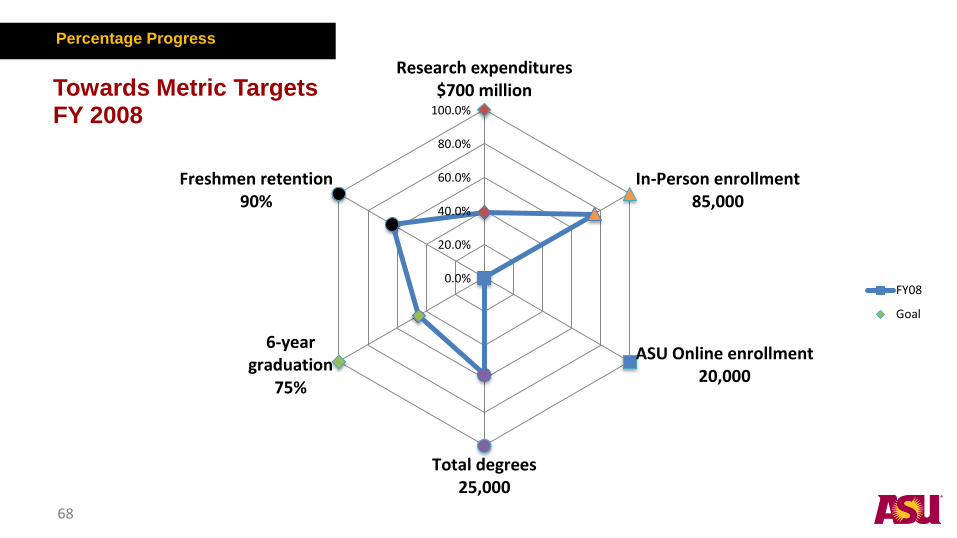
Research expenditures$700 million
In-Person enrollment85,000
ASU Online enrollment20,000
Total degrees25,000
6-yeargraduation
75%
Freshmen retention90%
Towards Metric Targets FY 2008
FY08
Goal
68
Percentage Progress

0.0%
20.0%
40.0%
60.0%
80.0%
100.0%
Research expenditures$700 million
In-Person enrollment85,000
ASU Online enrollment20,000
Total degrees25,000
6-yeargraduation
75%
Freshmen retention90%
Towards Metric Targets FY2014
FY08
FY14
Goal
69
Percentage Progress
0.0%
20.0%
40.0%
60.0%
80.0%
100.0%
Research expenditures$700 million
In-Person enrollment85,000
ASU Online enrollment20,000
Total degrees25,000
6-yeargraduation
75%
Freshmen retention90%
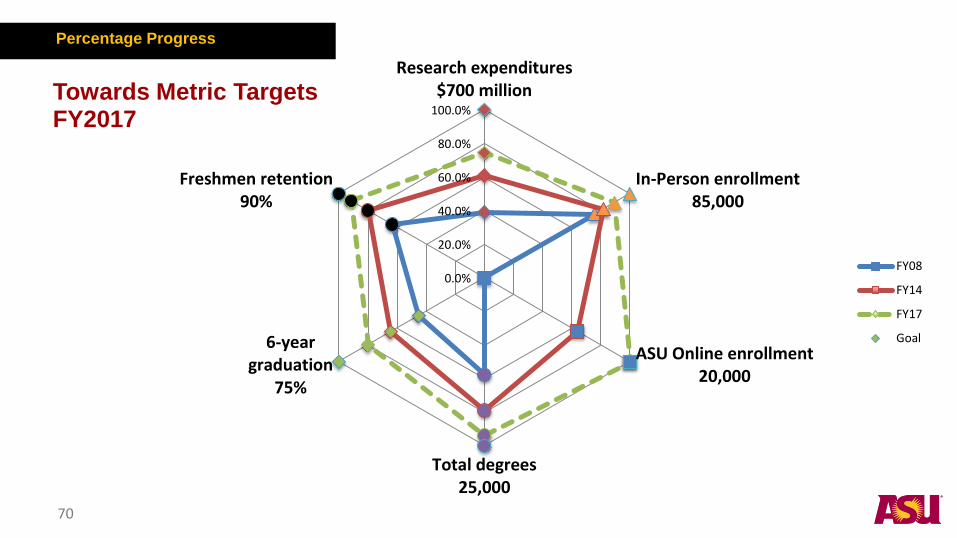
Towards Metric Targets FY2017
FY08
FY14
FY17
Goal
70
Percentage Progress

0.0%
20.0%
40.0%
60.0%
80.0%
100.0%
Research expenditures$700 million
In-Person enrollment85,000
ASU Online enrollment20,000
Total degrees25,000
6-yeargraduation
75%
Freshmen retention90%
Towards Metric Targets FY 2020
FY08
FY14
FY17
FY20
Goal
71
Percentage Progress

Achieving the Metrics: FY16 to FY20
Planned growth in FTE students:
• 13,000 in immersion programs (18%)
• 11,000 in online programs (120%)
Planned growth in annual degrees awarded
• 4,800 in immersion programs (28%)
• 3,800 in online programs (125%)
Planned growth in research expenditures
• $100 million in base programs (25%)
• $150 million in new centers and collaborative projects (200%)
Required growth is the rough
equivalent of growing a new
research university the size of
the University of California at
Riverside
72
The ASU Enterprise Plan

-
20,000
40,000
60,000
80,000
100,000
Fall 07 Fall 08 Fall 09 Fall 10 Fall 11 Fall 12 Fall 13 Fall 14 Fall 15 Fall 16 Fall 17 Fall 18 Fall 19 Fall 20
Total Enrollment: Actual and Projected vs. Metric Target
Total UG Actual Graduate Actual Projected Projected Metric
7,000
10,000
13,000
16,000
19,000
22,000
25,000
28,000
2007/08 2008/09 2009/10 2010/11 2011/12 2012/13 2013/14 2014/15 2015/16 2016/17 2017/18 2018/19 2019/20
Total Degrees: Actual and Projected vs. Metric Target
Total UG Actual Total Graduate Actual Projected Projected Metric
73
New investments needed by 2020 to reach the metrics
Supporting access and affordability
• Planned growth in financial aid to maintain access ($100M)
• Represents approximately 20% of gross tuition growth
Supporting quality educational outcomes
• 500 new faculty to support higher enrollment ($95M)
• A weighted hiring rate of one per 30-35 new FTE students
• Modest salary pools to retain faculty and staff ($115M)
• Information technology enhancements ($15M)
• Modest new construction and renovation/upgrading of existing facilities ($200M to $250M)
74
The ASU Enterprise Plan
New investments needed by 2020 to reach the metrics
Expanding research of public value
• Faculty expansion (within the previous number)
• Equipment and other start-up costs (annual new investment $15M)
• New lab facilities- (debt services and O&M on $350M to $450M of new construction)
Meeting externally-determined costs
• Benefits, utilities, inflation ($35M)
Maintaining the physical plant and IT infrastructure
• Minimum of $150M needed over 5 years
75
The ASU Enterprise Plan

What does the state disinvestment mean in terms of the financial plan? We cannot responsibly make the needed investments to achieve our charter without some replacement of the losses.
Recent actual increases in net assets are in the range of 4% to 7% of revenue. This is a modest but responsible level to maintain balance sheet strength, ensuring a healthy credit rating and and the ability to withstand financial volatility
Without the FY16 cut of $53M and the elimination of the previously modeled performance funding, the FY2020 net asset increases would remain in that healthy range.
76
The ASU Enterprise Plan

Attachment A UNIVERSITY OPERATING BUDGET
FY 2012-‐2014 ACTUAL WITH PROJECTIONS THROUGH FY 2020 ($ millions)
NOT FINAL -‐-‐ DOES NOT REFLECT CHANGES NEEDED IN THE ASU STRATEGIC ENTERPRISE PLAN
Revenues
State General Fund Appropriation
State Appropriation -‐ Research Infrastructure
Tuition and Fees
less Scholarship Allowance
Net Tuition and Fees
Grants & Contracts -‐-‐ Research
Financial Aid Grants (Primarily Pell Grants)
Private Gifts
Technology & Research Initiative Fund (TRIF)
Auxiliary Revenues, Net
Other Revenues
Total Revenues
Expenses
Salaries and Wages
Benefits
All Other Operating
Scholarships & Fellowships, Net of Scholarship
Depreciation
Interest on Indebtedness
Total Expenses
Net Increase (Decrease)
77
ACTUAL PROJECTED
FY 2012 FY 2013 FY 2014 FY 2015 FY 2016 FY 2017 FY 2018 FY 2019 FY 2020
$ 307.7 $ 297.4 $ 314.5 $ 338.0 $ 284.7 $ 284.7 $ 284.7 $ 284.7 $ 284.7
14.5 14.5 14.5 14.0 11.4 11.1 13.4 13.4 13.4
952.6 1,005.8 1,117.9 1,257.8 1,455.5 1,562.4 1,689.5 1,806.6 1,922.8
(195.4) (202.8) (221.0) (249.0) (276.4) (295.5) (315.0) (333.0) (350.4)
757.2 803.0 896.9 1,008.8 1,179.1 1,266.9 1,374.5 1,473.6 1,572.4
$ 280.7 $ 281.0 $ 281.1 $ 285.0 $ 300.0 $ 345.0 $ 395.0 $ 455.0 $ 530.0
110.2 104.4 106.9 115.4 118.9 122.5 126.2 130.0 133.9
62.6 62.3 74.1 69.0 72.5 76.1 79.9 84.7 89.8
23.8 25.2 27.8 26.7 27.2 27.6 28.0 28.4 28.8
105.5 122.5 140.5 140.4 144.5 148.7 154.5 160.5 168.4
73.9 88.9 106.1 96.0 114.5 120.0 125.8 138.6 147.3
$ 1,736.1 $ 1,799.2 $ 1,962.4 $ 2,093.3 $ 2,252.8 $ 2,402.7 $ 2,582.1 $ 2,768.9 $ 2,968.8
$ 679.6 $ 712.0 $ 761.8 $ 824.0 $ 867.9 $ 938.2 $ 999.6 $ 1,069.4 $ 1,145.0
231.4 236.0 268.0 280.2 294.7 318.1 338.7 362.0 387.4
432.1 480.8 523.9 570.0 651.0 698.5 769.1 842.1 924.0
125.7 125.1 140.4 157.3 182.4 192.8 208.9 224.5 241.1
98.0 107.0 112.3 113.0 116.0 129.0 139.8 143.4 146.5
48.1 53.3 52.7 56.4 64.0 67.0 86.9 90.0 91.2
$ 1,614.9 $ 1,714.2 $ 1,859.1 $ 2,000.9 $ 2,176.0 $ 2,343.6 $ 2,543.0 $ 2,731.4 $ 2,935.2
$ 121.2 $ 85.0 $ 103.3 $ 92.4 $ 76.8 $ 59.0 $ 39.1 $ 37.6 $ 33.6
Attachment A

78
79

What does $53 million mean in terms of resident students?
We cannot balance the budget on the backs of resident students
• Equivalent to the net tuition collected from 7,800 resident UG’s
• 15% reduction in state investment per resident FTE: $1,140
• 12% of the FY15 base resident UG & G tuition rate
• 17% of average FY15 net resident UG tuition after financial aid
• 35% of institutional financial aid to resident UG’s
80
The ASU Enterprise Plan
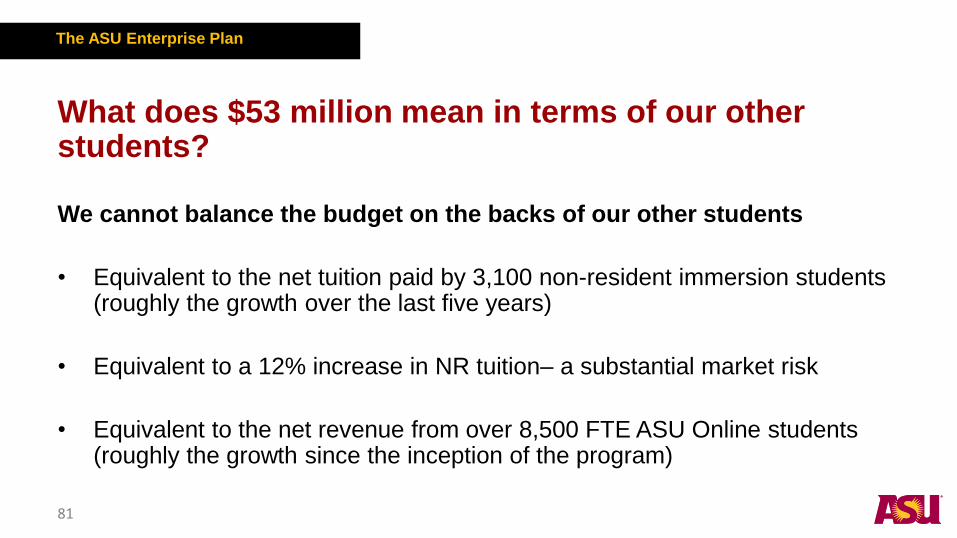
What does $53 million mean in terms of our other students?
We cannot balance the budget on the backs of our other students
• Equivalent to the net tuition paid by 3,100 non-resident immersion students (roughly the growth over the last five years)
• Equivalent to a 12% increase in NR tuition– a substantial market risk
• Equivalent to the net revenue from over 8,500 FTE ASU Online students (roughly the growth since the inception of the program)
81
The ASU Enterprise Plan
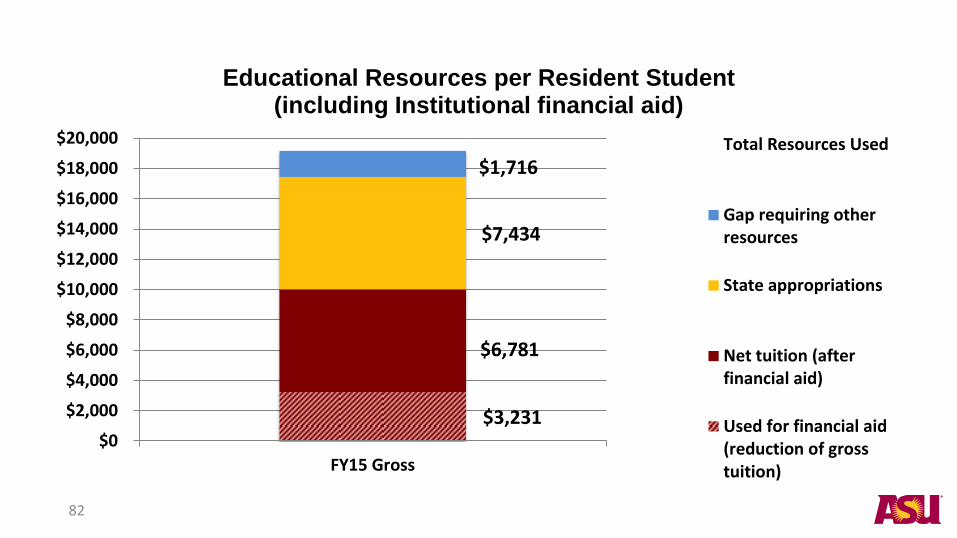
$3,231
$6,781
$7,434
$1,716
$0
$2,000
$4,000
$6,000
$8,000
$10,000
$12,000
$14,000
$16,000
$18,000
$20,000
FY15 Gross
Educational Resources per Resident Student (including Institutional financial aid)
Total Resources Used
Gap requiring otherresources
State appropriations
Net tuition (afterfinancial aid)
Used for financial aid(reduction of grosstuition)
82

$6,781
$7,434
$1,716
$0
$2,000
$4,000
$6,000
$8,000
$10,000
$12,000
$14,000
$16,000
$18,000
$20,000
FY15 Gross
Educational Resources per Resident Student (including Institutional financial aid)
Total Resources Used
Gap requiring otherresources
State appropriations
Net tuition (afterfinancial aid)
83

$6,353
$6,294
$3,163
$0
$2,000
$4,000
$6,000
$8,000
$10,000
$12,000
$14,000
$16,000
$18,000
$20,000
FY16 Gross
Educational Resources per Resident Student (including Institutional financial aid)
Total Resources Used
Gap requiring otherresources
State appropriations
Net tuition (afterfinancial aid)
84

Can We Cut our Way to Handling $53 million?
Faculty
• Equivalent to 320 faculty lines (15%)
• ASU currently has the lowest # of faculty per 100 FTE students
Staff
• Equivalent to 650-700 staff lines (25%)
• ASU currently has the lowest # of staff per 100 FTE students
Financial Stability:
• 55% of net asset growth forecast for FY15
• Eliminates the ability to build net assets
85
The ASU Enterprise Plan
$72,750
$65,588
$69,241
$72,112
$67,204
$69,111
$72,471
$77,496
$72,750
$64,685
$67,623 $69,050
$62,520 $63,241
$65,296
$77,101
$75,203 $75,077 $75,269 $75,792
$68,749
$66,730
$63,811 $62,456
$61,387 $60,602
$55,000
$60,000
$65,000
$70,000
$75,000
$80,000
FY08Actual
FY09Actual
FY10Actual
FY11Actual
FY12Actual
FY13Actual
FY14Actual
FY15Est
FY16Proj
FY17Goal
FY18Goal
FY19Goal
FY20Goal
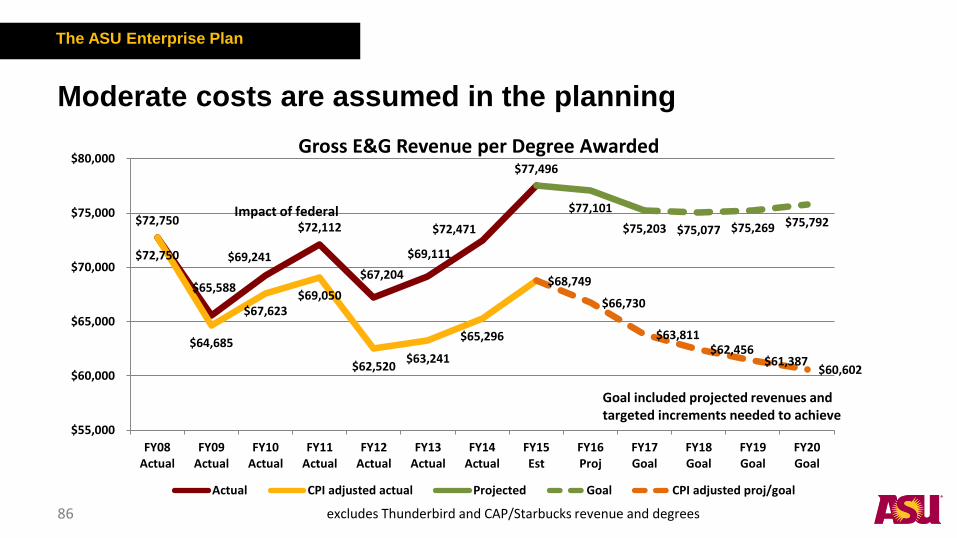
Gross E&G Revenue per Degree Awarded
Actual CPI adjusted actual Projected Goal CPI adjusted proj/goal
Impact of federal
Goal included projected revenues and targeted increments needed to achieve
excludes Thunderbird and CAP/Starbucks revenue and degrees
Moderate costs are assumed in the planning
The ASU Enterprise Plan
86

Changes to the Enterprise
Plan
87

The response to State disinvestment
Cutting to achieve financial balance is not a path to pursue-- we already operate at extremely low costs
Pushing tuition to unaffordable levels and/or reducing expenditures to poor quality and service levels cannot be the source of replacement funds over time if we are to achieve our degree goals and our state development responsibility role
Political environment suggests that ongoing dis-investment is as likely as any more positive outcome, and we will cannot be passive about preparing for that possibility
88
Changes to the ASU Enterprise Plan

Some Things are Consistent
Seeking to achieve degree and research goals and developing the resources to do so
Operating at very high levels of efficiency and effectiveness as compared to competitors
Growth in all student cohorts: resident, non-resident and international
Aggressive growth in ASU Online
Seeking new partnerships
89
Changes to the ASU Enterprise Plan

Key New Elements for FY 2016 to FY 2025
New educational products and partnerships.
Growth of executive education
Accelerated curriculum efficiencies
Re-establish the state partnership. State budget efforts become more political
Investment partnerships for economic development support
Goal is no change to current tuition policy, but success in new endeavors is crucial to accomplishing this objective
90
Changes to the ASU Enterprise Plan
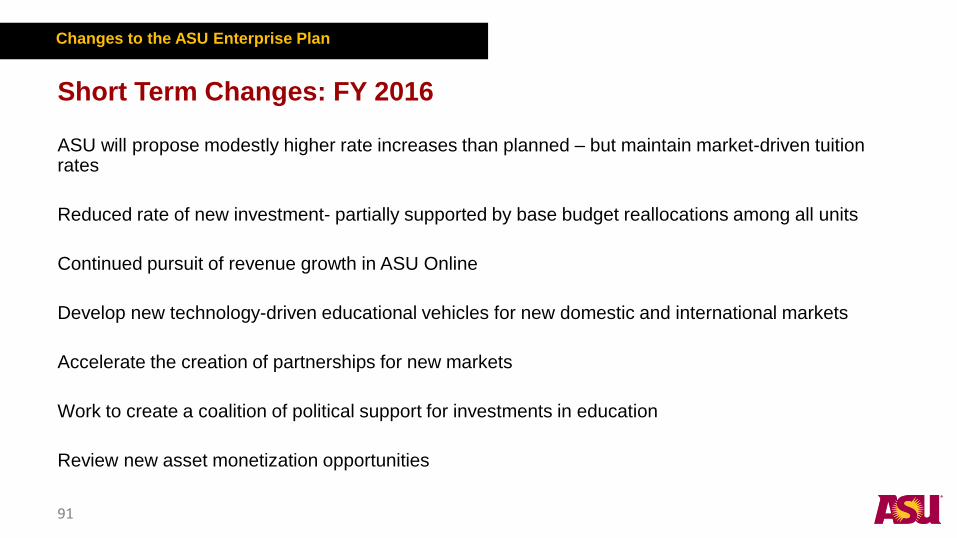
Short Term Changes: FY 2016
ASU will propose modestly higher rate increases than planned – but maintain market-driven tuition rates
Reduced rate of new investment- partially supported by base budget reallocations among all units
Continued pursuit of revenue growth in ASU Online
Develop new technology-driven educational vehicles for new domestic and international markets
Accelerate the creation of partnerships for new markets
Work to create a coalition of political support for investments in education
Review new asset monetization opportunities
91
Changes to the ASU Enterprise Plan

Mid-Term Changes: FY 2017
ASU renews its commitment to a low tuition environment for immersion resident students and a mid-range and competitive rate for others
Modest rate of new investment- partially supported by base budget reallocations among all units
Active pursuit of restoration of State investment and future funding commitments
Continued pursuit of revenue growth in ASU Online
Begin to see net revenue from new markets and partnerships 92
Changes to the ASU Enterprise Plan

The Longer Term: FY 2018 to FY 2025
Substantial new net revenue from new markets and partnerships begins to be realized
Substantial new revenue from executive education begins to be realized
Resource investments needed to fulfill the charter continue
Current tuition rate goals are dependent on success in generating new revenue and/or restoring the state partnership
More diverse commercial relationships and partnerships
93
Changes to the ASU Enterprise Plan
What Will We Be Working to Achieve with the State?
Autonomy in benefit plan design
Autonomy in retirement plan design
Autonomy in insurance plan design
Potential savings from autonomy are estimated at $15M to $20M annually
Other deregulation items
Sufficient state funding to support low resident tuition via a minimum of
$8,500 per resident FTE, performance funding, or state-based financial aid
94
Changes to the ASU Enterprise Plan

What Will We Be Working to Achieve with ABOR?
Multi-year tuition planning and flexibility to respond to additional state changes
Greater autonomy in establishing governance structures to pursue commercial and international partnerships
Support for developing novel sources of investment capital and commercial relationships for new ventures
Political support to pursue ASU’s State goals
95
Changes to the ASU Enterprise Plan

Partnerships
96
ASU’s growth and improvement would not have been possible without the resources and talent infusion that comes with partnerships
Willingness to experiment and to move rapidly is the key to finding partners
The Enterprise Plan will be highly dependent on continuing to find ways to leverage our resources with those of compatible partners
ASU Partnerships
97
Capacity to Serve More Students
Enrollment and Capacity Building
• City of Phoenix- downtown campus
• Community colleges- pathway programs
• City of Phoenix- athletics venues
• Mayo Clinic- nursing cohorts and BMI programs
• City of Mesa- Polytechnic infrastructure
98
ASU Partnerships
Opening New Educational Opportunities
New Venues
• Lake Havasu Education Foundation- higher education in rural Arizona
• Eastern Arizona College– four year degrees
Experimenting with New Access Programs
• Starbucks- College Achievement Plan
99
ASU Partnerships
Advancing Research
• Mayo Clinic- joint research activities
• State of Arizona- research infrastructure 1 (2005)
Promoting Economic Development
• City of Scottsdale- SkySong
• City of Chandler and TechShop- innovation center and maker space
100
ASU Partnerships

Accelerating the Creation of New Teaching Tools
• Pearson- ASU Online services
• Knewton- adaptive learning
• Numerous technology vendors- ASU Online curriculum
101
ASU Partnerships

Capital Investment
• American Campus Communities- student residence expansion
• Capstone- student residence expansion
• Inland America- student residence expansion
• State of Arizona- Athletic Facilities District
• Private sector partners- solar power expansion to 25 megawatts
102
ASU Partnerships

New Opportunities
University Innovation Alliance- partnering with 10 universities to innovate to better serve lower income students
Desert Ridge biomedical campus- partnering with City of Phoenix, State Land Department, Mayo Clinic, and private sector developer
Pima County, Town of Oro Valley, pharmaceutical companies- build a bio-technology incubator to serve southern Arizona
China research initiatives
Banner – develop research capabilities to support clinical neuroscience activities
Dozens of universities in large scale research center proposals
103
ASU Partnerships
Need to make the State a partner once again
What can we offer?
Improved outcomes
Expanded number of new graduates
Direct support for recruitment of new firms
Increased production of new technologies and businesses
Better service to our communities
104
ASU Partnerships

105

Increasing Graduates
Access
Cost Efficiencies
Quality
106

1. Progress in Degree Completion
1.1 Access: New Student Growth
First-Time Freshmen and New Transfers
6,820
7,647 7,719
8,467 9,052 9,274
9,707 9,344 9,544
9,254 9,265
10,232
11,079
5,531 5,506 5,374 5,395
5,063 4,910 5,446 5,388
6,158
6,776 7,228
7,992
9,363
0
2000
4000
6000
8000
10000
12000
2002 2003 2004 2005 2006 2007 2008 2009 2010 2011 2012 2013 2014
Nu
mb
er
of
Stu
de
nts
Fall Semester First-Time Freshmen New Transfers
• The number of degrees conferred is related to the size of the freshman cohort and the number of transfer students.
• The freshman cohort has increased from 6,820 in 2002 to 11,079 in 2014.
• Transfer have increased from 5,531 in 2002 to 9,363 in 2014.
107

1. Progress in Degree Completion
1.2 Increase Learning Support to More Students
• Improving students’ performance in classes is crucial to improving learning outcomes.
• Tutoring is now provided at 24 different locations across multiple campuses.
• In 2007, University Student Success Centers logged 20,500 visits.
• In 2013, University Student Success Centers logged 139,400 visits (46,000 in math) a nearly sevenfold increase.
20,500
139,400
2007-2008 2012-2013
Total Visits to University Academic Student Success Centers
108

1. Progress in Degree Completion
1.2 More Students with Improved Learning: GPA
• ASU has overseen major improvements in GPA
performance as learning support has been
continuously expanded since 2006.
• The first semester GPA is a key predictor of
retention and graduation.
Students with a GPA below 2.0 are retained at
very low rates, well below 50%.
• Students who use learning support are retained at
significantly higher rates.
Users were retained at a rate of 84%.
Non-users were retained at a rate of 76.6%.
Students with lower levels of academic
preparation are retained at an average 10.8
percentage points higher than comparable
students who did not use the services.
49.30%
58.70% 61.40%
20.1%
13.1% 11.8%
Fall 2006 Fall 2009 Fall 2013
GPA Distribution for Freshmen
3.0 and Above Below 2.0
109

1. Progress in Degree Completion
1.3 More Students with Improved Retention
• The first-year retention rate has improved from 76.7% for the 2002 cohort to a 84.1% for the 2013 cohort.
• The rate for AZ students is now at 87.1%
• Initiatives to impact retention started in 2007 and have increased substantially each year.
• The drop off for the 2011 cohort is due to multiple factors: increase in unmet cost of attendance, stricter renewal criteria for a scholars program, cumulative effect of the recession, increased number of students with math deficiencies.
Total Freshmen First-Year Retention Rate
76.7% 76.8%
79.0% 78.5%
77.2%
79.5%
81.2%
84.0% 83.5%
80.0%
83.8% 84.1%
70%
72%
74%
76%
78%
80%
82%
84%
86%
Re
ten
tio
n R
ate
Cohort Year
110

1. Progress in Degree Completion
1.3 Improved Retention with Access
Continue to increase the retention rate to the
enterprise goal of 89% while maintaining the
mission of access.
Achieving the goals while maintaining access is a
challenge few research universities outside of
Arizona attempt.
• On the basis of a four-year average, ASU is
outperforming many research universities
with similar access challenges (blue dot).
• On a one-year basis, retention has improved
from 77% in 2006 (red dot; slightly
underperforming
peers) to about 84% in 2013 (green dot;
outperforming many peers) without changing
admissions standards.
60%
65%
70%
75%
80%
85%
90%
95%
100%
105%
800 1000 1200 1400 1600Ave
rag
e F
res
hm
an
Re
ten
tio
n
Ra
te
(ave
rag
e 2
008-2
011
co
ho
rts
)
SAT 25th Percentile (2012 Cohort)
US News Ranked National Universities
111

29.6%
49.2% 49.2%
60.6%
55.8%
62.6% 65.6%
69.7%
25%
30%
35%
40%
45%
50%
55%
60%
65%
70%
75%
2002 2003 2004 2005 2006 2007 2008 2009 2010
Gra
du
ati
on
Ra
te
Cohort Year 4-Year ASU Graduation Rate 5-Year ASU Graduation Rate
6-Year ASU Graduation Rate 6-Year VSA Graduation Rate
1. Progress in Degree Completion
1.4 Graduation Improvement Follows From Retention
first cohort to use eAdvisor
Total Graduation Rates 6-year graduation rate has risen from 56.9% for the 2006 cohort to 62.6% for the 2008 cohort.
It is projected at 64% next year.
The 6-year rate for AZ students is now 66.3%
The VSA rate is 69.7% for the 2008 cohort and is estimated at 71% next year.
4-year graduation rate has risen from 33.5% for the 2006 cohort to 49.2% for the 2010 cohort.
The 4-year rate for AZ students is now 51%
1. Progress in Degree Completion
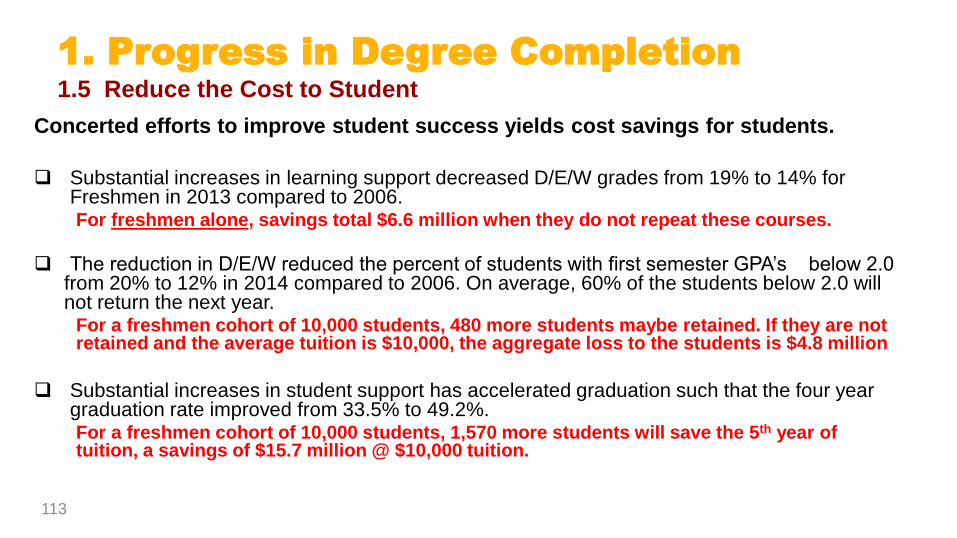
1.5 Reduce the Cost to Student
Concerted efforts to improve student success yields cost savings for students.
Substantial increases in learning support decreased D/E/W grades from 19% to 14% for
Freshmen in 2013 compared to 2006. For freshmen alone, savings total $6.6 million when they do not repeat these courses.
The reduction in D/E/W reduced the percent of students with first semester GPA’s below 2.0 from 20% to 12% in 2014 compared to 2006. On average, 60% of the students below 2.0 will not return the next year.
For a freshmen cohort of 10,000 students, 480 more students maybe retained. If they are not retained and the average tuition is $10,000, the aggregate loss to the students is $4.8 million
Substantial increases in student support has accelerated graduation such that the four year graduation rate improved from 33.5% to 49.2%. For a freshmen cohort of 10,000 students, 1,570 more students will save the 5th year of tuition, a savings of $15.7 million @ $10,000 tuition.
113

1. Progress in Degree Completion
1.6 Degrees Conferred
Degree growth, 2002-14:
• forty-five percent (45%) increase since 2006-07
• in 2013-14 degrees increased to 19,761
• goal is 25,000 in 2020
10,000
12,000
14,000
16,000
18,000
20,000
2002-03 2003-04 2004-05 2005-06 2006-07 2007-08 2008-09 2009-10 2010-11 2011-12 2012-13 2013-14
Total Degrees Awarded
114

1. Progress in Degree Completion
1.6 Degrees Conferred
Degrees by College 2013-14
STEM increases since 2006-07:
• Engineering: 2,562 from 1351 (90% increase)
• Natural Sciences: 1,216 from 689 (76% increase)
• Life Sciences: 633 from 360 (76% increase)
Some other significant increases:
• Health Solutions and Nursing: 1,604 from 778 (106% increase)
• Business and Economics: 3,659 from 2,819 (30% increase)
• Social Sciences and Public Programs: 62% and 83% increases respectively
0
500
1,000
1,500
2,000
2,500
3,000
3,500
4,000
Degrees Awarded by College
2003-04 2013-14
115
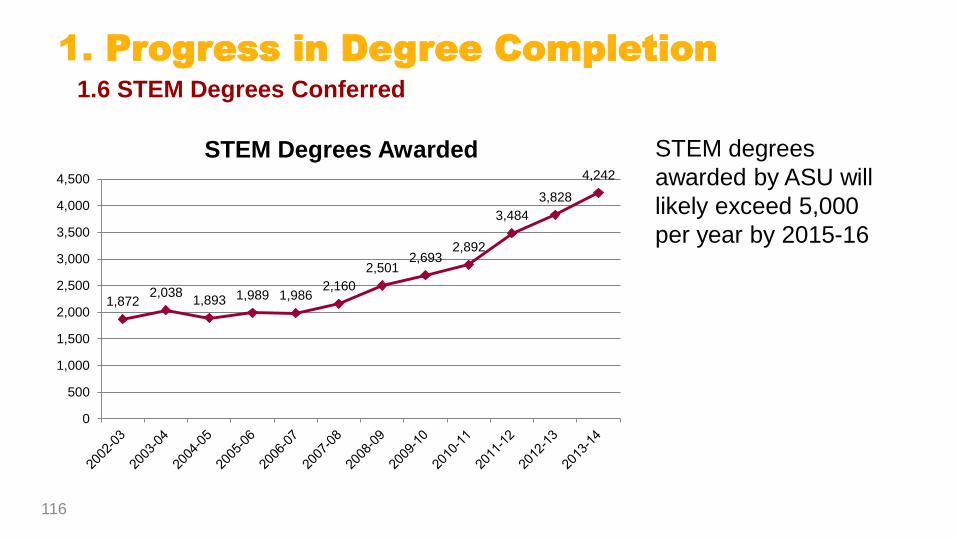
1. Progress in Degree Completion
1.6 STEM Degrees Conferred
1,872 2,038
1,893 1,989 1,986 2,160
2,501 2,693
2,892
3,484
3,828
4,242
0
500
1,000
1,500
2,000
2,500
3,000
3,500
4,000
4,500
STEM Degrees Awarded STEM degrees
awarded by ASU will
likely exceed 5,000
per year by 2015-16
116
General
Education
Courses
in Major
Electives
breadth
of
knowledge
deep subject
area
expertise
Critical
Thinking
Master Learner
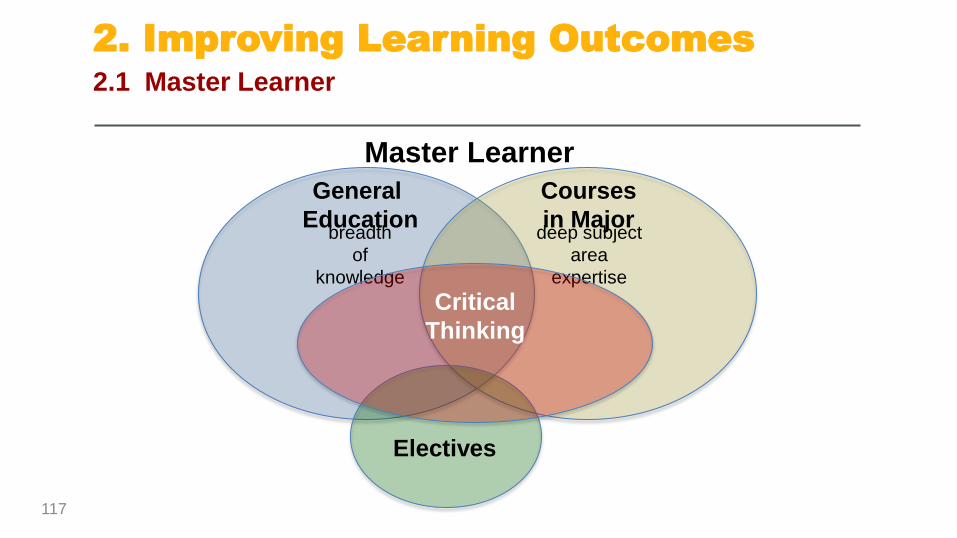
2. Improving Learning Outcomes
2.1 Master Learner
117

2. Improving Learning Outcomes
2.1 Master Learner: Develop skills for the 21st Century
The goal is to improve content proficiency while also improving critical thinking and problem solving abilities.
Passive learning environments such as large lectures produce the worse critical thinking skills.
• Adaptive + Active learning in general education courses
• LEAD
• PROMOD
118
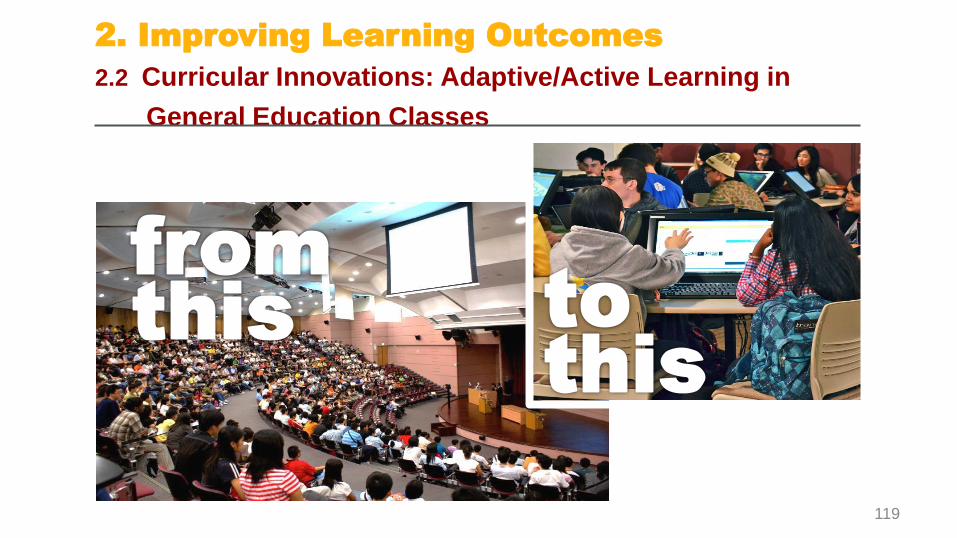
2. Improving Learning Outcomes
2.2 Curricular Innovations: Adaptive/Active Learning in
General Education Classes
119

LEAD (Learn, Explore, Advance, Design) for academically at-risk students
• First-year curriculum that is project based learning
• Builds fundamental skills necessary for success in other courses.
• Three courses integrated around university success, communication and critical thinking
Fall: Critical Reading & Writing; COM 101; University Success Course
Spring: Applied logic (Philosophy); Multimedia Communication; University Success Course
• Involves team work, debates and projects that integrate the skills learned from the same conventional courses as taken by other students.
• First semester results exceed expectations considerably
Spring Retention: LEAD 95% vs Non-LEAD Comparison 89%
FALL GPA: LEAD 3.04 vs Non-LEAD 2.55
2. Improving Learning Outcomes
2.3 Curricular Innovations: LEAD
120
First in the World Grant–$4 million provides: • Project-based learning in a degree program from freshman thru senior year
that integrates the learning around critical thinking, problem solving and team work.
• Cohere elective courses, general education courses and courses in the
major around a single integrated project so that all of the courses have direct applicability to the major
• Measuring and mastering learning objectives instead of time in seats • Applications of the learning objectives to projects central to the degree • Ten majors to launch pilots in fall 2015
2. Improving Learning Outcomes
2.3 Curricular Innovations: PROMOD
121

ASU measures the acquisition of general learning skills associated with a college education with more planned in the immediate future.
• Critical thinking, writing and numerical reasoning are being measured by the Educational Testing Service (ETS) Proficiency Profile in a longitudinal study of ASU students.
• ASU students were tested as incoming freshmen in fall 2011.
• They were retested in spring 2013, after their first two years at ASU.
• The study will be completed in spring 2015 as the students from the 2011 cohort conclude eight semesters at ASU.
• It is notoriously difficult to conduct these tests as universities across the country have learned. One national expert explains:
“One of the biggest reasons is that universities quickly find that it's easy to get incoming students to take tests during freshman orientation (and take them seriously); it's difficult to get seniors to do the same.
3. Measuring Learning
3.1 Quality of Learning: Critical Thinking,
Reading, Writing and Quantitative Reasoning
122
3. Measuring Learning
3.4 Quality of Learning: ePortfolio
A new method that seems superior to standardized tests involves the use of an
ePortfolio.
• Students have an ePortfolio from their freshmen year through their senior that
contains samples of work.
• Progress isn't scientifically measured, as in the ETS or CLA, but superior qualitative
judgments of progress will be available based on samples of academic work entered
into the ePortfolio.
• Students will own their portfolio, which they can edit and produce for a job market
search or entrance into post-graduate programs.
• Personalized electronic resumes also can be produced showing competencies that
specific employers are seeking,
It could have samples of work demonstrating critical thinking, quantitative
reasoning, team work and all manners of communication.
123

Provide training for general career skills
It is common to hear employers contend that the ability of students to convert academic preparation to career readiness is low.
ASU is starting a pilot project with an external partner to fill the gap.
Fullbridge is one such company, providing career-building skills for colleges and universities as well as companies. Among others, they have partnered with:
• Harvard Law
• Washington University
• Bowdoin
• Wesleyan
• Intel
• Citi®
4. Co-Curricular Innovations
4.2 Finishing Skills for Employment
124
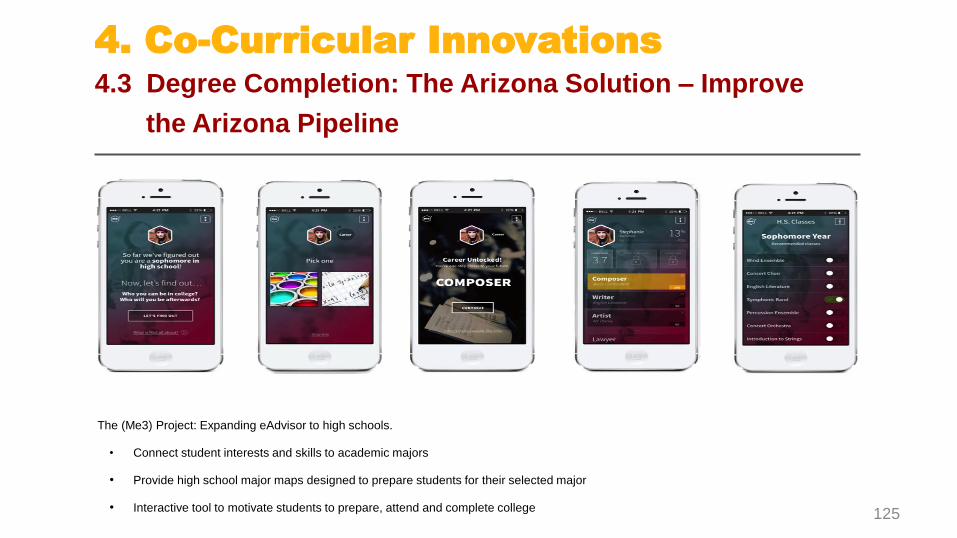
The (Me3) Project: Expanding eAdvisor to high schools.
• Connect student interests and skills to academic majors
• Provide high school major maps designed to prepare students for their selected major
• Interactive tool to motivate students to prepare, attend and complete college
4. Co-Curricular Innovations
4.3 Degree Completion: The Arizona Solution – Improve
the Arizona Pipeline
125