arizona@work pinal county local workforce …
TRANSCRIPT

1
ARIZONA@WORK Pinal County
LOCAL WORKFORCE DEVELOPMENT PLAN
2020-2023
Effective Date: July 1, 2020
RECISSIONS:
ARIZONA@WORK PINAL COUNTY
2016-2020 LOCAL WORKFORCE DEVELOPMENT PLAN

2
TABLE OF CONTENTS ACRONYMS .................................................................................................................................................. 6
GLOSSARY OF KEY TERMS ....................................................................................................................... 9
COMPOSITION OF THE ARIZONA@WORK PINAL COUNTY WORKFORCE DEVELOPMENT PLAN .................................................................................................................................................................... 13
IMPACT OF COVID-19 VIRUS ON THIS PLAN ....................................................................................... 13
ARIZONA@WORK PINAL COUNTY GOVERNANCE STRUCTURE.................................................... 15
PUBLIC COMMENTS ................................................................................................................................. 16
EXECUTIVE SUMMARY ............................................................................................................................ 17
OVERVIEW OF THE LOCAL WORKFORCE SYSTEM UNDER THE WORKFORCE INNOVATION AND OPPORTUNITY ACT .................................................................................................................................. 19
THE ARIZONA@WORK PINAL COUNTY SYSTEM ............................................................................ 24
FUNDING THE SYSTEM ........................................................................................................................ 24
EXPECTATIONS OF THE SYSTEM ........................................................................................................... 27
COMPETITIVE PROCESS USED IN AWARDING SUB GRANTS AND CONTRACTS .......................................... 28
GOALS AND STRATEGIES ......................................................................................................................... 29
SYSTEM ALIGNMENT .......................................................................................................................... 29
HOW TO GET THERE........................................................................................................................... 34
LABOR MARKET ANALYSIS .................................................................................................................... 37
ECONOMIC PROFILE OF PINAL COUNTY ............................................................................................... 37
EMPLOYMENT .................................................................................................................................... 42
LOCATION QUOTIENTS AND IDENTIFIED CLUSTERS ................................................................................ 46
WORKFORCE CHARACTERISTICS .......................................................................................................... 51
YOUTH .............................................................................................................................................. 58
COUNTY SUB-AREA COMPARISONS ..................................................................................................... 64
FORECASTS ........................................................................................................................................ 72
TARGETED INDUSTRIES ....................................................................................................................... 73
New Sectors ........................................................................................................................................ 74
Using Regional Statistics .................................................................................................................. 74
TRANSPORTATION AND LOGISTICS ...................................................................................................... 75
MANUFACTURING .............................................................................................................................. 84
Advanced Manufacturing................................................................................................................. 88
HEALTH SERVICES .............................................................................................................................. 92
Advanced Health Services ................................................................................................................ 96

3
AEROSPACE AND DEFENSE ................................................................................................................ 100
Advanced Aerospace and Defense ................................................................................................. 104
NATURAL AND RENEWABLE RESOURCES ............................................................................................ 108
Advanced Natural & Renewable Resources ................................................................................. 112
TOURISM ........................................................................................................................................ 116
ECONOMIC DEVELOPMENT PIPELINE ................................................................................................. 120
LABOR MARKET ANALYSIS: ................................................................................................................. 121
APPENDIX 1: METHODOLOGY TO DEFINE AND DETERMINE IN-DEMAND INDUSTRIES AND OCCUPATIONS
121
1. EMERGING EMPLOYMENT OPPORTUNITIES .......................................................................... 122
2. CURRENT EMPLOYMENT OPPORTUNITIES ............................................................................ 122
APPENDIX 2: LIVABLE WAGE ESTIMATES .......................................................................................... 124
APPENDIX 3 – EMPLOYMENT OPPORTUNITY FORECASTS .................................................................... 126
APPENDIX 4 – TARGETED INDUSTRY SUB-INDUSTRY SELECTIONS ........................................................ 129
ARIZONA@WORK PINAL COUNTY PARTNER PROGRAMS ........................................................... 138
ADULT AND DISLOCATED WORKER PROGRAMS .................................................................................. 138
RAPID RESPONSE ............................................................................................................................. 141
TRADE ADJUSTMENT ASSISTANCE (TAA) ........................................................................................... 141
YOUTH PROGRAM ............................................................................................................................ 142
WAGNER PEYSER/EMPLOYMENT SERVICE ......................................................................................... 142
UNEMPLOYMENT INSURANCE (UI) PROGRAMS .................................................................................. 143
ADULT EDUCATION .......................................................................................................................... 144
VOCATIONAL REHABILITATION .......................................................................................................... 145
PROGRAMS OF STUDY AUTHORIZED UNDER THE CARL D. PERKINS CAREER AND TECHNICAL EDUCATION ACT
OF 2006 ................................................................................................................................................. 146
SECONDARY AND POSTSECONDARY EDUCATION ................................................................................. 146
VETERANS ....................................................................................................................................... 147
SERVICE DELIVERY................................................................................................................................ 148
ARIZONA@WORK JOB CENTER LOCATIONS: ............................................................................... 151
GOAL 1: PROMOTE A STRONG PINAL COUNTY ECONOMY: ............................................................. 153
STRATEGY #1: MONITOR PINAL COUNTY GRP IN ORDER TO ASSESS THE ECONOMIC IMPACT OF COVID-19 154
STRATEGY #2: ESTABLISH ALIGNMENT OF EDUCATION, ECONOMIC AND WORKFORCE DEVELOPMENT
EFFORTS .................................................................................................................................................. 155
STRATEGY #3: PLAN WITH A GLOBAL PERSPECTIVE ............................................................................. 157

4
GOAL 2: SERVE BUSINESS NEEDS: ...................................................................................................... 159
STRATEGY #1: EFFECTIVELY STRUCTURE ARIZONA@WORK BUSINESS SERVICES ............................... 159
STRATEGY #2: UNDERSTAND PINAL COUNTY’S BUSINESS LANDSCAPE ................................................. 160
STRATEGY #3: ALIGNMENT OF INTERNAL EMPLOYER ENGAGEMENT ACTIVITIES ..................................... 164
RAPID RESPONSE ACTIVITIES ............................................................................................................ 166
GOAL 3: PREPARE JOB SEEKERS FOR EMPLOYMENT OPPORTUNITIES IN HIGH GROWTH INDUSTRIES: ............................................................................................................................................ 166
STRATEGY #1: LEVERAGE RESOURCES BY MAXIMIZING CO-ENROLLMENT IN CORE PROGRAMS ............. 166
STRATEGY #2: PROVIDE INNOVATIVE OPTIONS TO SERVICE ACCESS FOR ARIZONA@WORK PINAL
COUNTY CUSTOMERS ............................................................................................................................... 169
STRATEGY #3: ALIGN SERVICE DELIVERY ACTIVITIES .......................................................................... 170
CUSTOMER EXPERIENCE OVERVIEW .................................................................................................. 173
STRATEGY# 4: UNDERSTANDING THE LABOR DEMANDS OF HIGH-GROWTH INDUSTRIES AND OCCUPATIONS
180
TRAINING SERVICES ......................................................................................................................... 180
ELIGIBLE TRAINING PROVIDER LIST ................................................................................................... 186
YOUTH WORKFORCE ACTIVITIES ....................................................................................................... 187
14 ELEMENTS OF THE YOUTH PROGRAM ........................................................................................... 205
SUPPORT SERVICES .......................................................................................................................... 217
TRANSPORTATION............................................................................................................................ 218
GOAL 4: PROVIDE AN EFFICIENT, ACCOUNTABLE WORKFORCE SYSTEM .................................... 219
STRATEGY 1: DEVELOP A JOB-DRIVEN PUBLIC WORKFORCE DEVELOPMENT SYSTEM IN PINAL COUNTY . 219
STRATEGY 2: SUSTAIN A HIGH-PERFORMING LOCAL WORKFORCE DEVELOPMENT BOARD .................... 220
STRATEGY 3: EFFICIENTLY ALIGN, PRIORITIZE, AND SELECT WORKFORCE DEVELOPMENT SYSTEM PROJECTS
222
STRATEGY 4: PRACTICE EVIDENCED-BASED ADVERTISING, OUTREACH, AND STRATEGIC PUBLIC RELATIONS
223
PERFORMANCE AND CONTINUOUS IMPROVEMENT ........................................................................... 224
CONTINUOUS IMPROVEMENT OF ELIGIBLE PROVIDERS OF SERVICES .......................................... 231
COMPLIANCE WITH WIOA SECTION 188 ........................................................................................... 233
POLICIES IN PROCESS ....................................................................................................................... 235
EXHIBITS ................................................................................................................................................. 236
EXHIBIT 1: POSTINGS FOR PUBLIC COMMENTS........................................................................................... 237
EXHIBIT 2: DISTRIBUTION LIST FOR PUBLIC COMMENTS ............................................................................. 238
EXHIBIT 3: PUBLIC COMMENTS RECEIVED .................................................................................................. 239

5
EXHIBIT 4: FUNDAMENTALS MAP ............................................................................................................. 240
EXHIBIT 5: SUBSTATE ALLOCATIONS FORMULA .......................................................................................... 244
EXHIBIT 6: LIVABLE WAGES ...................................................................................................................... 248
EXHIBIT 7: YOUTH PROGRAM DEFINITION: “ADDITIONAL ASSISTANCE” ...................................................... 251
EXHIBIT 8: CENTER FOR FUTURE OF ARIZONA PROGRESS METERS ............................................................... 253
EXHIBIT 9: EQUAL OPPORTUNITY OFFICERS ............................................................................................... 277

6
ACRONYMS AAEDMS Arizona Adult Education Data Management System
ABE Adult Basic Education
ACA Arizona Commerce Authority
ADC Arizona Department of Corrections
ADOE Arizona Department of Education
AHCCCS Arizona Health Care Cost Containment System
AJC Arizona Job Connection
AZCIS Arizona Career Information System
BOS Board of Supervisors
CAC Central Arizona College
CAG Central Arizona Governments
CAHRA Community Action Human Resources Agency
CAVIT Central Arizona Valley Institute of Technology
CFR Code of Federal Regulations
CEO Chief Elected Officials
CPLC Chicanos Por La Causa
CRC U.S. Department of Labor Civil Rights Center
CTE Career Technical Education
DES Arizona Department of Economic Security
ECAP-A Education Career Action Plan – Adult
EO Equal Opportunity
EEO Equal Employment Opportunity
ESL English as a Second Language
ETPL Eligible Traning Provider List
FAFSA Free Application for Federal Student Aid
FDIC Federal Deposit Insurance Corporation
FEIN Federal Employer Identification Number

7
GED General Education Degree
GPA Grade Point Average
GRIC Gila River Indian Community
HOHP Honoring Hiring Helping Our Heroes of Pinal
HSE High School Equivalency
IEP Individual Employment Plan
ISS Individual Service Strategy
ITA Individual Training Account
ITV Interactive Television System
LLSIL Lower Living Standard of Income Level
MOU Memorandum of Understanding
MSFW Migrant Seasonal Farm Worker
NCRC National Career Readiness Certificate
OJT On the Job Training
PCWDB Pinal County Workforce Development Board
PPEP Portable, Practical, Educational Preparation
PY Program Year
R&D Research & Development
RESEA Re- Employment Service Eligibility Assessment
RFP Request for Proposal
RTA Regional Transportation Authority
RTAA Re-Employment Trade Adjustment Assistance
SBDC Small Business Development Center
SNAP Supplemental Nutrition Assistance Program
SWOT Strengths, Weaknesses, Opportunities, Threats
TAA Trade Adjustment Assistance
TABE Test of Adult Basic Education
TANF Temporary Assistance for Needy Families
TEGL Training and Employment Guidance Letter

8
TRA Trade Re-Adjustment Assistance
TTY Teletypewriter
UCX Unemployment Compensation for Ex Service Members
UI Unemployment Insurance
UIPL Unemployment Insurance Program Letter
VR Vocational Rehabilitation
WARN Worker Adjustment and Retraining Notification Act
WIOA Workforce Innovation and Opportunity Act

9
GLOSSARY OF KEY TERMS1 ALLOCATIONS: ARIZONA@WORK Pinal County is comprised of multiple funding streams for each of the required partners. Primarily, allocations are distributions of funds for Title I of WIOA to a local workforce development area. These funds are for the administration of the local workforce system as well as the Adult, Dislocated Worker, Youth programs. Local areas are allocated funds on an annual basis and have two program years to expend them once received. Unexpended funds are recaptured by the state. (NOTE: Effective in Program Year 2020, local areas will not receive a Rapid Response allocation which will be reserved by the State) ARIZONA@WORK: The statewide brand of the public workforce system as authorized under the Workforce Innovation and Opportunity Act of 2014. (see One Stop System) ARIZONA@WORK PINAL COUNTY: The local area brand of the statewide ARIZONA@WORK system. CARRYOVER (FUNDING): Local areas are allocated funds on an annual basis and have two program years to expend them by June 30th of the second year. Funds unexpended after the first year are identified as “carryover”. Funds that are unexpended after the second year are recaptured by the state. CHIEF ELECTED OFFICIAL: (Pinal County Board of Supervisors) appoints members to sit on the local Pinal County Workforce Development Board. The local government's chief elected official(s) in a local area is liable for any misuse of the WIOA grant funds allocated to the local area. CORE PARTNERS: Core programs are required to report on common performance indicators that provide key employment information, such as the employment rate of participants after exiting the program, their median wages, whether they attained a credential, and their measurable skill gains. Core programs must measure the effectiveness of services to employers for the first time. Per the Workforce Innovation and Opportunity Act of 2014, core partners of the ARIZONA@WORK system are:
Title I (B): Adult Program Dislocated Worker Program Youth Program
Title II: Adult Education and Family Literacy Act Programs Title III: Employment Service Title IV: Vocational Rehabilitation under the Rehabilitation Act of 1973.
1 Some terms may not be used in this plan but are provided as they are common in the ARIZONA@WORK delivery system

10
INFRASTRUCTURE FUNDING AGREEMENT (IFA): The IFA is a part of the MOU; it is not a separate document. It describes a reasonable cost allocation methodology, where infrastructure costs are charged to each partner based on partners’ proportionate use of the job center, relative to the benefits received from the use of the one-stop center consistent with Federal Cost Principles in the Uniform Guidance. The IFA is consistent with the partner programs’ authorizing laws and regulations, and other applicable legal requirements. JOB CENTER: Access to the ARIZONA@WORK system is through the American Job Center Network. The center structure is comprised of the following:
Comprehensive One-Stop Centers: A comprehensive one-stop center is a physical location where jobseeker and employer customers can access the programs, services, and activities of all required one-stop partners
Affiliate Site(s): An affiliated site, or affiliate one-stop center, is a site that makes available to jobseeker and employer customers one or more of the one-stop partners’ programs, services, and activities.
Network of One-Stop Partners or Specialized Centers: Any network of one-stop partners or specialized centers that connect to the comprehensive one-stop center in the area, as well as any appropriate affiliate centers
Electronic Access Points: In addition to providing access to services through the mandatory comprehensive physical one-stop center and any affiliated sites or specialized centers, required one-stop partner programs must provide access to programs, services, and activities through electronic means, where applicable and practicable.
JOB CENTER CERTIFICATION: Criteria established by the Workforce Arizona Council to ensure job centers adhere to WIOA requirements related to effectiveness, physical and programmatic accessibility, and continuous improvement, as well as measuring the local workforce area’s progress in achieving the statewide vision for the ARIZONA@WORK Job Center delivery system. Local workforce development boards must certify job centers every three years in order to be eligible to use infrastructure funds in the State funding mechanism. LOCAL WORKFORCE (DEVELOPMENT) AREA: The purpose of a local area is to serve as a jurisdiction for the administration of workforce development activities using Adult, Dislocated Worker, and Youth funds allocated by the State and to coordinate efforts related to the other core programs at a local community level. The Governor must designate local workforce development areas (local areas) in order for the State to receive Adult, Dislocated Worker, and Youth funding under Title I, subtitle B. LOCAL PLAN: Under WIOA sec. 108, each local workforce board must, in partnership with the appropriate chief elected officials, develop and submit a comprehensive 4-year plan to the Governor. The plan must identify and describe the policies, procedures, and local activities that are carried out in the local area, consistent with the State Plan. The plan must be reviewed and modified as necessary at the end of the second year. MEMORANDUM OF UNDERSTANDING (MOU): An agreement developed and executed between the local workforce board and one-stop partners with the agreement of the chief elected officials relating to the operations of the one stop delivery system in the local area.
11
NEGOTIATED LEVELS OF PERFORMANCE: In addition to the State negotiated levels of performance, States must work with local workforce development areas to establish performance goals for WIOA title I programs. The local board, the chief elected official, and the Governor must negotiate and reach agreement on local levels of performance based on the State negotiated levels of performance. ONE STOP SYSTEM: The one-stop delivery system brings together workforce development, educational, and other human resource services in a seamless customer-focused service delivery network that enhances access to the programs' services and improves long-term employment outcomes for individuals receiving assistance. One-stop partners administer separately funded programs as a set of integrated streamlined services to job seekers and employers. Arizona’s one-stop system is branded as ARIZONA@WORK. ONE STOP OPERATOR: At a minimum, the one-stop operator must coordinate the service delivery of required one-stop partners and service providers. Local workforce boards may establish additional roles of one-stop operator, including, but not limited to
1. Coordinating service providers across the one-stop delivery system 2. Being the primary provider of services within the center 3. Providing some of the services within the center 4. Coordinating service delivery in a multi-center area, which may include affiliated sites
PINAL COUNTY (LOCAL) WORKFORCE DEVELOPMENT BOARD: The local workforce board is to:
1. Provide strategic and operational oversight in collaboration with the required and additional partners and workforce stakeholders to help develop a comprehensive and high-quality workforce development system in the local area; 2. Assist in the achievement of Arizona’s strategic and operational vision and goals as outlined in the Unified State Plan or Combined State Plan; and 3. Maximize and continue to improve the quality of services, customer satisfaction, and effectiveness of the services provided.
PROGRAM YEAR (PY): July1 – June 30. • PY2020: July 1, 2020 – June 30, 2021 • PY2021: July 1, 2021 – June 30, 2022 • PY2022: July 1, 2022 – June 30, 2023 • PY2023: July 1, 2023 – June 30, 2024
SHARED GOVERNANCE: the CEO and the LWDB share governance responsibility for LWDB functions such as local planning, program oversight, negotiating local performance accountability measures, selection of One Stop Operators and providers, and approving a budget for LWDB activities. The LWDB and the CEO must enter into a written agreement that describes how the parties will carry out their shared governance functions (Shared Governance Agreement) WORKFORCE INNOVATION AND OPPORTUNITY ACT (WIOA): Legislation that is designed to strengthen and improve the nation's public workforce system and help individuals, including

12
youth and those with significant barriers to employment, into high-quality jobs and careers and help employers hire and retain skilled workers. WORKFORCE ARIZONA COUNCIL: The Workforce Arizona Council is responsible for implementing the Governor's strategic vision for a robust and effective workforce system in the State of Arizona.

13
COMPOSITION OF THE ARIZONA@WORK PINAL COUNTY WORKFORCE DEVELOPMENT PLAN
Section 108 of the Workforce Innovation and Opportunity Act (WIOA) states in part: “Each local board shall develop and submit to the Governor a comprehensive 4-year local plan, in partnership with the chief elected official. The local plan shall support the strategy described in the State plan in accordance with section 102(b)(1)(E), and otherwise be consistent with the State plan. … At the end of the first 2-year period of the 4-year local plan, each local board shall review the local plan and the local board, in partnership with the chief elected official, shall prepare and submit modifications to the local plan to reflect changes in labor market and economic conditions or in other factors affecting the implementation of the local plan.” Modifications are required to reflect changes to:
A. Labor market and economic conditions; and B. Other factors affecting the implementation of the local plan including:
i. Significant changes in local economic conditions; ii. Changes in available financing to support WIOA Title I and partner-provided
WIOA services; iii. Local Workforce Development Board structure; and iv. The need to revise strategies to meet local performance goals.
This plan was composed by the Pinal County Workforce Development Board (PCWDB) in partnership with the Pinal County Board of Supervisors. Entities representing the required partner programs as defined under WIOA also participated by providing input regarding their area of expertise. Community stakeholders as well as the general public were also afforded the opportunity to contribute to this effort through a public comment period. Once approved, the Pinal County Workforce Development Board in partnership with the Pinal County Board of Supervisors (chief elected official) shall review and modify this plan as necessary but no later than two years after its implementation.
IMPACT OF COVID-19 VIRUS ON THIS PLAN The introduction of the Covid-19 virus which took hold of the nation in March 2020 will have a profound impact on the public workforce system. For ARIZONA@WORK Pinal County, having to react to the realities the virus has placed upon our service delivery system, this plan is based on what is known at the time of submission. It is an accepted fact that it will require a review and possible modification prior to the mandated two-year update. Covid-19 has brought to light that it has never been more apparent that the ARIZONA@WORK delivery system must undergo revolutionary changes in order to not only modernize and keep pace with the “new normal”, but also to take advantage of revised processes that under otherwise “normal” circumstances would have taken years to implement. Through necessity, the

14
ARIZONA@WORK Pinal County system looks to expedite new approaches to serving our customers. These new processes have also validated that this plan is headed in a proactive rather than reactive direction. This direction is predicated on the following: Revising processes to emphasize innovation in service delivery
The Pinal County Workforce Development Board will be forging forward to increase the service reach to all citizens of the county. Quickly responding to the needs of the community in the case of a pandemic or other disaster has required a re-evaluation of how services are provided. A balance of in-person as well as virtual services must be made available to allow for a flexible system that can response quickly to the needs of the community while ensuring full access to services. The PCWDB is also looking to increase development of technological connectivity for online access to services.
“Next level” of service for business community Covid-19 has forced the Pinal County Workforce Development Board to re-evaluate its operations in an ever-changing world. Business services will be further defined to provide a clear delineation between board-specific activities and those offered and delivered by contracted program providers.
While respecting the firewall between the local workforce board and the operational service delivery of contracted providers within the one-stop context, the PCWDB will look to change the level of sight to a higher point than the ground level services provided via the one-stop partners by focusing on more strategic actions that allow it to position itself into a proactive mode of operations.
Negotiated Levels of Performance State guidance on local plan development requires each local area to submit expected levels of performance based on the last two program years of data. Under “normal” circumstances local areas would conduct an economic and workforce analysis, the state would provide a summary regression model based on past performance as well as provide the local areas the levels of performance the state had either estimated or negotiated with the U.S. Department of Labor Employment and Training Administration. It is difficult at this time to measure the true impact Covid-19 has had to local economies and associated talent pools. The Pinal County Workforce Development Board continues to analyze economic and workforce data. This analysis will translate into a more meaningful level of expectation and negotiation once the State has indicated it is ready to negotiate. Until then, the expected levels of performance as submitted are those that were negotiated for Program Year 2019. The board plans on submitting a plan modification once data is deemed sufficient to use in a more meaningful analysis.

15
ARIZONA@WORK PINAL COUNTY GOVERNANCE STRUCTURE

16
PUBLIC COMMENTS This plan was posted on the Pinal County website home page for the period of June 1-12, 2020.
In addition to the website posting, the Public Notice was published in the following newspapers in Pinal County (see Exhibit 1 for Public Notice): Superior Sun Copper Basin News San Manuel Miner Florence Reminder & Blade-Tribune Tri-Valley Dispatch Arizona City Independent/Edition
Notification of the postings was sent to all ARIZONA@WORK Pinal County staff, the PCWDB membership, the County Manager and the Board of Supervisors, in addition to other community stakeholders (see Exhibit 2 for the Distribution List). Upon receipt of the comments, staff reviewed the plan and incorporated edits where appropriate (see Exhibit 3 for Public Comments Received).
Public Notice The ARIZONA@WORK Pinal County Workforce Development Area Plan 2020-2023 (Local Plan) is now available for public review and comment, during the period of June 1, 2020 - June 12, 2020
Reference: Workforce Innovation and Opportunity Act (WIOA), dated July 22, 2014 (P.L. 113-128 Section 108; 20 CFR, Part 603, 651, 652, et. al, Subpart D; Sections 679.500 and 679.560 of the WIOA Final Rules dated August 19, 2016; State Workforce Policy #1 WIOA Local Governance, adopted June 5, 2019.
Due to COVID-19 Local Plan may be reviewed ONLINE ONLY: • Pinal County Website: https://www.pinalcountyaz.gov/Pages/Home.aspx • ARIZONA@WORK Pinal County Website:
https://arizonaatwork.com/locations/pinal-county/policies-and-plans
Not all Exhibits and Appendices are attached or completed at this time. Written comments will be received until June 12, 2020 at 5:00 PM at which time the public comment period will be completed. Comments are to be submitted to: [email protected] Equal opportunity Employer/Program Auxiliary aids and services are available upon request to individuals with disabilities.

17
EXECUTIVE SUMMARY This plan centers on the vision to modernize Pinal County’s workforce development service delivery system by increasing the capacity and accessibility to professional assistance and expertise through the distribution of available resources emphasizing the integration of digital technology. It is predicated on the vison established by the Pinal County Board of Supervisors and the Pinal County Workforce Development Board and the 2020-2023 Arizona State Unified Workforce Development Plan. Major highlights that have occurred setting the stage for this plan include: The Workforce Arizona Council composed the
2020-2023 Arizona State Unified Workforce Development Plan;
Restructuring the Pinal County Workforce Development Board into a 19-member board; Focusing on workforce board members’ onboarding and continued engagement to ensure
they are prepared to fulfill their statutory roles and responsibilities; Adopting a “disruptive innovation” approach to the current service delivery model; laser
focused on shaping the future of Pinal County and seeking innovative opportunity in addressing the challenges of a post Covid-19 workforce delivery system;
Ensuring all core, other required partners, and key community stakeholders participate in
the design of the service delivery system; Prioritizing the distribution of the footprint of ARIZONA@WORK Pinal County core
partner programs while emphasizing the need for more flexible and accessible service delivery sites throughout the county.
As the Arizona State Unified Workforce Development Plan is based on the principles of Governor Ducey’s Arizona Management System (AMS), this plan also embraces the same key principles. AMS is a professional, results-driven management system that focuses on customer value and vital outcomes for citizens. The system is based on “lean” principles, focusing on customer value, continuous improvement and engaged employees to improve productivity, quality and service. However, the reader is cautioned that major inroads to modernizing service delivery, in the spirit of continuous improvement, will require all levels of administration of ARIZONA@WORK Pinal County network partners to accept the fact that innovation in thought as well as practice is required. Disruptive innovation in not only such actions as customer flow at a particular service location, but also the allowance of pushing the boundaries of long held institutional practices. Such practices must be made available to be analyzed and where, within the confines of the law, existing state and local policies and practices can be tested, and changed for the better.
the Pinal County Workforce Development Board has focused on restructuring of its original service delivery model to better align with the needs of Pinal County residents and business community…

18
Based on the premise of disruptive innovation ARIZONA@WORK Pinal County will be moving toward the building of a workforce development system that is not centric to a single location, but rather a distributive service delivery model that is based on the following vision: “A distributive model of professional service delivery based on innovation that is adaptive and accessible to meet customer demand and exceeds customer expectations”2. It is paramount that Pinal County has a strong PCWDB - positioned to be visionary and strategic - and able to connect with key resources and stakeholders. The PCWDB will carry out its responsibilities by providing stakeholders opportunities to participate in board decision-making, particularly for representatives of organizations that may not sit on the board but continue to have a stake in the success of board decisions.
At the state level, the Fundamentals Map (see Exhibit 4 for a sample map) is a key element in the Governor’s Arizona Management System. The map depicts the mission, vision, core values and beliefs, as well as the key goals and metrics that will define success for Pinal County. The Fundamentals Map helps core and other required partners, and ultimately every Pinal County citizen
understand how the ARIZONA@WORK Pinal County system connects to the Pinal County Board of Supervisors and Pinal county Workforce Development Board’s most critical workforce related goals. The Pinal County Workforce Development Board, in tandem with the Pinal County Board of Supervisors, realizes the significance of the county’s stature at the cusp of historical economic breakthroughs. A skilled workforce is vital to Pinal County’s future. A workforce with the right skills for local employers drives the regional economy and benefits Pinal County residents, the region, and the State of Arizona. Economic developers can attract new businesses and retain existing businesses, which improves the income and lifestyle of everyone, but only if and when a workforce is well prepared. It is imperative that the ARIZONA@WORK Pinal County network of partners are all in synch and realize the current service delivery model requires needed changes in order to meet the demands of workforce development in the 21st century.
2 What Is Disruptive Innovation? Clayton M. Christensen , Michael E. Raynor, Rory McDonald, HARVARD BUSINESS REVIEW -
DECEMBER 2015 ISSUE
“A distributive model of professional service delivery based on innovation that is adaptive and accessible to meet customer demand and exceeds customer expectations”

19
OVERVIEW OF THE LOCAL WORKFORCE SYSTEM UNDER THE WORKFORCE INNOVATION AND OPPORTUNITY ACT
The Workforce Innovation and Opportunity Act (WIOA), was signed into law on July 22, 2014, with an effective date of July 1, 2015. WIOA amends the Adult Education and Family Literacy Act, the Wagner-Peyser Act, and the Rehabilitation Act of 1973. WIOA contains five titles: Title I: Workforce Development Activities
Subtitle A - System Alignment Subtitle B - Workforce Investment Activities and Providers
Title II: Adult Education and Literacy Title III: Amendments to the Wagner-Peyser Act (Employment Service) Title IV: Amendments to the Rehabilitation Act Of 1973 Title V: General Provisions The law highlights reforms made to the public workforce system. These reforms include: Aligning federal investments to support jobseekers and employers; Strengthening the governing bodies that establish State, Regional and Local workforce
investment priorities; Helping employers find workers with the necessary skills; Aligning goals and increasing accountability and information for job seekers and the
public; Fostering regional collaboration to meet the needs of regional economies; Targeting workforce services to better serve job seekers; Improving services to individuals with disabilities; Supporting access to services
The reforms guide a local area’s design of their delivery system through the six purposes of WIOA:
1. Increase opportunities for individuals with barriers; 2. Support alignment of systems; 3. Improve quality and relevance; 4. Increase structure and delivery; 5. Increase prosperity of workers and employers; 6. Enhance productivity and competitiveness of the Nation
Since becoming a designated WIOA local workforce area3 in 2015, Pinal County provides services described in this plan under the state’s ARIZONA@WORK brand.
3 The purpose of a local workforce area is to serve as a jurisdiction for the administration of workforce development activities using Adult, Dislocated Worker, and Youth funds allocated by the State and to coordinate efforts related to the other core programs at a local community level (U.S Department of Labor/Training and Employment Guidance Letter 27-14, issued April 15, 2015)

20
Workforce system alignment activities are described under Title IA of WIOA, outlining state and local provisions, state and local board administration as well as performance accountability. Title IB describes the workforce investment service delivery activities as well as providers of such services. In addition to the Adult, Dislocated Worker and Youth Programs described under Title IB of
WIOA, other “core program” as defined in the law are: WIOA Title II relating to adult education and literacy activities; WIOA Title III covering to Title sections 1 through 13 of the Wagner-Peyser Act (29
U.S.C. 49 et seq.) relating to employment services; and WIOA Title IV as described in Title I of the Rehabilitation Act of 1973 (29 U.S.C. 720 et
seq.), other than section 112 or part C of that title (29 U.S.C. 732, 741) (relating to vocational rehabilitation services).
WIOA also calls for other “required partners” to participate in a local area’s network of services. Required partners that carry out programs or activities in a local area shall:
1. Provide access through the one-stop delivery system to such program or activities carried out by the entity, including making the career services described in section 134(c)(2) that are applicable to the program or activities available at the one-stop centers (in addition to any other appropriate locations);
2. Use a portion of the funds available for the program and activities to maintain the one-stop delivery system, including payment of the infrastructure costs of one-stop
3. Enter into a local memorandum of understanding with the local board, relating to the operation of the one-stop system
4. Participate in the operation of the one-stop system consistent with the terms of the memorandum of understanding, the requirements of this title, and the requirements of the Federal laws authorizing the program or activities.
The following required partners provide services in the ARIZONA@WORK Pinal County service delivery area and are parties to the local Memorandum of Understanding:
“…the current service delivery model requires needed changes in order to
meet the demands of workforce development in the 21st century ”

21
Program Services Delivered By
• Adult Program • Dislocated Worker Program
ResCare Workforce Services
Youth Program Central Arizona College
The Adult Education and Family Literacy Act
Central Arizona College and Queen Creek Unified School District (Adult Education)
Wagner-Peyser Act Employment Service program Arizona Department of Economic Security/Workforce Development Administration
The Vocational Rehabilitation (VR) Program
Arizona Department of Economic Security/Rehabilitation Services Administration
Programs authorized under State unemployment compensation laws (in accordance with applicable Federal law)
Arizona Department of Economic Security
• Re-Employment Assistance Administration (Benefits) • Division of Employment and Rehabilitation Services
(Tax) Migrant and Seasonal Farmworker Programs under Title I of WIOA
Portable Practical Education Program (PPEP)
Trade Adjustment Assistance Arizona Department of Economic Security/Workforce Development Administration
Jobs for Veterans State Grants Programs Arizona Department of Economic Security/ Re-Employment Assistance Administration
The Senior Community Service Employment Program AARP (effective July 1, 2020)
(Arizona Department of Economic Security/Division of Aging and Adult Services subgrantee)
Employment and training activities carried out by the Department of Housing and Urban Development (Resident Opportunity for Self Sufficiency (ROSS))
Pinal County Department of Housing
Temporary Assistance for Needy Families (TANF) (Jobs Program)
ResCare Workforce Services
(Arizona Department of Economic Security/Workforce Development Administration subgrantee)
The Pinal County Workforce Development Board (PCWDB) in a shared governance role with the Pinal County Board of Supervisors serves as a strategic convener to promote and broker effective relationships among economic, education, and workforce partners throughout the local area. The PCWDB is responsible for developing a strategy based on the six purposes of WIOA to continuously improve and strengthen the ARIZONA@WORK system through innovation in, and alignment and improvement of, employment, training, and education programs to promote economic growth.

22
This plan was developed by the PCWDB, with input from core and other required program partners as well as outside stakeholders. It is intended to be used as a guiding document designed to fulfill this collective responsibility. The service delivery model described in this plan will ensure that services are provided based on the following characteristics outlined by the Workforce Arizona Council (WAC):
• Extensive Knowledge of Local Economy: Local Workforce Development Boards and ARIZONA@WORK Job Centers have extensive knowledge about the local and regional economy they serve and use labor market, economic, and employer data to inform decision-making about how to maximize the impact of the public workforce system on the local and regional economy.
• Business Engagement: Local Workforce Development Boards’ and ARIZONA@WORK Job Centers’ efforts to engage business partners are robust and comprehensive. Business Services representatives in the local areas will possess the knowledge, expertise and capacity to design and deploy custom workforce solutions for employers.
• Sector Partnerships: Local Workforce Development Boards and ARIZONA@WORK Job Centers convene and/or participate in one or more sector partnerships that are rooted in economic and labor market data analysis and driven by industry.
• Work-Based Learning Opportunities: Local Workforce Development Boards and ARIZONA@WORK Job Centers collaborate with employers to increase the availability of work-based learning opportunities such as on-the-job training, work experiences, pre-apprenticeships, and Registered Apprenticeship as training paths to employment.
• Job Seekers Trained for In-Demand Jobs: Local Workforce Development Boards and ARIZONA@WORK Job Centers focus education and training efforts on equipping job seekers and workers with skills and credentials directly connected to job placements along career pathways in high-growth/high-wage industries to the greatest extent possible.
• Industry-recognized Credentials: Local Workforce Development Boards and ARIZONA@WORK Job Centers increase the number of participants who attain personal, portable, industry recognized credentials.
• Career Pathways: Local Workforce Development Boards and ARIZONA@WORK Job Centers perpetually work to create new career pathways and promote existing employer-validated career pathways.
• Access to Services: Local Workforce Development Boards and ARIZONA@WORK Job Centers ensure access to skill development and employment services for all job seekers including access to supportive services and relevant guidance for those with barriers to employment.
• Actively Engage Veterans and Other Priority and Special Populations: Local Workforce Development Boards and ARIZONA@WORK Job Centers, working collaboratively with other community or statewide efforts when available, implement effective strategies to engage Veterans and other priority and special populations (as defined in WIOA) in workforce development services.
• Highly Integrated Service Delivery System: Local Workforce Development Boards and ARIZONA@WORK Job Centers ensure that service delivery and resources are fully integrated, coordinated between all job center partners, and centered on meeting the

23
needs of job seekers, workers, and business customers. An integrated model of service delivery and resources includes policies that enable partners to share and use captured information across multiple programs; cross-program staffing and customer flow management that optimizes efficiency and enhances customer experiences; and a management information system that effectively shares customer information across programs.
• Continuous Evaluation and Improvement of Services: Local Workforce Development Boards and ARIZONA@WORK Job Centers continuously evaluate and improve services and processes to increase job seeker, worker, and business customer access and satisfaction, and achieve performance measures.
• Use Evidence-based, Best and Promising Practices for Service Delivery: Local Workforce Development Boards and ARIZONA@WORK Job Centers provide comprehensive business and skill development services using best and promising practices and/or evidence-based practices when available.

24
THE ARIZONA@WORK PINAL COUNTY SYSTEM In some regards, the ARIZONA@WORK Pinal County workforce system can be seen as a manufacturing facility in which qualified candidates are the product being produced for the business customers who provide the employment opportunities in Pinal County. Development of this talent pipeline includes the K-12 school system and continues through post-secondary educational/training providers to ensure a well-oiled system has the inventory (talent pool) to meet the workforce demands of the county’s employer community.
FUNDING THE SYSTEM The Arizona Department of Economic Security (ADES) serves as the State administrative and fiscal agent for the Adult, Dislocated Worker and Youth funds. It also serves as the State Workforce Agency and administers the Wagner-Peyser/Employment Service and Vocational Rehabilitation grants. The Arizona Department of Education has jurisdiction over the Adult Education program. For the Adult Program, ADES allocates the funds to the local areas based on formulas that include such requisites as economically disadvantaged adults age 18 to 72, excluding college students and military from the American Community Survey. For the Dislocated Worker Program the following factors are used:

25
• Unemployment Concentration; • Unemployment Ratios, weighted for excess of state average; • Long Term (15+ weeks) Unemployment; • Insured Unemployed Exhausted Claimants; • Declining Industries (lowest 10% declining) and Employment; • Local Area Unemployment Statistics; and • Total Employment State Average.
The Youth Program factors include economically disadvantaged youth age 14-24, meeting (or member of family meeting) the Census poverty level or 70 percent of lower living standard income level (LLSIL). As listed on the state website, for 2020 the 70% LLSIL is $11,609 for a family of one and $32,245for a family of four. (NOTE: For a detailed description of the SubState Allocation formulas used for the Adult, Dislocated Worker and Youth Programs, see Exhibit 5.) ADES also serves as the administrative and fiscal agent for the Wagner-Peyser (WIOA Title III - Employment Service) and Vocational Rehabilitation (WIOA Title IV) grant funds. These funds are not allocated to the local areas, but instead ADES staff and contracted Vocational Rehabilitation counselors in each of the local workforce areas provide services offered by these grants. The Arizona Department of Education (ADOE) is the state’s administrative and fiscal agent for the Adult Education and Literacy funds (WIOA Title II). The ADOE contracts with providers throughout the state to ensure Title II services are available in each local area. Prior to Program Year 2020, ADES allocated the funds to the local areas based on the funding streams depicted in Figure 1.
Figure 1
However, in response to Covid-19, as permitted by WIOA (see Sec. 133(a)(2)), the state has elected to reserve 25% of the Dislocated Worker Program fund for Statewide Rapid Response Activities, allowing the state to respond to the increased needs of businesses and workers. At the

26
time of the writing of this plan, the State is in the process of developing a strategic vision and plan for the activities and use of these funds. As a result, for Program Year 2020, the distribution model is now the following: The Pinal County Board of Supervisors is the WIOA grant recipient, with the Pinal County Economic and Workforce Development Department as the designated entity responsible for the
administrative functions of the WIOA Adult, Dislocated Worker and Youth Program funds and the delivery of WIOA services in concert with the Pinal county Workforce Development Board. Pinal County has established fiscal controls and fund accounting procedures necessary to assure the proper disbursal and accounting of federal funds allocated to all related programs, according to generally accepted accounting principles. Pinal County, as grant recipient, is responsible for complying with all applicable uniform cost principles and administrative requirements for grants and agreements included in the appropriate circulars and rules as promulgated by the Federal Office of Management and Budget, United States Department of Labor, the Arizona Department of Economic Security (ADES) and Workforce Arizona Council policy. WIOA mandates that required partners enter into a Memorandum of Understanding (MOUs) with the Pinal County Workforce Development Board (PCWDB) regarding service delivery and the payment of infrastructure costs. Infrastructure costs to sustain the operations of the ARIZONA@WORK Pinal County system are outlined in Infrastructure Funding Agreements (IFA) that are signed by all partner programs. Costs for comprehensive center operations are based on a square footage basis. For rent charges, including utilities, each co-located partner is assigned dedicated office/cubicle space, calculating total square footage to be assigned with common areas being prorated based on the percentage of designated office/cubicle square

27
footage. Designated parking spots are allocated at per month cost per space if needed. The PCWDB will continue to explore and evaluate cost allocation methodologies to ensure infrastructure costs are allocated in a manner that meets the requirements of the IFA but does not stifle innovation and flexibility from an operational standpoint. EXPECTATIONS OF THE SYSTEM There exists a level of employers’ expectations that the workforce system can address their labor needs – regardless of skill level. In order to accomplish this, ARIZONA@WORK Pinal County acknowledges shortcomings in the ability to fill all jobs for all employers, as the public workforce system’s primary purpose is to serve those who have barriers to employment that can sometimes be significant.
Job seekers who access ARIZONA@WORK Pinal County will be provided with the opportunity to engage in two pathways. The first path is for individuals seeking a “job” which can be seen as a “quick hit” to employment. A job in this instance may be “gap employment” - a wage earned to fill a gap while the jobseeker is either engaged in training or based on immediate need, employment obtained for a paycheck regardless of long-term potential. The ARIZONA@WORK Pinal County job opportunities are posted in the Arizona Job Connection –

28
the statewide web based career management and reporting system that also houses the statewide job bank. The second path is the core focus of the ARIZONA@WORK Pinal County Workforce Development Plan. This path - CareerSTEP - will be built upon the concept of Career Pathways. ARIZONA@WORK Pinal County will use the U.S. Department of Labor – sponsored “Career Pathways Toolkit: A Guide for System Development”4. Although the primary audience for this Toolkit is staff who work at the state level, the Career Pathways Toolkit will be used and translated to the local service delivery level by ARIZONA@WORK Pinal County as the basis for the activities that will support achievement of the goals, objectives and strategies described in this plan. COMPETITIVE PROCESS USED IN AWARDING SUB GRANTS AND CONTRACTS All procurements follow federal, state and local procurement laws, regulations and policies. ARIZONA@WORK Pinal County utilizes the Pinal County-sanctioned Request for Proposal Procurement process to select eligible service providers. The competitive process is open to the public via public notices in local news media and on county web sites. Upon proposal reviews, and based on total scores from individual ranking sheets, the PCWDB forwards recommendations to the Pinal County Board of Supervisors for final approval. All proposals are subject to funding availability per U.S. Department of Labor allocations. The ARIZONA@WORK Pinal County reserves the right to: Renew contract(s) for a second year and third year without issuing a Request for Proposal
(RFP) for the second year. Accept or reject any or all of the proposals received and to cancel in part or in its entirety
a request if it is in the best interest of the county to do so. Negotiate necessary adjustments in proposed funding levels and program activities. Fund agencies outside the order of rating recommendations. Direct subcontractors to implement changes in accordance with state directives made to
comply with WIOA and applicable regulations.
The PCWDB issued a Request for Proposal for Youth Services in Spring 2016. This procurement complies with ADES issued WIOA Title IB Youth Policy “Procurement Requirements”. As a result of this procurement, Central Arizona College was selected as the Youth Provider. To date, the contract in the form of an Intergovernmental Agreement has been renewed annually through Program Year 2020 and is due for re-procurement at the end of Program Year 2020.
4 United States Department of Labor/Employment and Training Administration – Training and Employment Notice No. 17-15 issued December 1, 2015

29
WIOA requires a one-stop operator be selected by the local workforce development board after a competitive process has been conducted. To comply with this requirement, ARIZONA@WORK Pinal County issued a Request for Proposal initially in spring 2017 and again in Spring 2019 for a One Stop Operator. As a result of the most recent procurement, Chicanos Por La Causa was selected. Concurrent to the one-stop operator procurement, the contract for provision of Adult, Dislocated Worker and Rapid Response services was due to expire. Subsequently, a Request for Proposal for these services was issued. ResCare Workforce Services was awarded the contract effective July 1, 2019 to provide Adult, Dislocated Worker and Rapid Response services. NOTE: With the state reserving its statutory maximum of 25% of Rapid Response funds effective in PY 2020, the impact of local area Rapid Response activities and associated funding is still being examined at the time of the composition of this plan.
GOALS AND STRATEGIES SYSTEM ALIGNMENT Local plans under WIOA must align with the state workforce plan. The Workforce Arizona Council, Arizona Department of Economic Security (ADES) and the Arizona Department of Education (ADOE), submitted the 2020-2023 Arizona Unified State Plan in April 2020 to the federal agencies responsible for statewide implementation. The table below summarizes the alignment of focus between the state plan and this plan:
State of Arizona ARIZONA@WORK Pinal County Goals Strategies Goals Strategies
1. Promoting a strong economy
1. Promote industry sector partnerships/projects
2. Develop and implement a communication and outreach plan to promote awareness and utilization of the ARIZONA@WORK system
3. Increase and improve coordination between workforce, education and economic development efforts at the state and local level
1. Promote a strong Pinal County economy
1. Establish alignment of education, economic and workforce development efforts
2. Plan with a global perspective
2. Supporting Business Needs
1. Ensure training provided to job seekers and workers has a focus on transferable skills.
2. Create a comprehensive business engagement plan to support consistency and availability of services
2. Serve Business Needs
1. Effectively Structure ARIZONA@WORK Business Services
2. Understand Pinal County’s Business Landscape
3. Alignment of internal Employer Engagement activities

30
State of Arizona ARIZONA@WORK Pinal County Goals Strategies Goals Strategies
3. Prepare Job Seekers: Defend Against Poverty
1. Implement framework for supporting a statewide model for career pathways based on the identified in-demand industries and occupations, connecting the education and incorporating appropriate flexibility for regional variation
2. Improve processes for co-enrollment across partners to share costs and case management to better serve customers
3. Enhance initiatives supporting populations with barriers to employment to ensure customers are receiving needed services efficiently.
3. Prepare job seekers for employment opportunities in high growth industries
1. Leverage Resources By Maximizing Co-enrollment in Core Programs
2. Provide innovative options to service access for ARIZONA@WORK Pinal County customers
3. Align service delivery activities 4. Understanding the labor demands
of high-growth industries and occupations
4. Protect Taxpayers by providing efficient, accountable government services
1. Create a consistent system for continuous improvement
2. Improve processes for co-enrollment across partners to share costs and case management to better service customers
3. Identify data system solutions to enhance the interoperability and quality of data for use across ARIZONA@WORK programs
4. Provide an efficient, accountable workforce system
1. Develop a job-driven public workforce development system in Pinal County
2. Efficiently align, prioritize, and select workforce development system projects
3. Practice Evidenced-based Advertising, Outreach, and Strategic Public Relations
Pinal County, along with the eleven other Arizona local workforce development areas operates under the state brand – ARIZONA@WORK. This brand represents a more focused approach to the local workforce system, allowing customers – jobseekers and business alike - to identify with the network regardless of their geographic location. The ARIZONA@WORK Pinal County brand allows for a more regional/seamless approach to economic development efforts when leveraging several local workforce areas to meet the needs of customers. Business customers are able to recognize the statewide brand and connect with a single point of contact at their local affiliate who is already familiar with the services available. The brand also simplifies the service delivery system by erasing the confusing array of partners – all with their own branding and internal goals and processes. As we move forward, determining the total effect Covid-19 has had on the local economy and its impact on individuals requires new thinking. Strategies in this plan will focus on driving the local workforce system in a more innovative direction, one focused on a new wave of strategic thinking that will challenge the public workforce system’s partners to exceed customer expectations by offering a new service delivery culture and service mechanisms.

31
Meeting the workforce demands of the business community requires an alignment of economic development, education (including post-secondary) and workforce development efforts synchronized with statewide and Pinal County-specific strategies. Pinal County will participate in monitoring ongoing assessments of not only the state’s current economic environment, but the county’s contribution to it as well. It will be critical during the lifespan of this plan to closely monitor the economic direction of the county’s business attraction, retention and expansion efforts. Targeted industries identified by the county along with current in-demand industries and the occupations within those industries are the drivers for the workforce activities.
Alignment of these efforts at the local level requires a global perspective. This plan, in addition to aligning with the Arizona State WIOA Workforce Development Plan is also part of a larger blueprint to ensure Pinal County citizens have an opportunity to live a fulfilled life through employment. Part of this blueprint is outlined by the Center for the Future of Arizona’s “Arizona We Want”5 .
This initiative is a shared vision of success around what matters most to Arizonans that expresses their highest aspirations and hopes for the future. These efforts are tracked via a set of vetted progress meters.
These Progress Meters are an evolving, dynamic tool to measure the priorities that Arizonans identified of critical importance to the future of the state. The metrics were carefully considered and included the criteria of being: easily understood; supported by publicly available, trusted, and regularly updated data; and, useful as a guidepost for assessing policy and practice.
5 Center For The Future of Arizona (https://www.arizonafuture.org/the-arizona-we-want/overview/)
Meeting the workforce demands of the business community requires an alignment of economic development, education (including post-secondary) and workforce development efforts… Alignment of these efforts at the local level requires a global perspective.
“Strategies in this plan will focus on driving the local workforce system in a more innovative direction, one focused on a new wave of strategic thinking that will challenge the public workforce system’s partners…”

32
The Progress Meters may evolve over time, drilling data down to county level progress where possible, with the input of Arizona’s leaders, communities, and technical experts.
Successful outcomes related to the goals of this plan can only be realized through the collective efforts of the entire county community. As outlined in the Progress Meters, a broader span of influences will have a major impact on the success of the WIOA mandate. In order to ensure that the widest network of available community services is available to ARIZONA@WORK Pinal County customers, a close bond continues with community organizations that contribute to the support network, enabling program participants to remain engaged in their employment preparation efforts. Some notable engagements include but are not limited to:
Pinal Partnership: The Pinal Partnership was created with a vision of uniting community growth efforts in Pinal County. The mission of the Partnership is to “Improve research, planning and coordination of private and public efforts related to infrastructure, natural resources and community development in Pinal County.” The Pinal Partnership is a coalition of community, business, educational and governmental leaders, whose goal is to provide leadership and support in specific areas of focus. ARIZONA@WORK Pinal County holds an active membership in the Partnership. Pinal County Business and Education Partnership: The Pinal Business and Education Partnership, a committee of Pinal Partnership, was formed in 2012 when the Pinal County School Superintendent brought together members of the education, business, and government communities in collaboration with the Pinal Partnership. This collaboration supports school districts in preparing students to graduate with the skills necessary for college or career, and to begin their work as future leaders in the growth and prosperity of Pinal County and the State of Arizona. The continued efforts are facilitated through the Business-Education Committee. The active focus of the committee is highlighting and replicating successful business, government, and education collaborations throughout the county. These programs allow students to explore careers and plan for the appropriate steps in order to reach their goals. Business and Government are able to highlight skills and education that will lead to careers in specific fields. The motivation for this work is to provide opportunities to grow knowledgeable, motivated, and prepared graduates in Pinal County. ARIZONA@WORK Pinal County has joined this committee and has two active members engaged in its efforts. In 2018 and 2019, the PCWDB partnered with the Pinal Committee to hold a joint Business, Education and Workforce summit. Achieve Pinal: Workforce development is a critical component of economic growth and planning. The need to cultivate a talent pool starting in junior/high schools in order to build a local talent base to meet current and future economic growth in Pinal County is underway. Achieve Pinal strategies:
“This plan… is also part of a larger blueprint to ensure Pinal County citizens have an opportunity to live a fulfilled live through employment.”

33
Strengthening the K-12 Pipeline –Increase college readiness and high-school graduation rates Completing Credentials – Implement policies to make it easier for Arizonans to finish their
certificates or college degrees. Increasing Access – Raise awareness about options beyond high school and make them more
affordable. Aligning Workforce Needs – Engage businesses, governments and educators to identify and close
the skills gap.
Community Action Human Resources Agency (CAHRA): CAHRA is the designated community action program for Pinal County and is a leading safety net agency providing case management integrated with financial assistance, emergency home repair services, transitional housing for homeless families and Self-Help Housing for low and median income households. The agency has created a program of one-on-one services that strives to enhance personal and economic self-sufficiency.
CAHRA also places strong emphasis on building relationships with community resources, faith organizations, and municipal and state entities to ensure issues affecting the low-income population are addressed and solutions developed. The agency currently facilitates community networks in Casa Grande and Eloy and provides on-site itinerant services at the ARIZONA@WORK Pinal County Business and Career Center in Casa Grande.
Veterans Organizations: To enhance service delivery to veterans and eligible spouses of veterans, ARIZONA@WORK Pinal County’s comprehensive center is located next door to Honoring/Hiring/Helping Our Heroes of Pinal County (HOHP). The vision of the HOHP Board and committee members is to ensure that veterans and military families in Pinal County have services available to them to provide the support they need. A key mode of service delivery offered by HOHP is Eagle One – a mobile service center which travels throughout Pinal County making scheduled stops to provide services to veterans in their own communities. Pinal County Adult Probation: ARIZONA@WORK Pinal County has developed an operational partnership with Pinal County Adult Probation. The unemployment rate among adult probationers is more than seven times that of Pinal County at large. Probation Officers now have a formal process for referring unemployed and underemployed probationers to ARIZONA@WORK, where an initial assessment will determine the probationer's eligibility for the various services offered. ARIZONA@WORK program staff will communicate with Probation Officers so that each can help monitor and support the probationer's progress. Additional components of the partnership still in development include cross-training for ARIZONA@WORK and Probation staff, work readiness and related classes offered to probationers by Adult Probation, and Live Online Video Access to ARIZONA@WORK offered at locations where Probation Officers meet with probationers. Outcome goals for the partnership include: A 10% decrease in the unemployment rate for probationers by January 31, 2021; A 10% decrease in recidivism in

34
probationers by January 31, 2021; and a 10% increase in successful completion of probation rate by January 31, 2021. Against Abuse, Inc. (AAI): Against Abuse, Inc. is a private non-profit organization dedicated to helping individuals and the community understand effects of family violence and the resources available to meet the needs of those abused. In addition, the agency has taken a proactive role in providing a family focused, culturally sensitive continuum of prevention and intervention services to individuals and families in need of services. AAI began referring to ARIZONA@WORK Pinal County (then “Arizona Workforce Connection”) for employment opportunities for survivors in 2010. A formal Memorandum of Understanding was signed in 2017 and renewed in 2019. The MOU focused on providing ARIZONA@WORK Pinal County services to AAI-referred individuals. Leveraging ARIZONA@WORK Regional Partnerships: As a member of the ARIZONA@WORK statewide network, ARIZONA@WORK Pinal County will continue to partner with its affiliates throughout the state. Of particular focus will be the collaboration and coordination with ARIZONA@WORK Maricopa County and ARIZONA@WORK Pima County. When economic development business and retention efforts require a regional approach, these partnerships will be leveraged to provide a seamless and unified strategic service delivery model to meet the needs of the particular project. HOW TO GET THERE The PCWDB and the ARIZONA@WORK Pinal County partner programs will utilize this plan to mature into a proactive, innovative local workforce development area. The PCWDB is dedicated to constantly evaluating itself in seeking innovative practices from all service partners to deliver services in all areas of the county. This plan addresses the need to engage the entire county to ensure that every individual seeking employment who is in need of assistance has access to ARIZONA@WORK Pinal County services. Currently, there is one comprehensive center located in Casa Grande, the largest incorporated city in Pinal County. To ensure outreach and service access is available to the balance of the county, ARIZONA@WORK Pinal County will look to build upon successful access points by leveraging community libraries in order to build a network of locations that are accessible throughout the county. These locations will provide online and visual access via the locally developed video chat platform. This application was created by the Pinal County One Stop Operator and endorsed by the PCWDB in October 2019 as an innovative approach to providing access to remote areas of the county. Video chat gives customers access to a live, video- connected ARIZONA@WORK Pinal County representative. This approach dramatically changes the landscape of service delivery possibilities and will force partner staff to revisit how customer interactions are conducted.

35
Using labor market data, the PCWDB will develop evidence-based criteria to allow it to make informed decisions on where to locate service points. Formal agreements such as those used with Coolidge and in development stages with City of Maricopa and the Town of Superior will be the standard for solidifying these relationships. The development of this plan required the PCWDB to gather primary and secondary source data and conduct an in-depth analysis of the region. The analysis addressed items such as in-demand jobs, unemployment, education and training needs, business needs and addressing gaps among these items. Labor market trends and current labor force employment data were also taken into consideration. The impact of Covid-19 will force the PCWDB to monitor the data compiled for this plan. Data points for workforce systems are historically lagging indicators. The impacts of Covid-19 on the workforce system and planning a response to these impacts will be an ever-evolving responsibility of the PCWDB and all ARIZONA@WORK Pinal County partners. In working with local economic development members, the PCWDB has shifted its focus to future growth within the county. Per EMSI the county has a population of over 420,000 with approximately 60-65% of the county labor force commuting to surrounding counties for work. ARIZONA@WORK Pinal County, along with the county economic development teams are working on changing these trends, with higher skilled jobs and higher paying jobs available
locally. The challenge for ARIZONA@WORK Pinal County will be meeting the future in-demand labor market. The county has identified six target job sectors: Transportation/Logistics; Manufacturing; Health Services; Aerospace and Defense; Natural and Renewable Resources and Tourism. ARIZONA@WORK Pinal County will play a major part in the preparation of a
qualified workforce for jobs created by these targeted sectors. The plan shows the current economic development pipeline of companies that are targeting Pinal County. Some of these companies have already begun construction, while others are currently in negotiations with Pinal County or local city economic developers. The Pinal County Board of Supervisors have set the direction for county economic development and for local ARIZONA@WORK Pinal County efforts to move forward with linking these employers with the future of the workforce aligning efforts with the Pinal County Strategic Plan.
Target Industry Project Employees IndustryPhoenix Mart 4,500 Global Wholesale SourcingIPAZ Intermodal Facility 6,000 Industrial Park/Inland PortUnion Pacific Red Rock 250-300 Rail TransportationACA - Confidential Project 750 Household Consumables ManufacturingLucid Motors 2,200 High Tech Auto ManufacturingLKQ 200 Auto Parts manufacturingACA - Confidential Project 1,700 High Tech ManufacturingSevertson Movie Screens 15 Movie Industry Equipment Manufacturing
Health Services Sun Health Clinic/Pharmacy 15 Health care servicesInt'l Diplomatic Security Company 1,500 Pinal Airpark BasedHigh Tech Military Testing N/A Military SupportResolution Copper 3,500-4,000 Copper MiningSolar Farm & Battery Storage N/A Utilities/Electricity GenerationASARCO Expansion N/A Copper MiningACA - Confidential Project 50-100Florence Copper 250 Copper MiningMine Filtering Plant 375 Mining Support ServicesBio Gas Facility 50-75 Ag Waste Gas ProducerAttesa 18,000 Racetrack/Entertainment/Residential
Tourism Dreamport Villages 7,000 AmusementCasino Resort 450 Gambling/Amusement
Source: Pinal County Economic Development Department
Pinal County Economic Development PipelineAs of July 2018
Natural & Renewable Resources
Manufacturing
Transportation/Logistics
Aerospace & Defense
“The PCWDB is dedicated to constantly evaluating itself in seeking innovative practices from all service partners to deliver services to all areas of the county.”
36
ARIZONA@WORK Pinal County will focus on the core “Career Pathways Toolkit” to ensure that local service delivery is based on a proven systematic approach to preparing the local workforce for the targeted, in-demand occupations and for activities captured in the local plan. Changing the name of “Case Managers” to “Career Planners” allows for the general public to understand that their employment options are best served by focusing on career pathways rather than being “managed” to meet programmatic requirements. This plan strives to achieve a smooth transition between the job seeker and local business partners. Each will be served to ensure mutually supportive objectives are met. Based on the job seeker’s qualifications and utilizing the partners under WIOA, a customer-centric approach to all service strategies will be implemented to meet employers’ needs. ARIZONA@WORK Pinal County partner staff continue to provide business leaders with customized services such as posting job orders, job referrals of qualified candidates for those job orders, job fairs, recruitment, screening and interviewing schedules. A full line of business services is available. ARIZONA@WORK Pinal County will visit with employers and work with
economic developers to gather data from current local businesses to quantify their short, mid and long-term business needs. ARIZONA@WORK staff and Career Planners will also work with job seekers on career planning, labor market analysis and career path job selections based on that
analysis. Resume writing and interview skills are learned as part of services provided at the local comprehensive one-stop. The PCWDB will continue to review the current plan and update it as necessary. The plan will be considered a working document by all members of the PCWDB and ARIZONA@WORK Pinal County partner staff and community stakeholders to ensure the focus will meet the current needs of the county’s continued economic growth.
“The impacts of Covid-19 on the workforce system and planning a response to these impacts will be an ever-evolving responsibility of the PCWDB and all ARIZONA@WORK Pinal County partners.”

37
LABOR MARKET ANALYSIS In Spring 2018 Elliott D. Pollack and Company was retained by ARIZONA@WORK Pinal County to conduct an in-depth economic conditions analysis of employment trends and workforce characteristics in Pinal County. The analysis was designed to address in-demand economic sectors, occupations, and industries that have capitalized on the particular business location attributes and strengths of the County. The study provides an analysis of the skills and knowledge required by these industries and assesses the current workforce programs currently in place. This analysis informs the County of strategic opportunities that generate the types of business, industry and entrepreneurial growth and job generation that the County seeks as well as identifies weaknesses to address moving forward. In terms of employment, this analysis provides historical and forecasted growth, job types, wages, unemployment, labor force composition and participation, employment base and concentrations. This includes statistical information such as the number of jobs currently within each industry as well as companies and occupations within those industries. In addition, an assessment of the skills and educational levels of the County labor shed was performed. Data was collected from available sources such as the U.S. Census, U.S. Bureau of Labor Statistics, Arizona Office of Economic Opportunity, EMSI and the U.S. Cluster Mapping Project. This analysis assesses the knowledge and skills of residents relative to in-demand industries. Occupations within these industries are identified to help provide the County with a comprehensive list of degrees or training required to fill current and future positions. In conjunction with PCWDB members, interviews with selected government and business leaders to identify workforce needs of the County were conducted. ECONOMIC PROFILE OF PINAL COUNTY According to the Arizona Office of Economic Opportunity, several positive economic and workforce trends were recorded in Pinal County. These include:
• Population continues to increase, growing 3.5 percent from 2017 to 2018. • Population is projected to grow by 2.8 percent in 2020. • Incomes rose dramatically in Pinal County. Median family income increased from $52,788
in 2017 to $58,058 in 2018. • Labor force participation grew in 2018, increasing by 6,408 people, or 3.7 percent from
2017. • In 2018, seven out of ten major industry sectors recorded positive year-over-year
employment growth. • In 2018, employment gains were led by Professional and Business Services, which grew
by 700 jobs or 11.3 percent.

38
• Pinal County’s total employment is projected to increase by 1.5 percent annually from Q3 2018 through Q2 2020.
Economic and workforce challenges also occurred within Pinal County.
• The unemployment rate in Pinal County was higher than the statewide unemployment rate in 2018.
• In 2018, two of ten major industry sectors (Other Services and Leisure & Hospitality) reported year-over-year employment declines.
• An above average share of Pinal County residents (14 percent) have less than a high school diploma when compared with Arizona (13 percent) and the United States (12 percent).
Changes in population can have a large impact on a local economy. An area experiencing population growth, particularly growth in working-age populations, may experience an increase in economic development activity6 and workforce diversity.
6 Heady, D.D., Hodge, A (2009). The effect of population growth on economic growth: a meta-regression analysis of the macroeconomic literature. Population and Development Review, 35, 221-248.

39
• Arizona had one of the fastest growing populations in the U.S. from 2013-2017, ranking 9th among all U.S. states
• Maricopa, Pima, and Pinal counties represented 88 percent of Arizona’s total population growth from 2017 to 2018.
• Pinal County represented 12 percent of Arizona’s total population growth from 2017 to 2018, growing by 15,024 people within this period.
• Pinal County experienced the second largest numeric growth in the state, growing by 61,482 people from 2013 to 2018.
• From 2013 to 2017, 35 percent of individuals who moved to Pinal County from another state were prime-working age adults (25 to 54 years). 7
• In 2017 and 2018, Pinal Country represented 6 percent of Arizona’s total population.
Population projections provide useful insight into an area’s future demand for resources and services.8 An area experiencing population declines may choose to focus efforts on filling current job positions, while an area experiencing population growth may choose to focus on job creation. Further analysis into the composition of growing or declining populations can be a useful next step.
• Arizona is projected to add 406,032 people to its population from 2019-2022, growing by an annualized rate of 1.0 percent.
• Pinal County population is projected to add 51,963 people to its population from 2019-2022, representing 13% of total projected population growth for the state.
7 U.S. Census Bureau, American community Survey, Table s0701, 1-Year Estimates. 8 Kaneda, T. & Bremer, J. (2014). “Understanding Population Projection: Behind the Numbers. Population Reference Bureau”. Retrieved from https://www.prb.org/united-nations-population-projections/

40
• A majority of Pinal County’s population growth (89 percent) is projected to come from people migrating into the county from other Arizona counties, other states, or foreign countries.
It is important to understand the employment barriers faced by those served when developing workforce strategies. Population characteristics can help illuminate vulnerable segments of an area’s population. An area with population characteristics that are significantly different from state or national averages, may need to consider specific approaches on how best to meet the needs of their unique population.
• Median household income in Pinal County was lower than Arizona and the United States. However, median family income grew dramatically in 2018, increasing to $58,058 from $52,788 in 2017.
• Median age was higher in Pinal County than in Arizona or the United States. • Individuals with disabilities represented a larger share of total population in Pinal County
than in Arizona or the United States. • Veterans represented a larger share of total population in Pinal County than the United
States as a whole. • The labor force participation rate was considerably lower in Pinal County when
compared with the United States and Arizona.
Population growth naturally leads to growth in the labor force. The U.S. Bureau of Labor Statistics defines the labor force as individuals in the region who are either employed or unemployed (jobless, looking for a job, and available for work). Additionally, there is a labor force participation rate which measures the labor force compared to the civilian, non-

41
institutionalized population 16 years and older. Many in this age group who are not in the labor force are in school, retired, or have family responsibilities restricting work opportunities. Since 2001, both the population and labor force have more than doubled in Pinal County. In 2011, 2012, and 2013 the labor force in the County dipped slightly while population continued to increase. This suggests that the labor force participation rate declined during this period. In 2014 the labor force grew faster than total population but grew far less than population growth in 2015 again. 2016 and 2017 experienced a similar trend, with 2016 labor force growing similar to population but then population far outpacing labor force growth in 2017. This trend is not unique to Pinal County. Labor force participation across the country fell from an average of 66% to less than 63%. Greater Phoenix averaged over 68% labor force participation in the two decades leading up to the Great Recession, never falling below 66% in prior recessions. The Greater Phoenix metro fell below 62% and has shown some recovery but still far below historic norms. Due to these trends, there still may be a significant number of individuals within the working age population that may rejoin the labor force as employment opportunities continue to grow.
60,000
80,000
100,000
120,000
140,000
160,000
180,000
2001 2002 2003 2004 2005 2006 2007 2008 2009 2010 2011 2012 2013 2014 2015 2016 2017 2018YTDJune
Pinal County Civilian Labor Force2001 - 2018 YTD
Source: U.S. Dept of Labor, Bureau of Labor Statistics, AZ Office of Economic Opportunity

42
EMPLOYMENT Population growth also led to the creation of jobs, and the employment statistics for the broader Greater Phoenix region illustrate the support of population growth through increased employment opportunities. Historically, job market declines that are realized during periods of recession in the Greater Phoenix region tend to be mild. In both 1991 and 2001, the previous two recessions, job declines were minimal, only going negative during the 2001 recession. The job losses in 2009, which totaled nearly 2,700 jobs, spread across many sectors but were dominated by the construction industry and those sectors that support housing development. Employment in the County has rebounded since 2009, though due to the relatively small employment base, the growth rate varies greatly from year to year. As of the most recent data, employment is 1.3% higher than the same period last year.
Many sectors of the economy in Pinal County are at or above previous peak levels. The only exceptions are Mining and Construction, Manufacturing, and Government (though each of these sectors have shown improvements over the last few years). Significant gains have been realized in Leisure and Hospitality (tourism related industries), Education and Health Services, Information, and Professional & Business Services. Both the Information sector and Professional and Business Services sector actually never lost jobs during the recession but continued to grow both during the recession and continued to grow through the recovery.

43
Many Pinal County residents travel outside the county for work. Thus, while employment has rebounded to previous peak levels, the base of employment still requires commuting to Maricopa or Pima County for many residents. As the following unemployment rate chart illustrates, Many Pinal County residents have been able to find work after a significant number had lost employment from the recession. The unemployment rate began to rise sharply in 2008 and peaked at 12.3% in 2009. The rate has continued to improve, even with increases to the labor force, meaning regional employment has outpaced population over the last 8 years. The unemployment rate for the County as of March 2020 was 5.7% discounting the fact that the full impact of Covid-19 has yet to be realized.

44
COVID-19 has had a dramatic effect on the workforce throughout the country. In a matter of one month, the number of initial claims for unemployment insurance benefits skyrocketed as depicted in the following chart:
697
2412
3,343
2,241 1,552
10,221
21-Mar 28-Mar 4-Apr 11-Apr 18-Apr COVID-19 UI ClaimsWeek Ending on (2020)
COVID-19 Related New Unemployment Claims Pinal County
Source: Arizona Office of Economic Opportunity

45
For Pinal County, the Arizona Office of Economic Opportunity and U.S. Bureau of Labor Statistics provides data on 10 main super sectors. As the chart below shows, Government is the largest employer, accounting for 32.7% of all jobs. Trade, Transportation, & Utilities (mostly retail trade) comprise the next largest percentage of jobs with 17.5%, followed by Leisure & Hospitality (11.4%), Education & Health Services (10.2%), Professional & Business Services (10.1%), and Manufacturing (6.2%).
4.6%5.4%
7.3% 7.0%
6.0%5.6%
5.0%4.6%
7.4%
12.3%
10.7%
9.8%
8.5%8.1%
7.0%6.3%
5.5%5.0% 4.9%
2000 2001 2002 2003 2004 2005 2006 2007 2008 2009 2010 2011 2012 2013 2014 2015 2016 2017 2018YTDJune
Pinal County Unemployment RateSource: Arizona Office of Economic Opportunity

46
The “Government” sector supplies the highest percentage of jobs within Pinal County. This sector includes Federal, State, County and Local jobs and have a wide variety of industries and occupations. Some of those include:
− Professional & Business Services − Education (primary, secondary, and post-
secondary) − Utilities (water supply /irrigation systems) − Construction − Libraries − Waste Management − Fitness & Recreational Centers − Executive, Legislative, & General
Government
− Public Finance − Government Support Services − Justice, Public Order, & Safety
Activities − Legal Counsel & Prosecution − National Security & International
Affairs − Police & Fire Protection − Postal Service − Health Care & Social Assistance

46
Categorizing jobs by industry instead of aggregating jobs by who the employer may be (such as government), the County shows a much more diversified base of industries. Using this approach, it is apparent that educational services (14.5%) are the largest source of jobs, followed by retail trade (13.2%), public administration (11.2%), health care (10.5%), and accommodations & food service (10.5%).
LOCATION QUOTIENTS AND IDENTIFIED CLUSTERS By comparing Pinal County to the State of Arizona and the U.S. under more detailed industry classifications, some clustering of industries, or relative concentrations of certain industries can be identified. This is represented through the use of location quotients. Anything with a location quotient higher than 1.0 means that there is a relatively higher percentage of that industry compared to the broader economic region. Pinal County has a number of industries in which the location quotient was greater than 1.0 relative to both the United States and Arizona. Industries related to mining and agriculture are by far the most concentrated industries relative to broader economic regions. Certain manufacturing sectors (nonmetallic mineral products, chemical, food, primary metal, and plastics and rubber products) are also well represented in the county. Other industries, such as administrative & support services, waste management, utilities, and social assistance also have

47
relative concentrations in the county. Finally, local serving industries such as retail stores (food and beverage, building material & garden supply, health and personal care, gas stations, and general merchandise) as well as social assistance all had higher concentration of employment in Pinal County compared to the nation or state as a whole.
The U.S. Cluster Mapping project has created a dataset at the county level for the presence of clusters, defined as a group of individual industries that are closely related or linked, including use of labor occupations, and co-location patterns. The cluster is identified similar to location quotients. When a certain cluster is overrepresented in the county relative to the national average, it is considered a specialization. The U.S. Cluster Mapping Project further defines clusters as either “traded” or “local”. Traded industries sell to other regions and nations while local industries are present in most geographic areas, and primarily sell locally.
Industry Relative to U.S. Relative to AZNAICS 111 Crop production 2.78 3.21NAICS 112 Animal production and aquaculture 11.36 12.34NAICS 115 Agriculture and forestry support activities 1.93 1.22NAICS 212 Mining, except oil and gas 13.35 4.24NAICS 213 Support activities for mining 0.68 8.95NAICS 221 Utilities 1.17 1.01NAICS 311 Food manufacturing 1.53 3.13NAICS 325 Chemical manufacturing 1.2 2.87NAICS 326 Plastics and rubber products manufacturing 0.93 2.64NAICS 327 Nonmetallic mineral product manufacturing 2.55 2.98NAICS 331 Primary metal manufacturing 0.89 1.73NAICS 444 Building material and garden supply stores 1.33 1.30NAICS 445 Food and beverage stores 1.26 1.24NAICS 446 Health and personal care stores 0.99 1.03NAICS 447 Gasoline stations 2.36 2.39NAICS 452 General merchandise stores 2.16 1.98NAICS 561 Administrative and support services 1.3 0.91NAICS 562 Waste management and remediation services 1.25 1.66NAICS 624 Social assistance 0.81 1.05NAICS 813 Membership associations and organizations 1.01 1.40NAICS 814 Private households 0.61 1.30NAICS 999 Unclassified 1.94 0.42
Source: U.S. Bureau of Labor Statistics
2017Industry Location Quotients by Number Employed

48
As a percent of total employment, local serving clusters currently dominate the Pinal County economy. These include health services, hospitality, real estate, and retail. In terms of traded clusters, the County’s strongest sectors relative to the U.S. include business services, distribution and e-commerce, tourism, mining, upstream metals, construction, transportation and logistics, performing arts, plastics, agricultural services, and downstream metals.

49
Jobs
% of Total Jobs Sub Clusters
Local ClusterLocal Health Services
7,716 13.0%
Healthcare Provider Offices, Hospitals, Home and Residential Care, Drug Stores, Medical Laboratories, Funeral Service and Crematories, Optical Goods
Retailing, Medical Equipment Distribution and RentalLocal Hospitality Establishments 6,408 10.8%
Hospitality Establishments, Recreational Facilities and Instruction, Gifts and Souvenirs Retailing
Local Real Estate, Construction, and Development
3,675 6.2%
Specialty Contractors, Real Estate Services, Construction Materials Retailing, Concrete Products, General Contractors, Water and Sewer Line Construction,
Construction Materials Wholesaling, Highway and Street Construction, Building Equipment Distribution, Developers
Local Retailing of Clothing and General Merchandise 2,798 4.7%
General Merchandise Retailing, Apparel Retailing, Jewelry Retailing, Sewing, Needlework, and Piece Goods Retailing, Luggage Retailing
Local Motor Vehicle Products and Services
2,726 4.6%
Gasoline Stations, Automobile Dealers, Automotive Parts Retailing, Other Automotive Services, Automotive Repair Shops, Other Motor Vehicles
Distribution, Automotive Parts Wholesaling, Automotive Wholesaling, Parking Services
Local Commercial Services
2,414 4.1%
Local Professional Services, Security Services, Building Support Services, Miscellaneous Repair Services, Laundry and Linen Services, Stationery and
Office Supply Retailing, Testing Laboratories, Commercial Photography, Printing and Signmaking
Local Food and Beverage Processing and Distribution
2,146 3.6%
Retail Food Stores, Food Wholesaling, Vending and Direct Selling, Beer and Liquor Wholesaling, Beer, Wine, and Liquor Retailing, Tobacco Retailing,
Commerical and Retail BakeriesLocal Community and Civic Organizations 1,570 2.6%
Social Service Organizations, Religious Organizations, Business Associations, Labor Organizations, Political Organizations, Trusts
Local Personal Services (Non-Medical)
1,152 1.9%
Child Care Services, Hair Care Services, Other Personal Services, Personal Products Retailing, Photographic and Photofinishing Services, Repair Services,
Cleaning ServicesLocal Education and Training 996 1.7%
Elementary and Secondary Schools, Job Training Services, Recreational and Other Services
Local Household Goods and Services
953 1.6%
Landscape and Horticultural Services, Hardware Retailing, Furniture and Homefurnishings Retailing, Gardening Products and Supplies Retailing,
Electronics Repair, Hardware Wholesaling, Appliance RetailingLocal Financial Services
938 1.6%
Deposit-taking Institutions, Insurance Agents and Brokers, Tax Return Preparation Services, Collection Agencies, Pension, Health, and Welfare
FundsLocal Logistical Services
778 1.3%Local Transportation Services, Local Passenger Transportation, Warehousing
Services, Passenger Car Rental, Truck LeasingLocal Entertainment and Media
675 1.1%
Movie Theatres, Newspapers, Sporting and Hobby Retailing, Electronic and Photographic Retailing, Musical Instruments Retailing, Book and Periodical
Retailing, Video Rental, Electronic MediaLocal Utilities
349 0.6%Communications Services, Sanitary Services, Natural Gas Distribution,
Electric Power Distribition, Heating Oil and Other Fuel DealersLocal Industrial Products and Services
164 0.3%
Miscellaneous Equipment Rental and Leasing, Industrial Products and Services Wholesaling, Industrial Machinery and Distribution, Industrial Repair
Services
Source: U.S. Cluster Mapping (http://clustermapping.us), Institute for Strategy and Competitiveness, Harvard Business School. Copyright © 2018 President and Fellows of Harvard College. All rights reserved. Research funded in part by the U.S. Department of Commerce, Economic Development Administration.
Pinal County Industry Clusters Identified by the U.S. Cluster Mapping Project 2016

50
Jobs
% of Total Jobs Sub-Clusters Industries
Traded ClustersBusiness Services 4,722 7.9% Business Support Services, Computer
Services, Engineering, Corporate Headquarters, Architectural & Drafting
Services, Ground Passenger Transportation, Employment Placement
Services, Consulting
Facilities Support, Engineering, Translation & Interpretation , Legal , Drafting, Landscape Architectural Services, Architects, Telephone Answering, Telemarketing Bureaus, Payroll, Professional Employer Organizations, Lessors of Nonfinancial Intangible Assets, Data Processing, Computer Facilities Management, Data Processing, Hosting, and Related, Other Computer Related Services, Computer Systems Design, Custom Computer Programming,
Offices of Other Holding Companies, Corporate & Regional Managing Offices, Taxi & Limousine Service, Executive Search, Employment Placement Agencies, Managment Consulting, Distribution & Logistics Consulting, Human Resources Consulting, Other Scientific & Technical Consulting,
Administrative ConsultingDistribution & Electronic Commerce
2,191 3.7% Warehousing & Storage, Construction & Mining Machinery & Equipment,
Wholesale of Farm Products & Supplies, Electronic & Catalog Shopping, Rental &
Leasing, Wholesale
Refrigerated Warehousing and Storage, General Warehousing and Storage, Drugs and Druggists' Sundries Merchant Wholesalers, Construction and Mining (except Oil Well) Machinery and Equipment Merchant Wholesalers, Farm Product Warehousing and Storage, Farm Supplies Merchant
Wholesalers, Electronic Auctions, Business to Business Electronic Markets, Electronic Shopping, Office Machinery and Equipment Rental and Leasing, Construction, Mining, and Forestry Machinery and Equipment Rental and Leasing, Other Commercial and Industrial Machinery and Equipment Rental and
Leasing, Metal Service Centers and Other Metal Merchant Wholesalers, Sporting and Recreational Goods and Supplies Merchant Wholesalers
Hospitality & Tourism 1,614 2.7% Accommodations & Related Services, Tourism Attractions, Entertainment,
Spectator Sports
Hotels, Convention & Visitors Bureaus, Bed-and-Breakfast Inns, RV Parks & Campgrounds, Recreation & Vacation Camps, All Other Amusement & Recreation Industries, Scenic & Sightseeing Transportation, Tour Operators, Travel Agencies, Zoos & Botanical Gardens, Historical Sites, Museums,
RacetracksFood Processing & Manufacturing
1,469 2.5% Dairy Products, Baked Goods, Farm Wholesalers, Animal Foods
Dry, Condensed, and Evaporated Dairy Product Manufacturing, Fluid Milk Manufacturing, Tortilla Manufacturing, Other Snack Food Manufacturing, Grain & Field Bean Whsle, Grain and Field Bean Merchant Wholesalers, Other Animal Food Manufacturing
Upstream Metal Manufacturing
900 1.5% Metal Products, Metal Processing, Wires & Springs
Iron and Steel Pipe and Tube Manufacturing from Purchased Steel, Other Fabricated Wire Product Manufacturing, Primary Smelting and Refining of Copper, Nonferrous Metal (except Aluminum) Smelting and Refining, Secondary Smelting, Refining, and Alloying of Copper, Copper Rolling, Drawing,
Extruding, and Alloying , Copper Wire (except Mechanical) Drawing , Copper Rolling, Drawing, and Extruding Paper & Packaging 760 1.3% Paper products, Packaging All Other Converted Paper Product Manufacturing, Paper Bag and Coated and Treated Paper Manufacturing
Metal Mining 748 1.3% Metal Mining Copper Ore & Nickel Ore Mining, Gold Ore Mining, All Other Metal Ore Mining, Support Activities for Metal MiningConstruction Products & Services
705 1.2% Construction, Construction Components, Water, Sewage, & Other Systems,
Construction Materials, Construction Products
Power/Communications Transmission Line, Manufacturing & Industrial Buildings, Oil & Gas Pipeline, Other Heavy Construction, Civil Engineering Construction, Cement Manufacturing, Mineral Wood Manufacturing, Miscellaneous Nonmetallic Mineral Product Manufacturing, Concrete Block & Brick
Manufacturing, Cut Stone & Stone Product Manufacturing, Water Supply & Irrigation Systems, Asphalt Shingle & Coationg Material Manufacturing, Asphalt Paving Mixture & Block Manufacturing, Plumbing Fixture Fitting & Trim Manufacturing, Metal Tank Manufacturing
Transportation & Logistics
478 0.8% Air Transportation, Trucking, Ground Transportation Support Activities,
Specialty Air Transportation
Scheduled & Non-Scheduled Freight or Air Transportation, Other Airport Operations, Other Support Activities for Air Transportation, Specialized Freight (except Used Goods) Trucking, Long-Distance, General Freight Trucking, Long-Distance, Truckload, Packing and Crating, Support Activities for Rail
Transportation, Freight Transportation Arrangement, Other Support Activities for Road Transportation, All Other Support Activities for TransportationPerforming Arts 471 0.8% Performing Artists, Promoters & Managers Musical Groups and Artists, Theater Companies and Dinner Theaters, Independent Artists, Writers, and Performers, Agents and Managers for Artists,
Athletes, Entertainers, and Other Public Figures, Promoters of Performing Arts, Sports, and Similar Events with Facilities, Promoters of Performing Arts, Sports, and Similar Events without Facilities
Downstream Metal Products
415 0.7% Metal Products, Fabricated Metal Structures
Saw Blade and Handsaw Manufacturing, Hardware Manufacturing, Ornamental and Architectural Metal Work Manufacturing, Prefabricated Metal Building and Component Manufacturing, Fabricated Structural Metal Manufacturing
Plastics 300 0.5% Plastic Products Plastics Bottle Manufacturing, Polystyrene Foam Product Manufacturing, Plastics Plumbing Fixture Manufacturing, Plastics Pipe and Pipe Fitting Manufacturing, All Other Plastics Product Manufacturing
Nonmetal Mining 254 0.4% Nonmetal Mining All Other Nonmetallic Mineral Mining, Nonmetallic Minerals Support Activity (exc Fuels), Crushed and Broken Granite Mining and Quarrying, Other Crushed and Broken Stone Mining and Quarrying, Crushed and Broken Limestone Mining and Quarrying, Construction Sand and Gravel Mining
Agricultural Inputs & Services
210 0.4% Agricultural Services, Fertilizers, Farm Management & Labor Services
Cotton Ginning, Crop Harvesting, Primarily by Machine, Postharvest Crop Activities (except Cotton Ginning), Soil Preparation, Planting, and Cultivating, Fertilizer (Mixing Only) Manufacturing, Farm Management Services
Financial Services 174 0.3% Credit Intermediation, Securities Brokers, Dealers, and Exchanges, Financial
Investment Activities
Sales Financing, Other Activities Related to Credit Intermediation, Real Estate Credit, All Other Nondepository Credit Intermediation, Consumer Lending, Commodity Contracts Brokerage, Mortgage and Nonmortgage Loan Brokers, Securities Brokerage, Trust, Fiduciary, and Custody Activities,
Miscellaneous Intermediation, Portfolio Management, Investment AdviceOil & Gas Production & Transportation
130 0.2% Drilling Wells, Support Activities for Oil & Gas Operations, Pipeline Transportation
Drilling Oil and Gas Wells, Support Activities for Oil and Gas Operations, Pipeline Transportation of Natural Gas
Pinal County - Non-Agricultural, Traded Industry Clusters Identified by the U.S. Cluster Mapping Project - 2016
Source: U.S. Cluster Mapping (http://clustermapping.us), Institute for Strategy and Competitiveness, Harvard Business School. Copyright © 2018 President and Fellows of Harvard College. All rights reserved. Research funded in part by the U.S. Department of Commerce, Economic Development Administration.

51
WORKFORCE CHARACTERISTICS An estimated 135,000 Pinal County residents are employed in a variety of industries regionally. The following chart shows the distribution of Pinal County residents who are employed by type of industry. Retail trade ranks highest, followed by health care and social assistance, accommodation & food services, and education.
In terms of diversifying the economy, Pinal County has a large workforce trained in many industries. The following table illustrates the potential opportunity by industry by comparing the current workforce to current jobs in the County. Only Agriculture and Mining show more jobs than there are Pinal County residents employed in those jobs. These industries are importing workers from outside the County. For almost every industry, there are significantly more Pinal County residents employed in industries than there are jobs available in those industries in the County. This illustrates a significant opportunity to leverage the existing workforce to new companies considering the County.
0.0%
2.0%
4.0%
6.0%
8.0%
10.0%
12.0%
14.0%
16.0%
Pinal County Residents Employed By Industry - 2015Source: U.S. Census Bureau 2018 OnTheMap Application. Longitudinal-Employer Household Dynamics Program

52
The reality of the inflow and outflow of workers is actually even greater than the conceptual table shown above. While there are residents likely qualified to fill jobs in many industries within the County, more workers travel in from outside of the County to fill those positions, meaning even more qualified workers are leaked out to neighboring counties. The U.S. Census reports an estimated 58,885 jobs within Pinal County as of 2015. Of that total, an estimated 32,492 jobs (55%) are filled by Pinal County residents while the remaining 26,393 jobs are filled by residents of neighboring counties commuting into Pinal. The remaining 102,377 residents of Pinal County who are employed commute outside of the County for work.
Industry
Pinal County
Jobs
Pinal County Residents Employed
Net (Import) Export
Agriculture 2,448 2,054 (394)Mining & Quarrying 1,633 1,195 (438)Utilities 487 1,001 514Construction 2,126 7,497 5,371Manufacturing 3,690 9,968 6,278Wholesale Trade 1,223 4,662 3,439Retail Trade 7,787 19,187 11,400Transportation & Warehousing 828 3,997 3,169Information 701 2,291 1,590Finance and Insurance 877 5,902 5,025Real Estate and Rental and Leasing 605 2,367 1,762Professional, Scientific, & Technical Services 1,193 5,590 4,397Management of Companies and Enterprises 99 1,401 1,302Administration & Support, Waste Management 4,861 11,575 6,714Educational Services 8,527 11,785 3,258Health Care & Social Assistance 6,200 17,066 10,866Arts, Entertainment, and Recreation 1,069 2,630 1,561Accommodation & Food Services 6,184 12,963 6,779Other Services 1,744 3,739 1,995Public Administration 6,603 7,999 1,396
Pinal County Employment Versus Resident Employment2015
Source: U.S. Census Bureau 2018 OnTheMap Application. Longitudinal-Employer Household Dynamics Program

53
Pinal County residents also travel a considerable distance to work. Over 55% of the workforce travels 25 miles or more each way for work, with 16.5% traveling more than 50 miles each way.
Count ShareTotal All Jobs 134,869 100.0%
Less than 10 miles 22,604 16.8%
10 to 24 miles 37,678 27.9%
25 to 50 miles 52,326 38.8%
Greater than 50 miles 22,261 16.5%
Source: U.S. Census Bureau. 2018. OnTheMap Application. Longitudinal-Employer Household Dynamics Program
Distance/Direction Report - 2015Home Census Block to Work Census Block

54
The following map and graphic show the locations of jobs filled by Pinal County residents. An estimated 64.5% of the workforce travels into Maricopa County for work. Pinal County comes in 2nd with 24.1% of the workforce, followed by Pima County with 7.0% of the workforce.
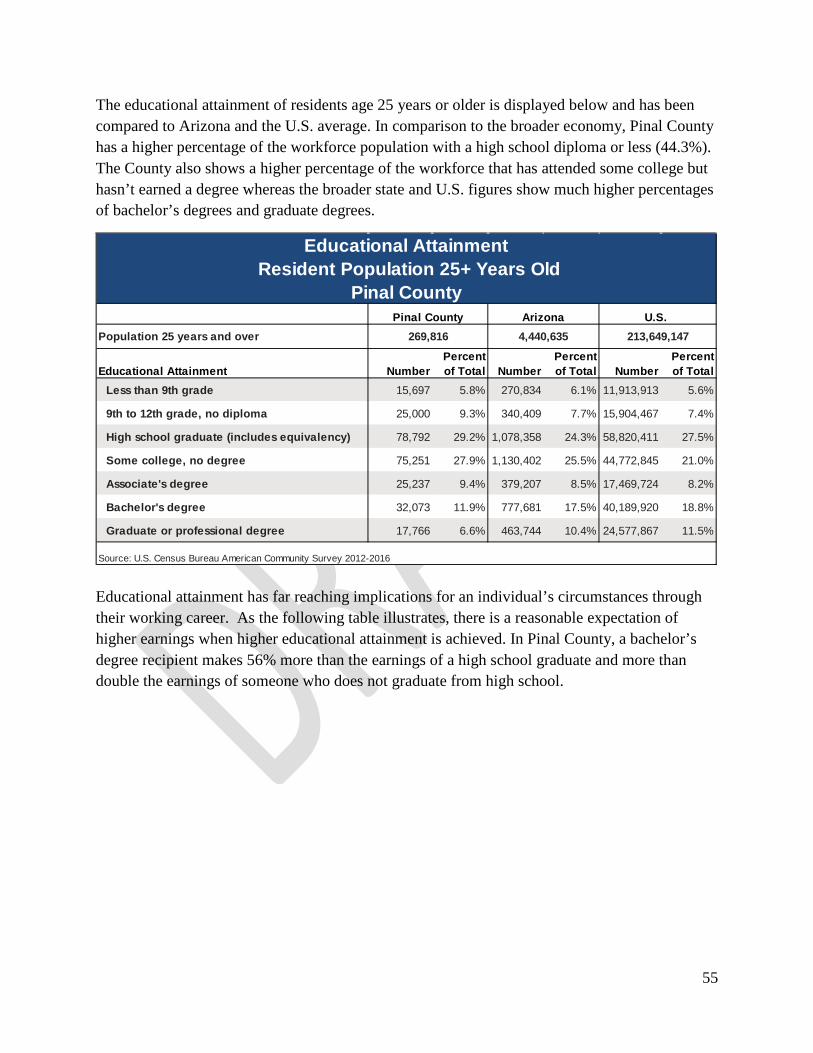
55
The educational attainment of residents age 25 years or older is displayed below and has been compared to Arizona and the U.S. average. In comparison to the broader economy, Pinal County has a higher percentage of the workforce population with a high school diploma or less (44.3%). The County also shows a higher percentage of the workforce that has attended some college but hasn’t earned a degree whereas the broader state and U.S. figures show much higher percentages of bachelor’s degrees and graduate degrees.
Educational attainment has far reaching implications for an individual’s circumstances through their working career. As the following table illustrates, there is a reasonable expectation of higher earnings when higher educational attainment is achieved. In Pinal County, a bachelor’s degree recipient makes 56% more than the earnings of a high school graduate and more than double the earnings of someone who does not graduate from high school.
Population 25 years and over
Educational Attainment NumberPercent of Total Number
Percent of Total Number
Percent of Total
Less than 9th grade 15,697 5.8% 270,834 6.1% 11,913,913 5.6%
9th to 12th grade, no diploma 25,000 9.3% 340,409 7.7% 15,904,467 7.4%
High school graduate (includes equivalency) 78,792 29.2% 1,078,358 24.3% 58,820,411 27.5%
Some college, no degree 75,251 27.9% 1,130,402 25.5% 44,772,845 21.0%
Associate's degree 25,237 9.4% 379,207 8.5% 17,469,724 8.2%
Bachelor's degree 32,073 11.9% 777,681 17.5% 40,189,920 18.8%
Graduate or professional degree 17,766 6.6% 463,744 10.4% 24,577,867 11.5%
Educational Attainment Resident Population 25+ Years Old
Pinal CountyPinal County Arizona U.S.
269,816 4,440,635 213,649,147
Source: U.S. Census Bureau American Community Survey 2012-2016

56
Earnings is directly correlated with poverty. Nearly 29% of individuals with less than a high school diploma in Pinal County are considered in poverty. That figure is cut nearly in half by graduating high school (16%). And only 5.5% of individuals with a bachelor’s degree or higher are in poverty. These figures are fairly consistent across geographic boundaries.
Pinal County Arizona U.S.
Population 25 years and over with earnings $33,375 $35,022 $36,810
Less than high school graduate $21,166 $20,053 $20,924
High school graduate (includes equivalency) $28,479 $27,300 $28,672
Some college or associate's degree $34,813 $33,941 $34,412
Bachelor's degree $44,352 $49,046 $51,094
Graduate or professional degree $51,202 $61,102 $67,832
MEDIAN ANNUAL EARNINGS
Source: U.S. Census Bureau American Community Survey 2012-2016
(IN 2016 INFLATION-ADJUSTED DOLLARS)
Pinal County Arizona U.S.Less than high school graduate 28.8% 31.0% 27.1%
High school graduate (includes equivalency) 16.0% 16.8% 14.3%
Some college or associate's degree 9.5% 11.2% 10.4%
Bachelor's degree or higher 5.5% 5.5% 4.5%
POVERTY RATE FOR THE POPULATION 25+ YEARS
Source: U.S. Census Bureau American Community Survey 2012-2016
BY EDUCATIONAL ATTAINMENT LEVEL

57
Pinal County appears to have an issue in graduating its students from high school and getting them into post-secondary training. As the chart below shows, for the population 18-24 years old, 26.5% are less than a high school graduate versus 16.9% for the state and 13.8% across the U.S. Over 35% have attended some college or earned an associate’s degree. But across the state, 44.4% have attended some college or earned an associate’s as compared to 46.0% across the U.S. Finally, only 2.5% of the population age 18-24 has earned a bachelor’s degree or higher versus 7.4% across the state and 10.2% across the U.S.

58
YOUTHThe Arizona Department of Education annually publishes graduate9 and dropout10 rates for thestate, counties and school districts.
Source: Arizona Department of Education (October 2019) (https://www.azed.gov/accountability-research/data/)
9 Graduation data is reported for Cohort Year 2018 English Learner students as well as a combination of Cohort Year 2018 English Learner students and Cohort Year 2018 former English learner students. 10 The calculation of dropout statistics is a cooperative effort of the local school districts, the Arizona Department of Education, the Arizona State Legislature, and the United States Department of Education. Dropout data is reported for fiscal year 2019 English Learner students as well as a combination of fiscal year 2019English Learner students nad former English Learner students.
Population 18 to 24 years
Educational Attainment NumberPercent of
Total NumberPercent of
Total NumberPercent of
TotalLess than high school graduate 8,309 26.5% 113,051 16.9% 4,326,831 13.8%
High school graduate (includes equivalency) 11,227 35.8% 209,298 31.3% 9,390,475 30.0%
Some college or associate's degree 11,062 35.2% 296,547 44.4% 14,398,370 46.0%
Bachelor's degree or higher 799 2.5% 49,428 7.4% 3,180,901 10.2%
Educational AttainmentResident Population 18-24 Years Old
Source: U.S. Census Bureau American Community Survey 2012-2016
Pinal CountyPinal County Arizona U.S.
31,397 668,324 31,296,577
County RateGreenlee 94.34%Santa Cruz 92.66%Yuma 87.95%Graham 87.31%Cochise 86.55%Mohave 82.65%Coconino 82.53%Yavapai 82.53%LaPaz 81.33%Pinal 80.42%Navajo 79.16%Maricopa 78.24%Pima 74.14%Apache 74.03%Gila 72.45%
Cohort Year 2018 Four Year Graduation RateCounty Rate
Greenlee 0.96%Santa Cruz 1.15%Yuma 2.59%Yavapai 2.85%Coconino 3.32%Maricopa 3.50%Cochise 3.54%LaPaz 3.88%Graham 3.96%Pinal 4.01%Mohave 4.35%Navajo 4.66%Apache 4.82%Gila 4.89%Pima 5.79%
FY 2019 Dropout Rate

59
According to the U.S. Census, approximately 46.8% of Pinal County’s youth aged 15 to 24 are not enrolled in school. This equates to 21,891 individuals. The percent of youth not enrolled in school is comparable to several of Arizona’s rural counties such as Cochise, Gila, and Mohave counties. The percentage is well above the statewide average of 38.8% and the U.S. average of 35.6%. In order to achieve the statewide average, Pinal County would need to effectively enroll an additional 3,750 students not currently enrolled. While not specifically reported in this table, it is apparent that the vast majority of youth not enrolled in school are over the age of 19. The U.S. Census reports the employment status and educational attainment of youth aged 16-19 by enrollment status. Of the 21,891 youth not enrolled in school, only 4,777 are aged 16-19 and 57% of those not enrolled have achieved a high school diploma or equivalency. Those not enrolled who have achieved a high school diploma or equivalency lags many other counties in the State with the exception of Gila County and Mohave County. The statewide average is 68% and the U.S average is 71%. Of the 4,777 youth in Pinal County aged 16-19 not enrolled in school, 1,944 (40.7%) are employed. The percent of unenrolled youth employed places Pinal County near the middle of the Arizona counties and those that exceed the county are not substantially higher. The county with the highest employment rate is Cochise County (56%). The statewide average is 46%. Of those employed youth 67.2% have a high school degree. 736 (15.4%) unenrolled youth in Pinal County are unemployed compared to 17.4% across the state. The U.S. average for this cohort is 16.5%. Finally, there are 2,097 (43.9%) unenrolled youth that are reportedly not in the labor force. This compares to 37.0% across the state and 34.5% for the U.S.

60
Pina
l Cou
nty
Apac
he C
ount
y
Coch
ise
Coun
ty
Coco
nino
Cou
nty
Gila
Cou
nty
Gra
ham
Cou
nty
Gre
enle
e Co
unty
La P
az C
ount
y
Mar
icop
a Co
unty
Moh
ave
Coun
ty
Nava
jo C
ount
y
Pim
a Co
unty
Sant
a Cr
uz C
ount
y
Yava
pai C
ount
y
Yum
a Co
unty
Stat
e or
Ariz
ona
Unite
d St
ates
Total 46,767 11,322 16,184 32,932 5,566 5,810 1,298 1,990 563,480 20,551 15,165 158,577 6,906 21,948 32,698 941,194 43,869,155Enrolled Public Schools 22,760 6,552 7,739 23,534 2,835 3,176 707 913 319,168 9,538 7,770 92,366 4,194 11,468 16,857 529,577 23,780,707Enrolled Private Schools 2,116 272 535 898 171 197 29 55 30,470 1,265 312 7,173 305 2,384 564 46,746 4,453,227Not enrolled in School 21,891 4,498 7,910 8,500 2,560 2,437 562 1,022 213,842 9,748 7,083 59,038 2,407 8,096 15,277 364,871 15,635,221Source: U.S. Census Bureau American Community Survey 2012-2016
Population by Enrollment Status15-24 Year Olds
Pina
l Cou
nty
Apac
he C
ount
y
Coch
ise
Coun
ty
Coco
nino
Cou
nty
Gila
Cou
nty
Gra
ham
Cou
nty
Gre
enle
e Co
unty
La P
az C
ount
y
Mar
icop
a Co
unty
Moh
ave
Coun
ty
Nava
jo C
ount
y
Pim
a Co
unty
Sant
a Cr
uz C
ount
y
Yava
pai C
ount
y
Yum
a Co
unty
Stat
e or
Ariz
ona
Unite
d St
ates
Total 46,767 11,322 16,184 32,932 5,566 5,810 1,298 1,990 563,480 20,551 15,165 158,577 6,906 21,948 32,698 941,194 43,869,155Enrolled Public Schools 48.7% 57.9% 47.8% 71.5% 50.9% 54.7% 54.5% 45.9% 56.6% 46.4% 51.2% 58.2% 60.7% 52.3% 51.6% 56.3% 54.2%Enrolled Private Schools 4.5% 2.4% 3.3% 2.7% 3.1% 3.4% 2.2% 2.8% 5.4% 6.2% 2.1% 4.5% 4.4% 10.9% 1.7% 5.0% 10.2%Not enrolled in School 46.8% 39.7% 48.9% 25.8% 46.0% 41.9% 43.3% 51.4% 38.0% 47.4% 46.7% 37.2% 34.9% 36.9% 46.7% 38.8% 35.6%Source: U.S. Census Bureau American Community Survey 2012-2016
Population by Enrollment Status15-24 Year Olds

61
Pina
l Cou
nty
Apac
he C
ount
y
Coch
ise
Coun
ty
Coco
nino
Cou
nty
Gila
Cou
nty
Gra
ham
Cou
nty
Gre
enle
e Co
unty
La P
az C
ount
y
Mar
icop
a Co
unty
Moh
ave
Coun
ty
Nava
jo C
ount
y
Pim
a Co
unty
Sant
a Cr
uz C
ount
y
Yava
pai C
ount
y
Yum
a Co
unty
Stat
e or
Ariz
ona
Unite
d St
ates
Total 19,513 5,098 6,478 12,386 2,144 2,267 583 883 221,331 8,634 6,525 56,303 3,120 9,632 12,183 367,080 17,061,952Enrolled in school 14,736 4,140 4,636 11,366 1,811 1,917 468 676 184,062 6,870 5,029 47,779 2,823 7,918 9,976 304,207 14,633,234
Employed 3,340 390 1,263 2,526 517 442 95 186 48,931 2,177 715 11,391 267 2,384 2,241 76,865 3,781,088Unemployed 954 243 324 1,244 105 61 29 36 12,443 452 524 5,046 132 901 667 23,161 1,049,793Not in labor force 10,442 3,507 3,049 7,596 1,189 1,414 344 454 122,688 4,241 3,790 31,342 2,424 4,633 7,068 204,181 9,802,353
Not enrolled in school 4,777 958 1,842 1,020 333 350 115 207 37,269 1,764 1,496 8,524 297 1,714 2,207 62,873 2,428,718High school graduate/Equivalent 2,710 675 1,586 617 173 230 73 143 25,693 909 1,004 5,670 234 1,301 1,744 42,762 1,730,579
Employed 1,307 164 988 220 45 91 39 56 14,318 423 388 3,154 140 648 997 22,978 977,361Unemployed 312 64 190 154 54 47 24 33 4,378 131 214 1,290 27 301 180 7,399 281,913Not in labor force 1,091 447 408 243 74 92 10 54 6,997 355 402 1,226 67 352 567 12,385 471,305
Not high school graduate 2,067 283 256 403 160 120 42 64 11,576 855 492 2,854 63 413 463 20,111 698,139Employed 637 5 42 166 28 0 15 0 3,430 319 59 711 0 142 117 5,671 212,550Unemployed 424 30 86 46 42 23 3 38 1,927 161 99 529 0 78 73 3,559 119,282Not in labor force 1,006 248 128 191 90 97 24 26 6,219 375 334 1,614 63 193 273 10,881 366,307
Source: U.S. Census Bureau American Community Survey 2012-2016
Employment Status by Educational Attaiment16-19 Year Olds

62
Pina
l Cou
nty
Apac
he C
ount
y
Coch
ise
Coun
ty
Coco
nino
Cou
nty
Gila
Cou
nty
Gra
ham
Cou
nty
Gre
enle
e Co
unty
La P
az C
ount
y
Mar
icop
a Co
unty
Moh
ave
Coun
ty
Nava
jo C
ount
y
Pim
a Co
unty
Sant
a Cr
uz C
ount
y
Yava
pai C
ount
y
Yum
a Co
unty
Stat
e or
Ariz
ona
Unite
d St
ates
Total 19,513 5,098 6,478 12,386 2,144 2,267 583 883 221,331 8,634 6,525 56,303 3,120 9,632 12,183 367,080 17,061,952Enrolled in school 75.5% 81.2% 71.6% 91.8% 84.5% 84.6% 80.3% 76.6% 83.2% 79.6% 77.1% 84.9% 90.5% 82.2% 81.9% 82.9% 85.8%
Employed 17.1% 7.7% 19.5% 20.4% 24.1% 19.5% 16.3% 21.1% 22.1% 25.2% 11.0% 20.2% 8.6% 24.8% 18.4% 20.9% 22.2%Unemployed 4.9% 4.8% 5.0% 10.0% 4.9% 2.7% 5.0% 4.1% 5.6% 5.2% 8.0% 9.0% 4.2% 9.4% 5.5% 6.3% 6.2%Not in labor force 53.5% 68.8% 47.1% 61.3% 55.5% 62.4% 59.0% 51.4% 55.4% 49.1% 58.1% 55.7% 77.7% 48.1% 58.0% 55.6% 57.5%
Not enrolled in school 24.5% 18.8% 28.4% 8.2% 15.5% 15.4% 19.7% 23.4% 16.8% 20.4% 22.9% 15.1% 9.5% 17.8% 18.1% 17.1% 14.2%High school graduate/Equivalent 13.9% 13.2% 24.5% 5.0% 8.1% 10.1% 12.5% 16.2% 11.6% 10.5% 15.4% 10.1% 7.5% 13.5% 14.3% 11.6% 10.1%
Employed 6.7% 3.2% 15.3% 1.8% 2.1% 4.0% 6.7% 6.3% 6.5% 4.9% 5.9% 5.6% 4.5% 6.7% 8.2% 6.3% 5.7%Unemployed 1.6% 1.3% 2.9% 1.2% 2.5% 2.1% 4.1% 3.7% 2.0% 1.5% 3.3% 2.3% 0.9% 3.1% 1.5% 2.0% 1.7%Not in labor force 5.6% 8.8% 6.3% 2.0% 3.5% 4.1% 1.7% 6.1% 3.2% 4.1% 6.2% 2.2% 2.1% 3.7% 4.7% 3.4% 2.8%
Not high school graduate 10.6% 5.6% 4.0% 3.3% 7.5% 5.3% 7.2% 7.2% 5.2% 9.9% 7.5% 5.1% 2.0% 4.3% 3.8% 5.5% 4.1%Employed 3.3% 0.1% 0.6% 1.3% 1.3% 0.0% 2.6% 0.0% 1.5% 3.7% 0.9% 1.3% 0.0% 1.5% 1.0% 1.5% 1.2%Unemployed 2.2% 0.6% 1.3% 0.4% 2.0% 1.0% 0.5% 4.3% 0.9% 1.9% 1.5% 0.9% 0.0% 0.8% 0.6% 1.0% 0.7%Not in labor force 5.2% 4.9% 2.0% 1.5% 4.2% 4.3% 4.1% 2.9% 2.8% 4.3% 5.1% 2.9% 2.0% 2.0% 2.2% 3.0% 2.1%
Source: U.S. Census Bureau American Community Survey 2012-2016
Employment Status by Educational Attaiment16-19 Year Olds

64
COUNTY SUB-AREA COMPARISONS Pinal County was subdivided into four sub-markets for additional review and comparison. For data collection purposes, Census block groups or Census tracts were utilized to define the boundaries of these sub-areas. The four sub-areas are referred to as regions 1 through 4 and generally described as “Region 1 - North”, “Region 2 – Central”, “Region 3 – East”, and “Region 4 – West”. The following map approximates these regions.

65
Over half of Pinal County’s population is currently located in the North region, followed second by the Central region with 35.6% of the population. Region 3 (Copper Corridor) and Region 4 (West) are significantly more sparse with 7.8% and 3.8% of the population, respectively. Region 3 contains even fewer children than its overall share of the population and a much higher share of persons 60 and older compared to its share of total population.
Number Number% of
County Number% of
County Number% of
County Number% of
CountyTotal: 397,604 210,007 52.8% 141,352 35.6% 31,059 7.8% 15,186 3.8% Under 5 years 25,065 14,760 58.9% 7,993 31.9% 1,149 4.6% 1,163 4.6% 5 to 9 years 27,875 16,291 58.4% 8,768 31.5% 1,335 4.8% 1,481 5.3% 10 to 14 years 28,081 16,056 57.2% 9,510 33.9% 1,481 5.3% 1,034 3.7% 15 to 17 years 15,370 8,233 53.6% 5,497 35.8% 984 6.4% 656 4.3% 18 and 19 years 9,159 4,976 54.3% 3,282 35.8% 510 5.6% 391 4.3% 20 years 4,863 2,712 55.8% 1,639 33.7% 160 3.3% 352 7.2% 21 years 4,097 1,716 41.9% 2,004 48.9% 297 7.2% 80 2.0% 22 to 24 years 13,278 6,681 50.3% 5,667 42.7% 492 3.7% 438 3.3% 25 to 29 years 25,110 11,710 46.6% 11,176 44.5% 1,061 4.2% 1,163 4.6% 30 to 34 years 27,653 14,390 52.0% 10,872 39.3% 1,114 4.0% 1,277 4.6% 35 to 39 years 27,470 15,283 55.6% 9,807 35.7% 1,037 3.8% 1,343 4.9% 40 to 44 years 25,497 13,856 54.3% 9,282 36.4% 1,258 4.9% 1,101 4.3% 45 to 49 years 22,142 11,853 53.5% 7,810 35.3% 1,509 6.8% 970 4.4% 50 to 54 years 22,942 11,391 49.7% 8,827 38.5% 1,817 7.9% 907 4.0% 55 to 59 years 22,807 11,738 51.5% 8,278 36.3% 2,060 9.0% 731 3.2% 60 and 61 years 9,302 5,014 53.9% 2,887 31.0% 1,152 12.4% 249 2.7% 62 to 64 years 14,420 7,536 52.3% 4,629 32.1% 1,883 13.1% 372 2.6% 65 and 66 years 10,297 4,949 48.1% 3,482 33.8% 1,662 16.1% 204 2.0% 67 to 69 years 14,798 7,364 49.8% 5,039 34.1% 2,055 13.9% 340 2.3% 70 to 74 years 20,761 10,294 49.6% 6,674 32.1% 3,380 16.3% 413 2.0% 75 to 79 years 13,614 6,688 49.1% 4,402 32.3% 2,317 17.0% 207 1.5% 80 to 84 years 7,361 3,576 48.6% 2,289 31.1% 1,313 17.8% 183 2.5% 85 years and over 5,642 2,940 52.1% 1,538 27.3% 1,033 18.3% 131 2.3%Source: U.S. Census Bureau American Community Survey 2012-2016
Region 1 Region 2 Region 3 Region 4West
Pinal County
Population by Age
North Central East

66
The following table illustrates the share of population within each region by age group. The North and West regions have relatively higher percentages of children whereas the east region has the highest presence of retirees.
Number% of Total Number
% of Total Number
% of Total Number
% of Total Number
% of Total
Total: 397,604 210,007 141,352 31,059 15,186 Under 5 years 25,065 6.3% 14,760 7.0% 7,993 5.7% 1,149 3.7% 1,163 7.7% 5 to 9 years 27,875 7.0% 16,291 7.8% 8,768 6.2% 1,335 4.3% 1,481 9.8% 10 to 14 years 28,081 7.1% 16,056 7.6% 9,510 6.7% 1,481 4.8% 1,034 6.8% 15 to 17 years 15,370 3.9% 8,233 3.9% 5,497 3.9% 984 3.2% 656 4.3% 18 and 19 years 9,159 2.3% 4,976 2.4% 3,282 2.3% 510 1.6% 391 2.6% 20 years 4,863 1.2% 2,712 1.3% 1,639 1.2% 160 0.5% 352 2.3% 21 years 4,097 1.0% 1,716 0.8% 2,004 1.4% 297 1.0% 80 0.5% 22 to 24 years 13,278 3.3% 6,681 3.2% 5,667 4.0% 492 1.6% 438 2.9% 25 to 29 years 25,110 6.3% 11,710 5.6% 11,176 7.9% 1,061 3.4% 1,163 7.7% 30 to 34 years 27,653 7.0% 14,390 6.9% 10,872 7.7% 1,114 3.6% 1,277 8.4% 35 to 39 years 27,470 6.9% 15,283 7.3% 9,807 6.9% 1,037 3.3% 1,343 8.8% 40 to 44 years 25,497 6.4% 13,856 6.6% 9,282 6.6% 1,258 4.1% 1,101 7.3% 45 to 49 years 22,142 5.6% 11,853 5.6% 7,810 5.5% 1,509 4.9% 970 6.4% 50 to 54 years 22,942 5.8% 11,391 5.4% 8,827 6.2% 1,817 5.9% 907 6.0% 55 to 59 years 22,807 5.7% 11,738 5.6% 8,278 5.9% 2,060 6.6% 731 4.8% 60 and 61 years 9,302 2.3% 5,014 2.4% 2,887 2.0% 1,152 3.7% 249 1.6% 62 to 64 years 14,420 3.6% 7,536 3.6% 4,629 3.3% 1,883 6.1% 372 2.4% 65 and 66 years 10,297 2.6% 4,949 2.4% 3,482 2.5% 1,662 5.4% 204 1.3% 67 to 69 years 14,798 3.7% 7,364 3.5% 5,039 3.6% 2,055 6.6% 340 2.2% 70 to 74 years 20,761 5.2% 10,294 4.9% 6,674 4.7% 3,380 10.9% 413 2.7% 75 to 79 years 13,614 3.4% 6,688 3.2% 4,402 3.1% 2,317 7.5% 207 1.4% 80 to 84 years 7,361 1.9% 3,576 1.7% 2,289 1.6% 1,313 4.2% 183 1.2% 85 years and over 5,642 1.4% 2,940 1.4% 1,538 1.1% 1,033 3.3% 131 0.9%Source: U.S. Census Bureau American Community Survey 2012-2016
Population by AgePinal County Region 1 Region 2 Region 3 Region 4
North Central East West

67
The following table details educational attainment for the population 25 years and older. Compared to the County as a whole, the central and western region have higher shares of adults with less than a high school diploma. On the higher end of educational attainment, the eastern region has the highest proportion of bachelor’s graduate, and professional degrees, followed by the north region.
Population 25 years and over
Educational Attainment Number% of Total Number
% of Total Number
% of Total Number
% of Total Number
% of Total
Less than 9th grade 15,697 5.8% 4,460 3.2% 9,078 9.4% 975 4.0% 1,184 12.3%9th to 12th grade, no diploma 25,000 9.3% 10,063 7.3% 11,879 12.2% 1,448 5.9% 1,610 16.8%High school graduate (or equivalency) 78,792 29.2% 40,339 29.1% 29,820 30.7% 5,921 24.0% 2,712 28.3%Some college, no degree 75,251 27.9% 40,900 29.5% 25,365 26.2% 6,620 26.9% 2,366 24.7%Associate's degree 25,237 9.4% 14,219 10.3% 8,182 8.4% 2,251 9.1% 585 6.1%Bachelor's degree 32,073 11.9% 19,164 13.8% 8,018 8.3% 3,987 16.2% 904 9.4%Graduate or professional degree 17,766 6.6% 9,437 6.8% 4,650 4.8% 3,449 14.0% 230 2.4%Source: U.S. Census Bureau American Community Survey 2012-2016
Educational Attainment Resident Population 25+ Years Old
269,816
Region 1
138,582
Pinal CountyNorth
Region 3East
Region 4West
96,992 24,651 9,591
Region 2Central

68
The following two tables detail the employment status of the working age population 16 years and older as well as youth aged 16-19. Similar to population, the majority of the County’s workforce resides in the northern part of the County. The north region also has a higher labor participation rate and employment rate than the County as a whole. The west region also has a relatively higher labor participation rate. The eastern region has the lowest labor force participation rate among the four regions. In terms of youth aged 16 to 19, the central region has the highest percentage of youth enrolled in school (77.6%) while the western region has the lowest percentage enrolled (58.5%). Of those not enrolled in school, the central region has the highest percentage without a high school diploma or GED, followed by the eastern region.
Number% of Total Number
% of Total Number
% of Total Number
% of Total Number
% of Total
Total: 311,567 160,260 113,228 26,764 11,315 In labor force: 155,847 50.0% 90,999 56.8% 47,857 42.3% 10,176 38.0% 6,815 60.2% Civilian labor force: 155,635 50.0% 90,946 56.7% 47,753 42.2% 10,163 38.0% 6,773 59.9% Employed 140,965 90.6% 83,405 91.7% 42,538 89.1% 9,054 89.1% 5,968 88.1% Unemployed 14,670 9.4% 7,541 8.3% 5,215 10.9% 1,109 10.9% 805 11.9% Armed Forces 212 0.1% 53 0.0% 104 0.1% 13 0.0% 42 0.4% Not in labor force 155,720 50.0% 69,261 43.2% 65,371 57.7% 16,588 62.0% 4,500 39.8%Source: U.S. Census Bureau American Community Survey 2012-2016
Employment Status 16 Years and OverPinal County Region 1 Region 2 Region 3 Region 4
North Central East West

69
Number% of Total Number
% of Total Number
% of Total Number
% of Total Number
% of Total
Total: 19,513 10,569 6,926 1,164 854 Enrolled in school: 14,736 75.5% 7,820 74.0% 5,372 77.6% 712 61.2% 500 58.5% Employed 3,340 22.7% 1,877 24.0% 1,158 21.6% 148 20.8% 56 11.2% Unemployed 954 6.5% 505 6.5% 317 5.9% 13 1.8% 88 17.6% Not in labor force 10,442 70.9% 5,438 69.5% 3,897 72.5% 551 77.4% 356 71.2% Not enrolled in school: 4,777 24.5% 2,749 26.0% 1,554 22.4% 61 5.2% 354 41.5% High school graduate & G.E.D. 2,710 56.7% 1,739 63.3% 646 41.6% 29 47.5% 250 70.6% Employed 1,307 48.2% 914 52.6% 282 43.7% 9 31.0% 94 37.6% Unemployed 312 11.5% 203 11.7% 65 10.1% 0 0.0% 14 5.6% Not in labor force 1,091 40.3% 622 35.8% 299 46.3% 20 69.0% 142 56.8% Not high school graduate: 2,067 43.3% 1,010 36.7% 908 58.4% 32 52.5% 104 29.4% Employed 637 30.8% 419 41.5% 204 22.5% 0 0.0% 14 13.5% Unemployed 424 20.5% 157 15.5% 234 25.8% 11 34.4% 22 21.2% Not in labor force 1,006 48.7% 434 43.0% 470 51.8% 21 65.6% 68 65.4%Source: U.S. Census Bureau American Community Survey 2012-2016
Employment Status 16-19 Year OldsPinal County Region 1 Region 2 Region 3 Region 4
North Central East West
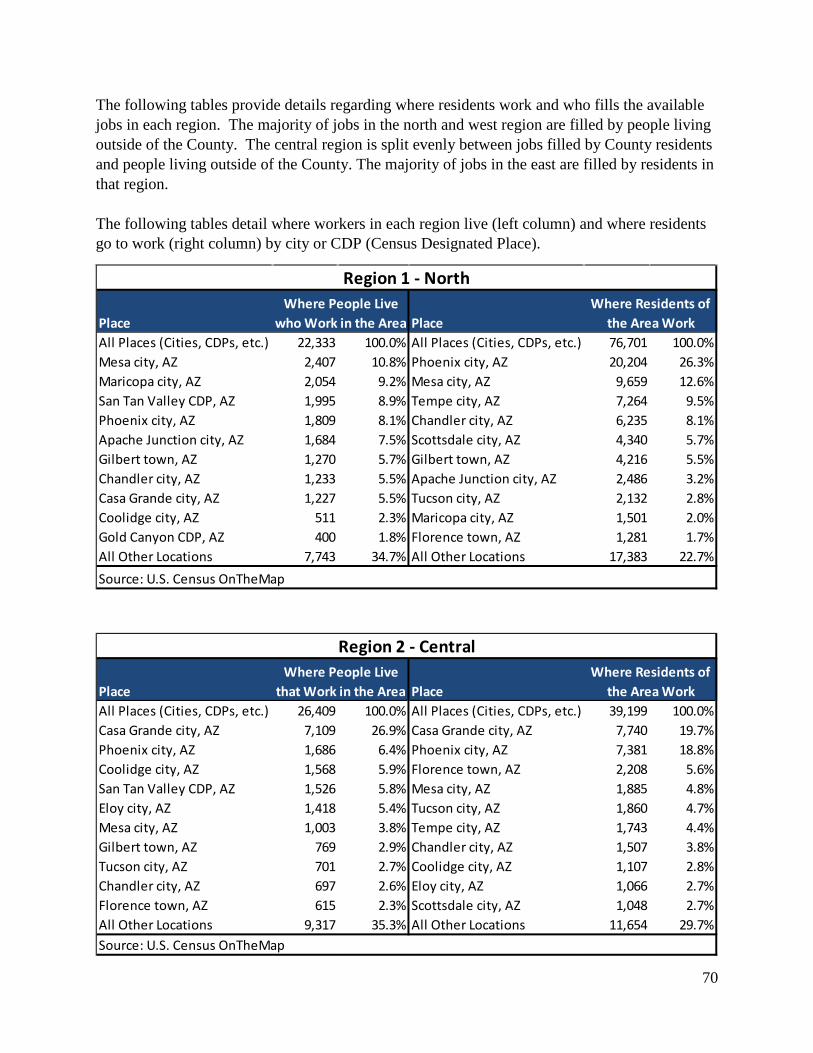
70
The following tables provide details regarding where residents work and who fills the available jobs in each region. The majority of jobs in the north and west region are filled by people living outside of the County. The central region is split evenly between jobs filled by County residents and people living outside of the County. The majority of jobs in the east are filled by residents in that region. The following tables detail where workers in each region live (left column) and where residents go to work (right column) by city or CDP (Census Designated Place).
Place PlaceAll Places (Cities, CDPs, etc.) 22,333 100.0% All Places (Cities, CDPs, etc.) 76,701 100.0%Mesa city, AZ 2,407 10.8% Phoenix city, AZ 20,204 26.3%Maricopa city, AZ 2,054 9.2% Mesa city, AZ 9,659 12.6%San Tan Valley CDP, AZ 1,995 8.9% Tempe city, AZ 7,264 9.5%Phoenix city, AZ 1,809 8.1% Chandler city, AZ 6,235 8.1%Apache Junction city, AZ 1,684 7.5% Scottsdale city, AZ 4,340 5.7%Gilbert town, AZ 1,270 5.7% Gilbert town, AZ 4,216 5.5%Chandler city, AZ 1,233 5.5% Apache Junction city, AZ 2,486 3.2%Casa Grande city, AZ 1,227 5.5% Tucson city, AZ 2,132 2.8%Coolidge city, AZ 511 2.3% Maricopa city, AZ 1,501 2.0%Gold Canyon CDP, AZ 400 1.8% Florence town, AZ 1,281 1.7%All Other Locations 7,743 34.7% All Other Locations 17,383 22.7%Source: U.S. Census OnTheMap
Where People Live who Work in the Area
Where Residents of the Area Work
Region 1 - North
Place PlaceAll Places (Cities, CDPs, etc.) 26,409 100.0% All Places (Cities, CDPs, etc.) 39,199 100.0%Casa Grande city, AZ 7,109 26.9% Casa Grande city, AZ 7,740 19.7%Phoenix city, AZ 1,686 6.4% Phoenix city, AZ 7,381 18.8%Coolidge city, AZ 1,568 5.9% Florence town, AZ 2,208 5.6%San Tan Valley CDP, AZ 1,526 5.8% Mesa city, AZ 1,885 4.8%Eloy city, AZ 1,418 5.4% Tucson city, AZ 1,860 4.7%Mesa city, AZ 1,003 3.8% Tempe city, AZ 1,743 4.4%Gilbert town, AZ 769 2.9% Chandler city, AZ 1,507 3.8%Tucson city, AZ 701 2.7% Coolidge city, AZ 1,107 2.8%Chandler city, AZ 697 2.6% Eloy city, AZ 1,066 2.7%Florence town, AZ 615 2.3% Scottsdale city, AZ 1,048 2.7%All Other Locations 9,317 35.3% All Other Locations 11,654 29.7%Source: U.S. Census OnTheMap
Region 2 - CentralWhere People Live
that Work in the AreaWhere Residents of
the Area Work

71
Place PlaceAll Places (Cities, CDPs, etc.) 3,541 100.0% All Places (Cities, CDPs, etc.) 6,990 100.0%San Manuel CDP, AZ 423 11.9% Phoenix city, AZ 1,075 15.4%Tucson city, AZ 362 10.2% Tucson city, AZ 865 12.4%Superior town, AZ 229 6.5% Mesa city, AZ 348 5.0%Casas Adobes CDP, AZ 189 5.3% Oro Valley town, AZ 265 3.8%Oro Valley town, AZ 172 4.9% Tempe city, AZ 254 3.6%Saddlebrooke CDP, AZ 135 3.8% Mammoth town, AZ 223 3.2%Catalina CDP, AZ 134 3.8% Scottsdale city, AZ 214 3.1%Mesa city, AZ 126 3.6% Apache Junction city, AZ 209 3.0%Oracle CDP, AZ 126 3.6% San Manuel CDP, AZ 193 2.8%San Tan Valley CDP, AZ 98 2.8% Superior town, AZ 177 2.5%All Other Locations 1,547 43.7% All Other Locations 3,167 45.3%Source: U.S. Census OnTheMap
Region 3 - EastWhere People Live
that Work in the AreaWhere Residents of
the Area Work
Place PlaceAll Places (Cities, CDPs, etc.) 3,723 100.0% All Places (Cities, CDPs, etc.) 3,945 100.0%Maricopa city, AZ 946 25.4% Phoenix city, AZ 850 21.5%Casa Grande city, AZ 327 8.8% Tucson city, AZ 320 8.1%Phoenix city, AZ 233 6.3% Tempe city, AZ 216 5.5%Chandler city, AZ 144 3.9% Casa Grande city, AZ 190 4.8%Mesa city, AZ 107 2.9% Mesa city, AZ 182 4.6%Tucson city, AZ 104 2.8% Chandler city, AZ 181 4.6%Ak-Chin Village CDP, AZ 80 2.1% Scottsdale city, AZ 159 4.0%Gilbert town, AZ 77 2.1% Ak-Chin Village CDP, AZ 155 3.9%Casas Adobes CDP, AZ 64 1.7% Maricopa city, AZ 124 3.1%Avra Valley CDP, AZ 56 1.5% Marana town, AZ 82 2.1%All Other Locations 1,585 42.6% All Other Locations 1,486 37.7%Source: U.S. Census OnTheMap
Region 4 - WestWhere People Live
that Work in the AreaWhere Residents of
the Area Work

72
FORECASTS The population of Pinal County has maintained positive growth rates through the recession. Going forward, the region is forecasted to experience growth rates in the range of 2.6% to 2.9%. By 2030, the region will be home to over 600,000 people, a 50% increase over the 2015 population.
Consistent and strong population growth, such as that expected to occur in Pinal County year after year, will create an ever-growing demand for local serving industries. Occupations that serve local residents will be a reliable source to consider for those seeking employment and careers. These occupations can safely be forecasted to continue to grow and will mirror population growth.
200,000
250,000
300,000
350,000
400,000
450,000
500,000
550,000
600,000
650,000
2015 2016 2017 2018 2019 2020 2021 2022 2023 2024 2025 2026 2027 2028 2029 2030
Population Projection - Pinal County2015 - 2030
Source: Arizona Department of Administration, Office of Employment & Population Statistics - 2015

73
TARGETED INDUSTRIES In 2007, Pinal County commissioned a study to help determine the region’s relative strengths and attributes to help direct economic development efforts. This report was completed by the Morrison Institute and included an Asset Inventory sheet. Stakeholder meetings among County officials and County departments at all levels beginning in early 2010 were held to discuss just what the County should be doing as far as attraction of jobs. Among those meetings the following items were discussed:
• July 2007 Morrison Institute report • 2007 , 2008, 2009 and 2010 Pinal County Strategic Plans • Pinal County transportation system – current and planned • Current workforce education levels • Workforce leakage • Retail leakage • Pinal County Comprehensive Land Plan (adopted in 2009) • State incentive programs • 2010 Central Arizona Regional Economic Development (Access Arizona) Business
Survey That gave rise to the decision by the County in late 2010/early 2011 to create the Top Targeted Job Sectors for focused economic development efforts. The industry sectors include the following:
1. Transportation/Logistics 2. Manufacturing 3. Health Services 4. Aerospace & Defense 5. Natural & Renewable Resources 6. *Tourism (added in 2016)
It is notable that the majority of these targeted sectors are considered base industries. Base industries are those that export their products out of a region and result in the importation of money into a region. The issue of importing dollars into a local economy is a crucial economic development concept. Once a dollar makes its way into the region, it flows from person to person as demanded products and services are supplied. Eventually some money leaves the local economy when products (and some services) are provided by companies outside of the County. This is natural leakage and cannot be avoided. In order to compensate for these outgoing dollars an economy must be internally productive and export products beyond its borders and attract dollars from other areas. The region’s base industries serve this purpose. Examples of base industries include the manufacturing sector (including aerospace and defense), export-related business services, tourism, retirement, and federal government employment.

74
Base industry companies also tend to be more capital intensive, and/or utilize skilled labor (not in every case, i.e. tourism, federal government). As local capital investment improves, and as more highly skilled workers are employed, productivity increases. This also leads to higher incomes and a higher standard of living for employees in these industries. The County’s local serving industries provide goods and services to the local population. Activities include most retail operations, construction, and local service banks, to name a few. The existence of base industries creates demand for these local serving industries. Without base industries, there is no means of supporting local serving employees. The County’s targeted sectors were chosen to diversify the County’s economy away from being too dependent on traditional industries such as mining or agriculture. Additionally, well-paying jobs would allow Pinal County residents, who currently commute to neighboring counties, an opportunity to work closer to home. The targeted sectors are not narrowly defined which allows for a multitude of business types to be considered and recruited. It also presents somewhat of a challenge to workforce development, considering the numerous and varied occupations within industries in these target sectors. The following sections briefly discuss possible industries and occupations that could be considered for each sector. Information was gathered from both Pinal County and the Greater Phoenix metro area. Although these industries may not currently have a strong presence in Pinal County, regional data suggests to considering all potential opportunities. New Sectors Additionally, the County has placed a strong emphasis on “high tech” companies and sub-sectors within each of the targeted sectors above. High tech industries, sometimes also referred to as “advanced industries”, are an important and noteworthy focus for Pinal County. These industries are characterized by a deep involvement with technology research and development, employment of and STEM (science, technology, engineering and math) workers which pay significantly above average wages. They also typically have an outsized economic impact per employee due to the use of technology and automation. The tech sector employs 80% of the nation’s engineers, performs 90% of private sector R&D, generates an estimated 85% of all U.S. patents, and accounts for 60% of U.S. exports. These industries also support an extensive supply chain network which creates more jobs through its ripple effects throughout the economy. The industries that encompass this “tech” sector overlap many traditional industries but are mostly concentrated in manufacturing, energy and services sectors. The introduction of a “high tech” focus will be addressed in each of the targeted sector analyses, with the exception of tourism. Using Regional Statistics The following statistics include data from the Phoenix-Mesa-Scottsdale MSA, also known as Greater Phoenix, which is comprised of Maricopa County and Pinal County. This two-county

75
region is utilized due to its sufficient size as an employment base and its diversity of industries from which to collect reliable data. Data for Pinal County only has also been assembled for each of the targeted sectors. This data will help illustrate the current opportunities and expected wages for those seeking work within the County. It is expected that Pinal County will continue to grow its employment base and diversity over time. The Greater Phoenix metropolitan statistical area is an appropriate proxy to analyze in-demand industries. Additionally, most of the Pinal County workforce currently commutes into Maricopa County and will continue to find employment opportunities there for many years to come. Reviewing in-demand occupations within in-demand industries at both the county and the regional level provides ARIZONA@WORK Pinal County service provider staff and job-seekers the appropriate information in terms of current opportunities and expected wages within a reasonable driving distance to their place of residence. TRANSPORTATION AND LOGISTICS Based on the current and future transportation network in the region, Transportation industries could include most forms within Pinal County, be it air transportation (air & express delivery), rail transportation (freight rail), or ground transportation (trucking). Logistics includes many service-based industries as well as physical assets such as warehouse facilities. Logistics services could include the following:
− Fleet Management
− Warehousing
− Materials Handling
− Order Fulfillment
− Logistics
− Network Design
− Inventory Management
− Third Party Logistics Management
− Supply & Demand Planning
The following tables display the top 25 occupations within the transportation and logistics industry in Greater Phoenix and Pinal County separately. These occupations are ranked by their percentage of jobs that comprise the industry. For example, in Greater Phoenix truck drivers make up 18.2% of total jobs in the transportation industry regionally. The top 25 occupations in this industry cumulatively represent 83.7% of all jobs in the industry. The total change and percent change of the top occupations in the transportation and logistics industry from 2012 to 2017 have also been displayed. In Greater Phoenix, nearly every occupation in the industry experienced growth over the last five years, with the exception of couriers and messengers. In addition, median hourly earnings for each occupation are listed.

76
Earnings among top occupations range from a low of $8.38 (taxi drivers) up to $42.07 (airline pilots, copilots, & flight engineers). Pinal County has a much smaller but solid base of employment in transportation and logistics. The County’s occupations in this industry have a much higher concentration of drivers of various types (heavy and tractor trailer truck, taxi, light truck, delivery, bus, transit, etc.). Wages are also more modest across occupations compared to the metro averages.

77
SOC Description
Employed in Industry
(2012)
Employed in Industry
(2017)Change
(2012-2017)% Change
(2012-2017)
% of Total Jobs in
Industry (2017)
Median Hourly
Earnings53-3032 Heavy and Tractor-Trailer Truck Drivers 14,864 17,761 2,897 19% 18.2% $18.0353-3041 Taxi Drivers and Chauffeurs 3,680 13,701 10,021 272% 14.1% $8.3853-7062 Laborers and Freight, Stock, and Material Movers, Hand 7,577 9,398 1,821 24% 9.6% $13.2053-3033 Light Truck or Delivery Services Drivers 4,047 5,362 1,315 32% 5.5% $14.1543-4181 Reservation and Transportation Ticket Agents and Travel Clerks 3,368 3,431 63 2% 3.5% $17.3853-2031 Flight Attendants 3,165 3,214 49 2% 3.3% $30.9753-2011 Airline Pilots, Copilots, and Flight Engineers 2,982 3,024 42 1% 3.1% $42.0743-5021 Couriers and Messengers 2,777 2,496 (281) (10%) 2.6% $12.8249-3011 Aircraft Mechanics and Service Technicians 2,076 2,431 355 17% 2.5% $29.0453-3021 Bus Drivers, Transit and Intercity 1,817 2,321 504 28% 2.4% $20.2953-3022 Bus Drivers, School or Special Client 1,089 2,271 1,182 109% 2.3% $14.6053-7051 Industrial Truck and Tractor Operators 1,591 1,973 382 24% 2.0% $15.4043-4051 Customer Service Representatives 1,466 1,830 364 25% 1.9% $15.1743-5032 Dispatchers, Except Police, Fire, and Ambulance 1,273 1,651 378 30% 1.7% $17.1711-9199 Managers, All Other 1,238 1,375 137 11% 1.4% $16.5649-3031 Bus and Truck Mechanics and Diesel Engine Specialists 1,032 1,197 165 16% 1.2% $19.1643-9061 Office Clerks, General 883 1,047 164 19% 1.1% $15.7843-1011 First-Line Supervisors of Office and Administrative Support Workers 872 1,030 158 18% 1.1% $23.5543-5081 Stock Clerks and Order Fillers 834 1,013 179 21% 1.0% $11.5953-1031 First-Line Supervisors of Transportation, Material-Moving Machine & Vehicle Operators 797 978 181 23% 1.0% $23.8011-1021 General and Operations Managers 752 944 192 26% 1.0% $40.4953-1021 First-Line Supervisors of Helpers, Laborers, and Material Movers, Hand 701 863 162 23% 0.9% $21.5511-3071 Transportation, Storage, and Distribution Managers 686 786 100 15% 0.8% $30.5753-7064 Packers and Packagers, Hand 667 759 92 14% 0.8% $9.7841-3099 Sales Representatives, Services, All Other 648 754 106 16% 0.8% $21.34Source: EMSI; U.S. BLS
Top 25 Occupations - Greater PhoenixTransportation & Logistics

78
SOC Description
Employed in Industry
(2012)
Employed in Industry
(2017)Change
(2012-2017)% Change
(2012-2017)
% of Total Jobs in
Industry (2017)
Median Hourly
Earnings53-3032 Heavy and Tractor-Trailer Truck Drivers 623 784 161 26% 30.0% $16.5853-3041 Taxi Drivers and Chauffeurs 92 534 442 480% 20.5% $8.2753-3033 Light Truck or Delivery Services Drivers 128 159 31 24% 6.1% $12.7143-5021 Couriers and Messengers 172 159 (13) (8%) 6.1% $11.3853-7062 Laborers and Freight, Stock, and Material Movers, Hand 83 105 22 27% 4.0% $12.9053-3022 Bus Drivers, School or Special Client 45 101 56 124% 3.9% $14.0911-9199 Managers, All Other 73 73 0 0% 2.8% $14.3843-5032 Dispatchers, Except Police, Fire, and Ambulance 24 34 10 42% 1.3% $16.3353-3021 Bus Drivers, Transit and Intercity 18 31 13 72% 1.2% $19.4353-1048 First-line Supervisors of Transportation & Material Moving Workers 22 29 7 32% 1.1% $20.3643-5052 Postal Service Mail Carriers <10 26 22 550% 1.0% $23.7143-4051 Customer Service Representatives 24 21 (3) (13%) 0.8% $14.7953-4031 Railroad Conductors and Yardmasters 25 20 (5) (20%) 0.8% $24.7853-5021 Captains, Mates, and Pilots of Water Vessels <10 19 12 171% 0.7% $34.2443-6014 Secretaries & Administrative Assistants 14 18 4 29% 0.7% $14.5113-1111 Management Analysts 12 18 6 50% 0.7% $24.7443-9061 Office Clerks, General 15 18 3 20% 0.7% $14.9811-1021 General and Operations Managers 16 17 1 6% 0.7% $32.9353-4011 Locomotive Engineers 23 17 (6) (26%) 0.7% $27.7249-3031 Bus and Truck Mechanics and Diesel Engine Specialists 13 17 4 31% 0.6% $16.8853-7051 Industrial Truck and Tractor Operators 12 16 4 33% 0.6% $16.3211-3071 Transportation, Storage, and Distribution Managers 17 15 (2) (12%) 0.6% $28.3053-2012 Commercial Pilots 10 14 4 40% 0.5% $31.2953-2011 Airline Pilots, Copilots, and Flight Engineers 14 14 0 0% 0.5% $37.7541-3099 Sales Representatives, Services, All Other 14 14 0 0% 0.5% $18.01Source: EMSI; U.S. BLS
Top 25 Occupations - Pinal CountyTransportation & Logistics

79
As the previous table illustrated, there are a wide range of potential occupations within the transportation and logistics industry. In total, 467 different occupations were identified within this single industry. The following tables display various education and skills requirements for occupations within the industry. The tables are sorted first by educational requirement. In addition to education, both work experience and training requirements have been detailed. A significant number of occupations within the transportation and logistics industry do not require a college education. Over 28% of jobs in the industry do not require any formal educational requirement. These positions also don’t require any previous work experience, though on-the-job training would be needed. The tables also illustrate that more technical positions are reserved for individuals with higher educational achievement. Those jobs requiring a high school diploma have a higher rate of previous work experience and longer-term training on the job. The jobs requiring college education have lower rates of on-the-job training, which suggests the educational training received is the skill sought by the employer, such as finance, engineering, sciences, etc.
NoneLess Than 5
Years5 Years or
More
No formal educational credential 28.0% 28.0% 0.0%High school diploma or equivalent 40.5% 32.3% 7.4% 0.8%Postsecondary nondegree award 21.1% 21.0% 0.1% 0.0%Some college, no degree 0.6% 0.6%Associate's degree 0.4% 0.4% 0.003%Bachelor's degree 9.3% 2.08% 5.64% 1.56%Master's degree 0.03% 0.02% 0.00001% 0.01%Doctoral or professional degree 0.04% 0.04% 0.00001%Grand Total 100.0% 84.5% 13.1% 2.4%Source: EMSI; Elliott D. Pollack & Company
Education & Skills RequirementsTransportation & Logistics
Education Requirements
% of Total Occupations
Work Experience Requirement

80
Advanced Transportation and Logistics A smaller subset of transportation and logistics sectors were selected that best represent what could be considered “high tech” portions of the overall industry. Of the 57 sectors that comprise the transportation and logistics industry, 17 sectors were chosen based on the type of business activity conducted. This includes air transportation, specialized freight transportation, mixed mode transit, pipeline transportation, navigational services, and process, physical distribution, and logistics consulting services (a complete list is provided in Appendix 3 of this report). As the following table of the top 25 occupations illustrate, advanced transportation and logistics positions command much higher wages. The weighted average wage (weighted by the percentage of each occupation representing the industry as a whole) of the top 25 occupations in advanced transportation and logistics is 46% higher than the top 25 occupations in the broader transportation and logistics industry.
None
Short-term on-
the-job training
Moderate-term on-the-job training
Long-term on-
the-job training Apprenticeship
Internship/ Residency
No formal educational credential 28.0% 27.9% 0.1%High school diploma or equivalent 40.5% 4.7% 22.4% 11.6% 1.6% 0.1%Postsecondary nondegree award 21.1% 2.6% 18.4% 0.005% 0.05%Some college, no degree 0.6% 0.1% 0.01% 0.5% 0.0001%Associate's degree 0.4% 0.4% 0.002% 0.0% 0.04%Bachelor's degree 9.3% 5.9% 0.01% 3.4% 0.02% 0.01%Master's degree 0.0% 0.02% 0.003%Doctoral or professional degree 0.0% 0.04% 0.0% 0.003%Grand Total 100.0% 13.8% 68.8% 15.5% 1.8% 0.1% 0.0%Source: EMSI; Elliott D. Pollack & Company
Transportation & Logistics
Education Requirements
% of Total Occupations
Training Requirement
Education & Skills Requirements

81
SOC Description
Employed in Industry
(2012)
Employed in Industry
(2017)Change
(2012-2017)% Change
(2012-2017)
% of Total Jobs in
Industry (2017)
Median Hourly
Earnings43-4181 Reservation and Transportation Ticket Agents and Travel Clerks 3,203 3,241 38 1% 13.6% $17.3853-2031 Flight Attendants 3,165 3,214 49 2% 13.5% $30.9753-2011 Airline Pilots, Copilots, and Flight Engineers 2,923 2,951 28 1% 12.4% $42.0749-3011 Aircraft Mechanics and Service Technicians 1,998 2,344 346 17% 9.8% $29.0453-3032 Heavy and Tractor-Trailer Truck Drivers 1,734 2,110 376 22% 8.8% $18.0353-7062 Laborers and Freight, Stock, and Material Movers, Hand 1,242 1,372 130 10% 5.7% $13.2043-4051 Customer Service Representatives 512 572 60 12% 2.4% $15.1713-1111 Management Analysts 404 395 (9) (2%) 1.7% $26.4143-1011 First-Line Supervisors of Office & Administrative Support Workers 366 388 22 6% 1.6% $23.5553-6099 Transportation Workers, All Other 345 357 12 3% 1.5% $13.6453-2012 Commercial Pilots 260 352 92 35% 1.5% $32.6811-1021 General and Operations Managers 216 248 32 15% 1.0% $40.4943-5011 Cargo and Freight Agents 236 244 8 3% 1.0% $22.0149-1011 First-Line Supervisors of Mechanics, Installers, and Repairers 188 220 32 17% 0.9% $26.5543-9061 Office Clerks, General 181 204 23 13% 0.9% $15.7849-2091 Avionics Technicians 146 181 35 24% 0.8% $28.3141-3099 Sales Representatives, Services, All Other 166 181 15 9% 0.8% $21.3449-3031 Bus and Truck Mechanics and Diesel Engine Specialists 135 159 24 18% 0.7% $19.1611-9199 Managers, All Other 135 157 22 16% 0.7% $16.5643-5032 Dispatchers, Except Police, Fire, and Ambulance 128 157 29 23% 0.7% $17.1753-3033 Light Truck or Delivery Services Drivers 126 150 24 19% 0.6% $14.1543-6014 Administrative Assistants, Except Legal, Medical, & Executive 129 145 16 12% 0.6% $16.1843-5081 Stock Clerks and Order Fillers 128 139 11 9% 0.6% $11.5953-7061 Cleaners of Vehicles and Equipment 122 134 12 10% 0.6% $10.2311-3071 Transportation, Storage, and Distribution Managers 112 125 13 12% 0.5% $30.57Source: EMSI; U.S. BLS
Top 25 Occupations - Greater PhoenixAdvanced Transportation & Logistics

82
SOC Description
Employed in Industry
(2012)
Employed in Industry
(2017)
Change (2012-2017)
% Change (2012-2017)
% of Total Jobs in
Industry (2017)
Median Hourly
Earnings53-3032 Heavy and Tractor-Trailer Truck Drivers 50 68 18 36% 31.0% $16.5813-1111 Management Analysts 10 15 5 50% 7.1% $24.7453-2012 Commercial Pilots 10 13 3 30% 6.2% $31.2953-2011 Airline Pilots, Copilots, and Flight Engineers 13 13 0 0% 5.8% $37.7549-3011 Aircraft Mechanics and Service Technicians 68 10 (58) (85%) 4.7% $26.4025-1099 Postsecondary Teachers <10 <10 1 Insf. Data 0.4% $24.2949-3031 Bus and Truck Mechanics and Diesel Engine Specialists <10 <10 1 100% 0.9% $16.8851-1011 First-Line Supervisors of Production and Operating Workers <10 <10 (1) (100%) 0.2% $21.3549-9099 Installation, Maintenance, and Repair Workers, All Other <10 <10 (2) (100%) 0.2% $13.5549-9071 Maintenance and Repair Workers, General <10 <10 (3) (75%) 0.3% $15.2625-3097 Teachers and Instructors, All Other <10 <10 1 Insf. Data 0.4% $15.5549-3042 Mobile Heavy Equipment Mechanics, Except Engines <10 <10 (1) (100%) 0.1% $21.2449-9041 Industrial Machinery Mechanics <10 <10 (1) (100%) 0.2% $20.1549-9043 Maintenance Workers, Machinery <10 <10 (5) (100%) 0.2% $17.2551-8092 Gas Plant Operators <10 <10 0 0% 0.5% $27.8239-6011 Baggage Porters and Bellhops 12 <10 (11) (92%) 0.3% $10.6551-9061 Inspectors, Testers, Sorters, Samplers, and Weighers <10 <10 (2) (67%) 0.3% $17.7715-1121 Computer Systems Analysts <10 <10 0 0% 0.2% $34.5153-2031 Flight Attendants <10 <10 1 Insf. Data 0.6% $28.5653-3031 Driver/Sales Workers <10 <10 0 0% 0.3% $12.2353-3033 Light Truck or Delivery Services Drivers <10 <10 0 0% 2.1% $12.7153-3041 Taxi Drivers and Chauffeurs <10 <10 1 100% 1.0% $8.2753-1048 First-line Supervisors of Transportation and Material Moving Workers <10 <10 (1) (33%) 1.1% $20.3653-1011 Aircraft Cargo Handling Supervisors <10 <10 (2) (100%) 0.2% $20.6317-2199 Engineers, All Other <10 <10 0 0% 0.3% $31.78Source: EMSI; U.S. BLS
Top 25 Occupations - Pinal CountyAdvanced Transportation & Logistics

83
The following tables display various education and skills requirements for occupations within the industry. The tables are sorted first by educational requirement. In addition to education, both work experience and training requirements have been detailed. In sharp contrast to the broader industry, advanced transportation and logistics sectors require more education to qualify. Only 7.8% of the positions do not require any formal educational requirement versus over 28% of jobs in the broader industry. Nearly 22% of the occupations within the advanced sub-sectors require a bachelor’s degree versus only 9.3% across the entire transportation and logistics industry.
NoneLess Than 5
Years5 Years or
MoreNo formal educational credential 7.8% 7.8% 0.01%High school diploma or equivalent 49.4% 31.1% 17.7% 0.6%Postsecondary nondegree award 18.9% 18.9% 0.02%Some college, no degree 0.5% 0.5%Associate's degree 1.3% 1.3%Bachelor's degree 21.7% 4.1% 15.6% 2.0%Master's degree 0.1% 0.07% 0.02%Doctoral or professional degree 0.1% 0.1%Grand Total 100.0% 64.0% 33.4% 2.5%
Source: EMSI; Elliott D. Pollack & Company
Education & Skills RequirementsAdvanced Transportation & Logistics
Education Requirements
% of Total Occupations
Work Experience Requirement

84
MANUFACTURING Manufacturing covers a wide range of potential businesses and make up a significant portion of all industry classifications. Manufacturing can include food & beverage, textiles, wood products, printing, petroleum, chemicals, plastics, metals, machinery, electronics, transportation equipment, and many others. As illustrated previously, Pinal County already has an established manufacturing base, including nonmetallic mineral products, chemicals, food products, primary metals, wood products, plastics and rubber, and others. In addition, there are many Pinal County residents currently employed in the manufacturing industry commuting out of the county for work. The following tables display the top 25 occupations within the manufacturing industry across Greater Phoenix and Pinal County. A total of 549 separate occupations can be found within the manufacturing industry. For Greater Phoenix, the top 25 occupations in this industry cumulatively represent 43.3% of all jobs in the industry. In Pinal County, the top 25 occupations comprise 48.7% of the industry. The total change and percent change of the top occupations in the manufacturing industry from 2012 to 2017 have also been displayed. In addition, median hourly earnings for each occupation are listed. Earnings in Greater Phoenix among top occupations range from a low of $12.33 (Packaging and Filling Machine Operators and Tenders) up to $44.52 (Software Developers, Systems Software). In Pinal County, wages are slightly lower.
None
Short-term on-
the-job training
Moderate-term on-
the-job training
Long-term on-
the-job training Apprenticeship
Internship/ Residency
No formal educational credential 7.8% 7.7% 0.1%High school diploma or equivalent 49.4% 4.8% 23.4% 19.7% 1.4% 0.1%Postsecondary nondegree award 18.9% 9.9% 8.9% 0.01% 0.1%Some college, no degree 0.5% 0.1% 0.01% 0.4%Associate's degree 1.3% 1.1% 0.001% 0.01% 0.2%Bachelor's degree 21.7% 8.7% 0.05% 12.9% 0.1% 0.01%Master's degree 0.1% 0.1% 0.01%Doctoral or professional degree 0.1% 0.1% 0.01%Grand Total 100.0% 24.8% 40.1% 33.0% 1.8% 0.1% 0.0%
Source: EMSI; Elliott D. Pollack & Company
Advanced Transportation & Logistics
Education Requirements
% of Total Occupations
Training Requirement
Education & Skills Requirements

85
SOC Description
Employed in Industry
(2012)
Employed in Industry
(2017)Change
(2012 - 2017)% Change
(2012 - 2017)
% of Total Jobs in
Industry (2017)
Median Hourly
Earnings51-1011 First-Line Supervisors of Production and Operating Workers 4,190 4,594 404 10% 3.5% $24.0651-2092 Team Assemblers 4,216 4,452 236 6% 3.4% $13.0751-4041 Machinists 3,533 3,862 329 9% 3.0% $19.8851-2022 Electrical and Electronic Equipment Assemblers 4,177 3,523 (654) (16%) 2.7% $17.7751-9061 Inspectors, Testers, Sorters, Samplers, and Weighers 3,224 3,226 2 0% 2.5% $19.4741-4012 Sales Representatives, Wholesale & Manufacturing, Except Technical & Scientific Products 2,310 2,568 258 11% 2.0% $23.3053-7062 Laborers and Freight, Stock, and Material Movers, Hand 2,226 2,565 339 15% 2.0% $13.2011-1021 General and Operations Managers 2,333 2,499 166 7% 1.9% $40.4911-9199 Managers, All Other 2,050 2,353 303 15% 1.8% $16.5651-4121 Welders, Cutters, Solderers, and Brazers 2,090 2,298 208 10% 1.8% $17.2943-4051 Customer Service Representatives 2,043 2,243 200 10% 1.7% $15.1717-2112 Industrial Engineers 2,239 2,150 (89) (4%) 1.6% $42.3517-2072 Electronics Engineers, Except Computer 2,405 2,062 (343) (14%) 1.6% $38.0443-5061 Production, Planning, and Expediting Clerks 1,768 1,802 34 2% 1.4% $20.1051-2099 Assemblers and Fabricators, All Other 1,472 1,672 200 14% 1.3% $12.8811-3051 Industrial Production Managers 1,496 1,588 92 6% 1.2% $39.1751-9111 Packaging and Filling Machine Operators and Tenders 1,292 1,567 275 21% 1.2% $12.3343-5071 Shipping, Receiving, and Traffic Clerks 1,487 1,564 77 5% 1.2% $14.4249-9071 Maintenance and Repair Workers, General 1,366 1,505 139 10% 1.2% $16.4915-1133 Software Developers, Systems Software 1,723 1,446 (277) (16%) 1.1% $44.5253-3032 Heavy and Tractor-Trailer Truck Drivers 1,185 1,444 259 22% 1.1% $18.0353-7051 Industrial Truck and Tractor Operators 1,220 1,437 217 18% 1.1% $15.4017-3026 Industrial Engineering Technicians 1,508 1,434 (74) (5%) 1.1% $27.0651-5112 Printing Press Operators 1,277 1,386 109 9% 1.1% $16.4243-9061 Office Clerks, General 1,237 1,322 85 7% 1.0% $15.78Source: EMSI; U.S. BLS
Top 25 Occupations - Greater PhoenixManufacturing

86
SOC Description
Employed in Industry
(2012)
Employed in Industry
(2017)
Change (2012-2017)
% Change (2012-2017)
% of Total Jobs in
Industry (2017)
Median Hourly
Earnings51-3092 Food Batchmakers 107 162 55 51% 3.8% $12.2351-1011 First-Line Supervisors of Production and Operating Workers 133 158 25 19% 3.7% $21.3551-2098 Assemblers & Fabricators, All Other, Including Team Assemblers 134 148 14 10% 3.5% $13.1111-9199 Managers, All Other 106 136 30 28% 3.2% $14.3851-9111 Packaging and Filling Machine Operators and Tenders 109 108 (1) (1%) 2.5% $12.4751-9061 Inspectors, Testers, Sorters, Samplers, and Weighers 70 94 24 34% 2.2% $17.7753-7062 Laborers and Freight, Stock, and Material Movers, Hand 87 93 6 7% 2.2% $12.9011-1021 General and Operations Managers 74 91 17 23% 2.1% $32.9341-4012 Sales Representatives, Wholesale and Manufacturing 77 89 12 16% 2.1% $19.3053-3032 Heavy and Tractor-Trailer Truck Drivers 74 88 14 19% 2.1% $16.5853-7051 Industrial Truck and Tractor Operators 73 81 8 11% 1.9% $16.3251-9023 Mixing and Blending Machine Setters, Operators, and Tenders 63 80 17 27% 1.9% $14.0643-4051 Customer Service Representatives 58 78 20 34% 1.8% $14.7951-4041 Machinists 44 65 21 48% 1.5% $16.9149-9071 Maintenance and Repair Workers, General 60 63 3 5% 1.5% $15.2611-3051 Industrial Production Managers 53 62 9 17% 1.5% $34.6551-9041 Extruding, Forming, Pressing, Compacting Machine Setters, Operators, & Tenders 47 60 13 28% 1.4% $14.2451-2028 Electrical, Electronic, and Electromechanical Assemblers 46 58 12 26% 1.4% $15.9951-4121 Welders, Cutters, Solderers, and Brazers 43 57 14 33% 1.3% $15.3343-5071 Shipping, Receiving, and Traffic Clerks 47 55 8 17% 1.3% $14.1415-1133 Software Developers, Systems Software 47 54 7 15% 1.3% $38.9543-5061 Production, Planning, and Expediting Clerks 36 49 13 36% 1.2% $18.3453-7064 Packers and Packagers, Hand 61 48 (13) (21%) 1.1% $11.7417-2112 Industrial Engineers 35 47 12 34% 1.1% $36.4549-9041 Industrial Machinery Mechanics 44 47 3 7% 1.1% $20.15Source: EMSI; U.S. BLS
Top 25 Occupations - Pinal CountyManufacturing

87
A significant number of occupations within the industry require at least a high school diploma (55.9%). Less than 10% of jobs in the industry do not require any formal educational requirement, while 26.5% require a bachelor’s degree. The tables also illustrate that this industry requires a significant amount of on-the-job training. Approximately 75% of occupations requiring a high school diploma also require moderate to long term on-the-job training. Longer training requirements help build a qualified workforce and lead to higher wages.
NoneLess Than 5
Years5 Years or
MoreNo formal educational credential 9.3% 9.3% 0.03%High school diploma or equivalent 55.9% 50.1% 5.5% 0.3%Postsecondary nondegree award 2.7% 2.7% 0.00% 0.0%Some college, no degree 0.9% 0.9%Associate's degree 4.0% 4.0% 0.001%Bachelor's degree 26.5% 16.9% 3.5% 6.2%Master's degree 0.1% 0.06%Doctoral or professional degree 0.1% 0.1% 0.000005%Grand Total 100.0% 84.1% 9.0% 6.5%
Source: EMSI; Elliott D. Pollack & Company
Education & Skills RequirementsManufacturing
Education Requirements
% of Total Occupations
Work Experience Requirement
None
Short-term on-
the-job training
Moderate-term on-
the-job training
Long-term on-
the-job training Apprenticeship
Internship/ Residency
No formal educational credential 9.3% 7.9% 0.5% 0.8%High school diploma or equivalent 55.9% 5.7% 8.1% 36.2% 4.8% 1.0%Postsecondary nondegree award 2.7% 0.9% 1.1% 0.2% 0.5%Some college, no degree 0.9% 0.3% 0.01% 0.6%Associate's degree 4.0% 3.8% 0.01% 0.2%Bachelor's degree 26.5% 24.0% 0.1% 2.3% 0.1% 0.01%Master's degree 0.1% 0.03% 0.03%Doctoral or professional degree 0.1% 0.1% 0.0% 0.003%Grand Total 100.0% 34.9% 17.3% 40.0% 6.3% 1.0% 0.0%Source: EMSI; Elliott D. Pollack & Company
Manufacturing
Education Requirements
% of Total Occupations
Training Requirement
Education & Skills Requirements

88
Advanced Manufacturing A smaller subset of manufacturing sectors were selected to represent what could be considered “high tech” portions of the overall industry. In 2015, the Brookings Institute identified 50 industries in the United States that they defined as “high tech”. Out of the 50 industries, 35 were in the manufacturing industry. This report utilizes those 35 manufacturing sectors to illustrate advanced manufacturing. They include aerospace products and parts, motor vehicles, bodies, trailers, and parts, communications equipment, basic chemicals, engines, turbines, pharmaceuticals, semiconductors, and many others. As the following table of the top 25 occupations illustrate, advanced manufacturing positions command much higher wages. The weighted average wage of the top 25 occupations in advanced manufacturing is 32% higher than the top 25 occupations in the broader manufacturing industry. It is interesting to note that many occupations within the advanced manufacturing sector in Greater Phoenix have declined over the last 5 years. The reasons for this decline are unclear, though workforce specialists should exercise caution in this area until sufficient new demand for these positions is identified through business expansion or new businesses recruitment.

89
SOC Description
Employed in Industry
(2012)
Employed in Industry
(2017)Change
(2012-2017)% Change
(2012-2017)
% of Total Jobs in
Industry (2017)
Median Hourly
Earnings51-2022 Electrical and Electronic Equipment Assemblers 4,142 3,477 (665) (16%) 5.2% $17.7751-2092 Team Assemblers 2,492 2,434 (58) (2%) 3.6% $13.0717-2072 Electronics Engineers, Except Computer 2,396 2,051 (345) (14%) 3.1% $38.0451-9061 Inspectors, Testers, Sorters, Samplers, and Weighers 2,191 2,036 (155) (7%) 3.0% $19.4751-1011 First-Line Supervisors of Production and Operating Workers 1,951 1,917 (34) (2%) 2.9% $24.0617-2112 Industrial Engineers 1,906 1,769 (137) (7%) 2.6% $42.3551-4041 Machinists 1,621 1,655 34 2% 2.5% $19.8815-1133 Software Developers, Systems Software 1,706 1,426 (280) (16%) 2.1% $44.5251-9141 Semiconductor Processors 1,477 1,231 (246) (17%) 1.8% $16.3417-3026 Industrial Engineering Technicians 1,325 1,211 (114) (9%) 1.8% $27.0617-3023 Electrical and Electronics Engineering Technicians 1,469 1,195 (274) (19%) 1.8% $30.8917-2011 Aerospace Engineers 1,290 1,137 (153) (12%) 1.7% $45.0143-5061 Production, Planning, and Expediting Clerks 1,184 1,107 (77) (7%) 1.6% $20.1011-1021 General and Operations Managers 1,170 1,102 (68) (6%) 1.6% $40.4917-2071 Electrical Engineers 1,304 1,093 (211) (16%) 1.6% $50.9715-1132 Software Developers, Applications 1,182 1,011 (171) (14%) 1.5% $42.7043-4051 Customer Service Representatives 979 989 10 1% 1.5% $15.1717-2141 Mechanical Engineers 1,078 981 (97) (9%) 1.5% $41.1411-9199 Managers, All Other 945 971 26 3% 1.4% $16.5611-9041 Architectural and Engineering Managers 1,067 928 (139) (13%) 1.4% $60.2149-3011 Aircraft Mechanics and Service Technicians 968 891 (77) (8%) 1.3% $29.0441-4012 Sales Representatives, Wholesale & Manufacturing, Except Technical & Scientific Products 854 862 8 1% 1.3% $23.3011-3051 Industrial Production Managers 875 831 (44) (5%) 1.2% $39.1713-1023 Purchasing Agents, Except Wholesale, Retail, and Farm Products 924 827 (97) (10%) 1.2% $27.3551-2099 Assemblers and Fabricators, All Other 782 815 33 4% 1.2% $12.88Source: EMSI; U.S. BLS
Top 25 Occupations - Greater PhoenixAdvanced Manufacturing

90
SOC Description
Employed in Industry
(2012)
Employed in Industry
(2017)
Change (2012-2017)
% Change (2012-2017)
% of Total Jobs in
Industry (2017)
Median Hourly
Earnings51-2098 Assemblers & Fabricators, All Other, Including Team Assemblers 59 72 13 22% 4.4% $13.1111-9199 Managers, All Other 47 58 11 23% 3.5% $14.3851-2028 Electrical, Electronic, and Electromechanical Assemblers 45 58 13 29% 3.5% $15.9915-1133 Software Developers, Systems Software 47 53 6 13% 3.2% $38.9551-1011 First-Line Supervisors of Production and Operating Workers 44 49 5 11% 3.0% $21.3551-9061 Inspectors, Testers, Sorters, Samplers, and Weighers 31 40 9 29% 2.4% $17.7711-1021 General and Operations Managers 30 36 6 20% 2.2% $32.9317-2072 Electronics Engineers, Except Computer 21 32 11 52% 2.0% $33.8743-4051 Customer Service Representatives 24 32 8 33% 1.9% $14.7941-4011 Sales Representatives, Wholesale, Manufacturing, Technical & Scientific Products 24 32 8 33% 1.9% $26.3817-2112 Industrial Engineers 25 31 6 24% 1.9% $36.4541-4012 Sales Representatives, Wholesale & Manufacturing, Except Technical & Scientific Products 24 28 4 17% 1.7% $19.3017-2071 Electrical Engineers 24 28 4 17% 1.7% $42.4151-4041 Machinists 23 27 4 17% 1.6% $16.9111-3051 Industrial Production Managers 22 25 3 14% 1.5% $34.6551-9071 Jewelers and Precious Stone and Metal Workers 14 23 9 64% 1.4% $11.2715-1132 Software Developers, Applications 16 23 7 44% 1.4% $34.7717-2141 Mechanical Engineers 19 22 3 16% 1.3% $34.1211-9041 Architectural and Engineering Managers 17 22 5 29% 1.3% $49.2843-5061 Production, Planning, and Expediting Clerks 18 22 4 22% 1.3% $18.3417-2011 Aerospace Engineers 14 22 8 57% 1.3% $41.4917-3023 Electrical and Electronics Engineering Technicians 20 20 0 0% 1.2% $26.5617-3026 Industrial Engineering Technicians 17 19 2 12% 1.2% $24.5549-9071 Maintenance and Repair Workers, General 19 18 (1) (5%) 1.1% $15.2617-2199 Engineers, All Other 10 18 8 80% 1.1% $31.78Source: EMSI; U.S. BLS
Top 25 Occupations - Pinal CountyAdvanced Manufacturing

91
Compared to the broader industry, advanced manufacturing sectors require more education to qualify. Only 2.9% of the positions do not require any formal educational requirement versus over 9.3% of jobs in the broader industry. Nearly 39% of the occupations within the advanced manufacturing sub-sectors require a bachelor’s degree versus 26.5% across the entire industry.
NoneLess Than 5
Years5 Years or
MoreNo formal educational credential 2.9% 2.9%High school diploma or equivalent 48.0% 43.3% 4.5% 0.1%Postsecondary nondegree award 2.4% 2.3% 0.005% 0.005%Some college, no degree 1.0% 1.0%Associate's degree 6.5% 6.5%Bachelor's degree 38.6% 27.4% 3.7% 7.4%Master's degree 0.1% 0.1%Doctoral or professional degree 0.3% 0.3%Grand Total 100.0% 83.8% 8.3% 7.6%Source: EMSI; Elliott D. Pollack & Company
Education & Skills RequirementsAdvanced Manufacturing
Education Requirements
% of Total Occupations
Work Experience Requirement
None
Short-term on-
the-job training
Moderate-term on-
the-job training
Long-term on-
the-job training Apprenticeship
Internship/ Residency
No formal educational credential 2.9% 2.6% 0.2% 0.1%High school diploma or equivalent 48.0% 4.6% 5.8% 32.9% 4.2% 0.5%Postsecondary nondegree award 2.4% 1.4% 0.2% 0.1% 0.6%Some college, no degree 1.0% 0.4% 0.02% 0.5%Associate's degree 6.5% 6.2% 0.01% 0.2%Bachelor's degree 38.6% 35.0% 0.2% 3.2% 0.1% 0.00%Master's degree 0.1% 0.06% 0.05%Doctoral or professional degree 0.3% 0.3% 0.0% 0.005%Grand Total 100.0% 48.0% 8.8% 37.2% 5.1% 0.5% 0.1%Source: EMSI; Elliott D. Pollack & Company
Advanced Manufacturing
Education Requirements
% of Total Occupations
Training Requirement
Education & Skills Requirements

92
HEALTH SERVICES The health services industry is another sector with a wide variety of sub-industries. In addition, this industry includes businesses that could serve Pinal County’s rapidly growing local / regional population or be considered an export-based company. Health services could include the following:
− Ambulatory
− Hospitals
− Nursing & Residential Care Facilities
− Social Assistance
− Pharmaceuticals
− Biotech
The following tables display the top 25 occupations within the health services industry across Greater Phoenix and Pinal County. A total of 573 separate occupations can be found within the health care field. The top 25 occupations in this industry in Greater Phoenix cumulatively represent 61.9% of all jobs in the industry. Similarly in Pinal County, the top 25 occupations represent 62.4% of the industry. The total change and percent change of the top occupations in health services from 2012 to 2017 are also displayed. In addition, median hourly earnings for each occupation are listed. Earnings among top occupations in Greater Phoenix range from a low of $7.70 (childcare workers) up to $85.53 (physicians & surgeons). Registered nurses comprise most of the industry (11.2%).

93
SOC Description
Employed in Industry
(2012)
Employed in Industry
(2017)Change
(2012-2017)% Change
(2012-2017)
% of Total Jobs in
Industry (2017)
Median Hourly
Earnings29-1141 Registered Nurses 29,196 34,054 4,858 17% 11.2% $35.5639-9021 Personal Care Aides 21,300 30,906 9,606 45% 10.2% $10.6931-1011 Home Health Aides 11,527 13,229 1,702 15% 4.3% $11.4031-9092 Medical Assistants 9,858 11,806 1,948 20% 3.9% $15.4639-9011 Childcare Workers 11,249 10,797 (452) (4%) 3.5% $7.7043-6013 Medical Secretaries 8,280 9,608 1,328 16% 3.2% $15.7131-1014 Nursing Assistants 7,821 8,893 1,072 14% 2.9% $14.2743-4171 Receptionists and Information Clerks 5,741 6,643 902 16% 2.2% $13.7729-1069 Physicians and Surgeons, All Other 4,522 5,022 500 11% 1.7% $85.5311-9111 Medical and Health Services Managers 4,051 4,887 836 21% 1.6% $41.7731-9091 Dental Assistants 4,003 4,481 478 12% 1.5% $18.8343-9061 Office Clerks, General 3,910 4,450 540 14% 1.5% $15.7819-3031 Clinical, Counseling, and School Psychologists 3,733 4,233 500 13% 1.4% $32.9643-1011 First-Line Supervisors of Office and Administrative Support Workers 3,408 4,061 653 19% 1.3% $23.5529-2061 Licensed Practical and Licensed Vocational Nurses 3,298 4,012 714 22% 1.3% $25.0243-3021 Billing and Posting Clerks 3,218 3,768 550 17% 1.2% $17.3125-2011 Preschool Teachers, Except Special Education 3,006 3,449 443 15% 1.1% $11.6443-4051 Customer Service Representatives 2,752 3,315 563 20% 1.1% $15.1743-6014 Administrative Assistants, Except Legal, Medical, & Executive 2,814 3,211 397 14% 1.1% $16.1821-1022 Healthcare Social Workers 2,539 3,066 527 21% 1.0% $18.9821-1093 Social and Human Service Assistants 2,212 2,990 778 35% 1.0% $13.5929-2099 Health Technologists and Technicians, All Other 2,411 2,949 538 22% 1.0% $19.1629-2071 Medical Records and Health Information Technicians 2,435 2,884 449 18% 0.9% $17.3529-1021 Dentists, General 2,378 2,859 481 20% 0.9% $81.0129-2011 Medical and Clinical Laboratory Technologists 2,376 2,776 400 17% 0.9% $27.54Source: EMSI; U.S. BLS
Top 25 Occupations - Greater PhoenixHealth Services

94
SOC Description
Employed in Industry
(2012)
Employed in Industry
(2017)
Change (2012-2017)
% Change (2012-2017)
% of Total Jobs in
Industry (2017)
Median Hourly
Earnings29-1141 Registered Nurses 967 1,018 51 5% 11.7% $32.9739-9011 Childcare Workers 946 726 (220) (23%) 8.3% $6.8539-9021 Personal Care Aides 304 653 349 115% 7.5% $10.3331-1011 Home Health Aides 288 302 14 5% 3.5% $10.9431-1014 Nursing Assistants 228 271 43 19% 3.1% $13.2431-9092 Medical Assistants 201 215 14 7% 2.5% $13.9243-6013 Medical Secretaries 190 200 10 5% 2.3% $15.3325-2011 Preschool Teachers, Except Special Education 136 180 44 32% 2.1% $13.1619-3031 Clinical, Counseling, and School Psychologists 152 174 22 14% 2.0% $31.8543-4171 Receptionists and Information Clerks 136 150 14 10% 1.7% $13.5111-9111 Medical and Health Services Managers 119 149 30 25% 1.7% $37.7929-1069 Physicians and Surgeons, All Other 125 130 5 4% 1.5% $97.5431-9091 Dental Assistants 103 128 25 24% 1.5% $18.0721-1018 Substance Abuse, Behavioral Disorder, & Mental Health Counselors 115 126 11 10% 1.4% $18.0229-2061 Licensed Practical and Licensed Vocational Nurses 93 119 26 28% 1.4% $23.0743-9061 Office Clerks, General 111 110 (1) (1%) 1.3% $14.9829-2053 Psychiatric Technicians 33 99 66 200% 1.1% $15.8429-1021 Dentists, General 60 95 35 58% 1.1% $59.3243-1011 First-Line Supervisors of Office and Administrative Support Workers 82 91 9 11% 1.0% $21.4129-2018 Clinical Laboratory Technologists and Technicians 98 89 (9) (9%) 1.0% $27.2321-1093 Social and Human Service Assistants 83 87 4 5% 1.0% $13.5243-6014 Secretaries and Administrative Assistants 86 85 (1) (1%) 1.0% $14.5143-3021 Billing and Posting Clerks 85 80 (5) (6%) 0.9% $16.1443-4051 Customer Service Representatives 51 76 25 49% 0.9% $14.7925-9041 Teacher Assistants 60 76 16 27% 0.9% $11.28Source: EMSI; U.S. BLS
Top 25 Occupations - Pinal CountyHealth Services

95
The following tables display various education and skills requirements for occupations within the health services industry. A significant number of occupations require at least a high school diploma (96.4%). Beyond a high school diploma, 14.6% of occupations require a postsecondary non-degree award, and 22.0% require a bachelor’s degree. This sector also has a relatively high percentage of advanced degree earners, with 5.5% requiring a master’s degree and 8.6% requiring a doctoral or professional degree. Both work experience and on-the-job training are relatively light as many of the occupations rely on the educational training earned by the employee.
NoneLess Than 5
Years5 Years or
MoreNo formal educational credential 3.5% 3.5% 0.004%High school diploma or equivalent 38.4% 35.8% 2.5% 0.1%Postsecondary nondegree award 14.6% 14.3% 0.4% 0.001%Some college, no degree 1.0% 1.0%Associate's degree 6.4% 6.1% 0.2%Bachelor's degree 22.0% 17.5% 3.1% 1.3%Master's degree 5.5% 5.4% 0.002% 0.1%Doctoral or professional degree 8.6% 8.6%Grand Total 100.0% 92.2% 6.2% 1.5%
Source: EMSI; Elliott D. Pollack & Company
Education & Skills RequirementsHealth Services
Education Requirements
% of Total Occupations
Work Experience Requirement

96
Advanced Health Services A smaller subset of health sectors was selected that best represent what could be considered “high tech” portions of the overall industry. Of the 47 sectors that comprise the health services industry, 26 sectors were chosen based on the type of business activity conducted. This includes medicinal and botanical manufacturing, pharmaceutical preparation, in-vitro diagnostic substances, medical laboratories, research and development, and hospitals, among others (a complete list is provided in Appendix 3 of this report). As the following table of the top 25 occupations illustrate, advanced health services positions command much higher wages. The weighted average wage of the top 25 occupations in advanced transportation and logistics is nearly 30% higher than the top 25 occupations in the broader health industry.
None
Short-term on-
the-job training
Moderate-term on-
the-job training
Long-term on-
the-job training Apprenticeship
Internship/ Residency
No formal educational credential 3.5% 3.5% 0.02% 0.01%High school diploma or equivalent 38.4% 3.0% 28.3% 6.8% 0.3% 0.03%Postsecondary nondegree award 14.6% 14.2% 0.4% 0.003% 0.02%Some college, no degree 1.0% 0.6% 0.00% 0.4% 0.002%Associate's degree 6.4% 6.2% 0.00% 0.1% 0.0003%Bachelor's degree 22.0% 21.3% 0.02% 0.3% 0.02% 0.3%Master's degree 5.5% 2.54% 2.9%Doctoral or professional degree 8.6% 3.4% 5.2%Grand Total 100.0% 51.3% 32.2% 7.7% 0.3% 0.0% 8.4%Source: EMSI; Elliott D. Pollack & Company
Health Services
Education Requirements
% of Total Occupations
Training Requirement
Education & Skills Requirements

97
SOC Description
Employed in Industry
(2012)
Employed in Industry
(2017)Change
(2012-2017)% Change
(2012-2017)
% of Total Jobs in
Industry (2017)
Median Hourly
Earnings29-1141 Registered Nurses 20,563 23,412 2,849 14% 23.9% $35.5631-1014 Nursing Assistants 2,545 2,798 253 10% 2.9% $14.2743-6013 Medical Secretaries 2,165 2,481 316 15% 2.5% $15.7129-2011 Medical and Clinical Laboratory Technologists 2,015 2,281 266 13% 2.3% $27.5411-9111 Medical and Health Services Managers 1,847 2,079 232 13% 2.1% $41.7731-9092 Medical Assistants 1,657 1,958 301 18% 2.0% $15.4643-4051 Customer Service Representatives 1,568 1,845 277 18% 1.9% $15.1729-2099 Health Technologists and Technicians, All Other 1,404 1,697 293 21% 1.7% $19.1629-2034 Radiologic Technologists 1,488 1,626 138 9% 1.7% $31.5129-2012 Medical and Clinical Laboratory Technicians 1,320 1,492 172 13% 1.5% $19.3429-1131 Veterinarians 1,082 1,391 309 29% 1.4% $38.0443-4171 Receptionists and Information Clerks 1,119 1,339 220 20% 1.4% $13.7729-2071 Medical Records and Health Information Technicians 1,177 1,337 160 14% 1.4% $17.3529-1126 Respiratory Therapists 1,192 1,334 142 12% 1.4% $27.4321-1022 Healthcare Social Workers 1,130 1,320 190 17% 1.3% $18.9831-9096 Veterinary Assistants and Laboratory Animal Caretakers 949 1,269 320 34% 1.3% $12.2629-1069 Physicians and Surgeons, All Other 1,094 1,193 99 9% 1.2% $85.5343-9061 Office Clerks, General 1,015 1,132 117 12% 1.2% $15.7829-2055 Surgical Technologists 960 1,087 127 13% 1.1% $25.2143-1011 First-Line Supervisors of Office & Administrative Support Workers 925 1,082 157 17% 1.1% $23.5529-2056 Veterinary Technologists and Technicians 782 1,045 263 34% 1.1% $15.8529-2052 Pharmacy Technicians 872 980 108 12% 1.0% $15.4743-6014 Administrative Assistants, Except Legal, Medical, & Executive 856 969 113 13% 1.0% $16.1829-1051 Pharmacists 813 911 98 12% 0.9% $59.0043-3021 Billing and Posting Clerks 756 867 111 15% 0.9% $17.31Source: EMSI; U.S. BLS
Top 25 Occupations - Greater PhoenixAdvanced Health Services

98
SOC Description
Employed in Industry
(2012)
Employed in Industry
(2017)
Change (2012-2017)
% Change (2012-2017)
% of Total Jobs in
Industry (2017)
Median Hourly
Earnings29-1141 Registered Nurses 818 830 12 1% 25.3% $32.9731-1014 Nursing Assistants 113 106 (7) (6%) 3.2% $13.2443-6013 Medical Secretaries 73 78 5 7% 2.4% $15.3311-9111 Medical and Health Services Managers 70 77 7 10% 2.4% $37.7929-2018 Clinical Laboratory Technologists and Technicians 83 76 (7) (8%) 2.3% $27.2329-2053 Psychiatric Technicians 18 74 56 311% 2.3% $15.8431-9092 Medical Assistants 48 62 14 29% 1.9% $13.9229-1069 Physicians and Surgeons, All Other 44 51 7 16% 1.6% $97.5431-9096 Veterinary Assistants and Laboratory Animal Caretakers 34 50 16 47% 1.5% $12.3343-4051 Customer Service Representatives 36 50 14 39% 1.5% $14.7929-2071 Medical Records and Health Information Technicians 47 49 2 4% 1.5% $15.9229-2034 Radiologic Technologists 48 46 (2) (4%) 1.4% $28.8029-1126 Respiratory Therapists 44 42 (2) (5%) 1.3% $25.0029-1131 Veterinarians 37 42 5 14% 1.3% $39.3629-1051 Pharmacists 37 41 4 11% 1.3% $55.4729-2052 Pharmacy Technicians 38 40 2 5% 1.2% $14.3229-2099 Health Technologists and Technicians, All Other 29 40 11 38% 1.2% $18.7643-4171 Receptionists and Information Clerks 32 39 7 22% 1.2% $13.5143-9061 Office Clerks, General 46 39 (7) (15%) 1.2% $14.9821-1022 Healthcare Social Workers 30 37 7 23% 1.1% $16.8529-2061 Licensed Practical and Licensed Vocational Nurses 42 36 (6) (14%) 1.1% $23.0737-2012 Maids and Housekeeping Cleaners 42 36 (6) (14%) 1.1% $10.1829-2055 Surgical Technologists 34 34 0 0% 1.0% $22.4043-1011 First-Line Supervisors of Office and Administrative Support Workers 30 33 3 10% 1.0% $21.4143-6014 Secretaries and Administrative Assistants 32 29 (3) (9%) 0.9% $14.51Source: EMSI; U.S. BLS
Top 25 Occupations - Pinal CountyAdvanced Health Services

99
Compared to the broader industry, advanced health services require even more education to qualify. Nearly 40% of the occupations within the advanced health services sub-sectors require a bachelor’s degree versus 22% across the entire industry.
NoneLess Than 5
Years5 Years or
MoreNo formal educational credential 3.4% 3.4% 0.001%High school diploma or equivalent 24.3% 22.0% 2.2% 0.1%Postsecondary nondegree award 11.9% 11.3% 0.6% 0.001%Some college, no degree 0.7% 0.7%Associate's degree 10.4% 9.8% 0.6%Bachelor's degree 39.7% 33.9% 3.7% 2.1%Master's degree 3.6% 3.5% 0.005% 0.0%Doctoral or professional degree 5.9% 5.9% 0.000000%Grand Total 100.0% 90.5% 7.1% 2.2%Source: EMSI; Elliott D. Pollack & Company
Education & Skills RequirementsAdvanced Health Services
Education Requirements
% of Total Occupations
Work Experience Requirement
None
Short-term on-
the-job training
Moderate-term on-
the-job training
Long-term on-
the-job training Apprenticeship
Internship/ Residency
No formal educational credential 3.4% 0.00% 3.4% 0.04% 0.01%High school diploma or equivalent 24.3% 2.9% 11.2% 9.7% 0.3% 0.09%Postsecondary nondegree award 11.9% 11.2% 0.6% 0.008% 0.08%Some college, no degree 0.7% 0.3% 0.00% 0.3% 0.005%Associate's degree 10.4% 9.9% 0.00% 0.4% 0.0009%Bachelor's degree 39.7% 38.4% 0.05% 0.8% 0.02% 0.3%Master's degree 3.6% 1.64% 1.9%Doctoral or professional degree 5.9% 3.8% 0.00000% 2.1%Grand Total 100.0% 68.3% 15.3% 11.3% 0.4% 0.1% 4.4%Source: EMSI; Elliott D. Pollack & Company
Advanced Health Services
Education Requirements
% of Total Occupations
Training Requirement
Education & Skills Requirements

100
AEROSPACE AND DEFENSE Pinal County has existing assets available to the aerospace and defense industry, such as Pinal Airpark. The airpark is home to companies that store, maintain, and salvage commercial aircraft such as Ascent Aerospace Solutions. In addition, there are training facilities for paratroopers and helicopter pilots. Future companies within this sector could include the following:
− Large Civil Aircraft
− Rotorcraft
− Commercial Space
− General Aviation
− Engines
− Unmanned Aircraft Systems
− Arms Producing Companies
− Alternative Aviation Fuels
− Supply Chain
− Military
The following table displays the top 25 occupations within the aerospace and defense industry across Greater Phoenix as well as Pinal County. A total of 365 separate occupations can be found within the aerospace and defense sector. The top 25 occupations in this industry cumulatively represent 72.4% of all jobs in the industry within Greater Phoenix but only 55.6% of the industry within Pinal County. The total change and percent change of the top occupations in aerospace and defense from 2012 to 2017 have also been displayed. In Greater Phoenix, the majority of the top 25 occupations experienced a decline. In Pinal County, most of the top occupations have shown growth, but on a much smaller base of employment. In addition, median hourly earnings for each occupation are listed. Earnings among top occupations in Greater Phoenix range from a low of $13.07 (Team Assemblers) up to $45.01 (Aerospace Engineers). There are a significant number of occupations within the industry that earn higher than average wages, such as pilots, software developers, mechanical engineers, and industrial engineers.

101
SOC Description
Employed in Industry
(2012)
Employed in Industry
(2017)Change
(2012-2017)% Change
(2012-2017)
% of Total Jobs in
Industry (2017)
Median Hourly
Earnings55-9999 Military occupations 13,434 14,441 1,007 7% 26.9% $18.5143-4181 Reservation and Transportation Ticket Agents and Travel Clerks 3,202 3,241 39 1% 6.0% $17.3849-3011 Aircraft Mechanics and Service Technicians 2,951 3,221 270 9% 6.0% $29.0453-2031 Flight Attendants 3,165 3,214 49 2% 6.0% $30.9753-2011 Airline Pilots, Copilots, and Flight Engineers 2,925 2,953 28 1% 5.5% $42.0753-7062 Laborers and Freight, Stock, and Material Movers, Hand 1,094 1,146 52 5% 2.1% $13.2017-2011 Aerospace Engineers 1,259 1,123 (136) (11%) 2.1% $45.0151-4041 Machinists 825 802 (23) (3%) 1.5% $19.8851-9061 Inspectors, Testers, Sorters, Samplers, and Weighers 851 768 (83) (10%) 1.4% $19.4715-1133 Software Developers, Systems Software 896 723 (173) (19%) 1.3% $44.5243-4051 Customer Service Representatives 671 671 0 0% 1.3% $15.1717-2112 Industrial Engineers 734 645 (89) (12%) 1.2% $42.3551-2011 Aircraft Structure, Surfaces, Rigging, and Systems Assemblers 681 619 (62) (9%) 1.2% $25.6443-5061 Production, Planning, and Expediting Clerks 612 577 (35) (6%) 1.1% $20.1051-2022 Electrical and Electronic Equipment Assemblers 712 480 (232) (33%) 0.9% $17.7751-2092 Team Assemblers 549 459 (90) (16%) 0.9% $13.0751-1011 First-Line Supervisors of Production and Operating Workers 495 443 (52) (11%) 0.8% $24.0643-1011 First-Line Supervisors of Office & Administrative Support Workers 441 437 (4) (1%) 0.8% $23.5517-2072 Electronics Engineers, Except Computer 533 428 (105) (20%) 0.8% $38.0415-1132 Software Developers, Applications 511 421 (90) (18%) 0.8% $42.7017-3026 Industrial Engineering Technicians 456 408 (48) (11%) 0.8% $27.0613-1023 Purchasing Agents, Except Wholesale, Retail, & Farm Products 455 408 (47) (10%) 0.8% $27.3517-2141 Mechanical Engineers 456 396 (60) (13%) 0.7% $41.1413-1081 Logisticians 426 388 (38) (9%) 0.7% $30.8553-2012 Commercial Pilots 292 383 91 31% 0.7% $32.68Source: EMSI; U.S. BLS
Top 25 Occupations - Greater PhoenixAerospace & Defense

102
SOC Description
Employed in Industry
(2012)
Employed in Industry
(2017)
Change (2012-2017)
% Change (2012-2017)
% of Total Jobs in
Industry (2017)
Median Hourly
Earnings55-9999 Military-only occupations 330 406 76 23% 25.5% $18.9849-3011 Aircraft Mechanics and Service Technicians 89 41 (48) (54%) 2.6% $26.4051-2028 Electrical, Electronic, and Electromechanical Assemblers 30 37 7 23% 2.3% $15.9915-1133 Software Developers, Systems Software 32 34 2 6% 2.1% $38.9553-2011 Airline Pilots, Copilots, and Flight Engineers 24 26 2 8% 1.7% $37.7511-9199 Managers, All Other 15 24 9 60% 1.5% $14.3851-2098 Assemblers & Fabricators, All Other, Including Team Assemblers 23 23 0 0% 1.5% $13.1111-1021 General and Operations Managers 23 22 (1) (4%) 1.4% $32.9333-3051 Police and Sheriff's Patrol Officers 19 21 2 11% 1.3% $31.1353-2012 Commercial Pilots 16 20 4 25% 1.3% $31.2917-2072 Electronics Engineers, Except Computer 14 20 6 43% 1.3% $33.8713-1071 Human Resources Specialists 15 17 2 13% 1.1% $24.0143-4051 Customer Service Representatives 21 16 (5) (24%) 1.0% $14.7917-2071 Electrical Engineers 16 16 0 0% 1.0% $42.4113-1081 Logisticians 13 16 3 23% 1.0% $30.4053-3032 Heavy and Tractor-Trailer Truck Drivers <10 16 8 100% 1.0% $16.5851-9061 Inspectors, Testers, Sorters, Samplers, and Weighers 14 16 2 14% 1.0% $17.7749-9071 Maintenance and Repair Workers, General 15 16 1 7% 1.0% $15.2617-2011 Aerospace Engineers 13 16 3 23% 1.0% $41.4917-2112 Industrial Engineers 13 15 2 15% 1.0% $36.4517-2141 Mechanical Engineers 11 13 2 18% 0.8% $34.1217-3023 Electrical and Electronics Engineering Technicians 14 13 (1) (7%) 0.8% $26.5615-1132 Software Developers, Applications 10 13 3 30% 0.8% $34.7711-9041 Architectural and Engineering Managers 11 13 2 18% 0.8% $49.2811-3121 Human Resources Managers 11 13 2 18% 0.8% $31.79Source: EMSI; U.S. BLS
Top 25 Occupations - Pinal CountyAerospace & Defense

103
The following tables display various education and skills requirements for occupations within the aerospace and defense industry. Apart from general military occupations, a significant number of occupations require a high school diploma. Beyond a high school diploma, 6.9% of occupations require a postsecondary non-degree award, and 25.2% require a bachelor’s degree. Work experience requirements are highest among jobs that require either a high school diploma or bachelor’s degree. On-the-job training is also most prevalent for these two groups. Nearly 20% of jobs (within the high school graduate requirement) require moderate to long term on-the-job training.
NoneLess Than 5
Years5 Years or
MoreNo formal educational credential 30.1% 30.1% 0.002%High school diploma or equivalent 34.1% 24.9% 9.0% 0.2%Postsecondary nondegree award 6.9% 6.9% 0.0% 0.01%Some college, no degree 0.4% 0.4%Associate's degree 3.2% 3.2% 0.0%Bachelor's degree 25.2% 14.7% 7.3% 3.2%Master's degree 0.02% 0.02%Doctoral or professional degree 0.1% 0.1%Grand Total 100.0% 80.3% 16.3% 3.4%Source: EMSI; Elliott D. Pollack & Company
Education & Skills RequirementsAerospace & Defense
Education Requirements
% of Total Occupations
Work Experience Requirement

104
Advanced Aerospace and Defense A smaller subset of aerospace and defense sectors was selected that best represent what could be considered “high tech” portions of the overall industry. Of the 21 sectors that comprise the aerospace and defense industry, 12 sectors were chosen based on the type of business activity conducted. This includes explosives manufacturing, ammunition manufacturing, Search, Detection, Navigation, Guidance, Aeronautical, and Nautical System and Instrument Manufacturing, aircraft manufacturing, air traffic control, and others (a complete list is provided in Appendix 3 of this report). As the following tables of the top 25 occupations illustrate, advanced aerospace & defense positions command much higher wages. Similar to advanced manufacturing, the occupations within this subset of advanced aerospace and defense have experienced a decline in positions over the past five years. Successful economic development efforts must occur before pursuing this particular sector as a career.
None
Short-term on-
the-job training
Moderate-term on-
the-job training
Long-term on-
the-job training Apprenticeship
Internship/ Residency
No formal educational credential 30.1% 27.1% 3.0% 0.09% 0.00%High school diploma or equivalent 34.1% 3.2% 11.0% 17.6% 2.1% 0.2%Postsecondary nondegree award 6.9% 6.0% 0.4% 0.1% 0.4%Some college, no degree 0.4% 0.2% 0.003% 0.2%Associate's degree 3.2% 3.1% 0.004% 0.03% 0.08%Bachelor's degree 25.2% 17.9% 0.11% 7.2% 0.01%Master's degree 0.02% 0.02%Doctoral or professional degree 0.1% 0.1%Grand Total 100.0% 57.5% 14.5% 25.2% 2.6% 0.2% 0.0%Source: EMSI; Elliott D. Pollack & Company
Aerospace & Defense
Education Requirements
% of Total Occupations
Training Requirement
Education & Skills Requirements
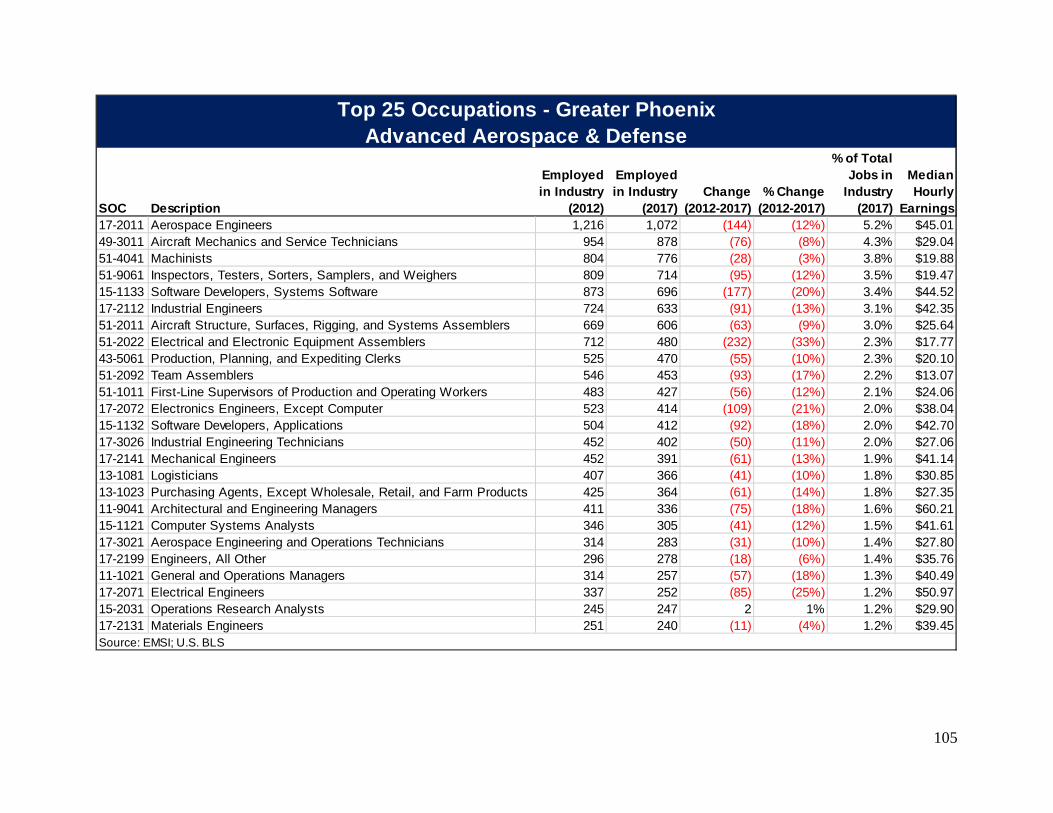
105
SOC Description
Employed in Industry
(2012)
Employed in Industry
(2017)Change
(2012-2017)% Change
(2012-2017)
% of Total Jobs in
Industry (2017)
Median Hourly
Earnings17-2011 Aerospace Engineers 1,216 1,072 (144) (12%) 5.2% $45.0149-3011 Aircraft Mechanics and Service Technicians 954 878 (76) (8%) 4.3% $29.0451-4041 Machinists 804 776 (28) (3%) 3.8% $19.8851-9061 Inspectors, Testers, Sorters, Samplers, and Weighers 809 714 (95) (12%) 3.5% $19.4715-1133 Software Developers, Systems Software 873 696 (177) (20%) 3.4% $44.5217-2112 Industrial Engineers 724 633 (91) (13%) 3.1% $42.3551-2011 Aircraft Structure, Surfaces, Rigging, and Systems Assemblers 669 606 (63) (9%) 3.0% $25.6451-2022 Electrical and Electronic Equipment Assemblers 712 480 (232) (33%) 2.3% $17.7743-5061 Production, Planning, and Expediting Clerks 525 470 (55) (10%) 2.3% $20.1051-2092 Team Assemblers 546 453 (93) (17%) 2.2% $13.0751-1011 First-Line Supervisors of Production and Operating Workers 483 427 (56) (12%) 2.1% $24.0617-2072 Electronics Engineers, Except Computer 523 414 (109) (21%) 2.0% $38.0415-1132 Software Developers, Applications 504 412 (92) (18%) 2.0% $42.7017-3026 Industrial Engineering Technicians 452 402 (50) (11%) 2.0% $27.0617-2141 Mechanical Engineers 452 391 (61) (13%) 1.9% $41.1413-1081 Logisticians 407 366 (41) (10%) 1.8% $30.8513-1023 Purchasing Agents, Except Wholesale, Retail, and Farm Products 425 364 (61) (14%) 1.8% $27.3511-9041 Architectural and Engineering Managers 411 336 (75) (18%) 1.6% $60.2115-1121 Computer Systems Analysts 346 305 (41) (12%) 1.5% $41.6117-3021 Aerospace Engineering and Operations Technicians 314 283 (31) (10%) 1.4% $27.8017-2199 Engineers, All Other 296 278 (18) (6%) 1.4% $35.7611-1021 General and Operations Managers 314 257 (57) (18%) 1.3% $40.4917-2071 Electrical Engineers 337 252 (85) (25%) 1.2% $50.9715-2031 Operations Research Analysts 245 247 2 1% 1.2% $29.9017-2131 Materials Engineers 251 240 (11) (4%) 1.2% $39.45Source: EMSI; U.S. BLS
Top 25 Occupations - Greater PhoenixAdvanced Aerospace & Defense

106
SOC Description
Employed in Industry
(2012)
Employed in Industry
(2017)
Change (2012-2017)
% Change (2012-2017)
% of Total Jobs in
Industry (2017)
Median Hourly
Earnings51-2028 Electrical, Electronic, and Electromechanical Assemblers 30 37 7 23% 6.4% $15.9915-1133 Software Developers, Systems Software 31 34 3 10% 5.9% $38.9551-2098 Assemblers & Fabricators, All Other, Including Team Assemblers 22 23 1 5% 4.0% $13.1117-2072 Electronics Engineers, Except Computer 13 20 7 54% 3.4% $33.8717-2071 Electrical Engineers 15 16 1 7% 2.8% $42.4117-2011 Aerospace Engineers 11 15 4 36% 2.6% $41.4917-2112 Industrial Engineers 12 15 3 25% 2.6% $36.4511-1021 General and Operations Managers 11 14 3 27% 2.5% $32.9351-9061 Inspectors, Testers, Sorters, Samplers, and Weighers 10 14 4 40% 2.4% $17.7743-4051 Customer Service Representatives <10 13 3 30% 2.3% $14.7915-1132 Software Developers, Applications <10 13 3 30% 2.2% $34.7741-4011 Sales Representatives, Wholesale, Manufacturing, Technical & Scientific Products 11 12 1 9% 2.2% $26.3811-9041 Architectural and Engineering Managers <10 12 3 33% 2.1% $49.2817-3023 Electrical and Electronics Engineering Technicians 12 12 0 0% 2.1% $26.5617-2141 Mechanical Engineers <10 12 2 20% 2.0% $34.1251-1011 First-Line Supervisors of Production and Operating Workers <10 11 2 22% 2.0% $21.3551-4041 Machinists <10 11 1 10% 1.9% $16.9149-9069 Precision Instrument and Equipment Repairers, All Other <10 <10 0 0% 0.1% $16.7651-9198 Helpers--Production Workers <10 <10 0 0% 0.1% $12.2117-2041 Chemical Engineers <10 <10 0 0% 0.1% $48.2217-3029 Engineering Technicians, Except Drafters, All Other <10 <10 3 100% 1.0% $25.3451-9199 Production Workers, All Other <10 <10 0 0% 0.2% $16.4643-5061 Production, Planning, and Expediting Clerks <10 <10 2 29% 1.5% $18.3443-6011 Executive Secretaries and Executive Administrative Assistants <10 <10 (1) (25%) 0.5% $21.9327-3042 Technical Writers <10 <10 (1) (50%) 0.2% $22.01Source: EMSI; U.S. BLS
Top 25 Occupations - Pinal CountyAdvanced Aerospace & Defense

107
The following tables display various education and skills requirements for occupations within the industry. In sharp contrast to the broader industry, advanced aerospace & defense sectors require more education to qualify. Only 1.6% of the positions do not require any formal educational requirement versus over 30% of jobs in the broader industry. Over 46% of the occupations within the advanced sub-sectors require a bachelor’s degree versus 25.2% across the entire industry.
NoneLess Than 5
Years5 Years or
MoreNo formal educational credential 1.6% 1.6%High school diploma or equivalent 38.2% 34.3% 3.7% 0.2%Postsecondary nondegree award 5.7% 5.6% 0.01% 0.02%Some college, no degree 0.7% 0.7%Associate's degree 7.0% 7.0%Bachelor's degree 46.3% 35.8% 3.4% 7.1%Master's degree 0.04% 0.04%Doctoral or professional degree 0.2% 0.2%Grand Total 100.0% 85.3% 7.2% 7.3%
Source: EMSI; Elliott D. Pollack & Company
Education & Skills RequirementsAdvanced Aerospace & Defense
Education Requirements
% of Total Occupations
Work Experience Requirement
None
Short-term on-
the-job training
Moderate-term on-
the-job training
Long-term on-
the-job training Apprenticeship
Internship/ Residency
No formal educational c 1.6% 1.4% 0.2%High school diploma or 38.2% 3.8% 4.2% 25.1% 4.6% 0.5%Postsecondary nondeg 5.7% 4.3% 0.2% 0.3% 0.9%Some college, no degr 0.7% 0.4% 0.3%Associate's degree 7.0% 6.9% 0.01% 0.1%Bachelor's degree 46.3% 42.1% 0.2% 3.9% 0.03% 0.002%Master's degree 0.04% 0.04% 0.0003%Doctoral or professiona 0.2% 0.2% 0.0001%Grand Total 100.0% 57.7% 6.0% 29.9% 5.6% 0.5% 0.0%Source: EMSI; Elliott D. Pollack & Company
Advanced Aerospace & Defense
Education Requirements
% of Total Occupations
Training Requirement
Education & Skills Requirements

108
NATURAL AND RENEWABLE RESOURCES As illustrated previously, Pinal County already has an established natural and renewable resources base. This includes large mining operations, a wide array of mining support services, nonmetal mining/quarrying, and solar electricity generating facilities. Future companies in the natural and renewable resources industry could include the following:
− Biofuels
− Solar Energy
− Wind Energy
− Fuel Cells & Industrial Batteries
− Pulp & Paper Products
− Mining
− Mining Support Services
− Construction Materials The following tables display the top 25 occupations within the natural and renewable resources industry. A total of 493 separate occupations can be found within this industry. The top 25 occupations in this industry within Greater Phoenix cumulatively represent 71.2% of all jobs in the industry. The total change and percent change of the top occupations in this industry from 2012 to 2017 are also displayed. In addition, median hourly earnings for each occupation are listed. Earnings among top occupations range from a low of $9.36 Farmworkers and Laborers, Crop, Nursery, and Greenhouse) up to $40.49 (general & operations managers).

109
SOC Description
Employed in Industry
(2012)
Employed in Industry
(2017)Change
(2012-2017)% Change
(2012-2017)
% of Total Jobs in
Industry (2017)
Median Hourly
Earnings45-2092 Farmworkers and Laborers, Crop, Nursery, and Greenhouse 3,951 4,420 469 12% 18.1% $9.3611-9013 Farmers, Ranchers, and Other Agricultural Managers 3,587 3,401 (186) (5%) 14.0% $12.5711-9199 Managers, All Other 728 989 261 36% 4.1% $16.5653-7073 Wellhead Pumpers 405 906 501 124% 3.7% $21.3411-9141 Property, Real Estate, and Community Association Managers 545 838 293 54% 3.4% $16.3899-9999 Unclassified Occupation 792 831 39 5% 3.4% $12.7411-1021 General and Operations Managers 386 634 248 64% 2.6% $40.4945-2093 Farmworkers, Farm, Ranch, and Aquacultural Animals 424 488 64 15% 2.0% $11.3953-3032 Heavy and Tractor-Trailer Truck Drivers 458 431 (27) (6%) 1.8% $18.0339-2021 Nonfarm Animal Caretakers 443 416 (27) (6%) 1.7% $10.0945-2091 Agricultural Equipment Operators 342 413 71 21% 1.7% $12.0213-1111 Management Analysts 433 405 (28) (6%) 1.7% $26.4111-1011 Chief Executives 149 364 215 144% 1.5% $30.7649-3042 Mobile Heavy Equipment Mechanics, Except Engines 438 358 (80) (18%) 1.5% $23.2747-1011 First-Line Supervisors of Construction Trades & Extraction Workers 528 347 (181) (34%) 1.4% $26.0539-2011 Animal Trainers 368 320 (48) (13%) 1.3% $10.0745-1011 First-Line Supervisors of Farming, Fishing, and Forestry Workers 265 273 8 3% 1.1% $25.0613-2011 Accountants and Auditors 255 224 (31) (12%) 0.9% $26.1547-2073 Operating Engineers and Other Construction Equipment Operators 156 216 60 38% 0.9% $21.9053-7072 Pump Operators, Except Wellhead Pumpers 110 210 100 91% 0.9% $19.2643-6014 Administrative Assistants, Except Legal, Medical, & Executive 147 201 54 37% 0.8% $16.1849-9071 Maintenance and Repair Workers, General 166 177 11 7% 0.7% $16.4943-3031 Bookkeeping, Accounting, and Auditing Clerks 199 170 (29) (15%) 0.7% $17.6353-7062 Laborers and Freight, Stock, and Material Movers, Hand 174 169 (5) (3%) 0.7% $13.2051-1011 First-Line Supervisors of Production and Operating Workers 166 159 (7) (4%) 0.7% $24.06Source: EMSI; U.S. BLS
Top 25 Occupations - Greater PhoenixNatural & Renewable Resources

110
SOC Description
Employed in Industry
(2012)
Employed in Industry
(2017)
Change (2012-2017)
% Change (2012-2017)
% of Total Jobs in
Industry (2017)
Median Hourly
Earnings45-2092 Farmworkers and Laborers, Crop, Nursery, and Greenhouse 1,048 1,180 132 13% 21.9% $10.4911-9013 Farmers, Ranchers, and Other Agricultural Managers 909 932 23 3% 17.3% $12.6953-7073 Wellhead Pumpers 90 170 80 89% 3.2% $21.6411-9141 Property, Real Estate, and Community Association Managers 124 158 34 27% 2.9% $15.4511-9199 Managers, All Other 121 154 33 27% 2.9% $14.3849-3042 Mobile Heavy Equipment Mechanics, Except Engines 194 141 (53) (27%) 2.6% $21.2445-2093 Farmworkers, Farm, Ranch, and Aquacultural Animals 93 128 35 38% 2.4% $12.4111-1021 General and Operations Managers 84 118 34 40% 2.2% $32.9345-2091 Agricultural Equipment Operators 89 116 27 30% 2.2% $14.0453-3032 Heavy and Tractor-Trailer Truck Drivers 116 110 (6) (5%) 2.0% $16.5839-2021 Nonfarm Animal Caretakers 76 85 9 12% 1.6% $10.0239-2011 Animal Trainers 65 72 7 11% 1.3% $10.0247-1011 First-Line Supervisors of Construction Trades &Extraction Workers 126 69 (57) (45%) 1.3% $21.8211-1011 Chief Executives 32 69 37 116% 1.3% $25.3945-1011 First-Line Supervisors of Farming, Fishing, and Forestry Workers 64 64 0 0% 1.2% $25.8651-1011 First-Line Supervisors of Production and Operating Workers 42 57 15 36% 1.1% $21.3549-9041 Industrial Machinery Mechanics 48 44 (4) (8%) 0.8% $20.1599-9999 Unclassified Occupation 78 43 (35) (45%) 0.8% $14.0149-9071 Maintenance and Repair Workers, General 25 42 17 68% 0.8% $15.2613-2011 Accountants and Auditors 58 41 (17) (29%) 0.8% $23.5017-2151 Mining & Geological Engineers, Including Mining Safety Engineers 49 37 (12) (24%) 0.7% $31.5643-6014 Secretaries and Administrative Assistants 29 36 7 24% 0.7% $14.5153-7072 Pump Operators, Except Wellhead Pumpers 24 35 11 46% 0.6% $19.0853-7032 Excavating and Loading Machine and Dragline Operators 42 32 (10) (24%) 0.6% $19.8043-3031 Bookkeeping, Accounting, and Auditing Clerks 44 31 (13) (30%) 0.6% $15.98Source: EMSI; U.S. BLS
Top 25 Occupations - Pinal CountyNatural & Renewable Resources

111
Over 46% of the occupations require a high school diploma while 31.8% of jobs in the industry do not require any formal educational requirement. The remaining 22% require some form of post-secondary education, most notably a bachelor’s degree. Jobs requiring no formal education typically require some short-term on-the-job training. Occupations requiring a high school diploma have a higher rate of requiring previous work experience and longer-term training on the job. The jobs requiring post-secondary education have lower rates of on-the-job training, which suggests the educational training received is the dominant skill sought by the employer.
NoneLess Than 5
Years5 Years or
MoreNo formal educational credential 31.8% 31.7% 0.05%High school diploma or equivalent 46.2% 19.9% 10.8% 15.5%Postsecondary nondegree award 2.0% 2.0% 0.1%Some college, no degree 0.8% 0.8%Associate's degree 0.9% 0.9%Bachelor's degree 17.8% 6.3% 6.4% 5.1%Master's degree 0.11% 0.1% 0.03%Doctoral or professional degree 0.3% 0.3%Grand Total 100.0% 62.0% 17.4% 20.6%Source: EMSI; Elliott D. Pollack & Company
Education & Skills RequirementsNatural & Renewable Resources
Education Requirements
% of Total Occupations
Work Experience Requirement

112
Advanced Natural & Renewable Resources A smaller subset of natural and renewable resource sectors was selected that best represent what could be considered “high tech” portions of the overall industry. Of the 50 sectors that comprise the natural and renewable resources industry, 32 sectors were chosen based on the type of business activity conducted. This includes farm management services, mining, support activities for mining, support activities for oil & gas, electric power generation and distribution, battery manufacturing, environmental consulting services, and others (a complete list is provided in Appendix 3 of this report). As the following tables of the top 25 occupations illustrate, advanced natural & renewable resources positions command much higher wages. The weighted average wage of the top 25 occupations in advanced transportation and logistics is over 38% higher than the top 25 occupations in the broader natural & renewable resources industry.
None
Short-term on-
the-job training
Moderate-term on-
the-job training
Long-term on-
the-job training Apprenticeship
Internship/ Residency
No formal educational credential 31.8% 3.4% 25.2% 3.1% 0.1%High school diploma or equivalent 46.2% 22.1% 5.6% 14.7% 3.3% 0.5%Postsecondary nondegree award 2.0% 0.1% 1.8% 0.1% 0.1%Some college, no degree 0.8% 0.1% 0.003% 0.7% 0.005%Associate's degree 0.9% 0.6% 0.3%Bachelor's degree 17.8% 16.9% 0.03% 0.6% 0.2% 0.1%Master's degree 0.11% 0.1% 0.01%Doctoral or professional degree 0.3% 0.3% 0.01%Grand Total 100.0% 43.6% 32.7% 19.5% 3.6% 0.5% 0.1%Source: EMSI; Elliott D. Pollack & Company
Natural & Renewable Resources
Education Requirements
% of Total Occupations
Training Requirement
Education & Skills Requirements

113
SOC Description
Employed in Industry
(2012)
Employed in Industry
(2017)Change
(2012-2017)% Change
(2012-2017)
% of Total Jobs in
Industry (2017)
Median Hourly
Earnings53-7073 Wellhead Pumpers 404 892 488 121% 8.3% $21.3411-9141 Property, Real Estate, and Community Association Managers 538 825 287 53% 7.6% $16.3811-9199 Managers, All Other 525 792 267 51% 7.3% $16.5699-9999 Unclassified Occupation 668 725 57 9% 6.7% $12.7411-1021 General and Operations Managers 328 567 239 73% 5.2% $40.4913-1111 Management Analysts 416 401 (15) (4%) 3.7% $26.4111-1011 Chief Executives 128 337 209 163% 3.1% $30.7647-1011 First-Line Supervisors of Construction Trades and Extraction Workers 459 277 (182) (40%) 2.6% $26.0549-3042 Mobile Heavy Equipment Mechanics, Except Engines 327 257 (70) (21%) 2.4% $23.2753-7072 Pump Operators, Except Wellhead Pumpers 109 196 87 80% 1.8% $19.2613-2011 Accountants and Auditors 211 176 (35) (17%) 1.6% $26.1553-3032 Heavy and Tractor-Trailer Truck Drivers 205 165 (40) (20%) 1.5% $18.0351-1011 First-Line Supervisors of Production and Operating Workers 144 133 (11) (8%) 1.2% $24.0643-4051 Customer Service Representatives 121 131 10 8% 1.2% $15.1743-6014 Administrative Assistants, Except Legal, Medical, & Executive 82 125 43 52% 1.2% $16.1851-9061 Inspectors, Testers, Sorters, Samplers, and Weighers 136 117 (19) (14%) 1.1% $19.4747-5081 Helpers--Extraction Workers 167 113 (54) (32%) 1.0% $13.8349-9041 Industrial Machinery Mechanics 138 102 (36) (26%) 0.9% $21.9247-5013 Service Unit Operators, Oil, Gas, and Mining 17 92 75 441% 0.9% $20.9249-9071 Maintenance and Repair Workers, General 94 92 (2) (2%) 0.8% $16.4947-2061 Construction Laborers 103 91 (12) (12%) 0.8% $13.6513-1161 Market Research Analysts and Marketing Specialists 76 89 13 17% 0.8% $26.7047-5041 Continuous Mining Machine Operators 113 88 (25) (22%) 0.8% $22.0919-2042 Geoscientists, Except Hydrologists and Geographers 135 88 (47) (35%) 0.8% $38.0443-3031 Bookkeeping, Accounting, and Auditing Clerks 117 81 (36) (31%) 0.8% $17.63Source: EMSI; U.S. BLS
Top 25 Occupations - Greater PhoenixAdvanced Natural & Renewable Resources

114
SOC Description
Employed in Industry
(2012)
Employed in Industry
(2017)
Change (2012-2017)
% Change (2012-2017)
% of Total Jobs in
Industry (2017)
Median Hourly
Earnings53-7073 Wellhead Pumpers 90 170 80 89% 8.1% $21.6411-9141 Property, Real Estate, and Community Association Managers 122 155 33 27% 7.4% $15.4511-9199 Managers, All Other 99 133 34 34% 6.4% $14.3849-3042 Mobile Heavy Equipment Mechanics, Except Engines 181 129 (52) (29%) 6.2% $21.2411-1021 General and Operations Managers 74 105 31 42% 5.0% $32.9353-3032 Heavy and Tractor-Trailer Truck Drivers 76 67 (9) (12%) 3.2% $16.5847-1011 First-Line Supervisors of Construction Trades & Extraction Workers 120 64 (56) (47%) 3.1% $21.8211-1011 Chief Executives 27 62 35 130% 3.0% $25.3951-1011 First-Line Supervisors of Production and Operating Workers 38 53 15 39% 2.6% $21.3517-2151 Mining & Geological Engineers, Including Mining Safety Engineers 48 37 (11) (23%) 1.8% $31.5699-9999 Unclassified Occupation 78 36 (42) (54%) 1.7% $14.0149-9041 Industrial Machinery Mechanics 41 35 (6) (15%) 1.7% $20.1553-7072 Pump Operators, Except Wellhead Pumpers 24 34 10 42% 1.6% $19.0813-2011 Accountants and Auditors 47 29 (18) (38%) 1.4% $23.5047-5041 Continuous Mining Machine Operators 22 27 5 23% 1.3% $19.5551-9021 Crushing, Grinding, Polishing Machine Setters, Operators, & Tenders 21 26 5 24% 1.3% $14.2153-7032 Excavating and Loading Machine and Dragline Operators 34 25 (9) (26%) 1.2% $19.8049-1011 First-Line Supervisors of Mechanics, Installers, and Repairers 32 25 (7) (22%) 1.2% $24.5247-5081 Helpers--Extraction Workers 52 24 (28) (54%) 1.1% $15.2151-9061 Inspectors, Testers, Sorters, Samplers, and Weighers 28 22 (6) (21%) 1.1% $17.7749-9043 Maintenance Workers, Machinery 40 22 (18) (45%) 1.0% $17.2549-9071 Maintenance and Repair Workers, General 11 21 10 91% 1.0% $15.2643-6014 Secretaries and Administrative Assistants 15 20 5 33% 1.0% $14.5147-5012 Rotary Drill Operators, Oil and Gas 40 19 (21) (53%) 0.9% $22.5613-1111 Management Analysts 22 19 (3) (14%) 0.9% $24.74Source: EMSI; U.S. BLS
Top 25 Occupations - Pinal CountyAdvanced Natural & Renewable Resources

115
Compared to the broader industry, advanced natural and renewable resources require even more education to qualify. Nearly 40% of the occupations within the natural and renewable resources sub-sectors require a bachelor’s degree versus 22% across the entire industry.
NoneLess Than 5
Years5 Years or
MoreNo formal educational credential 13.4% 13.4%High school diploma or equivalent 47.1% 24.2% 20.0% 2.9%Postsecondary nondegree award 2.0% 1.8% 0.2%Some college, no degree 1.0% 1.0%Associate's degree 1.6% 1.6%Bachelor's degree 34.2% 12.0% 12.1% 10.1%Master's degree 0.23% 0.2% 0.05%Doctoral or professional degree 0.6% 0.6%Grand Total 100.0% 54.7% 32.2% 13.0%Source: EMSI; Elliott D. Pollack & Company
Education & Skills RequirementsAdvanced Natural & Renewable Resources
Education Requirements
% of Total Occupations
Work Experience Requirement
None
Short-term on-
the-job training
Moderate-term on-
the-job training
Long-term on-
the-job training Apprenticeship
Internship/ Residency
No formal educational credential 31.8% 6.7% 3.8% 2.9% 0.0%High school diploma or equivalent 46.2% 13.8% 4.8% 22.3% 5.4% 0.8%Postsecondary nondegree award 2.0% 0.1% 1.5% 0.2% 0.2%Some college, no degree 0.8% 0.2% 0.007% 0.8% 0.001%Associate's degree 0.9% 1.2% 0.003% 0.4% 0.0000%Bachelor's degree 17.8% 32.7% 0.06% 0.9% 0.3% 0.2%Master's degree 0.11% 0.2% 0.02%Doctoral or professional degree 0.3% 0.6% 0.00000% 0.02%Grand Total 100.0% 55.5% 10.3% 27.4% 5.9% 0.8% 0.3%Source: EMSI; Elliott D. Pollack & Company
Advanced Natural & Renewable Resources
Education Requirements
% of Total Occupations
Training Requirement
Education & Skills Requirements

116
TOURISM Tourism can include the following:
− Hotels/Inns
− Casinos
− Amusement Parks/Tours
− Spectator Sports
− Racetracks
− Historical Sites/Museums/etc.
− Travel Agencies/ Tour Operators
− Scenic/ Sightseeing Transportation The following tables displays the top 25 occupations within the tourism industry within Greater Phoenix and Pinal County separately. A total of 457 separate occupations can be found within this industry. The top 25 occupations in this industry cumulatively represent 57% of all jobs in the industry within Greater Phoenix and 64.2% within Pinal County. The total change and percent change of the top occupations in this industry from 2012 to 2017 are displayed. In addition, median hourly earnings for each occupation are listed. Earnings among top occupations in Greater Phoenix range from a low of $5.81 (craft artists) up to $40.49 (general & operations managers).

117
SOC Description
Employed in Industry
(2012)
Employed in Industry
(2017)Change
(2012-2017)% Change
(2012-2017)
% of Total Jobs in
Industry (2017)
Median Hourly
Earnings37-2012 Maids and Housekeeping Cleaners 4,815 4,985 170 4% 6.0% $10.5127-2042 Musicians and Singers 3,710 4,438 728 20% 5.4% $14.9827-3043 Writers and Authors 3,122 4,043 921 30% 4.9% $14.9335-3031 Waiters and Waitresses 3,576 3,695 119 3% 4.5% $9.1743-4081 Hotel, Motel, and Resort Desk Clerks 2,738 2,805 67 2% 3.4% $10.7739-3091 Amusement and Recreation Attendants 2,300 2,483 183 8% 3.0% $10.3427-1013 Fine Artists, Including Painters, Sculptors, and Illustrators 1,794 2,157 363 20% 2.6% $8.5641-3041 Travel Agents 1,418 1,712 294 21% 2.1% $16.9649-9071 Maintenance and Repair Workers, General 1,524 1,611 87 6% 1.9% $16.4943-4051 Customer Service Representatives 1,334 1,576 242 18% 1.9% $15.1735-2014 Cooks, Restaurant 1,474 1,529 55 4% 1.8% $11.6611-9081 Lodging Managers 1,195 1,409 214 18% 1.7% $21.1743-4181 Reservation and Transportation Ticket Agents and Travel Clerks 1,244 1,351 107 9% 1.6% $17.3837-3011 Landscaping and Groundskeeping Workers 1,204 1,318 114 9% 1.6% $11.0927-1012 Craft Artists 984 1,180 196 20% 1.4% $5.8135-9011 Dining Room and Cafeteria Attendants and Bartender Helpers 1,132 1,171 39 3% 1.4% $9.3327-2011 Actors 853 1,151 298 35% 1.4% $14.0211-1021 General and Operations Managers 1,022 1,148 126 12% 1.4% $40.4941-2021 Counter and Rental Clerks 880 1,135 255 29% 1.4% $11.6433-9032 Security Guards 973 1,132 159 16% 1.4% $12.1335-3011 Bartenders 1,066 1,099 33 3% 1.3% $9.4111-9199 Managers, All Other 860 1,079 219 25% 1.3% $16.5641-3099 Sales Representatives, Services, All Other 976 1,037 61 6% 1.3% $21.3443-1011 First-Line Supervisors of Office & Administrative Support Workers 887 957 70 8% 1.2% $23.5527-2022 Coaches and Scouts 937 927 (10) (1%) 1.1% $14.67Source: EMSI; U.S. BLS
Top 25 Occupations - Greater PhoenixTourism

118
SOC Description
Employed in Industry
(2012)
Employed in Industry
(2017)
Change (2012-2017)
% Change (2012-2017)
% of Total Jobs in
Industry (2017)
Median Hourly
Earnings27-2042 Musicians and Singers 157 226 69 44% 8.6% $11.8627-3043 Writers and Authors 127 205 78 61% 7.8% $13.2237-2012 Maids and Housekeeping Cleaners 124 122 (2) (2%) 4.6% $10.1827-1013 Fine Artists, Including Painters, Sculptors, and Illustrators 77 109 32 42% 4.1% $6.7139-3091 Amusement and Recreation Attendants 66 84 18 27% 3.2% $11.2135-3031 Waiters and Waitresses 71 75 4 6% 2.9% $10.0137-3011 Landscaping and Groundskeeping Workers 73 68 (5) (7%) 2.6% $11.1111-9081 Lodging Managers 51 66 15 29% 2.5% $17.4527-1012 Craft Artists 41 60 19 46% 2.3% $4.8411-9199 Managers, All Other 40 60 20 50% 2.3% $14.3849-9071 Maintenance and Repair Workers, General 50 56 6 12% 2.1% $15.2627-2022 Coaches and Scouts 46 53 7 15% 2.0% $13.2827-2011 Actors 30 53 23 77% 2.0% $11.6043-4081 Hotel, Motel, and Resort Desk Clerks 54 52 (2) (4%) 2.0% $11.2839-9031 Fitness Trainers and Aerobics Instructors 73 50 (23) (32%) 1.9% $16.8427-2099 Entertainers and Performers, Sports and Related Workers, All Other 33 43 10 30% 1.6% $14.8939-9032 Recreation Workers 38 42 4 11% 1.6% $11.1127-4021 Photographers 31 42 11 35% 1.6% $13.4427-1011 Art Directors 11 37 26 236% 1.4% $12.3339-7018 Tour and Travel Guides 27 33 6 22% 1.3% $17.7727-2041 Music Directors and Composers 17 32 15 88% 1.2% $10.1511-1021 General and Operations Managers 28 32 4 14% 1.2% $32.9335-2014 Cooks, Restaurant 28 32 4 14% 1.2% $12.0441-3041 Travel Agents 22 29 7 32% 1.1% $14.9127-3012 Public Address System and Other Announcers 22 28 6 27% 1.1% $13.05Source: EMSI; U.S. BLS
Top 25 Occupations - Pinal CountyTourism

119
An estimated 33.8% of tourism occupations require a high school diploma while 41.7% of jobs in the industry do not require any formal educational requirement. The remaining 24.5% require some form of post-secondary education, most notably a bachelor’s degree (20.4%). Jobs requiring no formal education typically require some short term on-the-job training. Occupations requiring a high school diploma have a higher rate of requiring previous work experience and longer-term training on the job. The jobs requiring post-secondary education have lower rates of on-the-job training, which suggests the educational training received is the dominant skill sought by the employer.
NoneLess Than 5
Years5 Years or
MoreNo formal educational credential 41.7% 39.9% 1.8%High school diploma or equivalent 33.8% 25.1% 7.8% 0.8%Postsecondary nondegree award 1.5% 1.4% 0.1%Some college, no degree 2.2% 2.2%Associate's degree 0.3% 0.25% 0.0005%Bachelor's degree 20.4% 13.2% 4.0% 3.2%Master's degree 0.2% 0.1% 0.1%Doctoral or professional degree 0.1% 0.1%Grand Total 100.0% 82.2% 13.7% 4.1%Source: EMSI; Elliott D. Pollack & Company
Education & Skills RequirementsTourism
Education Requirements
% of Total Occupations
Work Experience Requirement
None
Short-term on-
the-job training
Moderate-term on-
the-job training
Long-term on-
the-job training Apprenticeship
Internship/ Residency
No formal educational credential 41.7% 0.2% 31.6% 2.0% 8.0%High school diploma or equivalent 33.8% 8.7% 15.3% 8.2% 1.5% 0.1%Postsecondary nondegree award 1.5% 0.6% 0.7% 0.0% 0.1%Some college, no degree 2.2% 0.1% 0.003% 0.7% 1.391%Associate's degree 0.3% 0.2% 0.015% 0.0% 0.0000%Bachelor's degree 20.4% 12.6% 0.11% 0.1% 7.5% 0.0%Master's degree 0.18% 0.2% 0.00%Doctoral or professional degree 0.1% 0.0% 0.00000% 0.00%Grand Total 100.0% 22.7% 47.7% 11.0% 18.4% 0.1% 0.0%Source: EMSI; Elliott D. Pollack & Company
Tourism
Education Requirements
% of Total Occupations
Training Requirement
Education & Skills Requirements

120
ECONOMIC DEVELOPMENT PIPELINE Pinal County is currently experiencing a flurry of economic development activity and interest. The Pinal County Economic and Workforce Development Department has identified over 20 projects that have either recently been completed, announced, or are considering the region for new operations. This list represents billions of dollars of capital investment and potentially tens of thousands of new jobs, without even considering the ripple effects of those direct jobs. The following table displays only a partial list of projects that could locate within the county. The projects have been generally categorized by targeted sector. To the extent information is available, the type of industry and number of potential jobs have also been displayed.
This pipeline of new investment can provide valuable insight in determining short term employment projections and future workforce needs. Industries that may not currently be represented in Pinal County could potentially become a significant part of the economy. Responsive workforce training can play an important role in helping these new companies identify and qualify their demand for employees. Close and frequent collaboration with economic development officials and other stakeholders will help to identify projects most likely to locate in the region. Once identified and confirmed, workforce staff and stakeholders can determine employment needs, training requirements, and the anticipated timing of new operations.
Target Industry Project Employees Industry Phoenix Mart 4,500 Global Wholesale Sourcing IPAZ Intermodal Facility 6,000 Industrial Park/Inland Port Confidential Project 400 Household Consumables Manufacturing Lucid Motors 2,200 High Tech Auto Manufacturing LKQ 200 Auto Parts manufacturing Nikola Motors 1,700 High Tech Auto Manufacturing Severson Movie Screens 75 Movie Industry Equipment Manufacturing
Health Services Sun Health Clinic/Pharmacy 15 Health care services Int'l Diplomatic Security Company 1,500 Pinal Airpark Based High Tech Military Testing N/A Military Support Resolution Copper 3,500-4,000 Copper Mining Solar Farm & Battery Storage N/A Utilities/Electricity Generation ASARCO Expansion N/A Copper Mining ACA - Confidential Project 50-100 Florence Copper 250 Copper Mining Mine Filtering Plant 375 Mining Support Services Bio Gas Facility 50-75 Ag Waste Gas Producer Attesa 2,500 Racetrack/ Research and Development
Tourism Dreamport Villages 7,000 Amusement Casino Resort 450 Gambling/Amusement
Source: Pinal County Economic Development Department
Pinal County Economic Development Pipeline
As of September 2018
Natural & Renewable Resources
Manufacturing
Transportation/ Logistics
Aerospace & Defense

121
LABOR MARKET ANALYSIS: APPENDIX 1: METHODOLOGY TO DEFINE AND DETERMINE IN-DEMAND INDUSTRIES
AND OCCUPATIONS WIOA provides guidance on the definition and determination of in-demand industries or occupations as the following:
(23) IN-DEMAND INDUSTRY SECTOR OR OCCUPATION
(A) IN GENERAL.—The term ‘‘in-demand industry sector or occupation’’ means—
(i) an industry sector that has a substantial current or potential impact (including through jobs that lead to economic self-sufficiency and opportunities for advancement) on the State, regional, or local economy, as appropriate, and that contributes to the growth or stability of other supporting businesses, or the growth of other industry sectors; or
(ii) an occupation that currently has or is projected to have a number of positions (including positions that lead to economic self-sufficiency and opportunities for advancement) in an industry sector so as to have a significant impact on the State, regional, or local economy, as appropriate.
(B) DETERMINATION.—The determination of whether an industry sector or occupation is in-demand under this paragraph shall be made by the State board or local board, as appropriate, using State and regional business and labor market projections, including the use of labor market information.
In publishing this definition, WIOA appears to be allowing for a common-sense approach to determine in-demand industries and occupations. This is stated in two different ways with a similar outcome:
1. From an industry approach: The selected industries must have a substantial impact on the economy and contribute to the growth and stability of other supporting businesses/industry sectors. They should also contain occupations that lead an individual to economic self-sufficiency and have opportunities for advancement.
2. From an occupational approach: The occupations should lead to economic self-sufficiency and either have a number of positions needed or be projected to have future positions needed in industries that have positive economic impacts.
In order to define in-demand occupations for Pinal County residents seeking career development services made available through the Workforce Innovation and Opportunity Act, in May 2020, the PCWDB adopted a two-pronged methodology that takes into consideration emerging employment opportunities and regional in-demand occupations based on two methodologies that include employment opportunities specific to the county.

122
1. EMERGING EMPLOYMENT OPPORTUNITIES Given the unprecedented economic growth in Pinal County, the PCWDB in part defines in-demand occupations as the need to fill employment opportunities as new companies locate throughout the region. These occupations are the result of county-wide business attraction efforts and typically align with the Pinal County Board of Supervisors’ targeted industries of Advanced Manufacturing, Tourism, Health Services, Natural and Renewable Resources, Transportation and Logistics, and Aerospace and Defense.
2. CURRENT EMPLOYMENT OPPORTUNITIES To identify current regional in-demand occupations, five factors were analyzed: Average Earnings, 5 Year Growth Projections, the Number of Job Opportunities for all standard occupation codes (SOC) within Pinal County and reasonable commute distances outside of the county. These factors were analyzed for Typical Entry Level Education ranging from No Formal Education Required to a Bachelor’s Degree. For each Education Level, filters were applied in order to identify occupations that have higher than average earnings, higher than average 5 year growth projections, and a reasonable number of available job opportunities within the defined geographies. This methodology yields the following results:
NAICS Code(s)
Industry Title
31
Manufacturing
51
Information
54
Professional Scientific and Technical Services
52
Finance and Insurance
62
Health Care and Social Assistance
23
Construction
56
Administrative and Support and Waste
Management Remediation Services
48
Transportation and Warehousing
NOTE: If creating custom industry, list all NAICS codes that make up industry.

123
SOC Code Occupation Title NAICS Code*
Industry Title
47-2051
Cement Masons and Concrete Finishers
23
Construction
47-2061
Construction Laborers
23
Construction
47-2181
Roofers
23
Construction
51-3011
Bakers
31
Manufacturing
53-7062
Laborers and Freight, Stock, and Material Movers
48, 56, 31, 23
Transportation and
warehousing, and others
51-2098
Assemblers and Fabricators, All Other, Including Team Assemblers
51
Manufacturing

124
Labor Market Analysis:
APPENDIX 2: LIVABLE WAGE ESTIMATES Title I of WIOA (Pub. L. 113–128) requires the U.S. Secretary of Labor (Secretary) to update and publish the Lower Living Standard Income Level (LLSIL) tables annually, for uses described in the law (including determining eligibility for youth). WIOA defines the term ‘‘low income individual’’ as one whose total family income does not exceed the higher level of the poverty line or 70 percent of the LLSIL. LLSIL is used for several purposes under the WIOA. Specifically, WIOA section 3(36) defines the term ‘‘low income individual’’ for eligibility purposes, and sections 127(b)(2)(C) and 132(b)(1)(B)(v)(IV) define the terms ‘‘disadvantaged youth’’ and ‘‘disadvantaged adult’’ in terms of the poverty line or LLSIL for State formula allotments. The governor and state/local workforce development boards (WDs) use the LLSIL for determining eligibility for youth and adults for certain services. In January, the U.S. Department of Health Services established poverty guidelines by family size for the contiguous 48 states. The January 2018 poverty guidelines were calculated by taking the 2016 Census Bureau’s poverty thresholds and adjusting them for price changes between 2016 and 2017 using the Consumer Price Index (CPI-U). These guidelines are listed below.
2020 POVERTY GUIDELINES FOR THE 48 CONTIGUOUS STATES
AND THE DISTRICT OF COLUMBIA
Persons in Family/Household
Poverty Guideline
1 $12,760
2 $17,240
3 $21,720
4 $26,200
5 $30,680
6 $35,160
7 $39,640
8 $44,120
For families/households with more than 8 persons, add $4,480 for each additional person.
U.S. Department of Labor, Federal Register / Vol. 85, No. 12 / Friday, January 17, 2020 / Notices

125
Based on those results, the U.S. Department of Labor Employment and Training Administration published the 2020 LLSIL by family size and region. The following table displays the LLSIL for the West region of the United States, both Metro and Non-Metro rates.
2020 Lower Living Standard Income Level (100%)
Western Region
Persons in Family/Household
Metro Non-Metro
1 $16,584 16,318
2 $27,178 26,742
3 $37,315 36,717
4 $46,064 45,319
5 $54,357 53,487
6 $63,577 62,555
West: AZ, CA, CO, ID, MT, NV, NM, OR, UT, WA, and WY
Although income is often compared to federal poverty levels in order to determine the LLSIL thresholds for defining “low-income,” these thresholds do not account for living costs beyond a very basic food budget. The federal poverty measure does not take into consideration costs such as childcare and health care that not only draw from an individual’s income, but are also determining factors in one’s ability to work and to endure the potential hardships associated with balancing employment and other aspects of everyday life. Further, poverty thresholds do not account for geographic variation in the cost of essential household expenses. In order to determine if the current levels identified for self-sufficiency in Pinal County are accurate, the PCWDB used the “Living Wage Calculator” developed by the Department of Urban Studies and Planning at the Massachusetts Institute of Technology to revisit the self-sufficiency levels for Pinal County. This calculator uses a market-based approach that draws upon geographically specific expenditure data related to a family’s likely minimum food, childcare, health insurance, housing, transportation, and other necessities (e.g. clothing, personal care items, etc.) costs. The living wage draws on these cost elements and the rough effects of income and payroll taxes to determine the minimum employment earnings necessary to meet a family’s basic needs while also maintaining self-sufficiency. The living wage model is a “step up” from poverty as measured by the poverty thresholds but it is a small “step up”, one that accounts for only the most basic needs of a family.

126
The living wage is the minimum income standard that, if met, draws a very fine line between the financial independence of the working poor and the need to seek out public assistance or suffer consistent and severe housing and food insecurity. In light of this fact, the living wage is perhaps better defined as a minimum subsistence wage. See Exhibit 6 for detailed breakdown of living wages for Pinal County.
Labor Market Analysis:
APPENDIX 3 – EMPLOYMENT OPPORTUNITY FORECASTS ARIZONA@WORK Pinal County desires to expand the employment opportunities of Pinal County residents. Part of that goal is to provide training and placement within the County, which can provide an enhanced quality of life by reducing commute times. While County residents have historically travelled outside the County for work, the latest population boom that occurred in the middle part of the last decade created an even more dramatic shift for Pinal residents working outside of the County. The first factor in this analysis is the number of available jobs within the County. In numeric terms, nearly 20,000 more jobs exist in the County and nearly 10,000 more Pinal residents have found employment within the County compared to 10 years ago. Continued job growth, especially in industries that provide self-sustaining wages and opportunities for advancement, will be a critical component in assisting more residents to find employment closer to home. The second factor in this analysis is the percentage of available jobs in the County that are filled by people living outside the County. Of the available jobs in the County, 45% employ someone living outside of Pinal County. This trend has remained fairly consistent over the past 10 years. The lowest percentage was recorded in 2004 at 42% of jobs held by non-residents and the highest percentage was recorded in 2007 at 46%. This factor may be influenced through active recognition of opportunities when they become available and matching or training Pinal job seekers to those opportunities. More than likely, this result is simply a function of an open job market and reasonable enough commute times for employees who currently travel into the County for work. The third factor in this analysis is the population and labor force available in Pinal County. The overall population of the County has grown much faster than new employment opportunities over the last 10 years. Thus, the need for longer commute times for job opportunities outside the County persist. The County has a very strong population growth outlook, making the need for substantial and sustained job growth even greater. Without it, the current trend of population outpacing jobs locally is likely to continue. Two employment forecasts, in addition to the most recent population forecast approved by the State of Arizona, were the focus of this analysis. The Arizona Commerce Authority’s Office of

127
Economic Opportunity (OEO) recently released a 10-year employment forecast for Pinal County. In addition, the Maricopa Association of Governments produced a long term (2015-2050) employment forecast for the County in 2016. Adjustments were necessary due to the different sources of data and differing baseline employment levels among these sources and in comparison to historical data. However, general conclusions can still be made despite these differences. With these various sources, forecast scenarios were modeled to gauge their effect on job opportunities for Pinal County residents. The Office of Economic Opportunity (OEO) and the Maricopa Association of Governments (MAG) have significantly different employment growth forecasts for the County. OEO’s forecast is considerably more conservative than the MAG forecast. OEO provides a base year and terminal year forecast, effectively forecasting 1.4% annual employment growth in the County over the next 10 years. This equates to between 800 and 950 new jobs each year. At current rates of job fulfillment, an estimated 4,850 Pinal residents may find new employment in the County. However, at this rate of job growth, the percentage of Pinal residents in the workforce working within the County will continue to diminish due to strong population growth that is expected over this same time period. MAG provides its employment forecast initially over a 5-year increment and then in 10-year increments. The result is a 3.2% average annual growth rate through 2020 and a 4.0% growth rate through 2030. This equates to between 1,800 and 3,400 new jobs in the County each year over the next 10 years. Under this scenario, nearly 15,000 jobs would be expected to be filled by Pinal residents and the percentage of residents working in the County would experience a gradual increase over this time period. The significant growth projected by MAG has not yet materialized in the short term (2015 to present). Thus, some adjustments are warranted. However, the growth prospects for the County, taking into consideration the pipeline of interested companies and developers, do not appear out of line or unachievable in the long term. And, as the table on the following page illustrates, the more aggressive rate of job growth is necessary to be able to provide much needed opportunities to an ever-growing workforce closer to their place of residence.

128
Year PopLabor Force Employment
Percent Growth
Numeric Growth
Residents Employed
% Residents Employed in County
OEO Scenario2015 406,468 134,869 58,885 32,492 24%2016 413,312 140,791 59,699 1.4% 814 32,941 23%2017 427,603 145,660 60,525 1.4% 825 33,397 23%2018 439,932 149,859 61,362 1.4% 837 33,859 23%2019 451,698 153,867 62,210 1.4% 848 34,327 22%2020 463,463 157,875 63,070 1.4% 860 34,801 22%2021 475,540 161,989 63,942 1.4% 872 35,283 22%2022 487,985 166,228 64,827 1.4% 884 35,770 22%2023 500,827 170,603 65,723 1.4% 896 36,265 21%2024 514,109 175,127 66,632 1.4% 909 36,767 21%2025 527,859 179,811 67,553 1.4% 921 37,275 21%2026 542,115 184,667 68,487 1.4% 934 37,790 20%MAG Scenario2015 406,468 134,869 58,885 32,492 24%2016 413,312 140,791 60,744 3.2% 1,859 33,518 24%2017 427,603 145,660 62,662 3.2% 1,918 34,576 24%2018 439,932 149,859 64,640 3.2% 1,978 35,667 24%2019 451,698 153,867 66,680 3.2% 2,041 36,793 24%2020 463,463 157,875 68,785 3.2% 2,105 37,955 24%2021 475,540 161,989 71,569 4.0% 2,783 39,491 24%2022 487,985 166,228 74,465 4.0% 2,896 41,089 25%2023 500,827 170,603 77,478 4.0% 3,013 42,751 25%2024 514,109 175,127 80,613 4.0% 3,135 44,481 25%2025 527,859 179,811 83,875 4.0% 3,262 46,281 26%2026 542,115 184,667 87,268 4.0% 3,394 48,154 26%
Source: AZ OEO; Maricopa Association of Governments; U.S. Census; Ell iott D. Pollack & Company
Pinal County Employment Forecast Scenarios

129
Labor Market Analysis:
APPENDIX 4 – TARGETED INDUSTRY SUB-INDUSTRY SELECTIONS Transportation & Logistics
Code Description481111 Scheduled Passenger Air Transportation481112 Scheduled Freight Air Transportation481211 Nonscheduled Chartered Passenger Air Transportation481212 Nonscheduled Chartered Freight Air Transportation481219 Other Nonscheduled Air Transportation482110 Rail transportation483111 Deep Sea Freight Transportation483112 Deep Sea Passenger Transportation483113 Coastal and Great Lakes Freight Transportation483114 Coastal and Great Lakes Passenger Transportation483211 Inland Water Freight Transportation483212 Inland Water Passenger Transportation484110 General Freight Trucking, Local484121 General Freight Trucking, Long-Distance, Truckload484122 General Freight Trucking, Long-Distance, Less Than Truckload484210 Used Household and Office Goods Moving484220 Specialized Freight (except Used Goods) Trucking, Local484230 Specialized Freight (except Used Goods) Trucking, Long-Distance485111 Mixed Mode Transit Systems485112 Commuter Rail Systems485113 Bus and Other Motor Vehicle Transit Systems485119 Other Urban Transit Systems485210 Interurban and Rural Bus Transportation485310 Taxi Service485320 Limousine Service485410 School and Employee Bus Transportation485510 Charter Bus Industry485991 Special Needs Transportation485999 All Other Transit and Ground Passenger Transportation486110 Pipeline Transportation of Crude Oil486210 Pipeline Transportation of Natural Gas486910 Pipeline Transportation of Refined Petroleum Products486990 All Other Pipeline Transportation487110 Scenic and Sightseeing Transportation, Land487210 Scenic and Sightseeing Transportation, Water487990 Scenic and Sightseeing Transportation, Other488111 Air Traffic Control488119 Other Airport Operations488190 Other Support Activities for Air Transportation488210 Support Activities for Rail Transportation488310 Port and Harbor Operations488320 Marine Cargo Handling488330 Navigational Services to Shipping488390 Other Support Activities for Water Transportation488410 Motor Vehicle Towing488490 Other Support Activities for Road Transportation488510 Freight Transportation Arrangement488991 Packing and Crating488999 All Other Support Activities for Transportation491110 Postal Service492110 Couriers and Express Delivery Services492210 Local Messengers and Local Delivery493110 General Warehousing and Storage493120 Refrigerated Warehousing and Storage493130 Farm Product Warehousing and Storage493190 Other Warehousing and Storage541614 Process, Physical Distribution, and Logistics Consulting Services

130
Advanced Transportation & Logistics
Code Description481111 Scheduled Passenger Air Transportation481112 Scheduled Freight Air Transportation481211 Nonscheduled Chartered Passenger Air Transportation481212 Nonscheduled Chartered Freight Air Transportation481219 Other Nonscheduled Air Transportation484220 Specialized Freight (except Used Goods) Trucking, Local484230 Specialized Freight (except Used Goods) Trucking, Long-Distance485111 Mixed Mode Transit Systems486110 Pipeline Transportation of Crude Oil486210 Pipeline Transportation of Natural Gas486910 Pipeline Transportation of Refined Petroleum Products486990 All Other Pipeline Transportation488111 Air Traffic Control488119 Other Airport Operations488190 Other Support Activities for Air Transportation488330 Navigational Services to Shipping541614 Process, Physical Distribution, and Logistics Consulting Services

131
Advanced Manufacturing
Code Description3241 Petroleum and Coal Products Manufacturing3251 Basic Chemical Manufacturing3252 Resin, Synthetic Rubber, and Artificial and Synthetic Fibers and Filaments Manufacturing3253 Pesticide, Fertilizer, and Other Agricultural Chemical Manufacturing3254 Pharmaceutical and Medicine Manufacturing3259 Other Chemical Product and Preparation Manufacturing3271 Clay Product and Refractory Manufacturing3279 Other Nonmetallic Mineral Product Manufacturing3311 Iron and Steel Mills and Ferroalloy Manufacturing3313 Alumina and Aluminum Production and Processing3315 Foundries3331 Agriculture, Construction, and Mining Machinery Manufacturing3332 Industrial Machinery Manufacturing3333 Commercial and Service Industry Machinery Manufacturing3336 Engine, Turbine, and Power Transmission Equipment Manufacturing3339 Other General Purpose Machinery Manufacturing3341 Computer and Peripheral Equipment Manufacturing3342 Communications Equipment Manufacturing3343 Audio and Video Equipment Manufacturing3344 Semiconductor and Other Electronic Component Manufacturing3345 Navigational, Measuring, Electromedical, and Control Instruments Manufacturing3346 Manufacturing and Reproducing Magnetic and Optical Media3351 Electric Lighting Equipment Manufacturing3352 Household Appliance Manufacturing3353 Electrical Equipment Manufacturing3359 Other Electrical Equipment and Component Manufacturing3361 Motor Vehicle Manufacturing3362 Motor Vehicle Body and Trailer Manufacturing3363 Motor Vehicle Parts Manufacturing3364 Aerospace Product and Parts Manufacturing3365 Railroad Rolling Stock Manufacturing3366 Ship and Boat Building3369 Other Transportation Equipment Manufacturing3391 Medical Equipment and Supplies Manufacturing3399 Other Miscellaneous Manufacturing

132
Health Services
Code Description541380 Testing Laboratories541713 Research and Development in Nanotechnology541714 Research and Development in Biotechnology (except Nanobiotechnology)541715 Research and Development in the Physical, Engineering, and Life Sciences (except Nanotechnology and Biotechnology)541940 Veterinary Services621111 Offices of Physicians (except Mental Health Specialists)621112 Offices of Physicians, Mental Health Specialists621210 Offices of Dentists621310 Offices of Chiropractors621320 Offices of Optometrists621330 Offices of Mental Health Practitioners (except Physicians)621340 Offices of Physical, Occupational and Speech Therapists, and Audiologists621391 Offices of Podiatrists621399 Offices of All Other Miscellaneous Health Practitioners621410 Family Planning Centers621420 Outpatient Mental Health and Substance Abuse Centers621491 HMO Medical Centers621492 Kidney Dialysis Centers621493 Freestanding Ambulatory Surgical and Emergency Centers621498 All Other Outpatient Care Centers621511 Medical Laboratories621512 Diagnostic Imaging Centers621610 Home Health Care Services621910 Ambulance Services621991 Blood and Organ Banks621999 All Other Miscellaneous Ambulatory Health Care Services622110 General Medical and Surgical Hospitals622210 Psychiatric and Substance Abuse Hospitals622310 Specialty (except Psychiatric and Substance Abuse) Hospitals623110 Nursing Care Facilities (Skilled Nursing Facilities)623210 Residential Intellectual and Developmental Disability Facilities623220 Residential Mental Health and Substance Abuse Facilities623311 Continuing Care Retirement Communities623312 Assisted Living Facilities for the Elderly623990 Other Residential Care Facilities624110 Child and Youth Services624120 Services for the Elderly and Persons with Disabilities624190 Other Individual and Family Services624210 Community Food Services624221 Temporary Shelters624229 Other Community Housing Services624230 Emergency and Other Relief Services624310 Vocational Rehabilitation Services624410 Child Day Care Services812191 Diet and Weight Reducing Centers902622 Hospitals (State Government)903622 Hospitals (Local Government)

133
Advanced Health Services
Code Description325411 Medicinal and Botanical Manufacturing325412 Pharmaceutical Preparation Manufacturing325413 In-Vitro Diagnostic Substance Manufacturing325414 Biological Product (except Diagnostic) Manufacturing333314 Optical Instrument and Lens Manufacturing334510 Electromedical and Electrotherapeutic Apparatus Manufacturing339112 Surgical and Medical Instrument Manufacturing339113 Surgical Appliance and Supplies Manufacturing339114 Dental Equipment and Supplies Manufacturing339115 Ophthalmic Goods Manufacturing339116 Dental Laboratories541380 Testing Laboratories541713 Research and Development in Nanotechnology541714 Research and Development in Biotechnology (except Nanobiotechnology)541715 Research and Development in the Physical, Engineering, and Life Sciences (except Nanotechnology and Biotechnology)541720 Research and Development in the Social Sciences and Humanities541940 Veterinary Services621492 Kidney Dialysis Centers621493 Freestanding Ambulatory Surgical and Emergency Centers621511 Medical Laboratories621512 Diagnostic Imaging Centers622110 General Medical and Surgical Hospitals622210 Psychiatric and Substance Abuse Hospitals622310 Specialty (except Psychiatric and Substance Abuse) Hospitals902622 Hospitals (State Government)903622 Hospitals (Local Government)

134
Aerospace & Defense
Advanced Aerospace & Defense
Code Description325920 Explosives Manufacturing332992 Small Arms Ammunition Manufacturing332993 Ammunition (except Small Arms) Manufacturing332994 Small Arms, Ordnance, and Ordnance Accessories Manufacturing334511 Search, Detection, Navigation, Guidance, Aeronautical, and Nautical System and Instrument Manufacturing336411 Aircraft Manufacturing336412 Aircraft Engine and Engine Parts Manufacturing336413 Other Aircraft Parts and Auxiliary Equipment Manufacturing336414 Guided Missile and Space Vehicle Manufacturing336415 Guided Missile and Space Vehicle Propulsion Unit and Propulsion Unit Parts Manufacturing336419 Other Guided Missile and Space Vehicle Parts and Auxiliary Equipment Manufacturing336992 Military Armored Vehicle, Tank, and Tank Component Manufacturing481111 Scheduled Passenger Air Transportation481112 Scheduled Freight Air Transportation481211 Nonscheduled Chartered Passenger Air Transportation481212 Nonscheduled Chartered Freight Air Transportation481219 Other Nonscheduled Air Transportation488111 Air Traffic Control488119 Other Airport Operations488190 Other Support Activities for Air Transportation901200 Federal Government, Military
Code Description325920 Explosives Manufacturing332993 Ammunition (except Small Arms) Manufacturing332994 Small Arms, Ordnance, and Ordnance Accessories Manufacturing334511 Search, Detection, Navigation, Guidance, Aeronautical, and Nautical System and Instrument Manufacturing336411 Aircraft Manufacturing336412 Aircraft Engine and Engine Parts Manufacturing336413 Other Aircraft Parts and Auxiliary Equipment Manufacturing336414 Guided Missile and Space Vehicle Manufacturing336415 Guided Missile and Space Vehicle Propulsion Unit and Propulsion Unit Parts Manufacturing336419 Other Guided Missile and Space Vehicle Parts and Auxiliary Equipment Manufacturing336992 Military Armored Vehicle, Tank, and Tank Component Manufacturing488111 Air Traffic Control

135
Natural & Renewable Resources Code Description111000 Crop Production112000 Animal Production115111 Cotton Ginning115112 Soil Preparation, Planting, and Cultivating115113 Crop Harvesting, Primarily by Machine115114 Postharvest Crop Activities (except Cotton Ginning)115115 Farm Labor Contractors and Crew Leaders115116 Farm Management Services115210 Support Activities for Animal Production211120 Crude Petroleum Extraction211130 Natural Gas Extraction212111 Bituminous Coal and Lignite Surface Mining212112 Bituminous Coal Underground Mining212113 Anthracite Mining212210 Iron Ore Mining212221 Gold Ore Mining212222 Silver Ore Mining212230 Copper, Nickel, Lead, and Zinc Mining212291 Uranium-Radium-Vanadium Ore Mining212299 All Other Metal Ore Mining212311 Dimension Stone Mining and Quarrying212312 Crushed and Broken Limestone Mining and Quarrying212313 Crushed and Broken Granite Mining and Quarrying212319 Other Crushed and Broken Stone Mining and Quarrying212321 Construction Sand and Gravel Mining212322 Industrial Sand Mining212324 Kaolin and Ball Clay Mining212325 Clay and Ceramic and Refractory Minerals Mining212391 Potash, Soda, and Borate Mineral Mining212392 Phosphate Rock Mining212393 Other Chemical and Fertilizer Mineral Mining212399 All Other Nonmetallic Mineral Mining213111 Drilling Oil and Gas Wells213112 Support Activities for Oil and Gas Operations213113 Support Activities for Coal Mining213114 Support Activities for Metal Mining213115 Support Activities for Nonmetallic Minerals (except Fuels) Mining221114 Solar Electric Power Generation221115 Wind Electric Power Generation221116 Geothermal Electric Power Generation221117 Biomass Electric Power Generation221210 Natural Gas Distribution322110 Pulp Mills322121 Paper (except Newsprint) Mills324110 Petroleum Refineries333611 Turbine and Turbine Generator Set Units Manufacturing335311 Power, Distribution, and Specialty Transformer Manufacturing335911 Storage Battery Manufacturing335912 Primary Battery Manufacturing541620 Environmental Consulting Services

136
Advanced Natural & Renewable Resources
Code Description115116 Farm Management Services211120 Crude Petroleum Extraction211130 Natural Gas Extraction212210 Iron Ore Mining212221 Gold Ore Mining212222 Silver Ore Mining212230 Copper, Nickel, Lead, and Zinc Mining212291 Uranium-Radium-Vanadium Ore Mining212299 All Other Metal Ore Mining212325 Clay and Ceramic and Refractory Minerals Mining212391 Potash, Soda, and Borate Mineral Mining212392 Phosphate Rock Mining212393 Other Chemical and Fertilizer Mineral Mining212399 All Other Nonmetallic Mineral Mining213111 Drilling Oil and Gas Wells213112 Support Activities for Oil and Gas Operations213113 Support Activities for Coal Mining213114 Support Activities for Metal Mining213115 Support Activities for Nonmetallic Minerals (except Fuels) Mining221114 Solar Electric Power Generation221115 Wind Electric Power Generation221116 Geothermal Electric Power Generation221117 Biomass Electric Power Generation221210 Natural Gas Distribution322110 Pulp Mills322121 Paper (except Newsprint) Mills324110 Petroleum Refineries333611 Turbine and Turbine Generator Set Units Manufacturing335311 Power, Distribution, and Specialty Transformer Manufacturing335911 Storage Battery Manufacturing335912 Primary Battery Manufacturing541620 Environmental Consulting Services

137
Tourism
Code Description485510 Charter Bus Industry487110 Scenic and Sightseeing Transportation, Land487210 Scenic and Sightseeing Transportation, Water487990 Scenic and Sightseeing Transportation, Other532111 Passenger Car Rental561510 Travel Agencies561520 Tour Operators561591 Convention and Visitors Bureaus561599 All Other Travel Arrangement and Reservation Services561920 Convention and Trade Show Organizers711211 Sports Teams and Clubs711212 Racetracks711219 Other Spectator Sports711310 Promoters of Performing Arts, Sports, and Similar Events with Facilities711320 Promoters of Performing Arts, Sports, and Similar Events without Facilities711410 Agents and Managers for Artists, Athletes, Entertainers, and Other Public Figures711510 Independent Artists, Writers, and Performers712110 Museums712120 Historical Sites712130 Zoos and Botanical Gardens712190 Nature Parks and Other Similar Institutions713110 Amusement and Theme Parks713210 Casinos (except Casino Hotels)713290 Other Gambling Industries713910 Golf Courses and Country Clubs713920 Skiing Facilities713930 Marinas713990 All Other Amusement and Recreation Industries721110 Hotels (except Casino Hotels) and Motels721120 Casino Hotels721191 Bed-and-Breakfast Inns721199 All Other Traveler Accommodation721211 RV (Recreational Vehicle) Parks and Campgrounds721214 Recreational and Vacation Camps (except Campgrounds)

138
ARIZONA@WORK PINAL COUNTY PARTNER PROGRAMS ADULT AND DISLOCATED WORKER PROGRAMS ARIZONA@WORK Pinal County’s workforce system is predicated on assisting individuals with barriers to employment as defined by the WIOA Section 3(24). Priority is given to those who qualify for core partner program services and have multiple barriers such as low-income below the 70% Lower Living Standard of Income (LLSIL) or below the designated threshold of self-sufficiency wages for employed adult and dislocated workers. Other barriers include disabilities, long-term unemployment, low-income adults and youth with basic skills deficiencies language barriers, and lack of work experience. A person is considered underemployed if they are employed either full or part-time, with a current annualized wage not exceeding 80% of their wages at the dislocation from their most recent employment, or if their earned wages are at or below the self-sufficiency threshold as identified in most current LLSIL tables published by the Arizona Department of Economic Security A primary target audience for ARIZONA@WORK Pinal County services are individuals receiving public assistance. The table below from the Arizona Department of Administration’s Office of Employment and Population Statistics shows the rate of Pinal County residents receiving public assistance is consistent with the overall state levels.
Pinal County Public Assistance Households (2018) Pinal
County Arizona United
States
TANF (Temporary Assistance for Needy Families)
1.0% 2.0% 2.0%
SSI (Supplemental Security Income) 4.0% 5.0% 5.0%
SNAP (Supplemental Nutrition Assistance Program)
11.0% 11.0% 12.0%
Medicaid/AHCCCS Individuals 16.0% 17.0% 15.0% Source: U.S. Census Bureau, American Community Survey, 2018 1-Year Estimates Arizona Office of Economic Opportunity NOTE: TANF, SSI and SNAP proportions are based on households, Medicaid/AHCCCS proportions are based on individuals.
With the exception of the SNAP program, Pinal County used public assistance programs at a lower rate when compared with the state. Medicaid/AHCCCS was the only public assistance program where Pinal County had a usage rate higher than the United States. With 12 percent of Pinal County households receiving either Temporary Assistance for Needy Families (TANF) or Supplemental Nutrition Assistance Program (SNAP) benefits,

139
ARIZONA@WORK Pinal County will work closely with the vendor providing the TANF Jobs Program services in Pinal County. The Jobs Program is the employment program for TANF recipients who are required to participate in a work program. Referrals from the Jobs program provider to ARIZONA@WORK Pinal County will be formalized so that TANF/Jobs Program clients are enrolled in the Adult Program. Arizona Health Care Cost Containment System (AHCCCS) is Arizona's Medicaid agency that offers health care programs to serve Arizona residents. The data shows that as of May 2020, 81,235 of Pinal County residents were enrolled in an AHCCCS program. This represents a seven percent increase in the year-over-year enrollments equating to an increase of 5,277 residents. The ARIZONA@WORK network will work with AHCCCS on laying the groundwork for the implementation of AHCCCS Works. This initiative is based on a federal waiver allowing for work requirements for able bodied adults ages 19-49 who are receiving AHCCCS. Prior to Covid-19, on April 1, 2020 approximately 2,000 AHCCCS recipients living in Pinal County meeting the AHCCCS Works criteria were set to be required to comply with the work requirements. The start of this action was delayed due to Covid-19. Similar efforts will be put forth to formalize a referral process with the Supplemental Nutrition Assistance Program. Although Pinal County SNAP residents are waived from the employment requirement of the program, ARIZONA@WORK Pinal County will work closely with the program to provide access to services that could benefit all SNAP recipients who are interested in pursuing employment. Although income is often compared to the federal poverty levels in order to determine the LLSIL thresholds for defining “low-income,” these thresholds do not account for living costs beyond a very basic food budget. The federal poverty measure does not take into consideration costs such as childcare and health care that not only draw from an individual’s income, but are also determining factors in one’s ability to work and to endure the potential hardships associated with balancing employment and other aspects of everyday life. Further, poverty thresholds do not account for geographic variation in the cost of essential household expenses. 11 In order to determine if the current levels identified for self-sufficiency in Pinal County are accurate, the PCWDB used the “Living Wage Calculator” 12 developed by the Department of Urban Studies and Planning at the Massachusetts Institute of Technology to revisit the self-sufficiency levels for Pinal County. This calculator uses a market-based approach that draws upon geographically specific expenditure data related to a family’s likely minimum food, childcare, health insurance, housing, transportation, and other necessities (e.g. clothing, personal care items, etc.) costs. The living wage draws on these cost elements and the rough effects of
11 “Living Wage Calculator” (http://livingwage.mit.edu/counties/04021) and “LIVING WAGE CALCULATOR User’s Guide / Technical Notes (2018 Update)”, Prepared for Amy K. Glasmeier, Ph.D. By Carey Anne Nadeau, Consultant, Open Data Nation / Department of Urban Studies and Planning Massachusetts Institute of Technology 12 Ibid.

140
income and payroll taxes to determine the minimum employment earnings necessary to meet a family’s basic needs while also maintaining self-sufficiency. The living wage model is a “step up” from poverty as measured by the poverty thresholds but it is a small “step up”, one that accounts for only the most basic needs of a family. The living wage is the minimum income standard that, if met, draws a very fine line between the financial independence of the working poor and the need to seek out public assistance or suffer consistent and severe housing and food insecurity. In light of this fact, the living wage is perhaps better defined as a minimum subsistence wage. By using the living wage calculated in the economic analysis earlier in this plan the threshold for self-sufficiency in Pinal County for employed adults and dislocated workers has been set at 159% of the LLSIL. An annual re-evaluation will be scheduled to ensure that the proper self-sufficiency wages are being used to determine eligibility for each Program Year. ARIZONA@WORK Pinal County provides contracted Adult and Dislocated Worker Program services to eligible adults and dislocated workers through ResCare Workforce Services. Priority for enrollment will be given to those unemployed adults who meet the 70 percent LLSIL threshold as well as qualified dislocated workers regardless of income level. Individuals will access a full range of services through the designated comprehensive job center, service access points, and partners. Comprehensive center staff will ensure that each customer who comes into the center for employment and training services receives customized services to meet their particular needs. Initial services start out as self-service and progress into tailored staff assisted services through a coordinated approach among partner programs, i.e., the CareerSTEP pathway. In order to receive program services, qualified adults and dislocated workers will be registered in the Arizona Job Connection (AJC) system – the web based case management and reporting system that also includes the State’s job bank and Eligible Training Provider List (ETPL). To help job seekers through this process, computers are available in the comprehensive center resource room as well as at each of the access points in the county. Individuals have access to these computers for AJC registration, job search, and employment applications. Once registered, job seekers are provided with information and methods to directly access or learn more about available services. A customer centric service delivery model will be instituted in the job center to ensure a free-flowing customer experience. Customers will be assigned appropriate staff based on their initial assessment, and referred to the primary program for career services based on their needs and goals. It is the goal of the ARIZONA@WORK Pinal County system to provide access and services that meet the customers’ needs. Innovation will be the driver for a service delivery model with the goal of providing various modes of communication and the ability to enroll in programs without necessarily needing to physically travel to a brick and mortar location to do so.

141
ARIZONA@WORK Pinal County partner staff will be trained on the eligibility criteria of dislocated workers. Staff who engage in assessing the results from the SMART Tool Assessment described in the Job Seeker Flow will be specifically prepared to identify individuals who may qualify. Staff will also be trained to identify individuals who meet the definition of a dislocated worker - beyond the traditional mass layoff criteria– most likely as a result of a Worker Adjustment and Retraining Notification Act (WARN). Dislocated Workers include self-employed individuals who are unemployed as a result of general economic conditions in the community in which the individual resides or because of natural disasters, and displaced homemakers - individuals who have been providing unpaid services to family members in the home. Once a customer has been identified as a Dislocated Worker, ARIZONA@WORK Pinal County staff will provide individualized career services as needed, through collaboration efforts among partners. Training services will be made available to dislocated workers whose assessment results and training justification indicate that training services are expected to lead to full time employment and self-sufficiency targeting in-demand industries and associated occupations within those industries. The Dislocated Worker Program offers employment and training programs for eligible workers who are unemployed through no fault of their own or have received an official layoff notice. The program also provides specialized Rapid Response services in collaboration with other partners. RAPID RESPONSE Rapid Response services provide short-term early intervention and immediate assistance with layoffs and plant closures. Rapid Response is designed to assist impacted workers to transition to their next employment as soon as possible. NOTE: As of May 2020, the state has elected to reserve the statutory maximum of 25% of the Dislocated Worker funds for statewide Rapid Response activities. It is unknown what impact this will have on the delivery model of Rapid Response activities in each local workforce area as the state develops its strategies.
TRADE ADJUSTMENT ASSISTANCE (TAA) The TAA program provides additional benefits for dislocated workers of companies that are directly affected by increased imports or certain shifts in production to other countries. TAA petitions trigger provision of Rapid Response services and specialized training services, the coordinated planning of which will lead to more rapid reemployment. Trade-affected workers receive notification that their Trade petition has been approved; the notification instructs them to contact their local TAA Coordinator for services. Making contact with the TAA Coordinator and providing a copy of the petition approval letter meets the Category 1 eligibility criteria for Dislocated Workers. Co-enrollment will occur for those eligible

142
for TAA services between the Dislocated Worker Program and TAA. The ARIZONA@WORK Pinal County Business and Career Center does not have TAA staff on site but can coordinate a referral for services. A referral can be facilitated between the Career Planner and the ADES State TAA Coordinator. YOUTH PROGRAM Central Arizona College (CAC) is the contracted provider for the ARIZONA@WORK Pinal County Youth Program. CAC was awarded their contract in response to a Request for Proposal (RFP) issued by Pinal County in March 2016. The RFP evaluation was based on the following factors: Program Design Experience Community Collaborations and Partnerships Cost and Budget Fiscal Ability Meeting the needs of the community
The Pinal County Board of Supervisors approved the proposal in June 2016. A new RFP will be issued for serviced during Program Year 2020. CAC offers all required 14 elements of the Youth Program, with a focus on serving out-of-school youth. Youth Program policy outlines criteria to define who “requires additional assistance to complete an educational program or to secure and hold employment” in the ARIZONA@WORK Pinal County Youth Policy (see Exhibit 7). A more in-depth description of Youth Program activities is provided in Goal 3. WAGNER PEYSER/EMPLOYMENT SERVICE The Arizona Department of Economic Security’s Employment Service program staff focus on providing basic career services including job search and placement assistance, provision of information on in-demand industry sectors and occupations, and information on non-traditional employment. Employment Service staff also provide support for such functions as job order entry and career services to Unemployment Insurance recipients. Employment Service partners with the Gila River Indian Community (GRIC), a member of the ARIZONA@WORK Nineteen Tribal Nation consortium to serve Pinal County residents who reside in that community. Employment Service has a team member housed at the GRIC Employment and Training building to provide services. ARIZONA@WORK Pinal County no longer has an individual serving as Migrant and Seasonal Farmworker (MSFW) staff. These services for both employers and job seekers will be provided by a MSFW Outreach Team from Yuma. Working closely with Employment Service staff, a full

143
array of services will be offered to migrant and seasonal farmworkers as well as to employers with agricultural employment opportunities. MSFW staff collaborates with fellow ARIZONA@WORK Pinal County partners, such as PPEP – the WIOA Title I Section 167 National Farmworker Jobs Program grantee ensuring that migrant and seasonal farmworkers are aware of the services available through the ARIZONA@WORK system. UNEMPLOYMENT INSURANCE (UI) PROGRAMS On August 13, 2015, The U.S. Department of Labor/Employment and Training Administration issued Unemployment Insurance Program Letter (UIPL) 20-15, “Unemployment Insurance and the Workforce Innovation and Opportunity Act of 2014.” The UIPL outlined the relationship between the services offered via the WIOA and the UI programs. Specifically, the UIPL reiterates that UI is a mandated one-stop partner program, although it is no longer required to have a seat on the local workforce development boards. The relationship between the UI programs and the other workforce system partners cannot be overstated, especially in extraordinary times such as Covid-19 presents. The goal of all ARIZONA@WORK Pinal County programs is to assist individuals with barriers to employment through a systematic plan of action while leveraging the resources each program provides. The UI Program, by issuing benefits to qualified individuals, provides a resource that assists these same individuals in re-entering the workforce as quickly as possible, using, for example, TAA program resources. In general, ARIZONA@WORK Pinal County will ensure that UI program activities are ingrained into the overall workforce delivery system by implementing the following strategies (this list is not exhaustive): Providing ring-down phones that dial directly to the State UI call centers; Helping UI claimants access the full range of one-stop services both on-line and in-
person through the ARIZONA@WORK Pinal County system; Ensuring UI claimants meet eligibility requirements (such as searching and registering
for work as required by state law); Providing effective services to veterans who file for benefits under the Unemployment
Compensation for Ex-Service members (UCX) program; Connecting UI claimants to Re-Employment Service through the RESEA program.
The Re-Employment Service Eligibility Assessment (RESEA) focuses on those claimants who have been determined to most likely exhaust their UI benefits prior to employment being secured to replace former wages. RESEA service delivery will be integrated into the ARIZONA@WORK Pinal County customer flow. There are two primary goals associated with RESEA: 1) Identify any barriers to employment; and 2) Ensure UI benefits are properly paid to eligible UI claimants by conducting a thorough UI eligibility review.

144
ARIZONA@WORK Pinal County workforce specialists will meet one-on-one with claimants who meet the RESEA profile. Covid-19 required a modification to the requirement that these service interactions occur in person and allowed for telephone services to satisfy this requirement. ARIZONA@WORK Pinal County will pursue continuation of this option along with technology advancements to provide RESEA services. In addition to the use of technology to change this business model, ARIZONA@WORK Pinal County will challenge the norm and seek to engage the Dislocated Worker Program as a RESEA service provider. Regardless of the mode used to connect with UI claimants, as a condition of ongoing receipt of benefits, RESEA meetings are mandatory and failure to comply could result in a loss of UI benefits. During this meeting, the workforce specialist will conduct an Unemployment Eligibility Review as well as conduct a review of the claimants work search activity. During this interview, an Individual Employment Plan (IEP) will be developed and entered into Arizona Job Connection. Labor Market Information specific to the job/career path in which the customer is seeking employment, as well as job search and job placement assistance through Arizona’s labor exchange website will be provided. The workforce specialists will also review the claimant’s resume and make suggestions for improvement and, if necessary, may refer the claimant to a resume writing workshop or a career guidance counselor. Based on the overall assessment of the claimant, the workforce specialist may also refer the claimant to other partner programs that may be beneficial to the overall strategy of returning the individual to employment. ADULT EDUCATION There are two Title II providers of adult education in Pinal County. Programs are available through Central Arizona College (CAC) and Queen Creek Adult Education Program (QCAEP). These programs are currently offering adult education and literacy activities, including workforce preparation activities throughout the county. Both Central Arizona College and Queen Creek Adult Education Program offer the Arizona Career Readiness Credential. QCAEP provides all levels of English instruction and High School Equivalency classes free of charge. Classes are available day and evening. In addition to class time, students have access to a state of the art computer lab, and blended learning is available. QCAEP offers free, high quality pre-school services for the children whose parents are enrolled in the adult education classes. Furthermore, The Adult Education Program is located in the District's Family Resource Center which provides referrals to families in crisis or in need. This arrangement is value added for adult learners who may need to tap in to support services in the community. As a core partner of the ARIZONA@WORK Pinal County system, CAC’s Adult Education Program provides adult education and literacy instruction/activities for ARIZONA@WORK Pinal County clients, as well as community members at large. Strategies implemented to ensure performance targets are met include: offering classes throughout the county at convenient times, providing high quality professional learning opportunities for all instructors, offering tutoring and disability resources for all students, working with CAC’s developmental education staff to

145
ease the transition to post-secondary education, and implementing College and Career Ready components in each adult education class. Furthermore, CAC’s Adult Education program employs a full-time College and Career Navigator who assists students individually as they transition out of the program and into post-secondary and/or career opportunities. The CAC Adult Education program works cooperatively with the greater Central Arizona College community to ensure classrooms outfitted with up-to-date technology, as well as routine building and IT maintenance, and assistance as needed from CAC’s Student Accessibility Coordinator. Because of this partnership, CAC Adult Education is able to offer classes at every CAC campus as well as the Casa Grande Center and the Gila River Indian Community in Sacaton. The current director of CAC’s Adult Basic Education (ABE) program has been a sitting member of the PCWDB since July 2015. QCAEP and CAC’s Adult Education programs utilize the state approved Arizona Adult Education Data Management System (AAEDMS) to keep track of all student data, including demographics, class registration, attendance, assessment scores, and individual goals. Program staff collect data on a monthly basis. Additionally, all programs follow the Arizona Department of Education guidelines regarding regular, quarterly student follow up. Regardless of provider, a key component of the Adult Basic Education program is the Integrated Education and Training (IET). Integrated Education and Training is a service approach that provides adult education and literacy activities concurrently and contextually with workforce preparation and workforce training for a specific occupation or occupational cluster for the purpose of educational advancement (34 CFR §463.35). IET is a powerful model to provide foundational skill development and occupational skill acquisition to promote career advancement when provided as part of a career pathway and with the coordination of critical workforce development and support services activities from WIOA Title IB programs. Local workforce plans and MOUs include strategies that promote and support the investment of WIOA Title IB funds to provide the support services activities in coordination with Title II for IET participants, including career counseling, navigation, placement and retention services, and training opportunities. In addition, co-enrollment policies between all core programs actively promote co-enrollment and specific targets should be set for co-enrollment of high-need populations. VOCATIONAL REHABILITATION Increasing awareness of disability related issues, including etiquette and culture, through Vocational Rehabilitation (VR) provided training and resources will improve the professionalism and effectiveness of the ARIZONA@WORK Pinal County partner staff while attending to individuals with disabilities who are accessing center services.

146
In addition to training in a variety of disability related topics, the VR program will offer technical assistance to the system partners surrounding Social Security Work Benefits, Americans with Disabilities Act, and Rehabilitation Act Section 503 compliance. VR is committed to ensuring programmatic and physical access to afford equal, effective and meaningful access to services for individuals with disabilities served by the ARIZONA@WORK Pinal County workforce system. VR staff will work cooperatively with program partner staff to determine the assistive technology needs of the comprehensive center in order to allow individuals with disabilities to access services in the comprehensive center and other service delivery points allowing for seamless participation alongside other job seekers. Job center staff will be trained by VR on the use of the assistive technology. In order to facilitate access to system services, VR staff will work cooperatively with job center staff in order to facilitate reciprocal referrals and joint service planning. Client data, such as demographic information and evaluation and testing results, can be shared between partners with client approval to assist in reciprocal referrals and joint service planning. PROGRAMS OF STUDY AUTHORIZED UNDER THE CARL D. PERKINS CAREER
AND TECHNICAL EDUCATION ACT OF 2006 Central Arizona College (CAC) has many career and technical education (CTE) programs that qualify for support from Carl D. Perkins grant funding. To be eligible to receive Perkins money each program must be affiliated with an outside third party that sets standards and assessment measures that support the credentials that the students work for to earn certificates and degrees. Programs of study must have an active advisory group that offers advice for improving each program and they must keep records of meetings, attendance, announcements, etc. Examples of how CAC has used these funds include programs in Nursing and Radiology, where students must engage in clinical experiences at facilities, which are qualified to handle their training. Carl D. Perkins grant funding is used to reimburse those students for their mileage, as a number of those trainings are located in Maricopa County. Programs such as welding, emergency medical technician and heavy equipment benefit by Perkins funds paying for capital items needed for the program to meet standards set by their accrediting agency. A number of high schools also participate in CTE programs. These programs contribute to the opportunity to establish pre-apprenticeship programs leading to the possibility of registered apprenticeship programs to complete the course of study leading to industry-recognized credentials. SECONDARY AND POSTSECONDARY EDUCATION The PCWDB has made a commitment to engage with not only secondary, but also post-secondary education partners. ARIZONA@WORK Pinal County continues to participate in the Pinal Partnership Business and Education Workforce Committee – mapping out strategies to

147
engage the elementary and secondary school systems in developing a talent pipeline to support the ongoing and projected growth of Pinal County’s in-demand and targeted industries. A determination of adult literacy levels in Arizona involves the collective outcomes of assessments in reading, writing, and math, with scores below 8th grade equivalents serving as the benchmark for literacy inhibiters. According to the National Center for Education Statistics’ Estimates for Low Literacy (2003), 16% of Pinal County’s population falls below the 8th grade threshold. As noted earlier, of residents who are 25+ years of age, Pinal County has a higher percentage of the workforce population with a high school diploma or less (15%) when compared to the State as a whole (14.1%). The County also shows a higher percentage of the workforce that has attended some college but has not earned a degree whereas the broader state and U.S. figures show much higher percentages of bachelor’s degrees and graduate degrees. Taking this data into consideration an opportunity exists to conduct outreach to a large percentage of Pinal County residents to engage in ARIZONA@WORK Pinal County services. The reality depicted in the data described above also present opportunities for workforce and education development representatives to collaborate by joint planning and leveraging services when possible. VETERANS ARIZONA@WORK Pinal County provides services to Veterans and eligible spouses through the Jobs for Veterans State Grant (JVSG) with coordination between all partner programs offered through the system. ARIZONA@WORK Pinal County does not have a fulltime onsite Veterans Local Veterans Employment Representative (LVER). Recognizing the critical role LVERs contribute in the facilitation of system-wide services for Pinal County’s veteran population, a LVER provides itinerant services from Tucson. The LVER will also be an important contributor to the business services function. In this role, they will advocate on behalf of veterans for employment and training opportunities with business, industry and community-based organizations. The LVER will continue to perform a vital role in establishing and maintaining regular contact with employers, including federal contractors. Furthermore, the LVER will provide labor market information to businesses and other entities as a key function in addition to working with service providers to promote veteran job seekers who have highly marketable skills and experience. Additional responsibilities carried out by the LVER include the facilitation of a full range of employment, training, and placement services to meet the needs of veterans, as well as providing technical advice to the service delivery point manager on Title 38, Jobs for Veterans Act, Veteran Program Letters, and the Veterans Priority of Service program. Special populations served by Disabled Veterans Outreach Programs Specialist (DVOPS) include veterans with special employment and training needs, Special Disabled veterans, disabled veterans, economically disadvantaged veterans, veterans with other barriers to

148
employment, homeless veterans, incarcerated veterans, and recently separated veterans. The specialists will provide a full range of employment and training services through collaboration with the ARIZONA@WORK Pinal County comprehensive center and partners, including veterans’ organizations, with the primary focus of meeting the needs of veterans and eligible spouses who are unable to obtain employment through basic career services. Coordination will be assured between the Veterans Program and other partners. Recently separated U.S. veterans, those within 48 months after discharge or release from active duty, will qualify as a dislocated worker. Also qualifying as a dislocated worker is the spouse of a member of the Armed Forces on active duty, as defined in U.S.C. Title 10 Section 101 (d) (1), who has experienced a loss of employment as a direct result of relocation to accommodate a permanent change in duty station of such member; or the spouse of a member of the Armed Forces on active duty (or who has been discharged from the military) who is unemployed or underemployed and is experiencing difficulty in obtaining or upgrading employment. The Veterans Program will work closely with the Dislocated Worker Career Planners to ensure that all qualifying veterans’ services are coordinated. Case management and career planning via AJC will complement the services available through both programs. In addition to the veteran’s services provided by the JVSG, the Pinal County Workforce Development Board will work with the Arizona Coalition for Military Families to coordinate county level initiatives to enhance services to veterans residing in the county. Programs such as the Department of Defense’s Skillbridge will be promoted. Options will be explored to incorporate these programs into employee recruitment efforts.
SERVICE DELIVERY Consistent with the distributive service delivery model, the PCWDB will continuously evaluate the optimal locations and service site model based on the following: Comprehensive One-Stop Centers: A comprehensive one-stop center is a physical location
where jobseeker and employer customers can access the programs, services, and activities of all required one-stop partners and meets the following criteria: (20 CFR 678.305).
a) A comprehensive one-stop center must have at least one Title I staff person
physically present. b) The comprehensive one-stop center must provide and promote:
1. Career services, described in § 678.430 2. Access to training services described in § 680.200 3. Access to any employment and training activities carried out under sec. 134(d)
of WIOA

149
4. Access to programs and activities carried out by one-stop partners listed in §§ 678.400 through 678.410, including Wagner-Peyser employment services
5. Workforce and labor market information. c) Customers must have access to these programs, services, and activities during regular
business days at a comprehensive one-stop center. The Local Board may establish other service hours at other times to accommodate the schedules of individuals who work on regular business days. The State Board will evaluate the hours of access to service as part of the evaluation of effectiveness in the one-stop certification process described in § 678.800(b).
d) "Access" to programs and services means having either: Program staff physically present at the location; having partner program staff physically present at the one-stop appropriately-trained to provide information to customers about the programs, services, and activities available through partner programs; or providing direct linkage through technology to program staff who can provide meaningful information or services.
1. A "direct linkage" means providing direct connection at the one-stop, within a reasonable time, by phone or through a real-time Web-based communication to a program staff member who can provide program information or services to the customer. Reasonable means within two business days or less.
2. A "direct linkage" does not include providing a phone number or computer Web site that can be used at an individual’s home; providing information, pamphlets, or materials; or making arrangements for the customer to receive services at a later time or on a different day.
e) All comprehensive one-stop centers must be physically and programmatically accessible to individuals with disabilities, as described in § 678.800. Affiliate Site(s): An affiliated site, or affiliate one-stop center, is a site that makes available to jobseeker and employer customers one or more of the one-stop partners’ programs, services, and activities.
Affiliate Site(s): An affiliated site is a site that makes available to jobseeker and employer customers one or more of the one-stop partners’ programs, services, and activities. Affiliated sites are access points in addition to the comprehensive one-stop center(s) in each local area used to supplement and enhance customer access to services. (20 CFR 678.310) a).
a) An affiliated site does not need to provide access to every required one-stop partner program.
b) The local area will determine the frequency of program staff’s physical presence in the affiliated site.
c) Separate stand-alone Wagner-Peyser employment services offices are not permitted under WIOA (20 CFR 678.315 and 652.202).

150
1. If Wagner-Peyser employment services are provided at an affiliated site, there must be at least one other partner in the affiliated site with staff physically present more than 50 percent of the time the center is open.
2. Additionally, the other partner must not be the partner administering local veterans’ employment representatives, disabled veterans’ outreach program specialists, or unemployment compensation programs. If Wagner-Peyser employment services and any of these three programs are provided at an affiliated site, an additional partner must have staff present in the center more than 50 percent of the time the center is open.
3. States, in conjunction with the Local Workforce Development Boards, must examine lease agreements and property holdings throughout the one-stop delivery system in order to use property in an efficient and effective way. Where necessary and appropriate, States and Local Workforce Development Boards must take expeditious steps to align lease expiration dates with efforts to consolidate one-stop operations into service points where Wagner-Peyser employment services are co-located as soon as reasonably possible. These steps must be included in the State Plan. (20 CFR 678.310c)
d) All affiliated sites must be physically and programmatically accessible to individuals with disabilities, as described in § 678.800.
Network of One-Stop Partners or Specialized Centers: Any network of one-stop partners
or specialized centers must connect to the comprehensive one-stop center in the area, as well as any appropriate affiliate centers (i.e. such as having processes in place to make referrals to the comprehensive and affiliate sites). (20 CFR 678.320)
a) Wagner-Peyser employment services cannot stand alone in a specialized center. b) Consistent with the requirements for an affiliated site, a specialized center must
include other programs besides Wagner-Peyser employment services, local veterans’ employment representatives, disabled veterans’ outreach program specialists, and unemployment compensation (20 CFR 678.315).
System Electronic Access Points: In addition to providing access to services through the mandatory comprehensive physical one-stop center and any affiliated sites or specialized centers, required one-stop partner programs must provide access to programs, services, and activities through electronic means, where applicable and practicable. (20 CFR 678.300e)
a) The provision of programs and services by electronic methods such as Web sites,
telephones, or other means must improve the efficiency, coordination, and quality of one-stop partner services.
b) Electronic delivery must not replace access to such services at a comprehensive one-stop center or be a substitute to making services available at an affiliated site if the partner is participating in an affiliated site.

151
c) Electronic delivery systems must be in compliance with the nondiscrimination and equal opportunity provisions of WIOA in section 188 and the implementing regulations at 29 CFR part 37.
As of the writing of this plan, ARIZONA@WORK Pinal County core program services will be provided at the following locations with access to other partners:
ARIZONA@WORK JOB CENTER LOCATIONS: Comprehensive Center: ARIZONA@WORK Pinal County
Business and Career Center 318 North Florence Street, Ste. C Casa Grande, AZ 85122 (520) 866-3600
Affiliate Sites: Empowerment Systems
2066 Apache Trail # 116, Apache Junction, AZ 85120 Specialized Centers: The following locations have been identified as ARIZONA@WORK Pinal County as specialized centers focusing on Youth Program activities:
Central Arizona College
Superstition Mountain Campus
805 S. Idaho Road, Apache Junction, AZ 85119
Central Arizona College
Maricopa Campus
17945 North Regent Drive Maricopa, AZ 85138-7808
System Electronic Access: In an effort to expand the service delivery footprint to the county residents, in late 2019, ARIZONA@WORK Pinal County One Stop operator developed an application allowing for live video chat between customers and staff. Leveraging the county’s public library system, this utilizes video chat technology allowing customers to connect with and conduct live chats with an ARIZONA@WORK Pinal County program representative. The first two locations targeted to pilot this new access are the Santa Cruz Library in Eloy and the Maricopa Public Library. Additional future locations have been discussed, including: San Tan Valley, CAC San Tan Campus and/or Public Library Coolidge, CAC Signal Peak Campus and/or Coolidge Library

152
Florence, CAC Florence Center and/or Florence Library Apache Junction, CAC Superstition Mountain Campus and/or Public Library Superior, Public Library and/or another location. Mammoth or Oracle or San Manuel.
Each location will be set up with a computer with either a curved monitor or dual monitors, microphone, speakers, and video camera. Once connection is made, discussions will be conducted for an initial assessment of need and then completion of the SMART Tool to determine which program the customer potentially is qualified for and is then referred accordingly. In determining the optimal location for service delivery points, the PCWDB will utilize source information such as the Poverty Density map provided by the Arizona Office of Economic Opportunity in Figure 3. Overlays with known transportation routes, community services and other resources will help to identify potential locations and the appropriate service model throughout Pinal County.
Figure 3
Identification of additional points of access will be based on the current level of inaccessibility to comprehensive services; the lack of public transit; population characteristics (based on the latest U.S. Census data), and each location’s demonstrated labor force participation with respect to targeted industry sectors. These informed decisions will allow the PCWDB to create a service delivery model that is adaptable and responsive to the needs of Pinal County communities.

153
GOAL 1: PROMOTE A STRONG PINAL COUNTY ECONOMY: Support Pinal County’s capacity to attract, retain and grow thriving businesses through
effective workforce development strategies. (economic/business service focus)
The following targeted sectors have been identified by Pinal County for long-term economic development growth:
1. Transportation/Logistics 2. Manufacturing 3. Health Services 4. Aerospace & Defense 5. Natural & Renewable Resources 6. Tourism
As part of the ongoing effort to attract new businesses to Pinal County as well as solidify the presence of existing businesses, the county has invested in building up its infrastructure – including a larger amount of renewable energy sources – and set the groundwork for a highly anticipated high-tech, automotive manufacturing boom, led by the development of manufacturing facilities for Lucid Motors (electric cars) and Nikola Motors (hydrogen fuel cell-powered semi-trucks). From an economic development perspective, these forward thinking efforts have set the county up to compete not only within the state of Arizona but on a national and in some cases global scale. With ample shovel ready sites, the county is able to attract large, high-tech companies that take up between 300-1,000 acres. Leading these efforts is the advanced manufacturing sector. In addition to Lucid Motors and Nikola Motors, Case New Holland America tests its driverless tractors in Casa Grande. Nissan Arizona Testing Center uses a five-mile track in Stanfield which is also used by Tesla to test its

154
vehicles. With Audi and Porsche testing their vehicles outside the City of Maricopa at the Volkswagen North America testing site, Pinal County is primed to be a high tech automotive hub. The planned Attesa Motorsports Park will contain a research, development and testing component on its 2,500 acre site with ground breaking targeted for August 2020. Building on this anticipated boom in employment opportunities would only be possible by the way the stakeholders in the county – developers and city and county governments – collaborated on making sure that their projects or communities were well-positioned when opportunities presented themselves. With a daily workforce leakage of over 100,000 workers each day, the key will be to keep workers in the county. This can only be achieved if there are jobs – both from existing employers and ongoing business attraction efforts. Companies such as Tractor Supply, WalMart Distribution Center and LKQ as well as Abbot Nutrition and Frito Lay will be looked upon as examples of how Pinal County can support businesses once they establish themselves in each community. STRATEGY #1: MONITOR PINAL COUNTY GRP IN ORDER TO ASSESS THE
ECONOMIC IMPACT OF COVID-19
Gross regional product (GRP), which is also called “regional GDP” and defined as the market value of all goods and services produced within a given area over a specific period of time, is a good measure of the size, income, and productivity of a regional economy.
Nationally, economists typically describe recessions as extended periods of decline in the U.S. national GDP, and GRP can be used in a similar way for sub-national regions.

155
Practical uses of GRP for researchers and policy analysts include:
1. Showing a fuller picture of regional economic health (output and income) than simply total jobs. Two cities may have an equal number of jobs, but one may significantly outperform the other in terms of total output as measured by GRP.
2. Measuring regional recessions. Nationally, economists typically describe recessions as extended periods of decline in the U.S. national GDP, and GRP can be used in a similar way for sub-national regions.
In order to assist Pinal County leadership in understanding the impact of COVID-19 on the local economy, the PCWDB and its staff will use calendar years 2019 Pinal County GRP as a baseline to monitor industry trends.
STRATEGY #2: ESTABLISH ALIGNMENT OF EDUCATION, ECONOMIC AND
WORKFORCE DEVELOPMENT EFFORTS The success of ARIZONA@WORK Pinal County’s efforts are predicated on how well the economic development, education (K-20) and workforce development systems are planned, aligned and seamlessly synced to deliver premier services to our business customers. Without such an alignment, there will be a disconnect between the labor needs of the business community and the preparation of a qualified workforce to meet those needs. The PCWDB has also aligned workforce development efforts within the context of the Pinal County Strategic Plan 2017-2020.13 The county plan aligns with the overall goals of the State Plan in that collaborative efforts at the local level will benefit the State as a whole. The local workforce board will focus on regional approaches to economic development and associated workforce development efforts. These efforts will naturally lead ARIZONA@WORK Pinal County to work closely with all levels of the geopolitical landscape. Recognizing the interrelationship between economic and workforce development, in February 2020, the county created the Economic and Workforce Development Department, cohabitating under one roof. This has merged the strategic direction of the PCWDB/ARIZONA@WORK Pinal County and economic development planning. Collaborating with economic development not only at the county level but with each municipality in the County, ARIZONA@WORK Pinal County has been directly included in the Pinal County Strategic Plan 2017-2020. Goal 2 of the County Strategic Plan is to “Enhance Economic Development to meet business/needs/demands”. The following is a summary of selected strategic objectives and action plans from the 2017-2020 Pinal County Strategic Plan in which the PCWDB will align economic and workforce development activities to contribute to the ongoing growth of the county:
13 http://www.pinalcountyaz.gov/PCPM/Pages/PCStrategicPlan.aspx

156
Objective Action Plan
Objective 2.1: Increase number of jobs in Pinal County by 2% annually by attracting six of the County’s targeted sectors employers by June 2021
Action Plan 2.1.1:
Facilitate economic development discussions regionally, nationally, and internationally to develop new business opportunities in Pinal County.
Action Plan 2.1.2:
Develop and implement an aggressive attraction/business retention and expansion plan that accentuates the county positive and mitigates the negatives. Target the six sector employers with client
visits and calls.
Action Plan 2.1.3:
Collaborate to achieve alignment of workforce development efforts to expand the availability of jobs
Objective 2.2:
Develop a skilled workforce through collaboration with Arizona based education institutions to create degree or technical programs to match employer’s needs by 2021
Action Plan 2.2.1:
Develop sector partnership to assist in resolving industry identified education and workforce training needs.
Action Plan 2.2.2:
Work with the LWDB and post-secondary education institutions to develop and implement the needed programs that will enhance our local workforce skill sets.
Action Plan 2.2.3:
Work with K-12 to develop and implement the needed programs that will enhance our local workforce skill sets

157
STRATEGY #3: PLAN WITH A GLOBAL PERSPECTIVE The PCWDB will also monitor the Arizona We Want Progress Meters14 launched by and housed with the Center for the Future of Arizona (CFA) as they progress in all aspects of a holistic approach to economic development. In order to fully maximize the WIOA funding allocation to Pinal County for its targeted populations, and build a sustainable talent pipeline to support the pending growth of the county, the Progress Meters can serve as a “health check” on the economic landscape for business attraction, retention and growth purposes.
Communities throughout Arizona are engaged in several areas of economic, education, health- related and social initiatives to further opportunities and overall “best place to live, play and
14 For a summary of the Center for the Future of Arizona’s Progress Meters see Exhibit 8 A detailed explanation of the Progress Meters can be found at https://www.arizonafuture.org/az-progress-meters/overview

158
work” theme for their residents. The CFA Progress Meters provide all communities throughout the state common metrics to gauge the success of their efforts. For these purposes the Progress Meters may be categorized as measures that have direct or indirect impact to the overall economic and workforce growth of Pinal County:
DIRECT IMPACT INDIRECT IMPACT
PROGRESS METER
Jobs Health and Well-Being
Education Civic Participation
Young Talent Connected Communities
Infrastructure
Natural Resources
For WIOA purposes in Pinal County – the CFA Progress Meters – specifically the Jobs and Education Meters - may serve as the common metrics to be used to inform the PCWDB as to the progress it is making to meet its intended economic, workforce, and educational goals. Collectively, the elements and ongoing incremental outcomes of each progress meter will be measures to track as part of the overall Pinal County economic health.

159
GOAL 2: SERVE BUSINESS NEEDS: Serve the Pinal County business community by understanding, anticipating and instituting a proactive approach to assist in meeting workforce needs through a
coordinated community business service effort
The Pinal County Workforce Development Board (PCWDB) serves as a strategic convener to promote and broker effective relationships among workforce partners conducting employer engagement activities on behalf of Pinal County. The PCWDB is responsible for developing a strategy that continuously improves and strengthens services delivered to employers through innovation in, and alignment and improvement of, employment, training, and education programs to promote economic growth. STRATEGY #1: EFFECTIVELY STRUCTURE ARIZONA@WORK BUSINESS
SERVICES In accordance with the requirements of the WIOA, the PCWDB shall identify and promote proven and promising strategies and initiatives for meeting the workforce needs of Pinal County employers. For the PCWDB, this requirement divides “business services” into two tiers; employer engagement and business services. Employer engagement is strategic in nature and practiced primarily by the PCWDB and its staff. This arm of business services markets and sells the workforce development system in its entirety by establishing and maintaining relationships with key community businesses and stakeholders. Established connections are then leveraged to advance the mission of the PCWDB to the benefit of Pinal County’s business community and workforce development system. The employer engagement function also looks for opportunities to strengthen the probability of business success through the creation of sector strategies and partnerships when appropriate, providing labor market information in support of business attraction, expansion, and retention, and working on a variety of special projects to support the needs of local employers. Business services is primarily operational in nature as it aims to deliver a variety of customizable assistances directly to Pinal County employers based on assessed needs. Business

160
Services are performed by partner programs that sign ARIZONA@WORK Pinal County’s Memorandum of Understanding (MOU). As outlined in Strategy 3, in order to avoid duplication of efforts and maximize service efficiency to employers, it is essential that business services be approached systematically and in alignment with the PCWDB’s business services strategy. In 2019, state funded Business Services Representative (BSR) and Local Veterans Employment Representative (LVER) positions were vacated with no estimated time to rehire. This in-turn left ARIZONA@WORK Pinal County without dedicated Business Service representation to network with, and provide labor certain exchange services to employers. These vacancies present the PCWDB with the opportunity to evaluate the flexibility afforded via Training and Employment Guidance Letter (TEGL) 13-19 which allows states to redefine the Wagner-Peyser Employment Service delivery model. The PCWDB will initiate exploratory discussions with the ADES (state workforce agency) focused on potentially placing the tier 2 labor exchange business service function within a Pinal County department such as Economic and Workforce Development. At a minimum, this function would provide referrals of job seekers to available job openings, assist in the development of job order requirements, match job seeker experience with job requirements and skills, assist employers with special recruitment needs, arrange job fairs, assist employers with analyzing hard-to-fill job orders, assist employers with job restructuring, and help employers deal with layoffs. Placing such a function within Economic and Workforce Development further aligns the efforts of workforce and economic development in Pinal County.
STRATEGY #2: UNDERSTAND PINAL COUNTY’S BUSINESS LANDSCAPE
Current Business Landscape
NOTE: Impacts of Covid-19 on the current business landscape will be assessed as data is made available and incorporated in a modified ARIZONA@WORK Pinal County plan. Pinal County’s economy includes a wide range of industries offering opportunities for individuals seeking all types of employment. According to the Arizona Office of Economic Opportunity, several positive economic and workforce trends occured in Pinal County during the last couple of years. These include:
• Population continues to increase, growing 3.5 percent from 2017 to 2018. • Population is projected to grow by 2.9 percent in 2019 and 2.8 percent in 2020. • Incomes rose dramatically in Pinal County. Median family income increased from $52,788
in 2017 to $58,058 in 2018. • Labor force participation grew in 2018, increasing by 6,408 people, or 3.7 percent from
2017. • In 2018, seven out of ten major industry sectors recorded positive year-over-year
employment growth. • In 2018, employment gains were led by Professional and Business Services, which grew
by 700 jobs or 11.3 percent. • Pinal County’s total employment is projected to increase by 1.5 percent annually from Q3
2018 through Q2 2020.
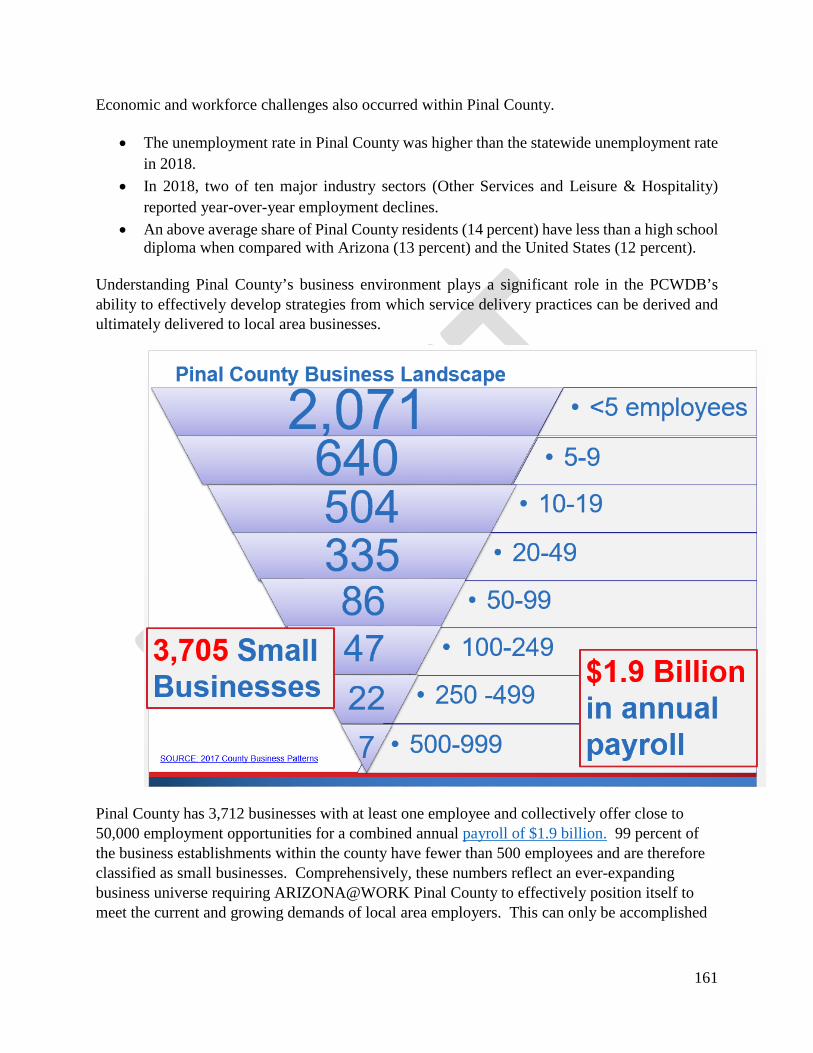
161
Economic and workforce challenges also occurred within Pinal County.
• The unemployment rate in Pinal County was higher than the statewide unemployment rate in 2018.
• In 2018, two of ten major industry sectors (Other Services and Leisure & Hospitality) reported year-over-year employment declines.
• An above average share of Pinal County residents (14 percent) have less than a high school diploma when compared with Arizona (13 percent) and the United States (12 percent).
Understanding Pinal County’s business environment plays a significant role in the PCWDB’s ability to effectively develop strategies from which service delivery practices can be derived and ultimately delivered to local area businesses.
Pinal County has 3,712 businesses with at least one employee and collectively offer close to 50,000 employment opportunities for a combined annual payroll of $1.9 billion. 99 percent of the business establishments within the county have fewer than 500 employees and are therefore classified as small businesses. Comprehensively, these numbers reflect an ever-expanding business universe requiring ARIZONA@WORK Pinal County to effectively position itself to meet the current and growing demands of local area employers. This can only be accomplished

162
through proactive practices that leverage business insight, available data, key partnerships, and opportunities to innovate! The following table reflects the number of Pinal County business establishments by industry. Respectively, Retail, Health Care and Social Assistance, and Construction are the three industries in Pinal County with the greatest number of businesses.
When it comes to business attraction, Pinal County Economic Development focuses recruitment efforts on businesses that offer local residents employment opportunities that demand high skills, offer high earning potential, and are projected for high growth. Specifically, Pinal County targets businesses in the industries of Manufacturing, Health Services, Natural Renewable Resources, Aerospace and Defense, Transportation and Logistics, and Tourism. Of the five targeted industries, only Health Services currently has a significant representation amongst all industries countywide. The presence of Health Services businesses in Pinal County is reflected in the number of employers from this industry that utilize services from ARIZONA@WORK Pinal County. The chart below represents the number of unique employers by industry, who advertised at least one job opening with ARIZONA@WORK Pinal County during program year 2018. Health Services employers lead the way with 24, Manufacturing was second with 17, and there was a three-way tie for third; Retail, Construction, and Agriculture each with 11.
122221
415120130
510120
56204
225291
14237
43503
63371
3497
0 100 200 300 400 500 600
Agriculture, forestry, fishing and huntingMining, quarrying, and oil and gas extraction
UtilitiesConstruction
ManufacturingWholesale trade
Retail tradeTransportation and warehousing
InformationFinance and insurance
Real estate and rental and leasingProfessional, scientific, and technical services
Management of companies and enterprisesAdministrative and support and waste management and…
Educational servicesHealth care and social assistance
Arts, entertainment, and recreationAccommodation and food services
Other services (except public administration)Industries not classified
Pinal County Business Establishments by Industry

163
Based on the number of unique employers who placed a job opening with ARIZONA@WORK Pinal County during Program Year 2018 and the total number of businesses in Pinal County, the annualized employer penetration rate was 4.3 percent for the local area. In total, 160 unique businesses out of 3,712 potential business were served. In order to further understand the characteristics of the employers ARIZONA@WORK Pinal County is serving, the PCWDB will consider the following actions over the next few years:
• In PY19, research the number of employees associated with the unique businesses that are being served. Over 2,000 of the 3,712 Pinal County business have between 1 and 5 employees.
• In PY20, if it is discovered that ARIZONA@WORK Pinal County services are not being utilized by businesses within this tier, the PCWDB will develop focused strategies to engage this cohort in order to better understand its workforce needs and hiring practices. This engagement should seek to identify potential customizable services that will make ARIZONA@WORK’s menu of services more relevant to the needs of this cohort.
• In PY21, if the cohort engagement yields significant findings, implement newly defined strategies that result in customized services for Pinal County businesses having 1 to 5 employees. If implemented effectively, this should result in a significant increase in employer penetration rate.
113
411
173
119
26
25
38
624
36
97
3
0 5 10 15 20 25 30
Agriculture, Forestry, Fishing and Hunting*Mining, Quarrying, and Oil and Gas Extraction
UtilitiesConstruction
*ManufacturingWholesale Trade
Retail Trade*Transportation and Warehousing
InformationFinance and Insurance
Real Estate and Rental and LeasingProfessional, Scientific, and Technical Services
Management of Companies and EnterprisesAdministrative and Support and Waste Management and…
Educational Services*Health Care and Social Assistance
*Arts, Entertainment, and Recreation*Accommodation and Food Services
Other Services (except Public Administration)Public Administration
Not Classified
Employers Served by ARIZONA@WORK Pinal County By Industry (PY18)

164
or • In PY21, if the cohort engagement does not yield significant findings, the PCWDB
shall focus employer engagement efforts on businesses with greater than 5 employees and remove the 2,000 plus employer base from the employer penetration calculation. Business Service representatives shall continue to serve the smaller employers on an as needed basis. This will significantly increase the employer penetration rate. Case in point, recalculating employer penetration for PY18 without the 2,071 employers, yields a 9.7% employer penetration rate for ARIZONA@WORK Pinal County.
STRATEGY #3: ALIGNMENT OF INTERNAL EMPLOYER ENGAGEMENT ACTIVITIES
The PCWDB recognizes that employer engagement activities are an integral function of
partner programs that participate within the ARIZONA@WORK system. Effective employer engagement strategies are a top priority for ARIZONA@WORK Pinal County. Regardless of employer size or industry, all interactions with businesses occurs in a professional manner. All businesses seeking assistance through ARIZONA@WORK Pinal County will:
• Receive an overview of customizable services. • Participate in an informal assessment to evaluate the employer’s needs. • Be provided a singular point of contact for questions or future needs. • Be encouraged to participate in a service satisfaction survey in order to help us
measure how effective and efficient service delivery systems were.
Establishing and maintaining partnerships with employers facilitates connections that benefit both the business community and job seekers utilizing ARIZONA@WORK services. Regardless of programmatic requirements, when engaging with Pinal County employers, the PCWDB would like to deploy system level messaging. In other words, all partner programs that engage with employers should have a basic understanding of all services available to employers through ARIZONA@WORK. The ARIZONA@WORK Pinal County Memorandum of Understanding (MOU) outlines the requirements for a Business Service Team led by the One-Stop Operator and comprised of partner programs that engage with employers. This team shall meet regularly to coordinate outreach efforts, cross train on available programmatic services, develop common marketing materials/collateral to promote services to employers, and share best practices from employer engagement activities. Through the implementation of WIOA in Pinal County, ARIZONA@WORK contributes to the economic development of our region by matching employers in search of a qualified workforce, with job seekers who possess the right skills. In Program Year 2018, ARIZONA@WORK Pinal

165
County had a 5.4% employer penetration rate serving 189 unique businesses with various resources that facilitated connections with qualified workers.
Employers are supported by aligning demand for skilled workers in “in-demand” occupations with a readily available supply of prepared job candidates. A host of services are provided to job seekers including but not restricted to limited financial assistance to remove barriers to employment and occupational skills training when appropriate. ARIZONA@WORK Pinal County’s vision is to exceed the expectations of every business and job seeker in Pinal County, but this can only be achieved when customers have access to offered services. Business expectations rely on an informed business service strategy that incorporates the current and future needs of Pinal County’s job creators. What job seekers expect is staff’s expertise and assistance in finding quality jobs that align with their interests and meet their financial needs. With recent major economic investments announced for Pinal County it is critical that the workforce system positions itself to meet this demand. Companies such as Lucid Motors, Attesa Motorsports and Nikola Motors, will each be seeking a qualified workforce. ARIZONA@WORK Pinal County will be looked upon to facilitate the meeting of these and other Pinal County business’ labor demands. The PCWDB will utilize its Business Service function to begin the asset mapping process within the in-demand and targeted industries identified in the economic analysis of this plan. The process will focus on identifying their workforce needs, skill gaps, recruitment strategies, as well as advocating for work-ready job seekers who could fulfill those workforce needs.
A. Business Service delivery will be consistent with the most current version of the
ARIZONA@WORK Pinal County Local Workforce Development Plan and processes agreed upon by members of the ARIZONA@WORK Pinal County Partner Program Operations Leadership Committee.
B. In addition to the guiding principles within the local plan, partners agree to: i. Agree upon and collaboratively develop a method to coordinate
outreach efforts to employers and networking groups. ii. Develop a comprehensive list of the services each partner offers to the
business community for internal reference iii. Develop integrated marketing materials that seamlessly promote
system services that are available to Pinal County’s business community.
iv. Leverage program caseloads to support hiring events and job fairs v. Identify a lead Business Service Representative to participate in
Business Service Team meetings to be scheduled at a frequency as agreed upon by partners.

166
RAPID RESPONSE ACTIVITIES On May 8, 2020 local workforce areas were notified by the Office of Economic Opportunity that as permitted by WIOA (see Sec. 133(a)(2)), the state elected to reserve 25% (or $9.9 million) of the Program Year 2020 Dislocated Worker Fund for Statewide Rapid Response Activities, allowing the state to respond to the increased needs of businesses and workers. Local areas were further notified the State will be developing a strategic vision and plan for the activities and use of funds and will consult and engage local areas accordingly to ensure alignment. As of the submission of this plan, those plans are unknown.
GOAL 3: PREPARE JOB SEEKERS FOR EMPLOYMENT OPPORTUNITIES IN HIGH GROWTH INDUSTRIES:
Prepare and match ARIZONA@WORK Pinal County job seekers to employers for a successful career pathway (job seeker focus)
The ARIZONA@WORK Pinal County system provides an integrated approach to the provision of services. Through the enhanced coordination and direct linkages between WIOA partner programs outlined in the ARIZONA@WORK Pinal County Memorandum of Understanding and Infrastructure Funding Agreement, information on services are made available to the business and job seeker communities in Pinal County.
STRATEGY #1: LEVERAGE RESOURCES BY MAXIMIZING CO-ENROLLMENT
IN CORE PROGRAMS The potential of co-enrollment into core programs will begin with the assessment process. It is at the stage of initial assessment when the needs of the individual begin to come into focus. Upon consulting with the individual, staff will recommend referrals to core programs that may be of benefit in the development of a comprehensive employment plan. Career Planners will play a critical role in determining which services are to be accessed to best serve program

167
participants. Through cross training, the Career Planners will collaborate with their core program colleagues as well as other ARIZONA@WORK Pinal County partners to implement an employment plan that may involve the co-enrollment in core programs. For example, Career Planners will work together to provide trade-affected workers with opportunities to obtain new job skills, resources and the support they need to successfully become employed. Potential Trade Adjustment Assistance (TAA) customers may be identified during the orientation process, or customers may self-certify and present their TAA certification at the outset. Dislocated Worker staff generally manages TAA participant cases, ensuring co-enrollment and appropriate leveraging of TAA and Dislocated Worker Program funding. The flexibility of TAA funds affords career planners more latitude when assisting TAA clients with matching existing skills to training leading to future careers. TAA customers are not limited to the Eligible Training Provider List (ETPL) when pursuing TAA-supported training. In addition, TAA requires only that training be made available at a reasonable cost and may preclude the use of a ‘hard’ training cap. Coordination between the Dislocated Worker Program and TAA provides integrated service delivery for co-enrolled participants. Guidelines were developed to ensure the availability of services to individuals affected by a layoff due to foreign competition. Once eligibility is determined by the Dislocated Worker program, program services are coordinated between the Dislocated Worker and TAA funding streams. Although occurrences of TAA activity have been extremely rare in Pinal County, ARIZONA@WORK Pinal County will coordinate with the program when opportunities present themselves. TAA does not have a TAA Counselor in the rural areas, although all TAA customers are assigned to a TAA Counselor’s caseload. The TAA Counselors work with “out-of-area” customers remotely and when necessary, the TAA Counselor will travel to an individual’s location to work with the customer in-person. TAA will coordinate with ARIZONA@WORK Pinal County staff to provide seamless services to participants in the following areas: Early intervention for worker groups on whose behalf a TAA petition has been filed:
• (NOTE: The following is a general description of the role of Rapid Response in a TAA petition scenario. It is unknown at this time what role ARIZONA@WORK Pinal County will specifically have in this state level activity effective July 1, 2020.) Rapid Response teams include TAA, Dislocated Worker and Employment Service representatives, who as a team conduct on-site (whenever permissible) presentations at the employer location. Rapid Response Coordinators will notify the TAA Program when they receive information about an upcoming lay-off if it appears the lay-off is due to foreign competition and therefore, potentially Trade eligible. Every effort will be made to provide informational sessions prior to the commencement of the lay-offs / plant closure.

168
These presentations consist of overviews of the benefits and services that can be expected from each of the partner groups. During these sessions the emphasis is how TAA, Dislocated Worker and Employment Service staff will work together to offer impacted individuals comprehensive re-employment benefits and services.
Services for TAA Participants, as indicated in the co-enrollment policies: • All TAA customers are required to be referred to the Dislocated Worker Program
to be co-enrolled. TAA Counselors emphasize the benefits of co-enrollment. All customers have Individual Employment Plans developed, which are shared and agreed upon between the TAA Counselors and Dislocated Worker Career Planners. Leveraging of resources occurs by having the Dislocated Worker Program take the lead in conducting assessments (Basic education levels, aptitudes, interests, etc.), the results from which guide the TAA and workforce system partners in developing customers’ re-employment plans. These plans identify possible barriers to employment as well as strategies to address those barriers. All TAA Customers have access to resources provided by Wagner-Peyser/Employment Service and all customers co-enrolled with other ARIZONA@WORK Pinal County partners are able to partake in workshops. Because Wagner-Peyser/Employment Service staff have on-going direct connection to local and statewide employers / job openings, customers may be assigned to a staff person for assistance with intensive Job Search activities.
• Case Management will be shared between TAA Counselors and Dislocated Worker Career Planners. Case notes are accessible by either program via Arizona Job Connection, allowing staff to coordinate activity and monitor contact as well as to track progress toward identified employment goals. Ongoing communication will be stressed between TAA and Dislocated Worker Career Planners. “Staffing” between a customer and both program representatives will occur as needed to address customer needs or issues.
• When it is determined a TAA-eligible customer needs re-training in order to be more competitive in the job market, TAA will take the lead in the development of the training plans. The training plans will be developed based on assessment results, Labor Market information, as well as taking into consideration the customer’s employment history, education, etc. and coordinated in partnership with the Dislocated Worker Program.
While TAA will be the primary funding source for an individual’s training, the Dislocated Worker Program may offer assistance with Supportive Services as needed (e.g., transportation, counseling, utility and rental assistance, extra school supplies, medical exams, etc.). Co-funding of training also may occur if it is necessary to meet a customer’s needs. Once a customer enters

169
approved training, there is coordination with Unemployment Insurance for an individual’s ongoing income support. TAA has developed and managed resources to integrate data provided through different agencies administering benefits and services in order to ensure consistent program administration and fiscal integrity, as well as reliable fiscal and performance reporting. TAA, Trade Readjustment Allowances (TRA), Re-Employment Trade Adjustment Assistance (RTAA), Dislocated Worker Program, and Employment Service all utilize the Arizona Job Connection (AJC) to collect universal customer demographic information and track the various program enrollments. In another example co- enrollments of out-of-school youth may result in an increase in leveraging the resources and program offerings of the Adult Program and Adult Basic Education (Title II). Out-of-school youth over the age of 18 may, depending on assessments and consultation with Career Planners, be co-enrolled in both the Youth and Adult Programs. As with the TAA-Dislocated Worker co-enrollment relationship, co- case management of the participant is shared by each program to ensure a seamless, comprehensive employment plan is composed leveraging the resources of each partner. STRATEGY #2: PROVIDE INNOVATIVE OPTIONS TO SERVICE ACCESS FOR
ARIZONA@WORK PINAL COUNTY CUSTOMERS The current operational model provides personalized services for clients who physically come to the job center in Casa Grande or visit a partner organization. This has resulted in an expectation that the customer must come to us. Although electronic access points exist, the model is predicated on a coordination of various partners at the comprehensive center in Casa Grande and is outdated and not customer centric. Labor intensive efforts, have focused solely on the services provided at the comprehensive center. As a result, there is a lack of integration with service providers not located at the center. Driven by the job center and local board certification process, it is realized that change is needed. Given available technology and transportation to accessible services, ARIZONA@WORK Pinal County finds itself operating like Blockbuster in the age of Netflix. Like defunct Blockbuster, service delivery relies on brick and mortar buildings when clients need virtual accessibility options to services or at a minimum - services that are more readily available closer to where they live. This plan addresses the need to engage the entire county to ensure that every individual seeking employment who is in need of assistance has access to ARIZONA@WORK Pinal County services. Currently, there is one comprehensive center located in Casa Grande, the largest incorporated city in Pinal County. To ensure outreach and service access is available to the balance of the county, ARIZONA@WORK Pinal County will look to build upon successful access points such as the Coolidge Library and the Eloy Veterans Center in order to build a network of locations that are accessible throughout the county. Using labor market data, the
170
PCWDB will develop evidence-based criteria to allow it to make informed decisions on where to locate service points. In order to formulate a cohesive plan to strategically increase the ARIZONA@WORK Pinal County footprint, in early 2020, the PCWDB created a Task Force comprised of board members and stakeholders. This Task Force has been charged with mapping out a plan that will provide for a reallocation of all available resources with the sole goal to increase service delivery to areas of the county determined to be underserved. The Task Force will look to integrate already initiated efforts, such as live video chat. As a result of expanding service at successful access points, ARIZONA@WORK Pinal County launched live video chat. The two pilot locations now operating are the Eloy Public Library and the Maricopa Public Library. At those two locations, clients now connect via video conference to ARIZONA@WORK Pinal County for services. Additional access points are under development. The next two targeted locations are the Coolidge Public Library and the Florence Public Library. Additional locations around Pinal County will then be added. These efforts will form the basis for an overarching plan designed to afford customers access to services at their convenience. The PCWDB as part of their strategic planning effort will work with service partners in the design of this new model. STRATEGY #3: ALIGN SERVICE DELIVERY ACTIVITIES Aligning career services and business activities to maximize meeting the labor demands of high-growth industries and occupations is critical to the success of individuals served. ARIZONA@WORK Pinal County service delivery will be predicated on a two-path model, centered on the strengths and desires of each individual who seeks assistance and who has been assessed to identify whether the individual is in crisis, has basic needs, or is ready to pursue a path toward a career.
For individuals who seek basic career services and are not interested in further assistance other than that provided by resources in the job center or online, a self-service track will be provided allowing them to become oriented to self-service options or staff assisted job search and matching primarily by Employment Service. Resume assistance as well as access to an array of workshops will also be available to individuals choosing this particular service path.
Services available to basic career service job seekers include: Access to comprehensive center resource room Job search Labor market information
CareerSTEP:
Strategic Transformational Employment Partners

171
Standardized skills assessments Job-seeker workshops (self-directed/computer-based opportunities, group workshops)
Based on an initial assessment, individuals who express a desire to explore career pathway options and a need to upgrade employability skills will be introduced to the CareerSTEP path. CareerSTEP is an individualized career service pathway that has been developed by the ARIZONA@WORK Pinal County partner programs. Job seekers choosing to enter this path will be assigned to a Career Planner who will work with them to develop a plan of action based on a menu of services offered by ARIZONA@WORK Pinal County partners. These services will be coordinated to focus on filling interpersonal as well as technical skill gaps identified through comprehensive assessments. Career Planners, providing customers access to both preliminary and in-depth assessments, will coach individuals along the CareerSTEP path. These more in-depth tools will provide the job seeker with a greater awareness of their basic aptitudes, as well as occupational skills and work interests. It is the intention to incorporate the Arizona Career Readiness Credential into the mix of pre-employment assessments. Additionally, this service level focuses on identifying individual barriers that may affect a customer’s ability to seek self-sufficient employment or complete training that leads to self-sufficiency. One-on-one reviews of the assessment results will assist clients in determining the best individual career pathway to pursue. Upfront strategies will help identify the best tactics to be used to ensure training funds and pathways are synched to the maximum benefit possible. CareerSTEP, Strategic: Focus will be on assisting individuals to identify their own talents through strength-based assessments and collaboration with their Career Planner to match their strengths with evidence based research of the targeted industry and occupational sectors in Pinal County. This matching will assist in the identification of the best mix of workforce services and will afford the individual the best opportunity for success in securing growth-oriented employment. CareerSTEP, Transformational: Based on the results of the skills and interest assessments conducted, each individual will collaborate with a Career Planner to compose career plan. Although each partner program may call these plans by specific programmatic names (e.g., Individual Employment Plan, Individual Service Strategy, etc.), career plan is the most critical document in the CareerSTEP process. It will serve as the roadmap for the job seeker, outlining the specific steps, training and supportive services to be accessed in order to produce individuals who are prepared and qualified to apply for in-demand opportunities in Pinal County. Basic education needs such as GED, English as a Second Language (ESL), personal computer, and advanced job search techniques may be offered, along with supportive services/referrals which may involve transportation, food, and housing assistance, to ensure as best as possible that barriers to employment are being addressed so that the job-seeker may focus fully on enhancing their employability skill levels. The relationship between the Career Planner and job seeker is
172
critical to the individual’s success. Job seekers will be provided with access to their Career Planner throughout their plan. CareerSTEP, Employment: The last step in all IEPs will be referring clients to a Workforce Specialist. The Workforce Specialist will work with individuals to ensure that their AJC registration is current and a resume is customized to the match the specific employment opportunities they are seeking and qualified for. Workforce Specialists will collaborate with each individual’s Career Planner to strategically explore the best option for a CareerSTEP participation. This may include on-the-job training (OJT), a paid work experience, or internship. The Business Service Representative will be a key member of this collaboration, working to ensure employers are aware of the OJT and work experience benefits to both the employer and potential new hire. CareerSTEP, Partners: Community partnerships play a key role in the CareerSTEP continuum of services. The ARIZONA@WORK Pinal County partnerships include the K-12 school system, who will be laying the foundations for Pinal County’s talent pipeline; community organizations, who will provide support services during work preparation time, and WIOA required partners, who will be the foundation for service integration and planning. The business community is the mainstay of the entire system, as employers will provide the opportunities to individuals on their path to self-sufficiency. Economic development partners assist in the identification of in-demand occupations/industries as well as communicating with job center staff to ensure economic development and workforce development are aligned. Post-secondary training partners are a critical partner as they are charged with providing the bridge between the gap in skills and the employment opportunities in in-demand industries. Individualized Career Services offered via CareerSTEP include: Job Match Staff-administered and interpreted skills assessment Career planning Job referral Scheduling appointments with appropriate community based organizations Development of a career plan Staff-administered skills development strategies Research on training options Pre-employment workshops Group counseling Short-term pre-vocational services such as Adult Basic Education, English as a Second
Language (ESL), basic computer literacy, interviewing skills, and soft skills Training Services:
• Occupational Skills Training
“…focus on transformative service delivery, not transactional program delivery throughout the workforce system…”

173
• On-the-Job Training (OJT) • Programs that combine workplace training with related instructions • Adult Education and literacy activities when integrated with other training
services • Customized training • Registered apprenticeship programs
• Employment plan development based on career pathways approach
CUSTOMER EXPERIENCE OVERVIEW ARIZONA@WORK Pinal County strives to offer a tailored customer experience void of programmatic requirements and jargon that is only understood by ARIZONA@WORK staff.
In order to ensure the sustainability of a customer friendly environment, and with the focus on transformative service delivery, not transactional program delivery throughout the workforce system, it is imperative that all staff and partners embrace a culture enriched with characteristics that include subject matter expertise, respect, professionalism, kind-heartedness, a sense of community, and collaboration. These traits are of the utmost importance and exhibited in our everyday interactions with both internal and external customers in order to maintain an effectual service delivery system that brings value to all.

174
The ARIZONA@WORK Pinal County customer flow is principled around basic concepts and functions detailed below.
ARIZONA@WORK Pinal County Workforce Development Customers
JOBSEEKER FLOW(Comprehensive Center Only)
Greeted and initial
assessment
Point of Entry
Where does this person
need to go?
SystemOrientation
NEW
Resource Room for independent
services
RETURNING
Career Planner
Non DVOP Eligible Veteran/ Non-vets
DVOP
New DVOP Eligible Veteran
APPO
INTM
ENT
Client done for the day –return as needed
Assessment Tool
No
assi
stan
ce n
eede
d
Inte
rest
ed in
or
requ
ests
furt
her
assi
stan
ce
Next
Employment Services
RESEA
Proposed Job Seeker service model (Comprehensive Center):
• Welcome i. An ARIZONA@WORK Pinal County staff member greets all job seekers
entering our center and during a brief exchange of some basic information, an initial assessment begins with the client answering questions during sign in via using the SMART Tool. This initial assessment is critical, as it is the first step along the job seeker’s path to evidence based service delivery.
ii. After signing in, eligible veterans desiring specialized services proceed to our Veteran Employment Advocate. In the event that the Veteran Employment Advocate is unavailable, eligible veterans desiring specialized services proceed to a Wagner-Peyser Workforce Specialist via Veterans Priority of Service
iii. All other first time visitors proceed to the resource room to complete the assessment process.
iv. As a part of the welcome function, all first time visitors will view an orientation of all the services that are available within our ARIZONA@WORK System.

175
v. After completing orientation, a resource center staff member will analyze the information the client provided during sign in to determine if the client might be eligible for one or more of the CareerSTEP services.
In the event that a client shows interest in any of the career services (not basic) that are available, based on the analysis of the assessment, he or she will be referred to the appropriate ARIZONA@WORK Pinal County partner representative. Independent Services
• A jobseeker is introduced to the menu of services he or she can use in the resource room. These independent job related activities include:
i. Registration in the Arizona Job Connection Database ii. Job search
iii. Résumé development or updates iv. Research of labor market information v. Online applications
vi. Development of a cover letter vii. Typing test
viii. Creation of an email account ix. Copy/FAX/Scan/Print Services x. Unemployment claims
• Staff in the ARIZONA@WORK Pinal County Resource Room assist job seekers with basic questions and job related activities. In the event that a job seeker requires or desires more involved staff assistance with basic services, he or she will proceed to the next available Wagner-Peyser Workforce Specialist.

176
Assessment Tool • Initial assessments are the most critical element of a job-seeker’s journey through the
numerous services offered by ARIZONA@WORK Pinal County. Initial assessments establish the foundation of service delivery. The results provide career planners with information that helps identify gaps and barriers between a job seeker’s current situation and ultimate employment goal. This information helps create a sound employment plan to guide the job seeker’s journey through the workforce development system. The PCWDB reserves the right to review and modify the assessment tool in use as necessary to safeguard the effectiveness of service delivery.
• Based on informal and formal assessments of the jobseeker, next step strategies include one of the following three approaches:
i. Return to the resource room for independent services. a. Now that the job-seeker is armed with knowledge of in-demand
occupations and career pathways; has a better understanding of self-interests; has been provided a realistic evaluation of his or her knowledge/skills/abilities; and doesn’t possess any apparent gaps in occupational skills; he or she may continue to independently use center resources in order to identify job and/or career pathway opportunities.
JOBSEEKER FLOW (cont’d)
Assessment Tool
Which service
pathway is best for this individual?
Employment Service
CareerSTEP
Self-Service
Job Search
Career Development
No further services required

177
b. Some job seekers may not want the level of involvement and/or commitment required for further career services and are free to explore the center’s resources to the degree with which they are comfortable.
ii. Assistance with basic services for: a. Résumé development b. Job referrals c. Job matching
iii. Referral to ARIZONA@WORK Pinal County’s CareerSTEP a. Occupational skill upgrades via Adult, Dislocated Worker, Youth,
Vocational Rehabilitation, other required partners or any combination as appropriate to leverage resources.
b. Adult Education for individuals requiring basic education obtainment before entering a career path.
The following diagram outlines the customer experience through the use of the video chat available at electronic access points in Eloy and the City of Maricopa:
Job Seeker service model (video chat Access Point)
• Welcome i. Client initiates a video call from one of the video chat Access Points
around the County. ii. The front desk staff member at the Business and Career Center in Casa
Grande greets the client and asks them if they are a veteran. 1. If they are a veteran then the Veterans Priority of Service gets
filled in by the staff member.

178
iii. The front desk staff member then asks probing questions to find out what kind of assistance the client needs.
iv. Some basic information is obtained (first and last name, cell number, and email address) and that information is entered on a tracking sheet.
v. The front desk staff member then determines which staff member is going to assist the client.
vi. That staff member then joins the video call and a warm introduction is made between the servicing staff member and the client.
vii. The front desk staff member then creates a virtual breakout room and then moves the staff member and client into the breakout room.
viii. The servicing staff member then opens the SMART Tool, shares the SMART Tool with the client so they can see it, and then asks the client all the SMART questions while filling in all the answers.
ix. After submitting the SMART Tool, the staff member then runs the SMART Analysis Tool to see if the client possibly matches any of our programs.
1. If a result is True for any program, the program(s) is/are explained to the client and the client is asked if they are interested in those services. If they are interested, the staff member makes a note to initiate the referral after the video call.
2. If the results are False, the staff member just moves on. x. Employment services are then provided (AJC registration, resume
building, job search, job applications, etc.). xi. After the client has been served and leaves the call, the staff member then
updates everything on the video chat tracking sheet and sends the client an email.
1. The email includes a thank you, the information they will need to login into AJC, a copy of their resume, and a request for their feedback with the link to the online customer satisfaction survey for video chat.
xii. If a referral is to be made, the staff member then transfers the needed information to the program.

179
An example of the innovative approaches to service delivery could involve the incorporation of an ARIZONA@WORK Pinal County Mobile Unit. At the time of the writing of this plan, the ARIZONA@WORK Pinal County One Stop Operator is exploring this option. This mobile unit would bring access to Pinal County residents who either
don’t know about ARIZONA@WORK Pinal County or who are unable to travel to Casa Grande or one of the remote access points for service. The mobile unit would be a trailer containing a computer lab, with a generator, air conditioning, and satellite internet and be used for all workforce services as well as a mobile classroom. The mobile unit in combination with video chat service and remote access points will provide ARIZONA@WORK Pinal County with a 21st century service delivery model. Through the ARIZONA@WORK Pinal County workforce system, adults and dislocated workers in need of training will be provided an Individual Training Account (ITA) and access to lists of eligible providers of training. Individual Training Accounts allow customers to make an informed choice when selecting a training provider, based on the specific information shared by each provider. Each ARIZONA@WORK Pinal County Job Center location must make the State List of Eligible Training Providers through the Arizona Job Connection website available to customers. ARIZONA@WORK Pinal County will incorporate the Arizona Career Readiness Credential (ACRC) into the service mix. The ACRC is a major initiative set forth by Governor Ducey in partnership with ARIZONA@WORK and the Arizona Office of Economic Opportunity (OEO). This tool prepares job seekers for success by demonstrating their command of seven skill areas that are relevant to every occupation, industry and career pathway across the state.
Close coordination between economic development and workforce development will assist in identifying the skillsets necessary to earn industry-recognized credentials.

180
Three foundational academic s kills and four personal and interpersonal skills form the framework of the Arizona Career Readiness Credential:
Foundational Skills Interpersonal Skills
Applied Mathematics Communicating Effectively
Reading for Information Teamwork and Collaboration
Workplace Data and Graphics Professionalism
Critical Thinking and Problem Solving
STRATEGY# 4: UNDERSTANDING THE LABOR DEMANDS OF HIGH-GROWTH
INDUSTRIES AND OCCUPATIONS TRAINING SERVICES Training services are designed to close the skill gap between the workplace skills an individual possesses and those necessary to secure employment opportunities available in local industries. Close coordination between economic development and workforce development will assist in identifying the skillsets necessary to earn industry-recognized credentials. Facilitating alignment with training providers will allow the overarching workforce system to focus on communicating the training programs necessary to keep the talent pipeline open and flowing with qualified candidates.
As stated in Training and Employment Notice 17-15, WIOA codifies the essential elements of career pathways into law. The term “career pathway” means a combination of rigorous and high-quality education, training, and other services that: Aligns with the skill needs of industries in the economy of the state or regional economy
involved Prepares an individual to be successful in any of a full range of secondary or
postsecondary education options, including apprenticeships Includes counseling to support an individual in achieving the individual’s education and
career goals

181
Includes, as appropriate, education offered concurrently with and in the same context as workforce preparation activities and training for a specific occupation or occupational cluster
Organizes education, training, and other services to meet the particular needs of an individual in a manner that accelerates the educational and career advancement of the individual to the extent practicable
Enables an individual to attain a secondary school diploma or its recognized equivalent, and at least one recognized postsecondary credential
Helps an individual enter or advance within a specific occupation or occupational cluster.
ARIZONA@WORK Pinal County Career Planners, with guidance provided by the Pinal County Local Workforce Development Board’s Career Pathways Committee, will use the U.S. Department of Labor – sponsored “Career Pathways Toolkit: A Guide for System Development” as the basis for Career pathways strategic planning. The Toolkit features “Six Key Elements of Career Pathways” as the basis for career and training planning. The components under each element are not sequential and may occur in any order. Likewise, multiple partners can engage in the components simultaneously to carry out the mission of the career pathways system. The six elements are:
1. Build cross-agency partnerships and clarify roles 2. Identify industry sectors and engage employers 3. Design education and training programs 4. Identify funding needs and sources 5. Align policies and programs 6. Measure system change and performance
The Toolkit outlines key components in support of the elements that are consistent with the focus of this plan, and which are predicated on the following: Understand Each Other’s Programs
• Understand each other’s specific goals, resources, and program performance measures and requirements.
• Conduct a service/resource mapping session. Many of the participating organizations and agencies are trying to achieve similar objectives, such as strengthening the local economy; however, they measure their progress in different ways. By understanding the core elements of each partner’s work, the leadership team can develop a systemic framework that can complement everyone’s goals.
Understand Career Pathways • Make sure all partners understand the big picture of developing a career pathways
system. Partners adopt a shared definition of career pathways and key related concepts to embed them into their own strategic plans/goals/strategies and into new and existing policies to support career pathways.

182
Focus on Mission • Reflect the mission in all career pathways materials and constantly remind partners
that the success of the career pathways system depends on the participant outcomes and how well they align with employer demands.
Communicate Expectations • Clearly communicate expectations of each of the participating partners while also
acknowledging the value of their contribution to the overall effort. Partners need to realize the importance and impact of their contributions.
Use Performance Data • Use performance data to demonstrate progress and impact. This will also support
partner buy-in and reinforce continued engagement over time. When the team regularly reviews data and compares itself to benchmarks, partners can make course corrections and are clear that their contributions are adding value.
Each staff member of the ARIZONA@WORK Pinal county workforce delivery system will ge expected to apply the career pathways strategies. Core partner staff will engage in intensive training so they are aware of the current employment opportunities in the county and the pathways to employment within those industries, including what is defined as “non-traditional” employment opportunities. They will be able to clearly communicate to job seekers these opportunities and refer them to the services that will be able to create a pathway plan (i.e., Career Plan/Individual Employment Plan/Individual Service Strategy) to outline the roadmap to economic independence. Aligning with local business attraction and retention efforts, ARIZONA@WORK Pinal County will focus its energies in educating participants on the employment opportunities that are available within identified in-demand industries, as well as prepare for forecasted targeted industries/occupations. It will be critical to have training programs on the ETPL that sync with these industries and their associated occupations. Engaging training providers to align with economic development efforts will lead to the creation of a talent pipeline. The timing of training program availability and the length of such programs must be developed with employer input; through this input, ARIZONA@WORK Pinal County will be able to produce a ready and able workforce to meet the employer’s needs exactly when needed and not produce a workforce that is developed too late or too early to meet the real-time need of business. Training services will be offered to all eligible participants. The menu of training services offered include: Occupational Skills Training funded through individual training accounts (ITA’s) and
listed on the Eligible Training Provider List On-the-Job Training (OJT) Programs that combine workplace training with related instructions

183
Skill upgrading and retraining Adult education and literacy activities when integrated with other training services Customized training Registered apprenticeship programs
All adults and dislocated workers will be registered and enrolled in the Arizona Job Connection (AJC) and determined eligible for program services prior to receiving training assistance. Determining the best mix of training services will be unique to each individual’s needs. In order to determine the need for training services for qualified individuals, the Career Planners will conduct an interview to determine the career aspirations and match those against assessment results. The conversation with the Career Planner is critical in that it creates the major segment of the blueprint for success of the individual as part of the career plan. The discussion will include an evaluation as to how, through the career services, the individual is unlikely or unable to obtain or retain employment, that leads to economic self-sufficiency or wages comparable to or higher than wages from previous employment. Based on information gathered from this interview and evaluation, the Career Planner will make a determination as to the need for training services in order to position the individual to obtain or retain employment. The determination will include an assessment of the skills and qualifications the individual possesses to successfully participate in the selected training program. Training will be provided to Career Planners to ensure they are comfortable in navigating what can be a delicate conversation; depending on an individual’s career aspirations, training may be denied if it does not meet stated criteria. Identifying in-demand occupations, in which employment opportunities exist or are projected to exist at the time training is completed in contrast to a participant’s interest in occupations that show no near-term promise of employment in Pinal County, will be factors in considering the approval of an ITA. Consultations with a Career Planner will be documented in the participant’s file and include at a minimum an evaluation of the following: Participant’s assessment results to determine if his/ her skills are sufficient to meet the
skills needed to successfully complete a selected training program; Program prerequisites; Availability of training funds; Cost of the training program; Comparison of training programs Availability of jobs in the local job market and the minimum entry wage for related
occupations. Jobs must be in in-demand occupations or industries in the local area.

184
Funding for training is limited to participants who are unable to obtain grant assistance from other sources or who require assistance beyond what is available from other sources. The Adult, Dislocated Worker and Youth Program participants who have been identified as candidates to receive training services are required to apply for a Pell Grant to pay for tuition, and to submit the Pell Grant award or denial letter for each semester they attend approved training. An individual may enroll in training while his or her Pell Grant application is being processed. The Youth Program will fund the tuition costs and agree to be reimbursed by the training provider; other sources, such as PPEP, will provide funding for training as well. Career planners generally determine the extent of other training resources used in order to ensure WIOA funds are expended for the best possible training outcome. Central Arizona Valley Institute of Technology (CAVIT), a joint vocational school district that serves several high schools in Pinal County, will provide vocational training for youth, regardless of whether they are currently enrolled in high school, as well as service learning opportunities for ARIZONA@WORK Pinal County Youth participants enrolled in CAVIT programming. Communication with other ARIZONA@WORK Pinal County partner programs will identify whether participants are co-enrolled in any other programs. For those participants who are co-enrolled in various workforce system programs, the cost of training will be leveraged and coordinated to maximize the resources available to ensure successful completion of the targeted training. To ensure that program training funds are awarded only when no other sources of funding are available or the amount available is insufficient in covering the participant’s training costs, Career Planners will assist participants in researching and determining alternative sources of funding that may be available, which may include: State-funded training funds Trade Adjustment Assistance (TAA) Rehabilitation Act funds Temporary Assistance for Needy Families Federal Pell Grant funds Other federal grant funds
In making the determination that Adult, Dislocated Worker or Youth Program funds are required, the full cost of training, including the cost of supportive services and other appropriate costs, will be taken into consideration to ensure the training is completed successfully. Once a training program has been identified on the Eligible Training Provider List (ETPL), the Adult and Dislocated Worker participants and Youth selecting to participate in Occupational Skills Training, will create an Individual Training Account (ITA) Plan. At a minimum, the plan associated with the ITA will contain the following components:

185
Total cost of the training program including tuition, supplies, books, and any fees Dollar amount of additional sources of training funds, including funds from other job
training programs and grants to be applied to the training cost Pell Grant eligibility and the award amount that will be applied to the training cost Duration of the ITA Plan Signatures from the career planner and participant 1. Assessments (i.e., IEP) to document the participant’s ability to complete the training 2. Labor market information relevant to the training to document the reasonable expectation
of high-pay/high-demand employment upon completion of training
ITAs allow customers to choose their preferred training provider based on their training goals. The ITA will be utilized for all training options that are listed on the ETPL, specifically in-demand occupations as defined by the PCWDB. Customers will have access to the ETPL through the Arizona Job Connection. A cap of $3,500 per participant per program year for ITAs has been established. Based upon the levels of funding allocations, the PCWDB in consultation with the contracted provider of Adult and Dislocated Worker Program services, will evaluate the established limits on ITA’s and determine if adjustments must be made to the per participant dollar amount and/or durations of training. In addition to the ITA, supportive services will be offered and provided to the participants to assist in addressing barriers that may inhibit success in participating in the training program. Administrative management must approve the request for funding training assistance. Training services will be directly linked to in-demand occupations in the local area, or in another area to which the adult or dislocated worker receiving such services is willing to relocate. Approval of all ITAs issued for training must be documented in the participant’s case file providing evidence based on real-time labor market information for identifying in-demand occupations. Sources used to validate growth industries and occupations will be projections identified earlier in this plan as well as those provided by the Arizona Office of Economic Opportunity. Targeted and in-demand industries and occupations may change based on economic development activity. Identification of these industries and associated occupations will be monitored regularly by program staff to ensure training is aligned with the needs of the local business community. If the participant meets the criteria for training services, the request will be submitted to the Adult and Dislocated Worker service provider Program Director or Youth Program Director. If the criteria is not met, the training will be denied and subject to revision and appeal. Dislocated Worker, Adult, and Youth programs’ participants will receive, and sign, an acknowledgement of understanding of the ARIZONA@WORK Pinal County complaint procedure during the program enrollment process. The “Alleged Violation of The Requirements

186
of Title I of the Workforce Innovation and Opportunity Act” complaint procedures are also posted at http://www.arizonaatwork.com/pinal-county/plans-policies-lawsfederal-regulations. ELIGIBLE TRAINING PROVIDER LIST All training providers who wish to offer programs with ARIZONA@WORK Pinal County and be able to receive funding via an ITA must be approved and posted on the Eligible Training Provider List (ETPL). Providers must register online at www.azjobconnection.gov (AJC) and have a Federal Employer Identification Number (FEIN). All programs offered by each training provider must be approved by the PCWDB. The PCWDB has designated the Pinal County Workforce Development Director responsible for the approval of providers and programs on the ETPL. The Director or designated staff is responsible for the following: Ensuring distribution and appropriate use of the ETPL through the ARIZONA@WORK
Pinal County system Assisting in determining the initial eligibility of training providers Coordinating with ADES to ensure that approved training provider programs are placed
on the statewide ETPL in a timely manner Monitoring training providers for compliance and performance Reviewing training programs for initial eligibility Collecting performance and cost information and any other required information related
to programs from training providers Executing procedures prescribed by DES to assist in determining the continued eligibility
of all training programs Evaluating performance data of all training providers during the continued eligibility
review to verify that the training programs meet minimum performance standards Consulting with the State ETPL Coordinator in cases where termination of an eligible
provider is considered Ensuring removal of training programs that are found to not meet ETPL requirements and
performance levels and/or are out of compliance with provisions of the WIOA Notifying training providers and the State ETPL Coordinator of denial of programs at the
local level Working with ADES to ensure there are a sufficient number and types of training
services, including eligible training providers with expertise in assisting individuals with disabilities and eligible providers with expertise in assisting adults in need of adult education and literacy activities serving the local area
Giving training providers an opportunity to appeal a denial or termination of eligibility of programs that includes an opportunity for a hearing at the local level, a timely decision, and a right to appeal to ADES

187
Programs are approved for the ETPL through a Consent Agenda at each PCWDB meeting. A summary report of those programs that have been approved, denied and removed from the ETPL will also be provided. Approval of programs is contingent on a number of factors. Consideration is given in relation to the cost of the program including:
1) Cost comparison to other similar programs; 2) Determining if the program is related to an in-demand occupation or sector and is in line
with a career pathway; 3) Verification of the information provided on the training program credential checklist and
determination if the program results in a recognized credential; 4) Verification of minimum wage information as well as verification that all of the program
information is complete in AJC; and 5) Identification of any corrections needing to be made by the training provider prior to
approval.
Determination will be made utilizing the “Training Program Credential Checklist” – ensuring that all criteria meet the local and state standards for inclusion on the ETPL. Recommendations for approval of initial eligibility of providers will be forwarded to the PCWDB for final approval as described above. Pinal County adheres to state policies in determining the subsequent eligibility of all providers. Local policy will reflect the requirement of collecting and analyzing performance data for subsequent program approval. This evaluation will assist in determining if the program meets state standards, and verifying if the related occupation is still in-demand in the local area; if it is determined that the occupation no longer meets ETPL requirements, a recommendation for removal of the program/provider will be forwarded to the State ETPL Coordinator. Local ETPL policy will be revised to reflect alignment with State ETPL policy when appropriate. An appeal process will be outlined to coincide with the requirements and timeframes outlined in the State policy. A challenge faced by Pinal County is the lack of formal training providers other than Central Arizona College (CAC). The ARIZONA@WORK Pinal County LWDB understands the need to develop strong ties with CAC and other providers, including technical schools, in order to ensure that local educational and training programs can be accessed and utilized in order to meet the needs of employers in the area, leading to the successful delivery of a trained workforce supporting local business development. YOUTH WORKFORCE ACTIVITIES The ARIZONA@WORK Pinal County Youth Program provides a comprehensive array of high-quality services, including career exploration and guidance, continued support of educational attainment, and training in in-demand industries and occupations. The program’s goal is for the youth to obtain employment within their career pathway or to enroll in post-secondary education or a registered apprenticeship prior to the end of participation. The Youth Program provides

188
services to In-School-Youth and Out-of-School Youth with barriers, with a special focus on supporting the educational and career success of Out-of-School Youth by accomplishing outreach and recruitment, intake and eligibility, determination, assessment, development of an individual service strategy, case management, and follow- up services. The Youth Program prepares participants to meet education and career goals and will provide:
• Preparation for postsecondary education and training opportunities, including registered apprenticeships
• Strong linkages between academic instruction and occupational education • Preparation for unsubsidized employment opportunities along career pathways; and • Strong connections to employers, including small employers, in-demand industry sectors,
and occupations of the local and regional labor markets To enhance access to CAC’s programs and services, the college currently maintains five campuses and two centers throughout Pinal County. One full-time career planner is located at the CAC Casa Grande Center to provide coverage to the southern part of Pinal County. One full-time career navigator/planner has an office at the Superstition Mountain Campus, located in Apache Junction. This placement enables the project to provide services in northern part of Pinal County. One full time career planner covers all participants in follow up and acts as the youth program Business Services liaison. All of CAC’s campuses provide several facilities the project will be able to use and access, including and not limited to community rooms, classrooms, libraries, laboratories for student learning, student cafeterias, and meeting rooms. The project director and program assistant will be located at the Superstition Mountain Campus. All of CAC’s facilities are compliant with the Americans with Disabilities Act and are connected by an ITV system. The ARIZONA@WORK Pinal County Job Center is open 8:00 a.m. to 5:00 p.m., Monday through Friday. It is closed on statutory holidays. Facilities owned and operated by CAC are open 8:00 a.m. to 6:00 p.m., Monday through Thursday. Use of facilities such as community rooms and classrooms may be scheduled during the evenings and weekends. Equipment available to the project includes CAC’s Interactive Television System (ITV), which links every CAC campus and center with nearly all Pinal County high schools and Arizona State University. Other available equipment owned by CAC includes projectors, classroom equipment for specific disciplines or classes, and computer labs. In Pinal County, many parents struggle to obtain the basic resources required to nurture children with high hopes, ambition, and dreams – the very things necessary for a good future. According to an U.S. Census Bureau estimate, Pinal County’s poverty rate in 2014 was 15.6 percent and 15.9 percent families with children under age 18 live in poverty. The poverty rate on the Gila River Indian Community is 48 percent.

189
According to the Arizona Children’s Action Alliance 2019 KidsCount County Profile, Pinal County is tied for third in Arizona for the highest percentage (15%) of 16- to 19-year-olds not in school or working. To help their children grow into successful, productive adults, most parents need jobs that pay a living wage, stable housing, and affordable childcare and healthcare. Arizona has one of the highest child poverty rates in the country, with Pinal County having particularly high rates of economic deprivation for children. This is demonstrated by the high percentage of Pinal County high school children being eligible for the income-based federal free and reduced lunch program.
SELECTED PINAL COUNTY HIGH SCHOOLS
Percentage of children for free or reduced-price lunches for School Year 2019-20. Figures are from October of the current school year, as reported by the School Food Authority (SFA) as of February 2020. Statewide average eligibility is 56%.
(Source: School Reports, Arizona Department of Education, http://www.azed.gov/hns/frp/)
School Percent Eligible
Apache Junction High School 44%
Casa Grande Union High School 52%
Casa Grande Vista Grande High School 61%
Combs High School 36%
Coolidge High School 68%
Florence High School 49%
Maricopa High School 46%
Poston Butte High School 49%
San Manuel High School 63%
San Tan Foothills High School 53%
Santa Cruz Valley Union High School 86%
Superior Junior/High School 57%
Source: School Reports, Arizona Department of Education, 2020 Pinal County has one of the highest teenage pregnancy rates in America. In Pinal County during 2013, there were 31.5 live births per 1,000 females aged 15-19 years. According to the Centers for Disease Control, the national teen birth rate for 2013 was 26.6 births for every 1,000.

190
Research demonstrates that becoming a mother in her teens significantly reduces a woman’s chances for obtaining the skills and qualifications needed for a reasonable wage, diminishes her employment prospects, and increases her likelihood of living her life in poverty. Approximately 40 percent of teen moms who give birth at age 17 or earlier finish high school. Girls who give birth at age 17 or younger can expect to earn $28,000 less in the subsequent 15 years after the birth than if they had delayed motherhood until 20 or 21. Only about 23 percent of the younger mothers go on to earn a GED. Moreover, children of teenage parents are more likely to become teenage parents themselves, thus perpetuating the cycle of poverty begun by a teenage birth. Values and Principles - The project design addresses the values and principles to meet the Youth Program Responsibility - ARIZONA@WORK Pinal County Youth participants assist in the development of their Individual Service Strategy plan and agree to accomplish the established goals and will actively participate in their program(s). They understand that their plan can be updated periodically or modified to meet changing needs and that the development of their plan does not establish a right to bring action to obtain these services. The youth participants also understand that supportive services are decided by the Youth Provider and other administrators on an individual need basis and that a lack of commitment, participation, or follow-through on their part may result in being exited from the youth program. They also understand that continued education is contingent upon successful completion of coursework of a “C” or better in all classes and they will need to provide progress report/grades every semester and agree to follow up service for one year after exiting the program. Strategically Meeting Needs of the Community – With support from a wide array of community partners, Central Arizona College continues to provide services to support in-school and out-of-school youth development within Pinal County and the adjacent Gila River Indian Community. This project targets in-school and out-of-school youth and the sub-groups of general, offenders, pregnant and parenting, high school dropout, and basic skills deficient youth. According to the Annie E Casey Foundation, the number of children living in poverty in Pinal County more than doubled from 44,997 in 2010 to 98,431 in 2014. The youth program provides linkages to the Pinal County communities and ARIZONA@WORK partners to:
a. Ensure that parents, youth participants, and members of the community with experience in youth programs are involved in the design and implementation of the WIOA Title I B Youth Program.
b. Make opportunities available to individuals who have successfully participated in the youth program to volunteer, and provide assistance to participants in the form of mentoring, tutoring and/or other services.
c. Provide appropriate connections between the youth program and the One-Stop system that will foster participation with local youth and include: 1. Local area justice and law enforcement officials 2. Local public housing authorities 3. Job Corps representatives

191
4. Representatives of other area youth initiatives, including those that serve the homeless and private youth initiatives
5. Coordination and provision of youth services 6. Linkages to the job market and employers 7. Access for eligible youth to resources, information and services 8. Other activities designed to meet the purposes of the youth program and youth
services
High School Dropout - Arizona has one of the worst high school dropout rates in the nation, and often has the dubious distinction of being bottom of state comparisons of these rates. In 2014-2015, the Arizona Department of Education reported that Arizona’s high school dropout rate was 3.46 percent. Pinal County’s high school dropout rate of 6.3 percent almost doubles Arizona’s. Moreover, in Pinal County 15.3 percent of all Native American high school students dropped out during 2015. Additionally, in Pinal County, 13 percent of 16 to 19-year old’s are not enrolled in school and do not have a high school diploma. Pinal County’s graduation rate of 73 percent is below both Arizona’s graduate rate (74.7 percent) and the nation’s graduation rate (78.2 percent). Basic Skills Deficient - “Basic Skills Deficient” individuals compute or solve problems, read, write, or speak English at or below the ninth grade level; or are unable to compute or solve problems, read, write, or speak English at a level necessary to function on the job, in the individual’s family, or in society. As noted, in its research study The Gathering Storm, the National Science Council expresses alarm about America’s economic competitiveness being eroded by American youth who leave high school without the basic skills required to contribute to the economy. According to the National Assessment of Adult Literacy (2003), almost 19 percent of Pinal County residents are functionally illiterate. Every year, CAC experiences a large influx of new students who lack the basic academic skills required for college. For example, at CAC, 85 percent of the incoming students must take developmental level math courses and 55 percent must take developmental reading classes. The lack of basic academic skills contributes to approximately 40 percent of first year students not returning to the college for their second year. Clearly, many and perhaps most of the region’s youth leave high school with significant deficits in their basic skills. Outreach and Recruitment – A Career Navigator and four full-time career planners are led by an experienced project director to conduct outreach and recruitment activities. Although this outreach effort is directed towards the entire region as a whole, it is coordinated to focus on communities of highest need at scheduled timeframes during the program year. For example, communities such as Coolidge, Eloy, Florence, Superior, Ray, Kearny, Dudleyville, Mammoth, San Manuel, and Oracle have particularly high rates of unemployment and poverty, and will have large populations of WIOA eligible youth with acute needs. Project staff will actively encourage individual referrals from human service providers, training centers, nonprofit agencies, faith-based organizations, probation, foster care, and local schools.

192
To support this outreach, the staff ensure that these organizations are aware of the project and its eligibility process. This strategy results in an increased applicant pool and the ability to coordinate services, share assessment information, and leverage resources once young people enroll in the program. The Youth Program Career Planners will coordinate with the ARIZONA@WORK Pinal County Business Services team to provide outreach to employers countywide, while also administering the Work Experience component for both the youth and the training providers. Employers will also be trained on Adult Mentoring activities to assist youth with their program of study or employment activities. Apache Junction High School and Coolidge High School will participate in and help facilitate outreach activities that increase students’ awareness about the benefits of participating in the Youth Program. The school counselors will be able to refer eligible students who have dropped out to the program. Disabled youth - The ARIZONA@WORK Youth Program continues to partner with Arizona Department of Economic Security, Vocational Rehabilitation programs for disabled individuals and continues to work closely with the CAC Disability Resources Director for students in training programs. Some of the youth participants have been dual enrolled in both the youth program and Vocational Rehabilitation in the past and the partnership works very well to benefit the youth participants that needs assistance and support. Youth with disabilities receive extensive pre-employment transition services so they can successfully obtain competitive integrated employment. Young people with disabilities are highly eligible for youth services and the program makes accommodations for those who need them. All youth with disabilities, ages 16 -24 who are not attending school, are eligible for out-of-school services. Youth with disabilities up to age of 21 are eligible for in-school services if they are low-income or meet other eligibility criteria. Section 188 of WIOA is clear that programs funded under WIOA must be fully accessible to individuals with disabilities, and that people with disabilities are entitled to reasonable accommodations and modifications that allow them to fully participate in WIOA funded programs. Orientation for Participants - The career planners provide an orientation to all interested youth, to ensure potential applicants understand the program’s benefits, policies, service options and expectations regarding joint responsibility, attitude, behavior, and commitment. The eligibility determination process, application, and required documentation (proof of age, citizenship/registered alien status, address, income, etc.) are explained. The youth and/or parent/caregiver, as appropriate, are apprised of the procedures for scheduling eligibility appointments. The career planners also maintain a list of potential applicants and follow up with the youth and the parent/guardian (for youth under 18 years of age) to determine additional services that may be needed to ensure completion of the application process.

193
Eligibility is determined prior to providing services to the participant, to comply with WIOA Regulations. Youth must be low income as defined by WIOA Regulations and between the ages of 14 and 21 at the time of enrollment if they are in school. Out of school youth, ages 16 to 24, will qualify based on WIOA Regulations and at least 95 percent of registered participants would be economically disadvantaged (unless they have a qualifying barrier to education or employment); however, up to five percent of participants who do not meet the low-income eligibility requirement can be determined eligible if they have at least one of the barriers prescribed in WIOA regulations. Registration/Enrollment - As per WIOA requirements, potential participants provide eligibility information prior to enrolling in the program. Thus, the project staff meet to review the information provided prior to enrollment. During the meetings, they determine whether each potential client is ready to make the commitment to actively participate in and benefit from the ARIZONA@WORK Pinal County Youth Program. If a youth is ineligible for participating in the program or is not interested in participating, the career planners refer the person to a partnering agency or to another organization that can provide the support needed. Assessment – The career planners conduct careful assessments of each youth participant. A continuous process during the participant’s involvement in the Youth program, the assessment evaluates progress, performs a goal setting and attainment process, and documents outcomes. “Objective Assessment” is the first activity following a youth’s enrollment in the program. This client-centered process identifies the participant’s interests, aptitudes, goals, skills, work/education history, motivation, barriers, life circumstances, and supportive service needs. Objective Assessment is typically completed at the time of enrollment. The assessment tool is the Test of Adult Basic Education (TABE) for reading, math and language and the O*NET Career Interest Inventory. The ARIZONA@WORK Pinal County Youth Program offers the TABE Online assessment through a partnership with the CAC Adult Education program. Test results are shared between partners for out of school youth who are attending GED (HSE) classes and therefore do not duplicate services. ARIZONA@WORK Pinal County Youth program purchased laptops that have career assessment software loaded on them for students to use for online assessments anywhere in Pinal County. The career planners can proctor these assessments by going to where the participants are located, and this will help with transportation difficulties. Career Planning is coordinated with ARIZONA@WORK Pinal County partners and other stakeholders by outreach, recruitment and retention activities accomplished by the Youth Program Career Planners and the Project director. Most of the partner programs have similar career planning goals and requirements for participants, students, and clients. Information about job fairs, community activities and workshops provided by the partners are shared through community connections and distributed to Career Planners and participants.

194
The youth are encouraged to attend as many opportunities, as possible, and transportation assistance is provided, as needed so they can attend. Many of the out-of-school youth attend the HSE/GED classes at Central Arizona College on various campuses around Pinal County. For example, assessment testing results are shared to discourage duplication of services and the TABE testing costs are incurred by CAC’s Adult Education program. Also, participants who are disabled can be dual enrolled with Vocational Rehabilitation to provide seamless service to the youth. Ongoing communication ensures continuity of service provision. Career Exploration - A primary purpose of the ARIZONA@WORK Pinal County Youth Program is to assist youth in finding entry-level employment and advance in the workforce through education and training. Finding good jobs in many of our region’s local communities is particularly challenging. However, CAC provides certificate and degree programs that prepare students for careers in the regional economy’s growth sectors, which include healthcare, alternative energy, and highway construction. Guidance counselors/advisors working with the Arizona career and business system, local schools, and CAC will be able to assist participants with developing career plans. In addition, the ARIZONA@WORK Pinal County Youth Program’s career planners will be able to provide career guidance.
This ARIZONA@WORK Pinal County Youth Program could refer youth to training and education that prepares them for work in emerging in demand career fields. CAC has access to the Arizona Career Information System, O*NET and GCFLearnFree.org, which are online tools that allows students and community members to explore potential careers. Students can enter a keyword of whatever career suits their interest and then can quickly learn about employment prospects in the field, job opportunities, income potential, and the education and training it would take to accomplish their goals. Career Path for Out of School Youth - A primary purpose of the ARIZONA@WORK Pinal County Youth Program is to assist youth to find entry-level employment and advance in the workforce through education and training. Finding good jobs in many of our region’s local communities is particularly challenging. However, CAC provides certificate and degree programs that prepare students for careers in the regional economy’s growth sectors, which include healthcare, alternative energy, and highway construction, for example. Employment guidance counselors/advisors working with the Arizona career and business system, local schools, and the college will be able to assist participants with developing career plans. In addition, the ARIZONA@WORK Pinal County Youth Program’s career planners provide career guidance. Youth Program staff continue to engage in the planning and implementation of the Arizona Career Readiness Credential. Once implemented, Career Planners assist participants is accessing the Career Readiness Courseware that will assist participants in achieving the Arizona Career Readiness Credential in the career field of their choosing, by providing guidance in navigating

195
the credentialing process and ensuring that program supports are in place to allow for successful employment preparatory outcomes. Skill Development - All enrolled youth receive training in leadership development, to include community service and peer-centered activities that encourage responsibility and other positive social and civic behaviors. Assistance is given to youth participants in securing better paying jobs, career pathway development and further education. Goal Setting - The career planners use SMART (Specific, Measurable, Achievable, Relevant, Time) goals to help youth participants set realistic and manageable goals for education and employment:
• What is specific about the goal? • Is the goal measurable? (How will you know the goal has been achieved?) • Is the goal achievable? • Is the goal relevant to performance expectations or professional development? • Is the goal time-bound? (How often will this task be done? Or, by when will this goal be
accomplished?)
Setting goals help youth identify roadblocks that they may face on their way towards achieving their goals by encouraging them to take advantage of resources, transportation assistance, supportive services, time management, and a safe environment to be able to make good choices. The goals the youth set allow them to progress and reach their individual career pathways. The career planners provide follow up services to youth who have completed the program. The follow-up process will monitor the participant’s transition to employment and/or further education and provide assistance when needed. Staff provides follow up services for at least one year after participants exit the program. The career planners provide follow-up and retention activities to ensure youth are provided with the necessary supports and services following program completion and transition to post-exit status. The requirement for a minimum of 12 months of follow-up services can contribute to the continued growth and development of the participant, and are consistent with youth development principles: improvement of academic achievement, support to complete post-secondary education, preparation for successful employment, and access to necessary supportive services to ensure successful outcomes. The identification of barriers prohibiting self-reliance and productive citizenship are central to a comprehensive follow-up strategy. Additionally, maximizing program performance must focus on retention/post-exit strategies, as status during the 2nd and 4th quarters following program exit is key to core youth performance measures. Staff maintains responsibility for providing follow-up services to participants, as well as maintaining regular contact with participants, supervisors, and/or training/education providers to monitor the youths’ status, identify and provide necessary supports, and intervene as needed.

196
Staff performs scheduled contact attempts and the retrieval of current status back up documentation. In addition, program leadership coordinates follow-up activities to enhance post-exit services, thus resulting in increased positive retention-related performance. Individual Service Strategy (ISS) – This process is both the final step in the assessment and the initial step in plotting the participant’s path in relation to the proposed program design. The career planner and the participant develop a plan based on information gathered during assessment. The ISS describes the youth’s commitment to the program and estimates how long he or she will need to participate. The ISS also strengthens the ARIZONA@WORK Pinal County Youth program accountability, by justifying and recording decisions made about the participant’s training, services, and referral to other programs and/or supportive services. The individual service strategy plan also provides:
• Activities leading to the attainment of a secondary school diploma or its recognized equivalent, or a recognized postsecondary credential
• Preparation for postsecondary educational and training opportunities • Strong linkages between academic instruction and occupational education that lead to the
attainment of recognized postsecondary credentials • Preparation for unsubsidized employment opportunities, in appropriate cases; and • Effective connections to employers, including small employers, in in-demand industry
sectors and occupations of local and regional labor markets.
Communication is critical to retaining and engaging youth clients. ARIZONA@WORK Pinal County Youth staff will contact participants between appointments - to keep the lines of communication open and to develop a relationship that encourages future participation. Regular contact occurs not only during assessment and enrollment activities, but also throughout participation in the program. To develop the ISS, each youth will meet with his/her assigned career planner to establish goals based on assessment results, develop a strategy to meet those goals, and understand the program’s specific steps, supports, actions, and expectations. The ISS planning efforts will result in an appropriate mix and sequence of training and services to address barriers and training needs. The career planner and the participant review the ISS quarterly - to ensure adequate progress and to identify and review any changing needs or circumstances. As the youth receives the services listed in the ISS, ongoing assessment will identify gains and improvements in academic levels, skills, and developmental needs. If there are gains and improvements, the ISS will be updated to meet the youth’s evolving needs, ensuring that ongoing services remain appropriate to the participant. The program will develop service strategies that identify career pathways that include employment and education goals, appropriate achievement objectives, and appropriate services based on the objective assessment results.

197
Work Experience – Work experiences are planned, structured learning experiences that take place in a workplace for a limited period of time. This would also make adult mentoring available, which would include a youth being matched with an adult mentor, an employer, or an employee of an employer. These adult mentors can offer face to face guidance, support, and encouragement to develop the competence and character of the youth participant. CAC will link the Individual Service Strategy to the performance indicators and include connections to employers of all types, especially in in-demand industry sectors and occupations by provision of detailed paid or unpaid Work Experience opportunities for each participant that is interested. These employers will also be trained to be Adult Mentors and the youth placed at the work site will be trained on workplace readiness skills prior to beginning employment. Work experiences are planned, structured learning experiences that take place in a workplace for a limited amount of time. This would also make adult mentoring available, which would include a youth being matched with an adult mentor, an employer, or an employee of an employer. These adult mentors can offer face to face guidance, support, and encouragement to develop the competence and character of the youth participant. Youth participants will be entered into any appropriate pre-apprenticeship or apprenticeship programs that fit their training or employment plan and goals. They can also be co-enrolled into the Adult program, if that allows them to take advantage of greater opportunities than the youth program alone can provide. Pre-apprenticeship programs are available at various community colleges in the Phoenix and Tucson areas, which are within commuting distance from Pinal County, and some state agencies, cities, and towns. Apprenticeships are also available with the skills trade departments at some of the state universities and community colleges, trades associations, Native American governments, cities, utilities, federal facilities, and dozens of public and private companies throughout Arizona. The career planner helps youth to research and participate in pre-apprenticeship and apprenticeship programs as appropriate. Support Services - Effective case management plays a significant role in the provision of comprehensive guidance counseling, follow-up and supportive services. Through interaction with the participant, the career planner identifies issues and challenges that may impede progress and success. These may include personal crises, basic needs (e.g. food, clothing, shelter,) legal issues, childcare, etc. Participants will be linked with appropriate professionals and/or supporting resources specific to individual need. Staff will be responsible for documenting the delivery of services, progress toward goals, and goal attainment. This is accomplished through ISS development and revision as well as case notes maintained online through the ARIZONA@WORK Pinal County Youth Career Planning System and the participant’s digital file. Follow-Up and Retention Activities provide 12-month follow-up and retention activities to ensure youth are provided with the necessary support and services following program completion and transition to post-exit status. Such activities include;

198
• Work with participants to identify barriers prohibiting self-reliance and productive citizenship. Employ required retention/post-exit strategies.
• Maintain regular contact with participants, supervisors, and/or training/education providers to monitor the youths’ status, identify and provide necessary supports, and intervene as needed.
• Perform scheduled quarterly contact attempts and the retrieval of current status back up documentation.
• Coordinate follow-up activities to enhance post-exit services, to increase retention-related performance.
The project staff meet formally monthly and on an as-needed basis to provide updates on the progress of the project and to identify any areas of concern. CAC’s budget officer, grants accountant, and other staff attend these meetings as needed. After creating a yearly calendar that contains performance benchmarks for each career planner, the project director regularly reviews and monitors the activities corresponding to the benchmarks. All staff are evaluated during their probation period and on a two-year cycle subsequently. As per the college’s policy on performance evaluation, the staff will be evaluated in the areas of Knowledge of Work, Quality of Work, Communications, Initiative, Planning and Organization, Decision Making, Teamwork and Interpersonal Skills, Leadership, Supervision and Coaching, Budget Responsibility, and Dependability. Staff also meet annually with the project director to discuss goals for the year and then quarterly to have conversations on what is working and what can be improved. These meetings are also meant to acknowledge the employee’s contribution to the program and reward accomplishments. In this capacity, the Career Planners will be provided with onboarding and ongoing training to ensure they are well versed in the overall ARIZONA@WORK Pinal County structure and operational goals. They will provide linkages and referral to supportive services, interaction with classroom and on-site training staff, and other professionals or family members having influence with the youth. In addition, they will also provide or source comprehensive guidance counseling, follow-up and supportive services. Through interaction with the participant, career planners will identify issues and challenges that may impede progress and success. Career Planners facilitate study skills, work readiness workshops, and organize other workshops related to the Youth Program 14 Elements, as required. Youth program staff will engage with out-of-school youth through information sharing between community agencies, schools, and organizations, as well as print and electronic media campaigns. Career Planners will attend any job or reengagement fairs put on by school districts in order to access youth who are currently not attending school or who have dropped out. Career Planners will reach out to agencies, such as TANF, community and faith-based organizations, probation departments, foster care, employers, and community clubs to assist with finding out-of-school youth.

199
Equipment available to the program includes CAC’s Interactive Television System (ITV), which links every CAC campus and center with nearly all Pinal County high schools and Arizona State University. Other available equipment owned by CAC includes projectors, classroom equipment for specific disciplines or classes, and computer labs. Project staff will actively encourage individual referrals from human service providers, training centers, nonprofit agencies, faith-based organizations, probation, and local schools. To support this outreach effort, staff will ensure that these organizations are aware of the ARIZONA@WORK Pinal County Youth Program and its eligibility process. This strategy will result in an increased applicant pool and the ability to coordinate services, share assessment information, and leverage resources once young people enroll in the program. Academic Gains for Youth - Education is offered concurrently with, and in the same context as, workforce preparation activities, basic academic skills, and hands-on training for a specific occupation, occupational cluster, financial literacy, entrepreneurial skills, and/or career pathway. Basic skills deficient youth are post-tested to make sure they are improving with educational gains. Year Round Services - All of the 14 elements service elements are available year round: Tutoring, study skills training, instruction and evidence based dropout prevention and recovery strategies that lead to completion of the requirements of secondary school diploma or High School Equivalency (HSE), including certificate of attendance or similar documentation for individuals with disabilities, or a recognized postsecondary credential; alternative high school services, or drop out services; occupational Skills training; paid and unpaid work experiences. Long-Term Support for Youth - Adult Mentoring is provided for the duration of 12 months and occurs during participation and during follow-up services after exit from the program. Youth could then be referred to agencies that could continue to provide support, services, guidance and counseling. The youth program would coordinate with the organization it refers a participant to in order to ensure the continuity of service. Accessibility - The Youth Program administers assessments to individuals with disabilities who will be provided appropriate accommodations according to the guidelines associated with the assessment tools used to determine functioning levels, Section 188 of WIOA, and Pinal County Workforce Development policy. The following tagline is used on all documentation and marketing materials: Equal Opportunity Employer / Program - Auxiliary aids and services are available upon request to individuals with disabilities. Accountability - ARIZONA@WORK Pinal County Youth Program ensures all youth meet the eligibility criteria for the youth program and receive information about the full array of services available through the ARIZONA@WORK partners, and eligible youth service providers, as well as referrals to appropriate training and educational programs with the capacity to serve the applicant either on a sequential or concurrent basis.

200
The youth program tracks the program funds spent on paid and unpaid work experiences, including wages and staff costs for the development and management of work experiences, and reports such expenditures as part of the local youth financial report. The program also tracks the percentage of funds spent on work experiences by calculating the total local area youth funds expended on work experience rather than by calculating the funds expended separately for In-School Youth and Out-of-School Youth. All federal, state, and county reports required are submitted in a timely manner. Transactions relating to Youth program-provided activities and services are entered or updated in Arizona Job Connection, the online ARIZONA@WORK database, within 15 calendar days from the date an activity or service is provided. Drug and Alcohol Abuse - Drug and alcohol abuse are recognized barriers for at-risk youth. Youth with drug and alcohol abuse may have additional issues that underlie their substance abuse, such as being homeless or transient, abused sexually, physically or emotionally, mentally ill, neglected at home or live in stressful family environments, lacking social or emotional supports, and negative peer pressure. Youth who struggle with these issues receive support and guidance from the career planners and are referred to resources in the community that assist them with a needs-assessment and counseling. Referrals to counseling appropriate to the needs of the individual are given to participants and partnerships with local resources, such as Horizon Health and Wellness, the Casa Grande Alliance, Pinal Hispanic Council, and other counseling agencies. Financial Management - Many online resources can benefit the training of youth in financial management, including Smart About Money.org, CashCourse.org, AZCareerInformationSystem.org and GCFLearnFree.org. Also, several banks and the FDIC have financial literacy packets that can be given to youth to take home and use as a reference when they have questions. The Youth Program assists participants in learning to create budgets, initiate checking and savings accounts at banks, and make informed financial decisions. The career planners support participants in learning how to effectively manage spending, credit, and debt, including student loans, consumer credit, and credit cards. The career planners also support a participant’s ability to understand, evaluate, and compare financial products, and services. Ensuring valid data - Youth Program data remains valid through the ongoing and continued utilization of the ARIZONA@WORK Job Connection online database. All Career Planners are registered in the system, are trained annually with data security and user information updates and have current fingerprint clearance cards. All youth program staff are trained on uploading required documentation into the database system. Reports are generated to check for missing values and to maintain positive performance measures and outcomes. Progress, Performance and Performance Tracking - Youth training is related to in-demand occupations or career pathways identified in the state and local plans and a recognized credential is awarded upon the successful completion of a training program. Participants complete a work

201
experience related to their career choice or to give them needed workplace skills and may be employed by the time they exit the program. CAC understands that the required performance measures are negotiated by the PCWDB for recipients of WIOA funds. Most of these measures are determined for the clients exiting the program, not for the entire cohort of participants. For example, youth receiving a credential, employment, retention of employment, and returning to school are the core performance measures for both in school and out of school youth. CAC anticipates meeting or exceeding all mandated core performance measures. Youth Program staff track performance through utilization of reports in Arizona Job Connection and keeps accurate records of all participant activities to ensure the negotiated targets are being met or exceeded. The ARIZONA@WORK Pinal County Youth program continues to work closely with the Pinal County Workforce Development Program Manager to exit the appropriate participants after completion of programs of study or employment activities to ensure performance measures are met or exceeded. The youth program tracks the program funds spent on paid and unpaid work experiences, including wages and staff costs for the development and management of work experiences, and reports such expenditures as part of the local WIOA youth financial report. The program also tracks the percentage of funds spent on work experiences by calculating the total local area youth funds expended on work experience. All federal, state, and county reports required would be submitted in a timely manner. Transactions relating to Youth program-provided activities and services are entered or updated in AJC within 15 calendar days from the date an activity or service is provided. Expending Funds - All out of school youth are offered the opportunity to participate in paid work experience, even if they are in a training program. The participant’s employment hours are adjusted to fit their schedule and ideally, they will be placed in a work environment that coincides with their career plans ongoing through the year. 20 percent of non-administrative local area funds are spent on work experience. Youth work experiences have an academic and occupational education component and may include the following four categories; summer employment opportunities and other employment opportunities available throughout the school year; pre-apprenticeship programs; internships and job shadowing; and on-the-job training opportunities. This would include other youth serving organizations and agencies. Youth program staff re-engage out of school youth by information sharing between schools as well as print and electronic media campaigns. Career Planners attend any job or re-engagement fairs put on by school districts in order to access youth who are currently not attending school or who have dropped out, as well as the current Memorandum of Agreement to protect information while sharing information with the 14 School Districts in Pinal County. Career Planners also reach out to agencies, such as, Temporary Assistance for Needy Families (TANF), community and faith-based organizations, probation departments, foster care, employers, and community

202
clubs to assist with finding out-of-school youth. These participants that are enrolled are offered work experience and training programs to ensure that a minimum of 75% of youth grant funds are expended on out-of-school youth. Partnerships and Program Elements - CAC’s work with the partners embraces a three-stage collaboration model, recognizing that collaborative efforts often represent a point on a continuum of linking, partnering, and coordination. CAC directs WIOA resources to provide comprehensive services while organizing existing opportunities and supports available from its collaborative partners. This ensures an economy of scale, fewer layers, centralized management, and successful participant and program outcomes. This project involves a high degree of collaboration with education, business, and community partners. CAC has well-established relationships with schools, community-based organizations, human service agencies, and faith-based organizations, other community colleges, and business/employers. For example, CAC is a member of several of the Chambers of Commerce organizations located in our regions. The college will draw on Chamber services and membership to gain additional business support for the project, including hiring students for subsidized employment and providing information about training and education requirements for the local workforce. CAC has developed an extensive partnership to support this project, including but not limited to Apache Junction High School, Central Arizona Valley Institute of Technology, Coolidge High School, Coolidge Youth Coalition, Pinal Hispanic Council, Pinal County Juvenile Court Services, and Seeds of Hope. CAC can expand these partnerships during the project period and will also partner with many businesses for work experience. CAC has well-established working relationships with schools, community-based organizations, human service agencies, local government, faith-based organizations, other community colleges, and business/employers. CAC communicates frequently with the staff and representatives of these organizations. CAC owns the Casa Grande Center, which houses the Pinal County Comprehensive One Stop - the college, the Arizona Department of Economic Security, and Workforce Investment Act Board use this facility jointly. Many CAC employees are on the boards of Pinal County agencies, local city councils, and charitable organizations, either as representatives of the college or in a personal capacity. CAC provides more than 90 certificate and 50 degree programs and has a long history of providing services and educational opportunities to women, minorities, and individuals from disadvantaged backgrounds. CAC has many transfer and articulation agreements with Northern Arizona University, the University of Arizona, and Arizona State University. The three state universities provide educational programming at the Signal Peak Campus. (Element #1)

203
Apache Junction High School and Coolidge High School participate in and help facilitate outreach activities that increase students’ awareness about the benefits of participating in the Youth Program. The school counselors are now able to refer eligible students to the program. (Element #2) ARIZONA@WORK Partners - The partners who work closely with the Youth Program
were selected because they assist youth participants with other services, resources, and guidance. Many of the partners assist with recruitment and retention efforts by referring youth to enroll in the ARIZONA@WORK Pinal County Youth Program. Partners, which include Adult Education, Vocational Rehabilitation, Employment Services, and other youth agencies, are required by the new WIOA legislation to follow all the guidelines and policies in order to remain in compliance. Most of the partners co-locate at the Arizona Business and Career Center and assist with continuity of positive customer service flow through the center.
Central Arizona Valley Institute of Technology (CAVIT) – This joint vocational school district, which serves several high schools in Pinal County, provides vocational training for youth, regardless of whether they are in high school, and service learning opportunities for ARIZONA@WORK Pinal County Youth participants enrolled in CAVIT programming. (Elements 3 & 5)
Seeds of Hope – This faith-based community development organization provides after school programming and summer programming as well as other activities for ARIZONA@WORK Pinal County Youth participants who live in Casa Grande’s West Side neighborhood. Seeds of Hope staff refer youth to the project; and accept referrals from ARIZONA@WORK Pinal County Youth staff for services provided at Seeds of Hope facilities. (Elements 7 & 10)
Coolidge Youth Coalition – This local nonprofit organization staff provides referrals of Coolidge youth to the ARIZONA@WORK Pinal County Youth program staff. Coolidge Youth Coalition provides education programming and other services to a significant number of young single mothers, expecting teens, high school dropouts, and youth with deficiencies in basic academic skills. (Elements 7 & 10)
Pinal Hispanic Council – This behavioral health agency refers WIOA eligible youth to the project. It has also pledged to provide behavioral health services to ARIZONA@WORK Pinal County Youth participants who need this assistance. (Elements 7 & 10)
Coolidge Rotary Club – Members refer Coolidge youth to the project, assist with transporting Coolidge WIOA participants to the CAC campus, and provide Rotary scholarships to ARIZONA@WORK Pinal County Youth from the Coolidge area. (Elements 6, 7 & 10)
Pinal County Juvenile Court Services – The court services help facilitate outreach activities that increase awareness of the program among its clients and their families.

204
Cultural sensitivity is being aware that cultural differences and similarities between people exist without assigning them a value – positive or negative, better or worse, right or wrong. The ARIZONA@WORK Pinal County Youth Program and Central Arizona College practice cultural sensitivity and awareness of/and respect for all parties, which make possible conditions of mutual trust and accurate communication for all concerned individuals. Important relationships between culture/diversity and the workplace require Career Planners to acknowledge and integrate culture-related influences that help shape how individuals, families, groups and communities experience job related activities. Culture refers to the acquired knowledge that groups (an individual as a member of a group) use to interpret life experiences and to generate social behavior. Career Planners are required to learn, understand, acknowledge and integrate into practice the values, beliefs and daily living patterns of diverse cultural and subculture orientations. Participants learn basic concepts of culturally competent workplace skills and begin to develop and expand the awareness, sensitivity, knowledge and skills that constitute culturally competent and meaningful cross-cultural encounters and public relations. They also recognize, acknowledge, and learn to manage interactions between one’s own cultural/subcultural orientation(s) and those of individuals, families and groups, with whom they interact. Best Practices - The above strategies are based on careful research into the best practices for providing services to in-school and out-of-school youth and our own experiences in providing services through our current Youth Program’s project. This research has helped us to avoid ineffective strategies such as one-size-fits-all single-solution programs, assessments that measure only failure and weaknesses, and programs that put young people into the same setting or structure where they struggled before. The research also supports our effort to include effective strategies that will foster the participants’ recruitment, retention, and completion. For example, we have incorporated proactive methods of outreach and recruitment, such as collaborating with existing community and neighborhood organizations that have strong connections with potential participants. Research into the best practices employed by programs to serve out-of-school and at-risk youth show that they are carefully designed to reduce “risk” and to boost resilience. “Risk” can be both a potentially negative state of being and a well-defined point of entry for the delivery of services. In either case, the term risk leads practitioners to consider needs and strategies to foster the well-being of youth. Risk factors exist in various domains, sometimes called key systems (Hawkins, 1985), including the peer group, family, school and community. Risk factors can include individual/peer factors (e.g. friends who engage in problem behavior, family factors (family management problems, family conflict, family history of problem behavior), school factors (such as early academic failure and conduct or attendance problems), and community factors (e.g. availability of drugs, low neighborhood attachment, and severe economic deprivation).

205
Resilient youth “bounce back” from setbacks and challenges. Resilient youth have “assets” that act as protective factors to support and encourage healthy development, and help teens avoid negative behaviors like dropping out of school, using alcohol or other drugs, teen pregnancy, and incarceration. Research of resiliency indicates that even severely at-risk youngsters can develop into confident, competent and caring adults if families, communities and schools define important assets and partner on strategies to promote resiliency. Schools, families and communities that support resilient youth tend to have three common characteristics: caring and supportive relationships, positive and high expectations, and opportunities for meaningful participation.
14 ELEMENTS OF THE YOUTH PROGRAM The following elements will be available to participants of the Youth Program and used to develop a detailed service strategy: ELEMENT #1 Tutoring, study skills training, instruction, and evidence-based dropout prevention and recovery strategies that lead to the completion of the requirements for a secondary school diploma or its recognized equivalent. Tutoring and study skills - Tutoring is available to all youth who indicate a need for additional educational assistance. ARIZONA@WORK Pinal County Youth staff work closely with instructors and tutoring programs within the youth’s educational setting to ensure that the necessary academic support is provided.
• At CAC, tutoring and study skills classes are available to college students and community members as needed.
• Several of the region’s high schools have additional tutoring and study skills programs available for their students
• If on-campus tutoring is unavailable or not complimentary to the needs of the youth, the staff assist in accessing other tutoring services or summer school.
• CAC can refer out of school youth to agencies that provide tutoring assistance to improve basic academic ability or to support G.E.D. (HSE) Preparation. For example, in Casa Grande, the Salvation Army has a computer lab with education software that individuals can use to improve their basic academic skills. Coolidge Youth Coalition has volunteer tutors to help Coolidge youth prepare for the High School Equivalency preparation. Apache Junction Library provides computer labs with educational software to the community.
A study skills program’s benefits include improved writing skills, enhanced reading comprehension, and increased organizational skills. These benefits can result in increased academic performance (as measured by G.P.A. and classroom attendance, for example) and higher rates of student retention and graduation.

206
The following key points are the typical content of a study skills program. Many of these topics are also offered in a Pathways to Success workshop model that is free to the community, students, and staff utilizing the ITV network making these classes available to the entire Pinal County area:
Principles of clear writing
Keeping lists of commonly used facts, tables charts
Thinking skill development
Working on group projects Reviewing study guide Increasing Concentration
Organization
Reading Comprehension Studying similar subjects at separate times to avoid confusion
Studying with friends
Making up possible questions Effective listening
Time Management
Basic understanding of content Using memory effectively
Drill and memorization Testing yourself Comprehension
Avoiding procrastination
Extracting important details
Avoiding distractions
Increasing vocabulary
Reading the directions
Application
Using an organizational planner or assignment book
Critical reading
Paying attention in class
Website evaluation Reading through entire test Problem Solving
Test taking strategies Taking notes Understanding the problem
Reviewing after lectures Answering easy questions first Devising a plan
Asking questions as you read or listen/Answering questions directly
Improving reading speed
Carrying out the plan
Reviewing notes Active reading Looking Back

207
The career planners have the responsibility of providing skills workshops for ARIZONA@WORK Youth participants unable to access study skills programs elsewhere. The staff use the study skills curricula available at Central Arizona College. These workshops would buttress or refresh the study skills that a participant may have already acquired in earlier training. Skill attainment training develops work readiness, basic education, and/or occupational skills that contribute to academic and employment success. All youth, regardless of age, receive training in at least one of the following three areas, based on need.
1) Career Guided Pathways Work readiness programs, which includes career exploration and planning, financial literacy, college and career readiness, academic preparation, life planning, goal setting, self-advocacy, and creation of a 10-year life plan and professional/academic e-portfolio (includes cover letter, resume, and other employment related information).
2) CAC Connect Gateway to College is available to high school students. These activities include the same information as the Work Readiness Programs, but also have life skills, study skills, tutoring, and basic education skills embedded in the information. Research has shown that the sooner youth begin to think about and plan for their future career and life goals, the better the retention and completion rates for both high school and secondary education.
3) Information that supports basic education skills are provided by CAC and the collaborating high schools. The career planners are responsible for coordinating training; communicating skill attainment goals; developing a specific educational plan with schools/adult education programs; and monitoring progress toward skill attainment outcomes. In all cases, the career planners and youth mutually establish specific basic skills goals. Training objectives and evaluation of achievement are outlined to promote goal attainment while providing numerous opportunities. Basic education training is provided to young people, whose academic assessment results indicate English, reading, writing, or computing skill levels at or below grades 8 and 9. The following identifies Basic Education Skill attainment that focuses on achieving successful outcomes in the training areas listed.
• Skill Attainment Training Area • Outcome • Basic Education Skills • Improvement in Reading, Language, and/or Math education levels • Required Education • Successful completion of coursework and attainment of high school credit or obtaining a
high school diploma or HSE/GED • Completing English Language Learners training and demonstrating, through assessment,
that English Language Learners services are no longer necessary.
This ARIZONA@WORK Youth refers in-school youth to existing before- and after-school activities and encourage them to stay in school and graduate. Project staff provide positive role models for participating youth and engage parents in their children’s education whenever possible. Moreover, the project

208
encourages young people to make constructive contributions to organizations and communities through service learning and work experience. ELEMENT #2 Alternative secondary school services, or dropout recovery services, as appropriate. All out-of-school participants who lack a high school diploma or equivalent are required to enroll in a High School Equivalency program. Alternative secondary school partnerships and linkages include school districts, charter schools, and other adult education agencies. To support dropout recovery, the following 14 elements mentioned in the WIOA Title I legislation, are available, as needed: Tutoring, study skills training, instruction and evidence based dropout prevention and recovery strategies that lead to completion of the requirements of secondary school diploma or High School Equivalency (HSE), including certificate of attendance or similar documentation for individuals with a disabilities), or a recognized postsecondary credential; alternative high school services, or drop out services; occupational Skills training; paid and unpaid work experiences. Youth are always encouraged to stay in high school, if that is an option for them, otherwise they are referred to a HSE/GED program. Education services leading to skill attainment for a participant who has dropped out of high school will typically take one of several forms, depending on his or her education status, individual circumstances, and functional level of basic skills. Whenever appropriate and possible, youth who have dropped out of school will be encouraged to re-enroll in their local high school. This is the optimum course of action for youth who have reasonable expectations of graduating with their cohort class, were progressing adequately while in school, or were not expelled or placed on long-term suspension. Enrollment in alternative school within the youth’s school district or at a charter school is an option if he or she is in need of an accelerated graduation plan offered by these schools, requires a non-traditional educational environment to maximize learning, or has behaviors that preclude re-enrollment at his or her local high school. Enrollment in an Adult Education program can provide educational opportunities for youth, including those who elect not to return to high school and those denied enrollment in a traditional high school. Adult Education services can be an option for out of school youth who attained a secondary school diploma or its equivalent but are basic skills deficient. CAC and Queen Creek Adult Education provide English as a Second Language instruction and High School Equivalency instruction at several sites within Pinal County. CAC strives to ensure that in-school youth remain in high school and graduate. The career planners advocate for youth with teachers, guidance counselors, and other school and college staff. By communicating assessment results with these personnel and parents, students benefit from concerned adults encouraging their academic success and will be more likely to complete their education. (As necessitated by law, all participants will be required to sign a release form that allows assessment-related information to be shared and reviewed for education and employment purposes.)

209
ELEMENT #3 Paid and unpaid work experiences that have academic and occupational education as a component of the work experience CAC students participating in the ARIZONA@WORK Pinal County Youth program are able to use the college’s student employment services to identify job opportunities. Several cities and town in the region offer employment in summer recreational programs. This type of work experience provides youth with an introduction to the world of work. The career planners help youth identify, prepare for, and apply for these work experiences. These experiences provide career exploration through a structured exposure to work and an introduction to opportunities in high demand occupations and industry clusters. The proposed project budget contains a line item to fund subsidized employment. Twenty percent of the overall budget is dedicated to funding work experiences. The work experience complements academic instruction by providing a context for the practical application of learned skills. Work sites may be in the public, private non-profit or private sector, and will be developed to provide an experience that approximates a “real work” situation. Work experiences may be paid or unpaid depending on various factors, such as the intensity and duration of the experience. Work experiences that have job responsibilities outlined in training agreements will be paid. Worksite assignments are based on the youth’s objective assessment, the ISS, commitments from employers, opportunity for employment upon completion of training, the worksite’s ability to integrate basic academic skills into work/training activities, and Child Labor Laws. The career planners provide the worksite supervisors with a workshop that covers the methodology involved in training and evaluating occupational skills and work readiness skills. ELEMENT #4 Occupational skill training, which includes priority consideration for training programs that lead to recognized post- secondary credentials that align with in-demand industry sectors or occupations in the local area involved, if the Local Board determines that the programs meet the quality criteria described in WIOA sec. 123 Occupational skills training – ARIZONA@WORK Pinal County Youth may receive training through occupational skills training, on the job training, skills upgrading and retraining, and/or customized training. Participants are exposed to the identified industry clusters to increase participation in high demand employment sectors that offer high wages. Training usually takes place in a classroom and results in an earned credential such as a certificate, diploma, license or degree. The ISS documents all activities resulting in training selection, the leveraging of financial aid, and community-based support for training. Occupational skills training conforms to Arizona Skill Attainment System requirements. Thus, the training provides on-site skills development and classroom-based skills development. On-site occupational skills training typically occurs during the work experience activity outlined below. The participant’s career planner communicates with the worksite supervisor to identify at least six employer-specific occupational skills, training objectives, and a training plan that produces proficiency in the

210
particular job. A formal worksite training agreement will articulate the training plan. The career planners provide the worksite supervisors with an overview of approaches and strategies that facilitate on-the-job learning. Classroom-based skills training is provided by training institutions that have met the Eligible Training Provider List (ETPL) standards. ARIZONA@WORK Pinal County Youth staff communicates with the classroom instructor to identify specific occupational skills, training objectives, and a training plan. In both on-site and classroom-based training, participant progress is assessed on a continuous basis. Training duration and/or methodology is modified as necessary to provide the opportunity for skill attainment. Work Readiness Training – Work Readiness Training is a scheduled activity for participants whose pre-assessed levels of proficiency in work readiness skills indicate a need for this training. Participation in this activity can occur at any time following Comprehensive Assessment and is determined by participant need and the sequence of activities outlined in the ISS. The duration of training will vary, based on the participant’s learning pace, degree of deficiency, and program goal(s). The career planners are the primary providers of work readiness training to ensure that the specific requirements for skill attainment are met. Collaborating business partners may offer supplemental workshops that provide for exploration of industry clusters and postsecondary opportunities. The career readiness workshops teach skills and knowledge related to career and personal awareness, understanding and accessing the labor market, daily living skills, job seeking skills, punctuality, attendance, presenting a neat appearance, exhibiting good conduct, showing initiative and reliability, and assuming the responsibilities involved in maintaining a job. The following outlines the specific content of the training components in youth workshops.
Work Readiness Skills
Making Career Decisions Survival/Daily Living Skills
Using Labor Market Decisions Being Consistently Punctual
Preparing Resumes Maintaining Regular Attendance
Filling Out Applications Demonstrating Positive attitudes and behavior
Interviewing/Follow-Up Letters Presenting Appropriate Appearance
Exhibiting Good Interpersonal Relations
Completing Tasks Effectively
The curriculum addresses the specific learning objectives (indicators) delineated in the skill attainment system/workplace standards. Emphasis is placed on values clarification, self-perception, motivation and employer expectations, and the practical application of these skills in relation to work. The Youth Programs’ approach is to combine work readiness skills training with work experience or training in basic education or occupational skills, and to use these activities to assess the participant’s

211
ability to demonstrate workplace skills outlined in the above table. This approach is consistent with principles of competency-based learning and instruction and is supported by national field studies indicating that job-keeping skills are most effectively trained and measured in a work or simulated work environment. Therefore, whenever possible, the classroom portion of work readiness skills training is followed by a paid or unpaid work experience. All participants are required to have work readiness training prior to being placed in a work experience position. CAC also has work readiness classes that are available for ARIZONA@WORK Pinal County Youth participants. The career planners are able to incorporate the content of these existing classes into the work readiness training they provide. ELEMENT #5 Education offered concurrently with and in the same context as workforce preparation activities and training for a specific occupation or occupational cluster. The project will link academic learning with occupational learning. During their work experience, WIOA participants have the opportunity to develop and demonstrate soft skills and competencies learned in the work readiness classes and workshops. As noted, work experience participants are required to attend a Work Readiness workshop prior to placement at a worksite. Education is offered concurrently with and in the same context as workforce preparation activities and training for a specific occupation or occupational cluster and requires integrated education and training. The three components for integrated education and training program are as follows:
1. Adult education and literacy activities such as basic academic skills training, critical thinking skills, or digital literacy skills
2. Workforce preparation activities such as self-management skills grooming for employment, or following directions; and
3. Workforce training such as occupational skills training, on-the-job training, job readiness training, or customized training.
The career planners provide activities that help youth transition to post-secondary education and training:
• Informing participants of legal responsibilities after turning 18 • Assessing participant strengths, abilities, and interests • Helping participants prepare and submit post-secondary education applications and financial
aid • Investigating and applying for scholarships; and • Developing a portfolio that demonstrates accomplishments and competencies.
Youth participants are encouraged to take advantage of Transitions courses that are offered during the fall at Central Arizona College. These participants can also work part time in their work experience

212
assignment while attending school. Both of these activities will assist with training on the following services, will provide labor market and employment information in the local area: Career awareness; Career exploration; Career counseling; Labor market trends; High demand occupations; and Job openings. ELEMENT #6 Leadership development opportunities, including community service and peer-centered activities encouraging responsibility and other positive social and civic behaviors. Leadership Development – The ARIZONA@WORK Pinal County Youth participants gain leadership experiences and exposure to leaders through service-learning projects, team leadership training, life skills training, and soft skills training. For example, as noted above, the work readiness workshops incorporate visits from ARIZONA@WORK Pinal County Youth participants who have already completed this training. The career planners, peers, success coaches, and partnership personnel provide examples and models of leadership. As noted, the project will include a Youth Advisory Committee which provides ARIZONA@WORK Pinal County Youth participants with the opportunity for input about the project’s program, activities, and services. Through this committee, participating youth gain experience in several requirements of leadership, including decision-making, being respectful of other people’s opinions, being able to reach consensus, and working with other people to overcome problems and challenges. Community Service and peer centered activities - The youth program provides linkages to the Pinal County communities and ARIZONA@WORK partners to ensure that parents, youth participants, and members of the community with experience in youth programs, are involved in the design and implementation of the Youth Program. Opportunities are made available to individuals who have successfully participated in the youth program to volunteer and provide assistance to participants in the form of mentoring, tutoring and/or other services and the program will provide appropriate connections between the youth program and the Arizona Business and Career Center that foster participation with local youth. Agencies that can assist with guiding youth are justice and law enforcement officials, public housing authorities, Job Corps, YouthBuild, Boys and Girls Clubs, representatives of other area youth initiatives, including those that serve the homeless and private youth initiatives. Youth Program staff assist with coordination and provision of youth services, linkages to the job market and employers, access for eligible youth to resources, information and services, and other activities designed to meet the purposes of the youth program and youth services. ELEMENT #7 Supportive services Supportive services will be available throughout the youth’s participation in the program. Supportive services will provide participants with the assistance necessary to complete the agreed upon program activities and transition to employment, postsecondary education, and/or advanced training. Support may include assistance with transportation, childcare, housing, referral to medical services, appropriate work attire, and work related tools. Whenever possible, support services will be accessed through in-kind

213
contributions and/or reduced fees for services in order to maximize available resources. Funding is also allocated in the project’s budget for supportive services. The provision of supportive services includes linkages and interaction with classroom and on-site training staff, interaction with other professionals or family members having influence with the youth, and performance coaching/counseling. Effective case management plays a significant role in the provision of comprehensive guidance counseling, follow-up and supportive services. Staff will be responsible for documenting the delivery of services, progress toward goals, and goal attainment. This is accomplished through ISS development and revision as well as case notes maintained online through the Arizona Job Connection and the participant’s hard file. ELEMENT #8 Adult mentoring for a duration of at least 12 months that may occur both during and after program participation. The purpose of adult mentoring is to build supportive relationships between youth and adults and to provide young people with positive adult role models. Mentoring within the program occurs in various ways. Informally, teachers, counselors, worksite supervisors and ARIZONA@WORK Pinal County Youth staff fulfill the role of mentors to participants. These adults can help the ARIZONA@WORK Pinal County Youth participants make wise decisions about their future. The adults also provide the encouragement and emotional support. When appropriate, the career planners refer participants to formally organized and recognized adult mentoring programs. The career planners document the time each participant spends being mentored and records issues that are communicated to them by either the participant or the individual providing the mentoring. ELEMENT #9 Follow-up services for not less than 12 months after the completion of participation. The follow up career planner provides follow-up and retention activities to ensure youth are provided with the necessary supports and services following program completion and transition to post-exit status. The requirement for a minimum of 12 months of follow-up services can contribute to the continued growth and development of the participant, and are consistent with youth development principles: improvement of academic achievement, support to complete post-secondary education, preparation for successful employment, and access to necessary supportive services to ensure successful outcomes. The identification of barriers prohibiting self-reliance and productive citizenship is central to a comprehensive follow-up strategy. Additionally, maximizing program performance must focus on retention/post-exit strategies, as status during the 2nd and 4th quarters following program exit is key to core youth performance measures. Project staff maintains responsibility for providing follow-up services to participants, as well as maintaining regular contact with participants, supervisors, and/or training/education providers to monitor

214
the youths’ status, identify and provide necessary supports, and intervene as needed. Staff perform scheduled contact attempts and the retrieval of current status back up documentation. In addition, program leadership coordinates follow-up activities to enhance post-exit services, thus resulting in increased positive retention-related performance. ELEMENT #10 Comprehensive guidance and counseling, which may include drug and alcohol abuse counseling, mental health counseling as well as referrals to counseling, as appropriate to the needs of the individual participant. Comprehensive Guidance and Counseling is part of a process of helping youth make informed educational, occupational, and life choices. Our consortium provides a comprehensive guidance and counseling program to develop competencies in self-knowledge, educational and occupational exploration and career planning. If a youth requires drug and alcohol or mental health counseling, a referral can be made to community based behavioral health agencies such as Pinal Hispanic Council or Horizon Human Services, both of which provide free counseling for clients in Pinal County. Adult Mentoring for the period of duration of 12 months would occur during participation and during follow-up services after exit from the program. Youth would be referred to agencies that could continue to provide support, services, guidance and counseling. The youth program would coordinate with the organization it refers a participant to in order to ensure the continuity of service. ELEMENT #11 Financial literacy education Financial literacy is the ability to use knowledge and skills to manage one’s financial resources effectively for lifetime financial security. Financial literacy education enables young people to start positive habits early (such as saving money and budgeting) and to avoid making decisions that could result in years of financial difficulty, such as incurring an unmanageable level of credit card debt. Surveys indicate that the majority of teens do not understand that credit cards accumulate interest and are neither able to balance a checkbook nor check the accuracy of a bank statement. Additionally, studies indicate that a sizeable majority of college students have at least one credit card, as well as have incurred several thousand dollars in credit card debt while in school. A recent Federal Deposit Insurance Company (FDIC) survey indicated that a large majority of surveyed teens are eager to learn more about how to manage and handle their money. Youth participate in Money Management workshops utilizing online modules, which will give them a better understanding of U.S. currency values, how to count bills and coins to pay or give money, how to use vending machines and ATMs, improve basic banking skills, including paying with a debit card and depositing money, and become familiar with the process of paying bills and filling out tax forms. Participants also learn the following subjects to better manage their money:

215
MONEY MANAGEMENT WORKSHOPS
Bank On It - An introduction to bank services Check It Out - How to choose & keep a checking account Setting Financial Goals - Money management/Retirement & Investing Pay Yourself First - Why you should save, save, save: Budget/Saving Borrowing Basics - An introduction to credit Charge It Right - How to make a credit card work for you Paying for College & Cars - Installment loans A Roof Over Your Head - Informed decisions on apartments and homes
ELEMENT #12 Entrepreneurial skills training Central Arizona College Small Business Development Center (SBDC) can assist youth with one-on-one confidential counseling where counselors use their real-life business ownership and management experience to give clients advice that is relevant and practical. SBDC services include, but are not limited to, assisting businesses with wellness evaluations, financial, marketing, production, organization, engineering and technical problems, feasibility studies, including: Accounting, Financial/Loan Packaging, Advertising, Government, Procurement, Business Plan Development, Market Research & Analysis, Business Startup, Management Issues, Cash Flow Management, Marketing, Commercialization of Technology, Personnel, Computer Applications, Positioning, Customer Analysis, Pricing Strategies, Environmental Management, Promotion, Exporting, Strategic Planning. Entrepreneurial skills training provides the basics of starting and operating a small business. These trainings develop the skills associated with entrepreneurship and may include, but are not limited to:
• Taking initiative • Creatively seeking out and identifying business opportunities • Develop budgets and forecast resource needs • Understand various options for acquiring capital and the trade-offs • Communicate effectively and market oneself and one’s ideas.
Workshops would be organized, as needed, for youth and the information will be included in ongoing training by the Career Planners. ELEMENT #13 Services that provide labor market and employment information about in-demand industry sectors or occupations available in the local area, such as career awareness, career counseling, and career exploration services. It is important that when participants make career choices that they have a good understanding whether an adequate supply of the jobs in which they are interested exists. It is also important that they know the sectors in which those jobs are located so they know where to look for employment and to receive specific

216
training and preparation to work in those particular sections. Additionally, project staff want to ensure that participants receive training for or seek jobs that exist – and that exist in sufficient numbers needed to ensure participants have a reasonable chance of securing work in the fields of their choice. Fortunately, CAC has access to online tools that will enable participants and the career planners to obtain valuable information about careers, labor market conditions, and where jobs are located.
• When a participant asks about future job growth in a specific field, the career planners answer questions by accessing regional, state, and national job market data provided by EMSI, an economic modeling company under contract with CAC.
• Participant and career planners can access the Arizona Career Information System (AzCIS), which helps people career and educational goals, connect majors to the world of work, locate scholarships, prepare to transfer to another institution, and find graduate schools.
• Through CAC, participants are able to access My Next Move, an online tool that allows people to search careers by key words or browse careers by industry type. Additionally, My Next Move can answer questions about careers that participants might enjoy and will then suggest careers that match the participant’s interest or training.
• Career planners and participants can use O*NET, the nation’s primary source of occupational information. O*NET contains information on hundreds of standardized and occupational-specific descriptors. The database also contains career exploration tools, career assessment instruments, and an interactive application for exploring and searching occupations.
With encouragement from the career planners, participants are able to attend Job Fairs that CAC regularly arranges and holds for its students and the wider public. The Job Fairs not only feature private and public entities looking for workers but also involve organizations seeking to provide careers in various fields, recruiting for internship and volunteer positions or providing continuing education information. ELEMENT #14 Activities that help youth prepare for and transition to post-secondary education and training. All new enrollees in the ARIZONA@WORK Pinal County Youth Program are required to complete the workshops and activities listed below, unless their assessment indicates there is not a need for a specific workshop or activity. The career planners develop a schedule of activities with the participants as soon as they are enrolled. Each participant understands that services such as payment of college tuition and support services hinges on their participation in the workshops and activities. This requirement will be documented in the participant’s ISS, which he or she will sign. The following lists the special programs and activities that will help youth prepare for and transition to post-secondary education and training and that is mandated, depending on the participant’s individual requirements.

217
WORKSHOPS AND ACTIVITIES TO HELP THE TRANSITION TO
POST-SECONDARY TRAINING AND EDUCATION:
Adult Mentors - Adult mentoring for first year college students – collaboration with other CAC grant projects and programs, as needed.
Dual Enrollment - Courses allowing high school students to obtain high school credit and college credit simultaneously
Career Exploration - On-line career exploration, overview of college classes that prepare students for employment in specific fields, field trips. Use of O*Net (on-line job and training search program) and GCF learnfree.org
Apply for federal financial aid (i.e. Pell) - WIOA eligible youth attending college must apply for a Pell grant (a federal WIOA requirement)
Career Guided Pathways Work Readiness workshops - Provides training in soft skills, resume preparation, job searches, standards of professional dress, etc. Students may need an income while they are at college or are in a post-secondary training program.
Financial Literacy workshops - Provides the prerequisite knowledge required for financial literacy and money management.
Scholarship and Financial Aid Opportunities - As per federal requirements, all WIOA eligible youth enrolled in college must apply for a Pell grant. The career planners will ensure that all WIOA eligible youth either attending college or enrolling in college complete the federal financial aid form (commonly known as FAFSA).
CAC offers Promise for the Future, a scholarship program designed to encourage students in Pinal County to stay in high school and graduate with a 2.75 grade point average. Students along with their parents sign a contract of commitment during the students eighth grade year. Students graduating with the required minimum GPA from a Pinal County High School receive a Promise for the Future Scholarship, which entitles them to a full tuition waiver to attend any CAC campus for up to four semesters. To date, more than 2,000 high school students have signed Promise for the Future contracts. The youth program makes an effort to reach out to students who have signed Promise for the Future agreements. The financial benefits provided by the Promise for the Future scholarship, coupled with the support provided by the ARIZONA@WORK Pinal County Youth program, provides students with the additional support they need to complete their educational goals. CAC offers dual enrollment courses in the areas of general education (transfer track) and courses that prepare students for work in specific fields. The students are required to complete the college entrance exams in both instances. Offering dual enrollment provides high school students with the opportunity to obtain high school credits and college credits simultaneously. SUPPORT SERVICES Effective career management will play a significant role in the provision of comprehensive career planning, follow-up and supportive services. Through interaction with the participant, the Career Planner will identify issues and challenges that may impede progress and success; challenges may include

218
personal crises, basic needs (e.g. food, clothing, shelter,) legal issues, childcare, etc. Participants will be linked with appropriate professionals and/or supporting resources specific to individual needs. Staff will be responsible for documenting the delivery of services, progress toward goals, and goal attainment, through IEP/ISS development and revision, as well as case notes. Career Planners provide customers access to both preliminary and in-depth assessment tools in addition to those offered as part of the welcome function. These more in-depth tools will provide jobseekers with a greater awareness of their basic aptitudes (e.g. TABE for math, English, and reading level determinations), as well as occupational skills and work interests. Additionally, this service level focuses on identifying individual barriers that may affect a customer’s ability to seek self-sufficient employment or complete training leading to self-sufficiency. One-on-one reviews of the assessment results will determine the best career pathway an individual may choose to follow. Once agreed, the Career Planner and jobseeker will work together to compose an Individual Employment Plan (IEP) which will serve as the roadmap. Basic education needs such as GED, English as a Second Language (ESL) classes, basic computer skills classes, and advanced job search techniques may be offered, along with supportive services/referrals including transportation (through the use of gas cards and/or reimbursement), food, and housing assistance, in order to address possible barriers to employment that will allow jobseekers to fully focus on enhancing their employability skill levels. Supportive services are also available to youth that provide assistance for needs to help them be successful in completing their educational program and obtaining employment. TRANSPORTATION Pinal County covers a vast geographic area, approximately 5,400 square miles and comparable in size to the state of Connecticut. One of the most critical challenges in such a rural area is transportation. With population bases centered in Casa Grande, San Tan Valley and the city of Maricopa, access to services and connectivity to resources within the county are not easily accessible. To address these and other transportation related issues, the Pinal County Board of Supervisors voted and approved the formation of the Pinal Regional Transportation Authority (RTA), which was established pursuant to A.R.S. § 48-5302A on August 5, 2015. The Pinal RTA was formed to provide a balanced regional transportation system, to manage the Regional Transportation Fund, to provide a twenty-year regional transportation plan, and to authorize funding for all modes of transportation projects. Membership of the RTA consists of Pinal County, the Cities of Apache Junction, Casa Grande, Coolidge, Eloy, Maricopa, the Towns of Florence, Kearny, Mammoth, Queen Creek, Superior, and the Central Arizona Governments (CAG).

219
GOAL 4: PROVIDE AN EFFICIENT, ACCOUNTABLE WORKFORCE SYSTEM Accelerate measurable impact and performance for less cost (county service delivery)
STRATEGY 1: DEVELOP A JOB-DRIVEN PUBLIC WORKFORCE DEVELOPMENT
SYSTEM IN PINAL COUNTY Each local area was required to choose at least three descriptive measures that need improvement and create proposed goals and a plan for improvement for each measure. Progress in completing these improvement plans will be incorporated into the next ARIZONA@WORK Job Center certification for the local areas. In response to this requirement, the Pinal County Workforce Development Board selected the following:
• Extensive Knowledge of Local Economy • Business Engagement • Highly Integrated Service Delivery System
As a part of the PCWDB’s 2020 strategic planning initiative, plans for improvement in these three areas will be developed. The PCWDB will dedicate its efforts toward cross-program strategies that focus on partnerships including not only employers and workforce system partners, but also partners tied to economic development, education, business groups and associations, as well as community service organizations that play an integral role in cross-program processes. The rudiments of such partnerships – asset mapping across all entities – have yet to take shape with any consistency, but must improve, to meet both employer and job-seeker needs in the most efficient, cost-effective ways available throughout the local area. To fulfill its vision, the Workforce Arizona Council will focus on developing the following characteristics throughout the system, including measuring the degree to which the local and regional workforce areas successfully offer activities that result in the growth of these characteristics:

220
Extensive Knowledge of Local Economy
Industry-recognized Credentials
Highly Integrated Service Delivery System
Access to Services
Continuous Evaluation and Improvement of Services
Career Pathways
Use Evidence-based, Best and Promising Practices for Service Delivery
Business Engagement
Sector Partnerships
Work-Based Learning Opportunities
Job Seekers Trained for In-Demand Jobs
Actively Engage Veterans and Other Priority and Special Populations
STRATEGY 2: SUSTAIN A HIGH-PERFORMING LOCAL WORKFORCE DEVELOPMENT
BOARD The PCWDB was recertified by the Workforce Arizona Council in December 2019.
Pinal County Workforce Development Board In February 2020, the PCWDB procured a vendor to assist in the establishment of a new foundation for the strategic direction of workforce development in Pinal County. This effort is designed to build upon the strategies developed and work accomplished during the 2016-2020 plan, while ensuring alignment with the Arizona Unified Workforce Development Plan for Program years 2020-2023. Five strategic planning sessions were conducted Between April 22 –May12 with board members and stakeholders. Through this effort, a strategic plan based on the six purposes of WIOA and the following goals, mission and vision will be produced and implemented: Mission: The mission of the Pinal County Workforce Development Board is to fulfill the Six Purposes of WIOA.
Category #
A - Majority Local Business Representatives (>50%) 10
B - Local Workforce - Labor and apprenticeship required; CBOs and other youth-related organizations optional (20% min)
4
C - Education and Training - Title II and higher education required.
Local education and CBOs helping barriered individuals (optional)
2
D - Government, Economic, and Community Development - Eco/Dev, Wagner-Peyser, and Voc Rehab required; philanthropic and others optional
3

221
Vision for Workforce Development in Pinal County:
Pinal County: A vibrant, affordable community, home to a skilled, diverse workforce; providing innovative opportunities for job seekers, employers, and employees to learn, grow, and prosper.
Goal 1: Enhance the talent pipeline of work-ready individuals and connect that diverse workforce with high quality, sustainable jobs.
Goal 2: Establish the Pinal County Workforce Development Board as the central convener facilitating all workforce activities in the region, rural and non-rural.
Goal 3: Create aligned and innovative methods of service delivery that demonstrate relevance and responsiveness in a changing economy.
This plan will inform the PCWDB on how best to approach its legislated roles and responsibilities with the goal of a highly efficient and accountable workforce system serving to the benefit of Pinal County’s businesses and jobseekers. The PCWDB’s strategic plan will ultimately inform the contents of the ARIZONA@WORK Pinal County Local Workforce Development Plan. Workforce Arizona Council “Certification of the ARIZONA@WORK Job Centers Policy” issued in August 2017 outlined the WAC’s vision of a job-driven public workforce development system in Arizona that focuses equally on the employment needs of job seekers and employers' needs for skilled labor with industry-recognized credentials to meet their current and future demand for labor. To fulfill its vision, the WAC outlined a focus on developing the following characteristics throughout the system, including measuring the degree to which the local and regional workforce areas successfully offer activities that result in the growth of these characteristics:
1. Extensive Knowledge of Local Economy; 2. Business Engagement; 3. Sector Partnerships;

222
4. Work-Based Learning Opportunities; 5. Job Seekers Trained for In-Demand Jobs; 6. Industry-recognized Credentials; 7. Career Pathways; 8. Access to Services; 9. Active Engagement of Veterans and Other Priority and Special Populations; 10. Highly Integrated Service Delivery System; 11. Continuous Evaluation and Improvement of Services; and 12. Use of Evidence-based, Best and Promising Practices for Service Delivery.
Per the policy, local boards must choose at least three descriptive measures that need improvement and create proposed goals and a plan for improvement for each measure, with progress in completing these improvement plans incorporated into the next ARIZONA@WORK Job Center certification for the local area. In response to this, the PCWDB selected the following three measures on which to focus: Extensive Knowledge of Local Economy Business Engagement; and Highly Integrated Service Delivery System
An aspect of the strategic planning sessions and associated plan will be the PCWDB taking an inward look at its operations. This will include as assessment of its structure including but not limited to member recruitment, onboarding, and committee composition. The underlying key will be to have a membership that is knowledgeable, informed and engaged. In addition, the PCWDB will work to forge a cohesive relationship with the Pinal County Board of Supervisors. The Shared Governance Agreement identifies the agreed upon shared responsibilities both entities agree to and will be used to guide this relationship in building a strong local workforce system. The PCWDB will continue to conduct an annual board retreat to remain current on the local plan and the WIOA, provide training for the board members, and develop strategies to unite business, economic and political leaders to shape the direction of workforce investment in Pinal County. PCWDB members will also continue to review board by-laws, as well as explore data and various strategies in an effort to enhance services. STRATEGY 3: EFFICIENTLY ALIGN, PRIORITIZE, AND SELECT WORKFORCE
DEVELOPMENT SYSTEM PROJECTS Pinal County is the youngest workforce development area in the State of Arizona which presents both opportunities and challenges. Pinal County’s workforce development system’s maturation process has, and must, continue to include the trial and error of innovative workforce development projects and initiatives that align with the forward thinking strategies outlined by the PCWDB.
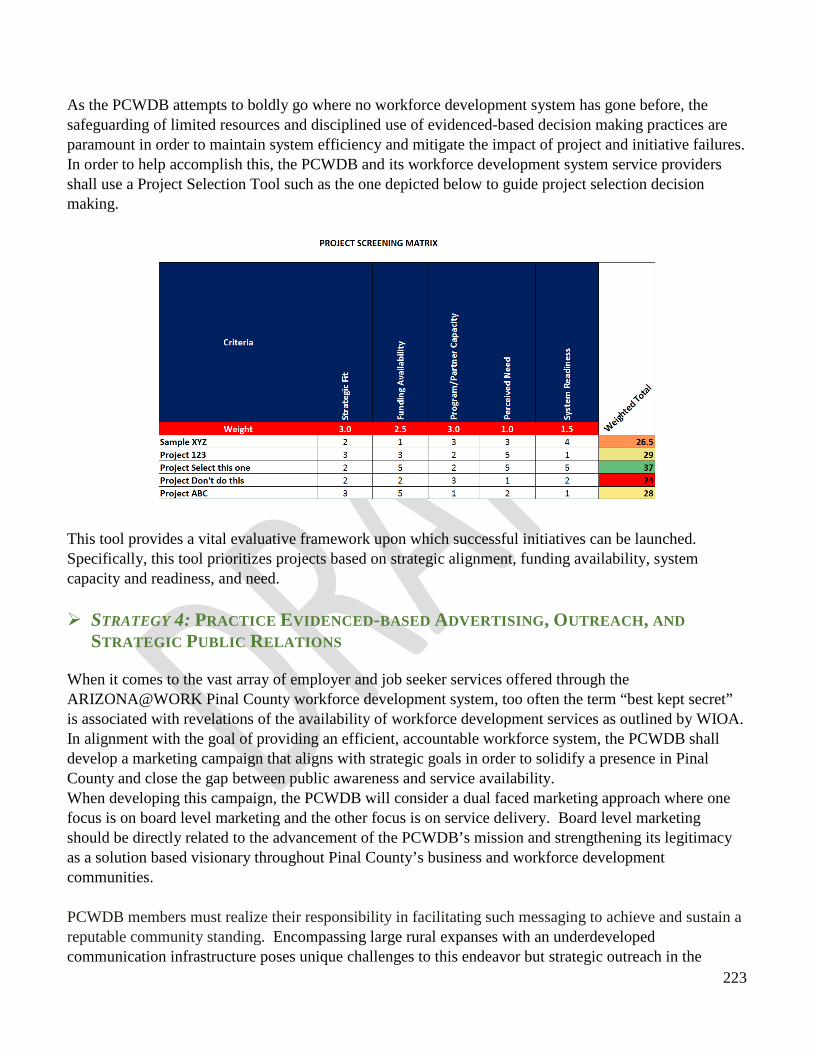
223
As the PCWDB attempts to boldly go where no workforce development system has gone before, the safeguarding of limited resources and disciplined use of evidenced-based decision making practices are paramount in order to maintain system efficiency and mitigate the impact of project and initiative failures. In order to help accomplish this, the PCWDB and its workforce development system service providers shall use a Project Selection Tool such as the one depicted below to guide project selection decision making.
This tool provides a vital evaluative framework upon which successful initiatives can be launched. Specifically, this tool prioritizes projects based on strategic alignment, funding availability, system capacity and readiness, and need. STRATEGY 4: PRACTICE EVIDENCED-BASED ADVERTISING, OUTREACH, AND
STRATEGIC PUBLIC RELATIONS When it comes to the vast array of employer and job seeker services offered through the ARIZONA@WORK Pinal County workforce development system, too often the term “best kept secret” is associated with revelations of the availability of workforce development services as outlined by WIOA. In alignment with the goal of providing an efficient, accountable workforce system, the PCWDB shall develop a marketing campaign that aligns with strategic goals in order to solidify a presence in Pinal County and close the gap between public awareness and service availability. When developing this campaign, the PCWDB will consider a dual faced marketing approach where one focus is on board level marketing and the other focus is on service delivery. Board level marketing should be directly related to the advancement of the PCWDB’s mission and strengthening its legitimacy as a solution based visionary throughout Pinal County’s business and workforce development communities. PCWDB members must realize their responsibility in facilitating such messaging to achieve and sustain a reputable community standing. Encompassing large rural expanses with an underdeveloped communication infrastructure poses unique challenges to this endeavor but strategic outreach in the

224
community to foster partnerships and strengthen awareness is a critical element to a comprehensive outreach plan. In order to avoid blending of operational oversight responsibilities and service delivery roles, it is recommended that the service delivery marketing campaign development is included in future iterations of the ARIZONA@WORK Pinal County service provider contracts, intergovernmental agreements, Memorandum of Understanding, and Infrastructure Funding Agreement. This strategy shall adhere to all standards within the ARIZONA@WORK brand guidelines, promote services rather than programs, and give consideration to targeted populations to include individuals with barriers to employment when developing materials and conducting outreach.
PERFORMANCE AND CONTINUOUS IMPROVEMENT Aligning performance accountability and reporting for WIOA’s core programs and additional DOL-administered programs facilitates the alignment of programs and services to support customer-centered service approaches by providing a system of programs and services that best fits the customer’s needs. Additionally, the ability to look across program results, and to look at the data beneath those results, can provide useful management information and can serve as a basis to evaluate and assess how programs and services are impacting a variety of customers. Customers will also have information to better inform their choices when selecting training programs. In order for customers to receive seamless services in the ARIZONA@WORK Pinal County system environment, it is imperative that all partner staff in the system understand each other’s organization, their services and their goals. ARIZONA@WORK Pinal County core partners will team together to develop a training curriculum that will ensure new employees are on-boarded with an awareness of the common goals and agreed upon strategies to deliver customer centric services. As depicted in Figure 4 all new core and required partner staff will complete training in common on-boarding procedures. This training will provide a foundational overview of the ARIZONA@WORK Pinal County workforce system, and will clearly delineate the role of each staff member and the role their function plays in the overall success of the customers being served. Specific job requirements will be the responsibility of each program’s leadership – but all program training will be offered in the context of the ARIZONA@WORK Pinal County system flow.

225
Figure 4
Cross training, including customer service training will be provided to all partners, coordinated by the ARIZONA@WORK One-Stop Operator. Training will be conducted quarterly at a minimum at staff meetings and within individual partner programs at regular monthly meetings. Staff will also be completing core competencies training approved by the Workforce Arizona Council. The WorkforceGPS (https://www.workforcegps.org/) site also provides substantive webinars on customer service and a wealth of other trainings, which can be viewed as individual staff schedules dictate. Since policy updates are very specific to each state, Pinal County will defer to the Workforce Arizona Council to determine what policies to address and when. The PCWDB understands that as gatekeepers of new guiding principles and processes for the workforce system, members need to be engaged in core competency trainings. Therefore, the PCWDB does foresee accessing these trainings periodically along with all ARIZONA@WORK Pinal County system staff. With new federal regulations under the Workforce Innovation and Opportunity Act, and following state policy, the PCWDB will continue to review best practices from throughout the country to ensure that stakeholders within the ARIZONA@WORK Pinal County system have the best possible information to update programs and processes.
To build upon the vision and mission statements of both the PCWDB and the County, as well as aligning with the priorities outlined by the Governor, the PCWDB will develop a high level “point-in-time” snapshot of selected data points for the local workforce board membership on one page. The data points may be adjusted periodically based on the PCWDB’s request to include data points such as:
Continuous training efforts
Initial programmatic training
Common Onboarding
Adult/DW
Customer Service
Youth Wagner-PeyserVoc Rehab Vets Pinal
County
New Employee
Workforce DevelopmentProfessional
Workforce Development
System Cross-TrainingProgrammatic
Staff Development

226
Average number of visits per month Number of new (first time) visitors Number of employers served Job seekers served Number of referrals between ARIZONA@WORK Pinal County partners Pinal County Labor Force Pinal County Unemployment Rate Pinal County Average Earnings WIOA Negotiated Performance Measures (Goals and Actual) Number of participants enrolled in the ARIZONA@WORK Pinal County partner programs Program Year Expenditure Rates for the Adult, Dislocated Worker and Youth Programs
It will be critical that the Board also include non-core required partner outcomes as well when assessing the overall workforce system. For instance - the core and required partners will collaborate with PCWDB input to develop a customer survey to capture both employer and job-seeker impressions on service delivery. This will enable the workforce system to continually measure its progress in meeting customer expectations. Tracking of program data and analyzing it serves as the cornerstone for an evidence-based, designed system of service delivery at several levels: Chief Elected Officials (Pinal County Board of Supervisors): As the body ultimately responsible
for the expenditure of the WIOA Title I funding allocated to Pinal County, performance data will be made available to the Board of Supervisors on a regular basis and upon request. This data will help in the evaluation of service providers who the County contracts with to provide WIOA services. Performance goals negotiations will take into account the economic climate of the County and incorporate the strategic economic and workforce development direction the Board of Supervisors set.
Pinal County Workforce Development Board (PCWDB): Programmatic and fiscal performance data will be presented to the PCWDB as part of a standing agenda item at each full board meeting. By presenting this data to the Board, program and fiscal staff will have the opportunity to share best practices as well as strategies focused on continually improving performance. The Board will also work with program staff to evaluate trend data and strategize on annual performance negotiations with the State.
ARIZONA@WORK Pinal County Partner Staff: Core negotiated program performance metrics are what the County will be held accountable to from a WIOA perspective. Additional metrics will be developed by the PCWDB in an attempt to provide “real-time” data as opposed to the time-lagged federal performance measures. It will be critical for partner staff to be aware of the contribution each makes to the health of the workforce delivery system regardless of which set of metrics is being tracked. Tracking of data allows program planning to be based on facts, and

227
allows for capturing trends –both positive and negative. Positive trending of performance allows for validation of agreed upon processes while the early detection of negative performance trends will allow ARIZONA@WORK Pinal County to address and correct processes that do not benefit the customers and programs. Beyond the core programs performance, the underlying fact is that the ARIZONA@WORK Pinal County workforce system is comprised of a number of required WIOA partner programs, as well as partners who are not “required”. The PCWDB will develop metrics to measure the effectiveness of the entire workforce system, allowing the evaluation and adjustment of strategies to keep pace with an ever changing economic and workforce development environment.
The PCWDB works closely with the Board’s Executive Committee, the Economic and Workforce Development Department, and county and city economic development managers to assess current local and regional economic conditions. Other areas assessed will include previous performance outcomes, future projections for business expansions and job growth, plans for workforce system capacity building, and other factors that may impact performance levels to establish Pinal County parameters as a prelude to performance negotiations. Federal performance measures for the Adult, Dislocated Worker and Youth Programs will be negotiated with the Arizona Department of Economic Security and be facilitated through the PCWDB. PCWDB staff will gather and analyze labor market information in anticipation of proposing levels of performance targets (See Appendix I). Negotiated indicators of performance for PY 2018 and PY 2019 to meet federal requirements are summarized in Figure 5.
PROGRAM PRIMARY INDICATORS OF PERFORMANCE
• Adult and Dislocated Worker Programs
authorized under chapter 3 of subtitle B;
• Adult Education and Literacy Activities authorized under title II;
• Employment Service Program authorized under sections 1 through 13 of the Wagner-Peyser Act (29 U.S.C. 49 et seq.) (except that sub clauses (IV) and (V) shall not apply to such program); and
• The program authorized under title I of the Rehabilitation Act of 1973 (29 U.S.C. 720 et seq.), other than section 112 or part C of that title (29 U.S.C. 732, 741)
i. The percentage of program participants who
are in unsubsidized employment during the second quarter after exit from the program;
ii. The percentage of program participants
who are in unsubsidized employment during the fourth quarter after exit from the program;
iii. *The median earnings of program participants
who are in unsubsidized employment during the second quarter after exit from the program;
iv. *The percentage of program participants
who obtain a recognized postsecondary credential, or a secondary school diploma or its recognized equivalent (subject to clause (iii)),

228
NOTE: Primary Indicators of Performance marked with an asterisk (*) to the right also apply to the Youth Program (see below)
during participation in or within 1 year after exit from the program;
v. *The percentage of program participants
who, during a program year, are in an education or training program that leads to a recognized postsecondary credential or employment and who are achieving measurable skill gains toward such a credential or employment; and
vi. *The indicators of effectiveness in serving
employers established pursuant to clause (iv).
PROGRAM PRIMARY INDICATORS OF PERFORMANCE
Youth Program authorized under chapter 2 of subtitle B
i. The percentage of program participants who
are in education or training activities, or in unsubsidized employment, during the second quarter after exit from the program;
ii. The percentage of program participants
who are in education or training activities, or in unsubsidized employment, during the fourth quarter after exit from the program; and
iii. The primary indicators of performance
described in sub clauses (III) through (VI) of subparagraph (A)(i) (See above)
“Baseline” indicators will not be used in the end of the year performance calculations and will not be used to determine failure to achieve adjusted levels of performance for purposes of sanctions. Baseline indicators are summarized in Figure 6.

229
Figure 6 PROGRAM BASELINE INDICATORS OF
PERFORMANCE Youth Program only • Measurable Skill Gains
• Effectiveness in Serving Employers • Median Earnings
Adult Education • All primary indicators EXCEPT
Measurable Skill Gains
Wagner-Peyser/Employment Service • Effectiveness in Serving Employers (NOTE: Credential Attainment Rate and Measurable Skill Gains are not required indicators)
Vocational Rehabilitation • All primary indicators
In September 2018, ARIZONA@WORK Pinal County negotiated levels of performance for PY 2018 and 2019 (see Exhibit E). As of the submission of this plan, PY2020 levels of performance have yet to be negotiated. The indicator for “Services to Employers” has been an effort facilitated by the Workforce Arizona Council. Although in the pilot stage, initial measures to be tracked at the state level only are outlined in below:
Federal (WIOA) Employer Measure Methodology Retention Rate Percentage of participants who exit and are employed
with the same employer/business in the 2nd and 4th quarters after exit
Employer Penetration Rate Percentage of employers using services out of all employers in the state
Arizona State Employer Measures Methodology Average Number of Days to Fill Job Openings using ARIZONA@WORK staff assistance
Measured from the employer’s first contact requesting staff assistance filling a currently available job opening to the job seekers’ start date, fulfilling the employer’s job opening.
Percentage of employers who contacted ARIZONA@WORK Job Center Who Confirm ARIZONA@WORK services assisted in identifying qualified job applications
Percentage derived from employers providing a response
Number of businesses whose worksites have been visited by an ARIZONA@WORK Business Services Representative
TBD
In order to break out of the historically siloed approach of measuring local area performance based solely on Adult, Dislocated Worker and Youth Program outcomes, ARIZONA@WORK Pinal County seeks to approach performance from a holistic perspective. Although levels of performance are negotiated at the

230
local level for the Adult, Dislocated Worker and Youth Programs, ARIZONA@WORK Pinal County will be pursing discussions with core partners at the state level to determine how best to measure the health and success of all workforce activities based on Pinal County-specific metrics much like the Adult, Dislocated Worker and Youth Programs are held to. This approach will be consistent with WIOA regulations found at 20 CFR (Code of Federal Regulations) § 463.205 (What performance indicators apply to local areas and what information must be included in local area performance reports?) which states that each local area in a State under WIOA Title I is subject to the same primary indicators of performance for the core programs for WIOA title I under § 463.155(a)(1) and (c) that apply to the State. Each core partner will be asked to identify performance targets based on its federal agency’s requirements and calculate the Pinal County rate for each of the targets. It is anticipated that a transition period will be required, as certain core partners such as Adult Education and Vocational Rehabilitation have not previously shared common measures with Title I and Title III programs. However, initial steps to develop a common, comprehensive core partner performance report will be pursued based on targeted outcomes reflecting activity in Pinal County. Both ResCare and CAC will submit Monthly Expenditure and Cash Draw Reports to the Pinal County WIOA Financial Manager. These reports will track the expenditures of the Adult, Dislocated Worker and Youth funds allocated to each contracted provider. The Financial Manager will work closely with each contractor to ensure expenditure rates are consistent with the respective grant timelines and that expenditures are all allowable costs. The Financial Manager will continue to provide the PCWDB with a financial report during regularly scheduled meetings. ARIZONA@WORK Pinal County core programs expect to be monitored by their respective State agencies on an annual basis. PCWDB staff will monitor contracted providers, ResCare, CAC and CPLC (the one-stop operator) during each program year. The Pinal County Economic and Workforce Development Department will be pursing the hiring of a Compliance/Monitoring Specialist whose focus will be to ensure that all board issues policies and required monitoring of the contracted providers is completed. A “desk review” will consist of verifying data that has been entered in the Arizona Job Connection (AJC) by both the client/participant and the Career Planner assigned to the participant for the Adult, Dislocated Worker and Youth Programs. “On-site” client/participant file monitoring involves verification of the presence of hard copy or uploaded into AJC “source” documentation in the client /participant’s file that is located at the physical site from which services have been provided. Both methods are components of programmatic monitoring and data validation and aim to determine the rate of accuracy of system staff’s compliance with local, state, and federal rules, regulations, policies, procedures, and documented practices.

231
As part of the negotiated Memorandum of Understanding to be signed by all core programs and other required program partners, metrics will be developed to measure the effectiveness of the entire ARIZONA@WORK System and will be vetted by the PCWDB. Measures for consideration include: Customer Perspective • Number of Clients Entering the One-Stops • Number of Employers Utilizing the One-
Stop Centers • Training Related Employment • Job Placements to Job Seekers • Average wage at placement
Internal Perspective • Number of website inquiries • Number of clients referred to employers • Customer Satisfaction Survey • Employer Satisfaction Survey
Financial Perspective • Training Dollars per program • Training Dollars per participant • Average Cost per participant in Job Search • Average Cost per participant in Training
Growth and Learning Perspective • Number of Staff cross-trained • One-Stop Staff completing Core
Competencies Certification • Number of PCWDB members completing
refresher training
CONTINUOUS IMPROVEMENT OF ELIGIBLE PROVIDERS OF SERVICES Creation of a qualified workforce to meet the strategic goals of the county and the business community is of the utmost priority if Pinal County is to succeed in meeting its strategic goals. The provision of viable training programs must be made available to the job seekers and program participants who are the commodity most in need to be molded into qualified candidates for the employment opportunities that will be made available in in-demand occupations and targeted industries being developed through economic development activities. Designated staff will be responsible for review of the requests from training providers to be approved for inclusion on the Arizona ETPL. Upon review of the submitted requests, staff will make the determination, based on required criteria whether to certify the programs The PCWDB has designated program staff to maintain the ETPL. All training programs that operate within Pinal County and request inclusion on the ETPL, will be reviewed for compliance before being added to the ETPL. Once approved, the training providers will be placed on the PCWDB consent agenda at the regularly scheduled PCWDB meeting. In general, providers seeking approval to offer training on the ETPL must meet the following qualifying criteria per the Arizona State WIOA Policy and Procedure Manual15:
1. An institution of higher learning that provides a program leading to a recognized postsecondary credential;
2. Entities that provide registered apprenticeship programs;
15 https://des.az.gov/sites/default/files/media/etpl_policy_final10_3_16.pdf

232
3. Other public and private providers of training programs, including joint labor-management organizations and providers of adult education and literacy activities when such activities are provided in combination with occupational skills training
Private post-secondary institutions and training providers must be licensed by the appropriate Arizona or federal licensing authority, as required by Arizona and Federal law. Private post-secondary providers must be licensed by the Arizona State Board of Private Postsecondary Education (http://azppse.state.az.us/). For training providers of adult education and literacy activities that are provided in combination with occupational skills training, the provider of the adult education instruction must be listed on the Arizona Department of Education’s list of Adult Basic Education (ABE) (Basic Reading, Writing, and Mathematics Skills) and GED® Preparation Classes. Adult Education instruction must be a State funded Title II provider of Adult Education. Apprenticeships are not licensed but must be registered with the Arizona Office of Apprenticeship. Key to being approved for listing, as a training provider on the ETPL, will be the provider’s ability to meet the following provisions within their training programs in order to meet the needs of local employers and serve individuals with barriers to employment:
1. Training programs must target skill preparation for occupations in-demand primarily in Pinal County and secondly in the state;
2. In-demand will be defined by the market analysis included in this plan as well as periodic updates to a developing economic landscape;
3. Training programs must align with industry sector strategies and career pathways; and 4. Training programs provide job driven training that leads to recognized postsecondary credentials.
Moreover, all ETPL training providers as recipients of WIOA Title IB Funds must comply with the following laws: Regulations under WIOA Section 188; 29 CFR 37, Title VI of the Civil Rights Act of 1964; Age Discrimination Act of 1998; Sections 504 and 508 of the Rehabilitation Act of 1973; Title IX of the Education Amendments of 1972; Title II Subpart A of the American with Disabilities Act of 1990; and The Genetic Information Nondiscrimination Act of 2008
Training providers that have been debarred by any state or the federal government will not be eligible to be included on the ETPL during the debarment period. A program summary will include programs that do not qualify or are removed from the ETPL and will be placed on the consent agenda. Programs that do not meet stated performance metrics dictated by both the State and local workforce board will be removed from the list. A quarterly ETPL status report, which will include performance data on each of the programs, will be provided to the PCWDB when performance data is available.

233
COMPLIANCE WITH WIOA SECTION 188 ARIZONA@WORK Pinal County will fully comply with Section 188 of the WIOA, the Americans with Disability Act, Section 504 of the Rehabilitation Act of 1973 (amended); the Age Discrimination Act of 1975; Title IX of the Education Act of 1972; and 29 CFR Part 38. This degree of compliance applies to all recipients, programs or activities that are offered through the ARIZONA@WORK Pinal County workforce delivery system and offered through the designated comprehensive center as well as access point locations. Beyond the essential compliance efforts stated above, ARIZONA@WORK Pinal County has developed the following operational “equal rights” system: Designation of Local Level Equal Opportunity (EO) Officer. The Pinal County Economic and Workforce Development Department’s Workforce Director currently serves as the designated local Equal Opportunity (EO) Officer. The Local Equal Opportunity Officer’s name is posted on the “Equal Opportunity is the Law” posters in the Business and Career Center and will be posted at other service delivery sites as they are identified. EO and Complaint training in the comprehensive center will be conducted annually with all WIOA program staff who work in the comprehensive center as well as those who represent a core program and work at one of the affiliate sites or are stationed at an access point. (For designated Local, State and Federal EO Officers see Exhibit 9) A formal complaint system has been established to ensure individuals have access to communicate any alleged non-compliance based on discriminatory actions. In order to ensure that all customers of the ARIZONA@WORK Pinal County are afforded the right to elevate any concerns they have regarding their receipt of services, the Complaints, Grievances and Appeals Policy has been developed to ensure alignment with WIOA Section 188. The policy is meant to address two types of complaints:
1. Complaints based on discrimination claims. The nondiscrimination and Equal Opportunity provisions found in Section 188 of the Workforce Innovation and Opportunity Act (WIOA) prohibit discrimination against applicants, beneficiaries and employees based on race, color, national origin, age, disability, sex, religion, and political affiliation or belief, as well as against beneficiaries on the basis of citizenship and participation in WIOA.
2. (Program/Service Delivery) Complaints based on reasons other than discrimination. High-level service delivery to customers of ARIZONA@WORK Pinal County is a primary tenant of the workforce system. Any customer has a right to elevate questions or concerns regarding the level of service they received. These include denial of services for reasons other than those based on discrimination claims.
Complaints reflect on the entire system – regardless of origin or program association. In addition to Section 188, efforts have been initiated with ADES to consolidate quarterly reporting of complaints between MSFW/Employment Service and the balance of the Section 188 required partners’ reporting. The intent is to capture all complaints within the ARIOZNA@WORK Pinal County workforce system to drive shared planning on how best to address incidents that caused a customer to go to the lengths of filing a complaint.

234
ARIZONA@WORK Pinal County will operate under the principle that as stewards of the public’s trust staff are held to unsurpassed standards of service delivery regardless of an individual’s personal circumstances. Under these principles, ARIZONA@WORK Pinal County sites will utilize the following strategies to ensure equal opportunity is provided to all customers in a nondiscriminatory manner: Notice to Special Populations. The ARIZONA@WORK Pinal County Business and Career
Center in Casa Grande has a notice and communication system accessible to everyone entering the comprehensive center. “Equal Opportunity is the Law” posters in English and Spanish are posted in the Center as well. “Equal Opportunity is the Law” forms are provided to Adult, Dislocated Worker, and Youth Program enrollees, who must acknowledge receipt of the document. The forms are then placed in participant files. Individuals with limited English proficiency are informed of their rights utilizing bilingual staff, and other customers are informed of the availability of nondiscrimination policies in service orientation sessions.
Pinal County will utilize the LanguageLine®. LanguageLine® Phone Interpreting℠ connects with a professional phone interpreter within seconds. Available 24/7/365, and fluent in 240 languages, this service will be used to access interpreters when there is no on-site staff who can provide a personal interpretation to customers who may be Limited English proficient.
Universal Access. ARIZONA@WORK Pinal County provides universal access. Visual representations of such accessibility are displayed throughout the Business and Career Center location. Universal access messaging will also be incorporated on the ARIZONA@WORK Pinal County website.
Compliance with Section 504 and the Rehabilitation Act of 1973, as Amended and 29 CFR Part 38. The Pinal Workforce Development Area has implemented an equal opportunity and nondiscrimination policy that is compliant with WIOA and 29 CFR Part 38An annual WIOA Equal Opportunity and Non-Discrimination audit will be conducted by the State Equal Opportunity Officer to ensure compliance with Equal Opportunity policies.
Data and Information Collection and Maintenance. The local Equal Opportunity Officer, with the assistance from the ARIZONA@WORK Pinal County staff, collects and maintains Equal Employment Opportunity (EEO) data with regard to system registrants and participants. This information is stored in AZJobConnection electronic workforce system.
Monitoring Recipients for Compliance. Pinal County has two sub-recipients: ResCare Workforce Services, which administers the Adult Program and Dislocated Worker Program. Central Arizona College, administers the Youth Program. These sub-recipients are monitored for EEO-related compliance once a year. Their staff will be included in the annual EO and Complaint Training.
Complaint Processing Procedures. The Pinal County workforce system developed and implemented complaint and grievance procedures based on the revised policies. Program participants are provided with information about the Pinal Workforce Development Area’s complaint and grievance policies upon enrollment and receive a copy of the complaint policy, which they must sign, having acknowledged they have read and understand the information. A

235
signed acknowledgement of the complaint and grievance procedure policies is placed in each registered participant’s file.
Review of Assurances, Job Training Plans, Contracts, and Policies and Procedures. ARIZONA@WORK Pinal County both ensures federal EO compliance with programmatic and architectural accessibility (i.e. reasonable accommodations) for individuals with disabilities ensures compliance with EO policies. Whenever possible and with proper notice (generally 48 hours), the Pinal County workforce system fulfills requested accommodations.
Compliance Assurances – Contractors and Service Providers ARIZONA@WORK Pinal County is committed to making all services, facilities, and information accessible to individuals without regard to race, color, religion, sex, national origin, age, disability, political affiliation, or belief. This applies to all programs, activities, and services provided by or made available to potential employees, volunteers, contractors, service providers, licensees, clients, and potential clients within the ARIZONA@WORK Pinal County system. To reinforce this commitment, all contractors and service providers are required to provide written assurance in their agreements, grants, and contracts that they are committed to and will comply with related laws and regulations as mentioned previously in this section.
ARIZONA@WORK Pinal County has established a comprehensive communication system, both written and electronic, that is accessible to all registrants, applicants, eligible applicants/registrants, applicants for employment, employees and interested members of the public. The system makes them aware of the local area’s obligation to operate its programs and activities in a nondiscriminatory manner, and the extent of the rights of members of these groups to file complaints of discrimination. POLICIES IN PROCESS The Equal Opportunity and Complaint policies are posted on the ARIZONA@WORK Pinal County website (https://arizonaatwork.com/pinal-county/plans-policies-lawsfederal-regulations) along with all other programmatic policies. The EO and Complaint policies were developed following the same formulas as all other programmatic policies, which consists of an initial draft being developed and then issued for public comment for 10 days via a posting on the ARIZONA@WORK Pinal County website. The comment period, which included a thorough review by the State WIOA EO Officer, was followed by suggested revisions being made and a final review conducted with stakeholders. The final policy was posted on the website.

236
EXHIBITS

237
EXHIBIT 1: POSTINGS FOR PUBLIC COMMENTS

238
EXHIBIT 2: DISTRIBUTION LIST FOR PUBLICCOMMENTS

239
EXHIBIT 3: PUBLIC COMMENTS RECEIVED

240
EXHIBIT 4: FUNDAMENTALS MAP

241 Yellow highlights= delete/Green highlight=wordsmith
Pinal County Workforce Development Board
DRAFT – A WORKING Document May 2020
State Flag Graphic Pinal County Logo
Pinal County Workforce Development Board
VISION: Board’s Vision for Workforce Development in Pinal County:Pinal County: A vibrant, affordable community, home to a skilled, diverse workforce; providing innovative opportunities for job seekers, employers, and employees to learn, grow, and prosper.
MISSION: The mission of the Pinal County Workforce Development Board is to fulfill the Six Purposes of WIOA.
CORE BELIEFS ARIZONA@WORK Pinal County is the public workforce system implemented by the collective and
collaborative activities of:
The Governor’s Workforce Arizona Council
The Arizona Commerce Authority/The Arizona Office of Economic Opportunity
Pinal County Board of Supervisors
Pinal County Workforce Development Board
The Arizona Department of Economic Security
o Employment Services, Business Services, Veterans Service, Vocational Rehabilitation
Services, Unemployment Insurance, and others.
The Arizona Department of Education
o Adult Basic Education, Career and Technical Education and others.
Contracted Service Providers for One Stop Operator, Adult/Dislocated Worker and Youth
LEADERSHIP
True Leaders Change
Things to Make them Better
CORE VALUES
Do the right thing
Commit to Excellence
Care about one another
KEY GOALS
AS A
FUNCTION OF
THE BOARD
PROMOTE A STRONG PINAL COUNTY ECONOMY
Support Pinal County’s capacity to attract, retain and grow thriving businesses
through effective workforce development strategies. (economic/business service
focus)
SERVE BUSINESS NEEDS
Serve the Pinal County business community by
understanding, anticipating and instituting a proactive
approach to assist in meeting workforce needs
(business service focus)
Coordinated community business service effort
Be knowledgeable and prepared to discuss and
strategize with Pinal County industry sectors and
individual businesses on challenges related to
workforce development. (Doing our homework)
PREPARE JOB SEEKERS FOR
EMPLOYMENT OPPORTUNITES IN HIGH
GROWTH INDUSTRIES
Prepare and match ARIZONA@WORK Pinal
County job seekers to employers for a successful
career pathway (job seeker focus)
PROVIDE AN EFFICIENT, ACCOUNTABLE
WORKFORCE SYSTEM
Accelerate transparent, measurable impact and
performance while maximizing the resources
available to Pinal County’s workforce system
MISSION
OUTCOMES/
Objectives
How well we
fulfill our
mission and key
goals
To be identified
via the A3
completion
LEAD
MEASURES
How well we
implement our
key functions to
impact mission
outcomes
To be identified
via the A3
completion
IDENTIFY
UNDERSTAND
CUSTOMER
. NEEDS
Do More Good IMPROVE
PROCESSES
RESULTS
Exhibit 4

242 Yellow highlights= delete/Green highlight=wordsmith
KEY
FUNCTIONS/
Strategies
Years 1-2
Activities that
fulfill our
mission and roles
Break out by
year
PCWDB develop and articulate a strategic
vision for ARIZONA@WORK Pinal County
focused on seamless service integration
(Service focus not program focus)
Improve workforce data quality
Leverage funding efficiently
Define PCWDB’s optimum structure for board
operations and staff operations
Establish board staff unit with
capacity to manage strategic planning
tools
Standardize criteria to determine selection of
service delivery locations and level of service at
each site (Comp Ctr, Affiliate, Specialized Ctr,
Access Point).
Expand virtual access and services
for businesses and job seekers,
particularly hard-to-serve
communities and populations
Possible “Strengths”
to be identified in
the 2020-24
ARIZONA@WOR
K State Plan
Possible
“Weaknesses” to be
identified in the
2020-24
ARIZONA@WOR
K State Plan
ARIZONA@WORK Pinal County
Interagency Structure
ARIZONA@WORK Core Partners Under WIOA ARIZONA@WORK Pinal County Annual Dashboard
The Governor’s Office
o Workforce Arizona
Council
The Arizona Commerce Authority
The Arizona Office of Economic
Opportunity
The Arizona Department of
Economic Security
The six core programs are:
WIOA Title 1:
o Title 1b: Adult,
o Dislocated Worker/Rapid Response and
o Youth Services.
WIOA Title 2: Adult Education and Family Literacy
WIOA Title 3: Wagner-Peyser Employment Services
WIOA Title 4: Vocational Rehabilitation
Business Services
Local Veterans Employment Representative
(LVER)
Disabled Veterans Outreach Program (DVOP)
Arizona Registered Apprenticeship Program
TANF Jobs Program
Work Opportunity Tax Credit (WOTC)
Reemployment Services and Eligibility
Assessment Program (RESEA)
Unemployment Insurance (UI) Benefits
Trade Adjustment Assistance (TAA)
Federal Bonding Program (FBP)

243 Yellow highlights= delete/Green highlight=wordsmith
The Arizona Department of
Education
o Adult Basic
Education, Career
and Technical
Education and
others.
Governor-Designated Local
Workforce Development Areas
(Title 1a: State and local governance
by the Workforce Arizona Council and
Local Workforce Development Boards
(LWDB)
o Pinal County Board of
Supervisors
o Pinal County Workforce
Development Board
Migrant and Seasonal Farm Workers (MSFW)
Program (WIOA Title I and Monitor Advocate)
Arizona Department of Corrections Adult
Education

244
EXHIBIT 5: SUBSTATE ALLOCATIONS FORMULA

Exhibit 5
U. S. Department of Labor
Employment and Training Administration
FOR USE IN SUB-STATE ALLOCATION FORMULAS
Workforce Innovation and Opportunity Act (WIOA) Statutory and Discretionary Formulas for Sub State Allocations
Sub-State Allocations Statutory Formula Descriptions
WIOA Youth Activities
Formula:
1/3: Local area relative share of total unemployed in areas of substantial unemployment (ASU) (average 12 months ending 6/30)
1/3: Local area relative share of excess unemployed (average 12 months ending 6/30)
1/3: Local area relative share of disadvantaged youth (American Community Survey 2011-2015)
Minimums:
A local area may not receive an allocation percentage that is less than 90 percent of the average allocation percentage of the past 2 years.
Maximum: Not allowed
WIOA Adult Activities
Same as Youth Activities, except
Formula uses disadvantaged ADULTS instead of YOUTH
WIOA Dislocated Workers
Formula:
Funds to local areas must be allocated based on a formula created by the Governor using the following 6 data factors:
Insured unemployment data
Unemployment concentrations
Plant closing and mass layoff data
Declining industries data
Farmer-rancher economic hardship data
Long-term unemployment data
The formula will use the most appropriate data available
Weighting a factor zero is not permitted unless a rational is presented in an approved State Plan.
Minimum:
A local area may not receive an allocation percentage that is less than 90 percent of the average allocation percentage of the past 2 years.
Maximum: Not required, but allowed
____________________________________________________________________________________________________
Sub-State Allocations Discretionary Formula Descriptions for Youth and Adult Activities
____________________________________________________________________________________________________
WIOA Youth Activities
Formula:
No less than 70 percent of the funds will be distributed as stated in the statutory formula;
1/3: Local area relative share of total unemployed in areas of substantial unemployment (ASU) (average 12 months ending 6/30)
1/3: Local area relative share of excess unemployed (average 12 months ending 6/30)
1/3: Local area relative share of disadvantaged youth (American Community Survey 2011-2015)
No more than 30 percent of the remaining funds will be distributed using additional data related to both:
(1) Excess youth poverty in urban, rural, and suburban local areas; and
(2) Excess unemployment above the State average in urban, rural, and suburban local areas
Minimums:
Statutory formula minimum must be applied to 70 percent or greater funds, or to the entire allocation.
Maximum: Not allowed
WIOA Adult Activities
Same as Youth Activities, except
Formula uses disadvantaged ADULTS instead of YOUTH and EXCESS POVERTY instead of excess YOUTH poverty
Formula Data Factor Definitions
WIOA Youth and Adults Programs
ASU: contiguous areas with unemployment rate of 6.5 percent or more
Excess unemployed: higher of:
(1) excess unemployed (unemployment in excess of 4.5 percent) in ASU's; or
(2) excess unemployed (unemployment in excess of 4.5 percent) in all areas
Disadvantaged adults: individuals, age 22-72, meeting (or member of family meeting):
Census poverty level or 70 percent of lower living standard income level (LLSIL).
Disadvantaged youth: individuals, age 16-21, meeting (or member of family meeting):
Census poverty level or 70 percent of lower living standard income level (LLSIL).
245

WIOA Youth and Adult Sub-State Allocations:Must be allocated to local areas per
Formula or Discretionary rules
States must choose one of these allocation methods
Formula Allocation:Must be equally split
ExcessUnemployment
ASUDisadvantaged
Adult/Youth
Discretionary Allocation:Ratio Split
≥ 70% ≤ 30%
ExcessUnemployment
ASUDisadvantaged
Adult/Youth
Excess Unemployment
above state average
ExcessYouth/Poverty
+
Minimum percentage (stop loss) may apply
May be split at any ratio using both factors but no more than 30% of
total funding
Must be split in equal parts and must total no less than 70% of total fundingMinimum percentage (stop loss) applies
Minimum percentage (stop loss) applies
246

WIOA Dislocated Worker Sub-State Allocations:Must be allocated to local areas per
Formula created by the Governor
States must use the following six data factors using the most
appropriate data available
Unemployment concentrations
Insured unemployment
data
Plant closing and mass layoff
data
Minimum percentage (stop loss) applies
Maximum percentage (stop gain) not required but may apply
Declining industries data
Farmer-rancher economic
hardship data
Long-term unemployment
data
Weighting a factor zero is not permitted unless a rational is presented in an approved State Plan
Sum of the weights of the six data factors must add up to 100 percent
247

248
EXHIBIT 6: LIVABLE WAGES

Exhibit 6
Living Wage Calculation for Pinal County, Arizona
Source: LIVING WAGE CALCULATOR
User’s Guide / Technical Notes - 2018 Update Prepared for Amy K. Glasmeier, Ph.D.
By Carey Anne Nadeau, Open Data Nation Updated 12/30/2018
Department of Urban Studies and Planning Massachusetts Institute of Technology 77 Massachusetts Ave., Room 7-346
Cambridge, MA 02139
The living wage shown is the hourly rate that an individual in a household must earn to support his or herself and their family. The assumption is the sole provider is working full-time (2080 hours per year). The tool provides information for individuals, and households with one or two working adults and zero to three children. In the case of households with two working adults, all values are per working adult, single or in a family unless otherwise noted.
The state minimum wage is the same for all individuals, regardless of how many dependents they may have. Data are updated annually, in the first quarter of the new year. State minimum wages are determined based on the posted value of the minimum wage as of January one of the coming year (National Conference of State Legislatures, 2019). The poverty rate reflects a person's gross annual income. It is converted it to an hourly wage for the sake of comparison.
Living Wage:
# Children 0 1 2 3 0 1 2 3 0 1 2 3Living Wage 11.90$ 24.93$ 30.61$ 39.92$ 19.08$ 23.46$ 26.16$ 30.29$ 9.54$ 13.69$ 16.72$ 20.46$ Poverty Wage 5.84$ 7.91$ 9.99$ 12.07$ 7.91$ 12.07$ 12.07$ 14.14$ 3.96$ 5.00$ 6.03$ 7.07$ Minimum Wage 10.50$ 10.50$ 10.50$ 10.50$ 10.50$ 10.50$ 10.50$ 10.50$ 10.50$ 10.50$ 10.50$ 10.50$
1 Adult 2 Adults (1 Working) 2 Adults (Both Working)
249

Typical Expenses
These figures show the individual expenses that went into the living wage estimate. Their values vary by family size, composition, and the current location.
Typical Expenses:
# Children 0 1 2 3 0 1 2 3 0 1 2 3Food 3,573$ 5,267$ 7,929$ 10,517$ 6,551$ 8,154$ 10,529$ 12,820$ 6,551$ 8,154$ 10,529$ 12,820$ Child Care -$ 6,904$ 12,809$ 18,714$ -$ -$ -$ -$ -$ 6,904$ 12,809$ 18,714$ Medical 2,262$ 7,455$ 7,112$ 7,194$ 5,156$ 7,112$ 7,194$ 6,913$ 5,156$ 7,112$ 7,194$ 6,913$ Housing 8,208$ 12,156$ 12,156$ 17,688$ 9,780$ 12,156$ 12,156$ 17,688$ 9,780$ 12,156$ 12,156$ 17,688$ Transportation 4,206$ 7,664$ 9,011$ 1,250$ 7,664$ 9,011$ 10,425$ 10,307$ 7,664$ 9,011$ 10,425$ 10,307$ Other 2,976$ 4,951$ 5,375$ 6,256$ 4,951$ 5,375$ 6,256$ 6,121$ 4,951$ 5,375$ 6,256$ 6,121$
1 Adult 2 Adults (1 Working) 2 Adults (Both Working)
Required Annual Income:
# Children 0 1 2 3 0 1 2 3 0 1 2 3Required Annual Income After Taxes
21,225$ 44,396$ 54,392$ 70,794$ 34,101$ 41,808$ 46,560$ 53,850$ 34,101$ 48,712$ 59,369$ 72,564$
Annual Taxes 3,532$ 7,458$ 9,276$ 12,242$ 5,586$ 6,987$ 7,852$ 9,160$ 5,586$ 8,243$ 10,182$ 12,564$ Required Annual Income After Taxes
24,757$ 51,854$ 63,668$ 83,037$ 39,687$ 48,795$ 54,412$ 63,010$ 39,687$ 56,955$ 69,551$ 85,128$
1 Adult 2 Adults (1 Working) 2 Adults (Both Working)
250

251
EXHIBIT 7: YOUTH PROGRAM DEFINITION:“ADDITIONAL ASSISTANCE”

970 N. Eleven Mile Corner Road, Casa Grande, AZ 85194|(520) 866-8085| [email protected]/pinal
Youth Who Requires Additional Assistance
ARIZONA@WORK Pinal County defines the “youth who requires additional assistance” as an individual who needs additional assistance to complete an educational program, or to secure and hold employment. Not more than five percent of all In-school enrolled in the program each year are eligible only based on the “requires additional assistance” criterion.
(Note: All In-School/Out-of-school Youth must be low income unless included in the 5% low-income exception)
Out of School Youth (OSY) In addition to meeting the low-income eligibility criteria, a youth who needs additional assistance may be eligible for WIOA Youth Services if one of the following criteria is met under this category:
Section Policy Provision Documentation Needed
Poor Work History/Underemployed
Has poor, limited or no work history and/or sporadic employment and is no longer employed or is seeking employment for the last 2 months, but remains unemployed or underemployed.
Work History Form Case notes
Has Incarcerated Parent(s) One or both parents is incarcerated Legal Document Self-Attestation Case Note
Occupational Skills/ Further Education Deficiency
Lack of educational, occupational and/or technical training that reduces opportunities for gainful employment and causes income poverty; poor access to quality education and job opportunities
Work History Form Self-Attestation Case Note
Counseling Services Is receiving or has received additional services through a licensed Counseling/Rehabilitation Agency.
Referral/Letter from Agency
In School Youth (ISY) In addition to meeting the low-income eligibility criteria, a youth who needs additional assistance may be eligible for WIOA Youth Services if one of the following criteria is met under this category:
Section Policy Provision Documentation Needed Poor School Attendance Has displayed chronic poor attendance within the last
school quarter and/or has an attendance rate of less than 85%.
School Record
Alternative Schooling Is currently attending an alternative school/education program that leads to a High School Diploma or High School Equivalency.
School Record
At Risk of Drop Out Is currently at risk of dropping out of school, as determined by referral from a school staff person, probation officer, or other responsible person with proper documentation and/or possesses unsatisfactory grades, GPA, and/or amount of credits.
School Record
School Disciplinary Has received or is receiving continuous disciplinary actions and/or is under a type of academic probation.
School Record
Counseling Services Is receiving or has received additional services through a licensed Counseling/Rehabilitation Agency.
Referral/Letter from Agency
Exhibit 7
252

253
EXHIBIT 8: CENTER FOR FUTURE OF ARIZONAPROGRESS METERS

Exhibit 8
In November 2019, the Business, Education and Workforce Committee of the Pinal Partnership1 hosted its 6th Annual Summit at the Central Arizona College, San Tan Campus. The theme of the event was “Collective Impact” and revolved around the Center for the Future of Arizona’s Progress Meters. Brief overviews of each progress meter were provided and subsequent discussions were held around the each meter and the collective impact it has on the others.
In the world of workforce development it is not difficult to make a case of the collective impact each meter may have when strategizing on an overall workforce development strategy. Research has shown that low childhood literacy has negative long-term consequences, and three-fourths of Arizona's third-graders do not read proficiently. Statistics show that children who are not able to read at grade level by fourth grade are four times more likely not to graduate from high school, and this can contribute to a cycle of poverty. The Opportunity Youth as an element of the Education Progress Meter targets the same population as the WIOA Youth Program.
Impacts of education to develop a workforce pipeline coincides with the intent of WIOA. It is a natural alignment of focus in terms of Infrastructure (e.g., roads, broadband) , Young Talent, Health along with Natural Resources (as an economic development targeted industry) and Civic Participation. Collectively, the Progress Meters track critical elements that must be in sync to attract train and retain a viable workforce.
The Progress Meters also allow for common ground definitions/data points for all state and local efforts rather than a myriad of initiatives with disparate ( or closely aligned ) missions but self-focused data points and outcome data/criteria.
Below is a summary of each of the meters.2
1 Pinal Partnership was formed to bring together all the people and ideas that will ultimately lead Pinal County to its full potential. Active Pinal Partnership committees that support issues facing Pinal County are: Education; Parks, Trails, Open Space and Public Lands; Health and Human Services; Government Relations; Economic Development; Transportation and Infrastructure and Water Resources 2 NOTE ABOUT THE DATA: For the medium and smaller Arizona counties and MSAs, results are known to require regular revisions. The most reliable data are provided through the annual numbers. When revisions are made, the metrics are adjusted within the CFA website and the Local Progress Meter Data Profile Report. As the data is dynamic,
254

Exhibit 8
Jobs Progress MeterWHY IT MATTERS: Arizonans want jobs that utilize their talents, build their future, and help our economy thrive.
WHAT SUCCESS LOOKS LIKE: Arizonans have the career advancement, training and education opportunities they need to reach their full potential and are equipped to participate at all stages of life in a growing, vibrant and rapidly evolving economy.
The Jobs Progress Meter tracks the following:
ELEMENT DESCRIPTION DATA AVAILABILITY
Job Growth (https://www.arizonafuture.org/az-progress-meters/jobs/job-growth/)
Job growth represents net job growth: the number of jobs created minus the number of jobs lost during a given period. Arizona continues to grow in population, and with that growth there are more people who need jobs.
Job Growth is updated monthly and annually for the following localities: • State• Counties• Certain Municipal Statistical Areas
(MSAs)
Unemployment Rate (https://www.arizonafuture.org/az-progress-meters/jobs/unemployment-rate/)
Unemployment is measured by the total number of unemployed as a percent of the civilian labor force. The US Bureau of Labor Statistics refers to this percentage as “U-3.” The unemployment rate is published monthly, and it is widely reported as an important indicator of the health of the labor force. People who choose not to work because they are retired or are at-home parents, for example, are not counted toward the unemployment numbers. Unemployment will be reported in comparison with recent periods.
Unemployment is updated monthly, quarterly and annually for the following localities:
• State• Counties• Certain Municipal Statistical
Areas (MSAs)
the meters are best viewed on the interactive website pages provided by the Center for the Future of Arizona. Some data is only available at the Metropolitan Statistical Area (MSA) level while other data sets can be drilled down to County level.
255

Exhibit 8
ELEMENT DESCRIPTION DATA AVAILABILITY
Underemployment Rate (https://www.arizonafuture.org/az-progress-meters/jobs/underemployment-rate/)
Underemployment is a measure of the percentage of the labor force that is unemployed, employed in work that under-utilizes their skills, or employed part-time but not by choice. Arizona’s underemployment rate is compared to the national average. The Bureau of Labor Statistics’ official measure of underemployment is known as “U-6.”
Underemployment is updated quarterly and annually for the following localities:
• State
Labor Force Participation (https://www.arizonafuture.org/az-progress-meters/jobs/labor-force-participation/)
The Labor Force Participation rate is the proportion of the working-age population that is either working or actively looking for work (officially labeled unemployed). Arizona’s economy has the potential to grow more rapidly with a higher labor force participation rate. While the US and Arizona labor force participation rates had declined during the Great Recession, the trend now appears to have reversed and become more positive.
Labor Force Participation is updated monthly, quarterly and annually for the following localities:
• State
Average Wages Per Worker (https://www.arizonafuture.org/az-progress-meters/jobs/average-wages-per-worker/)
Average Wages Per Worker are calculated by dividing total wages by the average of the employment levels for a given period, such as quarterly or annually. Comparisons are made with recent periods, between similar counties, and between Arizona, the nation and other Western states.
Arizona’s median family income has been below average. The ability of Arizonans to earn a livable wage is significant to each family’s quality of life and to the state’s ability to provide services through taxes.
Average Wages Per Worker is updated annually and reports the annual average wages for employed persons for the previous year within the following localities:
• Nation• States• Counties
256
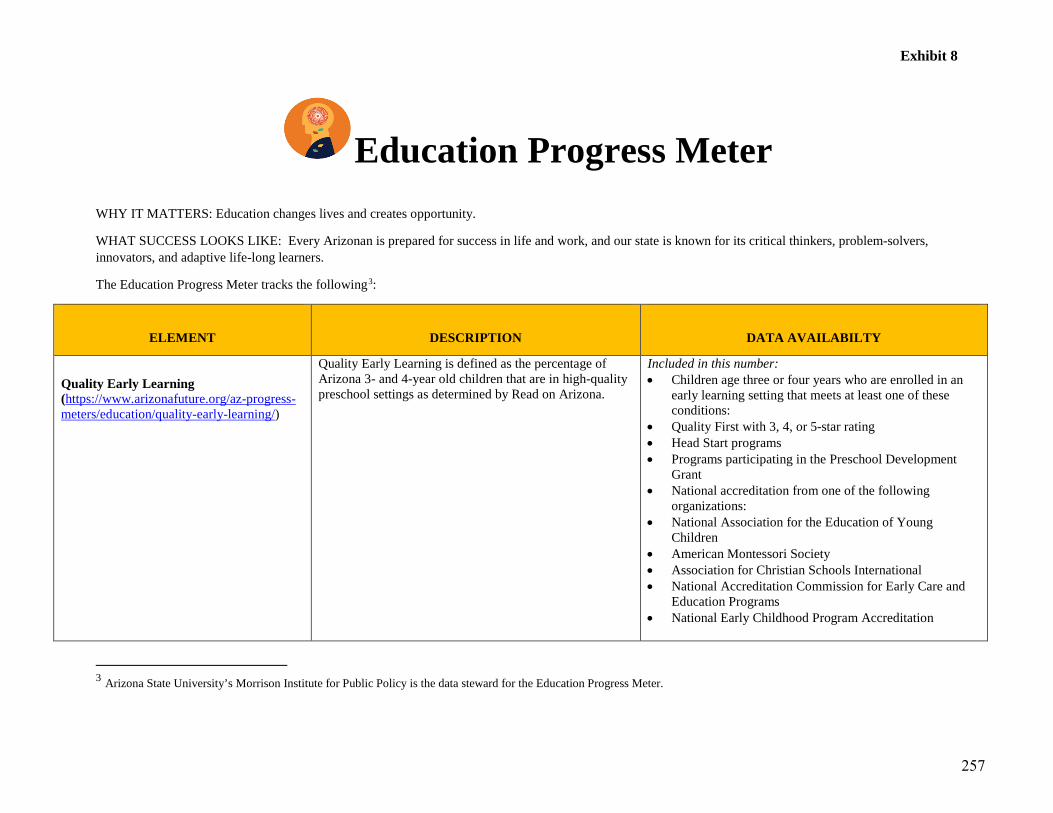
Exhibit 8
Education Progress MeterWHY IT MATTERS: Education changes lives and creates opportunity.
WHAT SUCCESS LOOKS LIKE: Every Arizonan is prepared for success in life and work, and our state is known for its critical thinkers, problem-solvers, innovators, and adaptive life-long learners.
The Education Progress Meter tracks the following3:
ELEMENT DESCRIPTION DATA AVAILABILTY
Quality Early Learning (https://www.arizonafuture.org/az-progress-meters/education/quality-early-learning/)
Quality Early Learning is defined as the percentage of Arizona 3- and 4-year old children that are in high-quality preschool settings as determined by Read on Arizona.
Included in this number: • Children age three or four years who are enrolled in an
early learning setting that meets at least one of theseconditions:
• Quality First with 3, 4, or 5-star rating• Head Start programs• Programs participating in the Preschool Development
Grant• National accreditation from one of the following
organizations:• National Association for the Education of Young
Children• American Montessori Society• Association for Christian Schools International• National Accreditation Commission for Early Care and
Education Programs• National Early Childhood Program Accreditation
3 Arizona State University’s Morrison Institute for Public Policy is the data steward for the Education Progress Meter.
257
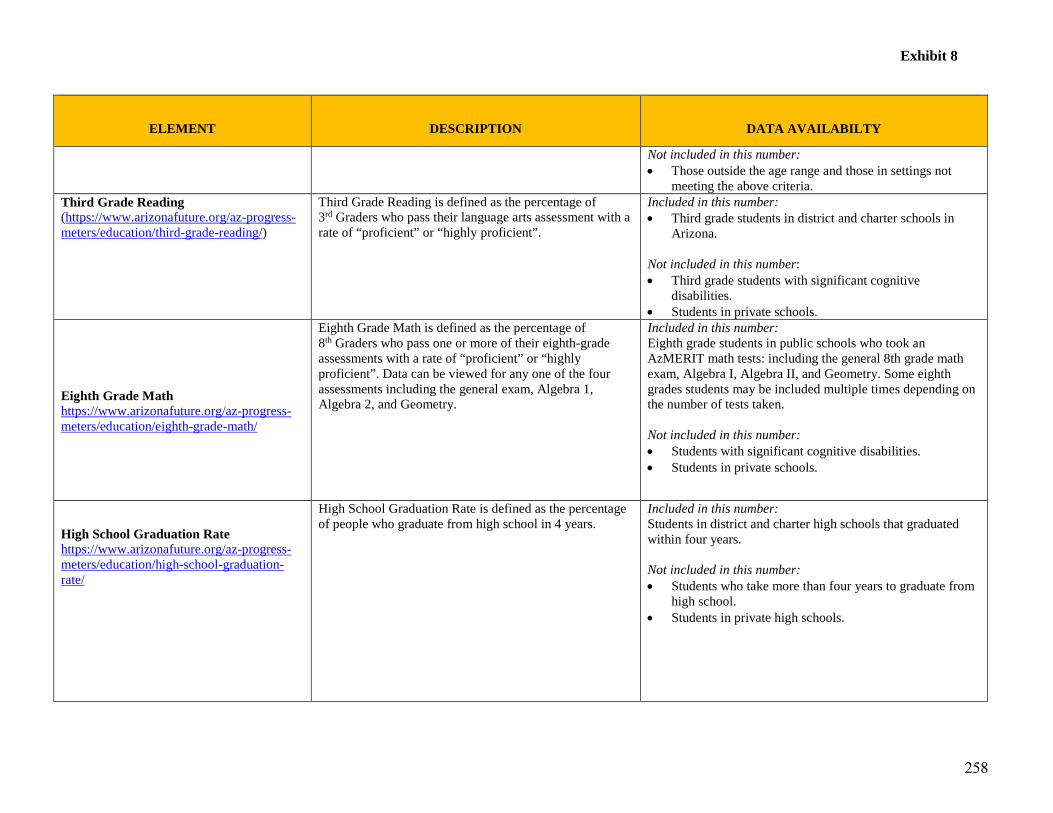
Exhibit 8
ELEMENT DESCRIPTION DATA AVAILABILTY
Not included in this number: • Those outside the age range and those in settings not
meeting the above criteria.Third Grade Reading (https://www.arizonafuture.org/az-progress-meters/education/third-grade-reading/)
Third Grade Reading is defined as the percentage of 3rd Graders who pass their language arts assessment with a rate of “proficient” or “highly proficient”.
Included in this number: • Third grade students in district and charter schools in
Arizona.
Not included in this number: • Third grade students with significant cognitive
disabilities.• Students in private schools.
Eighth Grade Math https://www.arizonafuture.org/az-progress-meters/education/eighth-grade-math/
Eighth Grade Math is defined as the percentage of 8th Graders who pass one or more of their eighth-grade assessments with a rate of “proficient” or “highly proficient”. Data can be viewed for any one of the four assessments including the general exam, Algebra 1, Algebra 2, and Geometry.
Included in this number: Eighth grade students in public schools who took an AzMERIT math tests: including the general 8th grade math exam, Algebra I, Algebra II, and Geometry. Some eighth grades students may be included multiple times depending on the number of tests taken.
Not included in this number: • Students with significant cognitive disabilities.• Students in private schools.
High School Graduation Rate https://www.arizonafuture.org/az-progress-meters/education/high-school-graduation-rate/
High School Graduation Rate is defined as the percentage of people who graduate from high school in 4 years.
Included in this number: Students in district and charter high schools that graduated within four years.
Not included in this number: • Students who take more than four years to graduate from
high school.• Students in private high schools.
258

Exhibit 8
ELEMENT DESCRIPTION DATA AVAILABILTY
Opportunity Youth https://www.arizonafuture.org/az-progress-meters/education/opportunity-youth/
Opportunity Youth is defined as the percent of 16-24-year olds that are NOT going to school or working.
Included in this number: Arizona residents age 16-24, inclusive, who are neither working nor attending school.
Not included in this number: Those outside the age range and those working or attending school. Those living in group quarters are excluded from poverty measures because their income is not calculated for the poverty statistic.
Post High School Enrollment https://www.arizonafuture.org/az-progress-meters/education/post-high-school-enrollment/
Post-High School Enrollment is defined as the annual percentage of Arizona high school graduates who register for college in the immediate school term following graduation.
Included in this number: Arizona district and charter high school students who graduated in 2017-18 school year and enrolled in post-secondary education during the 2018-19 school year. Post-secondary enrollment includes in-state and out-of-state universities, community colleges, or private postsecondary trade schools.
Not included in this number: • Students who have enlisted in the military.• Students attending the small number of private
postsecondary institutions that do not send data to theNational Student Clearinghouse.
• Students on religious missions.• Additionally, three types of schools, and their
accompanying students were removed from the county-level data:o Graduates of three schools whose county location
could not be definitively identified. These schoolshad a total of 80 graduates and 21 enrollees inpostsecondary education.
o Graduates of 54 high schools whose graduating classwas 5 or fewer students. These schools would havetotal maximum of 255 (51 x 5) graduates.
o Graduates of 110 high schools that had fewer than 5students enroll in the postsecondary education.
259

Exhibit 8
ELEMENT DESCRIPTION DATA AVAILABILTY
Post-Secondary Attainment https://www.arizonafuture.org/az-progress-meters/education/post-secondary-attainment/
Post-Secondary Attainment is defined in two ways: • State data are presented as the annual percentage of
Arizona residents who have some form of post-secondary certificate or degree. This could includeeducation from a technical school, military servicecredentials, apprenticeships or a degree from collegeor university. It is on this measure that the goal of60% is established.
• County and Demographic data are presented as theannual percentage of Arizona residents with a 2-yearAssociate’s degree or higher. This is due to the factthat annual data for these groups in the broaderdefinition of attainment as described in (1.) are notgenerally within acceptable standards of error becauseof small sample sizes. If we included all forms ofpost-secondary credentials, this number would beapproximately 5% points higher for most localitiesand demographics.
Included in this number: • Arizona residents age 25-64 who have two-year, four-
year, or advanced degrees from public or privateinstitutions or who have an active professional certificateor license.
• Alternatively, for county data and demographicsubgroups, this measure includes only those withAssociate’s degrees or higher as data for professionalcertificates or licenses are not available due to the limitedsample size.
Not included in this number: • Those who have never had post high-school education or
have attended but earned neither a degree or non-degreecertificate are not included. Also excluded are peopleunder age 25, many of whom are still working on theireducation.
• Those age 65 and over, many of whom are retired, arealso excluded.
• Those living in group quarters are excluded from povertymeasures because their income is not calculated for thepoverty statistic.
Teacher Pay https://www.arizonafuture.org/az-progress-meters/education/teacher-pay/
Teacher Pay is defined as the rank of Arizona’s elementary school teachers as compared to the other US states and British Colombia. Importantly, these data measure the salaries of all teachers, including those at charter schools and account for primary and secondary school teachers separately.
Included in this number: Median pay for district, charter, and private school elementary teachers, except for special education teachers. Median pay for public and private school secondary teachers, except for special education and career/technical education teachers. These numbers are adjusted to compensate for the regional cost of living. Included in these wage estimates are base salary, cost-of-living allowances, incentive pay, and several other items.
Not included in this number: Preschool, special education, career and technical teachers, teacher’s aides, or administrators. Overtime pay, stock
260

Exhibit 8
ELEMENT DESCRIPTION DATA AVAILABILTY
bonuses, and year-end-bonuses are excluded from the calculation of wages. NOTE: A complete description of the BLS definition of wages can be found at: https://www.bls.gov/oes/oes_ques.htm#def
261

Exhibit 8
Young Talent Progress MeterWHY IT MATTERS: Arizona’s long-term success depends on the contributions of all our young people.
WHAT SUCCESS LOOKS LIKE: Arizona is “the place to be” for the next generation of doers, makers, thinkers and innovators to advance their lives and communities.
Throughout 2018, CFA hosted 12 focus groups with 100 young people with a target of ages 18-39.The Young Talent metrics continue to be refined and shaped in the year ahead as dialogue continues with communities about their key priorities and aspirations for the future of the state. Current themes that have emerged from these discussions include an emphasis on the following types of issues:
• Quality of Public Transit• Rural/Urban Access to Broadband• Ratio of Counselors to Students in Arizona High Schools• Investment in Education• Reputation of Arizona Colleges and Universities• Retention of College Graduates over Time• Availability of Affordable, Workforce Housing• Cost of Living• Extent of Substance Abuse• Diversity of Arizona’s Population• Health of Arizona’s Nonprofits
262

Exhibit 8
Health and Well-Being Progress Meter
WHY IT MATTERS: Health and well-being are essential to our quality of life and to the success of our communities.
WHAT SUCCESS LOOKS LIKE: Arizonans enjoy good health, live in healthy communities, and have access to affordable health care and wellness resources.
The Health and Well-Being Progress Meter tracks the following:
ELEMENT DESCRIPTION DATA AVAILABILITY
Asthma Asthma is measured by the percent of Arizonans who reported they have been told by a healthcare professional that they have asthma.
Asthma is updated annually and is available for the following localities: • Nation• States• Counties
Percentage of Arizonans Without Health Insurance https://www.arizonafuture.org/az-progress-meters/health-and-wellbeing/percentage-of-arizonans-without-health-insurance/
This metric is measured by the percentage of Arizonans who reported they do not have health insurance as compared to the national average.
Percentage of Arizonans without Health Insurance is updated annually and is available for the following localities: • Nation• States• Counties
Relative Cost of Arizona Healthcare https://www.arizonafuture.org/az-progress-meters/health-and-wellbeing/relative-cost-of-arizona-healthcare/
Relative Cost of Arizona Healthcare is measured in two ways:
1. Arizonan’s health spending per capita is updated annuallyand is available for the following localities:• Nation• States
263

Exhibit 8
ELEMENT DESCRIPTION DATA AVAILABILITY
(1) Arizona’s spending per capita on healthcare (i.e., thetotal amount of spending on healthcare in Arizona, dividedby the total population); and
(2) the percentage of Arizonans who reported they did notseek medical treatment in the past year due to cost, ascompared to the nation as a whole.
2. The percentage of Arizonans who reported they did notseek medical treatment in the past year due to cost isupdated annually and is available for the followinglocalities:• Nation• States• Counties
Air Quality https://www.arizonafuture.org/az-progress-meters/health-and-wellbeing/air-quality/
Air Quality is measured by the number of days that exceed the federal Environmental Protection Area standard for maximum pollutant concentrations. Measures are only available in areas that are considered “Nonattainment Areas.” Depending on the area, ozone and particulate matter are measured.
Air Quality is updated annually and is available for nonattainment areas.
Physical Activity https://www.arizonafuture.org/az-progress-meters/health-and-wellbeing/physical-activity/
Physical Activity is measured by three indicators:
(1) Percentage of Arizonans who report exercising for atleast 30 minutes three or more days per week;
(2) Percentage of Arizonans who report they meet bothrecommended aerobic and strength physical activityguidelines; and
(3) Percentage of Arizona youth who are active at leastfive days per week.
1. Percentage of Arizonans who report they meet bothrecommended aerobic and strength physical activityguidelines, which are defined as: AerobicGuideline=150+ Minutes/Week, Strength Guideline=2+Sessions/Week.Data are updated annually and are available for thefollowing localities:• Nation• State• County
2. Percentage of Arizonans who report exercising for atleast 30 minutes three or more days per week is updatedannually and is available for the following localities:• Nation• State
3. Percentage of Arizona youth who are active at least fivedays of the week is updated annually and is available for:• Nation• State
264

Exhibit 8
ELEMENT DESCRIPTION DATA AVAILABILITY
Infant Mortality https://www.arizonafuture.org/az-progress-meters/health-and-wellbeing/infant-mortality/
Infant Mortality is measured as the number of children who die before their first birthday, per 1,000 live births.
Infant Mortality is updated annually and is available for the following localities:
• Nation• States• Counties
Incidence of Diabetes https://www.arizonafuture.org/az-progress-meters/health-and-wellbeing/incidence-of-diabetes/
Incidence of Diabetes is measured by the percent of Arizonans who reported they have been told by a healthcare professional that they have diabetes.
Incidence of Diabetes is updated annually and is available for the following localities:
• Nation• States• Counties
Incidence of Cardiac and Cerebral Disease https://www.arizonafuture.org/az-progress-meters/health-and-wellbeing/incidence-of-cardiac-and-cerebral-disease/
Incidence of Cardiac and Cerebral Disease is measured by four discrete metrics, including: (1) percent of Arizonans who reported they have been toldby a healthcare professional that they had a heart attack; (2) rate of deaths of Arizonans from diseases of the heart,age-adjusted, persons per 100,000 population; (3) percentof Arizonans who reported they have been told by ahealthcare professional that they had a stroke; and(4) rate of deaths of Arizonans from cerebrovasculardisease, age-adjusted, persons per 100,000 population.
Incidence of Cardiac and Cerebral Disease is updated annually and is available for the following localities:
• Nation• States• Counties
Mental Health Distress https://www.arizonafuture.org/az-progress-meters/health-and-wellbeing/mental-health-distress/
Mental Health Distress is measured as the percent of Arizonans who reported frequent mental distress which equates to 14 or more days of poor mental health in the last 30 days.
Mental Health Distress is updated annually and is available for the following localities:
• Nation• States• Counties
Hypertension https://www.arizonafuture.org/az-progress-meters/health-and-wellbeing/hypertension/
Hypertension is measured by the percent of Arizonans who reported they have been told by a healthcare professional that they have high blood pressure.
Hypertension is updated annually and is available for the following localities:
• Nation• States• Counties
265

Exhibit 8
Natural Resources Progress Meter
WHY IT MATTERS: Arizona’s natural beauty and resources are unique assets that contribute to our quality of life and economy.
WHAT SUCCESS LOOKS LIKE: Arizona’s natural resources are sustainably managed for future generations to support our shared prosperity.
The Natural Resources Progress Meter tracks the following:
ELEMENT DESCRIPTION DATA AVAILABILITY
Likelihood of Water Shortage from the Colorado River https://www.arizonafuture.org/az-progress-meters/natural-resources/likelihood-of-water-shortage-from-the-colorado-river/
The Likelihood of a Water Shortage from the Colorado River is measured by the Bureau of Reclamation, based on annual projections of water levels in Lake Mead, the reservoir that supplies much of Arizona’s water.
Likelihood of Water Shortage from the Colorado River data are only available for Lake Mead, the reservoir from which Arizona’s supplies are received. Updated every January and August, the August projection of the following January 1 water elevation determines whether a shortage is to be declared on the system.
Per Capita Water Use https://www.arizonafuture.org/az-progress-meters/natural-resources/per-capita-water-use/
Per Capita Water Use is measured as gallons per person used per day (GPCD). This measure is simply the amount of water used every day for a given geography and use, divided by the number of people.
Per Capita Water Use is updated annually and is available for: • State• Water providers that are either within an Active
Management Area (AMA) or who report their data to theDepartment of Water Resources.
266

Exhibit 8
ELEMENT DESCRIPTION DATA AVAILABILITY
Efficiency of Water Infrastructure https://www.arizonafuture.org/az-progress-meters/natural-resources/efficiency-of-water-infrastructure/
Efficiency of Water Infrastructure is measured by the amount and percent of water withdrawn from water sources (e.g., wells, lakes) by a water provider that is lost or unaccounted for before reaching the end user.
Efficiency of Water Infrastructure is updated annually and is available for total amount and percentage lost for:
• Arizona’s Active Management Areas (AMAs)• Water providers within the AMAs• Water providers within Community Water Systems
(CWS) that report their data
Relative Amount of Population and Land Area within Protected or Somewhat Protected Areas of Arizona https://www.arizonafuture.org/az-progress-meters/natural-resources/relative-amount-of-population-and-land-area-within-protected-or-somewhat-protected-areas-of-arizona/
Relative Amount of Population and Land Area within Protected or Somewhat Protected Water Areas of Arizona is measured by calculating the percentage of people and land within Active Management Areas (AMAs), mandatory adequacy jurisdictions and Irrigation Non-Expansion Areas (INAs) across Arizona.
Relative Amount of Population and Land Area within Protected or Somewhat Protected Areas of Arizona is updated annually and is available only for Arizona in a comparison with previous years.
Extent of Resolution of Arizona’s Disputed Water Rights https://www.arizonafuture.org/az-progress-meters/natural-resources/extent-of-resolution-of-arizonas-disputed-water-rights/
Extent of Resolution of Arizona’s Disputed Water Rights is measured by the number of Hydrographic Survey Reports (HSR) completed by Arizona Department of Water Resources for the 10 basins within the adjudications.
Extent of Resolution of Arizona’s Disputed Water Rights is updated annually and is available for Arizona’s 10 basins within the Little Colorado and Gila rivers adjudications with an annual comparison to the previous year.
Amount of Open Space and Acres of Open Space per Capita https://www.arizonafuture.org/az-progress-meters/natural-resources/amount-of-open-space-and-acres-of-open-space-per-capita/
Amount of Open Space” is measured by the number of acres of open space, including parks, preserves and federal public lands. “Acres of Open Space per Capita” is the number of acres divided by the latest population estimates of subject geographies. These metrics do not include State Trust lands, which are not available for public use without a permit.
Acres of Park Land and Acres of Park Land per Capita are updated when data are available for the following localities: • Arizona• Certain counties• Certain cities
267

Exhibit 8
ELEMENT DESCRIPTION DATA AVAILABILITY
Adoption of Regional/Municipal Resource Conservation Plans https://www.arizonafuture.org/az-progress-meters/natural-resources/adoption-of-regional-municipal-resource-conservation-plans/
Adoption of Regional/Municipal Resource Conservation Plans is measured by the number of adopted, qualifying conservation plans. Qualifying Natural Resource Conservation Plans must meet the following conditions: (1) It is developed with transparency and input from abroad set of constituents,
(2) It establishes goals for ecological resources, mayinclude cultural resources,
(3) It evaluates all lands and waters within the jurisdictionto measure benefits to resources,
(4) It establishes an implementation plan for acquiring orprotecting resources as required by goals and
(5) It is adopted by an agency with land use jurisdiction.
Adoption of Regional/Municipal Resource Conservation Plans is updated continuously when plans are adopted and is available for counties and cities within Arizona.
Extent of Forest Treatment to Reduce Damage from Catastrophic Forest Fires https://www.arizonafuture.org/az-progress-meters/natural-resources/extent-of-forest-treatment-to-reduce-damage-from-catastrophic-forest-fires/
Extent of Forest Treatment to Reduce Damage from Catastrophic Forest Fires is measured by the number of acres treated each year by authorized treatment projects within Arizona’s forests.
Extent of Forest Treatment to Reduce Damage from Catastrophic Forest Fires is updated annually and is available only for the state of Arizona.
Amount of Open Space and Acres of Open Space per Capita https://www.arizonafuture.org/az-progress-meters/natural-resources/amount-of-open-space-and-acres-of-open-space-per-capita/
Amount of Open Space” is measured by the number of acres of open space, including parks, preserves and federal public lands. “Acres of Open Space per Capita” is the number of acres divided by the latest population estimates of subject geographies. These metrics do not include State Trust lands, which are not available for public use without a permit.
Acres of Park Land and Acres of Park Land per Capita are updated when data are available for the following localities: • Arizona• Certain counties• Certain cities
268

Exhibit 8
ELEMENT DESCRIPTION DATA AVAILABILITY
Adoption of Regional/Municipal Resource Conservation Plans https://www.arizonafuture.org/az-progress-meters/natural-resources/adoption-of-regional-municipal-resource-conservation-plans/
Adoption of Regional/Municipal Resource Conservation Plans is measured by the number of adopted, qualifying conservation plans. Qualifying Natural Resource Conservation Plans must meet the following conditions: (1) It is developed with transparency and input from abroad set of constituents,
(2) It establishes goals for ecological resources, mayinclude cultural resources,
(3) It evaluates all lands and waters within the jurisdictionto measure benefits to resources,
(4) It establishes an implementation plan for acquiring orprotecting resources as required by goals and
(5) It is adopted by an agency with land use jurisdiction.
Adoption of Regional/Municipal Resource Conservation Plans is updated continuously when plans are adopted and is available for counties and cities within Arizona.
Extent of Forest Treatment to Reduce Damage from Catastrophic Forest Fires https://www.arizonafuture.org/az-progress-meters/natural-resources/extent-of-forest-treatment-to-reduce-damage-from-catastrophic-forest-fires/
Extent of Forest Treatment to Reduce Damage from Catastrophic Forest Fires is measured by the number of acres treated each year by authorized treatment projects within Arizona’s forests.
Extent of Forest Treatment to Reduce Damage from Catastrophic Forest Fires is updated annually and is available only for the state of Arizona.
269

Exhibit 8
Infrastruture Progress Meter
WHY IT MATTERS: Arizona’s economic vibrancy and livability rely on a robust infrastructure.
WHAT SUCCESS LOOKS LIKE: Arizonans enjoy access to safe and reliable energy, water, transportation, housing, and communications infrastructure built to meet future demand.
The Infrastructure Progress Meter measure the following:
ELEMENT DESCRIPTION DATA AVAILABILITY
Bridge and Pavement Conditions https://www.arizonafuture.org/az-progress-meters/infrastructure/bridge-and-pavement-conditions/
Bridge and Pavement Conditions are measured with three separate indicators –
(1) Bridge conditions: the percent of Arizona bridges inpoor condition;
(2) Interstate highway conditions: Percent of Arizonainterstate highway miles that are in poor condition;
(3) Non-Interstate highway conditions: Percent of Arizonahighway miles that are in poor condition.
Updated annually and available for: • National• States
270

Exhibit 8
ELEMENT DESCRIPTION DATA AVAILABILITY
Broadband Access https://www.arizonafuture.org/az-progress-meters/infrastructure/broadband-access/
Broadband Access is measured by the percentage of Arizonans who do not have access to broadband which is defined as terrestrial (ground-based) internet, providing speeds of at least 25 Megabits (Mb) per second download and 3 Mb per second upload.
Updated annually and available for: • National• States• Counties
Commute Time Length https://www.arizonafuture.org/az-progress-meters/infrastructure/commute-time-length/
Commute time length is measured by the Arizonan’s average commute time to work as reported by the US Census Bureau.
Updated annually and available for the following localities: • National• States• Counties• Some MSAs
Highway Travel Time Index https://www.arizonafuture.org/az-progress-meters/infrastructure/highway-travel-time-index/
Metropolitan roadway travel time reliability is measured by the Travel Time Index, which is a national measure of the ratio of travel time in the peak period as compared to the travel time at free-flow conditions.
Updated annually and available for select metropolitan areas nationally.
Quality of Public Transit https://www.arizonafuture.org/az-progress-meters/infrastructure/quality-of-public-transit/
Quality of Public Transit is measured by the statewide ranking of peer communities with the AllTransit™ performance score. “The AllTransit™ Performance Score is a comprehensive score that looks at connectivity, access to land area and jobs, frequency of service, and the percent of commuters who use transit to travel to work."
Updated annually and available for the following localities: • US Cities• Counties• Metropolitan Planning Organizations (MPOs)• Municipal Statistical Areas (MSAs)
Traffic Accidents https://www.arizonafuture.org/az-progress-meters/infrastructure/traffic-accidents/
Roadway fatalities and serious injuries are measured by (1) Ranking of Arizona traffic fatalities per 100 millionvehicle miles travelled as compared to the 51 US statesand the District of Columbia;
Updated annually for the following localities: • National• States
271

Exhibit 8
ELEMENT DESCRIPTION DATA AVAILABILITY
(2) Arizona injuries per 100 million vehicle milestravelled; and
(3) Raw number of fatalities and injuries for pedal cyclists,pedestrians, motorcyclists, and car crashes for localcommunities.
Alternative Fuel Vehicles https://www.arizonafuture.org/az-progress-meters/infrastructure/alternative-fuel-vehicles/
Alternative Fuel Vehicles are measured by the number of hydrogen, electric, natural gas, and propane vehicles registered in Arizona annually.
Updated annually and available for • Arizona
272

Exhibit 8
Civic Participation Progress Meter
WHY IT MATTERS: Civic participation is at the heart of our democracy.
WHAT SUCCESS LOOKS LIKE: Arizonans are informed, equipped, and empowered to participate in our democracy at all levels.
The Civic Participation Progress Meter measures the following:
ELEMENT
DESCRIPTION DATA AVAILABILITY
Voter Participation https://www.arizonafuture.org/az-progress-meters/civic-participation/voter-registration-and-turnout/
Voter participation is measured in different ways—some sources report on turnout of registered voters, others report on turnout of eligible voters (those who could vote but may or may not have even registered), and some rely on survey data of how frequently individuals report on their own participation in elections.
Depending on how voter participation is being measured.
Confidence in Institutions https://www.arizonafuture.org/az-progress-meters/civic-participation/confidence-in-institutions/
Confidence in Institutions compiles the average confidence levels of Americans in 14 major institutions that include military, police, church or organized religion, medical system, presidency, US Supreme Court, public schools, banks, organized labor, criminal justice system, television news, newspapers, big business and Congress.
Confidence in Institutions is updated annually and is only available for the nation as a whole.
273

Exhibit 8
ELEMENT
DESCRIPTION DATA AVAILABILITY
Contacting Public Officials https://www.arizonafuture.org/az-progress-meters/civic-participation/contacting-public-officials/
Contacting Public Officials is measured by the number of people who make contact by the following categories:
• Age• Educational Attainment• Family Income• Geography• Race
Depending on how Contacting Public Officials is being measured.
Discussing Politics https://www.arizonafuture.org/az-progress-meters/civic-participation/discussing-politics/
Discussing politics with family and friends can represent an important measure of social cohesion and of sharing information and is measured by the percentage of the following categories who frequently discuss politics among family and friends:
• Age• Educational Attainment• Family Income• Geography• Race
Depending on how Discussing Politics is being measured.
Buycotting or Boycotting Products https://www.arizonafuture.org/az-progress-meters/civic-participation/buycotting-or-boycotting-products/
One of the ways that members of a community can express their values and opinions is through exercising purchasing power. “Buycotting or Boycotting Products” might have implications for broader economic growth and well-being, as well. Furthermore, liking and caring about where one lives increases the odds that one will invest, spend and hire there. This element is measured by the percentage of the following categories:
• Age• Educational Attainment• Family Income• Geography• Race
Depending on how Discussing Politics is being measured.
274
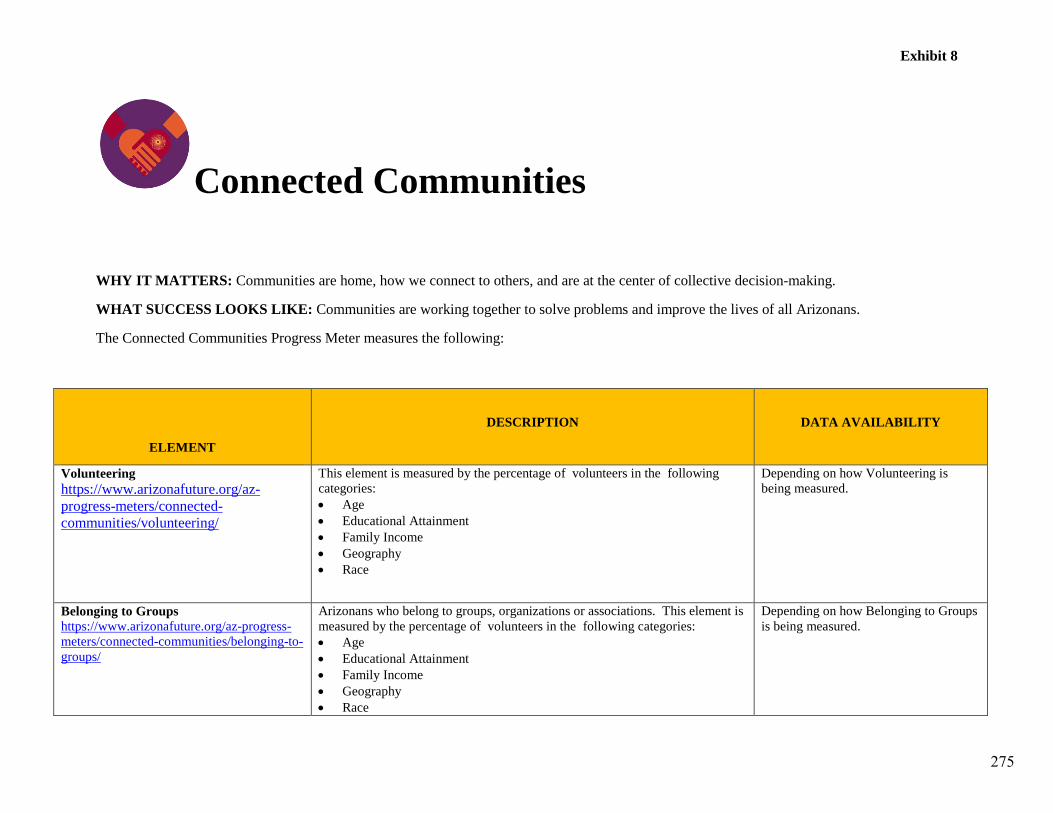
Exhibit 8
Connected Communities
WHY IT MATTERS: Communities are home, how we connect to others, and are at the center of collective decision-making.
WHAT SUCCESS LOOKS LIKE: Communities are working together to solve problems and improve the lives of all Arizonans.
The Connected Communities Progress Meter measures the following:
ELEMENT
DESCRIPTION DATA AVAILABILITY
Volunteering https://www.arizonafuture.org/az-progress-meters/connected-communities/volunteering/
This element is measured by the percentage of volunteers in the following categories: • Age• Educational Attainment• Family Income• Geography• Race
Depending on how Volunteering is being measured.
Belonging to Groups https://www.arizonafuture.org/az-progress-meters/connected-communities/belonging-to-groups/
Arizonans who belong to groups, organizations or associations. This element is measured by the percentage of volunteers in the following categories: • Age• Educational Attainment• Family Income• Geography• Race
Depending on how Belonging to Groups is being measured.
275
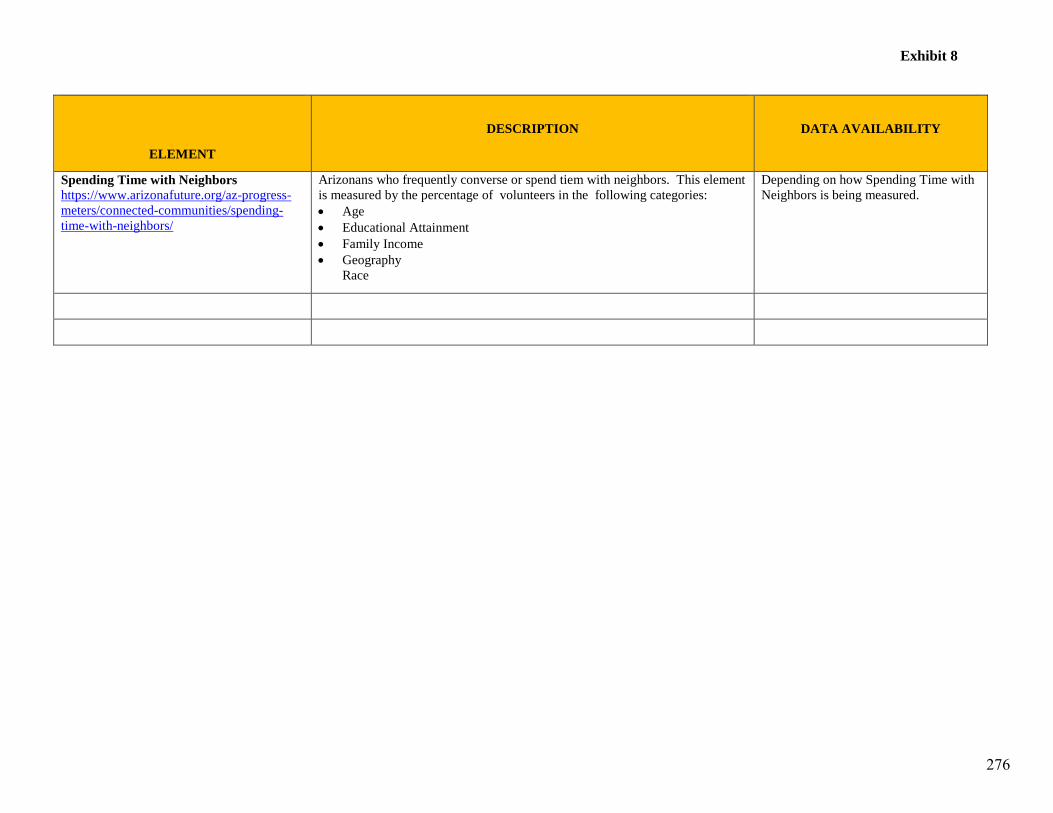
Exhibit 8
ELEMENT
DESCRIPTION DATA AVAILABILITY
Spending Time with Neighbors https://www.arizonafuture.org/az-progress-meters/connected-communities/spending-time-with-neighbors/
Arizonans who frequently converse or spend tiem with neighbors. This element is measured by the percentage of volunteers in the following categories: • Age• Educational Attainment• Family Income• Geography
Race
Depending on how Spending Time with Neighbors is being measured.
276

277
EXHIBIT 9: EQUAL OPPORTUNITY OFFICERS

Equal Opportunity Employer/Program 05/2020 Auxiliary aids and services are available upon request to individuals with disabilities.
Equal Opportunity Is the Law Exhibit 9
It is against the law for the State of Arizona, as a recipient of Federal financial assistance, to discriminate on the following bases:
• Against any individual in the United States, on the basis of race, color, religion, sex (including pregnancy,child birth or related medical condition, sex stereotyping, transgender status, and gender identity), nationalorigin (including Limited English Proficiency), age, disability, political affiliation or belief; and
• Against any beneficiary of programs financially assisted under Title I of the Workforce Innovation andOpportunity Act of 2014 (WIOA), on the basis of the beneficiary's citizenship/status as a lawfully admittedimmigrant authorized to work in the United States, or his or her participation in any WIOA Title I-financially assisted program or activity.
• Recipients of federal financial assistance must take reasonable steps to ensure that communications withindividuals with disabilities are as effective as communications with others. This means that, upon requestand at no cost to the individual, recipients are required to provide appropriate auxiliary aids and services toqualified individuals with disabilities.
The State of Arizona must not discriminate in any of the following areas:
• Deciding who will be admitted, or have access, to any WIOA Title I-financially assisted programor activity;
• Providing opportunities in, or treating any person with regard to, such a program or activity; or• Making employment decisions in the administration of, or in connection with, such a program or
activity.What to Do If You Believe You Have Experienced Discrimination
If you think that you have been subjected to discrimination under a WIOA Title I-financially assisted program or activity, you may file a complaint within 180 days from the date of the alleged violation with either:
• If you file your complaint with the State of Arizona, you must wait either until the State of Arizona issues awritten Notice of Final Action, or until 90 days have passed, (whichever is sooner), before filing acomplaint with the Civil Rights Center (see address above).
• If the State of Arizona does not give you a written Notice of Final Action within 90 days of the day onwhich you filed your complaint, you do not have to wait for the State of Arizona to issue that Notice beforefiling a complaint with CRC. However, you must file your CRC complaint within 30 days of the 90-daydeadline (in other words, within 120 days after the day on which you filed your complaint with the State ofArizona).
• If the State of Arizona does gives you a written Notice of Final Action on your complaint, but you aredissatisfied with the decision or resolution, you may file a complaint with CRC. You must file your CRCcomplaint within 30 days of the date on which you received the Notice of Final Action.
Or
State of Arizona
Or
Civil Rights Center The Local Office Joel Millman, Staff to Pinal County Workforce Development Board 135 N. Pinal St.Florence, AZ 85132 Phone: (520) 866-8088 E:[email protected]
Kerry Bernard State WIOA EO Officer Office of Equal Opportunity Department of Economic Security 1789 W. Jefferson Ave. MD 51H3 Phoenix, Arizona 85007 Phone: (602) 364 -3976 Fax: (602) 364 - 3982 TTY/TDD: 7-1-1 Email: [email protected]
Naomi M. Barry-Perez, Director Civil Rights Center (CRC) U.S. Department of Labor 200 Constitution Avenue NW Room N-4123 Washington, DC 20210 Phone: (202) 693-6500 Fax: (202) 693-6505 TTY: (202) 693-6516
278