arm ergometry exercise stress testing, body … ergometry...arm ergometry exercise stress testing,...
TRANSCRIPT

Arm Ergometry Exercise Stress Testing, Body Composition and Exercise
Prescription in Persons withSpinal Cord Injury
PVA Summit 2011 & EXPORenaissance Orlando at SeaWorld
Orlando, FLSeptember 18, 2011
Dr. Ann M. SpungenAssociate Director, VA RR&D National Center of Excellence for
the Medical Consequences of Spinal Cord InjuryJames J Peters VA Medical Center, Bronx, NY
Associate Professor of Medicine and Rehabilitation Medicine, Mount Sinai School of Medicine, New York, NY

Grant sources of funding include:
VA Rehabilitation Research & Development ServiceEastern Paralyzed Veteran’s Association (1990 – 2003) Spinal Cord Research Foundation Washington, D.C.James J. Peters VA Medical Center Bronx, NYMount Sinai School of Medicine New York, NYKessler Foundation for Medical Research and Kessler Institute of Rehabilitation, West Orange, NJRancho Los Amigos National Rehabilitation Hospital, Downey, CA
Dr. Ann M. Spungen has no financial interests or relationships to disclose with regards to: Consultant/advisory board member, Speaker’s Bureau, or Honoraria from Industry.

Obtaining CME Credit
• If you would like to receive CME credit
for this activity, please visit:
http://www.pesgce.com/PVAsummit2011/
• This information can also be found in the Summit
2011 Program on page 8.

Learning Objectives
1) Define the key components of an arm ergometry exercise stress test;
2) Interpret the results relative to physical fitness;
3) Use the arm ergometry exercise test results to recommend exercise training workloads;
4) Identify corollaries to peak exercise performance; and
5) Identify the magnitude of body composition changes from spinal cord injury.

Arm exercise is the predominant mode of aerobic physical activity for persons with paraplegia (Para). Fitness levels and peak performance can be determined from maximal arm ergometry exercise stress testing.
Wheelchair Racing in the 1980’s
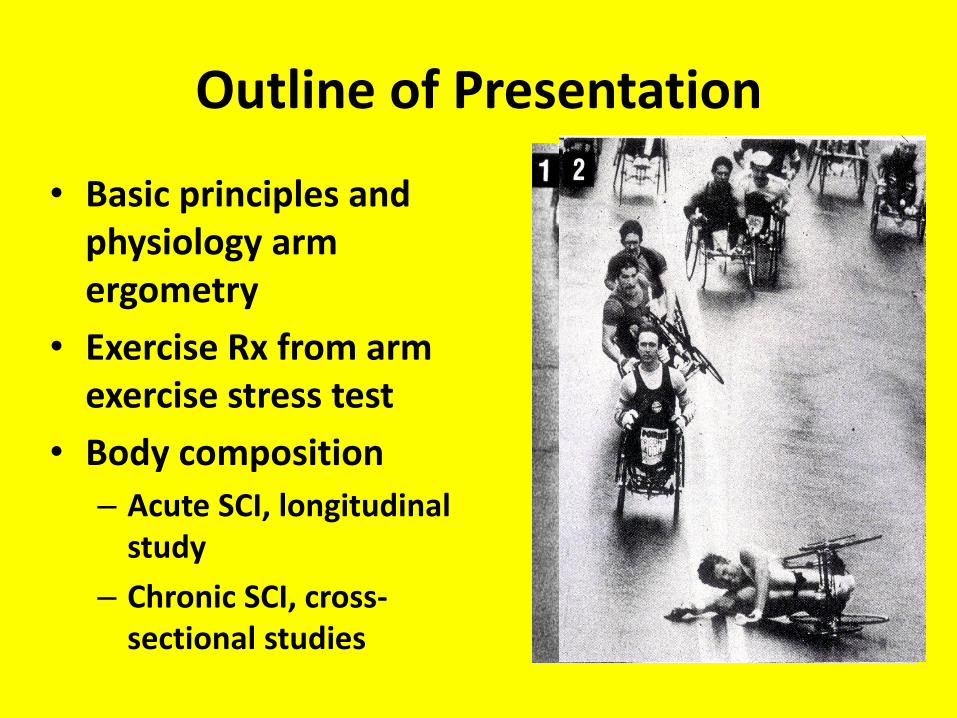
Outline of Presentation
• Basic principles and physiology armergometry
• Exercise Rx from arm exercise stress test
• Body composition
– Acute SCI, longitudinal study
– Chronic SCI, cross-sectional studies
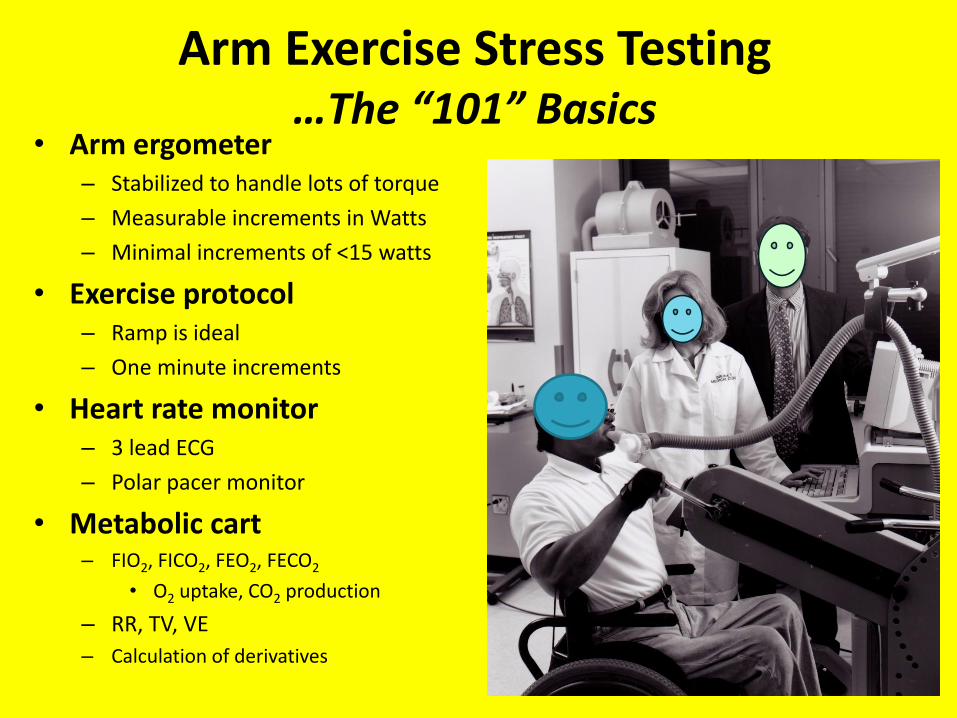
Arm Exercise Stress Testing …The “101” Basics
• Arm ergometer– Stabilized to handle lots of torque
– Measurable increments in Watts
– Minimal increments of <15 watts
• Exercise protocol– Ramp is ideal
– One minute increments
• Heart rate monitor– 3 lead ECG
– Polar pacer monitor
• Metabolic cart– FIO2, FICO2, FEO2, FECO2
• O2 uptake, CO2 production
– RR, TV, VE
– Calculation of derivatives

Phases of the Exercise Test
Pre-exercise Data collected during baseline, just prior to initiation of the exercise protocol.
Sub-maximal From onset of arm cranking to peak performance.
Anaerobic Threshold (AT) The highest oxygen uptake attained without sustained increase in blood lactate concentration.
Ventilatory Threshold (VT) Determined by the V-slope technique, the point during exercise that CO2 (VCO2) is produced more than O2 (VO2) is taken up (Wasserman, 1986). The VT closely correlates with anaerobic threshold.
Peak Exercise The highest attained O2 uptake during a maximal ergometry exercise test.
Recovery The phase of rest after termination of exercise.

Ambient and Exhaled Gas Concentrations
Variable/Parameter
FIO2 (%)
FEO2 (%)
FICO2 (%)
FECO2 (%)
FETCO2 (%)
Pre Exercise/Resting20.93
16.00 – 19.00
0.03
2.50 – 4.00
5.60 ± 0.07
Max/PeakExercise
20.93
15.00 – 18.00
0.03
4.60 – 6.80

VO2 = (1-FEO2-FECO2)
(1-FIO2-FICO2)
[Haldane Transformation]
x FIO2 – FEO2 (100) x 10 x VE (STPD)
[Conzolazio, 1963]

Pulmonary and Gas Exchange
Variable/ParameterVE (L/min)
TV (ml)
RR (f)
VO2(ml/min)
VCO2(ml/min)
RER (VCO2/VO2)
VEO2(L/1L VO2)
VECO2(L/1L VCO2)
Pre Exercise/Resting
6 – 12
200 – 700
10 – 15
180 – 400
150 – 350
0.80 – 0.85
20 – 40
25 – 50
Max/PeakExercise30 – 280
<ICmax
20 – 50
500 – 6000
400 – 6200
0.98 – 1.40
20 – 40
25 – 50
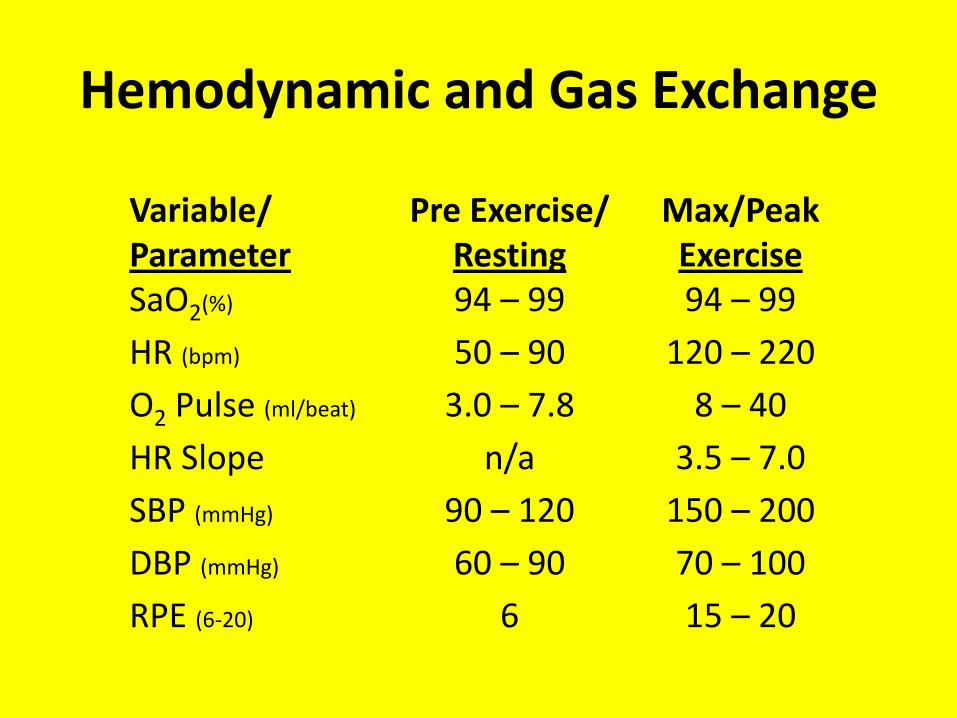
Hemodynamic and Gas Exchange
Variable/ParameterSaO2(%)
HR (bpm)
O2 Pulse (ml/beat)
HR Slope
SBP (mmHg)
DBP (mmHg)
RPE (6-20)
Pre Exercise/Resting94 – 99
50 – 90
3.0 – 7.8
n/a
90 – 120
60 – 90
6
Max/PeakExercise94 – 99
120 – 220
8 – 40
3.5 – 7.0
150 – 200
70 – 100
15 – 20
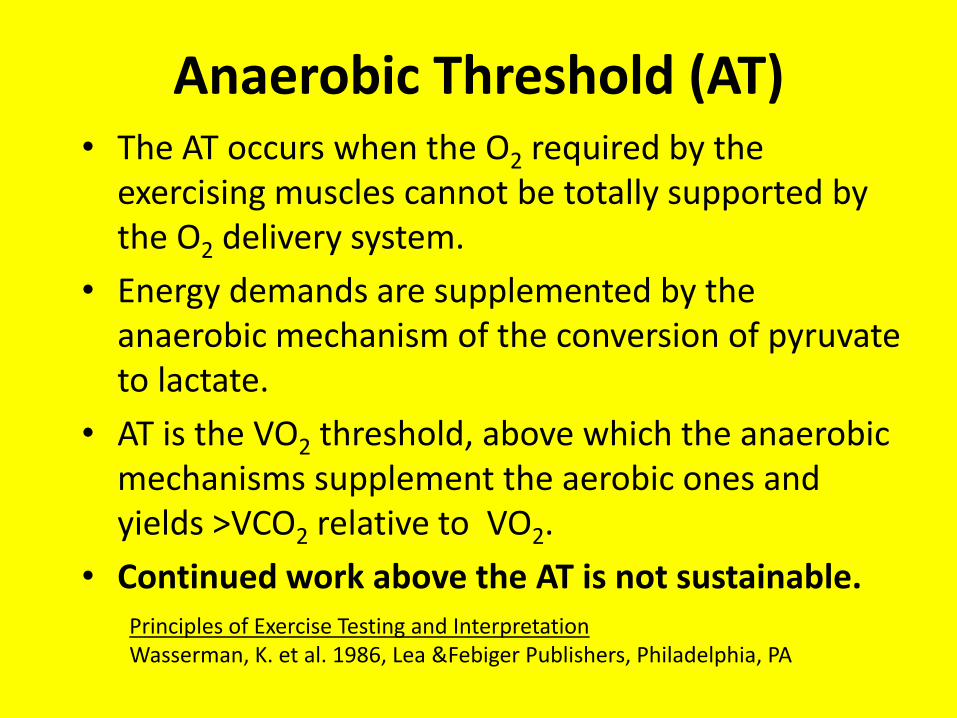
Anaerobic Threshold (AT)• The AT occurs when the O2 required by the
exercising muscles cannot be totally supported by the O2 delivery system.
• Energy demands are supplemented by the anaerobic mechanism of the conversion of pyruvateto lactate.
• AT is the VO2 threshold, above which the anaerobic mechanisms supplement the aerobic ones and yields >VCO2 relative to VO2.
• Continued work above the AT is not sustainable.Principles of Exercise Testing and InterpretationWasserman, K. et al. 1986, Lea &Febiger Publishers, Philadelphia, PA

Principles of Exercise Testing and InterpretationWasserman, K. et al. 1986, Lea &FebigerPublishers, Philadelphia, PA, Pg 12.
“Isocapnic buffering” refers to curvilinear increase in VE and VCO2.
AT occurs when lactate increases.
“Respiratory Compensation” occurs after isocapnicbuffering because of the metabolic acidosis of exercise.
AT ≈180 W (63% of Pk)Pk =285 W (Leg Ergometry)
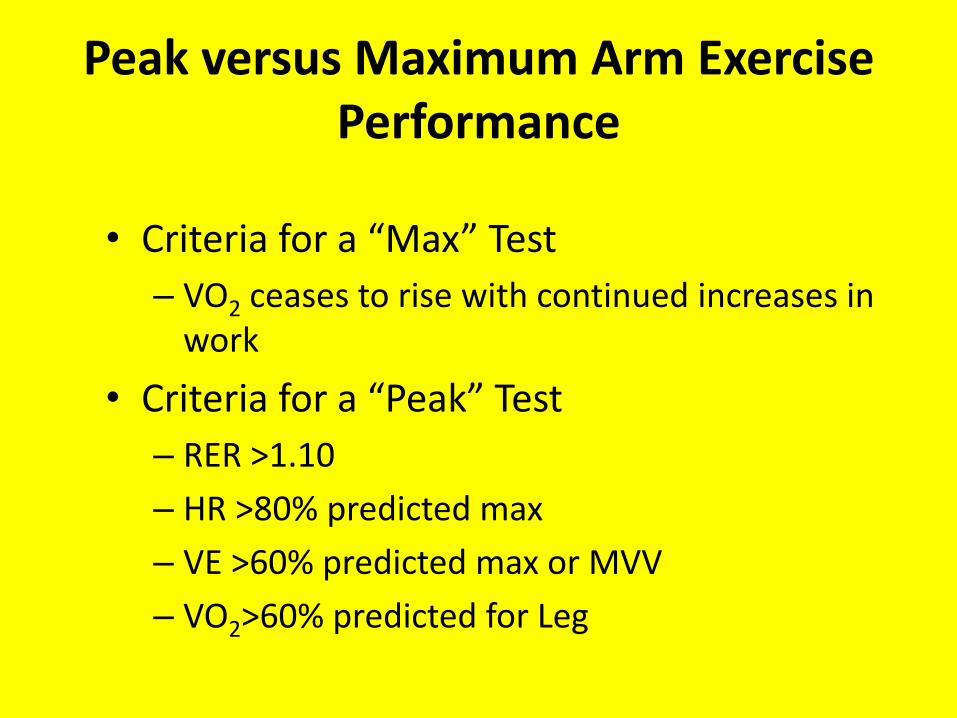
Peak versus Maximum Arm Exercise Performance
• Criteria for a “Max” Test
– VO2 ceases to rise with continued increases in work
• Criteria for a “Peak” Test
– RER >1.10
– HR >80% predicted max
– VE >60% predicted max or MVV
– VO2>60% predicted for Leg

Maximal Arm Ergometry Exercise Testing in Monozygotic Twins
Discordant for Paraplegia

Arm and Leg Exercise Stress Testing
Arm PWC was tested in both sets of twins
Leg PWC was tested in the NonPara twins
Arm: Para vs. NonPara
Para Arm and NonPara Arm
vs. NonPara Leg

Methods: Twin DNA Testing• Blood was collected for
restriction fragment length polymorphism (RFLP) analysis of Pst I digested DNA for twin zygosity.
• The results of the analyses were obtained with six probes which detect independent, highly polymorphic loci.
• The chance of two non-identical twins having identical DNA patterns at six loci was 1 in 4,096 (Lifecodes Corp, Stamford, CT)

Methods• A prospective study was performed in 10 pairs of
monozygotic twins.
• Arm and leg: lean and fat tissue masses were determined by dual energy x-ray absorptiometry(DXA).
• Paired t-tests were used for comparisons within twin pairs.
• Unpaired t-tests and ANOVAs were used for comparisons between the gender (male vs. female) and activity level (active vs. inactive) subgroups.
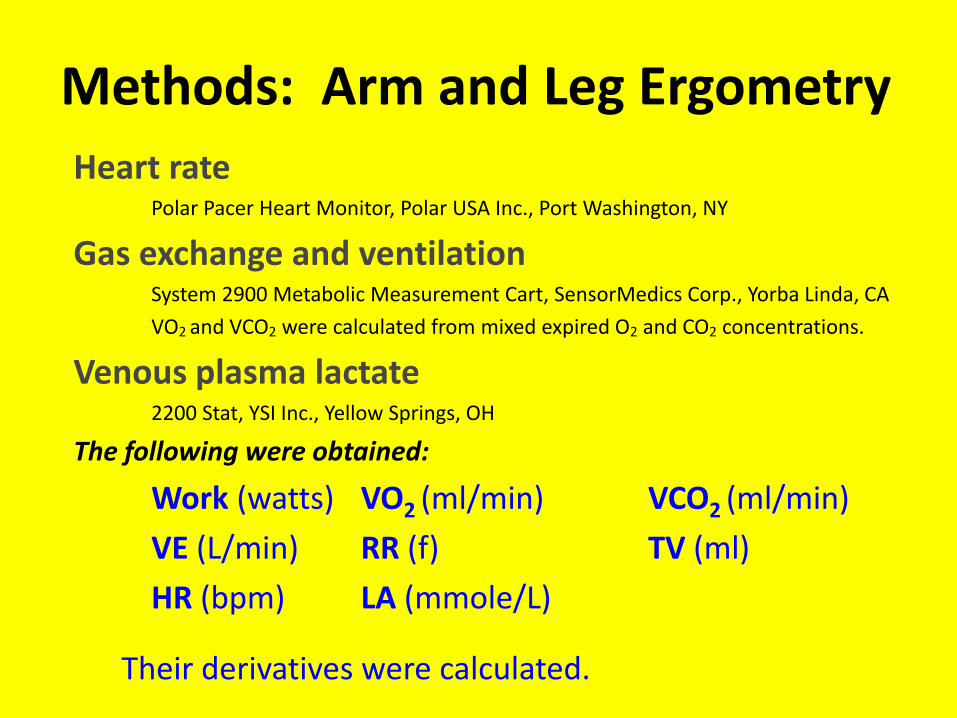
Methods: Arm and Leg Ergometry
Heart ratePolar Pacer Heart Monitor, Polar USA Inc., Port Washington, NY
Gas exchange and ventilation System 2900 Metabolic Measurement Cart, SensorMedics Corp., Yorba Linda, CA
VO2 and VCO2 were calculated from mixed expired O2 and CO2 concentrations.
Venous plasma lactate 2200 Stat, YSI Inc., Yellow Springs, OH
The following were obtained:
Work (watts) VO2 (ml/min) VCO2 (ml/min)
VE (L/min) RR (f) TV (ml)
HR (bpm) LA (mmole/L)
Their derivatives were calculated.

Arm and Leg Exercise Protocols
Mode:
Ergometer:
Work units:
RPMs:
Protocol:
Increments:
Initial wkld:
Arm
Ergometry
arm cycle
Fleisch
Ergostat
Switzerland
watts
60
incremental
12 watts/min
12 watts
Leg
Ergometry
leg cycle
Ergoline
Ergometrics
Germany
watts
60
ramp
25 watts/min
0 watts

Exercise Test Termination Criteria
Subject wished to stop.
Subject unable to maintain 60 rpms at specified wkld.
HR ≥85% of max pred. heart rate
RER ≥1.10
VO2 plateau

Subjects
6 male pairs
4 female pairs
Age = 36±8 y
Para twins: Lower paraplegia
(T7 to L2)DOI 13 ±10 y
(1-27 y)10 active (≥3x/wk)
NonPara twins:10 active (≥3x/wk)

Height(m)
Weight (kg)
BMI (kg/m2)
Arm Lean (kg)
Leg Lean (kg)
Para
1.72±0.13
64.1±13.1
21.4±2.6
7.1±2.2*
10.5±3.0
NonPara
1.73±0.11
71.6±17.2*
23.7±3.9*
6.2±2.0
18.3±4.7*
P value
Ns
0.01
0.03
0.03
<0.0001
Characteristics of the Twins

Baseline and Predicted Maximum Values
Static Pulmonary Function
FVC (L)
FEV1(L)
IC (L)
MVV (L)
Predicted Maximum
HR (bpm)
VO2(ml/min)
VE (L/min)
VO2/kg (ml/kg/min)
Watts (W)
Para
4.23 ±1.39
3.49 ±0.99
3.03 ±1.12
116 ±20
185 ±7
2683 ±514
121 ±35
38.0 ±4.5
203 ±52
NonPara
4.82 ±1.38 *
3.78 ±0.97
3.45 ±1.06 *
116 ±34
185 ±7
2715 ±542
131 ±34
38.5 ±4.9
209 ±50
*P<0.05

Pre-Exercise Data
HR (bpm)
VE (L/min)
VO2 (ml/min)
RER (VCO2/VO2)
LA (mmol/L)
Para
ARM
90±18 *
11.6±2.9
307±71
0.94±0.13
1.14±0.30
NonPara
ARM
81±11
11.2±3.7
348±111
0.90±0.11
1.03±0.38
NonPara
LEG
95±7 •
14.1±6.0
373±177
0.90±0.11
1.16±0.36
* P<0.05 ARM: Para vs. NonPara• P<0.05 NonPara: Arm vs. Leg

Anaerobic / Ventilatory Threshold Data
HR (bpm)
VE (L/min)
VO2 (ml/min)
RER (VCO2/VO2)
LA (mmol/L)
Work (watts)
Para
ARM
149±17 * •
39.1±13.1
1155±400
1.03±0.07
4.96±1.83
82±36
NonPara
ARM
121±6
35.3±12.9
1087±432
1.03±0.06
4.59±1.49
69±27
NonPara
LEG
134±11
39.2±13.8
1365±596
1.00±0.07
3.05±1.49
117±44
* P<0.0005 ARM: Para vs. NonPara• P<0.05 ARM Para vs. LEG NonParaP<0.005 NonPara: Arm vs. Leg

Peak Exercise Data
HR (bpm)
VE(L/min)
VO2 (ml/min)
RER (VCO2/VO2)
LA (mmole/L)
Work (watts)
Para
ARM
179±10
75.9±31.0
1709±679
1.25±0.10
10.8±3.1
118±41
NonPara
ARM
174±11
92.9±30.3
1940±579
1.28±0.14
14.6±4.4§
120±29
NonPara
LEG
171±11
93.6±34.4
2259±855*
1.31±0.11•
7.9±4.3
207±69*
•P<0.05 for Para Arm vs. NonPara Leg
§P<0.05 for NonPara: Arm vs. Leg
*P<0.01 for Para Arm and NonPara Arm vs. NonPara Leg

Peak Exercise Values as a Percent of Predicted Maximum
HR
VE
VO2
Watts
ARM
Para
%pMax
97±7
64±19
63±17
58±10
LEG
NonPara
%pMax
93±6
73±24
85±27 *
100±27 *
ARM
NonPara
%pMax
94±7
72±20
71±16
58±10
* P<0.01 for SCI Arm and NonSCI Arm vs. NonSCI Leg

Heart Rate vs. Watts (Arm only)
NonParaParaH
ea
rt R
ate
(b
pm
)
90
100
110
120
130
140
150
160
170
180
190
12 24 36 48 60 72 84 96 108 120 132 144 156 168
Watts
*P <0.05
VO2 vs. Watts (Arm only)V
O2
(ml/m
in)
NonPara
Para
0
500
1000
1500
2000
2500
3000
3500
12 24 36 48 60 72 84 96 108 120 132 144 156 168
Watts
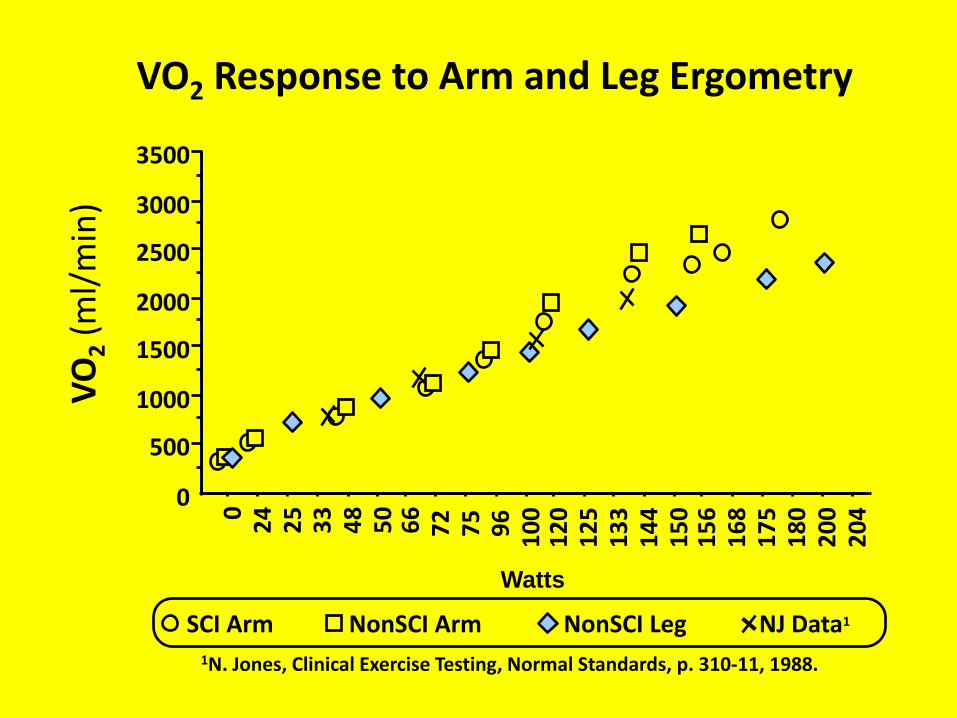
VO2 Response to Arm and Leg Ergometry
1N. Jones, Clinical Exercise Testing, Normal Standards, p. 310-11, 1988.
VO
2(m
l/m
in)
NJ Data1NonSCI LegNonSCI ArmSCI Arm
0
500
1000
1500
2000
2500
3000
3500
02
42
53
34
85
06
67
27
59
61
00
12
01
25
13
31
44
15
01
56
16
81
75
18
02
00
20
4
Watts

Heart Rate vs. Watts(Arm and Leg)H
ea
rt R
ate
(b
pm
)
Watts
NonPara LEG, slope=0.298
NonPara ARM, slope=0.586 *
Para ARM, slope=0.434 *
90
100
110
120
130
140
150
160
170
180
0 50 100 150 200 250
*P<0.05 for Para Arm and NonPara Arm vs. NonPara Leg

Lactate vs. VO2 (Arm and Leg)LA
(mm
ole
/L)
VO2(ml/min)
0
2
4
6
8
10
12
14
16
18
0 1000 2000 3000 4000
NonPara LEG
NonPara ARM
Para ARM

Trained
Untrained
* P <0.01
• P <0.05
Pe
rce
nt
of
Max
Pre
dic
ted
30
40
50
60
70
80
90
100
110
VO2 Watts
*•
*
•
Arm Exercise for Total Group: Active (n=10) vs. Inactive (n=10)
Para NonPara Para NonPara

FEMALE
MALE
20
30
40
50
60
70
80
90
100
110
Heart Rate VO2 Watts Ventilation
Pe
rce
nt
of
Max
Pre
dic
ted *P<0.05
Arm Exercise for Total Group: Male (n=12) vs. Female (n=8)

Arm
Pe
ak E
xerc
ise
VO
2(m
l/m
in)
Arm Lean Tissue Mass (kg)
800
1000
1200
1400
1600
1800
2000
2200
2400
2600
2800
3000
3.0 4.0 5.0 6.0 7.0 8.0 9.0 10.0 11.0
Para R2=0.74P=0.0007
NonParaR2=0.73P=0.003
Relationship of Arm Lean Tissue Masswith Peak Exercise VO2

0
500
1000
1500
2000
2500
3000
3500
4000
0 50 100 150 200
VO2
VCo2
0
500
1000
1500
2000
2500
3000
3500
4000
0 50 100 150 200
VO2
VCo2
V-Slope Method for Anaerobic Threshold Detection
Watts
UntrainedPara
TrainedPara

Lactate and Ventilatory Threshold
0
500
1000
1500
2000
2500
3000
3500
0 50 100 150 200
VO2
VCO2
0.0
5.0
10.0
15.0
20.0
25.0
0 50 100 150 200
Watts
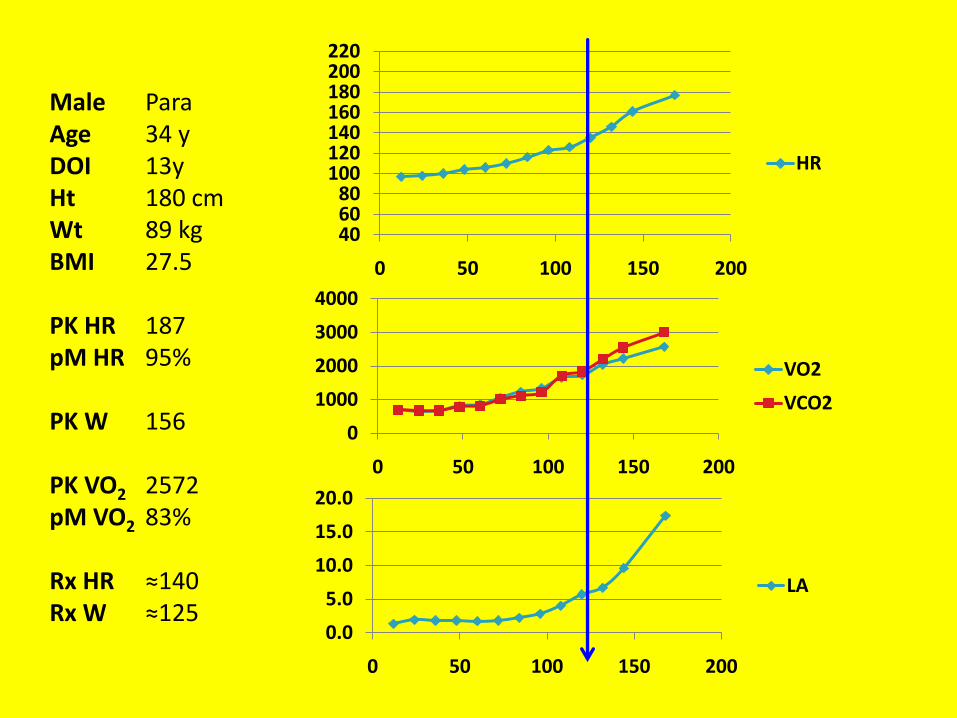
Sample of Arm Exercise: Para
PEAK ExerciseLA 20.0VO2 2500VCO2 3000W 160
(mm
ole
/L)
Ml /
Min
LA
AT % ≈43%
406080
100120140160180200220
0 50 100 150 200
HR
0
1000
2000
3000
4000
0 50 100 150 200
VO2
VCO2
0.0
5.0
10.0
15.0
20.0
0 50 100 150 200
LA
Male ParaAge 34 yDOI 13yHt 180 cmWt 89 kgBMI 27.5
PK HR 187pM HR 95%
PK W 156
PK VO2 2572pM VO2 83%
Rx HR ≈140Rx W ≈125

Body Composition Changes after Acute SCI – Longitudinal Data
Chronic SCI – Cross sectional Data

Methods
• Study Design
– Prospective, longitudinal study of newly injured patients
• Measurement Time Points
– Baseline (16 to 65 days since SCI)
– Sequentially at months 1, 3, 6, 12, 15, 18, and 24 after the baseline measurement
– Real time was determined as days and months since SCI
Acute SCI Longitudinal Data

Subjects
• 20 patients with acute SCI
• All were motor complete (ASIA A or B) • One subject was removed s/p change in status of
motor completeness of SCI
• 19 Subjects
– Gender: 14 Male, 5 Female
– SCI: 7 Tetra, 12 Para
• Tetra: 3 Female, 4 Male
• Para: 2 Female, 10 Male
Acute SCI Longitudinal Data

Tetra(n=7)
43 13(22-57)
171 12(157-185)
70.0 16.0(55.0-89.0)
24.0 4.1(21.0-32.0)
46 16(26-65)
Para(n=12)
29 7(18-41)
177±6(165-185)
75.0±16.0(47.3-114.0)
24.0±5.0(17.3-36.0)
44 16(16-65)
P Value
<0.005
NS
NS
NS
NS
Age (y)
Ht (cm)
Wt (kg)
BMI (kg/m2)
Days since SCI
Male(n=14)
32±10(20-57)
178±6(168-185)
79.0±13.0(60.0-114.0)
25.0±4.3(20.0-36.0)
43 16(16-65)
Female(n=5)
36±15(18-53)
166±9(157-180)
58.4±11.2(47.3-77.3)
21.0±2.5(17.3-24.0)
50 15(26-62)
P Value
NS
<0.005
<0.005
0.06
NS
Characteristics of the Subjects
Acute SCI Longitudinal Data
(Data reported in mean SD and ranges)

Tetra(n=7)
15.0 7.6(3.3-25.3)
23±10(4-33)
50.7 16.8(35.0-80.4)
Para(n=12)
16.3±12.3(6.0-44.9)
21±12(10-46)
75.0±16.0(34.3-66.6)
PValue
NS
NS
NS
Baseline Values
TB Fat (kg)
TB Fat (%)
TB Lean (kg)
Male(n=14)
15.3±11.1(3.3-45.0)
19±10(4-41)
57.0±8.9(46.8-80.4)
Female(n=5)
17.3±10.6(8.2-34.9)
29±12(18-47)
37.1±3.0(34.3-41.9)
PValue
NS
0.10
<0.005
Baseline Body Composition of the Subjects(Mean SD and Ranges)
Acute SCI Longitudinal Data
Females had sig, less lean mass in the arms and legs than males.Arm and leg fat mass trended (ns) to be higher in females.

Number of Subjects Studied at Each Time Point
Time
Baseline
Month 1
Month 3
Month 6
Month 12
Month 24
Number of S’s
19
19
19
17
13
10
Acute SCI Longitudinal Data

n=19
12.0
14.0
16.0
18.0
20.0
22.0
24.0
26.0
28.0
30.0
32.0
34.0
BL
1.4
1
2.5
3
4.6
6
7.5
12
13.6
15
16.9
18
20.5
24
25.6
Study Visit
Real Time
Months Since SCI
n=17
n=13
n=10
TB F
at (
kg)
Total Body Fat Mass (kg
*P<0.01
Acute SCI Longitudinal Data
28.813.3 kg
15.910.7 kg

Total Body % Fat – All SubjectsTo
tal B
od
y Fa
t (%
)
BL
1.4
1
2.5
3
4.6
6
7.5
12
13.6
15
16.9
18
20.5
24
25.6
Study Visit
Real Time
Months
18
20
22
24
26
28
30
32
34
36
38
40
2211%
3510%
Acute SCI Longitudinal Data

TB F
at (
%)
Total Body % Fat by Level of SCI
BL
1.4
1
2.5
3
4.6
6
7.5
12
13.6
15
16.9
18
20.5
24
25.6
Study Visit
Real Time
Months
14
18
22
26
30
34
38
42
TETRA
PARA
Acute SCI Longitudinal Data

0
1.0
2.0
3.0
4.0
5.0
6.0
Mo 6
Mo 12
Mo 24
Arm Fat Mass(No differences: Para vs. Tetra or Male vs. Female)
Arm
Fat
Tis
sue
Mas
s (k
g)
BL
1.4
1
2.5
3
4.6
6
7.5
12
13.6
18
20.5
24
25.6
Study Visit
Real Time
Months since SCI

Leg Fat Mass (kg) – All Subjects
4.0
5.0
6.0
7.0
8.0
9.0
10.0
11.0
Leg
Fat
(kg)
BL
1.4
1
2.5
3
4.6
6
7.5
12
13.6
15
16.9
18
20.5
24
25.6
Study Visit
Real Time
Months
*P<0.05 for Total group from Bl
P <0.08
Acute SCI Longitudinal Data

Total Body Lean Mass (kg) – By Gender
MALE, n=14
MALE, n=12
MALE, n=11
MALE, n=7
FEMALE, n=5
FEMALE, n=4
FEMALE, n=3
25.0
30.0
35.0
40.0
45.0
50.0
55.0
60.0
65.0
BL
1.4
1
2.5
3
4.6
6
7.5
12
13.6
15
16.9
18
20.5
24
25.6
Study Visit
Real Time
Months
Acute SCI Longitudinal Data
*P<0.05

Leg Lean Mass (kg) – By Gender
MALE, n=14
MALE, n=12
MALE, n=11
MALE, n=7
FEMALE, n=5
FEMALE, n=4
FEMALE, n=3
BL1.4
12.5
34.6
67.5
1213.6
1516.9
1820.5
2425.6
Study VisitReal Time
Months
Acute SCI Longitudinal Data
6.0
8.0
10.0
12.0
14.0
16.0
18.0
20.0
22.0
24.0
*P<0.02

2.0
3.0
4.0
5.0
6.0
7.0
8.0
9.0
10.0
BL1.4
12.5
34.6
67.5
1213.6
1820.5
2425.6
Study VisitReal Time
Months since SCI
TETRA, Mo 6
TETRA, Mo 12
TETRA, Mo 24
PARA, Mo 3
PARA, Mo 6
PARA, Mo 12
PARA, Mo 24MALES
Arm
Le
an M
ass
(kg)
Arm Lean Mass (kg) – By Gender
Acute SCI Longitudinal Data
TETRA, Mo 6
TETRA, Mo 24
PARA, Mo 12
PARA, Mo 24
FEMALES

Body Composition in
Chronic SCICross Sectional Data
Tota
l Bo
dy
Lean
(kg
)
35.0
40.0
45.0
50.0
55.0
60.0
65.0
70.0
75.0
80.0
NonSCITwins
SCITwins
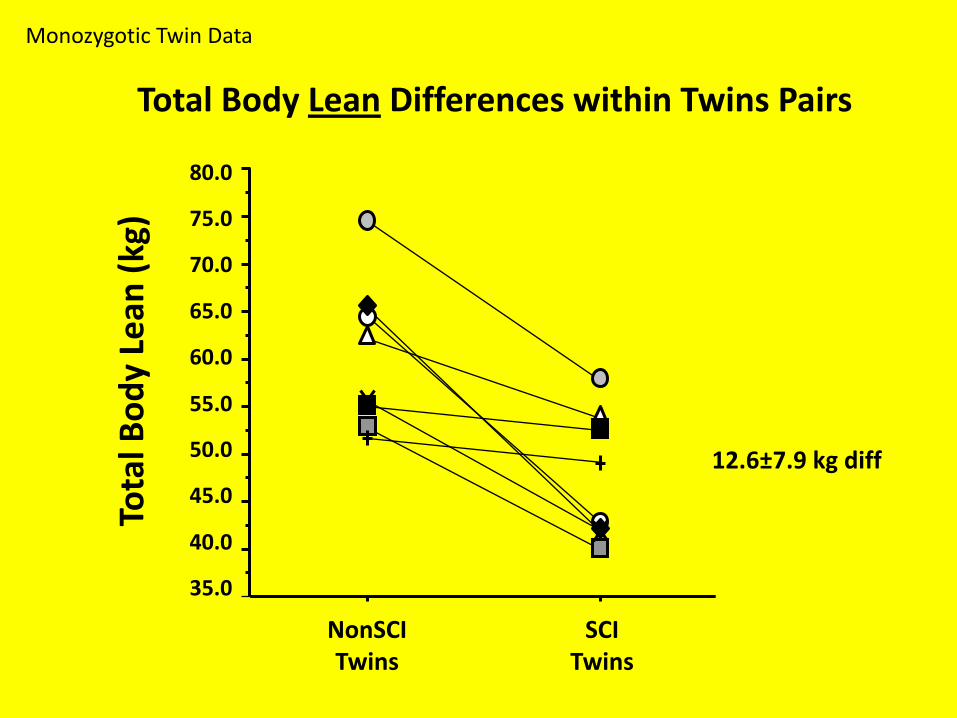
Total Body Lean Differences within Twins Pairs
Monozygotic Twin Data
12.6±7.9 kg diff

Total Body Lean Tissue Loss with Duration of Injury in the SCI Twins
Duration of Injury (y)
Difference of an average of 7.8 kg LTM per decade of injury
Monozygotic Twin Data
Intr
apai
rD
iffe
ren
ce f
or
Tota
l Bo
dy
Lean
Tis
sue
(kg
)
-25
-22
-19
-16
-13
-10
-7
-4
-1
0 5 10 15 20 25 30
R= 0.87, slope = -0.782 ±0.181, p<0.005

Leg
Lean
Tis
sue
(kg
)
NonSCITwins
SCITwins
7.5
10.0
12.5
15.0
17.5
20.0
22.5
25.0
27.5
30.0
5.0
Leg Lean Differences within Twins Pairs
Monozygotic Twin Data
10.1±4.0 kg diff

0
5.0
10.0
15.0
20.0
25.0
30.0
Arms Legs Trunk Total Body
Fat
Mas
s (k
g)
2.9±2.4 kg
* P<0.01
* P<0.05
* P<0.05
3.6±3.3kg
6.4±6.1kg
SCI
Non SCI
Average Differences for Fat Mass
Monozygotic Twin Data

Tota
l Bo
dy
Fat
Mas
s (k
g)
Body Mass Index (kg/m2)
0
5
10
15
20
25
30
35
18 20 22 24 26 28 30 32
SCI r=0.75, p<0.05NonSCI r=0.82, p<0.01
Relationship of Body Mass Index with Fat Mass
Monozygotic Twin Data

Comparison of Percent Lean between SCI and Controls by Age Category
< 40 y 40 y
Tota
l Bo
dy
Pe
rce
nt
Lean *
*
40
45
50
55
60
65
70
75
80*P<0.0001
SCIN=133
ControlsN=100
*P<0.01
Cross-sectional Data
Spungen et al., J ApplPhysiol 95:2398-2407, 2003

TOTAL BODY PERCENT LEAN TISSUE(C=100, T=66, P=67)
TOTA
L B
OD
Y P
erc
en
t Le
an
AGE (y)
30
40
50
60
70
80
90
100
10 20 30 40 50 60 70 80
Tetra
Para
Control
Spungen et al., J ApplPhysiol 95:2398-2407, 2003
Controls
(-1.0% / 10 y)
SCI
(-3.2% / 10 y)
Cross-sectional Data
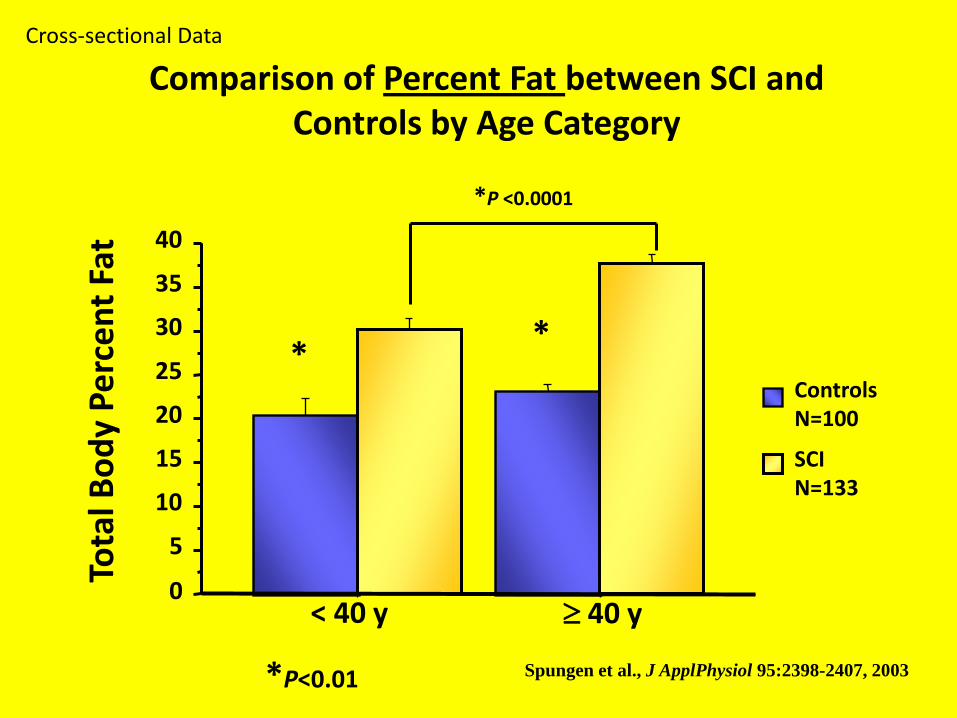
Comparison of Percent Fat between SCI and Controls by Age Category
SCIN=133
ControlsN=100
Tota
l Bo
dy
Pe
rce
nt
Fat
0
5
10
15
20
25
30
35
40
< 40 y 40 y
*
*P <0.0001
*
*P<0.01 Spungen et al., J ApplPhysiol 95:2398-2407, 2003
Cross-sectional Data
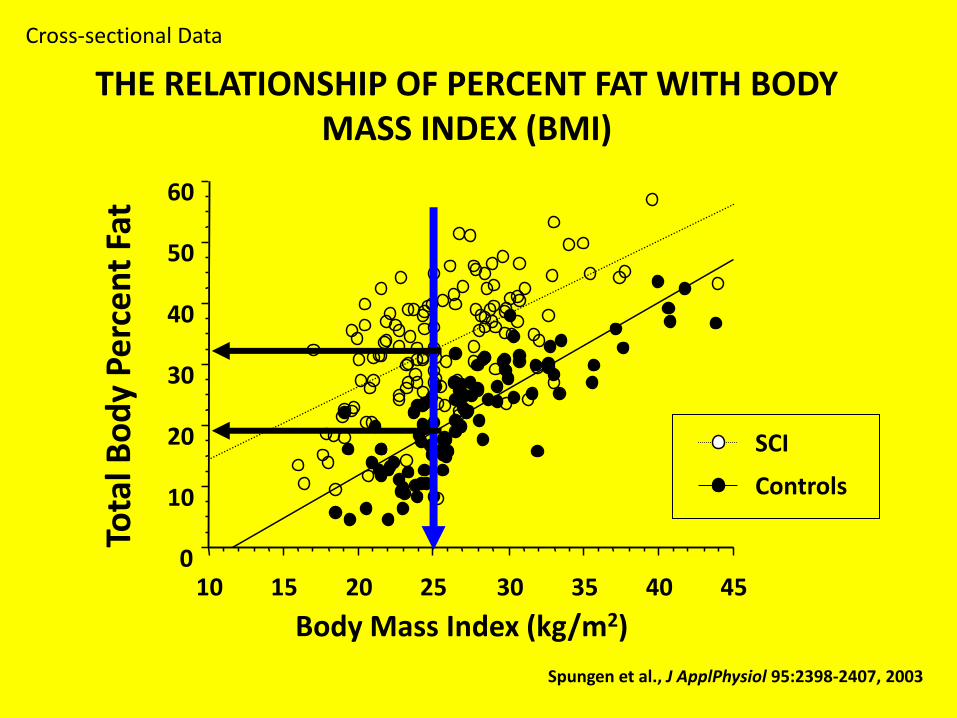
Tota
l Bo
dy
Pe
rce
nt
Fat
Body Mass Index (kg/m2)
0
10
20
30
40
50
60
10 15 20 25 30 35 40 45
SCI
Controls
THE RELATIONSHIP OF PERCENT FAT WITH BODY MASS INDEX (BMI)
Spungen et al., J ApplPhysiol 95:2398-2407, 2003
Cross-sectional Data

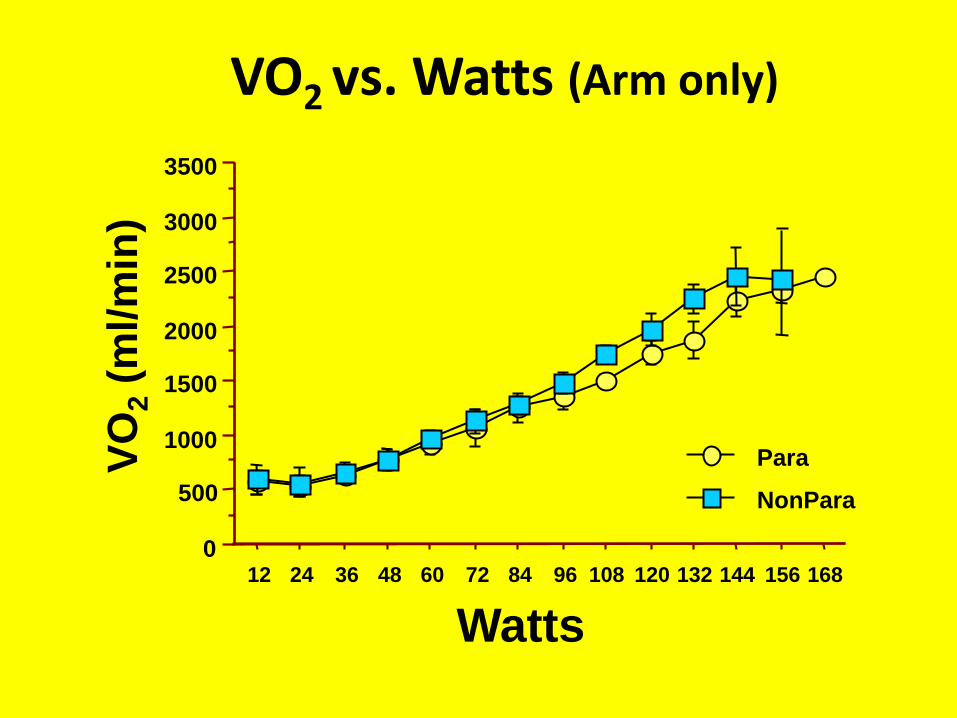
Arm Exercise Summary: Para ARM vs. NonPara ARM
The twins with paraplegia compared with their able-
bodied co-twins:
Had significantly lower static pulmonary function,
likely due to varying degrees of abdominal wall
paralysis.
Had significantly higher heart rates at the sub-
maximal work rates (12 to 96 watts) and at the
anaerobic/ventilatory thresholds.
Demonstrated no differences at peak exercise for
any of the parameters measured.
Had nearly identical oxygen uptake levels and
lactate production for each sub-maximal work rate.

For Para ARM and NonPara ARM vs. NonSCI Leg
Heart rate was significantly higher for any given sub-maximal workload or oxygen uptake.
The heart rate slope of arm work was significantly steeper than for leg work.
The anaerobic contribution to arm work was significantly greater than for the same oxygen consumption for leg work (i.e., greater lactic acid production).
Both Twins, using their arms, attained:
63% of their maximum predicted VO2
58% of their PWC (peak Watts) for legs.
Arm Exercise Summary: Arm vs. Leg
Arm Exercise Conclusions Twins with paralysis who use their arms daily for mobilization
are able to perform the same amount of arm work as their non paralyzed twins.
In the NonPara twins, trunk and lower extremity skeletal muscle recruitment during arm ergometry may have contributed to the higher VO2 at peak exercise despite lower arm lean tissue mass.
In ergometric work, the oxygen cost of any given workload performed by the arms or the legs is the same whether performed by a person with lower extremity paralysis, a non paralyzed person, trained, untrained, males, or females.
In both groups, arm peak exercise performance was highly correlated with arm lean tissue mass, suggesting the importance of upper body strength training.

Body Composition Summary
Paralysis from SCI is associated with a rapid loss of lean tissue below the level of lesion.
Fat mass is significantly increased within months after SCI and continues to increase for at least 2 years.
The rate or relative amount of fat increase is similar between males & females and paraplegia & tetraplegia.
Percent fat is higher for any unit of BMI in those with SCI.
Muscle continues to decline with advancing age and duration of injury, at a greater rate than in the general population.

Body Composition Summary
Absolute fat mass increase after SCI may partially
explain the high prevalence of metabolic
consequences commonly found in this population.
The influence of this increased amount of fat mass on
cardiovascular risk is unknown.
These deleterious increases in regional and total body
fat should be vigorously targeted in future
intervention studies.

James J. Peters VA Medical CenterBronx, NY

VA Rehabilitation R&D National Center of Excellence for theMedical Consequences of Spinal Cord Injury