arm mali gpu opengl es application optimization...
TRANSCRIPT

ARM® Mali™ GPUVersion: 3.0
OpenGL ES Application Optimization Guide
Copyright © 2011, 2013 ARM. All rights reserved.ARM DUI 0555C (ID102813)
ARM Mali GPUOpenGL ES Application Optimization Guide
Copyright © 2011, 2013 ARM. All rights reserved.
Release Information
The following changes have been made to this book.
Proprietary Notice
Words and logos marked with ® or ™ are registered trademarks or trademarks of ARM® in the EU and other countries, except as otherwise stated below in this proprietary notice. Other brands and names mentioned herein may be the trademarks of their respective owners.
Neither the whole nor any part of the information contained in, or the product described in, this document may be adapted or reproduced in any material form except with the prior written permission of the copyright holder.
The product described in this document is subject to continuous developments and improvements. All particulars of the product and its use contained in this document are given by ARM in good faith. However, all warranties implied or expressed, including but not limited to implied warranties of merchantability, or fitness for purpose, are excluded.
This document is intended only to assist the reader in the use of the product. ARM shall not be liable for any loss or damage arising from the use of any information in this document, or any error or omission in such information, or any incorrect use of the product.
Where the term ARM is used it means “ARM or any of its subsidiaries as appropriate”.
Confidentiality Status
This document is Non-Confidential. The right to use, copy and disclose this document may be subject to license restrictions in accordance with the terms of the agreement entered into by ARM and the party that ARM delivered this document to.
Product Status
The information in this document is final, that is for a developed product.
Web Address
http://www.arm.com
Change history
Date Issue Confidentiality Change
30 March 2011 A Non-confidential First release
14 May 2013 B Non-Confidential Second release
28 October 2013 C Non-Confidential Third release. Adds support for Midgard architecture Mali GPUs
ARM DUI 0555C Copyright © 2011, 2013 ARM. All rights reserved. iiID102813 Non-Confidential
ContentsARM Mali GPU OpenGL ES Application Optimization Guide
PrefaceAbout this book .......................................................................................................... viiFeedback ..................................................................................................................... x
Chapter 1 Introduction1.1 About optimization ................................................................................................... 1-21.2 The Mali GPU hardware .......................................................................................... 1-31.3 The graphics pipeline ............................................................................................... 1-71.4 Differences between desktop systems and mobile devices .................................... 1-91.5 Differences between mobile renderers .................................................................. 1-101.6 How to use this guide ............................................................................................ 1-11
Chapter 2 Optimization Checklist2.1 About the optimization checklist .............................................................................. 2-22.2 The checklist ............................................................................................................ 2-32.3 Checklist for porting desktop applications to mobile devices ................................. 2-102.4 Check system settings ........................................................................................... 2-112.5 Final release checklist ........................................................................................... 2-12
Chapter 3 The Optimization Process3.1 The steps in the optimization process ..................................................................... 3-23.2 General optimization advice .................................................................................... 3-6
Chapter 4 Taking Measurements and Locating Bottlenecks4.1 About taking measurements and locating bottlenecks ............................................ 4-24.2 Procedure for taking measurements and locating bottlenecks ................................ 4-3
ARM DUI 0555C Copyright © 2011, 2013 ARM. All rights reserved. iiiID102813 Non-Confidential

Contents
4.3 Taking measurements ............................................................................................. 4-44.4 Analyzing graphs ..................................................................................................... 4-54.5 Locating bottlenecks with DS-5 Streamline ............................................................. 4-64.6 Locating bottlenecks with other tools ..................................................................... 4-134.7 Isolating specific problem areas ............................................................................ 4-174.8 List of optimizations ............................................................................................... 4-19
Chapter 5 Optimization Workflows5.1 About optimization workflows .................................................................................. 5-25.2 The initial optimization workflow .............................................................................. 5-5
Chapter 6 Application-Processor Optimization Workflow6.1 About application-processor bound problems ......................................................... 6-26.2 Check if the problem is application bound or API bound ......................................... 6-46.3 Application bound .................................................................................................... 6-56.4 API bound ................................................................................................................ 6-66.5 Check for too many draw calls ................................................................................. 6-76.6 Check usage of VBOs ............................................................................................. 6-86.7 Check for pipeline stalls ........................................................................................... 6-96.8 Check for too many state changes ........................................................................ 6-106.9 Other application-processor bound problems ........................................................ 6-11
Chapter 7 Utgard Optimization Workflows7.1 Utgard architecture vertex processing bound problems .......................................... 7-27.2 Utgard architecture fragment-processing bound problems ...................................... 7-67.3 Utgard architecture bandwidth bound problems .................................................... 7-14
Chapter 8 Midgard Optimization Workflows8.1 Counters to measure on Midgard architecture Mali GPUs ...................................... 8-28.2 Midgard architecture vertex processing bound problems ........................................ 8-38.3 Midgard architecture fragment-processing bound problems ................................... 8-68.4 Midgard architecture bandwidth bound problems .................................................. 8-12
Chapter 9 Application Processor Optimizations9.1 Align data ................................................................................................................. 9-29.2 Optimize loops ......................................................................................................... 9-39.3 Use vector instructions ............................................................................................ 9-59.4 Use fast data structures ........................................................................................... 9-69.5 Consider alternative algorithms and data structures ............................................... 9-79.6 Use multiprocessing ................................................................................................ 9-8
Chapter 10 API Level Optimizations10.1 Minimize draw calls ................................................................................................ 10-210.2 Minimize state changes ......................................................................................... 10-710.3 Ensure the graphics pipeline is kept running ......................................................... 10-8
Chapter 11 Vertex Processing Optimizations11.1 Reduce the number of vertices .............................................................................. 11-211.2 Use culling ............................................................................................................. 11-311.3 Use normal maps to simulate fine geometry ......................................................... 11-511.4 Use level of detail .................................................................................................. 11-6
Chapter 12 Fragment Processing Optimizations12.1 Fragment processing optimizations ....................................................................... 12-212.2 Fragment shader optimizations ............................................................................. 12-4
Chapter 13 Bandwidth Optimizations13.1 About reducing bandwidth ..................................................................................... 13-2
ARM DUI 0555C Copyright © 2011, 2013 ARM. All rights reserved. ivID102813 Non-Confidential

Contents
13.2 Optimize textures ................................................................................................... 13-313.3 Use mipmapping .................................................................................................... 13-513.4 Use texture compression ....................................................................................... 13-613.5 Only use trilinear filtering if necessary ................................................................... 13-813.6 Reduce bandwidth by avoiding overdraw .............................................................. 13-913.7 Reduce drawing surfaces with culling .................................................................. 13-1013.8 Reduce bandwidth by utilizing level of detail ....................................................... 13-11
Chapter 14 Miscellaneous Optimizations14.1 Use approximations ............................................................................................... 14-214.2 Check the display settings ..................................................................................... 14-514.3 Use VSYNC ........................................................................................................... 14-814.4 Make use of under-used resources ..................................................................... 14-11
Appendix A Utgard Architecture Performance CountersA.1 Vertex processor performance counters .................................................................. A-2A.2 Fragment processor performance counters ............................................................. A-4
Appendix B Midgard Architecture Performance Counters
ARM DUI 0555C Copyright © 2011, 2013 ARM. All rights reserved. vID102813 Non-Confidential
Preface
This preface introduces the ARM® Mali™ GPU OpenGL ES Application Optimization Guide. It contains the following sections:• About this book on page vii.• Feedback on page x.
ARM DUI 0555C Copyright © 2011, 2013 ARM. All rights reserved. viID102813 Non-Confidential
Preface
About this bookThis book is for ARM Mali Graphics Processor Units (GPUs).
Note This book is not for the Mali-55 GPU.
Intended audience
This book is written for application developers who are developing or porting applications to platforms with Mali GPUs. This guide assumes application developers have some knowledge of 3D graphics programming but it does not assume they are experts.
Using this book
This book is organized into the following chapters:
Chapter 1 Introduction Read this for an introduction to optimizing for Mali GPUs.This chapter introduces the concept of optimization. It explains why you optimize and what you can optimize for. It also provides an overview of the Mali GPUs, the graphics pipeline, the difference between development for desktop and mobile platforms.
Chapter 2 Optimization Checklist Read this for a list of things to check for before starting a full optimization process. These are relatively simple optimization techniques that can make a large difference. These are listed first to remind you of these basic, but most important, techniques.
Chapter 3 The Optimization Process Read this for a description of a full optimization process. It describes with the aid of a flow chart, the process of diagnosing and solving performance problems. The flowchart goes through the process of taking a measurement, determining the bottleneck, and using the relevant optimization to remove the bottleneck.
Chapter 4 Taking Measurements and Locating Bottlenecks Read this for a description of how to take measurements of your application and locate performance bottlenecks.
Chapter 5 Optimization Workflows Read this for an introduction to optimization workflows and the initial optimization workflow.
Chapter 6 Application-Processor Optimization Workflow Read this for a series of flow charts that guide you through a series of common application-processor performance problems. Each flow chart guides you through the process of diagnosing problems and selecting optimizations to remove the bottlenecks.
ARM DUI 0555C Copyright © 2011, 2013 ARM. All rights reserved. viiID102813 Non-Confidential

Preface
Chapter 7 Utgard Optimization Workflows Read this for a series of flow charts that guide you through a series of common performance problems. Each flow chart guides you through the process of diagnosing problems and selecting optimizations to remove the bottlenecks. This chapter is for use with Utgard architecture Mali GPUs.
Chapter 8 Midgard Optimization Workflows Read this for a series of flow charts that guide you through a series of common performance problems. Each flow chart guides you through the process of diagnosing problems and selecting optimizations to remove the bottlenecks. This chapter is for use with Midgard architecture Mali GPUs.
Chapter 9 Application Processor Optimizations Read this for a list of optimizations for applications that are performance limited by the application processor.
Chapter 10 API Level Optimizations Read this for a list of optimizations for applications that are performance limited by API usage.
Chapter 11 Vertex Processing Optimizations Read this for a description of optimizations for applications that are performance limited by vertex processing.
Chapter 12 Fragment Processing Optimizations Read this for a list of optimizations for applications that are performance limited by fragment processing.
Chapter 13 Bandwidth Optimizations Read this for a list of optimizations for applications that are performance limited by bandwidth.
Chapter 14 Miscellaneous Optimizations Read this for a list of optimizations that are not categorized in the other chapters.
Appendix A Utgard Architecture Performance Counters Read this for a description of the Utgard architecture Mali GPU performance counters.
Appendix B Midgard Architecture Performance Counters Read this for a description of the Midgard architecture Mali GPU performance counters.
Glossary
The ARM Glossary is a list of terms used in ARM documentation, together with definitions for those terms. The ARM Glossary does not contain terms that are industry standard unless the ARM meaning differs from the generally accepted meaning.
See ARM Glossary, http://infocenter.arm.com/help/topic/com.arm.doc.aeg0014-/index.html.
Conventions
This book uses the conventions that are described in:• Typographical conventions on page ix.
ARM DUI 0555C Copyright © 2011, 2013 ARM. All rights reserved. viiiID102813 Non-Confidential

Preface
Typographical conventions
The following table describes the typographical conventions:
Additional reading
This section lists publications by ARM and by third parties.
See Infocenter, http://infocenter.arm.com, for access to ARM documentation.
ARM publications
This book contains information that is specific to this product. See the following documents for other relevant information:• ARM® Mali™ GPU OpenGL ES Application Development Guide (ARM DUI 0363).• ARM®Cortex®-A Series Programmer’s Guide (ARM DEN 0013).
Other publications
This section lists relevant documents published by third parties:• OpenGL ES 2.0 Specification, http://www.khronos.org.• OpenGL ES 3.0 Specification, http://www.khronos.org.• OpenGL ES Shading Language Specification, http://www.khronos.org.• EGL 1.4 Specification, http://www.khronos.org.
Typographical conventions
Style Purpose
italic Introduces special terminology, denotes cross-references, and citations.
bold Highlights interface elements, such as menu names. Denotes signal names. Also used for terms in descriptive lists, where appropriate.
monospace Denotes text that you can enter at the keyboard, such as commands, file and program names, and source code.
monospace Denotes a permitted abbreviation for a command or option. You can enter the underlined text instead of the full command or option name.
monospace italic Denotes arguments to monospace text where the argument is to be replaced by a specific value.
monospace bold Denotes language keywords when used outside example code.
<and> Encloses replaceable terms for assembler syntax where they appear in code or code fragments. For example:MRC p15, 0 <Rd>, <CRn>, <CRm>, <Opcode_2>
SMALL CAPITALS Used in body text for a few terms that have specific technical meanings, that are defined in the ARM glossary. For example, IMPLEMENTATION DEFINED, IMPLEMENTATION SPECIFIC, UNKNOWN, and UNPREDICTABLE.
ARM DUI 0555C Copyright © 2011, 2013 ARM. All rights reserved. ixID102813 Non-Confidential

Preface
FeedbackARM welcomes feedback on this product and its documentation.
Feedback on this product
If you have any comments or suggestions about this product, contact your supplier and give:• The product name.• The product revision or version.• An explanation with as much information as you can provide. Include symptoms and
diagnostic procedures if appropriate.
Feedback on content
If you have comments on content then send an e-mail to [email protected]. Give:• The title.• The number, ARM DUI 0555C.• The page numbers to which your comments apply.• A concise explanation of your comments.
ARM also welcomes general suggestions for additions and improvements.
Note ARM tests the PDF only in Adobe Acrobat and Acrobat Reader, and cannot guarantee the quality of the represented document when used with any other PDF reader.
ARM DUI 0555C Copyright © 2011, 2013 ARM. All rights reserved. xID102813 Non-Confidential

Chapter 1 Introduction
This chapter introduces the ARM® Mali™ GPU OpenGL ES Application Optimization Guide. It contains the following sections:• About optimization on page 1-2.• The Mali GPU hardware on page 1-3.• The graphics pipeline on page 1-7.• Differences between desktop systems and mobile devices on page 1-9.• Differences between mobile renderers on page 1-10.• How to use this guide on page 1-11.
ARM DUI 0555C Copyright © 2011, 2013 ARM. All rights reserved. 1-1ID102813 Non-Confidential

Introduction
1.1 About optimizationGraphics is about making things look good. Optimization is about making things look good with the least computational effort. Optimization is especially important for mobile devices that have restricted computing power and memory bandwidth to save power.
Optimization is the process of taking an application and making it more efficient. For graphical applications this typically means modifying the application to make it faster.
A low frame rate means the application appears jumpy. This gives a bad impression and can make applications such as games difficult to play. You can use optimization to improve the frame rate of an application. This makes using the application a better, smoother experience.
A consistent frame rate is typically more important than a high frame rate. A frame rate that varies gives a worse impression than a relatively low but consistent frame rate.
Optimization can have different objectives, such as:• Increase the frame rate.• Make content more detailed.• Reduce power consumption.
— Use less memory bandwidth.— Use fewer clock cycles per frame.
• Reduce memory foot print.• Reduce download size.
Different optimizations are often interrelated. For example, you can use frame rate optimization as a means to save power. You do this by optimizing the application for a higher frame rate but limiting the frame rate to a lower level. This saves power because the GPU requires less time to compute frames and can remain idle for longer periods.
Optimizing to reduce the memory footprint of an application is not a typical optimization, but it can be useful because smaller applications are more cacheable. In this case, making the application smaller can also have the effect of making the application faster.
Note This guide primarily concentrates on making the application frame rate higher. Where appropriate, other types of optimization are mentioned.
ARM DUI 0555C Copyright © 2011, 2013 ARM. All rights reserved. 1-2ID102813 Non-Confidential

Introduction
1.2 The Mali GPU hardwareThis section describes the main components of the Mali GPU hardware. It contains the following sections:• About the Mali GPU families.• Utgard architecture hardware.• Midgard architecture hardware on page 1-5.
1.2.1 About the Mali GPU families
There are two families of Mali GPUs:
The Utgard architecture family The Utgard architecture family of Mali GPUs have a vertex processor and one or more fragment processors. They are used for graphics only applications with OpenGL ES 1.1 and 2.0.See Utgard architecture hardware.
The Midgard architecture family The Midgard architecture family of Mali GPUs have unified shader cores that perform vertex, fragment, and compute processing. They are used for graphics and compute applications with OpenGL ES 1.1 to OpenGL ES 3.0, and OpenCL 1.1.See Midgard architecture hardware on page 1-5.
Both families of Mali GPUs also contain the following common hardware:
Tile based rendering Mali GPUs use tile-based deferred rendering.The Mali GPU divides the framebuffer into tiles and renders it tile by tile. Tile-based rendering is efficient because values for pixels are computed using on-chip memory. This technique is ideal for mobile devices because it requires less memory bandwidth and less power than traditional rendering techniques.
L2 cache controller One or more L2 cache controllers are included with the Mali GPUs. L2 caches reduce memory bandwidth usage and power consumption.An L2 cache is designed to hide the cost of accessing memory. Main memory is typically slower than the GPU, so the L2 cache can increase performance considerably in some applications.
Note Mali GPUs use L2 cache in place of local memory.
1.2.2 Utgard architecture hardware
This section describes the main components of the Utgard architecture Mali GPUs. It contains the following sections:• Utgard architecture hardware components on page 1-4.• The vertex processor on page 1-4.• The fragment processors on page 1-5.
ARM DUI 0555C Copyright © 2011, 2013 ARM. All rights reserved. 1-3ID102813 Non-Confidential

Introduction
Utgard architecture hardware components
Utgard architecture Mali GPUs are typically used in a mobile or embedded environment to accelerate 2D and 3D graphics. The graphics are produced using an OpenGL ES graphics pipeline. See The graphics pipeline on page 1-7.
Mali GPUs are configurable so they can contain different components. The types of components a Mali GPU can contain are:• Vertex processor.• Fragment processors.• Memory Management Units (MMUs).• Power Management Unit (PMU).• L2 cache.
Table 1-1 Shows the components in the Utgard architecture Mali GPUs.
Figure 1-1 shows a Mali-400 MP GPU.
Figure 1-1 Mali-400 MP GPU
A general-purpose application processor runs the operating system, graphics applications, and the Mali GPU driver.
The vertex processor
The vertex processor handles the vertex processing stage of the graphics pipeline. It generates lists of primitives and accelerates the building of data structures, such as polygon lists and packed vertex data, for the fragment processors.
Table 1-1 Possible Mali GPU components
Mali GPU Vertex processor
Fragment processors MMU PMU L2 Cache
Mali-200 1 1 1 - -
Mali-300 1 1 2 1 8 KB
Mali-400 MP 1 1-4 1 per processor 1 0 KB-256 KB
Mali-450 MP 1 1-8 1 per processor 1 64 KB-256 KB per fragment processor block
Fragment processor
Vertexprocessor
MMU
Mali-400 MP GPU
L2 cache controller
MMU
Fragment processor
MMU
Fragment processor
MMU
Fragment processor
MMUPower
ManagementUnit
ARM DUI 0555C Copyright © 2011, 2013 ARM. All rights reserved. 1-4ID102813 Non-Confidential

Introduction
The fragment processors
The fragment processors handle the rasterization and fragment processing stages of the graphics pipeline. They use the data structures and lists of primitives generated by the vertex processor to produce the framebuffer result that is displayed on the screen.
1.2.3 Midgard architecture hardware
This section describes the main components of the Midgard architecture Mali GPUs. It contains the following sections:• Midgard architecture hardware components• Shader cores on page 1-6
Midgard architecture hardware components
Midgard architecture Mali GPUs are typically used in a mobile or embedded environment to accelerate 2D graphics, 3D graphics, and computations. The graphics are produced using an OpenGL ES graphics pipeline. See The graphics pipeline on page 1-7.
A general-purpose application processor runs the operating system, graphics applications, and the Mali GPU driver.
Midgard architecture Mali GPUs are configurable so they can contain different components. The types of components a Midgard architecture Mali GPU can contain are:• Shader cores.• Memory Management Units.• L2 cache.• Hierarchical tiler.
Table 1-1 on page 1-4 shows the components in the Midgard architecture Mali GPUs.
Figure 1-2 on page 1-6 shows a Mali-T600 Series GPU.
Table 1-2 Possible Mali-T600 series GPU components
Mali GPU Shader cores Arithmetic pipes per shader core MMU L2 Cache Hierarchical tiler
Mali-T604 1-4 2 1 32 KB - 128 KB 1
Mali-T658 1-8 4 1-2 32 KB - 512 KB 1
Mali-T622 1-2 2 1 32 KB - 64 KB 1
Mali-T624 1-4 2 1 32 KB - 128 KB 1
Mali-T628 1-8 2 1-2 32 KB - 512 KB 1
Mali-T678 1-8 4 1-2 32 KB - 512 KB 1
ARM DUI 0555C Copyright © 2011, 2013 ARM. All rights reserved. 1-5ID102813 Non-Confidential

Introduction
Figure 1-2 Mali-T600 Series GPU
Shader cores
The shader cores handles the vertex processing stage of the graphics pipeline. It generates lists of primitives and accelerates the building of data structures, such as polygon lists and packed vertex data, for fragment processing.
The shader cores also handle the rasterization and fragment processing stages of the graphics pipeline. They use the data structures and lists of primitives generated during vertex processing to produce the framebuffer result that is displayed on the screen.
Mali-T600Series Core Group
Job Manager
Hierarchial Tiler
Shader Core 2 Shader Core 3 Shader Core 4
Coherent Level 2 Cache Memory Subsystem
Memory Management
Unit
Shader Core 1
ARM DUI 0555C Copyright © 2011, 2013 ARM. All rights reserved. 1-6ID102813 Non-Confidential
Introduction
1.3 The graphics pipelineMali GPUs implement a graphics pipeline supporting the OpenGL ES Application Programming Interfaces (APIs). This section describes the OpenGL ES graphics pipeline, it contains the following sections:• OpenGL ES Graphics pipeline overview.• Initial processing.• Per-vertex operations on page 1-8.• Rasterization and fragment shading on page 1-8.• Blending and framebuffer operations on page 1-8.
1.3.1 OpenGL ES Graphics pipeline overview
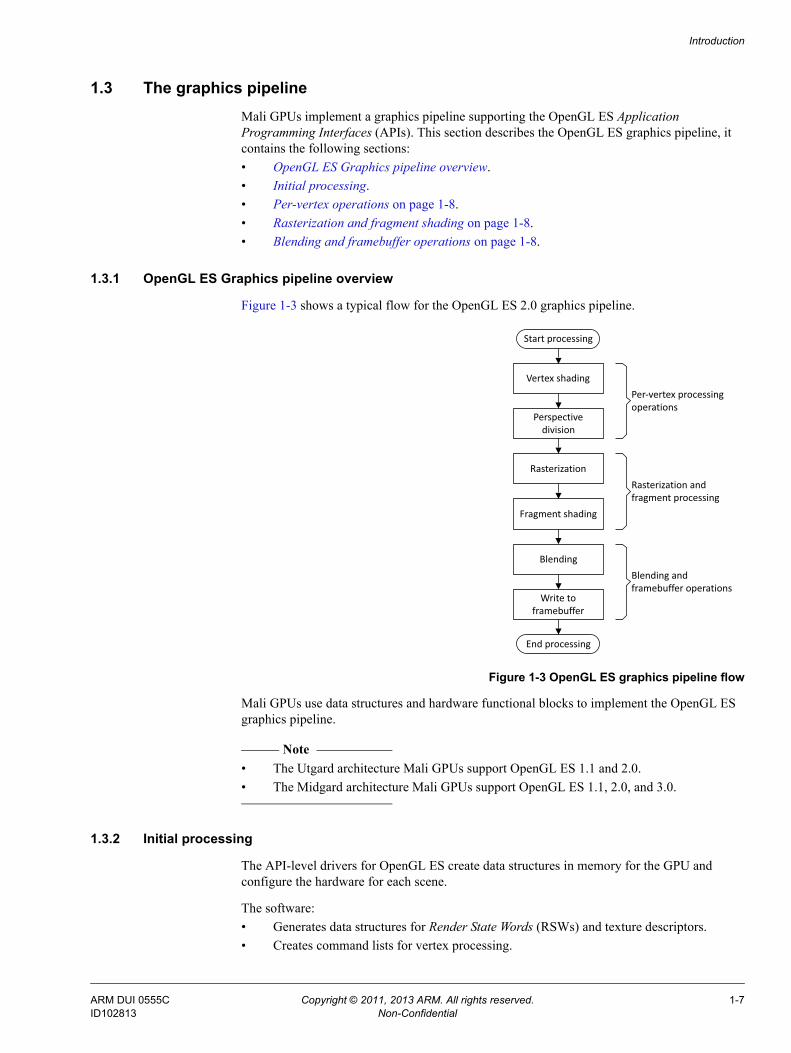
Figure 1-3 shows a typical flow for the OpenGL ES 2.0 graphics pipeline.
Figure 1-3 OpenGL ES graphics pipeline flow
Mali GPUs use data structures and hardware functional blocks to implement the OpenGL ES graphics pipeline.
Note • The Utgard architecture Mali GPUs support OpenGL ES 1.1 and 2.0.• The Midgard architecture Mali GPUs support OpenGL ES 1.1, 2.0, and 3.0.
1.3.2 Initial processing
The API-level drivers for OpenGL ES create data structures in memory for the GPU and configure the hardware for each scene.
The software:• Generates data structures for Render State Words (RSWs) and texture descriptors.• Creates command lists for vertex processing.
End processing
Start processing
Vertex shading
Perspectivedivision
Fragment shading
Rasterization
Write to framebuffer
Per-vertex processing operations
Rasterization and fragment processing
Blending and framebuffer operations
Blending
ARM DUI 0555C Copyright © 2011, 2013 ARM. All rights reserved. 1-7ID102813 Non-Confidential

Introduction
• Compiles shaders on demand.
1.3.3 Per-vertex operations
The shader core or vertex processor runs a vertex shader program for each vertex.
This shader program performs:• Lighting.• Transforms.• Viewport transformation.• Perspective transformation.
The shader core or vertex processor also perform the following processing:• Assembles vertices of graphics primitives.• Builds polygon lists.
1.3.4 Rasterization and fragment shading
The shader cores or fragment processors perform the following operations:
Reads data Reads the state information, polygon lists, and transformed vertex data. These are processed in a triangle setup unit to generate coefficients.
Rasterizes polygons The rasterizer takes the coefficients from the triangle setup unit and applies equations to create fragments.
Executes fragment shaders A fragment shader program executes on each fragment to calculate the color of the fragment.
1.3.5 Blending and framebuffer operations
The shader cores or fragment processors produces the final display data for the framebuffer after processing the tile buffer. To increase processing speed, each shader core or fragment processor processes a different tile.
The blending unit blends the fragments with the color already present at the corresponding location in the tile buffer.
The shader core or fragment processor:
1. Tests the fragments and updates the tile buffer.
2. Calculates if fragments are visible or hidden and stores the visible fragments in tile buffers.
3. Writes the contents of the tile buffer to the framebuffer after the tile is completely rendered.
ARM DUI 0555C Copyright © 2011, 2013 ARM. All rights reserved. 1-8ID102813 Non-Confidential

Introduction
1.4 Differences between desktop systems and mobile devicesMobile and embedded systems must balance compute power, battery life, and cost. This means the following resources are limited in mobile platforms compared to desktop platforms:• Compute capability.• Memory capacity.• Memory bandwidth.• Power consumption.• Physical size.
Desktop systems do not have these limitations so application developers can have many times more compute resources to utilize.
Mali GPUs are typically used in mobile or embedded systems so it is important to be aware of these differences if you are porting a graphics application from a desktop platform.
Some graphically rich applications were initially developed for desktop platforms and then ported to embedded or mobile platforms. The reduction in available resources means that the application is unlikely to work at the same performance level as it does on the desktop platform.
Optimization enables your application to get closer to the performance level it achieves on a desktop platform.
See Checklist for porting desktop applications to mobile devices on page 2-10.
ARM DUI 0555C Copyright © 2011, 2013 ARM. All rights reserved. 1-9ID102813 Non-Confidential

Introduction
1.5 Differences between mobile renderersThe section describes differences between mobile renderers. It contains the following sections:• Differences with other mobile GPUs.• Differences with software renderers.
1.5.1 Differences with other mobile GPUs
All GPUs have different optimization points. Many optimizations are common but do not assume an application optimized for one platform automatically performs well on another.
For example, ARM recommends you sort objects or triangles into front-to-back order in your application. This enables early culling of fragments, reduces fragment processing load, and reduces overdraw.
This optimization is not unique to Mali GPUs, it also works on some other mobile GPUs and desktop GPUs.
1.5.2 Differences with software renderers
If your application runs on existing mobile devices with a software renderer, the application might not run well on a Mali GPU. This is because the optimizations for using a GPU can be very different to those for software renderers.
To obtain high performance with a GPU, your application might require re-optimization. In particular, ensure you do not use a large number of draw calls per frame. Batch objects together to reduce the number of draw calls.
For more information, see Minimize draw calls on page 10-2.
ARM DUI 0555C Copyright © 2011, 2013 ARM. All rights reserved. 1-10ID102813 Non-Confidential

Introduction
1.6 How to use this guideThis guide is to help you create better applications. You can use it to help you optimize an existing applications or you can use the techniques as you develop applications.
You can optimize an application anywhere in the development process. It is best to start with a good design and use optimization techniques during development in application areas that you know are compute intensive.
You can use this guide in the following ways:• To improve performance on an existing application or towards the end of development,
see the following chapter:— Chapter 2 Optimization Checklist.
• To learn the optimization process, see the following chapters:— Chapter 3 The Optimization Process.— Chapter 4 Taking Measurements and Locating Bottlenecks.
• As a guide with example workflows that take you through a full optimization process. see the following chapters:— Chapter 5 Optimization Workflows.— Chapter 6 Application-Processor Optimization Workflow.— Chapter 7 Utgard Optimization Workflows.— Chapter 8 Midgard Optimization Workflows.
Note For a full optimization process. start at Chapter 5.
• To learn optimization techniques or as a reference, see the following chapters:— Chapter 9 Application Processor Optimizations.— Chapter 10 API Level Optimizations.— Chapter 11 Vertex Processing Optimizations.— Chapter 12 Fragment Processing Optimizations.— Chapter 13 Bandwidth Optimizations.— Chapter 14 Miscellaneous Optimizations.
Note These chapters divide optimizations by processor type. However, many optimizations are
not specific to one processor and can apply to others.
ARM DUI 0555C Copyright © 2011, 2013 ARM. All rights reserved. 1-11ID102813 Non-Confidential

Chapter 2 Optimization Checklist
This chapter provides a checklist to go through before starting a full optimization process. It contains the following sections:• About the optimization checklist on page 2-2.• The checklist on page 2-3.• Checklist for porting desktop applications to mobile devices on page 2-10.• Check system settings on page 2-11.• Final release checklist on page 2-12.
Note These techniques can have a very large impact on performance, so ensure you have checked these before moving onto the following chapters.
ARM DUI 0555C Copyright © 2011, 2013 ARM. All rights reserved. 2-1ID102813 Non-Confidential

Optimization Checklist
2.1 About the optimization checklistApplications can under-perform for a number of reasons. Optimizing 3D applications can be a complex topic with many different techniques that can be used in different circumstances.
However, many performance problems can be fixed relatively easily. Most of these require relatively simple optimization techniques that you can use to improve the performance and quality of graphics.
This chapter lists a number of techniques that fix many basic problems. Ensure you go through the list before trying more advanced optimizations.
ARM DUI 0555C Copyright © 2011, 2013 ARM. All rights reserved. 2-2ID102813 Non-Confidential
Optimization Checklist
2.2 The checklistThis section contains a list of things to check in your application. It contains the following sections:• Check the display settings.• Use direct rendering if possible.• Use the correct tools with the correct settings on page 2-4.• Remove debugging information on page 2-4.• Avoid infinite command lists on page 2-5.• Avoid calls that stall the graphics pipeline on page 2-5.• Do not compile shaders every frame on page 2-6.• Use VSYNC on page 2-6.• Use graphics assets that are appropriate for your platform on page 2-6.• Do not use 24-bit textures on page 2-6.• Use mipmapping on page 2-7.• Use texture compression on page 2-7.• Reduce memory bandwidth usage on page 2-8.• Use Vertex Buffer Objects on page 2-8.• Ensure your application is not application-processor bound on page 2-8.
2.2.1 Check the display settings
Ensure the settings for your display system are correct and your application matches them. If there is a mismatch the system might perform a pixel format conversion and possibly also blitting to correct it. Resources used for conversions cannot be used by applications so have a negative impact on the performance of your application.
Check the following settings:
• Ensure your application has the correct drawing surfaceWhen your application requests a drawing surface it might not get the type of surface it requested. To avoid getting the wrong surface, check potential surfaces as they are returned and only accept the correct one.For example code that shows how to sort through EGLConfigs, see the Mali Developer Center, http://malideveloper.arm.com/.
• Ensure the framebuffer resolution and color format are compatible with the display controller.
The following advice applies to platforms that use the Linux OS FBDEV:• Ensure the framebuffer does not exceed the resolution of the screen.• Ensure the framebuffer does not exceed the color depth of the screen.• Ensure the drawing surface format is the same as the framebuffer format.
2.2.2 Use direct rendering if possible
Blitting is an expensive operation that takes time and consumes a lot of memory bandwidth. You can improve performance significantly by avoiding it.
The process of drawing graphics directly into the framebuffer is called direct rendering. If possible, use direct rendering to avoid blitting and increase the performance of your application. Using direct rendering is OS-specific, so see the documentation for your OS to check if it is available and how to use it.
ARM DUI 0555C Copyright © 2011, 2013 ARM. All rights reserved. 2-3ID102813 Non-Confidential

Optimization Checklist
2.2.3 Use the correct tools with the correct settings
Using the right tools or tools with the right settings can significantly impact performance. Ensure you are using the correct tools with the latest updates and setting appropriate for your device:
Use the latest tools Compile your application with the latest versions of your development tools. This ensures your application benefits from the latest stability improvements and performance optimizations.
Rebuild everything after a tools update If you change tools or versions of tools, ensure you recompile everything so all the software benefits from the changes.
Build for the correct architecture There are different versions of application processor architectures. To ensure the best performance, ensure you build for the correct version. If you build for an older architecture version and run on a newer version, performance might be reduced.
Use the facilities in your hardware If your platform has hardware floating point, Vector Floating Point (VFP), or NEON™, ensure the compiler is set to build for it. Also consider using libraries that take advantage of these hardware features.
Note If your operating systems supports hard floating point, ensure the entire system
and support libraries are built to support it.
Optimize your release build Ensure that for release, you set your compiler to produce binaries optimized for speed. These provide the best performance.
2.2.4 Remove debugging information
Gathering debugging information is useful for correcting errors, but it requires memory and compute resources. The process of gathering debugging information typically has a negative impact on performance.
Ensure you switch off debugging before releasing your application. Only leave debugging on if you require debugging capability in your application.
For other pre-release checks, see Final release checklist on page 2-12.
Use minimal printf() calls printf() calls can be very slow. You can prevent them from impacting application performance by only displaying the frame rate after a relatively large number of frames. For example, make a printf() call every 100 frames, not every frame or every second frame.If you are using logcat on Android OS you can use more calls because it has a minimal impact on performance.
ARM DUI 0555C Copyright © 2011, 2013 ARM. All rights reserved. 2-4ID102813 Non-Confidential

Optimization Checklist
Do not call glGetError() more than one time per frame Every call to glGetError() takes time to process. A large number of these per frame consumes sufficient compute resources to limit the frame rate of the application. Ensure you make no more than one glGetError() call per frame.You can use #define macros to build the debug code for development builds and remove it for release builds.
Note If the application is gathering debugging information while you are taking performance measurements, these measurements are likely to be inaccurate.
2.2.5 Avoid infinite command lists
This section describes infinite command lists and the issues they can cause.
The process of deferred rendering involves placing commands into lists. If you do not clear buffers between frames, the command lists can keep growing. This causes the Mali GPU to repeat work already completed for previous frames. This is obviously more work than necessary.
Note • This issue is typically only a problem if your application renders to a surface such as a
pixmapsurface, or pbuffersurface, and it does not clear the command lists at the end of a frame.
• This issue is not a problem if your application uses Framebuffer Objects (FBO).
• An application that renders to a eglWindowSurface automatically ends the frame every time it calls eglSwapBuffers().
To prevent command lists growing, ensure your application clears the following buffers before drawing a new frame:• Color buffers.• Depth buffers.• Stencil buffers.
You can use the following command to clear these buffers:
glClear( GL_COLOR_BUFFER_BIT | GL_DEPTHBUFFER_BIT | GL_STENCILBUFFER_BIT );
Note You must clear all these buffers at the same time.
2.2.6 Avoid calls that stall the graphics pipeline
Some OpenGL ES function calls read from the framebuffer. To do this, the Mali GPU must first render the entire image before you can read back from it. This operation causes the graphics pipeline to stall so it is likely to reduce performance.
Avoid the following OpenGL ES calls:• glReadPixels()
• glCopyTexImage()
• glTexSubImage()
ARM DUI 0555C Copyright © 2011, 2013 ARM. All rights reserved. 2-5ID102813 Non-Confidential

Optimization Checklist
2.2.7 Do not compile shaders every frame
It is possible to compile shaders for every frame. This reduces the performance of your application because shader compilation requires application processor and memory resources.
It is more efficient to compile shaders when your application starts. This only requires resources when your application starts, so it does not reduce the performance of your application while it is running.
You can also ship your application with pre-compiled shaders. These only require linking at runtime so require relatively little runtime compute resources.
Note Pre-compiled shaders only work on the GPUs they are compiled for.
2.2.8 Use VSYNC
Vertical Synchronization (VSYNC) synchronizes the frame rate of your application with the screen display rate. VSYNC is a useful technique because:
• It improves image quality by removing tearing.
• It reduces power consumption by preventing the application producing frames faster than the screen can display them.
For more information see Use VSYNC on page 14-8.
Note Do not use VSYNC if you are measuring performance.
2.2.9 Use graphics assets that are appropriate for your platform
Some mobile platforms have small screens with relatively low resolutions compared to desktop systems.
If you are porting a desktop application to a mobile platform, fine details are likely to have little visual impact. This enables you to simplify graphics assets. You can make changes such as:• Reducing the size and bit depth of textures.• Reducing geometry complexity.• Simplifying or removing effects that have little visible impact.
These changes reduce memory bandwidth usage and enable higher performance.
For more information on simplification, see Use approximations on page 14-2.
2.2.10 Do not use 24-bit textures
For high bit depth textures, use 16-bit or 32-bit textures rather than 24-bit textures.
24-bit textures do not fit neatly into cache. Using 24-bit textures can cause data to use more than one cache line and this has a negative impact on performance and memory bandwidth.
16-bit and 32-bit textures fit into cache lines without problems so they do not suffer from these performance issues.
ARM DUI 0555C Copyright © 2011, 2013 ARM. All rights reserved. 2-6ID102813 Non-Confidential

Optimization Checklist
Note For most textures, it is better to use texture compression than high bit depth textures. Compressed textures improve performance because they use less memory bandwidth. For more information, see Use texture compression.
2.2.11 Use mipmapping
Mipmapping is a technique that can simultaneously:• Improve image quality.• Increase performance.• Reduce memory bandwidth usage.
You can instruct the Mali GPU driver to generate mipmaps at runtime in OpenGL ES with a single line of code. Alternatively you can pre-generate the mipmaps with the Mali GPU Texture Compression Tool.
Mipmapping is an easy way to improve the performance of memory bandwidth limited applications.
Note Some applications have shown very large performance gains with mipmapping enabled.
2.2.12 Use texture compression
Texture compression is a technique that reduces the size of textures in memory. Texture compression can:• Increase performance.• Increase texture cacheability.• Reduce memory bandwidth usage.
The Mali GPU drivers support a number of different texture compression types.
ETC1 Ericsson Texture Compression (ETC1) is widely used with all OpenGL ES versions. All Mali GPUs support ETC1.
ETC2 ETC2 is an improved version of ETC1 that includes transparency support. ETC2 is a part of the OpenGL ES 3.0 specification.
ASTC Adaptive Scalable Texture Compression (ASTC) is an official extension to OpenGL ES 3.0.
Table 2-1 Texture compression types
Compression type Mali GPU support
ETC1 All Mali GPUs
ETC2 All Mali-T600 Series GPUs
ASTC Mali-T622, Mali-T624, Mali-T628, Mali-T678
ARM DUI 0555C Copyright © 2011, 2013 ARM. All rights reserved. 2-7ID102813 Non-Confidential

Optimization Checklist
You can create ETC1, ETC2 and ASTC compressed textures with the Mali GPU Texture Compression Tool.
For more information see Use texture compression on page 13-6.
2.2.13 Reduce memory bandwidth usage
Memory bandwidth requires a lot of power, so it is very restricted in mobile devices compared to desktop systems. Bandwidth can easily become a bottleneck limiting the performance of your application. For this reason, it is important to keep bandwidth usage low:
• Bandwidth is a shared resource so using too much can limit the performance of the entire system in unpredictable ways. For example, graphics memory is shared with application memory so high bandwidth usage by the GPU can degrade application processor performance.
• Accessing data in cache reduces power usage and can increase performance. If your application must read from memory a lot, use techniques such as mipmapping and texture compression to ensure your data is cache friendly. See Use mipmapping on page 2-7, and see Use texture compression on page 2-7.
Note Determining that memory bandwidth is causing problems is difficult. See Determining if memory bandwidth is the problem on page 4-18.
There are a number of methods you can use to reduce memory bandwidth usage.• Activate back face culling.• Utilize view frustum culling.• Ensure textures are not too large.• Use a texture resolution that fits the object on screen.• Use low bit depth textures where possible.• Use lower resolution textures if the texture does not contain sharp detail.• Only use trilinear filtering on specific objects.• Utilize Level of Detail (LOD).
For more information see Chapter 13 Bandwidth Optimizations.
2.2.14 Use Vertex Buffer Objects
A Vertex Buffer Object (VBO) is a data storage mechanism that enables an application to store and manipulate data in GPU memory. VBOs provide a large reduction in vertex bandwidth overhead so can provide a considerable performance increase.
If you send data to the GPU every frame it is copied whether it has changed or not. Using VBOs avoids these copies because storing data in the GPU memory means no copies are required.
Note You can also do the same for index buffers by using index buffer objects.
2.2.15 Ensure your application is not application-processor bound
If an application is application-processor bound, the graphics system idles while it waits for graphics data to process. In this case, you must optimize the application code. Optimizations to improve graphics performance have no impact on overall performance.
ARM DUI 0555C Copyright © 2011, 2013 ARM. All rights reserved. 2-8ID102813 Non-Confidential

Optimization Checklist
The application can be application-processor bound in the following areas:• The application logic is too compute intensive.• The application is overloading the driver by not using the API optimally.• A combination of application logic and driver.
There are a number of methods to optimize application code:• Optimize API usage.• Align data.• Use loop optimizations.• Use fast data structures.• Use vector instructions.
For more information see Chapter 10 API Level Optimizations, and Chapter 9 Application Processor Optimizations.
Note A graphics application is more likely to be application-processor bound if it originated on a desktop platform and you are moving it to a mobile platform.
ARM DUI 0555C Copyright © 2011, 2013 ARM. All rights reserved. 2-9ID102813 Non-Confidential

Optimization Checklist
2.3 Checklist for porting desktop applications to mobile devicesIf you are porting a desktop application to a mobile device with a Mali GPU, the entire checklist applies. However, pay special attention to the following:• Draw non-transparent objects in front to back order.• Avoid high numbers of triangles.• Avoid long shaders.• Avoid high bit depth and high resolution textures.• Use texture compression.
ARM DUI 0555C Copyright © 2011, 2013 ARM. All rights reserved. 2-10ID102813 Non-Confidential

Optimization Checklist
2.4 Check system settingsIt is critical for application performance that your system is set up correctly. Even well optimized applications run badly if your system settings are not optimal.
Note Incorrect system settings are a common error so ensure you check them. If you cannot change the settings, inform the vendor of your system.
Check the caches are switched on Modern systems all use cache to boost performance. If the caches in the system are not switched on there is a large performance reduction.
Check the application processor and GPU clock settings are correct No application can run at maximum performance if the clock settings for the application processor or GPU are incorrect. Alternatively, if the clocks for the application processor or GPU are set too high the system is likely to use too much power.
Check the application processor and GPU are in full power mode Application processors and GPUs all have low speed, low power modes that save power when the processors are not in use. For high performance applications, ensure the processors are in full power mode for maximum performance.
Ensure the GPU clock is not scaled according to application processor load If the GPU clock is scaled according to the application processor load, the performance of applications are likely to suffer. This is because the application processor and GPU are likely to be busy at different times. If the GPU is busy when the application processor is not, lowering the clock of the GPU reduces performance.Control the clock of the application processor and GPU independently to fix this problem.
ARM DUI 0555C Copyright © 2011, 2013 ARM. All rights reserved. 2-11ID102813 Non-Confidential

Optimization Checklist
2.5 Final release checklistTable 2-2 lists items you can quickly check before releasing an application.
Table 2-2 Final release checklist
Check Additional Information
Are caches enabled? See Check system settings on page 2-11
Did you switch off debugging? See Remove debugging information on page 2-4
Have you removed pipeline stalling calls? See Avoid calls that stall the graphics pipeline on page 2-5
Is back face culling enabled? See Reduce drawing surfaces with culling on page 13-10 and Avoid overdraw on page 12-2
Is mipmapping enabled? See Use mipmapping on page 2-7
Are you using compressed textures? See Use texture compression on page 2-7
Is VSYNC enabled? See Use VSYNC on page 2-6
Did you use the latest tools? See Use the correct tools with the correct settings on page 2-4
Are your tools configured correctly?
Did you build an optimized binary?
ARM DUI 0555C Copyright © 2011, 2013 ARM. All rights reserved. 2-12ID102813 Non-Confidential

Chapter 3 The Optimization Process
This chapter describes the optimization process. It contains the following sections:• The steps in the optimization process on page 3-2.• General optimization advice on page 3-6.
The optimization process involves taking performance measurements, identifying bottlenecks, and applying appropriate techniques to remove them.
Note Chapter 7 Utgard Optimization Workflows provides examples of how to use this process.
ARM DUI 0555C Copyright © 2011, 2013 ARM. All rights reserved. 3-1ID102813 Non-Confidential

The Optimization Process
3.1 The steps in the optimization processThis section describes the steps in the optimization process. It contains the following sections:• About the optimization process on page 3-3.• Take measurements on page 3-4.• Locate the bottleneck on page 3-4.• Determine the optimization on page 3-4.• Apply the optimization on page 3-5.• Verify the optimization on page 3-5.• Repeat the optimization process on page 3-5.
ARM DUI 0555C Copyright © 2011, 2013 ARM. All rights reserved. 3-2ID102813 Non-Confidential

The Optimization Process
3.1.1 About the optimization process
The optimization process involves identifying bottlenecks in applications, and using various techniques to remove them.
There are a number of steps in the optimization process:1. Take performance readings from your application.2. Analyze the readings to locate the bottleneck.3. Identify the types of optimization that are appropriate.4. Select and apply an optimization.5. Take performance readings to ensure the optimization works.
The steps are shown in Figure 3-1.
Figure 3-1 Optimization process steps
Note The optimization process is likely to reveal a series of different bottlenecks in different areas, so you might have to go through the process a number of times to remove them all. See Bottlenecks move between processors on page 3-9.
Take measurements
Locate bottleneck
Determine the relevant optimization
Apply the optimization
Verify the optimization works
Yes
Is application performance acceptable?
End
Start
No
Analyze measurements
ARM DUI 0555C Copyright © 2011, 2013 ARM. All rights reserved. 3-3ID102813 Non-Confidential

The Optimization Process
3.1.2 Take measurements
To optimize, you first take measurements from your application. These enable you to determine the problem areas. Follow these rules when you are taking measurements to ensure your measurements are accurate:
• Only take measurements from a hardware device with a Mali GPU. Only real hardware can provide accurate performance measurements.
• Ensure that you have VSYNC switched off when taking measurements. If it is enabled, results are likely to be inaccurate.
You can use DS-5 Streamline to take readings from the Mali GPU counters and record data about the application while it is running. You can also gather performance information with other tools.
For more information, see Chapter 4 Taking Measurements and Locating Bottlenecks.
3.1.3 Locate the bottleneck
To locate a bottleneck that reduces performance, you must analyze your measurements. You can use tools to help you perform the analysis:
DS-5 Streamline DS-5 Streamline displays counters values from the Mali GPU and application processors as graphs on a timeline. See Locating bottlenecks with DS-5 Streamline on page 4-6.
Other tools You can also take performance measurements with other tools. The display of the measurements depends on the tool you use. See Locating bottlenecks with other tools on page 4-13.
You can use the graphs and other data displays to locate a performance bottleneck. When you have located the bottleneck you can:• Take additional measurements to isolate the exact problem area.• Apply one or more optimizations.
For more information, see Chapter 4 Taking Measurements and Locating Bottlenecks.
3.1.4 Determine the optimization
The optimization to apply depends on the bottleneck. You might not find the exact cause of the bottleneck, but you can find out where it has the greatest impact. Typically, the application is bound in one of the following areas:• Application code.• Misuse of API.• Use of blocking API calls.• Vertex processing.• Triangle setup.• Fragment processing.• Memory bandwidth.
For more information, see List of optimizations on page 4-19.
ARM DUI 0555C Copyright © 2011, 2013 ARM. All rights reserved. 3-4ID102813 Non-Confidential

The Optimization Process
3.1.5 Apply the optimization
Applying the optimization might involve modifying application code and art assets. You can download tools to assist you with some parts of this process from Mali Developer Center, http://malideveloper.arm.com.
3.1.6 Verify the optimization
Optimization might not always work as expected. Verify the optimization by running the application again with the optimization applied.
It is possible for an optimization to have very little effect on application performance. This can mean the following:
• There are other bottlenecks in the application limiting performance.
• The measurements were misleading and the wrong optimization was applied. This can happen if the real bottleneck is difficult to measure.
If there is only a small difference to frame time, consider taking more measurements and analyzing them.
3.1.7 Repeat the optimization process
An optimization process can reveal a series of different bottlenecks. You might have to go through the process a number of times to remove all of them and get performance up to the required level.
You are likely to find new bottlenecks as you repeat the optimization process. As you optimize in one part of the system, new bottlenecks can appear in other areas. For more information, see Bottlenecks move between processors on page 3-9.
ARM DUI 0555C Copyright © 2011, 2013 ARM. All rights reserved. 3-5ID102813 Non-Confidential

The Optimization Process
3.2 General optimization adviceThis section contains general optimization advice. It contains the following sections:• Experiment with different approaches.• Use frame time instead of FPS for comparisons.• Set a computation budget and measure against it on page 3-7.• Bottlenecks move between processors on page 3-9.
3.2.1 Experiment with different approaches
Different GPU implementations have different resources and might use various versions of the Mali GPU drivers. These differences impact performance in different ways so it is important to experiment with different approaches to graphics programming and optimizations to achieve maximum performance.
Different applications can react to optimizations in very different ways. In one application a specific optimization might have a large impact on performance, whereas in another application it might have little or no impact.
If you are optimizing, do not assume all optimizations are always going to increase performance. A graphics pipeline consists of several components and different resources that can be the bottleneck. Optimizations that do not address the bottleneck have no effect until the current bottleneck has been resolved.
There are often trade-offs between optimizations, so experiment with different techniques to see what works best for your application.
3.2.2 Use frame time instead of FPS for comparisons
Frames per second (FPS) is a simple and basic measurement of performance, but frame time is a better measure of optimization effectiveness.
Frame time is a linear measure, but frames per second is non-linear. Linear measurements make calculations easier.
Figure 3-2 shows frames per second plotted against frame time. This graph shows the non-linear nature of FPS measurements.
Figure 3-2 Frame time and FPS
Frames per
second
Frame timein ms
10
20
30
40
50
60
70
80
90
100
10 20 30 40 50 60 70 80 90 100
ARM DUI 0555C Copyright © 2011, 2013 ARM. All rights reserved. 3-6ID102813 Non-Confidential
The Optimization Process
If you know the individual time changes corresponding to different optimizations, you can add the times together to get the total improvement.
If you are using FPS as a measurement, you cannot add them together because their non-linear nature. Any attempt to add them gives an incorrect total.
Table 3-1 shows a series of comparisons between different FPS measurements A and B.
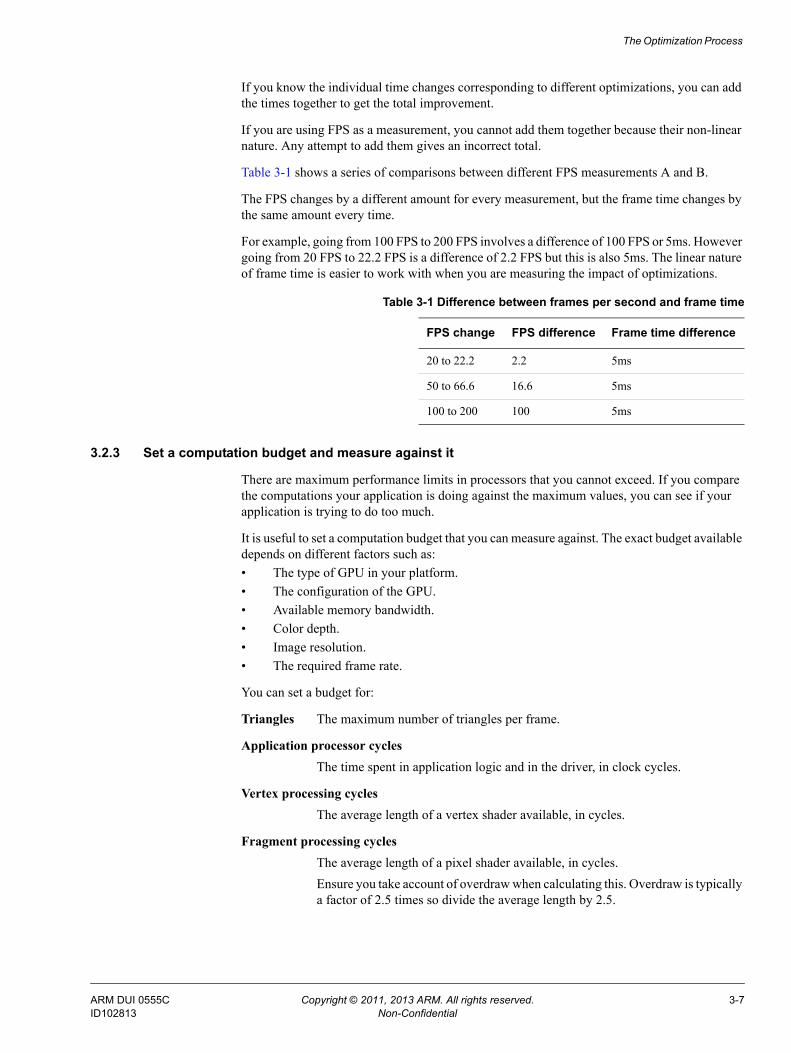
The FPS changes by a different amount for every measurement, but the frame time changes by the same amount every time.
For example, going from 100 FPS to 200 FPS involves a difference of 100 FPS or 5ms. However going from 20 FPS to 22.2 FPS is a difference of 2.2 FPS but this is also 5ms. The linear nature of frame time is easier to work with when you are measuring the impact of optimizations.
3.2.3 Set a computation budget and measure against it
There are maximum performance limits in processors that you cannot exceed. If you compare the computations your application is doing against the maximum values, you can see if your application is trying to do too much.
It is useful to set a computation budget that you can measure against. The exact budget available depends on different factors such as:• The type of GPU in your platform.• The configuration of the GPU.• Available memory bandwidth.• Color depth.• Image resolution.• The required frame rate.
You can set a budget for:
Triangles The maximum number of triangles per frame.
Application processor cycles The time spent in application logic and in the driver, in clock cycles.
Vertex processing cycles The average length of a vertex shader available, in cycles.
Fragment processing cycles The average length of a pixel shader available, in cycles.Ensure you take account of overdraw when calculating this. Overdraw is typically a factor of 2.5 times so divide the average length by 2.5.
Table 3-1 Difference between frames per second and frame time
FPS change FPS difference Frame time difference
20 to 22.2 2.2 5ms
50 to 66.6 16.6 5ms
100 to 200 100 5ms
ARM DUI 0555C Copyright © 2011, 2013 ARM. All rights reserved. 3-7ID102813 Non-Confidential

The Optimization Process
Memory bandwidth Memory bandwidth includes any data that is written to or read from memory. This includes:• The number of bytes per pixel of texture data.• Size of attribute data types.• Number of vertices.• Blitting.• Writes to or reads from the framebuffer.
Calculating a fragment shader budget
The calculation to work out the fragment shader budget is:
1. Multiply the number of Mali GPU shader cores or fragment processors by the Mali GPU clock speed. This gives the maximum theoretical number of cycles per second.Multiply this by 0.8 to give a more realistic number of available fragment processing cycles per second. This is result A.
2. Multiply the frame height by the frame width. This gives the number of pixels per frame.Multiply this by the required frame rate. This gives the number of pixels required per second.To take account of average overdraw, multiply this number by 2.5. This gives the number of fragments required per second. This is result B.
3. Divide the value of result A by the value of result B.The result produced is the average number of cycles a fragment shader can be.
You do not have to make all your fragment shaders this long. For example, you can use longer, more complex shaders on objects closer to the camera and shorter, less complex shaders on more distant objects.
You can use the shader compiler to determine the number of cycles a shader requires. See Measurements from other Mali GPU tools on page 4-13.
Note Do not assume the number of fragment processing cycles equals the number of fragment processing instructions. The processors in Mali GPUs can do many operations per cycle.
ARM DUI 0555C Copyright © 2011, 2013 ARM. All rights reserved. 3-8ID102813 Non-Confidential
The Optimization Process
3.2.4 Bottlenecks move between processors
This section describes how bottlenecks move between processing stages of the graphics pipeline and the profile of an ideal application. It contains the following sections:• How bottlenecks move between graphics pipeline processing stages.• Ideal application profile on page 3-10.
How bottlenecks move between graphics pipeline processing stages
The performance bottleneck in an application can move between the different processing stages as optimizations are applied. Readings from analysis tools can tell you where the bottleneck is likely to move to and if a processing stage is under-used.
Note In DS-5 Streamline bottlenecks are directly visible in the graph display. The bottleneck is the busiest graph.
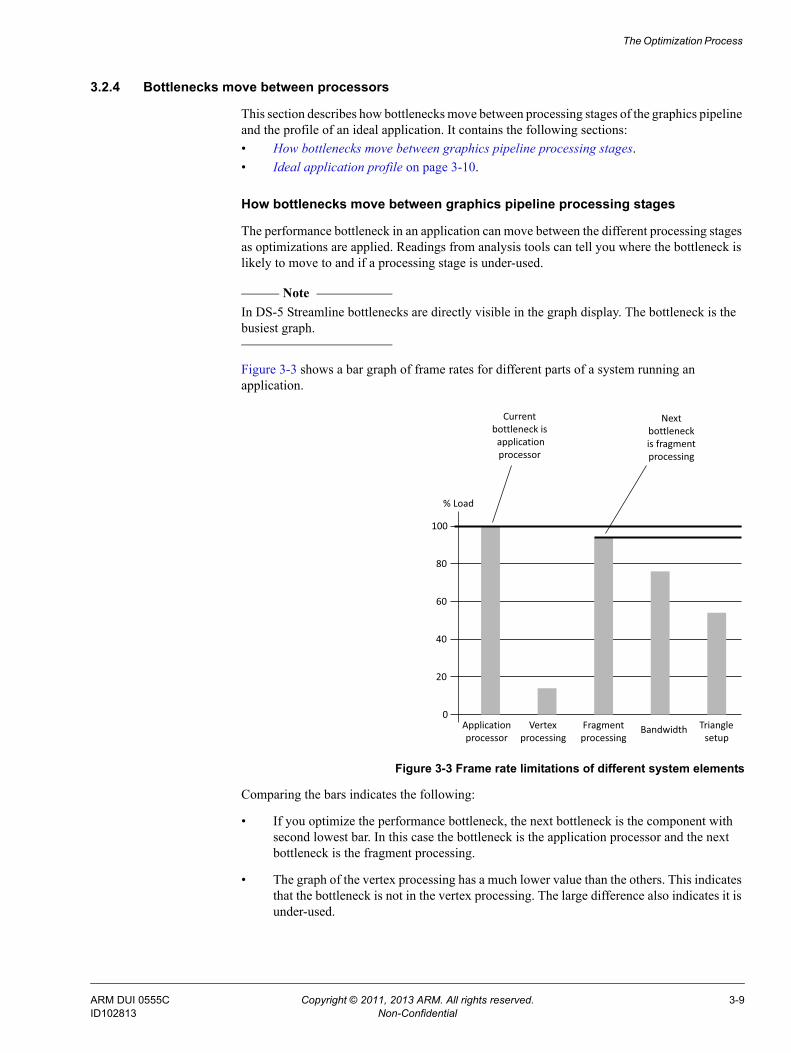
Figure 3-3 shows a bar graph of frame rates for different parts of a system running an application.
Figure 3-3 Frame rate limitations of different system elements
Comparing the bars indicates the following:
• If you optimize the performance bottleneck, the next bottleneck is the component with second lowest bar. In this case the bottleneck is the application processor and the next bottleneck is the fragment processing.
• The graph of the vertex processing has a much lower value than the others. This indicates that the bottleneck is not in the vertex processing. The large difference also indicates it is under-used.
0
20
40
60
80
100
Vertexprocessing
Fragmentprocessing
Bandwidth Trianglesetup
Currentbottleneck is application processor
Next bottleneckis fragment processing
% Load
Applicationprocessor
ARM DUI 0555C Copyright © 2011, 2013 ARM. All rights reserved. 3-9ID102813 Non-Confidential

The Optimization Process
If a processor has spare processing capacity, consider if there are any processing operations that you can move to it. For example, you might be able to move operations from the application processor or fragment processing stage to the vertex processing stage.
Ideal application profile
An ideal application is limited approximately equally by all components. A bar graph such as Figure 3-4 indicates the application is making good use of all components.
In this case a single optimization is not likely to make a large impact on performance and you require multiple optimizations to give a higher and more stable frame rate.
Figure 3-4 Ideal application equally limited
0
20
40
60
80
100
Vertexprocessing
Fragmentprocessing
Bandwidth Trianglesetup
Ideal applicationis limited nearly
equally by all system components
Applicationprocessor
% Load
ARM DUI 0555C Copyright © 2011, 2013 ARM. All rights reserved. 3-10ID102813 Non-Confidential

Chapter 4 Taking Measurements and Locating Bottlenecks
This chapter describes how to take measurements of your application and locate performance bottlenecks. It contains the following sections:• About taking measurements and locating bottlenecks on page 4-2.• Procedure for taking measurements and locating bottlenecks on page 4-3.• Taking measurements on page 4-4.• Analyzing graphs on page 4-5.• Locating bottlenecks with DS-5 Streamline on page 4-6.• Locating bottlenecks with other tools on page 4-13.• Isolating specific problem areas on page 4-17.• List of optimizations on page 4-19.
ARM DUI 0555C Copyright © 2011, 2013 ARM. All rights reserved. 4-1ID102813 Non-Confidential

Taking Measurements and Locating Bottlenecks
4.1 About taking measurements and locating bottlenecksThis chapter describes a procedure for taking measurements and locating bottlenecks.
The procedure described is mainly based on using DS-5 Streamline to take measurements. You can use the free community edition of DS-5 Streamline for this. To obtain the community edition, see The Mali Developer Center, http://malideveloper.arm.com.
You can also use other tools for taking and interpreting measurements. Techniques for doing these are also described. You can use alternative tools in place of DS-5 Streamline or as an additional source of information.
ARM DUI 0555C Copyright © 2011, 2013 ARM. All rights reserved. 4-2ID102813 Non-Confidential

Taking Measurements and Locating Bottlenecks
4.2 Procedure for taking measurements and locating bottlenecksTo take measurements and locate bottlenecks use the following procedure:
Take initial measurements and view as graphs Take initial measurements using an analysis tool. Measuring the most important counters first gives you an idea of where performance bottlenecks are likely to be. Measure the following counters first:• GPU Vertex activity.• GPU Fragment activity.• <Application processor> Instruction: Executed.
View the counter values as graphs Use your analysis tool to plot the counter values as graphs. DS-5 Streamline automatically plots the counter values as graphs on a timeline.
Determine problem areas by comparing graphs You can find out what part of the system is the most busy by comparing graphs for the different components.How you compare the graphs depends on the specific tool you are using. For more information see Analyzing graphs on page 4-5.
Drill down to find exact problems When you have isolated the busiest part of the system, you can take more measurements to isolate the exact problem area.
ARM DUI 0555C Copyright © 2011, 2013 ARM. All rights reserved. 4-3ID102813 Non-Confidential

Taking Measurements and Locating Bottlenecks
4.3 Taking measurementsTo find where a bottleneck is likely to be, measure the most important counters first. Analysis tools can capture data from the hardware counters in the GPU and display the results as graphs.
To ensure the measurements you take are accurate always do the following:
Take performance measurements from your device For accurate measurements, always take performance measurements from your device. Any method of simulation or approximation is likely to produce misleading measurements.For example, you might be able to use a desktop workstation for development but the relative strengths of this system are likely to be very different compared to a mobile device.
Ensure VSYNC is disabled Ensure VSYNC is disabled while you are taking measurements. Taking measurements with VSYNC enabled produces inaccurate results.
Note DS-5 Streamline does not directly measure frame rate, but you can measure it indirectly. See Analyzing graphs in DS-5 Streamline on page 4-9.
ARM DUI 0555C Copyright © 2011, 2013 ARM. All rights reserved. 4-4ID102813 Non-Confidential

Taking Measurements and Locating Bottlenecks
4.4 Analyzing graphsDS-5 Streamline and other tools can display counter data as graphs. This provides an easy, visual way to identify bottlenecks.
Consider the following general rules for analyzing graphs:
• Measure and plot the most important counters first. These give you an idea of where performance bottlenecks are likely to be located.
• A graph can indicate a problem by being too high, too low, or covering a large area. The exact diagnosis depends on the counters you are measuring and how the analysis tool displays the graphs.
• Graphs can be volatile. The relative performance of the different processors can change from one frame to another.
• Look for averages over longer time periods to find where to make general overall performance improvements.
• When you have identified the most intensively used processor, the next step is to identify the problem by taking more measurements.
• Look at performance on a frame by frame basis if you want to optimize specific scenes.
• You might not be able to completely isolate a problem by looking at graphs. If this is the case you can use other techniques to find the exact problem. See Locating bottlenecks with other tools on page 4-13.
ARM DUI 0555C Copyright © 2011, 2013 ARM. All rights reserved. 4-5ID102813 Non-Confidential

Taking Measurements and Locating Bottlenecks
4.5 Locating bottlenecks with DS-5 StreamlineThis section describes how to use DS-5 Streamline to analyze data and locate bottlenecks. It contains the following sections:• About DS-5 Streamline.• GPU counters in DS-5 Streamline on page 4-8.• Analyzing graphs in DS-5 Streamline on page 4-9.• DS-5 Streamline displaying high fragment processing usage on page 4-10.• Zoomed DS-5 Streamline display on page 4-11.• DS-5 Streamline displaying list of functions on page 4-12.
Note DS-5 Streamline requires Mali GPU drivers with performance measurement enabled. Activating performance measurement in the Mali GPU drivers has a negligible impact on the performance of correctly written applications.
4.5.1 About DS-5 Streamline
DS-5 Streamline is a tool that provides you with information about how well your application performs. You can use DS-5 Streamline to gather data from performance counters in the application processor and Mali GPU in real time. DS-5 Streamline displays the counter data as a series of graphs.
You can use DS-5 Streamline to:• Capture counter data from the application processor and the Mali GPU.• Save captured data for replay.• View a timeline that displays
— The GPU activity over time.— The GPU activity per process.— Changes in the framebuffer over time.
• Display the values of individual performance counters in graphs and tables.• Observe how the values change over time.• Assess the performance of each frame.• View graphs of processor activity.• View the stack trace.• View the application profile.
You can customise DS-5 Streamline to read and display data from different counters. You can compare these graphs against each other so you can determine the factors that are dominating performance and where performance bottlenecks are likely to be.
Figure 4-1 on page 4-7 shows DS-5 Streamline displaying graphs from a number of different counters.
ARM DUI 0555C Copyright © 2011, 2013 ARM. All rights reserved. 4-6ID102813 Non-Confidential

Taking Measurements and Locating Bottlenecks
Figure 4-1 DS-5 Streamline
ARM DUI 0555C Copyright © 2011, 2013 ARM. All rights reserved. 4-7ID102813 Non-Confidential

Taking Measurements and Locating Bottlenecks
4.5.2 GPU counters in DS-5 Streamline
DS-5 Streamline captures data from the hardware counters in the application processor and the Mali GPU. It displays these results as graphs.
Figure 4-2 shows the Counter Configuration window where you select counters to record and display in DS-5 Streamline.
Figure 4-2 DS-5 Streamline counters
You can also add virtual counters that show relationships between values. For example:• Cache hit to miss ratios.• Triggers that generate a value based on a defined criteria.
For more information, see the DS-5 Streamline documentation.
ARM DUI 0555C Copyright © 2011, 2013 ARM. All rights reserved. 4-8ID102813 Non-Confidential

Taking Measurements and Locating Bottlenecks
4.5.3 Analyzing graphs in DS-5 Streamline
You can view the following in DS-5 Streamline:• Graphs of activity of all the processors used by the application.• A stack trace displayed as a call graph.• Native application profiling.
You can make the following observations from graphs in DS-5 Streamline:• Short tasks generate small spikes of activity.• Intensive tasks generate high processor utilization for extended periods.• What processor is active at what time.
Note DS-5 Streamline does not directly measure frame rate. You can measure it directly in your application or you can measure it indirectly in DS-5 Streamline by:• Looking for API calls such as EGLswapbuffers.• looking for repeating patterns in the processor graphs.
To analyze graphs in DS-5 Streamline:
1. Look at the following graphs:• GPU Vertex activity.• GPU Fragment activity.• <Application processor> Instruction: Executed.
2. Analyze the graphs:• Look for the processor with the highest and longest graph. This processor is used
the most intensively.• If it is difficult to find a single processor that is taking too much time, the problem
might be bandwidth overuse or graphics pipeline stalls.• When you have identified the most intensively used processor, take more
measurements to isolate the problem. See Chapter 7 Utgard Optimization Workflows.
• If all graphs are busy your application is making good use of the Mali GPU.
Note For the most accurate measurements, Zoom in to EGLSwapBuffers() calls and use the calipers to isolate a frame.
ARM DUI 0555C Copyright © 2011, 2013 ARM. All rights reserved. 4-9ID102813 Non-Confidential

Taking Measurements and Locating Bottlenecks
4.5.4 DS-5 Streamline displaying high fragment processing usage
Figure 4-3 shows a number of graphs from a Mali-400 GPU displayed in DS-5 Streamline. You can see a spike of activity in the center of the window in the Mali GPU Fragment Processors and Drawcall Statistics graphs. The other graphs are mainly flat.
Figure 4-3 High fragment processing usage
ARM DUI 0555C Copyright © 2011, 2013 ARM. All rights reserved. 4-10ID102813 Non-Confidential

Taking Measurements and Locating Bottlenecks
4.5.5 Zoomed DS-5 Streamline display
Figure 4-4 shows a zoomed display in DS-5 Streamline. The spikes of activity are individual frames.
Figure 4-4 Zoomed display of high fragment processing usage
ARM DUI 0555C Copyright © 2011, 2013 ARM. All rights reserved. 4-11ID102813 Non-Confidential

Taking Measurements and Locating Bottlenecks
4.5.6 DS-5 Streamline displaying list of functions
Figure 4-5 shows a DS-5 Streamline displaying a list of functions and usage statistics.
Figure 4-5 DS-5 Streamline function list
ARM DUI 0555C Copyright © 2011, 2013 ARM. All rights reserved. 4-12ID102813 Non-Confidential
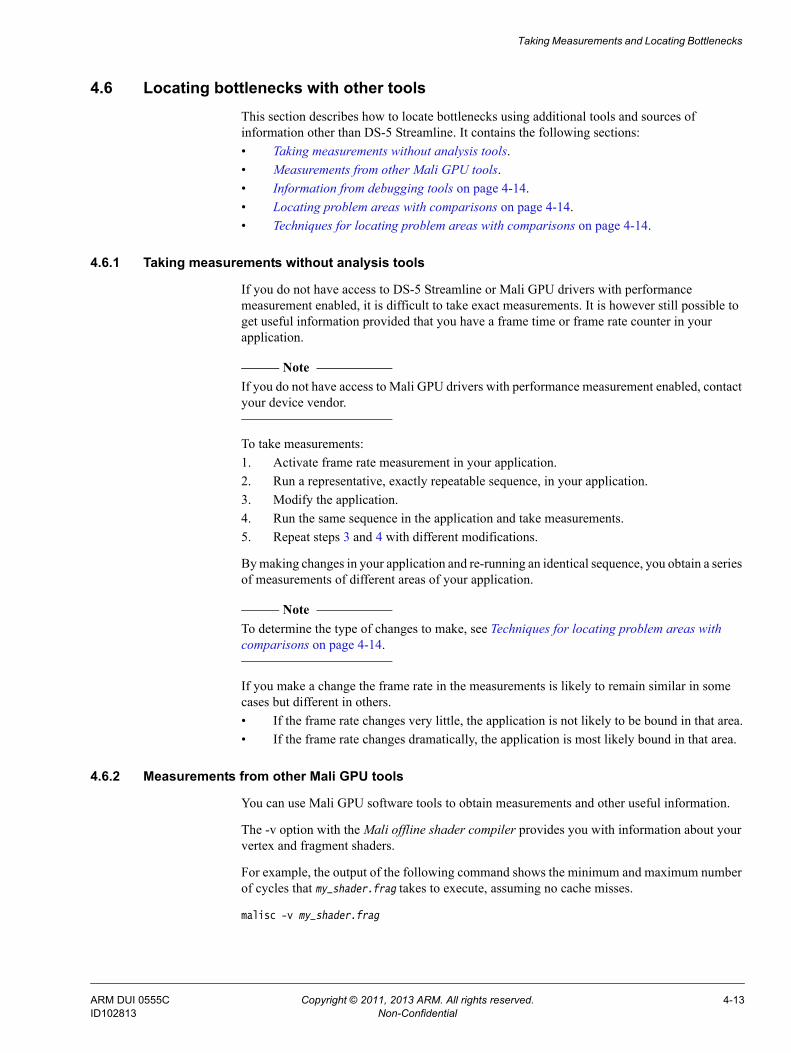
Taking Measurements and Locating Bottlenecks
4.6 Locating bottlenecks with other toolsThis section describes how to locate bottlenecks using additional tools and sources of information other than DS-5 Streamline. It contains the following sections:• Taking measurements without analysis tools.• Measurements from other Mali GPU tools.• Information from debugging tools on page 4-14.• Locating problem areas with comparisons on page 4-14.• Techniques for locating problem areas with comparisons on page 4-14.
4.6.1 Taking measurements without analysis tools
If you do not have access to DS-5 Streamline or Mali GPU drivers with performance measurement enabled, it is difficult to take exact measurements. It is however still possible to get useful information provided that you have a frame time or frame rate counter in your application.
Note If you do not have access to Mali GPU drivers with performance measurement enabled, contact your device vendor.
To take measurements:1. Activate frame rate measurement in your application.2. Run a representative, exactly repeatable sequence, in your application.3. Modify the application.4. Run the same sequence in the application and take measurements.5. Repeat steps 3 and 4 with different modifications.
By making changes in your application and re-running an identical sequence, you obtain a series of measurements of different areas of your application.
Note To determine the type of changes to make, see Techniques for locating problem areas with comparisons on page 4-14.
If you make a change the frame rate in the measurements is likely to remain similar in some cases but different in others.• If the frame rate changes very little, the application is not likely to be bound in that area.• If the frame rate changes dramatically, the application is most likely bound in that area.
4.6.2 Measurements from other Mali GPU tools
You can use Mali GPU software tools to obtain measurements and other useful information.
The -v option with the Mali offline shader compiler provides you with information about your vertex and fragment shaders.
For example, the output of the following command shows the minimum and maximum number of cycles that my_shader.frag takes to execute, assuming no cache misses.
malisc -v my_shader.frag
ARM DUI 0555C Copyright © 2011, 2013 ARM. All rights reserved. 4-13ID102813 Non-Confidential

Taking Measurements and Locating Bottlenecks
You can use these figures to work out the maximum number of vertices or fragments that can be shaded per second. This is useful when you are using a fragment shader budget. See Set a computation budget and measure against it on page 3-7.
The Mali offline shader compiler and other tools are available from the Mali Developer Center, http://malideveloper.arm.com.
4.6.3 Information from debugging tools
You can determine application processor utilization from profiling tools such as OProfile. Profiling tools can provide information about the behavior of your application and distinguish between application and driver usage. Distinguishing between these enables you to work out if the problem is in the application logic or in the use of the OpenGL ES API.
Static code analysis tools can identify if code is complex. Complex code is more likely to be slow and prone to errors.
4.6.4 Locating problem areas with comparisons
You can find exact problem areas by replacing code or assets types with versions that use no compute or memory bandwidth resources. A large performance difference indicates a problem area.
For example, the following procedure explains how to find a problem shader:1. A null shader is a shader that does nothing. Replace all shaders with null shaders and
measure the before and after performance difference. If there is no performance difference then the problem is not a shader. If there is a big difference then there is a problem related to the shader.
2. Divide the shaders into two halves, A and B, and test again.a. Test with the A half as null shaders and the B half as the original shaders.b. Test with the A half as the original shaders and the B half as null shaders.c. Compare the results.
3. Determine the half with the largest performance impact. Divide this half into two and repeat step 2. Continue this process until you have located the specific problem shader.
4. Optimize the shader and measure performance again with all the original shaders present. If there is still a problem there might be other problems shaders. Continue repeating the process until you have optimized all the problem shaders.
Note It is important to be systematic in this process. Investigate one type of code or asset at a time. If you try to investigate more than one type at a time your measurements are likely to be inaccurate.
4.6.5 Techniques for locating problem areas with comparisons
There are a number of areas you can investigate with the technique described in Locating problem areas with comparisons. The technique requires disabling code and assets. Alternatively you can try the following:
Change resolution Change the resolution of your application and measure the frame rate difference.If the frame rate scales with the inverse of the resolution, that is, the performance halves when you double the resolution, your application is fragment processing bound or bandwidth limited.
ARM DUI 0555C Copyright © 2011, 2013 ARM. All rights reserved. 4-14ID102813 Non-Confidential
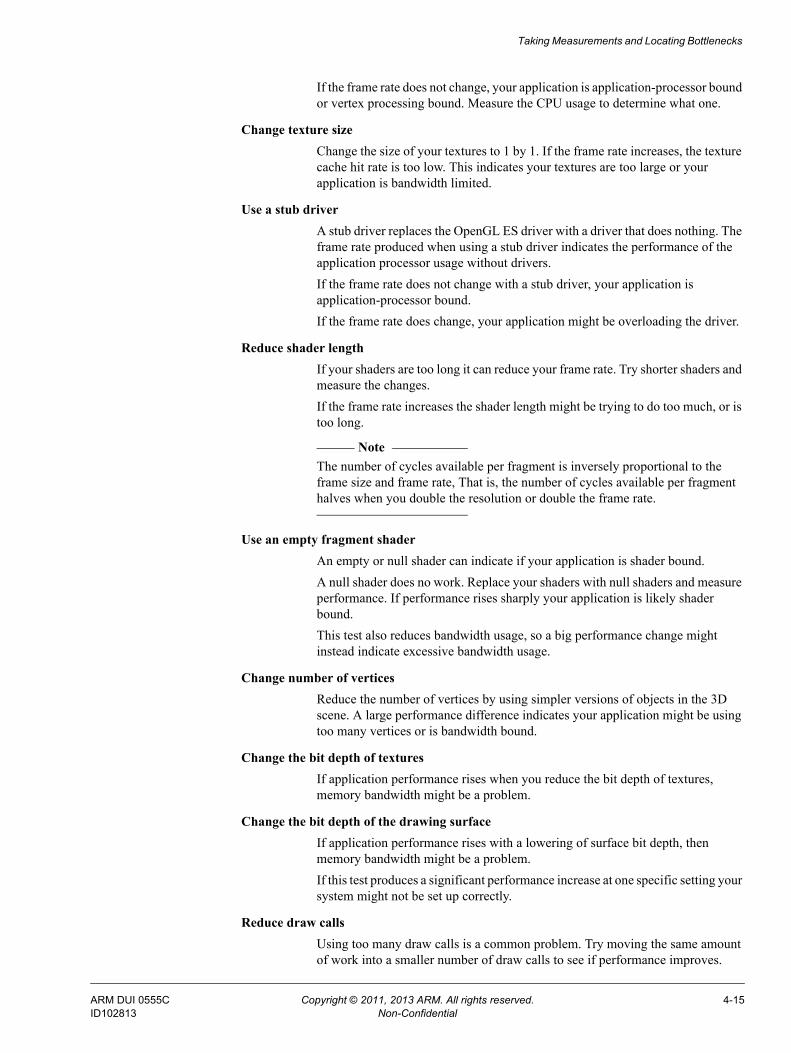
Taking Measurements and Locating Bottlenecks
If the frame rate does not change, your application is application-processor bound or vertex processing bound. Measure the CPU usage to determine what one.
Change texture size Change the size of your textures to 1 by 1. If the frame rate increases, the texture cache hit rate is too low. This indicates your textures are too large or your application is bandwidth limited.
Use a stub driver A stub driver replaces the OpenGL ES driver with a driver that does nothing. The frame rate produced when using a stub driver indicates the performance of the application processor usage without drivers.If the frame rate does not change with a stub driver, your application is application-processor bound.If the frame rate does change, your application might be overloading the driver.
Reduce shader length If your shaders are too long it can reduce your frame rate. Try shorter shaders and measure the changes.If the frame rate increases the shader length might be trying to do too much, or is too long.
Note The number of cycles available per fragment is inversely proportional to the
frame size and frame rate, That is, the number of cycles available per fragment halves when you double the resolution or double the frame rate.
Use an empty fragment shader An empty or null shader can indicate if your application is shader bound. A null shader does no work. Replace your shaders with null shaders and measure performance. If performance rises sharply your application is likely shader bound.This test also reduces bandwidth usage, so a big performance change might instead indicate excessive bandwidth usage.
Change number of vertices Reduce the number of vertices by using simpler versions of objects in the 3D scene. A large performance difference indicates your application might be using too many vertices or is bandwidth bound.
Change the bit depth of textures If application performance rises when you reduce the bit depth of textures, memory bandwidth might be a problem.
Change the bit depth of the drawing surface If application performance rises with a lowering of surface bit depth, then memory bandwidth might be a problem.If this test produces a significant performance increase at one specific setting your system might not be set up correctly.
Reduce draw calls Using too many draw calls is a common problem. Try moving the same amount of work into a smaller number of draw calls to see if performance improves.
ARM DUI 0555C Copyright © 2011, 2013 ARM. All rights reserved. 4-15ID102813 Non-Confidential

Taking Measurements and Locating Bottlenecks
Reduce state changes Try reducing the number of state changes to see if performance improves.
ARM DUI 0555C Copyright © 2011, 2013 ARM. All rights reserved. 4-16ID102813 Non-Confidential

Taking Measurements and Locating Bottlenecks
4.7 Isolating specific problem areasWhen you have located the general area where a bottleneck is, the next stage is to isolate the specific cause of the bottleneck. This section describes how to isolate problem areas. It contains the following sections:• Application is application-processor bound.• Application is vertex processing bound.• Application is fragment processing bound on page 4-18.• Determining if memory bandwidth is the problem on page 4-18.
4.7.1 Application is application-processor bound
The application can be application-processor bound in the following areas:The application logic uses too much processing power
To determine if your application is application-processor bound in the application logic, remove the draw calls and swapbuffers commands by either replacing them with comments or using a stub driver. If there is little or no change in performance, the limitation is probably in the application logic.Use a profiler to determine what areas of the application logic are performing badly and optimize this code.See Chapter 9 Application Processor Optimizations.
The application is overloading the driver If the low resolution output test indicates that the bottleneck is in the application processor but the application logic is not the problem, the application might be using the OpenGL ES API in an sub-optimal way, such as:• Too many draw calls.• Too many state changes.• Pipeline stalls.See Chapter 10 API Level Optimizations.
A combination of application logic and overloading the driver Sometimes the application is not bound in one area, but it is the combination of both that causes the application to be application-processor bound. If this is the case you must optimize both the application logic and the OpenGL ES API usage.
Note • You can use DS-5 or profilers such as OProfile to distinguish between application and
driver overhead.
• These are only approximate methods for determining if the application is application-processor bound and might not always be reliable. To determine the source of problems with more accuracy perform a full optimization process.
4.7.2 Application is vertex processing bound
If the application is vertex processing bound, the problem can be in one of these areas:• Too many vertices.• Vertex shader too long.• Vertex shader too complex.• High triangle setup time.• High Polygon List Builder Unit (PLBU) time.
See Utgard architecture vertex processing bound problems on page 7-2.
ARM DUI 0555C Copyright © 2011, 2013 ARM. All rights reserved. 4-17ID102813 Non-Confidential

Taking Measurements and Locating Bottlenecks
4.7.3 Application is fragment processing bound
If the application is fragment processing bound, the problem can be in one of these areas:
Fragment processing bound problems: The problem is in fragment processing. The problem is typically:• High overdraw.• Too many texture reads.• High texture cache miss rate.
Fragment shading bound problems: The problem is in the shaders. The problem is typically:• Shader too long.• Shader too complex.• Shader too long and too slow.• Shader has too many branches.
See Chapter 12 Fragment Processing Optimizations.
4.7.4 Determining if memory bandwidth is the problem
Memory bandwidth impacts everything and is difficult to measure directly. It is therefore difficult to diagnose if it is a bottleneck.
Bandwidth overuse can appear to be other limitations in processors. If one of the processors is limiting performance and optimizations do not appear to be having any effect, it might be bandwidth causing the problem.
If the application is bandwidth bound, the problem is most likely to be:• Textures.• Overdraw.
See Utgard architecture bandwidth bound problems on page 7-14, and see Chapter 13 Bandwidth Optimizations.
ARM DUI 0555C Copyright © 2011, 2013 ARM. All rights reserved. 4-18ID102813 Non-Confidential

Taking Measurements and Locating Bottlenecks
4.8 List of optimizationsThis section lists the optimizations described in this guide and indicates what parts of the system they apply to. It contains the following sections:• Application processing optimizations list.• API optimizations list.• Vertex processing optimizations list on page 4-20.• Fragment processing optimizations list on page 4-20.• Bandwidth optimizations list on page 4-21.• Miscellaneous optimizations list on page 4-22.
After you have determined the cause of a problem, you must apply an optimization to fix it. Use the lists in this section to determine what optimizations to use.
4.8.1 Application processing optimizations list
Table 4-1 shows the application processing optimizations listed in this guide.
4.8.2 API optimizations list
Table 4-2 shows the API optimizations listed in this guide.
Table 4-1 Application processing optimizations listed in this guide
Optimization
Use the correct tools with the correct settings on page 2-4
Remove debugging information on page 2-4
Ensure your application is not application-processor bound on page 2-8
Check system settings on page 2-11
Align data on page 9-2
Optimize loops on page 9-3
Use vector instructions on page 9-5
Use fast data structures on page 9-6
Consider alternative algorithms and data structures on page 9-7
Use multiprocessing on page 9-8
Use approximations on page 14-2
Table 4-2 API optimizations listed in this guide
Optimization
Check the display settings on page 2-3
Use direct rendering if possible on page 2-3
Avoid infinite command lists on page 2-5
Avoid calls that stall the graphics pipeline on page 2-5
Do not compile shaders every frame on page 2-6
ARM DUI 0555C Copyright © 2011, 2013 ARM. All rights reserved. 4-19ID102813 Non-Confidential

Taking Measurements and Locating Bottlenecks
4.8.3 Vertex processing optimizations list
Table 4-3 shows the vertex processing optimizations listed in this guide.
4.8.4 Fragment processing optimizations list
Table 4-4 shows the fragment processing optimizations listed in this guide.
Use VSYNC on page 2-6
Use Vertex Buffer Objects on page 2-8
Minimize draw calls on page 10-2
Minimize state changes on page 10-7
Ensure the graphics pipeline is kept running on page 10-8
Table 4-2 API optimizations listed in this guide (continued)
Optimization
Table 4-3 Vertex processing optimizations listed in this guide
Optimization
Use VSYNC on page 2-6
Use graphics assets that are appropriate for your platform on page 2-6
Reduce memory bandwidth usage on page 2-8
Use Vertex Buffer Objects on page 2-8
Check system settings on page 2-11
Optimize loops on page 9-3
Reduce the number of vertices on page 11-2
Use culling on page 11-3
Use normal maps to simulate fine geometry on page 11-5
Use level of detail on page 11-6
Avoid overdraw on page 12-2
Use approximations on page 14-2
Table 4-4 Fragment processing optimizations listed in this guide
Optimization
Use VSYNC on page 2-6
Use graphics assets that are appropriate for your platform on page 2-6
Do not use 24-bit textures on page 2-6
Use mipmapping on page 2-7
Use texture compression on page 2-7
ARM DUI 0555C Copyright © 2011, 2013 ARM. All rights reserved. 4-20ID102813 Non-Confidential
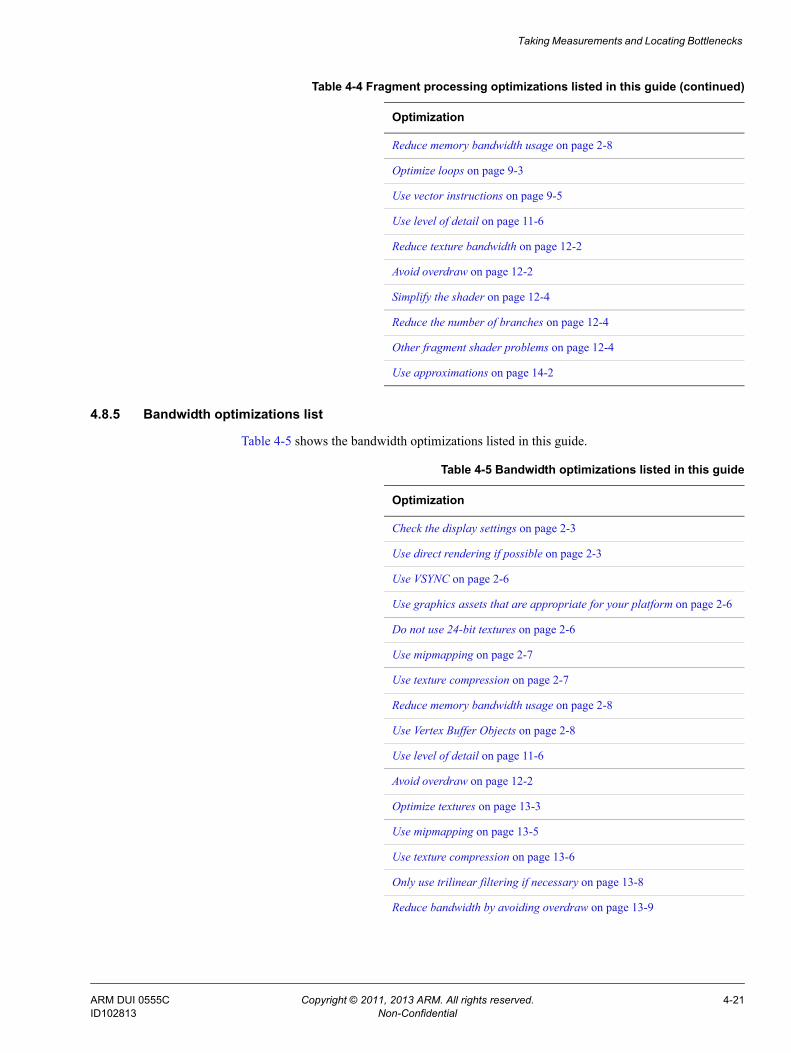
Taking Measurements and Locating Bottlenecks
4.8.5 Bandwidth optimizations list
Table 4-5 shows the bandwidth optimizations listed in this guide.
Reduce memory bandwidth usage on page 2-8
Optimize loops on page 9-3
Use vector instructions on page 9-5
Use level of detail on page 11-6
Reduce texture bandwidth on page 12-2
Avoid overdraw on page 12-2
Simplify the shader on page 12-4
Reduce the number of branches on page 12-4
Other fragment shader problems on page 12-4
Use approximations on page 14-2
Table 4-4 Fragment processing optimizations listed in this guide (continued)
Optimization
Table 4-5 Bandwidth optimizations listed in this guide
Optimization
Check the display settings on page 2-3
Use direct rendering if possible on page 2-3
Use VSYNC on page 2-6
Use graphics assets that are appropriate for your platform on page 2-6
Do not use 24-bit textures on page 2-6
Use mipmapping on page 2-7
Use texture compression on page 2-7
Reduce memory bandwidth usage on page 2-8
Use Vertex Buffer Objects on page 2-8
Use level of detail on page 11-6
Avoid overdraw on page 12-2
Optimize textures on page 13-3
Use mipmapping on page 13-5
Use texture compression on page 13-6
Only use trilinear filtering if necessary on page 13-8
Reduce bandwidth by avoiding overdraw on page 13-9
ARM DUI 0555C Copyright © 2011, 2013 ARM. All rights reserved. 4-21ID102813 Non-Confidential

Taking Measurements and Locating Bottlenecks
4.8.6 Miscellaneous optimizations list
You can sometimes optimize by moving computations to under-used resources. This is a useful optimization technique that makes the best use of your compute resources.
Table 4-6 shows the miscellaneous optimizations listed in this guide.
See Make use of under-used resources on page 14-11 and Bottlenecks move between processors on page 3-9.
Reduce drawing surfaces with culling on page 13-10
Reduce bandwidth by utilizing level of detail on page 13-11
Use approximations on page 14-2
Table 4-5 Bandwidth optimizations listed in this guide (continued)
Optimization
Table 4-6 Miscellaneous optimizations listed in this guide
Optimization
Check the display settings on page 2-3
Use direct rendering if possible on page 2-3
Use the correct tools with the correct settings on page 2-4
Remove debugging information on page 2-4
Check system settings on page 2-11
Use approximations on page 14-2
Check the display settings on page 14-5
Use VSYNC on page 14-8
Make use of under-used resources on page 14-11
ARM DUI 0555C Copyright © 2011, 2013 ARM. All rights reserved. 4-22ID102813 Non-Confidential
Chapter 5 Optimization Workflows
This chapter describes the optimization workflows and the initial optimization workflow. It contains the following sections:• About optimization workflows on page 5-2.• The initial optimization workflow on page 5-5.
ARM DUI 0555C Copyright © 2011, 2013 ARM. All rights reserved. 5-1ID102813 Non-Confidential

Optimization Workflows
5.1 About optimization workflowsThis section describes the optimization workflow procedure. It contains the following sections:• The optimization workflow procedure.• Measuring the application.• Take measurements on real hardware on page 5-3.• Taking measurements with DS-5 Streamline on page 5-3.• Determining the problem area on page 5-4.
The optimization workflows contain examples of how to find and resolve a number of common performance problems. They guide you through the process of diagnosing problems and selecting the optimizations to resolve them.
The optimization workflows are split across the following:• The initial optimization workflow on page 5-5.• Chapter 6 Application-Processor Optimization Workflow.• Chapter 7 Utgard Optimization Workflows.• Chapter 8 Midgard Optimization Workflows.
The Utgard and Midgard architecture Mali GPUs have a chapter each. This is because of the differences between the architectures and the different performance counters in the GPUs.
Note The optimization workflow chapters do not describe how to find and solve all performance problems, however you can use a similar process to find other problems.
5.1.1 The optimization workflow procedure
The following steps are based on the process described in Chapter 3 The Optimization Process:
1. Start at The initial optimization workflow on page 5-5.
2. Take some basic measurements. See Measuring the application.
3. Compare these to determine what area requires additional investigation. See Determining the problem area on page 5-4.
4. Go to the relevant chapter and section and follow the procedure described. There is a flowchart that shows the worflow in each section.
5. Each section describes a number of measurements you can use to diagnose problems and suggests methods to resolve them. There are also links to more information.
6. When you have completed this process, measure the application to ensure the optimization has worked. If the performance is not high enough, go through the process again. To fully optimize an application, you might have to go through the process a number of times.
5.1.2 Measuring the application
This section describes how to make the first performance measurements of your application and how to determine the area to take additional measurements in. It contains the following sections:• Take measurements on real hardware on page 5-3.• Taking measurements with DS-5 Streamline on page 5-3.• Determining the problem area on page 5-4.
ARM DUI 0555C Copyright © 2011, 2013 ARM. All rights reserved. 5-2ID102813 Non-Confidential

Optimization Workflows
5.1.3 Take measurements on real hardware
You must use a hardware device with a Mali GPU. Only real hardware can provide accurate performance measurements.
The following sections describe how to measure real hardware with DS-5 Streamline.
You can download DS-5 Streamline from the Mali Developer Center, http://malideveloper.arm.com.
If you do not have DS-5 Streamline you can still locate performance problems by other methods. See Locating bottlenecks with other tools on page 4-13.
5.1.4 Taking measurements with DS-5 Streamline
If you are using DS-5 Streamline you require:• A hardware device with a Mali GPU.• Mali GPU drivers with performance measurement enabled.
To measure performance with DS-5 Streamline, do the following:1. Attach your device to your workstation and take the initial measurements.2. Look at the following graphs:
• GPU Vertex activity.• GPU Fragment activity.• <Application processor> Instruction: Executed.
3. Compare these graphs to each other. Look for the processor that is the most active and takes the most time.
Figure 5-1 on page 5-4 shows DS-5 Streamline with a number of graphs graphics plotted for the application processor, vertex processing and fragment processing.
ARM DUI 0555C Copyright © 2011, 2013 ARM. All rights reserved. 5-3ID102813 Non-Confidential

Optimization Workflows
Figure 5-1 DS-5 Streamline
5.1.5 Determining the problem area
To determine the problem area you must find out what part of the system is slowest or taking the most time. The way you do this depends on the measurement tool you are using:
• DS-5 Streamline displays graphs that show the activity of the different processors. You can compare the different graphs and see the most active processor directly.If something is running slowly it uses more processor time. If you can identify the most active processor, this is most likely where the problem area is.
• If the DS-5 Streamline display does not show any specific processor as being busy but does show gaps in the charts for the different processors, the problem might be stalls because of API usage. This is an application processor problem.
• If the problem does not appear to one of these your application might be bandwidth bound. The application might also be bandwidth bound if you can identify a problem area but optimization has no impact. See Utgard architecture bandwidth bound problems on page 7-14 or Midgard architecture bandwidth bound problems on page 8-12.
ARM DUI 0555C Copyright © 2011, 2013 ARM. All rights reserved. 5-4ID102813 Non-Confidential

Optimization Workflows
5.2 The initial optimization workflowThis section provides a series of flow charts that guide you through the process of diagnosing performance problems and applying the relevant optimizations to fix them. Figure 5-2 shows the overall flowchart. The colored boxes show one of the paths that you can take through the flowchart.
Figure 5-2 Workflow overview
Application bound
Triangle bound
Vertex shader bound
Texture or overdraw
bound
Fragment shader bound
APIbound
Application processor
bound
Fragment processing
bound
Bandwidth bound
Vertex processing
bound
Measure:Vertices processed,
Vertex shader
Measure:
Frame rate,Application processor instructions executed,GPU Vertex activity,
GPU Fragment activity
High vertexprocessing
time
High CPU time
OtherHigh fragmentprocessing
time
Vertex processing bandwidth
bound
Fragment processing bandwidth
bound
Measure:Application time,
Driver time
Measure:Overdraw,
Texture bandwidth
Measure:Bandwidth usage of vertex and fragment processing
Start
ARM DUI 0555C Copyright © 2011, 2013 ARM. All rights reserved. 5-5ID102813 Non-Confidential

Optimization Workflows
5.2.1 Take initial measurements
Figure 5-3 shows the top level workflow.
Figure 5-3 Top level workflow
• Attach your device to your workstation and take the initial measurements.
• Look at the following graphs:— GPU Vertex activity.— GPU Fragment activity.— <Application processor> Instruction: Executed.
• Compare these graphs to each other. Look for the processor that is the most active and takes the most time.
5.2.2 Determine the problem area
When you have identified the problem area, go to the relevant section in this chapter to isolate the cause of the problem:
• For application-processor bound problems, see Chapter 6 Application-Processor Optimization Workflow.
• For vertex processing, fragment processing and bandwidth bound problems on the Utgard architecture Mali GPUs, see Chapter 7 Utgard Optimization Workflows.
• For vertex processing, fragment processing and bandwidth bound problems on the Midgard architecture Mali GPUs, see Chapter 8 Midgard Optimization Workflows.
• Bandwidth overuse is a difficult problem to determine directly because it often appears as problems with the other processors. When an application is bandwidth bound all the processors in the system are affected negatively. See the relevant section for your Mali GPU:— Utgard architecture bandwidth bound problems on page 7-14— Midgard architecture bandwidth bound problems on page 8-12.
Measure and compare:
Application processor instructions executedGPU Vertex activityGPU Fragment activity
Highvertex
processingtime
High application processor
time
Other
High fragment
processingtime
Application processor bound
Vertex processing
bound
Fragment processing
bound
Bandwidth bound
Start
ARM DUI 0555C Copyright © 2011, 2013 ARM. All rights reserved. 5-6ID102813 Non-Confidential
Chapter 6 Application-Processor Optimization Workflow
This section describes how to diagnose the most common application-processor bound problems. It contains the following sections:• About application-processor bound problems on page 6-2.• Check if the problem is application bound or API bound on page 6-4.• Application bound on page 6-5.• API bound on page 6-6.• Check for too many draw calls on page 6-7.• Check usage of VBOs on page 6-8.• Check for pipeline stalls on page 6-9.• Check for too many state changes on page 6-10.• Other application-processor bound problems on page 6-11.
ARM DUI 0555C Copyright © 2011, 2013 ARM. All rights reserved. 6-1ID102813 Non-Confidential

Application-Processor Optimization Workflow
6.1 About application-processor bound problemsApplications can be application-processor bound if they do a lot of processing in software on the application processor. This is especially true if the application originated on a desktop platform and you are moving it to a mobile platform. If an application is application-processor bound, making graphics optimizations has no impact on performance.
The application processor can be application bound or API bound:
• If the application is not optimized, the rest of the system is idle while it waits for the application to produce data.
• The application can be API bound if it does not use the OpenGL ES API in an optimal manner. This can cause the graphics processors in the system to stall or make the driver too busy.
DS-5 Streamline enables you to see:• What API calls are made.• How many times API functions are called.• The time spent in API functions.
Figure 6-1 on page 6-3 shows the flow of this section.
ARM DUI 0555C Copyright © 2011, 2013 ARM. All rights reserved. 6-2ID102813 Non-Confidential

Application-Processor Optimization Workflow
Figure 6-1 High application processor time workflow
Application bound
Measure: Pipeline stalls
Measure:Application time
Driver time
Measure: Draw calls
Measure: Use of VBOs
Use pipeline
stall fixes
Reduce draw calls
Use VBOs
Apply application
optimizations
Application processor bound
Is application time high? Yes
No
Is value high? Yes
No
Is value high? Yes
No
Measure: State changes
Reduce state
changesIs value high? Yes
Is value high? No
Yes
ARM DUI 0555C Copyright © 2011, 2013 ARM. All rights reserved. 6-3ID102813 Non-Confidential

Application-Processor Optimization Workflow
6.2 Check if the problem is application bound or API boundMeasure the time spent in the application, the time spent in the driver, and compare them.
Look at the timeline with the API calls:
• If your application spends a lot of time busy in application code without making many API calls, then the problem is most likely in the application itself. See Application bound on page 6-5.
• If your application makes a lot OpenGL ES API calls, then the application might be making too many. See API bound on page 6-6.
• If your application is not busy in application code and makes relatively few OpenGL ES API calls, then the application might not be using the OpenGL ES API in an optimal way. See API bound on page 6-6.
• If there are gaps in the charts for the different processors, but no specific processor is busy, the problem might be stalls because of API usage. See API bound on page 6-6.
ARM DUI 0555C Copyright © 2011, 2013 ARM. All rights reserved. 6-4ID102813 Non-Confidential

Application-Processor Optimization Workflow
6.3 Application boundIf the application time is too high, the performance is limited because the application does not produce commands fast enough.
There are many application optimization techniques to improve the performance of your application. For example:• Use of approximations.• Code optimizations.• Fast data structures.• Alternative algorithms.• Vectorization.
For more information, see Chapter 9 Application Processor Optimizations.
ARM DUI 0555C Copyright © 2011, 2013 ARM. All rights reserved. 6-5ID102813 Non-Confidential

Application-Processor Optimization Workflow
6.4 API boundIf the driver time is too high, the performance is limited because the driver cannot produce enough commands. There are a number of reasons the driver can become overloaded. Typically it is because the OpenGL ES APIs are not used optimally or your application is making too many OpenGL ES API calls.
There are many correct ways to use the OpenGL ES APIs but some produce better results than others. The following sections describe issues to look for.
ARM DUI 0555C Copyright © 2011, 2013 ARM. All rights reserved. 6-6ID102813 Non-Confidential

Application-Processor Optimization Workflow
6.5 Check for too many draw callsIf your application makes too many draw calls the performance is limited. Draw calls have a relatively high overhead. Making too many draw calls can overload the driver and the application processor cannot produce enough commands for the GPU.
The number of draw calls per frame that impact performance depends on the application processor in your device.
Typically, thousands of draw calls per frame cause a significant performance decrease. Keep the number in the range of low hundreds of draw calls per frame or lower to keep performance high.
To minimize the overhead, batch elements from different draw calls together into a single draw call. See Minimize draw calls on page 10-2.
Note On Utgard architecture Mali GPUs you can measure draw calls with the following counters:• glDrawElements Statistics: Calls to glDrawElements
• glDrawArrays Statistics: Calls to glDrawArrays
ARM DUI 0555C Copyright © 2011, 2013 ARM. All rights reserved. 6-7ID102813 Non-Confidential
Application-Processor Optimization Workflow
6.6 Check usage of VBOsIf you do not use VBOs, data must be transferred every frame and this limits the performance of your application. VBOs reduce this overhead and can substantially increase the performance of applications.
Note On Utgard architecture Mali GPUs you can measure the usage of VBOs with the following counter:
BufferProfiling: VBO Upload Time (ms).
If the graph peaks after a number of frames then drops to zero or a low number for one or more frames, you are probably using VBOs correctly.
If the graph is constantly low or zero, you are probably not using VBOs enough or not using them at all.
See Use Vertex Buffer Objects on page 2-8.
ARM DUI 0555C Copyright © 2011, 2013 ARM. All rights reserved. 6-8ID102813 Non-Confidential

Application-Processor Optimization Workflow
6.7 Check for pipeline stallsCheck that the application processor and the GPU processors are all active at the same time. If they are not, the pipeline might be stalling.
Typically data flows through a pipeline and multiple data elements are processed simultaneously. Pipeline stalls occur when processing must be fully complete in one stage of the pipeline before moving to another. If the pipeline is stalling there is no simultaneous activity by the processors and performance is limited by the slowest operation.
To prevent pipeline stalls, avoid the following OpenGL ES calls:• glReadPixels()
• glCopyTexImage()
• glTexSubImage()
See Ensure the graphics pipeline is kept running on page 10-8.
ARM DUI 0555C Copyright © 2011, 2013 ARM. All rights reserved. 6-9ID102813 Non-Confidential

Application-Processor Optimization Workflow
6.8 Check for too many state changesState changes have a relatively high overhead. Making too many of them can overload the driver.
Every state change requires data to be transferred and has a processing overhead. If your application makes a large number of state changes, this can overload the driver limiting performance.
To minimize the overhead it is better to make as few state changes as possible. Where possible, batch state changes together to reduce their number.
Note On Utgard architecture Mali GPUs you can measure state changes by looking at the timeline for the following OpenGL ES API calls:• glEnable()
• glDisable()
See Minimize state changes on page 10-7.
ARM DUI 0555C Copyright © 2011, 2013 ARM. All rights reserved. 6-10ID102813 Non-Confidential

Application-Processor Optimization Workflow
6.9 Other application-processor bound problemsIf the application is application-processor bound but the problem is not one of those listed in this section, look at other optimizations. See Chapter 9 Application Processor Optimizations.
Another possibility is the problem is caused by memory bandwidth overuse. See Chapter 13 Bandwidth Optimizations.
ARM DUI 0555C Copyright © 2011, 2013 ARM. All rights reserved. 6-11ID102813 Non-Confidential

Chapter 7 Utgard Optimization Workflows
This chapter contains examples of how to find and resolve a number of common performance problems for Utgard architecture Mali GPUs. It guides you through the process of diagnosing problems and selecting the optimizations to resolve them.
This chapter contains the following sections:• Utgard architecture vertex processing bound problems on page 7-2.• Utgard architecture fragment-processing bound problems on page 7-6.• Utgard architecture bandwidth bound problems on page 7-14.
Note This chapter does not apply to the Midgard architecture Mali GPUs. See Chapter 8 Midgard Optimization Workflows.
ARM DUI 0555C Copyright © 2011, 2013 ARM. All rights reserved. 7-1ID102813 Non-Confidential

Utgard Optimization Workflows
7.1 Utgard architecture vertex processing bound problemsThis section describes how to diagnose the most common vertex processing bound problems. It contains the following sections:• Check vertex shader time on page 7-3.• Check for too many vertices on page 7-4.• Check for high PLBU time on page 7-4.• Check for culled primitives on page 7-5.• Check utilization of VBOs on page 7-5.• Other vertex processing bound problems on page 7-5.
Figure 7-1 on page 7-3 shows the workflow of this section.
Note It is unusual for the vertex processing to be the bottleneck in real applications.
ARM DUI 0555C Copyright © 2011, 2013 ARM. All rights reserved. 7-2ID102813 Non-Confidential

Utgard Optimization Workflows
Figure 7-1 High vertex processing time workflow
7.1.1 Check vertex shader time
Measure the vertex processor counter Mali GPU Vertex Processor: Active cycles, vertex shader.
If the graph is consistently high the application is vertex shader bound. There are a number of reasons why this might be the case. To determine the reason measure the following vertex processor counters:• Mali GPU Vertex Processor: Active cycles
• Mali GPU Vertex Processor: Active cycles, vertex shader
• Mali GPU Vertex Processor: Vertex loader cache misses
Measure: Vertex shader time
Measure:PLBU time
Measure: Vertices processed
Measure: Primitives fetched Primitives culled
Reduce triangles
Use culling
Measure: Use of VBOs
Use VBOs
Vertex processor bound
No
No
Is primitives culled low? Yes
No
Is value high? No
Is value high? Yes
No
Is value high?
Is value high? Yes
Yes
High shader time
ARM DUI 0555C Copyright © 2011, 2013 ARM. All rights reserved. 7-3ID102813 Non-Confidential

Utgard Optimization Workflows
You can use these counters to find the following problems with your shader:
Is the shader is too long? The vertex shader is too long if the following are true:• The value of Active cycles vertex shader is low compared to the value of
Active cycles.• The value of Vertex loader Cache misses is high.If the vertex shader is too long try shortening it.
Is the shader is too complex? The shader is too complex if the following are true:• The value of Active cycles vertex shader is close to the value of Active
cycles.• The value of Vertex loader Cache misses is low.If the vertex shader is too complex try:• Simplify the shader.• Apply arithmetic optimizations.• Consider if the shader can be partially or completely moved to the fragment
processor or application processor.
Is the shader is too long and too complex? If measurements indicate a shader it is too long but optimizing has relatively little impact, then the shaders might be both too long and too complex. In this case you must optimize for both.
Does the shader have too many branches? The cost of branches in Mali GPUs is relatively low but too many branches can make the shader too big or too complex.
7.1.2 Check for too many vertices
Measure the vertex processor counter Mali GPU Vertex Processor: Vertices processed
If the graph is consistently high, your application might be using too many triangles, see• Check for high PLBU time.• Chapter 11 Vertex Processing Optimizations.
7.1.3 Check for high PLBU time
Check for the Polygon List Builder Unit (PLBU) time by measuring the vertex processor counter Mali GPU Vertex Processor: Active cycles, PLBU geometry processing.
If the graph is consistently high, your application might be using too many triangles.
If your application is triangle bound, it has too many primitives, vertices, or triangles. To fix this try reducing the number of triangles.
To reduce the number of triangles, you can:• Use fewer objects.• Use simpler objects.• De-tessellate objects.• Cull triangles.
ARM DUI 0555C Copyright © 2011, 2013 ARM. All rights reserved. 7-4ID102813 Non-Confidential
Utgard Optimization Workflows
There are other techniques you can use to reduce the number of triangles. See Check for culled primitives and see Chapter 11 Vertex Processing Optimizations.
Note A high PLBU time might indicate you do not have culling enabled. If this is the case the vertex processor has to process all triangles every frame. In this case there might not be too many triangles but too many are being processed. See Use culling on page 11-3.
7.1.4 Check for culled primitives
You can reduce the number of triangles in a scene by culling triangles that are invisible in the final image.
Measure the vertex processor counter Mali GPU Vertex Processor: Primitives culled.
If the graph of Primitives culled is low your application might use insufficient culling. Ensure backface culling and depth testing are both active.
If the graph of Primitives culled is high there might be a number of causes:
• Your application might be using too many triangles.
• The application might not be using view frustum culling.
• The application might be making the Mali GPU do too much culling. Cull large objects at a coarse level in the application before sending them to the Mali GPU.
For more information see Use culling on page 11-3.
7.1.5 Check utilization of VBOs
Measure the software counter BufferProfiling: VBO Upload Time (ms).
If the graph peaks after a number of frames then drops to zero or a relatively low number for one or more frames, you are using VBOs correctly.
If the value is constantly low or zero, you are probably not using VBOs enough or not using them at all.
If you do not use VBOs data must be transferred every frame and this limits the performance of your application. VBOs reduce this overhead and can substantially increase the performance of applications.
See Use Vertex Buffer Objects on page 2-8.
7.1.6 Other vertex processing bound problems
If the application is vertex processing bound but the problem is not one of those listed in this section, then look at other optimizations.
See Chapter 11 Vertex Processing Optimizations and Chapter 14 Miscellaneous Optimizations.
ARM DUI 0555C Copyright © 2011, 2013 ARM. All rights reserved. 7-5ID102813 Non-Confidential

Utgard Optimization Workflows
7.2 Utgard architecture fragment-processing bound problemsThis section describes how to diagnose and resolve fragment-processing bound problems. The fragment processing can be bound by the data consumed by the fragment processing or by fragment shader programs. It contains the following sub-sections:• Check for fragment-processing bound problems on page 7-7.• Check for fragment shader bound problems on page 7-10.
ARM DUI 0555C Copyright © 2011, 2013 ARM. All rights reserved. 7-6ID102813 Non-Confidential

Utgard Optimization Workflows
7.2.1 Check for fragment-processing bound problems
This section guides you through a series of measurements to diagnose fragment processing bound problems. It contains the following sections:• Check texture bandwidth on page 7-8.• Check for oversized textures on page 7-8.• Check compressed texture reads on page 7-8.• Check for overdraw on page 7-9.• Other fragment processing bound problems on page 7-9.
Figure 7-2 shows the workflow of this section.
Figure 7-2 High fragment processing time workflow
Use compressed
textures
High fragment processor time
Is value high?
Is value high?
Textures too big
Reduce texture sizeReduce texture bit depth
Use mipmapping
High shader time
Yes
Measure: Overdraw
Measure: Texture bandwidth
Measure: Compressed texture reads
Measure: Texture cache hit to
miss ratio
No
Reduce overdraw
Is value high?
Is value high?
Yes
No
No
Yes
Yes
ARM DUI 0555C Copyright © 2011, 2013 ARM. All rights reserved. 7-7ID102813 Non-Confidential

Utgard Optimization Workflows
Check texture bandwidth
Measure the following counters.• Fragment Processor: Total bus reads
• Fragment Processor: Texture descriptors reads
If the graphs of Total bus reads and Texture descriptors reads are both low your application is fragment shader bound. See Check for fragment shader bound problems on page 7-10.
If the graphs of Total bus reads and Texture descriptors reads are both high your application is texture bound. See Check for oversized textures.
Check for oversized textures
Measure the following counters:• Mali GPU Fragment Processor X: Texture cache hit count.• Mali GPU Fragment Processor X: Texture cache miss count.
The texture cache miss rate is typically 10% of the texture cache hit rate. If it is much higher than this there might be a number of problems:• Textures are too big.• The Texture bit depth is too high.• The application does not use MIP mapping.
If any of these are true then your application is likely to have a problem with memory bandwidth.
See Chapter 12 Fragment Processing Optimizations, and Chapter 13 Bandwidth Optimizations.
Check compressed texture reads
Measure the following counters:• Mali GPU Fragment Processor X: Texture cache hit count
• Mali GPU Fragment Processor X: Compressed texture cache hit count
Analyze and compare the values of the counters:
• If the graph of Compressed texture cache hit count is zero, your application is not using compressed textures.
• Subtract the value of Compressed texture cache hit count from the value of Texture cache hit count. This gives you the uncompressed texture cache hit count. If this value is significantly lower than the value of Compressed texture cache hit count you are not using many compressed textures. Consider compressing more of your textures.
• If the graph of Compressed texture cache hit count is significantly higher than Texture cache uncompressed reads your application is using compressed textures but:— The textures might be too big.— The application does not use MIP mapping.— There might be too many textures.
Textures use a large amount of memory bandwidth. If too much bandwidth is used the shader cannot get sufficient data and stalls. Compressed textures reduce memory bandwidth usage. This can increase performance and reduce power consumption. See Use texture compression on page 13-6.
ARM DUI 0555C Copyright © 2011, 2013 ARM. All rights reserved. 7-8ID102813 Non-Confidential

Utgard Optimization Workflows
Check for overdraw
Measure the counter Mali GPU Fragment Processor X: Fragment passed z/stensil count.
Divide the result by the number of pixels in a frame. This gives you the overdraw factor.
An overdraw factor of 1 indicates there is no overdraw but this is rare. Overdraw is typically around 2.5 but can vary depending on the application. If your content is mostly non-transparent and the overdraw factor is greater than 2.5 performance is likely to be impacted. Consider reducing the overdraw factor by using techniques such as:• Enable depth testing.• Enable back face culling to avoid rendering invisible faces.
Drawing order is important for reducing overdraw:1. Sort scene objects by depth.2. Draw non-transparent objects in front to back order.3. Draw transparent objects in back to front order.
See Avoid overdraw on page 12-2 and Use culling on page 11-3.
Note It is normal for scenes with transparent content to have high overdraw.
Other fragment processing bound problems
If the application is fragment processing bound but the problem is not one of those listed in this section, then look at other optimizations. See Chapter 12 Fragment Processing Optimizations and Chapter 14 Miscellaneous Optimizations.
Another possibility is that the application is bandwidth bound. See Utgard architecture bandwidth bound problems on page 7-14.
ARM DUI 0555C Copyright © 2011, 2013 ARM. All rights reserved. 7-9ID102813 Non-Confidential
Utgard Optimization Workflows
7.2.2 Check for fragment shader bound problems
High fragment shader time can be caused by a number of problems. This section describes these problems. It contains the following sections:• Confirm the problem is in the fragment shader on page 7-11.• Check if the shader is too long on page 7-12.• Check if the shader is too complex on page 7-12.• Check if the shader is too long and too complex on page 7-12.• Check for too many branches on page 7-13.• Other fragment shader problems on page 7-13.
Figure 7-3 on page 7-11 shows the workflow of this section.
ARM DUI 0555C Copyright © 2011, 2013 ARM. All rights reserved. 7-10ID102813 Non-Confidential

Utgard Optimization Workflows
Figure 7-3 High fragment shader time workflow
Confirm the problem is in the fragment shader
Measure the following fragment processor hardware counters:• Mali GPU Fragment Processor X: Fragment passed z/stensil count.• Mali GPU Fragment Processor X: Instruction completed count.
Divide the value of Instruction completed count by the value of Fragment passed z/stensil count. This gives the average number of instruction words completed per fragment.
Shader too long:Shorten shader
Shader too complex:Simplify shader
Measure: Program cache
miss count
Too many branches:Remove branches
Measure: Pipeline bubbles
cycle count
DoesProgram cache
miss count reduce?
Yes
High shader time
Is value high?
Yes
Is value high?
Yes
No
No
Is value high?
Measure:Instruction completed countFragment rasterized count
Divide instruction completed count by fragment rasterized count
Yes
ARM DUI 0555C Copyright © 2011, 2013 ARM. All rights reserved. 7-11ID102813 Non-Confidential
Utgard Optimization Workflows
If this value is high your application has a high fragment shader time. The type of value that counts as high depends on the exact configuration of your Mali GPU. The number of cycles per fragment available depend on the number of shader cores and their clock speed. To work out the number of cycles available per fragment you must calculate a shader budget. See Set a computation budget and measure against it on page 3-7.
Note Mali GPUs perform multiple instructions per cycle. Do not assume one line of code equals one instruction.
Check if the shader is too long
Measure the following hardware counters:• Mali GPU Fragment Processor X: Program cache miss count.• Mali GPU Fragment Processor X: Program cache hit count.
Typically the value of Program cache miss count is very low. Usually 0.01% or less of Program cache hit rate.
If the graph is high, the fragment shader program is too long. If this is the case, shorten the shader and measure the counter again. If the result does not change the shader is too long and too complex. See Check if the shader is too long and too complex.
Check if the shader is too complex
Measure the following hardware counters:• Mali GPU Fragment Processor X: Program cache miss count.• Mali GPU Fragment Processor X: Program cache hit count.
Typically the value of Program cache miss count is very low. Usually 0.01% or less of Program cache hit rate.
If the graph of Program cache miss count is very low, the fragment shader is too complex. Try:
• Simplify the shader.
• Arithmetic optimizations.
• Consider if the shader can be partially or completely moved to the vertex processor or application processor.
Measure overall performance again. If performance does not improve the shader is too long and too complex. See Check if the shader is too long and too complex.
Check if the shader is too long and too complex
If you have checked whether the shader program is too long or too complex and optimizing does not have much impact, the shader program might be both too long and too complex. In this case try both simplifying and reducing the length of the shader.
If optimizing for length has little effect, measure Program cache miss count again. If the value has dropped, then the size optimization has worked but the shader is still too complex. In this case you must also simplify the shader. See Fragment shader optimizations on page 12-4.
ARM DUI 0555C Copyright © 2011, 2013 ARM. All rights reserved. 7-12ID102813 Non-Confidential

Utgard Optimization Workflows
Check for too many branches
Measure the fragment processor hardware counter Mali GPU Fragment Processor X: Pipeline bubbles cycle count.
If the graph of Mali GPU Fragment Processor X: Pipeline bubbles cycle count is high, the shader might have too many branches.
Note Branches are unlikely to be a problem on Mali GPUs because branches have a relatively low computational cost.
Other fragment shader problems
If the application is fragment shader bound but the problem is not one of those listed in this section, then look at other optimizations. See Chapter 12 Fragment Processing Optimizations and Chapter 14 Miscellaneous Optimizations.
ARM DUI 0555C Copyright © 2011, 2013 ARM. All rights reserved. 7-13ID102813 Non-Confidential

Utgard Optimization Workflows
7.3 Utgard architecture bandwidth bound problemsThis section describes how to determine if your application is bandwidth bound and how to reduce bandwidth usage. It contains the following sections:• Measure texture cache hit to miss ratio on page 7-16.• Check for blitting on page 7-16.• Measuring maximum bandwidth on page 7-16.• Compare application bandwidth to the maximum bandwidth available on page 7-17.• Fragment processing bandwidth bound on page 7-17.• Vertex processing bandwidth bound on page 7-18.
An application is bandwidth bound if it tries to use more memory bandwidth than is available. It is difficult to determine when an application is bandwidth bound because it impacts all parts of the application and the graphics pipeline.
There are a number of techniques you can use to confirm your application is bandwidth bound. Figure 7-4 on page 7-15 shows the workflow for this section.
ARM DUI 0555C Copyright © 2011, 2013 ARM. All rights reserved. 7-14ID102813 Non-Confidential

Utgard Optimization Workflows
Figure 7-4 Bandwidth bound workflow
Measure:Texture cache hit to
miss ratio
Measure: maximum bandwidth available and total bandwidth
used
Measure: Fragment processors total
bandwidth
Fix
Bandwidth bound
Close to maximum bandwith?
No
Yes
No
Fragment processor bandwidth boound
Vertex processor bandwidth bound
No
Yes
Not bandwidth bound
Is your device using blitting? Yes Fix if
possible
Is cache hit to miss ratio high? Yes
Are these values similar?
Is texture useefficient?
No
YesNo
ARM DUI 0555C Copyright © 2011, 2013 ARM. All rights reserved. 7-15ID102813 Non-Confidential

Utgard Optimization Workflows
7.3.1 Measure texture cache hit to miss ratio
The largest user of memory bandwidth is textures. A side effect of using too much texture bandwidth is that the texture cache usage is high.
Measure the following fragment processor hardware counters:• Mali GPU Fragment Processor X: Texture cache hit count.• Mali GPU Fragment Processor X: Texture cache miss count.
Typically, the ratio of texture cache hits to misses is approximately 10 to 1. A higher ratio is better and a lower ratio is worse.
A low ratio indicates cache usage is higher than normal. This can be because:• Use of textures that are too large.• Use of too many large textures.• The application does not use compressed textures.• The application does not use mipmapped textures.
If these problems are present in your application, fix them before you continue. Fixing these reduces memory bandwidth usage and might fix the overall performance problem.
7.3.2 Check for blitting
Check if your system is blitting image data. Blitting uses memory bandwidth and this might be the cause of bandwidth overuse.
To check for blitting measure the software counter: EGL Counters: Blit Time.
If your system is blitting a high resolution framebuffer, the bandwidth usage for this operation can be hundreds of Megabytes per second.
Blitting can occur if the system is not set up correctly. See Check the display settings on page 14-5.
Note Your system might do blitting as part of its display system. This blitting cannot be avoided.
7.3.3 Measuring maximum bandwidth
If you can establish your application is bandwidth bound, locate the source of the bandwidth overuse to fix it. To locate the source of the bandwidth overuse:
1. Work out the maximum available bandwidth.
2. Compare this to different parts of the system to find out what one is using too much bandwidth.
If you do not know the maximum bandwidth available on your device, you can work it out by running a test application that uses as much bandwidth as possible. Ensure the test application uses:• The highest resolution available.• Highest bit depth possible.• Very large, high bit depth textures.• 16x Anti-aliasing.• No texture compression.• No mipmapping.
ARM DUI 0555C Copyright © 2011, 2013 ARM. All rights reserved. 7-16ID102813 Non-Confidential

Utgard Optimization Workflows
• No VSYNC.
The aim of the test application is to overload the memory system by using as much bandwidth as possible. If the test application runs at a low frame rate, it is working correctly.
Measure the following counters while the test application is running:• Mali GPU Vertex Processor: Words read, system bus.• Mali GPU Vertex Processor: Words written, system bus.• Mali GPU Fragment Processor X: Total bus reads.• Mali GPU Fragment Processor X: Total bus writes.
Note If your Mali GPU has multiple fragment processors, ensure you take measurements from all of them.
Add all the measured results together and multiply by 8. The result is the maximum bandwidth available in Megabytes per second. This measurement includes cache usage so it is likely to appear higher than the maximum theoretical memory bandwidth in your system.
7.3.4 Compare application bandwidth to the maximum bandwidth available
Run your application and measure the following counters:• Mali GPU Vertex Processor: Words read, system bus.• Mali GPU Vertex Processor: Words written, system bus.• Mali GPU Fragment Processor X: Total bus reads.• Mali GPU Fragment Processor X: Total bus writes.
Note If your Mali GPU has multiple fragment processors, ensure you take measurements from all of them.
Add all the measured results together and multiply by 8. The result is the total bandwidth usage in Megabytes per second.
Add the values together and compare the result to the maximum bandwidth available value you measured from the test application in Measuring maximum bandwidth on page 7-16. If the figures are similar, your application is using too much bandwidth.
Compare the values and see what is the highest:
• If the Mali GPU fragment processors use the most bandwidth, see Fragment processing bandwidth bound.
• If the Mali GPU vertex processing uses most bandwidth, see Vertex processing bandwidth bound on page 7-18.
7.3.5 Fragment processing bandwidth bound
If your application is bound by the fragment processing using excessive bandwidth, the problem might be caused by one or more of the following:
Textures Typically, textures reads are the largest part of memory bandwidth usage. There are a number of ways you can reduce texture bandwidth usage:• Reduce the number of textures.• Reduce texture resolution.
ARM DUI 0555C Copyright © 2011, 2013 ARM. All rights reserved. 7-17ID102813 Non-Confidential

Utgard Optimization Workflows
• Reduce texture bit depth.• Use mipmapping.• Use texture compression.
Overdraw Overdraw happens when pixels are drawn over one another. This wastes bandwidth because the pixels drawn over are invisible. You can reduce bandwidth usage by reducing overdraw. See Avoid overdraw on page 12-2.
Trilinear filtering Trilinear filtering involves reading more than one texture to generate a single pixel using a large amount of bandwidth. Only use trilinear filtering on objects if absolutely necessary.
Fragment shader is too complex Complex shaders with a lot of intermediate state can fill up cache memory causing it to flush to main memory. If this happens memory bandwidth is used every time data is read from or written to memory.
See Chapter 13 Bandwidth Optimizations.
7.3.6 Vertex processing bandwidth bound
If your application is bound by the vertex processing using excessive bandwidth, the problem might be one of the following:
Too many triangles Too many triangles can cause excessive bandwidth usage. This is unlikely to happen unless you have a highly complex scene. See Reduce the number of vertices on page 11-2.Triangles might also use excessive bandwidth usage if you do not use culling. If you do not use culling the vertex processor processes triangles that are never drawn. See Use culling on page 11-3.
Vertex shader is too complex Complex shaders with a lot of intermediate state can fill up cache memory causing it to flush to main memory. If this happens memory bandwidth is used every time data is written to or read from memory.
Reading non-localized data If you have data spread widely through data structures the GPU might load data into cache that is never used. Avoid data structures such as sparse vertex arrays, Always try to place data together to make it more cacheable.
ARM DUI 0555C Copyright © 2011, 2013 ARM. All rights reserved. 7-18ID102813 Non-Confidential

Chapter 8 Midgard Optimization Workflows
This chapter contains examples of how to find and resolve a number of common performance problems for Midgard architecture Mali GPUs. It guides you through the process of diagnosing problems and selecting the optimizations to resolve them.
This chapter contains the following sections:• Counters to measure on Midgard architecture Mali GPUs on page 8-2.• Midgard architecture vertex processing bound problems on page 8-3.• Midgard architecture fragment-processing bound problems on page 8-6.• Midgard architecture bandwidth bound problems on page 8-12.
Note Measure the counters for this chapter before looking at the individual sections. See Counters to measure on Midgard architecture Mali GPUs on page 8-2.
ARM DUI 0555C Copyright © 2011, 2013 ARM. All rights reserved. 8-1ID102813 Non-Confidential

Midgard Optimization Workflows
8.1 Counters to measure on Midgard architecture Mali GPUsYou can measure up to 50 counters simultaneously on Midgard architecture Mali GPUs. Measure the following counters:• Mali Job Manager Cycles: GPU cycles.• Mali Job Manager Cycles: JS0 cycles.• Mali Job Manager Cycles: JS1 cycles.• Mali Core Cycles: Tripipe cycles.• Mali Core Cycles: Compute cycles.• Mali Core Cycles: Fragment cycles.• Mali Core Threads: Compute threads.• Mali Core Threads: Fragment threads.• Mali Arithmetic Pipe: A instructions.• Mali Fragment Primitives: Primitives loaded .• Mali Fragment Primitives: Primitives dropped.• Mali Fragment Tasks: Tiles rendered.• Mali Load/Store Pipe: LS instructions.• Mali Texture Pipe: T instructions.• Mali Texture Pipe: Cache misses.• Mali Load/Store Cache: Read hits.• Mali Load/Store Cache: Read misses.• Mali L2 Cache: External read beats.• Mali L2 Cache: External write beats.• Mali L2 Cache: Cache read hits.
ARM DUI 0555C Copyright © 2011, 2013 ARM. All rights reserved. 8-2ID102813 Non-Confidential
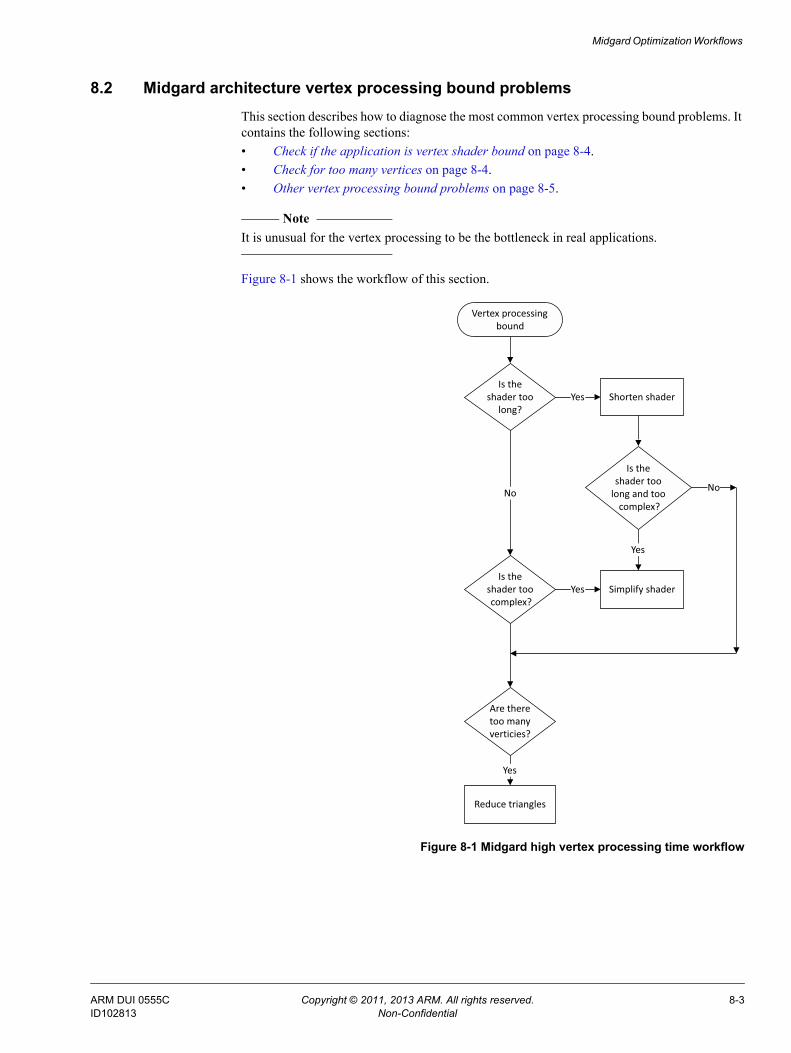
Midgard Optimization Workflows
8.2 Midgard architecture vertex processing bound problemsThis section describes how to diagnose the most common vertex processing bound problems. It contains the following sections:• Check if the application is vertex shader bound on page 8-4.• Check for too many vertices on page 8-4.• Other vertex processing bound problems on page 8-5.
Note It is unusual for the vertex processing to be the bottleneck in real applications.
Figure 8-1 shows the workflow of this section.
Figure 8-1 Midgard high vertex processing time workflow
Shorten shader
Simplify shaderIs the
shader too complex?
Yes
Vertex processing bound
Is theshader too
long?
No
Yes
Is theshader too
long and too complex?
Yes
No
Are theretoo manyverticies?
Yes
Reduce triangles
ARM DUI 0555C Copyright © 2011, 2013 ARM. All rights reserved. 8-3ID102813 Non-Confidential

Midgard Optimization Workflows
8.2.1 Check if the application is vertex shader bound
If the application is vertex shader bound, there are a number of reasons why this might be the case:
Check if the vertex shader is too long The vertex shader is too long if the following are true:• The value of Mali Job Manager Cycles: JS1 cycles is similar to Mali Job
Manager Cycles: GPU cycles.• The value of Mali Load/Store Cache: Read misses is relatively high.• The value of Mali Texture Pipe: T instructions is low.If the vertex shader is too long try shortening it.
Check if the vertex shader is too complex The shader is too complex if the following are true:• The value of Mali Job Manager Cycles: JS1 cycles is similar to the value
of Mali Job Manager Cycles: GPU cycles.• The value of Mali Load/Store Cache: Read misses is low.• The value of Mali Texture Pipe: T instructions is low.If the vertex shader is too complex try the following:• Simplify the shader.• Apply arithmetic optimizations.• Consider if the shader can be partially or completely moved to the fragment
processing stage or to the application processor.
Check if the vertex shader is too long and too complex If measurements indicate a shader it is too long but optimizing has relatively little impact, then the shaders might be both too long and too complex. In this case you must optimize for size first then complexity.
8.2.2 Check for too many vertices
If Mali Fragment Primitives: Primitives loaded - Mali Fragment Primitives: Primitives dropped is high you might be using too many triangles.
Other indicators you are using too many triangles are:• The value of Mali Job Manager Cycles: JS1 cycles is similar to Mali Job Manager Cycles:
GPU cycles.• The value of Mali Load/Store Cache: Read misses is high.• The value of Mali Texture Pipe: T instructions is low.
If your application is triangle bound, it has too many primitives, vertices, or triangles. To fix this try reducing the number of triangles.
To reduce the number of triangles, you can:• Use fewer objects.• Use simpler objects.• De-tessellate objects.• Cull triangles.
There are other techniques you can use to reduce the number of triangles. See Chapter 11 Vertex Processing Optimizations.
ARM DUI 0555C Copyright © 2011, 2013 ARM. All rights reserved. 8-4ID102813 Non-Confidential

Midgard Optimization Workflows
8.2.3 Other vertex processing bound problems
If the application is vertex processing bound but the problem is not one of those listed in this section, then look at other optimizations.
See Chapter 11 Vertex Processing Optimizations and Chapter 14 Miscellaneous Optimizations.
ARM DUI 0555C Copyright © 2011, 2013 ARM. All rights reserved. 8-5ID102813 Non-Confidential

Midgard Optimization Workflows
8.3 Midgard architecture fragment-processing bound problemsThis section describes how to diagnose and resolve fragment-processing bound problems. The fragment processing can be bound by the data consumed by the fragment data processing or by fragment shader programs. It contains the following sub-sections:• Check for fragment data processing bound problems on page 8-7.• Check for fragment shader bound problems on page 8-10.
ARM DUI 0555C Copyright © 2011, 2013 ARM. All rights reserved. 8-6ID102813 Non-Confidential

Midgard Optimization Workflows
8.3.1 Check for fragment data processing bound problems
This section guides you through a series of measurements to diagnose fragment data processing bound problems. It contains the following sections:• Check texture bandwidth on page 8-8.• Check for texture bandwidth problems on page 8-8.• Check for overdraw on page 8-8.• Check for high late Z on page 8-9.• Other fragment processing bound problems on page 8-9.
Figure 8-2 shows the workflow of this section.
Figure 8-2 Midgard High fragment processing time workflow
Reduce overdraw
High fragment processor time
Is value high?
Is value high?
Check:Compressed textures
MipmappingTexture size
Texture bit depthNumber of textures
Fragment shader bound
Yes
Check:Overdraw
Check:Texture bandwidth
Check:High late Z
Check for:Texture bandwidth
problems
No
Is value high?
Is value high?
Yes
No
Check:TransparenciesDepth testing
DiscardAlpha-to-coverage
Stencil updates
Yes
No
Yes
ARM DUI 0555C Copyright © 2011, 2013 ARM. All rights reserved. 8-7ID102813 Non-Confidential

Midgard Optimization Workflows
Check texture bandwidth
Your application is using too much texture bandwidth if the following are true:• The value of Mali Job Manager Cycles: JS0 cycles is high.• The value of Mali Core Cycles: Fragment cycles is high.• The value of Mali Core Cycles: Compute cycles is low.• The value of Mali Texture Pipe: T instructions is high.• If the value of Mali L2 Cache: External read beats is high.
If your application is using too much texture bandwidth, see Check for texture bandwidth problems.
If your application is not using too much texture bandwidth it is fragment shader bound. See Check for fragment shader bound problems on page 8-10.
Check for texture bandwidth problems
Your application might have texture bandwidth problems if the following are true:• The value of Mali Job Manager Cycles: JS0 cycles is high.• If the value of Mali L2 Cache: External read beats is high.• The value of Mali Texture Pipe: T instructions is high.• The value of Mali Texture Pipe: Cache misses is high.
The Mali Texture Pipe: Cache misses is typically 10% of Mali Texture Pipe: T instructions. If it is much higher than this, then your application is likely to have a problem with memory bandwidth. There can be a number of reasons for this:• Your application does not use compressed textures.• Your application does not use MIP mapping.• Your textures are too big.• Your texture bit depth is too high.• Your application uses too many textures.
Textures use a large amount of memory bandwidth. If too much bandwidth is used the shader cannot get sufficient data and stalls. Compressed textures and MIP mapping both reduce memory bandwidth usage significantly. This can increase performance and reduce power consumption.
See Chapter 12 Fragment Processing Optimizations, and Chapter 13 Bandwidth Optimizations.
Check for overdraw
To work out the overdraw factor use the following formula:
Overdraw factor = Mali Core Threads: Fragment threads ÷ (Mali Fragment Tasks: Tiles rendered × 256).
An overdraw factor of 1 indicates there is no overdraw but this is rare. Overdraw is typically around 2.5 but can vary depending on the application. If your content is mostly non-transparent and the overdraw factor is greater than 2.5 performance is likely to be impacted.
Drawing order is important for reducing overdraw:1. Sort scene objects by depth.2. Draw non-transparent objects in front to back order.3. Draw transparent objects in back to front order.
ARM DUI 0555C Copyright © 2011, 2013 ARM. All rights reserved. 8-8ID102813 Non-Confidential

Midgard Optimization Workflows
You can also reduce the overdraw factor by using techniques such as:• Enabling depth testing.• Enabling back face culling to avoid rendering invisible faces.
See Avoid overdraw on page 12-2 and Use culling on page 11-3.
Note It is normal for scenes with transparent content to have high overdraw.
Check for high late Z
If the value of Mali Core Threads: Frag threads killed late ZS is high, check your use of the following:• Transparencies.• Depth testing.• Discard.• Alpha-to-coverage.• Stencil updates.
Other fragment processing bound problems
If the application is fragment processing bound but the problem is not one of those listed in this section, then look at other optimizations. See Chapter 12 Fragment Processing Optimizations, Chapter 14 Miscellaneous Optimizations. Also see Midgard architecture bandwidth bound problems on page 8-12.
ARM DUI 0555C Copyright © 2011, 2013 ARM. All rights reserved. 8-9ID102813 Non-Confidential

Midgard Optimization Workflows
8.3.2 Check for fragment shader bound problems
High fragment shader time can be caused by a number of problems. This section describes these problems. It contains the following sections:• Confirm the problem is in the fragment shader.• Check if the fragment shader is too long on page 8-11.• Check if the fragment shader is too complex on page 8-11.• Check if the fragment shader is too long and too complex on page 8-11.• Other fragment shader problems on page 8-11.
Figure 8-3 shows the workflow of this section.
Figure 8-3 Midgard high fragment shader time workflow
Confirm the problem is in the fragment shader
Use the following formula to calculate the number of instructions per fragment:
Instructions per fragment = Mali Core Cycles: Fragment cycles / Mali Arithmetic Pipe: A instructions.
If the instructions per fragment is high and the value of Mali Job Manager Cycles: JS0 cycles is low, your application has a high fragment shader time.
The number of instructions per fragment available depend on the number of shader cores and their clock speed. To work out the number of instructions available per fragment, calculate a shader budget. See Set a computation budget and measure against it on page 3-7.
Shorten shader
Simplify shaderIs the
shader too complex?
Yes
High fragment shader time
Is the fragment shader
too long?
No
Confirm the problem is in the
fragment shader
Yes
Is theshader too
long and too complex?
Yes
No
Other fragment shader problems
ARM DUI 0555C Copyright © 2011, 2013 ARM. All rights reserved. 8-10ID102813 Non-Confidential

Midgard Optimization Workflows
Note Mali GPUs perform multiple instructions per cycle. Do not assume one line of code equals one instruction.
Check if the fragment shader is too long
The fragment shader is too long if the following are true:
• The value of Mali Job Manager Cycles: JS0 cycles is similar to the value of Mali Job Manager Cycles: GPU cycles.
• The value of Mali Load/Store Cache: Read misses is relatively high.
• The value of Mali Texture Pipe: T instructions is relatively low.
• The value of Mali Arithmetic Pipe: A instructions is relatively low to medium.
If the vertex shader is too long, shorten the shader and measure the counter again. If the result does not change the shader is too long and too complex. See Check if the fragment shader is too long and too complex.
Check if the fragment shader is too complex
The fragment shader is too complex if the following are true:
• The value of Mali Job Manager Cycles: JS0 cycles is similar to the value of Mali Job Manager Cycles: GPU cycles.
• The value of Mali Load/Store Cache: Read misses is low.
• The value of Mali Texture Pipe: T instructions is relatively high.
• The value of Mali Arithmetic Pipe: A instructions is high.
Try:
• Simplify the shader.
• Arithmetic optimizations.
• Consider if any of the shader functionality can be moved to the vertex processing stage or to the application processor.
If the vertex shader is complex, simplify the shader and measure overall performance again. If performance does not improve the shader is too long and too complex. See Check if the fragment shader is too long and too complex.
Check if the fragment shader is too long and too complex
If measurements indicate a shader it is too long or too complex but optimizing has relatively little impact, then the shaders might be both too long and too complex. In this case you must optimize for size first then complexity. See Fragment shader optimizations on page 12-4.
Other fragment shader problems
If the application is fragment shader bound but the problem is not one of those listed in this section, then look at other optimizations. See Chapter 12 Fragment Processing Optimizations and Chapter 14 Miscellaneous Optimizations.
ARM DUI 0555C Copyright © 2011, 2013 ARM. All rights reserved. 8-11ID102813 Non-Confidential

Midgard Optimization Workflows
8.4 Midgard architecture bandwidth bound problemsThis section describes how to determine if your application is bandwidth bound and how to reduce bandwidth usage. It contains the following sections:• Measure texture cache hit to miss ratio on page 8-14.• Check for blitting on page 8-14.• Measuring maximum bandwidth on page 8-14.• Compare application bandwidth to the maximum bandwidth available on page 8-15.• Midgard fragment processing bandwidth bound on page 8-16.• Midgard vertex processing bandwidth bound on page 8-16.
An application is bandwidth bound if it tries to use more memory bandwidth than is available. It is difficult to determine when an application is bandwidth bound because it impacts all parts of the application and the graphics pipeline.
This section describes a number of techniques you can use to confirm your application is bandwidth bound.
Figure 8-4 on page 8-13 shows the workflow for this section.
ARM DUI 0555C Copyright © 2011, 2013 ARM. All rights reserved. 8-12ID102813 Non-Confidential
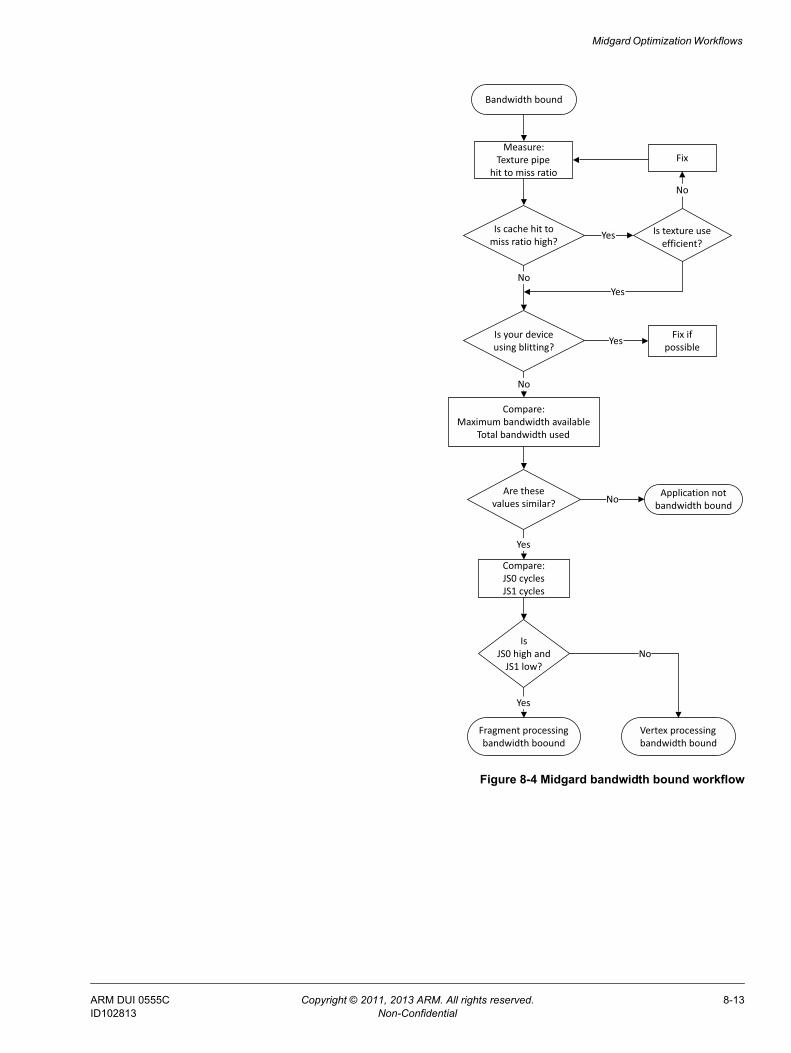
Midgard Optimization Workflows
Figure 8-4 Midgard bandwidth bound workflow
Measure:Texture pipe
hit to miss ratio
Compare:Maximum bandwidth available
Total bandwidth used
Fix
Bandwidth bound
IsJS0 high and
JS1 low?No
Yes
No
Fragment processing bandwidth boound
Vertex processing bandwidth bound
Yes
Application not bandwidth bound
Is your device using blitting?
YesFix if
possible
Is cache hit to miss ratio high?
Yes
Are thesevalues similar?
Is texture useefficient?
No
YesNo
No
Compare:JS0 cyclesJS1 cycles
ARM DUI 0555C Copyright © 2011, 2013 ARM. All rights reserved. 8-13ID102813 Non-Confidential

Midgard Optimization Workflows
8.4.1 Measure texture cache hit to miss ratio
The largest user of memory bandwidth is textures. A side effect of using too much texture bandwidth is that the texture cache usage is high.
Look at the following counters:• Mali Texture Pipe: T instructions.• Mali Texture Pipe: Cache misses.
Typically, the ratio of T instructions to cache misses is approximately 10 to 1. A higher ratio is better and a lower ratio is worse.
A low ratio indicates cache usage is higher than normal. This can be because:• Use of textures that are too large.• Use of too many large textures.• The application does not use compressed textures.• The application does not use mipmapped textures.
If these problems are present in your application, fix them before you continue. Fixing these reduces memory bandwidth usage and might fix the overall performance problem.
8.4.2 Check for blitting
Check if your system is blitting image data. Blitting uses memory bandwidth and this might be the cause of bandwidth overuse.
To check for blitting measure look at the following counters:• Mali L2 Cache: External write beats.• Mali L2 Cache: External read beats.
If the values of these counters are similar your application might be blitting.
If your system is blitting a high resolution framebuffer, the bandwidth usage for this operation can be hundreds of Megabytes per second.
Blitting can occur if the system is not set up correctly. See Check the display settings on page 14-5.
Note Your system might do blitting as part of its display system. This blitting cannot be avoided.
8.4.3 Measuring maximum bandwidth
If you can establish your application is bandwidth bound, locate the source of the bandwidth overuse to fix it. To locate the source of the bandwidth overuse:
1. Work out the maximum available bandwidth.
2. Compare this to different parts of the system to find out what one is using too much bandwidth.
If you do not know the maximum bandwidth available on your device, you can work it out by running a test application that uses as much bandwidth as possible. Ensure the test application uses:• The highest resolution available.• Highest bit depth possible.
ARM DUI 0555C Copyright © 2011, 2013 ARM. All rights reserved. 8-14ID102813 Non-Confidential

Midgard Optimization Workflows
• Very large, high bit depth textures.• 16x Anti-aliasing.• No texture compression.• No mipmapping.• No VSYNC.
The aim of the test application is to overload the memory system by using as much bandwidth as possible. If the test application runs at a low frame rate, it is working correctly.
Look at the following counters:• Mali L2 Cache: External read beats.• Mali L2 Cache: External write beats.
Add these values together and multiply by 8 or 16. The result is the maximum bandwidth available in Megabytes per second.
Note 8 or 16 is the width in bytes of the data bus connecting the Mali GPU in the System on Chip you are using.
8.4.4 Compare application bandwidth to the maximum bandwidth available
Look at the following counters:• Mali L2 Cache: External read beats.• Mali L2 Cache: External write beats.
Add these values together and multiply by 8 or 16. The result is the total bandwidth usage in Megabytes per second.
Note 8 or 16 is the width in bytes of the data bus connecting the Mali GPU in the System on Chip you are using.
Add the values together and compare the result to the maximum bandwidth available value you measured from the test application in Measuring maximum bandwidth on page 8-14. If the figures are similar, your application is using too much bandwidth.
Compare the following values:
• If the following are true:The value of Mali Job Manager Cycles: JS1 cycles is low.The value of Mali Job Manager Cycles: JS0 cycles is similar to the value of Mali Job Manager Cycles: GPU cycles.Your Mali GPU is fragment processing bandwidth bound, see Midgard fragment processing bandwidth bound on page 8-16.
• If the following are true:The value of Mali Job Manager Cycles: JS0 cycles is low, The value of Mali Job Manager Cycles: JS1 cycles is similar to the value of Mali Job Manager Cycles: GPU cycles.Your Mali GPU is vertex processing bandwidth bound, see Midgard vertex processing bandwidth bound on page 8-16.
ARM DUI 0555C Copyright © 2011, 2013 ARM. All rights reserved. 8-15ID102813 Non-Confidential
Midgard Optimization Workflows
8.4.5 Midgard fragment processing bandwidth bound
If your application is bound by the fragment processing using excessive bandwidth, the problem might be caused by one or more of the following:
Textures Typically, textures reads are the largest part of memory bandwidth usage. There are a number of ways you can reduce texture bandwidth usage:• Reduce the number of textures.• Reduce texture resolution.• Reduce texture bit depth.• Use mipmapping.• Use texture compression.
Overdraw Overdraw happens when pixels are drawn over one another. This wastes bandwidth because the pixels drawn over are invisible. You can reduce bandwidth usage by reducing overdraw. See Avoid overdraw on page 12-2.
Trilinear filtering Trilinear filtering involves reading more than one texture to generate a single pixel using a large amount of bandwidth. Only use trilinear filtering on objects if absolutely necessary.
Fragment shader is too complex Complex shaders with a lot of intermediate state can fill up cache memory causing it to flush to main memory. If this happens memory bandwidth is used every time data is read from or written to memory.
See Chapter 13 Bandwidth Optimizations.
8.4.6 Midgard vertex processing bandwidth bound
If your application is bound by the vertex processing using excessive bandwidth, the problem might be one of the following:
Too many triangles Too many triangles can cause excessive bandwidth usage. This is unlikely to happen unless you have a highly complex scene. See Reduce the number of vertices on page 11-2.Triangles might also use excessive bandwidth usage if you do not use culling. If you do not use culling the vertex processing stage processes triangles that are never drawn. See Use culling on page 11-3.
Vertex shader is too complex Complex shaders with a lot of intermediate state can fill up cache memory causing it to flush to main memory. If this happens memory bandwidth is used every time data is written to or read from memory.
Reading non-localized data If you have data spread widely through data structures the GPU might load data into cache that is never used. Avoid data structures such as sparse vertex arrays, Always try to place data together to make it more cacheable.
ARM DUI 0555C Copyright © 2011, 2013 ARM. All rights reserved. 8-16ID102813 Non-Confidential
Chapter 9 Application Processor Optimizations
There are many optimization techniques to improve the performance of code running on your application processor.
This chapter describes application processor optimizations. It contains the following sections:• Align data on page 9-2.• Optimize loops on page 9-3.• Use vector instructions on page 9-5.• Use fast data structures on page 9-6.• Consider alternative algorithms and data structures on page 9-7.• Use multiprocessing on page 9-8.
ARM DUI 0555C Copyright © 2011, 2013 ARM. All rights reserved. 9-1ID102813 Non-Confidential

Application Processor Optimizations
9.1 Align dataThe OpenGL ES standard requires data to be copied from the application to the driver. If you align your data to eight bytes it is more cacheable. This makes copies faster and reduces memory bandwidth usage.
You must also align data before the Mali GPU can use it. If you enforce alignment in code the Mali GPU driver does not have to align the data during the copy. This improves performance because there is no overhead aligning the data when the copy occurs.
Note • Ensure you align data when you import data from header files. This might require a
compiler-specific command.
• Aligned data is more cacheable on GPUs and application processors so it is a good idea to always align data to 8 bytes if possible.
ARM DUI 0555C Copyright © 2011, 2013 ARM. All rights reserved. 9-2ID102813 Non-Confidential
Application Processor Optimizations
9.2 Optimize loopsLoops are used for intensive computations in both application code and shaders. They can take up a very large proportion of processing time. You can make application and shader code significantly faster by optimizing loops.
Generally, the key to loop optimization is to make the loop do as little as possible per iteration to make each iteration faster. If the loop runs ten thousand times, reducing the loop by one instruction requires ten thousand less instructions.
Note Ensure you profile your code so that you can find the loops that use the most compute power. Only optimize the loops that require optimization.
Move repeated computations If there are computations in a loop that can be done before the loop, move these computations to outside the loop.Look for instructions that compute the same value over and over again. You can move these computations out of the loop.
Move unused computations If there are computations in the loop that generate results that are not used within the loop, move these computations to outside the loop.
Avoid computations in the iteration if test Every time a loop is iterated a conditional test determines if another iteration is required. Make this computation as simple as possible. Consider if the entire computation must be performed each time. If possible move any pre-computable parts outside the loop.
Simplify code Avoid complex code constructs. It is easier for the compiler to optimize code if it is simpler.
Avoid cross-iteration dependencies Try to keep the computations in iterations independent of other iterations. This enables the compiler to make optimizations that are otherwise not possible.
Work on small blocks of data Ensure the inner loops work on small blocks of data. Smaller blocks of data are more cacheable.
Minimize code size Keeping loops and especially inner loops small makes them more cacheable. This can have a significant impact on performance. Reducing the size of loops make the instructions more likely to be cached and this increases performance.
Unroll loops You can take the computations from many loop iterations and make them into a smaller number of large iterations. This reduces the computational load by saving if test computations.Test how well unrolling the loop works at different sizes. Over a certain threshold the loop becomes too big for efficient caching and performance drops.
ARM DUI 0555C Copyright © 2011, 2013 ARM. All rights reserved. 9-3ID102813 Non-Confidential

Application Processor Optimizations
Compilers can unroll loops for you so you might not have to do it manually in your code. Some application processors can do loop unrolling in hardware. In both cases it is worth testing to see if you have to do the unrolling manually.However, automatic code unrolling is limited. If your application processor supports automatic code unrolling keeping the code small is the better option. Test to see what works best.
Avoid branches in loops A conditional test in a loop typically generates a branch instruction. Branch instructions can slow an application processor down and are especially bad in loops. Avoid branches if possible and especially in inner loops.
Do not make function calls in inner loops Function calls in loops generate at least two branches and can initiate program reads from a different part of memory. If possible, avoid making function calls in loops and especially in inner loops.Consider if the data can be part processed in the loop first, then the call made outside the loop.Some functions calls can be avoided by copying the contents of the function into the loop. The compiler might do this with some calls automatically but with some compilers you can force it with compiler directives.
Use the right tools Various application processor tools can help with optimizing applications. Use these tools if they are available.
Use vector instructions if possible Vector instructions process multiple data items simultaneously so you can use these to speed up a loop or reduce the number of iterations. For more information see Use vector instructions on page 9-5.
Note If you are processing a very small number of items it might be faster not to use a loop.
ARM DUI 0555C Copyright © 2011, 2013 ARM. All rights reserved. 9-4ID102813 Non-Confidential

Application Processor Optimizations
9.3 Use vector instructionsMany ARM application processors and Mali GPUs include vector or Single Instruction Multiple Data (SIMD) instructions. These enable the processor to perform multiple operations with a single instruction. Using vector instructions can produce a very large performance boost for some operations so use vector processing where possible.
Vector processing works by processing multiple operations in parallel with a single instruction. The number and type of operations you can do depends on the type of vector processor extension in your processor.
For example, an ARM processor with the NEON Media Processing Engine can do up to 4 32-bit operations, 8 16-bit operations, or 16 8-bit operations simultaneously, depending on the implementation. The shader cores in the Midgard architecture Mali GPUs and the fragment processor in the Utgard architecture Mali GPUs have similar capabilities.
Other advantages of vector instructions are:
• Vector operations can reduce code size making it more cacheable.
• You can sometimes use vector instruction in a loop as a form of loop unrolling. This can reduce the number of total iterations the loop must do by 4 or more times.
Note If the number of data items being processed is not a multiple of the number of elements
in the vector, you require additional code to process the start or end elements. This code is only executed once.For example, if you are processing an array with 1002 items of data, you are only required to perform 250 iterations because you can process 4 items at a time. The remaining 2 items require additional code to process them.
ARM DUI 0555C Copyright © 2011, 2013 ARM. All rights reserved. 9-5ID102813 Non-Confidential

Application Processor Optimizations
9.4 Use fast data structuresAll graphics and application processing depends on data. If the processor cannot read data at high speed then the application processor cannot process it at high speed.
Experiment with different types of data structures and measure to see what is fastest. Try the following:
Avoid pointer chases Some data structures use pointers to navigate between different elements in a data structure. Reading a data element involves first reading an address and then fetching a data item and the address of the next element from that address. This means reading data incurs memory latency every time an element is read. If the data is spread around memory the latency increases and reading speed decreases.If the nature of your data requires a data structure like this:• Try making the elements contain as much data as possible.• Clump multiple elements together into small arrays.
Use regular, linear data structures An application can read arrays quickly because they have a regular structure and can read linearly, or stream from memory.
Localise data to make it more cacheable If data elements are beside each other in memory, reading one element is likely to bring another into the cache. This makes accessing that data faster and saves power because it saves a memory transaction.
Optimize data size to fit in cache Try to make the size of your data elements a power of two. This makes them more cacheable.
ARM DUI 0555C Copyright © 2011, 2013 ARM. All rights reserved. 9-6ID102813 Non-Confidential

Application Processor Optimizations
9.5 Consider alternative algorithms and data structuresThere are many code level optimizations that can make an application perform better in specific areas. Using different algorithms and data structures can sometimes produce large performance gains.
Consider what problems you are trying to solve and see if you can solve them in different ways. For example:
• If you are modelling a landscape as a grid, try using an irregular mesh as an alternative.
• If you are representing object positions in a grid, an alternative is to use a mathematical approach.
• For collision detection, try grouping objects into a hierarchy of bounding boxes. It is quick to test for collisions at the top level. You are only required to test deeper in the hierarchy if there is a collision at the highest level.
• If you are computing collision detection in three dimensions, check if you can approximate or ignore the third dimension. This can reduce many types of computations.
These are examples. Experiment with different approaches and measure the results to see how well they work.
If you cannot think of alternative approaches, describe the problem to someone else and see how they would solve it. If their solution is different then this might be an alternative you can consider.
The act of describing the solution can be sufficient to bring new ideas to mind. This can assist you in thinking about possible alternatives.
ARM DUI 0555C Copyright © 2011, 2013 ARM. All rights reserved. 9-7ID102813 Non-Confidential

Application Processor Optimizations
9.6 Use multiprocessingMany modern mobile devices have multiple application processors. Multi-processing can potentially improve performance of application processor code by a large margin.
Multi-processing requires that data can be accessed in parallel.
You can do this by:
• Splitting data and assigning it to individual threads.
• Sharing data between the threads and using mutual exclusion to prevent conflicts.
• Using a concurrent data structure. That is, a data structure that can be read by multiple threads simultaneously.
ARM DUI 0555C Copyright © 2011, 2013 ARM. All rights reserved. 9-8ID102813 Non-Confidential

Chapter 10 API Level Optimizations
This chapter describes API level optimizations. It contains the following sections:• Minimize draw calls on page 10-2.• Minimize state changes on page 10-7.• Ensure the graphics pipeline is kept running on page 10-8.
ARM DUI 0555C Copyright © 2011, 2013 ARM. All rights reserved. 10-1ID102813 Non-Confidential

API Level Optimizations
10.1 Minimize draw callsThis section describes how to minimize draw calls. It contains the following sections:• About minimizing draw calls.• Limitations on combined draw calls on page 10-3.• Combining textures in a texture atlas on page 10-4.• Combining multiple texture atlases together on page 10-5.• Combining text textures in a font atlas on page 10-6.
10.1.1 About minimizing draw calls
It is easy to limit the performance of your application by making too many draw calls. If your applications makes many hundreds or thousands of draw calls per frame, try to reduce the number of them.
OpenGL ES draw calls are calls to the following functions:• glDrawArrays()
• glDrawElements()
The reason for the performance limitation is every draw call has a processing overhead. The processing required by draw calls includes allocating memory, copying data, and other data processing. The overhead is the same whether you draw a single triangle or thousands of triangles.
If your application issues a large number of draw calls, the overhead of these draw calls can make your application become application-processor bound.
You can reduce or remove the performance limitation by grouping uniforms and draw calls together and passing them in a smaller number of API calls.
If you combine multiple triangles into a single draw call, the overhead is only imposed once rather than multiple times. This reduces the total overhead and increases the performance of your application.
Figure 10-1 shows a series of API calls that pass relatively little data. Figure 10-2 on page 10-3 shows a pair of API calls each with a larger amount of data.
The processing in Figure 10-2 on page 10-3 is the same as that shown in Figure 10-1 but the time taken is smaller because the overhead of two draw calls is lower than the overhead of four.
Figure 10-1 API calls with small data payload
API call Processing API
call ProcessingOverhead Overhead API call Processing API
call ProcessingOverhead Overhead
API callwith small
data payload
ARM DUI 0555C Copyright © 2011, 2013 ARM. All rights reserved. 10-2ID102813 Non-Confidential

API Level Optimizations
Figure 10-2 API calls with large data payload
You can combine triangles in a single draw call by using the following data structures:• Triangle strips.• Triangle lists.• Index arrays.
You can additionally combine triangles by making combinations of combinations. For example, you can combine multiple triangle strips together. You can assist this process by adding degenerate triangles between the strips.
10.1.2 Limitations on combined draw calls
There are limitations on combining draw calls. The combined triangles must:• Be in the same format.• Use the same shader.• Use the same GL state.
If you cannot join triangles because they use different shaders:
• Consider if the effect generated by the shader makes a significant difference. If the difference is small, it might be worth removing the separate effect.
• You can alternatively use different effects in one shader, and use a control variable to select between them.
Note This increases the size of the shader and selecting the effect requires additional
computation.
API call OverheadAPI
call ProcessingOverhead Processing
API callwith large
data payload
ARM DUI 0555C Copyright © 2011, 2013 ARM. All rights reserved. 10-3ID102813 Non-Confidential

API Level Optimizations
10.1.3 Combining textures in a texture atlas
To assist with the process of combining triangles, you can combine multiple textures together into a texture atlas. This is a single texture image that contains textures from components of different objects. The texture atlas shown in Figure 10-3 contains all the textures that are used drawing the sign shown in Figure 10-4.
Note Texture atlas based techniques typically do not work with repeating textures.
Figure 10-3 Texture atlas for sign
Figure 10-4 Sign in game
ARM DUI 0555C Copyright © 2011, 2013 ARM. All rights reserved. 10-4ID102813 Non-Confidential

API Level Optimizations
10.1.4 Combining multiple texture atlases together
If the objects being drawn use the same shaders, you can combine multiple texture atlases into a single larger combined texture atlas. Figure 10-5 shows a combined texture atlas for a set of signs including the texture atlas shown in Figure 10-3 on page 10-4.
Figure 10-5 Texture atlas with multiple signs
ARM DUI 0555C Copyright © 2011, 2013 ARM. All rights reserved. 10-5ID102813 Non-Confidential

API Level Optimizations
10.1.5 Combining text textures in a font atlas
If you are drawing text on screen you can put text into a font atlas. You can then combine all the text drawing calls into a single call and use a font atlas to provide the font images. This is an efficient technique because it enables you to draw all the text in a single draw call. Figure 10-6 shows a section of a font atlas.
Figure 10-6 Font atlas
ARM DUI 0555C Copyright © 2011, 2013 ARM. All rights reserved. 10-6ID102813 Non-Confidential

API Level Optimizations
10.2 Minimize state changesState changes are similar to draw calls in that there is an overhead imposed every time state is changed. To reduce this overhead, minimize the number of state changes your application makes.
You can reduce state changes with the following techniques:
• Group together triangles or objects with the same texture.
• Group objects with the same state together and make changes on them in one go.
• Use texture atlases. This enables you to draw complex single objects or multiple objects with a single texture. See Combining textures in a texture atlas on page 10-4.
• Check the state in your application to see if it must be changed, only make state changes that are necessary.
• Remove redundant glEnable() and glDisable() pairs.For example, replace this type of construct:— glEnable()
<do operation 1>glDisable()
glEnable()
<do operation 2>glDisable()
with this:— glEnable()
<do operation 1><do operation 2>glDisable()
ARM DUI 0555C Copyright © 2011, 2013 ARM. All rights reserved. 10-7ID102813 Non-Confidential

API Level Optimizations
10.3 Ensure the graphics pipeline is kept runningThis sections describes how to avoid stalling the graphics pipeline. It contains the following sections:• The graphics pipeline.• Avoiding calls that stall the graphics pipeline on page 10-9.
10.3.1 The graphics pipeline
The graphics pipeline consists of the application processor, vertex processing, fragment processing, and framebuffer. For the pipeline to work efficiently, data must be kept flowing through it.
If data is not kept flowing, the application processor, vertex processing, or fragment processing stages might idle, waiting for data output from another stage.
You can keep the pipeline running by performing multiple types of operations simultaneously and avoiding blocking calls.
Figure 10-7 Graphics pipeline flow with stall
Figure 10-7 shows the impact of a stall on the graphics pipeline. The diagram shows eight jobs processed in 11 steps. The steps are indicated by the letters A to K:
Steps A to D Steps A to D show data passing through the pipeline correctly.Job 1 starts in the application processor at step A and moves along the pipeline in steps B to C. The results arrive in the framebuffer in step D.
4 3 2 1
Stall 5 -
Stall 5 4 3 2
4 3
5 -
Stall 5 - - 4
- 4
7 6
6 5 - 4
5 4
8 7 6 5
Step
E
F
G
H
I
J
K
D
2 1
1 - - -
Vertex processing
Fragmentprocessing
- -
3 2 1 -
B
C
A
FramebufferApplicationprocessor
Normal pipeline
operation
Pipeline stalled in application
processor
Results of 5 make it to framebuffer 3
steps later
Pipeline restarts normal operation
after stall but framebuffer
remains the same
ARM DUI 0555C Copyright © 2011, 2013 ARM. All rights reserved. 10-8ID102813 Non-Confidential

API Level Optimizations
Steps E to G Steps E to G show the impact of job 5 stalling in the application processor.Job 4 moves through the pipeline as it is processed in steps F and G, but the vertex processing stage runs out of work at step F. At step G both the vertex and fragment processing stages have no work.
Steps G to J For steps G to J the framebuffer contains the results of job 4. This is because the GPU cannot produce more frames while the pipeline is stalled.
Step H At step H, job 5 finishes in the application processor and moves into the vertex processing stage at step I. Job 5 moves along the pipeline and arrives in the framebuffer in stage K.
The stall in steps E to G causes the framebuffer to keep the same image for steps G to J. In a real application this produces a fall in frame rate and a potentially jumpy application.
10.3.2 Avoiding calls that stall the graphics pipeline
There are a number of OpenGL ES function calls that can cause the graphics pipeline to stall. Avoid using these calls because they can have a significant impact on performance.
Some OpenGL ES function calls read from the framebuffer. To do this, the Mali GPU must first render the entire image before you can read back from it. This operation is likely to be slow.
It is best to avoid the following OpenGL ES calls because they can stall the graphics pipeline:
glReadPixels() This call stalls the graphics pipeline and this can lead to a significant performance reduction. Avoid calls to glReadPixels() if at all possible.
glCopyTexImage() ARM recommends that if you are using OpenGL ES 2.0, you use FBOs instead of this call. These enable you to draw directly to a texture rather than using copies.
glTexSubImage() This does not normally stall the pipeline, but it can stall it if you attempt to modify a pixmap image or FBO rendertarget that has not completed rendering.
ARM DUI 0555C Copyright © 2011, 2013 ARM. All rights reserved. 10-9ID102813 Non-Confidential

Chapter 11 Vertex Processing Optimizations
This chapter describes a series of optimizations for vertex processing bound applications. It contains the following sections:• Reduce the number of vertices on page 11-2.• Use culling on page 11-3.• Use normal maps to simulate fine geometry on page 11-5.• Use level of detail on page 11-6.
ARM DUI 0555C Copyright © 2011, 2013 ARM. All rights reserved. 11-1ID102813 Non-Confidential

Vertex Processing Optimizations
11.1 Reduce the number of verticesYou can use the following methods to reduce the number of vertices:• Use fewer objects.• Use fewer polygons.• Use simpler objects.• De-tessellate objects.• Use triangle strips.• Use triangle fans.• Cull triangles. See Use culling on page 11-3.
ARM DUI 0555C Copyright © 2011, 2013 ARM. All rights reserved. 11-2ID102813 Non-Confidential

Vertex Processing Optimizations
11.2 Use cullingCulling is the process of removing parts of a scene that are not visible so the Mali GPU does not have to draw them. There are a number of methods of culling. These range from very coarse types of culling performed by the application to very fine culling of individual triangles and fragments performed by the Mali GPU.
Note It is best to cull entire objects and draw calls in the application and let the GPU cull individual triangles. In scenes with many triangles, triangle culling can be a highly intensive operation. If you use the application processor to do this it is likely to reduce the performance of your application.
Enable back face culling Back face culling is an OpenGL ES option. When it is enabled the GPU removes the back facing triangles in objects so they are not drawn.
Enable depth testing Depth testing is an OpenGL ES option that discards fragments that are behind previously drawn fragments. This reduces the amount of computation required by the GPU.
Use bounding shapes and view frustum culling You can reduce the number of runtime computations required for culling by using bounding boxes, spheres and other shapes to contain complex objects. By using these shapes to calculate what objects are visible your application can remove invisible objects and only send information for the visible objects to the GPU.For example, you can cull the following because they are not visible:• Any object outside the view frustum. • Any object that is behind the camera plane.
Work out what parts of the world are visible In applications such as mapping or games, only certain parts of the world are visible at any given time. You can reduce GPU work by working out what sections of the world are visible at different locations in the application before runtime. At runtime the application uses this information to determine what objects are visible and the Mali GPU only processes these.Figure 11-1 on page 11-4 shows a section of a world in a game. The Mali GPU must process all of this data if there is no culling.
ARM DUI 0555C Copyright © 2011, 2013 ARM. All rights reserved. 11-3ID102813 Non-Confidential

Vertex Processing Optimizations
Figure 11-1 Section of a world without culling
Figure 11-2 shows the same section of the game world where the greyed sections are culled. Only the remaining colored section is processed. By culling the greyed sections, the amount of data the Mali GPU processes is reduced considerably.
Figure 11-2 Section of a world with culling
ARM DUI 0555C Copyright © 2011, 2013 ARM. All rights reserved. 11-4ID102813 Non-Confidential

Vertex Processing Optimizations
11.3 Use normal maps to simulate fine geometryYou can use normal maps to simulate fine geometry. This gives the impression that a shape is more complex than it actually is. Using this technique enables you to make objects look better and reduce vertex processing computations.
Figure 11-3 and Figure 11-4 show normal maps used in scenes. The highlights are produced with specular maps.
Figure 11-3 Floor with normal map
Figure 11-4 Ceiling with normal map
ARM DUI 0555C Copyright © 2011, 2013 ARM. All rights reserved. 11-5ID102813 Non-Confidential

Vertex Processing Optimizations
11.4 Use level of detailLOD is a set of techniques that involve using different versions of an object with greater or less detail, depending on the distance from the camera.
When the object is close to the camera a full resolution, fully detailed object is displayed. When the object is further away a lower resolution, less detailed object is used. Figure 11-5 and Figure 11-6 show different levels of detail for asteroids.
Figure 11-5 Wireframe asteroids with levels of detail
Figure 11-6 Asteroids with levels of detail
The same technique applies to textures. High resolution textures are used for objects closer to the camera and lower resolution textures used for objects far away.
Applying LOD to objects reduces the usage of both compute power and memory bandwidth.
You can choose the LOD technique for different distances from the camera, Use the lowest level of detail that is appropriate but try lower levels to see if it makes much difference. Using fewer details requires less memory and bandwidth.
ARM DUI 0555C Copyright © 2011, 2013 ARM. All rights reserved. 11-6ID102813 Non-Confidential

Vertex Processing Optimizations
Another technique that you can use is to replace objects with billboards. As an object gets very small on screen small details become invisible. You can replace the object with a billboard with a texture that has an image of the object. This requires less computation to draw something that looks similar.
For example, consider a house with full details includes windows, window ledges and curtains all as 3D objects. As the camera moves away from the house the individual details can be simplified because the fine detail is no longer visible. At the furthest distances from the camera the house is so small on screen that you can draw it as a flat image of a house with no 3D details.
ARM DUI 0555C Copyright © 2011, 2013 ARM. All rights reserved. 11-7ID102813 Non-Confidential

Chapter 12 Fragment Processing Optimizations
This chapter describes fragment processing optimizations. It contains the following sections:• Fragment processing optimizations on page 12-2.• Fragment shader optimizations on page 12-4.
ARM DUI 0555C Copyright © 2011, 2013 ARM. All rights reserved. 12-1ID102813 Non-Confidential

Fragment Processing Optimizations
12.1 Fragment processing optimizationsThis section describes fragment processing optimizations. It contains the following sections:• Reduce texture bandwidth.• Avoid overdraw.• Other fragment processing bound problems on page 12-3.
12.1.1 Reduce texture bandwidth
Textures use a large amount of memory bandwidth. If too much bandwidth is used the fragment shaders cannot get sufficient data and stall.
There are a number of methods to reduce texture bandwidth. See Chapter 13 Bandwidth Optimizations.
12.1.2 Avoid overdraw
Overdraw occurs when the GPU draws over the same pixel multiple times. This means compute resources and memory bandwidth are used for fragments that are not visible in the final frame. This is a waste of resources and it negatively impacts the performance of applications. Avoid overdraw if possible.
You can use a number of methods to avoid overdraw:
Enable depth testing Depth testing discards any fragment behind those already drawn.
Enable back face culling Back face culling removes triangles on the back of objects that are not visible.
Sort objects then draw non-transparent objects 1. Ensure depth testing is enabled. It is required for this technique to work.2. Sort the objects in the scene by distance from the camera.
You can save time sorting by keeping geometry in data structures such as Binary Space Partition (BSP) trees.
3. Draw the non-transparent objects in front to back order.4. Draw the transparent objects last in back to front order.
Optimize the use of transparency Transparency is a useful effect but it can be resource intensive if there are many layers.If you are using transparent objects you can reduce their drawing cost by:• Ensuring transparent objects are drawn last. If a transparent object is not
drawn last your application might have to waste resources drawing the same object more than once.
• Minimizing the number of transparent layers visible through each other.• Draw transparent objects after non-transparent objects.• Draw transparent objects in back to front order.
ARM DUI 0555C Copyright © 2011, 2013 ARM. All rights reserved. 12-2ID102813 Non-Confidential

Fragment Processing Optimizations
12.1.3 Other fragment processing bound problems
If the application is fragment processing bound but the problem is not one of those listed in this section, then look at other optimizations. See Chapter 12 Fragment Processing Optimizations and Chapter 14 Miscellaneous Optimizations.
Another possibility is the application might be bandwidth bound. See Chapter 13 Bandwidth Optimizations.
ARM DUI 0555C Copyright © 2011, 2013 ARM. All rights reserved. 12-3ID102813 Non-Confidential
Fragment Processing Optimizations
12.2 Fragment shader optimizationsThis section describes fragment shader optimizations. It contains the following sections:• Simplify the shader.• Reduce the number of branches.• Other fragment shader problems.
12.2.1 Simplify the shader
If the fragment shader is too complex it can take too long to perform its function. There are a number of techniques you can use to simplify the shader.
Arithmetic optimizations Consider if can you combine multiple operations into one.
Move the computations Consider if the shader can be partially or completely moved to the vertex processing stage or application processor.
Use textures in place of computations You can precompute values and store these in textures in place of doing computations. This is a useful technique but it does increase memory bandwidth usage.
You can use many standard code optimization techniques to simplify shaders. See Optimize loops on page 9-3.
12.2.2 Reduce the number of branches
Branches are not a slow operation on Mali GPUs, however they might cause problems if:• There are an excessive number of branches.• The branches lead to code blocks that must be read from the cache or RAM.
An excessive number of branches might indicate a control type algorithm is in use. Control algorithms typically perform better on application processors.
Consider if you can use less branch intensive algorithm to get the same result. Another option is to consider moving the code to the application processor.
If branches lead to code blocks that must be read from cache or RAM, then the shader is probably too long.
If there are similarities between the code blocks you might be able to merge them and perform the function of the branch in a computational manner.
12.2.3 Other fragment shader problems
If the application is fragment shader bound but the problem is not one of those listed in this section, see Chapter 14 Miscellaneous Optimizations.
ARM DUI 0555C Copyright © 2011, 2013 ARM. All rights reserved. 12-4ID102813 Non-Confidential

Chapter 13 Bandwidth Optimizations
This chapter explains why it is important to keep memory bandwidth usage low and describes methods to reduce it. It contains the following sections:• About reducing bandwidth on page 13-2.• Optimize textures on page 13-3.• Use mipmapping on page 13-5.• Use texture compression on page 13-6.• Only use trilinear filtering if necessary on page 13-8.• Reduce bandwidth by avoiding overdraw on page 13-9.• Reduce drawing surfaces with culling on page 13-10.• Reduce bandwidth by utilizing level of detail on page 13-11.
ARM DUI 0555C Copyright © 2011, 2013 ARM. All rights reserved. 13-1ID102813 Non-Confidential
Bandwidth Optimizations
13.1 About reducing bandwidthMemory bandwidth in mobile devices is very restricted compared to GPUs in desktop systems. It can easily become a bottleneck limiting the performance of your application. For this reason, try to minimize your use of memory bandwidth:
• Bandwidth is a shared resource so using too much can limit the performance of the entire system in unpredictable ways. For example, graphics memory is shared with application memory so high bandwidth usage by the GPU can degrade application processor performance.
• Accessing external memory requires a lot of power so reducing bandwidth usage reduces power consumption.
• Accessing data in cache reduces power usage and can increase performance. If your application must read from memory a lot, use techniques such as mipmapping and texture compression to ensure your data is cache friendly. See Use mipmapping on page 13-5, and see Use texture compression on page 13-6.
Note Determining that memory bandwidth is causing problems is difficult. See Determining if memory bandwidth is the problem on page 4-18.
ARM DUI 0555C Copyright © 2011, 2013 ARM. All rights reserved. 13-2ID102813 Non-Confidential

Bandwidth Optimizations
13.2 Optimize texturesTextures typically use a large amount of memory bandwidth so optimizing their use is the first target for bandwidth reduction. This section describes a number of methods to optimize and reduce the memory bandwidth used by textures in:• Ensure textures are not too large.• Use a texture resolution that fits the object on screen.• Use low bit depth textures where possible.• Use lower resolution textures if the texture does not contain sharp detail.• Textures and lighting maps do not have to be the same size on page 13-4.• Reduce the number of textures on page 13-4.
13.2.1 Ensure textures are not too large
Ensure your textures are not too large by using the minimum resolution and color depth required to create the effect you want.
If textures are too large they use more memory bandwidth, produce lower quality images and are not cache friendly.
Note If your application requires large textures, ensure you use mipmapping and texture compression to reduce bandwidth usage. See Use mipmapping on page 13-5, and Use texture compression on page 13-6.
13.2.2 Use a texture resolution that fits the object on screen
Use a texture resolution that is appropriate to the size of the object as it appears on screen. If the object is small on screen, you can use a small texture. For example if the object only takes up 100 by 100 pixels when it appears on screen, you do not require a texture any larger than 100 by 100 pixels.
Note If the texture is displayed in a 1:1 pixel precise manner, image filtering or mipmaps are not necessary. Disable these to save memory and bandwidth.
13.2.3 Use low bit depth textures where possible
It is sometimes possible to use low bit depth textures with little or no visible loss of definition. Experiment with 4-bit or 8-bit per pixel textures to see if they work with your application. If these do not work, try 16-bit formats such as RGB565 or RGBA5551. Only use 32-bit RGBA8888 textures if there is no other option.
Note Do not use 24-bit textures. These are cache unfriendly and can use more bandwidth despite being smaller than 32 bit textures.
13.2.4 Use lower resolution textures if the texture does not contain sharp detail
If the texture does not contain sharp detail try a lower resolution texture.
ARM DUI 0555C Copyright © 2011, 2013 ARM. All rights reserved. 13-3ID102813 Non-Confidential

Bandwidth Optimizations
If the texture contains a small section of high detail you might be able to use a standard resolution texture for the high detail part and a low resolution texture for the rest.
13.2.5 Textures and lighting maps do not have to be the same size
Different textures are used for different purposes. These are not required to be the same resolution even if they are on the same object. Consider each texture individually and use the lowest resolution and bit depth required to get the effect you want.
13.2.6 Reduce the number of textures
If you are using multiple textures see if you can achieve the same result with fewer textures.
For example, consider if the effect can be pre-baked onto another texture.
ARM DUI 0555C Copyright © 2011, 2013 ARM. All rights reserved. 13-4ID102813 Non-Confidential

Bandwidth Optimizations
13.3 Use mipmappingMipmapping is a technique that potentially provides very large performance gains. Mipmapping has a number of potential benefits:• Reduces memory bandwidth usage.• Increases texture cacheability.• Increases image quality.
When your application draws an object on screen, the image drawn can be at very different sizes depending on the distance from the camera. It can range from filling the screen to being a small object in the distance.
If a single texture is used, the density that the texture is sampled at, or texture sampling density, is only correct when the object drawn is similar to the size of the texture. If the object size and the texture size do not match, the texture sampling density is incorrect. This produces artifacts that reduce image quality.
Mipmapping gets around this problem by taking a high resolution texture and scaling it to multiple smaller sizes known as mipmap levels. This requires about 33% more memory than a non-mipmapped texture. An image with a number of mipmap levels is shown in Figure 13-1.
Figure 13-1 Image with mipmap levels
When an object is drawn with mipmapping enabled, the texture with the closest size to the object is used. This means the object always has a texture of a matching size to take samples from and the texture sampling density is therefore correct. This reduces image artifacts and produces a higher quality image.
If the texture sampling density is correct, the texels that are sampled are close to one another in memory making the texture data more cacheable. Increased cacheability reduces memory bandwidth usage and increases performance.
You can instruct the Mali GPU driver to generate mipmaps at runtime or you can pre-generate the mipmaps with the Mali GPU Texture Compression Tool. You can download this from the Mali Developer Center, http://malideveloper.arm.com.
You can generate mipmaps from uncompressed textures in OpenGL ES at runtime with the following function call:
glGenerateMipmap()
ARM DUI 0555C Copyright © 2011, 2013 ARM. All rights reserved. 13-5ID102813 Non-Confidential

Bandwidth Optimizations
13.4 Use texture compressionThis section describes texture compression. It contains the following sections:• About texture compression.• Suitability of textures for texture compression on page 13-7.• Using ETC1 with transparency on page 13-7.
13.4.1 About texture compression
Texture compression reduces the size of textures in memory. Texture compression:• Increases performance.• Reduces memory bandwidth usage.• Increases texture cacheability.
The Mali GPU drivers support Ericsson Texture Compression (ETC1). This is widely used with OpenGL ES versions 1.1 and 2.0. ETC1 compression removes data so it is described as lossy. There can be a reduction in image quality compared to uncompressed textures. ETC1 texture compression provides a compression ratio of 4:1 compared to RGB565.
You can compress images with the Mali GPU Texture Compression Tool. The tool provides before and after compressed images so that you can compare the changes. It also provides an image that shows the difference between the compressed and uncompressed images.
You can download the Mali GPU Texture Compression Tool from the Mali Developer Center, http://malideveloper.arm.com.
Figure 13-2 shows the Mali GPU Texture Compression Tool.
Figure 13-2 Mali GPU Texture Compression Tool
ARM DUI 0555C Copyright © 2011, 2013 ARM. All rights reserved. 13-6ID102813 Non-Confidential

Bandwidth Optimizations
13.4.2 Suitability of textures for texture compression
Texture compression works well with some content. It provides compression with no noticeable image changes in some cases, but in others the differences are very noticeable.
Texture compression typically works for:• Photographic content.• Diffuse maps.• Environment maps.• Specular maps.
Texture compression typically does not usually work well for:• Normal maps.• Fonts.• Gradients between different hues.
Note These are only guidelines. Experiment with your content to see if compression provides acceptable results.
13.4.3 Using ETC1 with transparency
ETC1 does not directly support texture compression on images with transparency because it does not support the alpha channel in images.
There are a number of techniques that enable you to use ETC1 texture compression with transparency by breaking the color and transparency information apart and storing them in a texture atlas or as separate textures.
Figure 13-3 shows the color and transparency combined in a texture atlas.
Figure 13-3 Textures combined from texture atlas to create texture with transparency
Figure 13-4 shows the color and transparency stored as individual textures.
Figure 13-4 Separate textures combined to create texture with transparency
For more information about these methods and examples, see the Mali Developer Center, http://malideveloper.arm.com/.
ARM DUI 0555C Copyright © 2011, 2013 ARM. All rights reserved. 13-7ID102813 Non-Confidential
Bandwidth Optimizations
13.5 Only use trilinear filtering if necessaryTrilinear filtering is useful to avoid artifacts on large flat surfaces that extend away from the viewer. For example floors, walls and airport runways.
Trilinear filtering has a large bandwidth cost, so avoid using it unless it makes a significant visual difference.
Trilinear filtering is likely to have very little visual impact if your application runs on a small screen. If this is the case consider if it is worth the extra computations and bandwidth.
Note If your application is bandwidth bound, disabling trilinear filtering is a useful performance-quality trade-off.
ARM DUI 0555C Copyright © 2011, 2013 ARM. All rights reserved. 13-8ID102813 Non-Confidential

Bandwidth Optimizations
13.6 Reduce bandwidth by avoiding overdrawOverdraw involves drawing fragments to the same pixel more than one time. If the front fragments obscure the fragments behind drawing them wastes compute power.
Drawing fragments uses bandwidth so reducing overdraw reduces bandwidth usage.
See Avoid overdraw on page 12-2.
ARM DUI 0555C Copyright © 2011, 2013 ARM. All rights reserved. 13-9ID102813 Non-Confidential

Bandwidth Optimizations
13.7 Reduce drawing surfaces with cullingYou can reduce the number of surfaces drawn on by culling triangles. This reduces the number of triangles processed and reduces overdraw.
See Use culling on page 11-3.
ARM DUI 0555C Copyright © 2011, 2013 ARM. All rights reserved. 13-10ID102813 Non-Confidential

Bandwidth Optimizations
13.8 Reduce bandwidth by utilizing level of detailLOD is a family of techniques that lower the resolution of geometry and textures for objects as they move away from the camera. These techniques reduce bandwidth usage.
For more information, see Use level of detail on page 11-6.
ARM DUI 0555C Copyright © 2011, 2013 ARM. All rights reserved. 13-11ID102813 Non-Confidential

Chapter 14 Miscellaneous Optimizations
This section describes optimizations that do not fit in the other chapters. It contains the following sections:• Use approximations on page 14-2.• Check the display settings on page 14-5.• Use VSYNC on page 14-8.• Make use of under-used resources on page 14-11.
ARM DUI 0555C Copyright © 2011, 2013 ARM. All rights reserved. 14-1ID102813 Non-Confidential

Miscellaneous Optimizations
14.1 Use approximationsThis section describes how to use approximations to improve performance. It contains the following sections:• General methods of approximation.• Technique specific methods of approximation.
Many desktop applications use special effects to create high quality images. High quality effects require a lot of computations.
One method of optimizing is to use approximations in these effects. This involves using faster techniques that create a similar, but not identical effect.
14.1.1 General methods of approximation
The following is a list of general methods of approximation that you can use:
Use compute power where it has the greatest visual impact Some effects are subtle and might be hardly visible on a mobile device. Make the best use of the available resources by using compute power on effects that have the most visible impact.
Simplify effects You can optimize by removing or simplifying elaborate effects. Try changing complex effects to simpler effects that give a similar result.
Graphics are rarely required to be correct The human visual system often does not notice errors so graphics are typically not required to be precise for all applications. Lighting can also be inaccurate and shadows can be inaccurate or completely missing.You might be able to use more approximate, simpler computations that reduce correctness to achieve increased performance.
Simplify equations Some shaders use complex equations. Try to use simpler, less compute intensive equations to achieve a similar effect.
Consider different algorithms You can sometimes get large performance increases by changing to more efficient algorithms. Try different algorithms to see how they perform.
14.1.2 Technique specific methods of approximation
The following is a list of some of the technique specific methods of approximation:
Shadows You can use projection shadows to generate soft shadows.
Lighting Save computations by using fewer lights or by reducing the distance they are visible from.
Blur For blur effects, take a low resolution texture and blur it. This is faster and uses less memory bandwidth than blurring a higher resolution texture.You can also use blur effects such as depth of field to enable you to use lower resolution textures.
ARM DUI 0555C Copyright © 2011, 2013 ARM. All rights reserved. 14-2ID102813 Non-Confidential

Miscellaneous Optimizations
Figure 14-1 on page 14-3 shows depth of field in an application. The road detail is sharp in the foreground but becomes blurred further away from the camera.
Figure 14-1 Depth of field
Glow Create a series of transparent white triangles around the object. Fade from fully opaque beside the object to fully transparent at the edge.
Reflections There are graphics techniques that generate reflections with relatively little cost but impose limitations. Consider if you can work within the limitations and so use these techniques.Figure 14-2 on page 14-4 shows a scene with reflections. These reflections are generated by drawing the geometry of the chess pieces upside down. This technique uses no extra geometry memory but can only be used with flat mirrored surfaces.
ARM DUI 0555C Copyright © 2011, 2013 ARM. All rights reserved. 14-3ID102813 Non-Confidential

Miscellaneous Optimizations
Figure 14-2 Scene with reflections
ARM DUI 0555C Copyright © 2011, 2013 ARM. All rights reserved. 14-4ID102813 Non-Confidential
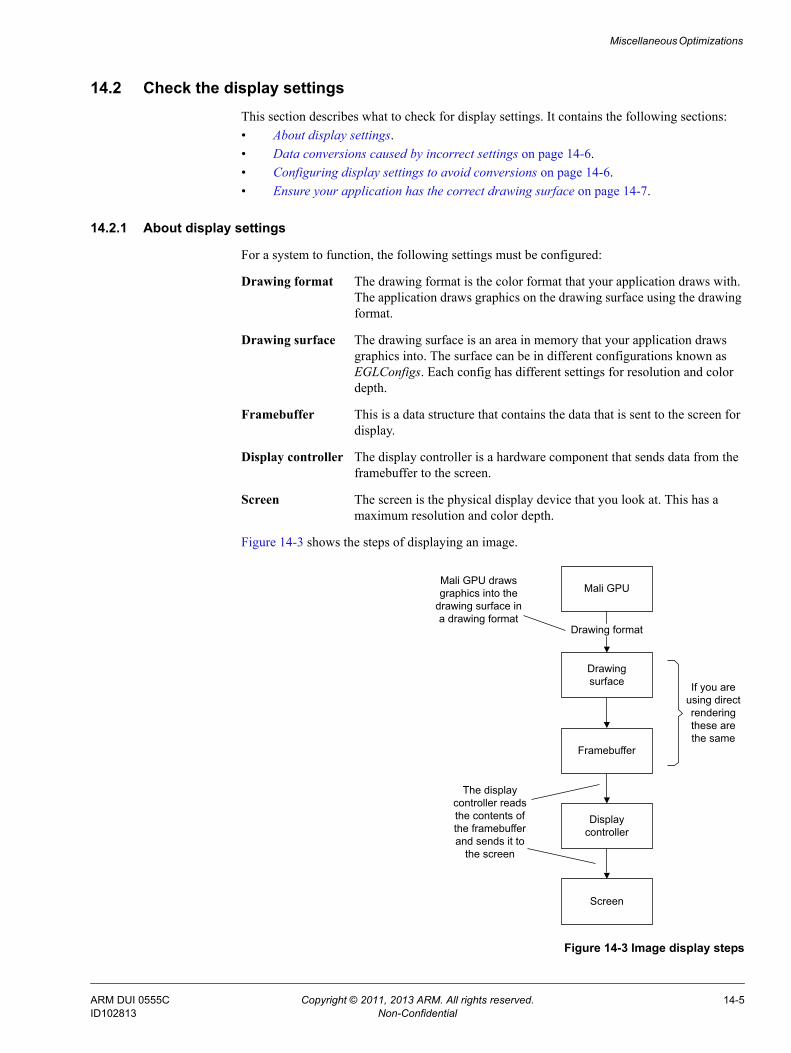
Miscellaneous Optimizations
14.2 Check the display settingsThis section describes what to check for display settings. It contains the following sections:• About display settings.• Data conversions caused by incorrect settings on page 14-6.• Configuring display settings to avoid conversions on page 14-6.• Ensure your application has the correct drawing surface on page 14-7.
14.2.1 About display settings
For a system to function, the following settings must be configured:
Drawing format The drawing format is the color format that your application draws with. The application draws graphics on the drawing surface using the drawing format.
Drawing surface The drawing surface is an area in memory that your application draws graphics into. The surface can be in different configurations known as EGLConfigs. Each config has different settings for resolution and color depth.
Framebuffer This is a data structure that contains the data that is sent to the screen for display.
Display controller The display controller is a hardware component that sends data from the framebuffer to the screen.
Screen The screen is the physical display device that you look at. This has a maximum resolution and color depth.
Figure 14-3 shows the steps of displaying an image.
Figure 14-3 Image display steps
Displaycontroller
Drawing format
Drawingsurface
Framebuffer
Screen
Mali GPUMali GPU draws graphics into the
drawing surface in a drawing format
The display controller reads the contents of the framebuffer and sends it to
the screen
If you are using direct rendering these are the same
ARM DUI 0555C Copyright © 2011, 2013 ARM. All rights reserved. 14-5ID102813 Non-Confidential

Miscellaneous Optimizations
14.2.2 Data conversions caused by incorrect settings
This section describes the data conversions caused by incorrect settings and the resources they require. It contains the following sections:• Types of conversions.• Resources used by conversions.
Types of conversions
The following types of data conversions can be triggered by incorrect settings:
Color format conversion Color format conversion happens when one format does not match another. This can happen if:• The drawing surface format does not match the framebuffer format• The framebuffer and screen do not match.
Image scaling Drawing to a different resolution from the screen might cause the surface to be scaled to the correct resolution.
Note This can be useful on high definition displays if your application cannot
produce a high frame rate. Produce a lower resolution frame and let the system scale it to full resolution.
Memory copies Memory copies or blitting happen when data is moved. Color format conversions and image scaling can also trigger blitting. To avoid this, use direct rendering. See Use direct rendering if possible on page 2-3.
Resources used by conversions
Data conversion operations require resources that include:• Compute resources on the GPU or application processor.• Memory.• Memory bandwidth.
Resources used for conversions cannot be used by applications so this can have a negative impact on the performance of your application.
14.2.3 Configuring display settings to avoid conversions
Data conversions are not necessary if the system and your applications have correct and compatible settings. Ensure the following:
Ensure the framebuffer resolution and color format are compatible with the display controller
The display controller might be able to display different formats and resolutions. If the framebuffer is not in a resolution and format that is compatible, a color format conversion is performed.
The following advice applies to platforms that use Linux FBDEV:
Ensure the framebuffer does not exceed the resolution of the screen Trying to display something larger than the resolution of the screen shall result in the image being rescaled or not being shown correctly.
ARM DUI 0555C Copyright © 2011, 2013 ARM. All rights reserved. 14-6ID102813 Non-Confidential

Miscellaneous Optimizations
Ensure the framebuffer does not exceed the color depth of the screen If the screen has a 16-bit color depth, using a 32-bit color framebuffer results in the display being drawn incorrectly or a color format conversion.Converting between 32 and 16 color depths can be a very expensive process. It is typically done by the GPU, but in some cases it must be performed by the application processor. This reduces valuable compute resources.Using a 16-bit display uses less memory and bandwidth than a 32-bit display. If however your system is limited to a 32-bit display, do not use a 16-bit framebuffer to save memory. Converting 16-bit data to 32-bit data can be an expensive process.
Ensure the drawing surface format is the same as the framebuffer format If the drawing surface format is different from the framebuffer format, a conversion is required to display it.
Note If you are using double or triple buffering, there are multiple framebuffers in memory but only one is displayed at a time.
14.2.4 Ensure your application has the correct drawing surface
When your application requests a drawing surface it might not get the type of surface it requested. This means you might get a higher color depth than you requested. To avoid getting the wrong surface, check potential surfaces as they are returned and only accept the correct one.
For example, if you request a RGB565 surface you are presented with a list of EGLConfigs. If you pick the first config it might be an RGBA8888 surface. This is obviously not the surface you want. If you iterate through the configs returned you can select the RGB565 format directly and avoid the incorrect formats.
For example code that shows how to sort through EGLConfigs, see the Mali Developer Center, http://malideveloper.arm.com/.
ARM DUI 0555C Copyright © 2011, 2013 ARM. All rights reserved. 14-7ID102813 Non-Confidential

Miscellaneous Optimizations
14.3 Use VSYNCThis section describes Vertical Synchronization (VSYNC) and the issues it can cause. It contains the following sections:• About VSYNC.• Using VSYNC.• Potential issues with VSYNC on page 14-9.• Triple buffering on page 14-10.
14.3.1 About VSYNC
VSYNC synchronizes the frame rate of your application with the screen display rate.
VSYNC is a useful technique because it improves image quality by removing tearing. It also prevents the application producing frames faster than the screen can display them. You can use this to save power.
Note Ensure you deactivate VSYNC before doing any other optimizations. If VSYNC is enabled frame rate measurements are likely to be incorrect and can lead you to applying incorrect optimizations.
14.3.2 Using VSYNC
To use VSYNC, optimize your application for the highest possible frame rate. The aim is to have the application frame rate significantly higher than the screen display rate.
For example, assume your application produces frames at 40 Frames Per Second (FPS) and the screen display rate is 30 FPS. Figure 14-4 shows that 4 frames are generated for every 3 screen display updates.
Figure 14-4 Screen updates and frame completes
Activating VSYNC locks the application frame rate to 30 FPS. The application generates a frame then stops generating any new graphics until after the frame is displayed. When the frame is displayed on screen the application starts the next frame. This process is shown in Figure 14-5 on page 14-9. Power is saved because the GPU is not active between the end of frame generation and the screen display update.
1 2 3 4 5 6 7
Framegeneration
Screen display updates
Frames complete
Framegeneration
Framegeneration
Framegeneration
Framegeneration
Framegeneration
Framegeneration
Framegeneration
ARM DUI 0555C Copyright © 2011, 2013 ARM. All rights reserved. 14-8ID102813 Non-Confidential

Miscellaneous Optimizations
Figure 14-5 Screen updates and frame completes with VSYNC
14.3.3 Potential issues with VSYNC
VSYNC might not be appropriate for applications that have a highly variable frame rate because it can appear to cause sudden drastic drops in frame rate.
The frame rate drop happens when the time for an application to produce a frame is longer than the time between screen display updates. The frame can then only be displayed at the next screen update. This has the effect of halving the frame rate. This is shown in Figure 14-6.
Figure 14-6 Screen updates and frame completes with VSYNC reducing frame rate
Note Only activate VSYNC as a final step after you have performed any other optimizations. Measure the performance of your application after you activate VSYNC to ensure there are no sudden frame drops.
1 2 3 4 5 6 7
Framegeneration
Screen display updates
Frames complete
Framegeneration
Framegeneration
Framegeneration
Framegeneration
Framegeneration
Saves power because GPU is
not used between frames
1 2 3 4 5 6 7
Framegeneration
Screen display updates
Framegeneration
Framegeneration
Frames complete
ARM DUI 0555C Copyright © 2011, 2013 ARM. All rights reserved. 14-9ID102813 Non-Confidential

Miscellaneous Optimizations
14.3.4 Triple buffering
Triple buffering is a technique that uses three buffers to reduce or avoid the problems VSYNC can cause. The three buffers are:
The back buffer The back buffer holds the image being drawn. When the GPU finishes drawing, the back buffer and middle buffer switch.
The middle buffer The middle buffer holds a completed image until the front buffer is ready to display it. When the current frame finishes displaying, the front buffer and middle buffer switch.
The front buffer The front buffer holds the image currently being displayed.
Using three buffers decouples the drawing process from the display process. This means that a consistent high frame rate is achieved with VSYNC, even if frame drawing takes take longer than the frame display time.
Figure 14-7 Screen updates with triple buffering and VSYNC
Triple buffering with VSYNC is shown in Figure 14-7. The frame generation process takes longer than the frame display, but the display frame rate remains high because the GPU can keep drawing while the middle buffer holds a completed frame. A frame might be dropped occasionally.
Note Triple buffering requires three buffers the same size as the framebuffer. This can be a significant amount of memory if your application is drawing at a high resolution.
1 2 3 4 5 6 7
Drawimage
Screen display updates
Frames complete
Displayframe
Displayframe
Displayframe
Displayframe
Displayframe
Displayframe
Holdframe
Holdframe
Holdframe
Holdframe
Holdframe
Holdframe
Drawimage
Drawimage
Drawimage
DrawimageBack buffer
Middle buffer
Front buffer
ARM DUI 0555C Copyright © 2011, 2013 ARM. All rights reserved. 14-10ID102813 Non-Confidential

Miscellaneous Optimizations
14.4 Make use of under-used resourcesThis section describes how to make use of under-used resources. It contains the following sections:• Use spare resources to increase image quality.• Use spare resources to save power.• Move operations from the fragment processing stage to the vertex processing stage.• Move operations from the vertex processing stage to the fragment processing stage.• Move operations from the application processor to the vertex processing stage on
page 14-12.
If a resource is under-used consider moving computations to it. To determine if you have under used resources you must analyze the performance of your application. For more information, see Chapter 3 The Optimization Process.
14.4.1 Use spare resources to increase image quality
If your application is performing well you can use spare resources to improve image quality by for example, adding additional effects.
14.4.2 Use spare resources to save power
You can opt not to use spare resources. Not using spare resources saves power because the GPU can switch off when there is no work to do.
Note This is a useful technique to use in mobile devices where there is a limited battery life.
14.4.3 Move operations from the fragment processing stage to the vertex processing stage
In many applications the vertex processing stage is under-used. If your application is fragment processing bound, it might be possible to move some of these computations to the vertex processing stage.
For example, you can move some types of pixel shading computations to the vertex processing stage by using varyings. Varyings are computed per vertex and are interpolated across a triangle. This requires less computations than computing values per pixel but produces lower visual quality for some effects. The quality difference can be relatively small so consider if per pixel operations are worth the additional computations.
A compromise is to split calculations across processing stages. You can use the vertex processing stage to output varyings and compute per pixel differences in the fragment processing stage.
14.4.4 Move operations from the vertex processing stage to the fragment processing stage
If your application is vertex processing bound and it uses a lot of geometry for detail, then you might be able to reduce it using techniques that make surfaces appear more detailed than they really are. For example, normal maps are textures that represent surface normals. Shader programs can use normal maps to give the impression of more surface detail without increasing the number of triangles.
See Use normal maps to simulate fine geometry on page 11-5.
ARM DUI 0555C Copyright © 2011, 2013 ARM. All rights reserved. 14-11ID102813 Non-Confidential

Miscellaneous Optimizations
14.4.5 Move operations from the application processor to the vertex processing stage
You can use the vertex processing stage to compute animations. Figure 14-8 shows a frame from a demo where the plant is animated with a vertex shader.
Figure 14-8 Animated plant
ARM DUI 0555C Copyright © 2011, 2013 ARM. All rights reserved. 14-12ID102813 Non-Confidential

Appendix A Utgard Architecture Performance Counters
This appendix lists the performance counters for Utgard architecture Mali GPUs. It contains the following sections:• Vertex processor performance counters on page A-2.• Fragment processor performance counters on page A-4.
ARM DUI 0555C Copyright © 2011, 2013 ARM. All rights reserved. A-1ID102813 Non-Confidential

Utgard Architecture Performance Counters
A.1 Vertex processor performance countersTable A-1 lists Mali GPU performance counters that monitor the vertex processor.
Table A-1 Vertex processor performance counters
Counter Name Description
Active cycles Number of cycles per frame the vertex processor was active.
Active cycles, bounding box and command generator
Number of active cycles per frame spent by the vertex processor Polygon List Builder Unit setting up bounding boxes and commands. This is mainly graphics primitives. This includes time spent waiting on the bus.
Active cycles, PLBU command processor
Number of cycles per frame the vertex processor PLBU command processor was active including time waiting for semaphores.
Active cycles, PLBU geometry processing
Number of cycles per frame the vertex processor PLBU was active, excepting final data output. This is the number of active cycles through the prepare list commands. This includes time spent waiting on the bus.
Active cycles, PLBU primitive assembly
Number of active cycles per frame spent by the vertex processor PLBU doing primitive assembly. This does not include scissoring or final output. This does include time spent waiting on the bus.
Active cycles, PLBU tile iterator Number of active cycles per frame spent by the vertex processor PLBU iterating over the tiles in the bounding box generating commands, this is mainly because of graphics primitives. This includes time spent waiting on the bus.
Active cycles, PLBU vertex fetcher
Number of active cycles per frame spent by the vertex processor PLBU fetching vertex data. This includes time spent waiting on the bus.
Active cycles, scissor tile iterator Number of active cycles per frame spent by the vertex processor PLBU iterating over tiles to perform scissoring. This includes time spent waiting on the bus.
Active cycles, vertex loader Number of cycles per frame the vertex loader unit was active.
Active cycles, vertex shader Number of cycles per frame the vertex shader unit was active.
Active cycles, vertex shader command processor
Number of cycles per frame the vertex shader command processor was active. This includes time waiting for semaphores.
Active cycles, vertex storer Number of cycles per frame the vertex storer unit was active.
Commands written to tiles Number of commands written by vertex processor to the fragment processor input data structure per frame.These commands are eight bytes, mainly primitives.
Cycles vertex loader waiting for vertex shader
Number of cycles per frame the vertex loader was idle while waiting on the vertex shader.
Mali GP2 PLBU cycles per frame Number of cycles per frame the vertex processor PLBU output unit was active writing the fragment processor input data structure including time spent waiting on the bus.
Memory blocks allocated Number of overflow data blocks required for outputting the fragment processor input data structure per frame.
Primitives culled Number of graphics primitives culled per frame because they were seen from the back or because they were out of out of the frustum.
Primitives fetched Number of graphics primitives fetched by the vertex processor per frame.
Read bursts, system bus Number of read bursts by the vertex processor from the system bus per frame.
Vertex loader cache misses Number of cache misses in the vertex input unit of the vertex shader per frame.
ARM DUI 0555C Copyright © 2011, 2013 ARM. All rights reserved. A-2ID102813 Non-Confidential

Utgard Architecture Performance Counters
Vertices fetched Number of vertices fetched by the vertex processor per frame.
Vertices processed Number of vertices processed by the vertex processor per frame.
Words read, system bus Total number of 64-bit words read by the vertex processor from the system bus per frame.
Words written, system bus Total number of 64-bit words written by the vertex processor to the system bus per frame.
Write bursts, system bus Number of write bursts from the vertex processor to the system bus per frame.
Table A-1 Vertex processor performance counters (continued)
Counter Name Description
ARM DUI 0555C Copyright © 2011, 2013 ARM. All rights reserved. A-3ID102813 Non-Confidential

Utgard Architecture Performance Counters
A.2 Fragment processor performance countersTable A-2 lists Mali GPU performance counters that monitor the fragment processor.
Table A-2 Fragment processor performance counters
Counter Name Description
Active clock cycles count The number of clock cycles that were active between polygon start and IRQ.
Bus read request cycles count Number of cycles the bus read request signal was HIGH.
Bus write request cycles count Number of cycles of the bus write request signal was HIGH.
Bus read transactions count Number of read requests accepted by the bus.
Bus write transactions count Number of write requests accepted by the bus.
Compressed texture cache compressed hit count
Number of texture cache hits for compressed textures.
Compressed texture cache compressed miss count
Number of texture cache misses for compressed textures.
Fragments passed z-stencil count Number of fragments passing Z and stencil test.
Fragment rasterized count Number of fragment rasterized. Fragments/(Quads x 4) gives the average actual fragments per quad.
Fragments rejected fragment-kill count Number of fragments exiting the fragment shader as killed.
Fragments rejected fwd-fragment-kill count
Number of fragments killed by forward fragment kill.
Instruction completed count Number of fragment shader instruction words completed. This is a function of fragments processed and the length of the shader programs.The formula for instruction completed count is:(Number of Quads) x (Number of pixels in a quad) x (instructions in the shader).
Instruction failed load-miss count Number of fragment shader instructions not completed because of failed load operation.
Instruction failed store-miss count Number of fragment shader instructions not completed because of failed store operation.
Instruction failed texture-miss count Number of fragment shader instructions not completed because of failed texture operation.
Instruction failed tile read-miss count Number of fragment shader instructions not completed because of failed read from the tilebuffer.
Instruction failed varying-miss count Number of fragment shader instructions not completed because of failed varying operation.
Lines count Number of lines read from the polygon list.
Load unit reads Number of 64-bit words read from the bus by the LOAD sub-instruction.
Load/Store cache hit count Number of hits in the load/store cache.
Load/Store cache miss count Number of misses in the load/store cache.
Patches evaluated Number of patches evaluated for EarlyZ rejection.
Patches rejected early z/stencil count Number of patches rejected by EarlyZ. A patch can be 8x8, 4x4 or 2x2 fragments.
Pipeline bubbles cycle count Number of unused cycles in the fragment shader while rendering is active.
Pixel rectangle count Number of pixel rectangles read from the polygon list.
ARM DUI 0555C Copyright © 2011, 2013 ARM. All rights reserved. A-4ID102813 Non-Confidential

Utgard Architecture Performance Counters
Points count Number of points read from the polygon list.
Polygon count Number of triangles read from the polygon list.
Polygon list reads Number of 64-bit words read from the bus by the Polygon list reader.
Program cache hit count Number of hits in the program cache.
Program cache miss count Number of misses in the program cache.
Program cache reads Number of 64-bit words read from the bus into the fragment shader program cache.
Quad rasterized count Number of 2x2 quads output from the rasterizer.
RSW reads Number of 64-bit words read from the bus into the Render State Word register.
Stall cycles PolygonListReader Number of clock cycles Polygon List Reader waited for output being collected.
Stall cycles triangle setup Number of clock cycles TSC waits for input.
Store unit writes Number of 64-bit words written to the bus.
Texture cache conflict miss count Number of times a requested texel was not in the cache and its value, retrieved from memory, must overwrite an older cache entry. This happens when an access pattern cannot be serviced by the cache.
Texture cache hit count Number of times a requested texel was found in the texture cache.
Texture cache miss count Number of times a requested texel was not found in the texture cache.
Texture cache uncompressed reads Number of 64-bit words read from the bus into the uncompressed textures cache.
Texture descriptor remapping reads Number of 64-bit words read from the bus when reading from the texture descriptor remapping table.
Texture descriptors reads Number of 64-bit words containing texture descriptors read from the bus.
Texture mapper cycle count Number of texture operation cycles.
Texture mapper multipass count Number of texture operations looped because more texture passes are required.
Tile write-back writes Number of 64-bit words written to the bus by the write-back unit.
Total bus reads Total number of 64-bit words read from the bus.
Total bus writes Total number of 64-bit words written to the bus.
Uniform remapping reads Number of 64-bit words read from the bus when reading from the uniform remapping table.
Varying cache conflict miss count Number of times a requested varying was not in the cache and its value, retrieved from memory, must overwrite an older cache entry. This happens when an access pattern cannot be serviced by the cache.
Varying cache hit count Number of times a requested varying was found in the cache.
Varying cache miss count Number of times a requested varying was not found in the cache.
Varying reads Number of 64-bit words containing varyings generated by the vertex processor, read from the bus.
Table A-2 Fragment processor performance counters (continued)
Counter Name Description
ARM DUI 0555C Copyright © 2011, 2013 ARM. All rights reserved. A-5ID102813 Non-Confidential
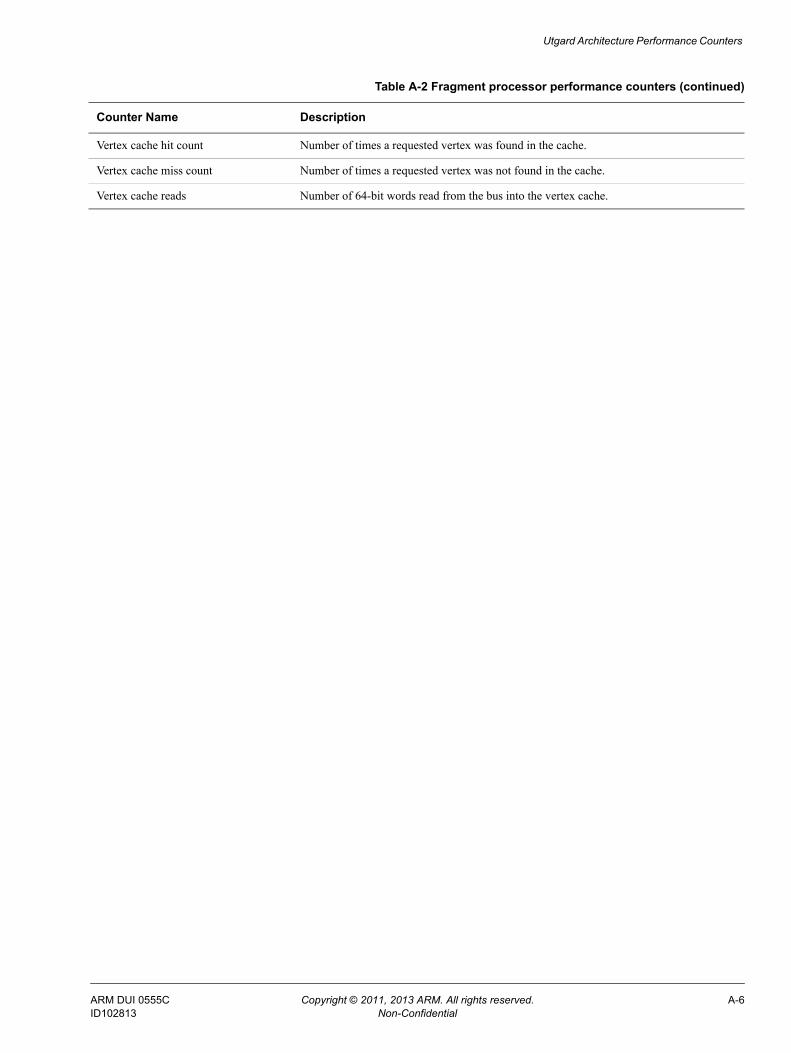
Utgard Architecture Performance Counters
Vertex cache hit count Number of times a requested vertex was found in the cache.
Vertex cache miss count Number of times a requested vertex was not found in the cache.
Vertex cache reads Number of 64-bit words read from the bus into the vertex cache.
Table A-2 Fragment processor performance counters (continued)
Counter Name Description
ARM DUI 0555C Copyright © 2011, 2013 ARM. All rights reserved. A-6ID102813 Non-Confidential

Appendix B Midgard Architecture Performance Counters
This appendix lists the performance counters for Midgard architecture Mali GPUs.
Table B-1 lists the Midgard architecture Mali GPU performance counters.
Table B-1 Midgard architecture Mali GPU performance counters
Counter Name Description
Mali Job Manager Cycles
GPU cycles Number of cycles the GPU was active
IRQ cycles Number of cycles the GPU had a pending interrupt
JS0 cycles Number of cycles JS0 (fragment) was active
JS1 cycles Number of cycles JS1 (vertex/tiler/compute) was active
JS2 cycles Number of cycles JS2 (compute) was active
Mali Job Manager Work
JS0 jobs Number of Jobs (fragment) completed in JS0
JS0 tasks Number of Tasks completed in JS0
JS1 jobs Number of Jobs (vertex/tiler/compute) completed in JS1
JS1 tasks Number of Tasks completed in JS1
JS2 jobs Number of Jobs (compute) completed in JS2
JS2 tasks Number of Tasks completed in JS2
ARM DUI 0555C Copyright © 2011, 2013 ARM. All rights reserved. B-1ID102813 Non-Confidential

Midgard Architecture Performance Counters
Mali Core Cycles
Tripipe cycles Number of cycles the Tripipe was active
Fragment cycles Number of cycles fragment processing was active
Compute cycles Number of cycles vertex\compute processing was active
Fragment cycles waiting for tile Number of cycles spent waiting for a physical tile buffer
Mali Core Threads
Fragment threads Number of fragment threads started
Dummy fragment threads Number of dummy fragment threads started
Compute threads Number of vertex\compute threads started
Frag threads doing late ZS Number of threads doing late ZS test
Frag threads killed late ZS Number of threads killed by late ZS test
Mali Fragment Primitives
Primitives loaded Number of primitives loaded from tiler
Primitives dropped Number of primitives dropped because out of tile
Mali Fragment Quads
Quads rasterized Number of quads rasterized
Quads doing early ZS Number of quads doing early ZS test
Quads killed early Z Number of quads killed by early ZS test
Mali Fragment Tasks
Tiles rendered Number of tiles rendered
Tile writes killed by TE Number of tile writes skipped by transaction elimination
Mali Arithmetic Pipe
A instructions Number of instructions completed by the A-pipe (normalized per pipeline)
Mali Load/Store Pipe
LS instructions Number of instructions completed by the LS-pipe
LS instruction issues Number of instructions issued to the LS-pipe, including restarts
Mali Texture Pipe
T instructions Number of instructions completed by the T-pipe
T instruction issues Number of instructions issued to the T-pipe, including restarts
Cache misses Number of instructions in the T-pipe, recirculated because of cache miss
Mali Load/Store Cache
Read hits Number of read hits in the Load/Store cache
Read misses Number of read misses in the Load/Store cache
Table B-1 Midgard architecture Mali GPU performance counters (continued)
Counter Name Description
ARM DUI 0555C Copyright © 2011, 2013 ARM. All rights reserved. B-2ID102813 Non-Confidential

Midgard Architecture Performance Counters
Write hits Number of write hits in the Load/Store cache
Write misses Number of write misses in the Load/Store cache
Atomic hits Number of atomic hits in the Load/Store cache
Atomic misses Number of atomic misses in the Load/Store cache
Line fetches Number of line fetches in the Load/Store cache
Dirty line evictions Number of dirty line evictions in the Load/Store cache
Snoops in to LSC Number of coherent memory snoops in to the Load/Store cache
Mali L2 Cache
External write beats Number of external bus write beats
External read beats Number of external bus read beats
Cache read hits Number of reads hitting in the L2 cache
Write hits Number of writes hitting in the L2 cache
Write snoops Number of write transaction snoops
Read snoops Number of read transaction snoops
External bus stalls (AR) Number of cycles a valid read address (AR) is stalled by the external interconnect
External bus stalls (W) Number of cycles a valid write data (W channel) is stalled by the external interconnect
Table B-1 Midgard architecture Mali GPU performance counters (continued)
Counter Name Description
ARM DUI 0555C Copyright © 2011, 2013 ARM. All rights reserved. B-3ID102813 Non-Confidential