armenia, georgia, kyrgyz republic, moldova, and … · · 2001-03-07income cis countries since...
TRANSCRIPT

INTERNATIONAL MONETARY FUND AND WORLD BANK
Armenia, Georgia, Kyrgyz Republic, Moldova, and Tajikistan:
External Debt and Fiscal Sustainability
Jointly Prepared by the European II Department of the IMF and the Europe and Central Asia Region of the World Bank
(In consultation with other departments)
Approved by John Odling-Smee and Johannes Linn
February 7, 2001
Contents Page
I. Introduction.................................................................................................................. 3 II. Background .................................................................................................................. 3 A. Debt and Debt-Service Indicators .......................................................................... 3 B. The Genesis of the Debt Problem .......................................................................... 9 III. External Debt and Fiscal Sustainability..................................................................... 17 A. Scenario One ......................................................................................................... 18 B. Scenario Two......................................................................................................... 22 C. Sensitivity Analyses .............................................................................................. 23 D. Impact on Poverty and Social Services................................................................. 26 E. Conclusions ........................................................................................................... 29 IV. Issues for Consideration............................................................................................. 31 Figures 1. Total Government and Government-Guaranteed External Debt as Share of GDP ..... 5 2. Nominal Government and Government-Guaranteed Debt as a Share of Total External Debt, End-1999 ........................................................................................... 5 3. Composition of Government and Government-Guaranteed Debt ............................... 8 4. Index of Policy Reform.............................................................................................. 12 5. Nominal Exchange Rate Movements vs. U. S. Dollar............................................... 14 6. Nominal Exchange Rate Movements vs. Ruble ........................................................ 16 7. Real Effective Exchange Rates.................................................................................. 16 8. Average Primary Fiscal Balances in 2001�05 ........................................................... 30

- 2 -
Text Boxes 1. Energy Sector Issues .................................................................................................. 10 2. Was the Growth of External Debt Foreseen? ............................................................ 15 3. Impact of Devaluation on Debt Ratios....................................................................... 23 Tables 1. Structure of External Debt, end-1999 .......................................................................... 6 2. Debt Service Ratios in 1999 ........................................................................................ 7 3. Decomposition of Factors Contributing to Growth of External Debt........................ 17 4. Assumed Adjustment under Scenario One ................................................................ 20 5. Debt and Debt-Service Ratios under Scenarios One and Two .................................. 21 6. Stress Testing for Harder Borrowing Terms.............................................................. 25 7. Stock of Domestic Debt as of December 31, 1999.................................................... 25 8. Poverty Levels and GNP Per Capita.......................................................................... 27 9. Per Capita General Government Social Expenditures ............................................... 28 10. Fiscal Adjustment Assumed under Scenario One...................................................... 31 Statistical Appendix 1. Armenia ..................................................................................................................... 33 2. Georgia ..................................................................................................................... 35 3. The Kyrgyz Republic................................................................................................. 37 4. Moldova ..................................................................................................................... 39 5. Tajikistan.................................................................................................................... 41

- 3 -
I. INTRODUCTION
1. In recent Board discussions, a number of Executive Directors have expressed concerns about the large government and government-guaranteed debt incurred by low income CIS countries since 1991. Directors have questioned if: (i) the financial assistance provided to them is on appropriate terms; (ii) they can service this debt in view of their financial difficulties, and especially since the Russian crisis; and (iii) the debt service is crowding out social and other important government expenditures. Directors have also been concerned about the large share of financing provided by the IFIs to these countries, and the weight of multilateral creditors in the structure of their external debt.
2. This paper examines the debt situation in the five CIS countries that are eligible for PRGF and IDA only, namely Armenia, Georgia, the Kyrgyz Republic, Moldova, and Tajikistan. Section II of the paper describes the size and composition of the debt and the key factors that have led to its rapid accumulation in recent years.1 An analysis of the medium-term sustainability of this debt is contained in Section III, and Section IV raises issues for consideration by the Boards of the Bank and the Fund. Detailed debt sustainability analyses (DSA) for each country are contained in the accompanying background paper. This paper has been prepared for the information of the two Executive Boards. If the Boards wish, staff will prepare a follow-up paper with policy proposals for addressing the issues raised in this paper for consideration by Executive Directors.
II. BACKGROUND
A. Debt and Debt-Service Indicators
3. The five countries that are the subject of this paper began the transition with little or no external or domestic debt.2 Since then, they have rapidly accumulated external liabilities and some are now facing an increasingly difficult external debt burden, relative to their ability to generate primary external and budget surpluses.
1 This paper focuses on external debt issues. The five countries under review have had little success in developing domestic debt markets. Where they have made some initial progress, these markets have been shallow and volatile, and in all but one country (Armenia) have collapsed in the wake of the 1998 Russian financial crisis. Nevertheless, in some countries domestic debt is relatively large, although it is mostly held by central banks. Nonresident participation in domestic government debt markets has been minimal, although some domestic credit carries government guarantee.
2 Soon after 1991, as agreed with the creditors, Russia offered other CIS countries to take over 100 percent of all official foreign liabilities and assets of the former Soviet Union. With the exception of Georgia, these countries have enacted the so-called �zero option,� and Georgia is expected to do so in the near future.

- 4 -
4. The stock of external government and government-guaranteed debt of Armenia, Georgia, the Kyrgyz Republic, Moldova, and Tajikistan amounted to about $5.7 billion at end-1999. External debt indicators for the five countries are shown in Figure 1 and Table 1. Debt owed or guaranteed by government is mostly concessional and accounts for nearly all of the external debt (Figure 2).3 The combined net present value of this debt amounted to $4.3 billion. In some countries, notably the Kyrgyz Republic and Tajikistan, nonguaranteed debt has also grown rapidly (Figure 2).
5. The net present value (NPV) of future debt-service payments at end-1999�on all external debt including payments on public enterprise and private nonguaranteed debt�was above 150 percent of export earnings for Georgia, the Kyrgyz Republic, and Armenia (Table 2).4,5 For government and government-guaranteed external debt, the NPV of future
3 Unless otherwise stated, sources for all figures and tables are World Bank and IMF staff estimates prepared on the basis of data provided by the national authorities. This paper applies the OECD definition of concessionality or official development assistance (ODA) as carrying a grant element of at least 25 percent. Data and projections are those available in November 2000, and mid-2000 assumptions for international discount and interest rates have been used for evaluating the NPV of debt stocks.
4 For this study, external debt sustainability problems are signaled by ratios of the NPV of future debt service (henceforth referred to as NPV in this paper) to exports of goods and services in excess of 200�220 percent. Fiscal sustainability problems are indicated by ratios of NPV to central government revenue in excess of 250�280 percent. The debt ratios reported here cannot be directly compared with the HIPC thresholds, since these five countries have not rescheduled their bilateral debt on Naples terms, which is a prerequisite for HIPC treatment. After a stock-of-debt operation on Naples terms involving a two-thirds NPV reduction, a threshold of 150 percent for the first indicator is used as a decision-making tool under the enhanced HIPC initiative. Even if this 150 percent ratio is not met for countries that are particularly open to international trade�and have export to GDP ratios above 30 percent and a revenue to GDP ratio of 15 percent or more�an NPV of debt to revenue ratio of 250 percent is taken into consideration as well.
5 This paper concentrates on government and government-guaranteed debt, expanding the analysis to nonguaranteed and public enterprise debt where relevant. It does so because in many CIS countries it is difficult to distinguish between public and private activities. For example, because of the quasi-fiscal nature of energy related debt, this debt has been assumed by the budget in some cases (Georgia and Moldova). However, for external sustainability ratios, both guaranteed and private nonguaranteed debts are included in the calculations at 100 percent of nominal value. Nonguaranteed debt (owed by private and state enterprises) is excluded from the calculations of fiscal sustainability ratios, except as noted above for energy obligations of Moldova and Georgia, while government guaranteed debt is included at 100 percent of nominal value.

- 5 -
Figure 1. Total government and government guaranteed external debt as share of GDP
0
20
40
60
80
100
120
140
1992 1993 1994 1995 1996 1997 1998 1999
perc
ent
A rm enia G eorgia Kyrgyz R epublic M oldova Tajikistan
Figure 2. Nominal government and government-guaranteed debt as a share of total external debt, end-1999
0
500
1000
1500
2000
2500
Armenia Georgia Kyrgyz Rep. Moldova Tajikistan
Mill
ion
US$
0
20
40
60
80
100
percent
Commercial nonguaranteedTotal Gov. & Gov. guaranteedGov. & Gov. guaranteed debt/Total external debt (right scale)

- 6 -
Table 1. Structure of External Debt, end-1999 (In millions of dollars)
Armenia
Georgia
Kyrgyz Rep.
Moldova
Tajikistan
Total
Nominal Figures
Total External liabilities 921 2195 1683 1458 1213 7470 Total government and govt. guaranteed
854 1678 1383 937 887 5739
Multilateral creditors 642 839 934 597 315 3327 World Bank 363 378 355 287 126 1509 IMF 201 319 192 175 100 987 Other multilateral 78 142 387 135 89 831
Bilateral creditors 178 839 449 187 532 2185 Russia 109 179 168 68 288 812 Other FSU 14 415 16 0 162 607 Other Paris Club 48 174 194 102 30 548 Other bilateral 7 71 70 17 52 217
Commercial and Guaranteed debt 34 0 0 153 40 227
Non-Guaranteed Debt 53 42 300 105 326 826 O/w State-owned enterprises 46 0 295 0 289 630
Private non-guaranteed 7 42 5 105 37 196 Memo: Cross-border arrears 1/ 14 475 n.a. 416 n.a. 905
Present Value Terms
Total external liabilities 615 1982 1159 1417 890 6063 Total government and govt. guaranteed
548 1447 852 895 564 4306
Total multilateral debt 372 617 511 574 196 2269 World Bank 160 186 126 230 43 746 IMF 160 255 157 227 74 873 Other multilateral 52 175 228 117 78 651
Total bilateral debt 143 830 341 183 328 1824 Russia 102 157 150 89 112 610 Other FSU 14 444 14 0 126 598 Other Paris Club 26 170 118 83 21 418 Other bilateral 1 59 60 11 61 191
Commercial and Guaranteed Debt 34 0 139 40 213
Non-Guaranteed Debt 53 61 307 105 326 852 O/w State-owned enterprises 46 0 301 0 289 636
Private nonguaranteed debt 7 61 6 105 37 216 Memo: Cross-border arrears 1/ 14 475 n.a. 416 n.a. 905
Sources: Ministries of Finance and Central Banks of the respective countries; IMF and World Bank staff estimates; BIS.
1/ Cross-border arrears are mostly energy-related.

- 7 -
debt service payments would be substantially above 250 percent of central government revenues for all countries but Armenia, where it was about 170 percent. In 1999, the ratios of debt service due to exports remained below 25 percent for all countries except Moldova, which has significant debt on commercial terms.6 Debt service due accounted for over 80 percent of central government revenues in Moldova, and 45 percent in Georgia, but less than 25 percent in the other three countries. In most of these countries actual payments were often less than payments due.
Table 2. Debt Service Ratios in 1999 1/
(In percent)
NPV of External Debt Debt Service in 1999 To Exports To Central Govt.
Revenue To Exports To Central Govt.
Revenue
Armenia 154 168 16 19 Georgia 213 688 13 45 Kyrgyz Republic 188 386 24 24 Moldova 130 365 37 81 Tajikistan 2/ 128 504 5 20
Sources: Authorities of respective countries and IMF staff estimates.
1/ Ratios to exports include debt and debt payments on public enterprise and private nonguaranteed debt, while ratios to central government revenue only cover government and government guaranteed debt. 2/ Export figure excludes alumina and electricity barter transactions. 6. The composition of the government and government-guaranteed external debt as of end-1999 is shown in Figure 3 and Table 1. Both in nominal and in NPV terms, debt owed to multilateral organizations accounted for just over half of the outstanding debt for these countries as a group.7 In NPV terms, the IMF is the largest creditor of this group of countries, followed closely by the World Bank. In nominal terms, the largest multilateral creditor in all five countries was the World Bank, followed by the IMF, except in the Kyrgyz Republic, where the AsDB was the second largest creditor. Bilateral debt�mainly to Russia and Turkmenistan�was a relatively large share of the total in Georgia and Tajikistan. Paris Club countries other than Russia (itself now a member of the Paris Club) accounted for about 10 percent of the total public debt of the five countries. Government-guaranteed debt owed to commercial creditors accounted for a modest share of the total in all countries, except in Moldova, which had placed a large Eurobond.
6 Debt service paid in excess of 25 percent of exports of goods and services is taken to signal a potential cash-flow constraint.
7 Multilateral organizations include the IMF, the World Bank, the Asian Development Bank (AsDB), the European Bank for Reconstruction and Development (EBRD), the European Union (EU), and others.

- 8 -
Figure 3. Composition of government and government guaranteed debt
1/ Except Russia
Face Value terms: $5.7 billion total
Other Paris Club 1/
10%
Other FSU11%
Russia14%
IMF17%
World Bank26%
Other bilateral4%
Other multilateral
14%
Commerical Guaranteed
4%
Present Value terms: $4.3 billion total
Russia14%
IMF21%
Other FSU14%
Other Paris Club 1/
10%
Other bilateral4% World Bank
17%
Commerical Guaranteed
5%
Other multilateral
15%

- 9 -
B. The Genesis of the Debt Problem
7. The transition started with massive shocks to the economies of these countries. All five countries are relatively poor in natural resources, in particular energy, and adjustments of imported energy prices to world levels were equivalent to terms-of-trade shocks of up to15 percent of GDP. In most countries, this shock was combined with a significant loss of fiscal transfers and capital investments from the central Soviet budget and a collapse of the payments system.
8. In the first years of independence these countries also experienced wars, internal conflicts and natural disasters. Armenia, Georgia, and Tajikistan faced prolonged armed conflicts, and Georgia and Moldova lost control over part of their territory. These events diverted substantial resources and political attention from the economic and social agenda, often undermining confidence in economic reforms and discouraging private investment. As recent border clashes in the Kyrgyz Republic and Uzbekistan demonstrate, regional conflicts remain a threat to stability and growth.
9. There was also a rapid accumulation of cross-border enterprise arrears as the inter-republican payments system collapsed in the early 1990s. Initially, faced with highly uncertain prospects for investment and growth, the authorities were reluctant to impose hard-budget constraints on state enterprises, partly due to concerns about the social implications of dramatically higher energy prices and anticipated mass bankruptcies. However, since governments did not have the budgetary resources to subsidize energy consumers directly, payments arrears on energy imports rapidly began to accumulate (Box 1). At that time, the authorities of newly independent countries may have assumed that arrears on energy imports would be written off at a later date.8 This reluctance to impose payments discipline was compounded by the inability or unwillingness of the energy exporters in the region to terminate delivery of gas and energy products to some of these countries, despite their poor payments record. These arrears were later mostly consolidated into inter-governmental debt, which is one of the reasons why Russia and Turkmenistan�the chief energy exporters in the CIS�are major creditors to several of the five countries. This was especially the case in Georgia (gas from Turkmenistan) and Moldova (gas from Russia and electricity from Romania), where energy arrears have continued to accumulate in recent years.
8 During the Soviet era these resource flows had usually been financed either through use of nonmarket prices or through explicit subsidies from the Union budget, neither of which necessitated repayment.

- 10 -
Box 1. Energy Sector Issues
In a number of these countries energy debt accounts for a large share of the total debt, partly because the authorities have used the energy sector to provide an indirect social safety net for their populations and because of the lack of hard budget constraints. The energy sector in these countries often suffers from serious nonpayment and governance problems and has played a key role in the reluctance of these (and other CIS) countries to eliminate the noncash economy. To a large extent, the five countries depend on energy supplies from Russia, Turkmenistan, and, to a lesser extent, Uzbekistan, with no real alternatives available. Coverage ratios (e.g., percent of the population with access to electricity and safe water) and energy use per capita remain significantly higher than in comparable countries. As a result of the poor financial situation in the energy sector in these countries, and with declining public investment in state-owned energy enterprises, the latter�s asset value has eroded and the quality of services has deteriorated. Structural reforms in the energy sectors are now underway in Armenia, Georgia, the Kyrgyz Republic, and Moldova. Georgia and Moldova have opened their electricity sectors (excluding assets in disputed territories) to private participation by selling a significant share of the energy distribution companies to strategic investors, with the participation of the EBRD. In Georgia two hydropower plants have been sold and offers have been invited in both countries for the rest of the distribution and generation companies. In contrast, the process has not gone beyond distribution in the other three countries and no transactions have been concluded. In Moldova, distribution companies covering 70 percent of supply have been sold, and sale of the remainder is currently under negotiation. The reforms that are being pursued aim at moving to full cost recovery, eliminating unfunded energy privileges, encouraging private investment, and improving regulations. Improvements in energy consumption efficiency are also being pursued. These reforms are supported by the World Bank and the IMF, as well as through investment from the EBRD and�in the Kyrgyz Republic and Tajikistan�the AsDB. However, these reforms will need time and considerable resources to bring about significant improvements.
10. Arrears associated with inter-governmental trade agreements accumulated in central banks� correspondent account balances in 1991�93. These claims were in many cases also converted into official government debt, and were rescheduled in late-1993 and subsequently. In several countries, they account for a significant portion of the debt owed to Russia. Both with regard to energy and other arrears, governance problems played a role, as frequently it was not possible to verify the relevant transactions, nor was there a clear assignment of contracts.
11. By the mid-1990s, most of these countries had embarked on Bank and Fund-supported programs aimed at stabilizing and transforming their economies.9 Although 9 This process started first in the Kyrgyz Republic in 1993, while Tajikistan was the last to initiate market reforms, owing to persistent armed conflicts.

- 11 -
budget deficits generally were reduced, they remained large in several cases. Initially, it was hoped that reforms would quickly lead to a pick-up of economic growth and inflows of foreign direct investment. With this in mind, the international community provided support not only to give time to the authorities to strengthen domestic revenue performance, but also to finance public investment programs. However, the implementation of planned reforms proved to be more difficult than expected, and policy slippages contributed to slower adjustment and higher fiscal deficits than had been programmed. As a result, neither the investment climate nor domestic revenues improved as anticipated. A significant share of budget deficits continued to be financed by external credit, resulting in the rapid accumulation of official external debt, especially after 1996. 10
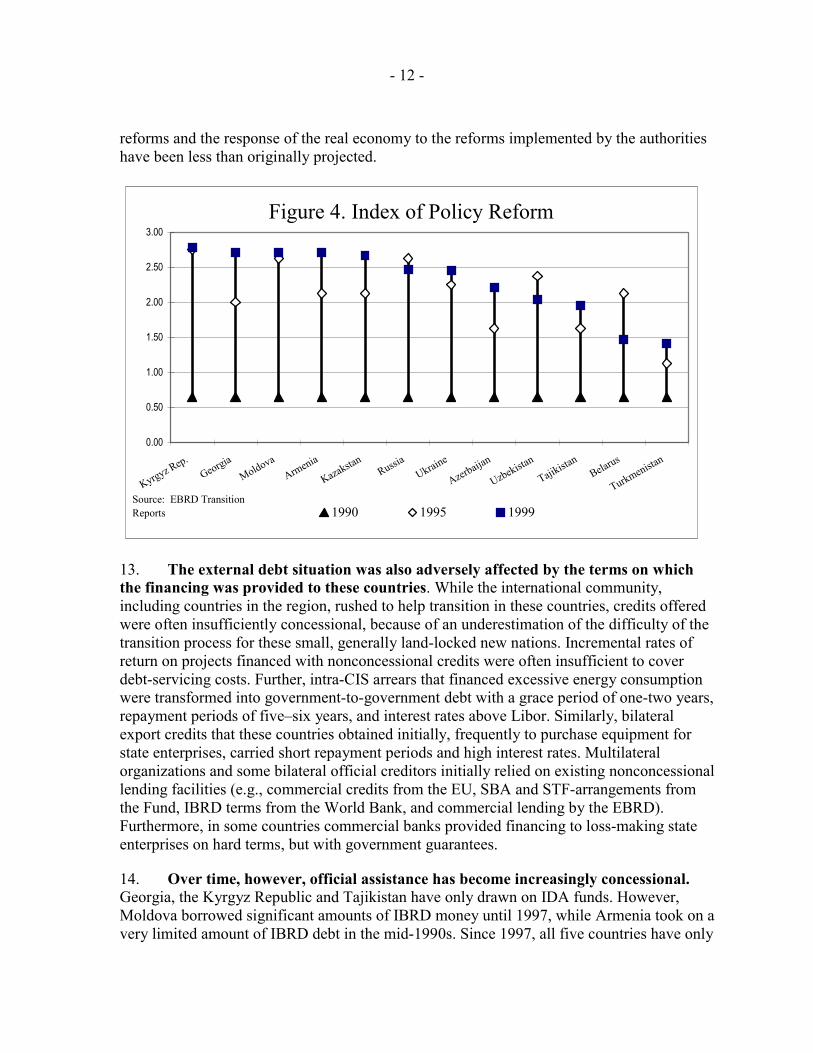
12. Successive adjustment programs achieved neither the degree of reform nor the export and output growth rates that had been projected. Early Fund- and Bank-supported adjustment programs were ambitious and assumed full implementation of many difficult measures. However, despite some progress in stabilization and structural reforms, the transition process in these five countries proved to be more difficult than expected, although it might be noted that�in terms of policy reform achievements�most of this group has performed relatively well when compared with others in the CIS (Figure 4). A full discussion of factors leading to weak reform and growth performance is beyond the scope of this paper.11 Among other factors, there have been widespread policy slippages, governance problems and an unexpectedly pervasive degree of �state capture.�12 Moreover, the ability of the authorities to prioritize viable projects, and manage public debt, as well as their implementation capacity, were overestimated. Partly as a result, the pace of economic
10 Fund and Bank staff have recognized the risks posed by growing indebtedness in CIS countries for some time. In addition to staff reports, these concerns were raised in John Odling-Smee and Basil Zavoico, �External Borrowing in the Baltics, Russia, and Other Countries of the Former Soviet Union�the Transition to the Market Economy,� IMF Paper on Policy Analysis and Assessment 98/5, in Ishan Kapur and Emmanuel van der Mensbrugghe, �External Borrowing by the Baltics, Russia and Other Countries of the Former Soviet Union: Developments and Policy Issues,� IMF Working Paper 97/72, and in �Official Financing for Developing Countries and Their Debt Situation,� SM/95/224 (September 1, 1995) and SM/95/228 (September 8, 1996, Annex II).
11 For a discussion, see Johannes Linn, �Ten Years of Transition in Central Europe and the Former Soviet Union: The Good News and the Not-So-Good News,� in M. Blejer and M. �kreb, eds., Transition: the First Decade, Kluwer Academic (forthcoming), and Oleh Havrylyshyn, et al., Growth Experience in Transition Countries, 1990�98, IMF Occasional Paper No. 184 (1999).
12 Where public officials have passed favorable laws or enact preferential forms of regulation to protect vested interests. See J. Hellman, et al., �Measuring Governance, Corruption and State Capture,� World Bank Working Paper No. 2312 (April 2000).
- 12 -
reforms and the response of the real economy to the reforms implemented by the authorities have been less than originally projected.
Figure 4. Index of Policy Reform
0.00
0.50
1.00
1.50
2.00
2.50
3.00
Kyrgyz Rep.Georgia
MoldovaArmenia
KazakstanRussia
Ukraine
Azerbaijan
Uzbekistan
Tajikistan
Belarus
Turkmenistan
1990 1995 1999Source: EBRD Transition Reports
13. The external debt situation was also adversely affected by the terms on which the financing was provided to these countries. While the international community, including countries in the region, rushed to help transition in these countries, credits offered were often insufficiently concessional, because of an underestimation of the difficulty of the transition process for these small, generally land-locked new nations. Incremental rates of return on projects financed with nonconcessional credits were often insufficient to cover debt-servicing costs. Further, intra-CIS arrears that financed excessive energy consumption were transformed into government-to-government debt with a grace period of one-two years, repayment periods of five�six years, and interest rates above Libor. Similarly, bilateral export credits that these countries obtained initially, frequently to purchase equipment for state enterprises, carried short repayment periods and high interest rates. Multilateral organizations and some bilateral official creditors initially relied on existing nonconcessional lending facilities (e.g., commercial credits from the EU, SBA and STF-arrangements from the Fund, IBRD terms from the World Bank, and commercial lending by the EBRD). Furthermore, in some countries commercial banks provided financing to loss-making state enterprises on hard terms, but with government guarantees.
14. Over time, however, official assistance has become increasingly concessional. Georgia, the Kyrgyz Republic and Tajikistan have only drawn on IDA funds. However, Moldova borrowed significant amounts of IBRD money until 1997, while Armenia took on a very limited amount of IBRD debt in the mid-1990s. Since 1997, all five countries have only

- 13 -
received IDA credits, and in 2000 were formally designated as eligible for IDA-only. Similarly, the Fund has made these countries eligible for PRGF loans, the AsDB has moved toward softer terms, and the EU has begun to provide grants, or more concessional loans, to help these countries repay older EU loans.13
15. As the capacity to repay did not improve significantly, and debt-service payments fell due, these countries accumulated arrears and approached their creditors for rescheduling of government and government-guaranteed debt. Since 1995, Georgia, the Kyrgyz Republic, Moldova, and Tajikistan have repeatedly signed bilateral rescheduling agreements.14 While providing temporary liquidity relief, in general these rescheduling operations were typically on nonconcessional terms with little attention to capacity to repay or comparable treatment of creditors.15
16. The Russian financial crisis of 1998 had a significant adverse impact on these countries, affecting exports, private transfers, investment and economic growth. The decline in economic growth in these countries at that time was accompanied by other unfavorable developments. While reliable data are not available, there is some evidence that mounting unemployment in Russia�along with administrative controls intended to stem capital flight�curtailed workers� remittances from Russia at the same time as the Russian ruble was depreciating at a faster rate than the currencies of these five countries. For example, an estimated 300,000 Armenians worked in Russia before the crisis, compared with a labor force in Armenia itself of 1.4 million, while remittances from Russia to Georgia in 1997 amounted to almost one half of the public sector wage bill. As a consequence, the poverty rate in these countries grew sharply, and the resulting fiscal pressures were often met with unsustainable sequestration and expenditures arrears.
17. Currency movements in the wake of the crisis raised the debt burden considerably. In four of the five countries nominal exchange rates depreciated sharply against the U.S. dollar between end-1997 and end-1999: by 33 percent in Georgia, 48 percent in Tajikistan, 60 percent in Moldova, and 62 percent in the Kyrgyz Republic (Figure 5). The exception was Armenia, where the currency remained broadly stable. Although to some extent they represented the unwinding of previous real appreciations, these unanticipated depreciations were unavoidable because of the weak external position of most countries.
13 All but Moldova were made ESAF/PRGF-eligible in December 1995. Moldova�s eligibility was approved in early 1999.
14 For example, the Kyrgyz Republic has rescheduled parts of its debt owed to Russia five times since 1994.
15 Noncash payments, such as mutual offsets and debt-equity swaps, complicate the comparison of the terms.

- 14 -
Moreover, they led to very sharp increases in fiscal debt servicing burdens and a worsening of the debt indicators in all countries but Armenia (Box 2).
Figure 5. Nominal exchange rate movements vs. dollar
40
60
80
100
120
Jul-97
Sep-97
Nov-97
Jan-98
Mar-98
May-98
Jul-98
Sep-98
Nov-98
Jan-99
Mar-99
May-99
Jul-99
Sep-99D
olla
r/Dom
estic
cur
renc
y,
July
199
8 =
100
Georgia Armenia KyrgyzMoldova Tajikistan
18. Despite the depreciations vis-à-vis the U.S. dollar, these currencies appreciated sharply against the Russian ruble after August 1998 (Figure 6).16 Partly as a result, exports fell markedly compared with the 1997 level, particularly in the Kyrgyz Republic and Moldova. Whereas Russia was the destination for an average of 29 percent of exports of these countries in 1997, by 1999 sales to Russia were only 23 percent of all exports, and were down by 37 percent on average in dollar terms. The 1998 developments in Russia caused a double crisis in most of these countries. While exports to Russia declined sharply (except in Tajikistan), the domestic currency cost of servicing dollar-denominated debt increased significantly.
19. In response to this crisis, the international community, led by the Bank and the Fund, mobilized additional resources for these countries. IDA commitments to the five countries in FY1999 were increased by 30 percent over what was planned at the start of the year. These additional resources helped governments maintain their levels of social spending and limit the buildup of wage, pension and social assistance arrears.
20. The growth of external debt ratios therefore reflects a number of factors. In large part, the growth of external debt during 1993-98 stemmed from substantial current account deficits that resulted from policy failures and factors that undermined economic growth. An accounting exercise demonstrates that most of the debt buildup through 1998 was caused by high current account deficits (which averaged over 10.1 of GDP for these countries as a group over this period). As shown in Table 3 and in Appendix II of the Background Paper, the overall external indebtedness of these countries increased by as much as 56 percentage points of GDP between 1993 and 1998. However, in each case, primary current 16 In real effective terms, these currencies do not seem to have lost much ground (Figure 7).

- 15 -
Box 2. Was the Growth of External Debt Foreseen?
The growth of external debt in the five countries concerned was not entirely unexpected. Indeed, Fund and Bank staff recognized early on that, for some of these countries, the debt burden was rising quickly. In 1995 creditors� and donors� meetings were organized to facilitate debt rescheduling and/or additional flows, but it was anticipated that economic growth would recover in time to afford repayment without further extraordinary measures.
Staff external debt projections prepared in 1996 or early 1997 were generally close to the mark for 1999 in dollar terms. These forecasts were also reasonably accurate as a percentage of exports of goods and services. In particular, the 1996-97 forecasts for nominal external debt in 1999 were less than 6 percent off the actual values in dollar terms (see table below).
However, growth projections did not materialize, and programs did not allow for possible negative external shocks such as the Russian crisis of August 1998. The Russian crisis, in particular, resulted in a substantial depreciation of national currencies against the U.S. dollar, and thus a dramatic increase in debt service expressed in domestic currency. At the same time, exports to Russia declined sharply due to the appreciation of the national currencies vis-à-vis the ruble.
Why didn�t growth recover as originally forecast? As the first decade of transition came to a close, a number of studies attempted to take stock of economic reforms in Central and Eastern Europe and the FSU.1 Most of this work has pointed to a fairly consistent set of causes of the slow economic growth in the CIS countries:
• Initial conditions in these countries were among the worst among all transition countries;
• Macroeconomic stabilization came only with a delay, leading to greater price and exchange rate instability than was the case in Eastern Europe and the Baltics;
• Structural adjustment efforts were inadequate, especially at the enterprise-level;
• Governance problems proved to be deeper than expected, leading to delays in improving the business environment and investor confidence; and
• Finally, political volatility and local conflicts have also deterred investors, undermining exports and growth, and leading to substantial fiscal costs, such as assistance to refugees.
_____________________ 1 See, for instance, Chapter III of World Economic Outlook, IMF (October 2000) and Linn (forthcoming), see footnote 11.
Projected vs. Actual Debt and GDP in 1999Armenia 1 Georgia 2 Kyrgyz Republic 3 Moldova 4 Tajikistan 5
Projected Actual Projected Actual Projected Actual Projected Actual Projected ActualTotal external debt ($ millions) 6 967 907 1,861 1,720 1,292 1,382 978 1,041 1,229 1,213 as share of GDP 37.9 49.1 24.0 63.0 67.0 112.2 25.0 79.8 184.7 117.2Memo item: Nominal GDP ($ millions) 7 2,554 1,847 7,754 2,728 1,928 1,232 3,912 1,304 665 1,0351 (IMF EBS/96/12). 2 (IMF EBS/96/141); note that there was a revision in GDP methodology after 1996. 3 (IMF EBS/9743); excludes nonguaranteed debt. 4 (IMF EBS/96/142). 5 (World Bank IDA/R96-74/2). 6 Excluding cross-border arrears. 7 Forecast error is chiefly due to currency depreciation, rather than errors in forecasting real GDP growth.

- 16 -
Figure 6. Nominal exchange rate movements vs. Ruble
50100150200250300350400450
Jul-97
Sep-97
Nov-97
Jan-98
Mar-98
May-98
Jul-98
Sep-98
Nov-98
Jan-99
Mar-99
May-99
Jul-99
Sep-99R
ussi
an ru
ble/
Dom
estic
cur
renc
y,
July
199
8 =
100
Georgia Armenia KyrgyzMoldova Tajikistan
Figure 7. Real Effective Exchange Rates
50
75
100
125
150
Jul-97
Sep-97
Nov-97
Jan-98
Mar-98
May-98
Jul-98
Sep-98
Nov-98
Jan-99
Mar-99
May-99
Jul-99
Sep-99
July
199
8 =
100
Georgia Armenia Kyrgyz Republic Moldova Tajikistan

- 17 -
account deficits alone would have resulted in even larger increases of external debt. To some extent, this trend was masked by real exchange rate appreciation. FDI flows also helped to moderate the growth of debt. Since 1998, however, most of the growth in debt to GDP ratios has been caused by adverse exchange rate movements in the wake of the Russian crisis.
Table 3. Decomposition of factors contributing to growth of external debt1 (In percent of GDP)
Of which due to:
Total Change in Debt Ratio
Interaction of Initial Debt, Interest and
Growth Rates
Cumulative Effect of
Primary Current Account
Imbalances
Cumulative Effect of FDI
Cumulative Effect of Other
Flows
(A) (B) (C) (D) (A-B-C-D) Armenia 1993-1998 26.9 -7.3 55.2 -16.4 -4.5 1999-2005 5.6 -11.0 59.1 -39.0 -3.6 Georgia 1993-1998 0.9 -28.3 10.6 -15.3 34.0 1999-2005 0.0 -6.0 27.1 -30.7 9.7 Kyrgyz Rep. 1993-1998 51.4 -23.3 67.3 -24.4 31.8 1999-2005 -5.2 0.7 48.8 -52.8 -1.9 Moldova 1993-1998 56.3 -4.0 37.6 -1.5 24.2 1999-2005 -15.6 0.6 15.4 8.8 -40.5 Tajikistan 1993-1998 17.7 -30.0 30.0 -7.9 25.6 1999-2005 -5.6 -11.8 39.6 -22.2 -11.2 1 For a detailed explanation, see Appendix II of the Background Paper.
III. EXTERNAL DEBT AND FISCAL SUSTAINABILITY
21. Detailed simulations of the external debt burden have been prepared for each country for the period 2000�10. In each case, the first or base case scenario assumes a positive external environment, while a second or low case scenario explores the implications of a less favorable external environment or a weaker response by the economy to the envisaged reforms.17 This paper summarizes the results of the DSAs, while details on the scenarios are included in the Background Paper.
22. All five countries are assumed to be implementing strong reform programs. These programs are assumed to receive the support of the IMF and the World Bank in the context of long-term poverty reduction strategies. Indeed, the macroeconomic framework 17While an effort was made to include comparable assumptions, the country projections are based on country-specific factors, especially as regards the balance of payments.

- 18 -
under Scenario One, and the policy environment assumed under both scenarios, are consistent with the Fund and Bank-supported programs for most of these countries.18 As a result, these scenarios embody a degree of adjustment that may be near the limit of what is feasible and appropriate.
23. Under both scenarios it is expected that governments will not assume nonguaranteed enterprise debt, with two exceptions in the case of the existing stock of energy arrears.19 By contrast, the stock of government guarantees is included in the debt sustainability exercise at 100 percent of face value, reflecting the high failure rates of such borrowers. It is also assumed that no new energy debt will be incurred.
24. Since all five countries are IDA-only eligible, future financing is assumed on average to be on concessional terms (grant element of at least 35 percent in all cases, apart from Georgia, where the figure is 25 percent) with the average degree of concessionality tapering off toward the end of the projection period. Apart from Fund- and Bank-supported programs, this assumption abstracts from questions regarding the availability of such financing and burden-sharing among the creditors. In addition, the status of some creditors may constrain the level of concessionality they can offer. With regards to the regularization of debt arrears, the DSAs assume that the ongoing rescheduling negotiations (e.g., by Georgia, the Kyrgyz Republic, Moldova, and Tajikistan) are successfully concluded on the terms that have been already discussed with creditors.20
A. Scenario One
25. If economic growth and external trade respond as favorably to reforms as expected under the Fund- and Bank-supported programs, four of the five countries could be expected to see progressive reductions in the NPV of external debt after a few years. Although all five may face cash-flow problems over the next two�three years, only the Kyrgyz Republic would have an NPV ratio that continues to be around 150 percent. 18 For details, see IMF Board papers for Georgia (EBS/00/258), the Kyrgyz Republic (EBS/00/182), Moldova (EBS/00/249), and Tajikistan (EBS/00/206). The Fund-supported program for Armenia expired in December 1999, but a new program is currently under discussion with the authorities.
19 For Moldova, it is assumed that $70 million, or about one quarter of the outstanding energy debt, will be recognized and rescheduled. For Georgia, a separate analysis shows that absorption of the energy arrears into government debt worsens external and fiscal sustainability significantly, though if this debt is rescheduled on relatively concessional terms, the effect tapers off by the end of the projection period (see the Background Paper).
20 All five countries are engaged in rescheduling discussions with some creditors. Some rescheduling agreements (e.g., between Armenia and Turkmenistan, and the Kyrgyz Republic and Pakistan) have recently been concluded.

- 19 -
Nevertheless, in all five countries, except perhaps Armenia, debt payments would severely constrain other government expenditures throughout much of the decade.
26. Real GDP growth under Scenario One in all five countries is projected at 4½�6½ percent per annum throughout the projection period, while inflation is targeted to decline to single-digit numbers (Statistical Appendix). Under this scenario, four out of the five countries are likely to strengthen their non-interest external current account positions. Armenia and Georgia are projected to achieve a strong external adjustment, while in Moldova, the non-interest current account deficit is expected to remain stable. The Kyrgyz Republic is an exception to the general trend. Its non-interest current account is projected to deteriorate temporarily as a result of a fall in exports when gold production starts to wind down in 2003, and to begin improving only in the last three years of the projection period. In Armenia the non-interest current account deficit is expected to narrow from the high levels of 1999�2001, but to remain at about 7 percent of GDP in the outer five years. This does not necessarily indicate that Armenia�s external position will be significantly weaker than in other countries, as Armenia is projected to receive more foreign direct investment than the other countries (7 percent of GDP, but falling over time to 4-5 percent, compared with 2½-5 percent for the other four countries).
27. The fiscal performance of all five countries is assumed to strengthen significantly. This improvement is projected to spread beyond the explicit budget of the central governments, and assumes the discontinuation of hidden price subsidies and other quasi-fiscal activities which currently jeopardize the sustainability of public finances (implying no new energy arrears). The scenario therefore presupposes strong policy ownership that translates into hard-budget constraints in the quasi-fiscal sector. In this sense, the formal budget would tend to understate the adjustment effort. Revenues are projected to improve steadily, albeit modestly, while expenditures are expected to grow at a slower pace.21 As a result, countries are projected to achieve primary surpluses or reduce their primary deficits by an average of 8 percentage points between 1995 and 2005 (Table 4).
28. For all five countries, Scenario One indicates that the external debt situation is likely to remain difficult for the next five years, but to improve thereafter, as measured by the ratio of the NPV of debt to exports of goods and services (Table 5 and Statistical Appendix). The Kyrgyz Republic is projected to have persistently high long-term debt ratios (around 150 percent of exports for most of the next 10 years). In Armenia, this indicator is projected to decline slowly and to remain in the range of 120�130 percent until 2010. Stronger recovery in exports and slower import growth (and in the case of Moldova, an increase in the share of concessional financing) cause a faster decline in the NPV ratios of Georgia and Moldova from about 180 percent in 2001 to the 60�80 percent range by 2010. Finally, since Tajikistan has contracted less debt and already enjoys highly concessional
21 Privatization proceeds are forecast conservatively, given the modest flows in the past, and persistent governance problems in some countries.

- 20 -
terms on most of its debt, its NPV ratio is the lowest of all five and is projected to decline even further, to about 50 percent. If the assumptions in Scenario One were to materialize, only the Kyrgyz Republic would likely face persistent pressure on export earnings caused by a high level of external debt. As noted above, for the next five years or so, the situation will remain difficult for Georgia and Moldova as well.22
Table 4. Assumed Adjustment under Scenario One (In percent of GDP)
Primary
External Primary Fiscal Balance1/ Fiscal Revenue2/ Current Account Balance 1995 1999 2005 1995 1999 2005 1995 1999 2005 Armenia -8.0 -5.1 -1.6 8.5 17.7 18.9 -14.6 -15.1 -8.2 Georgia -5.9 -3.0 2.7 6.7 8.0 9.9 -7.1 -6.2 -1.8 Kyrgyz Republic -16.0 -9.8 -1.6 16.4 15.8 17.7 -14.3 -10.8 -5.7 Moldova -2.3 2.3 0.8 23.7 18.8 19.0 -5.0 0.4 -3.9 Tajikistan -5.9 -2.5 2.1 13.3 10.8 13.2 -9.2 1.1 -2.1
Sources: Authorities of respective countries and IMF staff estimates. 1/ Includes public investment program. 2/ Central government revenues excluding grants.
22 The external debt situation is projected to remain tight in a cash-flow sense for the next two-three years, especially for Moldova and the Kyrgyz Republic. The ratio of debt service to exports of goods and services is expected to stay below 25 percent for the other three countries if they can successfully conclude the bilateral debt restructuring talks that are under way, and obtain new financing only on highly concessional terms.

Table 5. Debt and Debt-Service Ratios under Scenarios One and Two
(In percent)
Ratio of NPV of External Debt to Ratio of Debt Service to Exports of Goods and
Services Central Government
Revenue Exports of Goods and
Services Central Government
Revenue 2005 2005 2005 2005 1999
Scenario One
Scenario Two
1999 Scenario
One Scenario
Two
1999 Scenario
One Scenario
Two
1999 Scenario
One Two
Scenario Armenia 154 127 190 168 155 231 16 11 15 19 15 19
Georgia 213 126 194 688 329 511 13 18 26 45 50 71
Kyrgyz Rep. 188 148 177 386 299 372 24 18 21 24 31 36
Moldova 130 86 151 365 171 306 37 18 29 81 34 52
Tajikistan 1/ 128 101 128 504 315 604 5 10 12 20 31 58
Sources: Ministries of Finance and Central Banks of respective countries; IMF and World Bank staff estimates.
1/ Export figure excludes alumina and electricity barter transactions.
- 21 -
29. The projections in Scenario One indicate that for all countries, other than Armenia, debt will seriously constrain the fiscal position. The ability of governments to enhance revenues is expected to remain modest and central government revenue-to-GDP ratios are generally not projected to exceed 20 percent. As a result, both short- and long-term fiscal sustainability indicators are well above the thresholds used under the enhanced HIPC initiative.23 In fact, NPV to revenue ratios are projected to remain above 250 percent for six�seven years in the Kyrgyz Republic, Georgia, and Tajikistan, and for three�four years in Moldova. Furthermore, the scenarios assume that nonguaranteed debt (including some of the energy arrears) will not be absorbed by the budget. Were this to occur, the debt burden on the central government budget would increase significantly.
B. Scenario Two
30. If the economy does not respond in the favorable way assumed in Scenario One, or if the external environment proves more difficult, all five countries could face cash-flow problems over the next two�four years, and potential sustainability problems over the longer term. Given that projected improvements in the macroeconomic environment have often not materialized, a less favorable alternative scenario has been simulated to illustrate the risks to Scenario One.
31. Scenario Two assumes policy adjustment that is similar to the base case, but significantly lower exports growth, either because of a weaker response of the economy or a less favorable external environment.24 In particular, GDP growth rates are slowed to 2�3 percent (rather than the 4½�6½ percent rates assumed in Scenario One) and export growth rates are assumed to be more closely in line with projected increases in world trade (implying a reduction of 30 to 60 percent, depending on the country). It is assumed that external financing on concessional terms continues to be available in Scenario Two. If this is not possible, additional policy responses would be needed. Should external adjustment take place through exchange rate movements, however, the ratio of debt to revenues would worsen very sharply.
32. The results of Scenario Two assumptions are striking: the ratio of NPV of external debt to exports of goods and services rises or stays above 150 percent for all countries but Tajikistan (Table 5 and Statistical Appendix). Debt service as a share of exports rises above 25 percent for Georgia, the Kyrgyz Republic, and Moldova (although it eases a bit in 2003-05 as the bunching problem of the first part of the decade wears off). The effect on
23 As noted earlier, comparison with HIPC ratios must be undertaken with caution in part because these five countries have not yet been able to reschedule bilateral debt on concessional Naples terms.
24 The debt sustainability position of countries would be much worse under Scenario Two if there were significant policy slippages.

- 23 -
fiscal ratios would be quite significant as well. In particular, the ratio of the NPV of external debt to central government revenues rises or stays above 250 percent for all countries, and for Georgia, the Kyrgyz Republic, and Tajikistan this ratio rises above 400 percent. Finally, the ratio of debt service to central government revenue rises and/or stays above 35 percent for Georgia, the Kyrgyz Republic, Moldova, and Tajikistan, and only falls below this level for Moldova by 2008 (Statistical Appendix).
C. Sensitivity Analyses
33. Exchange rate depreciations could worsen the fiscal picture sharply. This is already evidenced by the significant deterioration of the debt situation in four of the five countries following the depreciations after the Russian financial crisis. Both scenarios assume constant or somewhat appreciating real exchange rates.25 Other things being equal, however, even a mild depreciation could significantly undermine fiscal sustainability in all countries (Box 3). An exchange rate depreciation is more likely under Scenario Two than Scenario One, given that it assumes a weaker external environment.
Box 3. Impact of Devaluation on Debt Ratios A weaker external environment could give rise to pressures for exchange rate depreciation. To illustrate the impact of this factor, a stress test was run on Scenario Two for Tajikistan. An exchange rate shock was simulated in 2001, with the real effective exchange rate depreciating by about 27 percent in 2001 (year-on-year), falling further by another 5 percent in 2002, 4 percent in 2003, and 3 percent in 2004, before stabilizing in the outer years. The impact of real depreciation feeds immediately into the fiscal measures of debt burden, as the output and revenues decline sharply in dollar terms. On average, the NPV of external debt to revenues deteriorates by 124 percent in the four years after the depreciation. Subsequently its effect tapers off; fiscal ratios in the second half of the decade worsen compared to Scenario Two by 114 percent, since the external gap shrinks. It is not surprising that the effect of a real depreciation on external debt ratios is less pronounced than on the fiscal ratios. However, significant additional borrowing needs in the first years after the depreciation give rise to a �debt trap,� and a rapid increase in the stock of external debt. By 2010, the ratio of NPV to exports is projected to exceed 250 percent, despite highly concessional terms assumed for new borrowing.
25 For Moldova and Tajikistan, Scenario Two assumes a constant real exchange rate, as opposed to a modest appreciation in Scenario One. For the other three countries in both scenarios the real exchange rate is assumed to remain constant.

- 24 -
34. Restructuring of bilateral debt is likely to have a significant positive impact for these countries. For illustrative purposes, a hypothetical rescheduling operation was simulated for each country in this group, in line with typical (Naples) terms granted to low-income countries by the Paris Club.26 Specifically, it was assumed that the debt would be subject to a two-thirds reduction in NPV terms, applied to all bilateral official and commercial debt (excluding nonguaranteed debt of the private sector). This debt relief was assumed to be applied in two rounds�first to the debt arrears outstanding and to the debt service due over 2001�04 (flow rescheduling), and then to the remaining stock of debt (stock rescheduling). Under Scenario One, the simulations suggest that rescheduling might not be needed for Armenia, while for Georgia, Moldova, and Tajikistan flow rescheduling in 2001-03 would be sufficient to achieve sustainable short-term and long-term debt indicators. For the Kyrgyz Republic, the long-term ratios would remain relatively high for most of the 10-year period with flow rescheduling, thereby indicating that for this country debt stock relief might be needed. Under Scenario Two, the impact is more diverse. In Armenia, any debt relief operation would be difficult to justify, since the burden of debt service is driven by new borrowing (to close large and persistent external gaps) and not the old debt. The other four countries will need both flow and stock rescheduling. However, while the simulations for Moldova and Tajikistan indicate that stock rescheduling would return debt indicators to comfortable limits, for Georgia a complete rescheduling operation would only just be sufficient to achieve sustainability. Even complete stock and flow rescheduling does not seem to be sufficient to enable the Kyrgyz Republic to achieve significantly lower ratios of external debt to exports or government revenues. In all five countries, the external debt position would remain sensitive to the terms and the availability of new financing even in the event of deep debt relief.
35. Hardening the terms of new borrowing would also cause a sharp deterioration in debt ratios. A reduction in the average grant element of new borrowing by about 50 percent would have a significant impact on external sustainability. The NPV ratios would jump by 20 to 30 percent for most countries by 2010. In terms of scheduled debt service ratios, for most countries the impact is more modest as financing gaps are projected to remain relatively low and repayments start only later in the 10-year projection period (Table 6).
36. The accumulation of domestic debt above the levels assumed under the Fund and Bank-supported programs could worsen the overall debt position. The stock of domestic debt is already significant in several countries (Table 7). This debt is mostly held by central banks, and has not always been serviced in the past. At this time, it is assumed in most cases that only partial payments will be made on domestic debt service, and that central banks will generally roll over debt owed directly to them. To the extent that it is not offset by
26 The Paris Club would decide on the applicability of these terms on a case-by-case basis, and it has not agreed that Naples terms should apply to any of these countries. Moreover, some non-Paris club countries (such as Turkmenistan) have been reluctant to participate in nonconcessional�let alone concessional�reschedulings.

- 25 -
transfers of central bank profits to the budget, full servicing of domestic debt could impose a sizable additional burden on the already scarce resources of all governments, except in Armenia and, to a lesser extent, the Kyrgyz Republic. Further, there is a potential for contingent liabilities to build up in the banking system, which could also worsen the debt dynamics.
Table 6. Stress Testing for Harder Borrowing Terms1/ Percent, average annual increase
Ratio of NPV of External Debt to Ratio of Debt Service to
Exports of Goods and Services
Central Government Revenue
Exports of Goods and Services
Central Government Revenue
2001-05 2006-10 2001-05 2006-10 2001-05 2006-10 2001-05 2006-10 Scenario One
Armenia 11.3 24.0 11.2 24.0 18.3 58.5 17.9 58.8 Georgia 14.0 23.0 2.0 12.0 5.0 18.0 5.0 18.0 Kyrgyz Republic 1.9 7.8 2.1 7.7 1.5 14.1 2.4 14.5 Moldova 14.4 29.9 17.0 27.9 3.4 5.3 3.5 5.2 Tajikistan 11.2 25.1 11.3 24.9 7.9 33.6 8.3 34.5
Scenario Two
Armenia 11.6 23.9 11.5 23.9 18.5 52.9 18.0 53.1 Georgia 5.4 27.2 5.0 27.2 7.8 15.0 7.6 15.0 Kyrgyz Republic 6.8 21.9 7.4 21.6 5.4 50.0 8.0 50.5 Moldova 18.6 28.0 18.6 28.0 0.2 8.0 0.2 8.0 Tajikistan 17.4 35.5 18.5 35.5 18.6 54.0 21.3 56.0
Sources: Ministries of Finance and Central Banks; IMF and World Bank staff estimates. 1/Harder borrowing terms reflect a 50 percent reduction in the grant element of the new financing.
Table 7. Stock of Domestic Debt as of December 31, 1999
(in percent of GDP, unless otherwise stated)
Armenia Georgia Kyrgyz Republic
Moldova Tajikistan
Total domestic debt 2.6 13.0 7.0 13.9 9.2 of which: To the Central Bank 0.8 12.9 6.6 9.6 9.1 Traded instruments 1.8 0.1 0.4 4.3 0.1
Memo: GDP (mil. dollars) 1853 2797 1232 1304 1033 Sources: Authorities of respective countries, IMF staff estimates.

- 26 -
37. Finally, cross-border energy arrears are assumed in both scenarios to be largely managed by the private or public enterprise sector without recourse to fiscal support (except as noted above). If governments were to assume all or a significant portion of this debt, the sustainability outlook indicated above would be much less favorable. In any event, continued support from international donors and investors would be needed to complete the restructuring of the energy sector in these countries.
D. Impact on Poverty and Social Services
38. In U.S. dollar terms, the five countries in this study are currently among the poorest in the world, with 1999 per capita incomes ranging from $290 in Tajikistan to $620 in Georgia (Table 8). The incidence of poverty increased dramatically during the 1990s, and absolute poverty rates in 1998 ranged from 45 percent in Georgia to 68 percent in Tajikistan.27 The primary reason for the poverty increase is the severe erosion of incomes and public social services occasioned by the collapse of output and fiscal systems (including transfers from the Union government) during the early years of transition. There has also been a substantial increase in income inequality during the transition. The Gini coefficient of per capita income rose from a weighted average of 0.27 in 1987�90 to 0.48 in 1996�99. Finally, as noted above, armed conflicts, natural disasters and exogenous economic shocks, notably the Russian crisis of 1998, have been important factors contributing to poverty in these countries.
39. Most analyses of poverty in these countries indicate that sustained, broad-based growth of income and employment opportunities is key to poverty reduction in the medium term.28 The simulations described above embody the assumption of policy reforms to stimulate such growth. However, even under Scenario One, average GDP per capita in these countries will only regain its 1991 level of $863 in 2006. Under Scenario Two, per capita GDP would not reach its 1991 level on average even by the end of the decade. Action is needed to arrest the decline in the populations� access to acceptable standards of health services and schooling, and to ensure that the most vulnerable groups, including children, the elderly, and displaced persons and refugees, are afforded a minimum level of social security.
27 For the ECA countries, absolute poverty is measured in terms of the headcount at $2.15 per person per day in 1996 PPP terms.
28 These countries enjoy a strong human capital base and there is good reason to think that the majority of their populations will benefit from the opportunities created by new economic structures and the resumption of growth. See, for instance, Making Transition Work for Everyone: Poverty and Inequality in Europe and Central Asia. World Bank. 2000.

- 27 -
Table 8. Poverty Levels and GNP per capita1/
Country Poverty � Headcount Index
1999 Dollar GNP per capita (Atlas Method)
Tajikistan 68 290 Moldova 55 410 Kyrgyz Republic 49 300 Armenia 44 490 Georgia 19 620
Other IDA-only: Bangladesh 36 370 Burkina Faso 45 240 Cameroon 40 580 Lao PDR 46 280 Mauritania 50 380 Nicaragua 50 430 Mozambique 68 230 Uganda 44 310 Vietnam 51 370 Source: World Bank. 2000. Making Transition Work for Everyone: Poverty and Inequality in Europe and Central Asia. World Development Indicators database.
1/Private consumption data are not available for Tajikistan, Georgia and Moldova. ECA poverty headcount numbers are based on the international poverty line of $2.15 per person per day. Other IDA-only refers to selected countries, and poverty headcount refers to the percentage of the population below the poverty line.
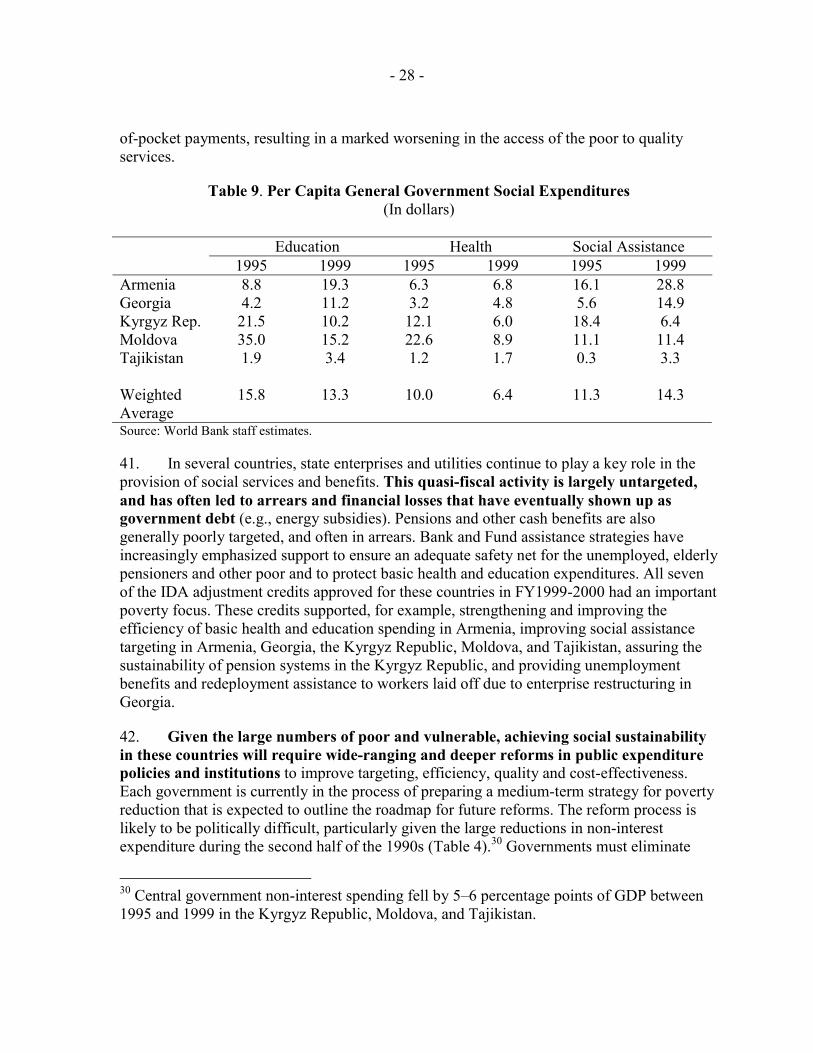
40. The ability of these countries to address their social needs in a sustainable and efficient manner is already severely constrained. Following a sharp drop during the first few years of transition, most of these countries have managed to maintain social spending levels broadly stable as a share of GDP. However, this was in a context of drastically reduced real GDP. The result has been a financial crisis in the social sectors of most countries. By 1999, dollar per capita expenditures on health and education in these countries had fallen to levels comparable to those in some of the poorest countries in the world (Table 9). This decline has contributed to a deterioration in the quality of health and education services. Spending within the social sectors is also typically very inefficient. Personnel, energy and supply costs due to the oversupply of hospitals, clinics, schools, doctors, teachers and other staff absorb the bulk of the limited social expenditure budget. With total public health expenditures averaging $6 per capita in 1999, these countries are not able to provide a basic package of health services, including vaccination, pre- and post-natal services and HIV/AIDS awareness.29 Many services in both sectors now increasingly demand illicit and informal out- 29 The 1992 World Development Report estimated that the annual cost of such a minimum essential health package in 1990 varied from $12 per capita in low-income countries to $21.50 in middle-income countries.
- 28 -
of-pocket payments, resulting in a marked worsening in the access of the poor to quality services.
Table 9. Per Capita General Government Social Expenditures (In dollars)
Education Health Social Assistance
1995 1999 1995 1999 1995 1999 Armenia 8.8 19.3 6.3 6.8 16.1 28.8 Georgia 4.2 11.2 3.2 4.8 5.6 14.9 Kyrgyz Rep. 21.5 10.2 12.1 6.0 18.4 6.4 Moldova 35.0 15.2 22.6 8.9 11.1 11.4 Tajikistan 1.9 3.4 1.2 1.7 0.3 3.3 Weighted Average
15.8
13.3
10.0
6.4
11.3
14.3
Source: World Bank staff estimates.
41. In several countries, state enterprises and utilities continue to play a key role in the provision of social services and benefits. This quasi-fiscal activity is largely untargeted, and has often led to arrears and financial losses that have eventually shown up as government debt (e.g., energy subsidies). Pensions and other cash benefits are also generally poorly targeted, and often in arrears. Bank and Fund assistance strategies have increasingly emphasized support to ensure an adequate safety net for the unemployed, elderly pensioners and other poor and to protect basic health and education expenditures. All seven of the IDA adjustment credits approved for these countries in FY1999-2000 had an important poverty focus. These credits supported, for example, strengthening and improving the efficiency of basic health and education spending in Armenia, improving social assistance targeting in Armenia, Georgia, the Kyrgyz Republic, Moldova, and Tajikistan, assuring the sustainability of pension systems in the Kyrgyz Republic, and providing unemployment benefits and redeployment assistance to workers laid off due to enterprise restructuring in Georgia.
42. Given the large numbers of poor and vulnerable, achieving social sustainability in these countries will require wide-ranging and deeper reforms in public expenditure policies and institutions to improve targeting, efficiency, quality and cost-effectiveness. Each government is currently in the process of preparing a medium-term strategy for poverty reduction that is expected to outline the roadmap for future reforms. The reform process is likely to be politically difficult, particularly given the large reductions in non-interest expenditure during the second half of the 1990s (Table 4).30 Governments must eliminate
30 Central government non-interest spending fell by 5�6 percentage points of GDP between 1995 and 1999 in the Kyrgyz Republic, Moldova, and Tajikistan.

- 29 -
commitments for benefits and service delivery that they cannot afford, close facilities where necessary and reduce staffing levels. Greater attention to cost-effectiveness in social spending will be critical to improve living standards and to secure international financial assistance. Better quality and elimination of side-payments for priority services should help build public support for social sector reforms.
E. Conclusions
43. The above analysis shows that all five countries are likely to face a difficult fiscal and external outlook in the next decade. Massive external shocks have contributed to this situation, which has typically been exacerbated by inadequate policy response, corruption and poor governance, lack of policy ownership, and inadequate implementation capacity. Notwithstanding the substantial amount of external assistance provided, these countries have witnessed a sharp decline in their populations� living standards. Support from the international community has aimed to assist these countries through the adjustment period. However, the international community, including the Fund and the Bank, underestimated the difficulty of transition and the gestation period for structural and institutional reforms, and overestimated the authorities� willingness and ability to implement these reforms.
44. The paper argues that if the external environment remains favorable and strong reform programs are implemented during the next 10 years, the external debt situation for Armenia, Georgia, Moldova, and Tajikistan may be manageable, while for the Kyrgyz Republic the situation could remain very difficult. However, with peak debt-servicing ratios coming in 2001�04, all five countries could experience cash-flow problems during the next few years. The impact of the debt on the budget remains a matter of serious concern in all countries except possibly Armenia, and some debt flow rescheduling may be required if social expenditures are not to be squeezed. With a less favorable external environment or response from the economy, the debt situation could become unsustainable in many of these countries. External shocks or any weakening of the reform effort, which is already assumed to be stronger than in recent years, could quickly create severe external payments and fiscal problems.
45. Indeed, the Fund and Bank-supported programs that are currently underway in most of these countries aim to enable the authorities to secure macroeconomic outcomes consistent with Scenario One. In particular, structural and institutional reforms are expected to substantially enhance foreign private investment as well as to reverse some of the capital flight witnessed during the last decade. This is important, since�as shown in Table 4�despite the substantial fiscal adjustment envisaged under Scenario One, relatively high current account deficits would persist.31 This highlights an important risk. It is possible that the projected level of foreign investment might not materialize. Therefore, the authorities need to stand ready to strengthen their adjustment efforts, if necessary. There are no
31 See Appendix II of the Background Paper.

- 30 -
alternatives to strong adjustment programs�including the structural reforms that are meant to confront vested interests and enhance economic productivity�that would promote investment and could be supported by the international community.
46. In particular, there is an urgent need to improve public finances. Significant increases in government revenues are already built into the projections for Georgia, the Kyrgyz Republic, and Tajikistan (Table 10), and the revenue levels in Armenia and Moldova are above the international average for countries at their income levels. Insofar as improvements in tax administration are likely to take time to bear fruit, it is difficult to envisage much further adjustment on the revenue side. At the same time, the level of non-interest expenditures in these countries is not insignificant, and there is room for expenditure reallocation to the social sectors and for efficiency gains.
47. In several countries, however, fiscal adjustment by itself is unlikely to be sufficient for genuine poverty reduction efforts, if debt service obligations are to be met as well. Figure 8, for example, shows that average primary fiscal balances during 2001�05 would need to be around 1 percent of GDP tighter in order to achieve a 10 percentage point reduction in the ratio of NPV to exports by 2005. Under Scenario Two, however, reductions in this ratio of 30�40 percentage points would be needed to achieve sustainability in several countries.32 Therefore, larger external assistance in the form of highly concessional new money (or grants) and/or restructuring of external obligations (or debt relief), could be needed to allow these countries to allocate more resources for growth-generating and poverty reduction measures.
32 Whether the relationship described in Figure 8 is linear for large adjustments is not clear. However, under Scenario Two a large adjustment would nevertheless be needed to establish sustainability.
Figure 8. Average annual primary fiscal balances in 2001-05
-4.0
-3.0
-2.0
-1.0
0.0
1.0
2.0
3.0
Armenia Georgia Kyrgyz Moldova TajikistanPerc
ent o
f GD
P
Scenario One
Average annual primary fiscal balance needed to achieve 10 percentage point reduction in NPV toexports by 2005

- 31 -
IV. ISSUES FOR CONSIDERATION
48. The preliminary analysis undertaken in this paper indicates that any concerted effort to assist these countries with their debt problems will have to be built on a case-by-case basis, because of the very different situation each country faces. Do Directors agree that the staffs of the IMF and the World Bank should prepare a follow-up paper that would explore options for the resolution of the debt problems described above? Issues that could be examined in the successor paper include the following:
• The extent to which fiscal adjustment beyond that already envisaged under both scenarios is feasible and advisable;
• The minimum required policy packages, including poverty reduction and the elimination of energy arrears, that these countries will need to adopt to secure the support of the international community;
• The scope and minimum level of concessionality of new financing needed to support poverty reduction and economic recovery in these countries;
• The need for debt rescheduling, and mechanisms and forms of arranging it (Paris Club or bilateral, concessional or nonconcessional);
• The heavy reliance of these countries on multilateral assistance and borrowing from the Bank and the Fund, as well as burden-sharing among bilateral creditors; and
Table 10. Fiscal Adjustment Assumed under Scenario One 1/
(In percent of GDP)
1999 2005 1999 2005 1999 2005 1999 2005 1999 2005
Revenue 22.0 22.1 15.8 19.7 23.5 26.8 27.3 25.7 13.5 15.5
Expenditure 29.1 24.5 22.7 19.0 36.1 29.5 32.7 28.1 16.6 14.0Of which :
Noninterest 27.1 23.6 19.8 17.0 33.1 28.0 26.1 24.9 16.0 12.8Interest 2.0 0.9 2.9 2.0 3.0 1.5 6.6 3.2 0.6 1.2
Primary balance -5.1 -1.6 -4.0 2.7 -9.6 -1.2 1.2 0.8 -2.5 2.6
Memorandum items:Total debt service 2/ 3.3 2.9 3.6 5.0 2.8 4.3 15.2 6.5 0.7 3.0External current account balance -16.2 -8.8 -7.9 -3.6 -16.3 -7.3 -2.6 -6.5 -3.5 -4.9
Sources: Ministries of Finance and Central Banks; and IMF and World Bank staff estimates.
1/ General government, including grants and PIP.2/ Government and government-guaranteed external debt.
Armenia Georgia Kyrgyz Rep. Moldova Tajikistan

- 32 -
• The appropriateness of requiring�in the context of Fund- and Bank- supported programs�that all government or government-guaranteed borrowing be on highly concessional terms.

- 33 - STATISTICAL APPENDIX
Table 1. Armenia: Summary Table, 1999-2010
Average Average1999 2000 2001-2005 2006-2010
Actual Prelim. Scenario One Scenario Two Scenario One Scenario Two
Nominal GDP US$ million 1,846.6 1,912.5 2,485.9 2,257.1 3,697.5 2,960.5Exchange rate, LCU/US$, (period average) 522.9 534.4 548.6 548.1 549.0 561.4Real GDP growth, percent change 3.3 4.0 5.7 3.0 5.0 3.0GDP deflator -5.9 -0.4 2.9 2.9 3.0 3.0Real effective exchange rate, percent change -5.1 -8.1 0.0 0.0 0.0 0.0Exports GS volume growth, percent change n.a. n.a. n.a. n.a. n.a. n.a.Exports GS value growth, percent change 6.5 16.4 10.5 6.5 9.4 6.5Imports GS volume growth, percent change n.a. n.a. n.a. n.a. n.a. n.a.Imports GS value growth, percent change -8.1 8.8 4.2 3.4 7.0 5.0Exports GS, in percent of GDP 20.7 23.3 24.7 23.9 26.1 25.0Imports GS, in percent of GDP 49.8 52.3 46.1 48.8 40.4 46.4Current account balance, incl.transfers, in percent of GDP -16.2 -15.3 -10.7 -13.6 -7.4 -13.5Non-interest current account, in percent of GDP 1/ -15.1 -14.3 -10.0 -12.5 -6.9 -12.0Net foreign direct investment, in percent of GDP 6.6 8.4 6.5 5.0 4.4 4.0Residual external financing gap, in percent of GDP (-deficit/+surplus) -5.1 0.0 -1.6 -4.7 -1.1 -5.8Primary balance, central government budget, in percent of GDP -7.1 -5.9 -1.6 -1.5 -1.6 -1.4Central government revenues, in percent of GDP 2/ 17.7 16.5 18.2 18.2 19.0 19.0
Source: IMF and World Bank staff estimates and projections.
1/ NICA excludes interest payments and includes income receipts.2/ Central government revenue includes extrabudgetary funds and excludes grants.

- 34 - STATISTICAL APPENDIX
Figure 1. Armenia: Key Debt Sustainability Indicators, 1999-2010.
Source: IMF and World Bank staff estimates and projections.
NVP of debt service as ratio of exports of goods and services
100
125
150
175
200
225
250
1999 2000 2001 2002 2003 2004 2005 2006 2007 2008 2009 2010100
125
150
175
200
225
250
Scenario One Scenario Two
External Sustainability
NVP of debt service as ratio of central government revenue
100
150
200
250
300
350
1999 2000 2001 2002 2003 2004 2005 2006 2007 2008 2009 2010100
150
200
250
300
350
Scenario One Scenario Two
Fiscal Sustainability
Total debt service as ratio of central government revenue
0
5
10
15
20
25
1999 2000 2001 2002 2003 2004 2005 2006 2007 2008 2009 20100
5
10
15
20
25
Scenario One Scenario Two
Total debt service as ratio of exports of goods and services
0
4
8
12
16
20
1999 2000 2001 2002 2003 2004 2005 2006 2007 2008 2009 20100
4
8
12
16
20
Scenario One Scenario Two

- 35 - STATISTICAL APPENDIX
Table 2. Georgia: Summary Table, 1999-2010
Average Average1999 2000 2001-2005 2006-2010
Actual Prelim. Scenario One Scenario Two Scenario One Scenario Two
Nominal GDP US$ million 2,728.1 3,070.1 3,956.3 3,560.0 5,822.0 4,693.0Exchange rate, LCU/USD$ (period average) 2.0 2.0 2.0 2.0 2.1 2.1Real GDP growth, percent change 2.9 1.2 4.8 2.5 4.4 2.5GDP deflator 1/ 19.1 4.3 4.3 4.3 4.0 4.0Real effective exchange rate, percent change -33.4 -10.0 -2.2 -2.2 0.0 0.0Exports G volume growth, percent -3.5 9.9 6.8 3.8 6.1 3.9Exports G value growth, percent -0.3 9.2 9.1 5.8 8.2 6.0Imports G volume growth, percent -12.5 -5.1 7.9 3.2 12.9 3.8Imports G value growth, percent -12.5 8.5 4.9 5.0 6.7 5.5Exports GS, in percent of GDP 27.1 26.9 27.7 27.4 28.6 27.9Imports GS, in percent of GDP 46.4 44.9 40.8 44.4 37.2 44.0Current account balance, including transfers, in percent of GDP -8.0 -8.1 -4.9 -6.4 -1.9 -6.8Non-interest current account, in percent of GDP 2/ -6.2 -6.6 -3.5 -4.6 -1.1 -5.0Net FDI, in percent of GDP 2.2 2.6 3.4 3.0 3.5 3.0Residual external financing gap, in percent of GDP (-deficit/+surplus) n.a. 0.0 0.0 -2.6 0.0 -6.2Primary balance, central government budget, in percent of GDP -3.0 -1.1 1.7 2.2 2.5 3.0Central government revenues, in percent of GDP 3/ 8.0 7.9 9.1 9.1 10.4 10.4
Source: IMF and World Bank staff estimates and projections.
1/ Changes in the CPI index.2/ NICA excludes interest payments and includes income receipts.3/ Central government revenue excludes extrabudgetary funds and grants.

- 36 - STATISTICAL APPENDIX
Figure 2. Georgia: Key Debt Sustainability Indicators, 1999-2010
Source: IMF and World Bank staff estimates and projections
NPV of debt service as ratio of exports of goods and services
5075
100125150175200225250275300
1999 2000 2001 2002 2003 2004 2005 2006 2007 2008 2009 20105075100125150175200225250275300
Scenario One, w/o energy arrears Scenario One, incl. energy arrears Scenario Two
External Sustainability
NPV of debt service as ratio of central government revenue
150
250
350
450
550
650
750
850
1999 2000 2001 2002 2003 2004 2005 2006 2007 2008 2009 2010150
250
350
450
550
650
750
850
Scenario One, w/o energy arrears Scenario One, incl. energy arrears Scenario Two
Fiscal Sustainability
Total debt service as ratio of exports of goods and services
5
10
15
20
25
30
35
1999 2000 2001 2002 2003 2004 2005 2006 2007 2008 2009 20105
10
15
20
25
30
35
Scenario One, without energy arrears Scenario Two
Total debt service as ratio of central government revenue
102030405060708090
100
1999 2000 2001 2002 2003 2004 2005 2006 2007 2008 2009 2010102030405060708090100
Scenario One, w/o energy arrears Scenario Two

- 37 - STATISTICAL APPENDIX
Table 3. Kyrgyz Republic: Summary Table, 1999-2010
Average Average1999 2000 2001-2005 2006-2010
Actual Prelim. Scenario One Scenario Two Scenario One Scenario Two
Nominal GDP US$ million 1,232.0 1,240.4 1,696.0 1,545.4 2,401.1 1,930.8Exchange rate, LCU/US$, (period average) 39.2 48.9 56.4 56.4 66.0 66.0Real GDP growth, percent change 3.7 4.8 5.0 2.0 4.5 2.0GDP deflator 36.5 19.7 9.1 9.1 5.0 5.0Real effective exchange rate, percent change -12.7 -1.5 1.8 1.8 0.0 0.0Exports G volume growth, percent 1/ -31.3 5.8 6.9 2.8 7.0 3.0Exports G value growth, percent 1/ -28.2 7.0 8.1 4.1 8.0 4.0Imports G volume growth, percent 1/ -21.5 -1.0 2.3 2.4 1.0 0.5Imports G value growth, percent 1/ -28.4 -0.2 3.6 3.5 2.0 1.5Exports GS, in percent of GDP 42.8 44.8 39.8 40.3 30.2 28.8Imports GS, in percent of GDP 57.3 56.1 45.4 49.9 34.9 44.0Current account balance, incl.transfers, in percent of GDP -16.3 -12.7 -5.7 -9.4 -4.9 -14.8Non-interest current account, in percent of GDP 2/ -10.8 -6.9 -3.3 -6.4 -3.5 -11.7Net FDI, in percent of GDP 3.6 5.6 5.8 3.6 5.3 3.6Residual external financing gap, in percent of GDP (-deficit/+surplus) n.a. 0.0 -1.6 -3.4 -2.1 -10.0Primary balance, central government budget, in percent of GDP 3/ -9.1 -4.7 -2.0 -1.8 -1.5 -1.2Central government revenues, in percent of GDP 4/ 14.6 13.8 16.4 16.4 18.0 18.0
Source: IMF and World Bank staff estimates and projections.
1/ Excluding gold.2/ NICA excludes interest payments and includes income receipts.3) Accrual basis, including PIP and the deficit of the social fund.4/ Central government revenue includes extrabudgetary funds and excludes grants.

- 38 - STATISTICAL APPENDIX
Figure 3. Kyrgyz Republic: Key Debt Sustainability Indicators, 1998-2010
Source: IMF and World Bank staff estimates and projections
NPV of debt service as ratio of exports of goods and services
50
100
150
200
250
300
350
1999 2000 2001 2002 2003 2004 2005 2006 2007 2008 2009 201050
100
150
200
250
300
350
Scenario One Scenario Two
External Sustainability
NPV of debt service as ratio of central government revenue
200
250
300
350
400
450
500
550
1999 2000 2001 2002 2003 2004 2005 2006 2007 2008 2009 2010200
250
300
350
400
450
500
550
Scenario One Scenario Two
Fiscal Sustainability
Total debt service as ratio of exports of goods and services
10
15
20
25
30
35
40
1999 2000 2001 2002 2003 2004 2005 2006 2007 2008 2009 201010
15
20
25
30
35
40
Scenario One Scenario Two
Total debt service as ratio of central government revenue
10
20
30
40
50
1999 2000 2001 2002 2003 2004 2005 2006 2007 2008 2009 201010
20
30
40
50
Scenario One Scenario Two

- 39 - STATISTICAL APPENDIX
Table 4. Moldova: Summary Table, 1999-2010
Average Average1999 2000 2001-2005 2006-2010
Actual Prelim. Scenario One Scenario Two Scenario One Scenario Two
Nominal GDP US$ million 1,304.0 1,407.2 2,051.4 1,579.0 3,591.0 2,020.7Exchange rate, LCU/US$, (period average) 10.5 12.5 14.1 16.0 17.8 22.8Real GDP growth, percent change -4.4 0.0 6.8 2.5 6.0 2.5GDP deflator 38.3 27.8 10.4 10.0 10.0 10.0Real effectived exchange rate, percent change 2.6 18.8 2.6 0.0 2.0 0.0Exports G volume growth, percent -28.7 2.8 12.6 2.4 10.8 2.4Exports G value growth, percent -27.1 5.4 15.5 5.0 13.5 5.0Imports G volume growth, percent -43.3 24.7 9.1 1.9 8.5 1.9Imports G value growth, percent -42.1 27.8 11.8 4.4 11.3 4.4Exports GS, in percent of GDP 46.4 46.4 48.7 48.0 55.1 47.9Imports GS, in percent of GDP 58.0 66.8 63.3 68.9 66.3 66.8Current account balance, including transfers, in percent of GDP -2.6 -7.8 -6.3 -8.2 -5.6 -7.8Non-interest current account, in percent of GDP 1/ 0.4 -4.3 -3.2 -3.8 -3.4 -3.8Net foreign direct investment, in percent of GDP 2.6 10.2 5.2 2.9 5.4 2.0Residual external financing gap, in percent of GDP (-deficit/+surplus) n.a. 0.0 -0.4 -2.8 -0.2 -1.7Primary balance, central government budget, in percent of GDP 2.3 2.5 1.4 1.8 0.4 1.2Central government revenues, in percent of GDP 2/ 18.8 19.0 19.0 19.0 19.0 19.0
Source: IMF and World Bank staff estimates and projections.
1/ NICA excludes interest payments and includes income receipts.2/ Central government revenue includes extrabudgetary funds and excludes grants.

- 40 - STATISTICAL APPENDIX
Figure 4. Moldova: Key Debt Sustainability Indicators, 1999-2010.
Source: IMF and World Bank staff estimates and projections
NPV of debt service as ratio of exports of goods and services
50
75
100
125
150
175
200
1999 2000 2001 2002 2003 2004 2005 2006 2007 2008 2009 201050
75
100
125
150
175
200
Scenario Two Scenario Two
External SustainabilityNPV of debt service as ratio of central government revenue
100
150
200
250
300
350
400
1999 2000 2001 2002 2003 2004 2005 2006 2007 2008 2009 2010100
150
200
250
300
350
400
Scenario One Scenario Two
Fiscal Sustainability
Total debt service as ratio of exports of goods and services
10
15
20
25
30
35
40
45
1999 2000 2001 2002 2003 2004 2005 2006 2007 2008 2009 201010
15
20
25
30
35
40
45
Scenario One Scenario Two
Total debt service as ratio of central government revenue
0
10
20
30
40
50
60
70
80
90
1999 2000 2001 2002 2003 2004 2005 2006 2007 2008 2009 20100
10
20
30
40
50
60
70
80
90
Scenario One Scenario Two

- 41 - STATISTICAL APPENDIX
Table 5. Tajikistan: Summary Table, 1999-2010
Average Average1999 2000 2001-2005 2006-2010
Actual Prelim. Scenario One Scenario Two Scenario One Scenario Two
Nominal GDP US$ million 1,034.5 943.0 1,305.1 1,159.7 2,326.7 1,484.6Exchange rate, LCU/US$, (period average) 1,253.9 1,822.9 2,400.0 2,518.0 2,400.0 3,180.0Real GDP growth, percent change 3.7 5.0 5.0 2.5 5.0 2.5GDP deflator 26.5 20.0 12.8 7.6 7.0 7.0Real effective exchange rate, percent change -23.6 -19.4 3.9 0.0 4.4 0.0Exports GS volume growth, percent 1/ 7.1 7.1 4.9 1.8 5.0 0.9Exports GS value growth, percent 1/ 11.2 11.0 8.7 5.0 9.2 5.0Imports GS volume growth, percent 1/ -11.3 18.5 4.2 0.5 4.1 0.5Imports GS value growth, percent 1/ -4.2 15.8 8.1 4.3 8.2 4.5Exports GS, in percent of GDP 69.4 84.5 80.0 105.1 68.5 104.7Imports GS, in percent of GDP 70.9 90.1 83.8 109.1 69.3 106.3Current account balance, incl.transfers, in percent of GDP -3.5 -5.8 -5.8 -6.7 -2.7 -4.7Non-interest current account, in percentage of GDP 2/ 1.1 -0.5 -2.1 -1.3 -0.7 -0.5Net foreign direct investment, in percent of GDP 2.0 3.2 2.4 2.0 2.6 2.0Residual external financing gap, in percent of GDP (-deficit/+surplus) -2.5 0.6 -0.3 -1.3 -0.6 -4.3Primary balance, central government budget, in percent of GDP -3.1 0.0 1.6 2.0 1.9 n.a.Central government revenues, in percent of GDP 3/ 10.8 11.2 12.4 12.0 14.2 13.3
Source: IMF and World Bank staff estimates and projections.
1/ Exports and imports include alumina and electricity.2/ NICA excludes interest payments and includes income receipts.3/ Central government revenue includes extrabudgetary funds and excludes grants.

- 42 - STATISTICAL APPENDIX
Figure 5. Tajikistan: Key Debt Sustainability Indicators, 1999-2010
Source: IMF and World Bank staff estimates and projections.
NPV of debt service as ratio of exports of goods and services
020406080
100120140160180
1999 2000 2001 2002 2003 2004 2005 2006 2007 2008 2009 2010020406080100120140160180
Scenario One Scenario Two
NPV of debt service as ratio of central government revenue
100
200
300
400
500
600
700
1999 2000 2001 2002 2003 2004 2005 2006 2007 2008 2009 2010100
200
300
400
500
600
Scenario One Scenario Two
Total debt service as ratio of exports of goods and services
0
5
10
15
20
1999 2000 2001 2002 2003 2004 2005 2006 2007 2008 2009 20100
5
10
15
20
Scenario One Scenario Two
Total debt service as ratio of central government revenue
0102030405060708090
100
1999 2000 2001 2002 2003 2004 2005 2006 2007 2008 2009 20100102030405060708090100
Scenario One Scenario Two
External Sustainability Fiscal Sustainability