armls data for march 2017 – published april 21, …armls.com/docs/stat-march-2017.pdf · data for...
TRANSCRIPT
1 ARMLS STAT MARCH 2017
DATA for MARCH 2017 - Published April 21, 2017
Permission is granted only to ARMLS® Subscribers for reproduction with attribution to “ARMLS® COPYRIGHT 2017”. For questions regarding this publication contact [email protected].
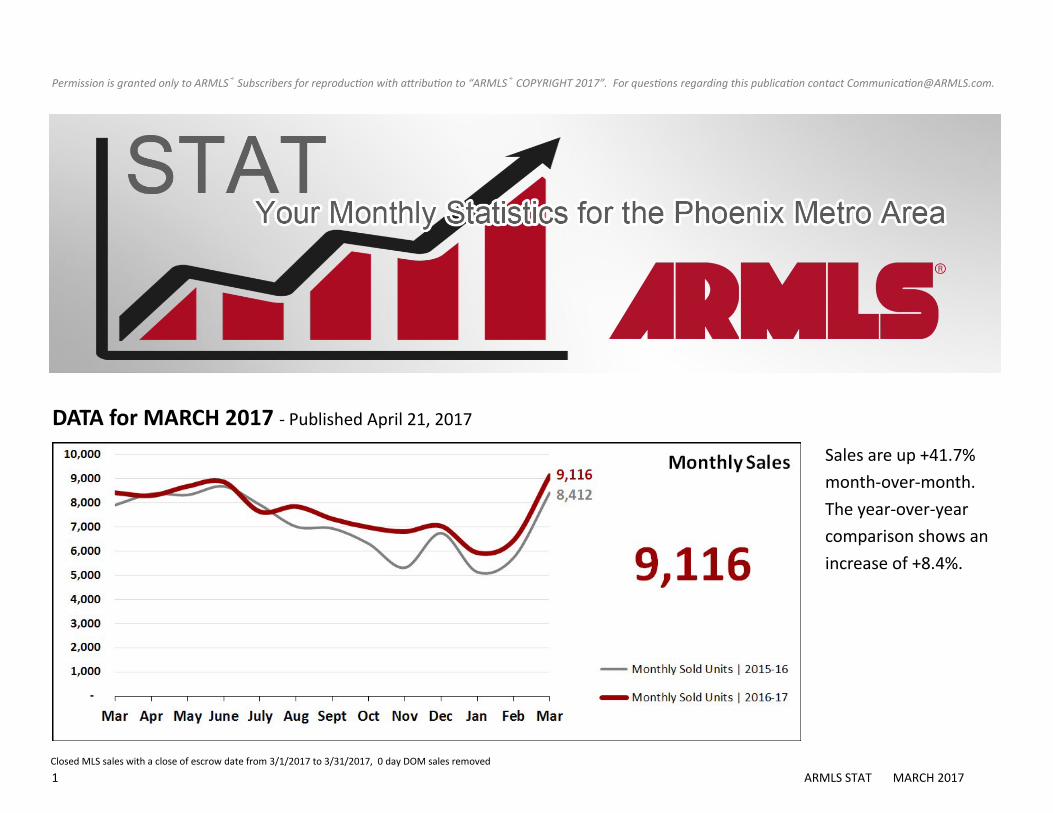
Sales are up +41.7%
month-over-month.
The year-over-year
comparison shows an
increase of +8.4%.
Closed MLS sales with a close of escrow date from 3/1/2017 to 3/31/2017, 0 day DOM sales removed

2 ARMLS STAT MARCH 2017
New inventory is up
+21.6% month-over-
month while the year-
over-year comparison
shows an increase of
+6.7%.
Total inventory has
a month-over-
month decrease of
-0.6% while year-
over-year reflects a
decrease of -11.1%.
New MLS listings that were active for at least one day from 3/1/2017 to 3/31/2017, 0 day DOM sales removed
Snapshot of statuses on 3/31/2017

3 ARMLS STAT MARCH 2017
March UCB listings
percent of total inven-
tory was 18.8% with
March CCBS listings at
2.2% of total inventory.
Months supply of in-
ventory for February
was 3.85 with March at
2.70.
Snapshot of statuses on 3/31/2017
Current inventory of Active/UCB/CCBS divided by the monthly sales volume of March 2017, 0 day DOM sales removed

4 ARMLS STAT MARCH 2017
Average new list pric-
es are up +2.5% year-
over-year. The year-
over-year median is
up +4.0%.
The average sales
price is up +7.9%
year-over-year while
the year-over-year
median sales price is
also up +6.6%.
List prices of new listings with list dates from 3/1/2017 to 3/31/2017, 0 day DOM sales removed
MLS sales prices for closed listings with a close of escrow date from 3/1/2017 to 3/31/2017, 0 day DOM sales removed
5 ARMLS STAT MARCH 2017
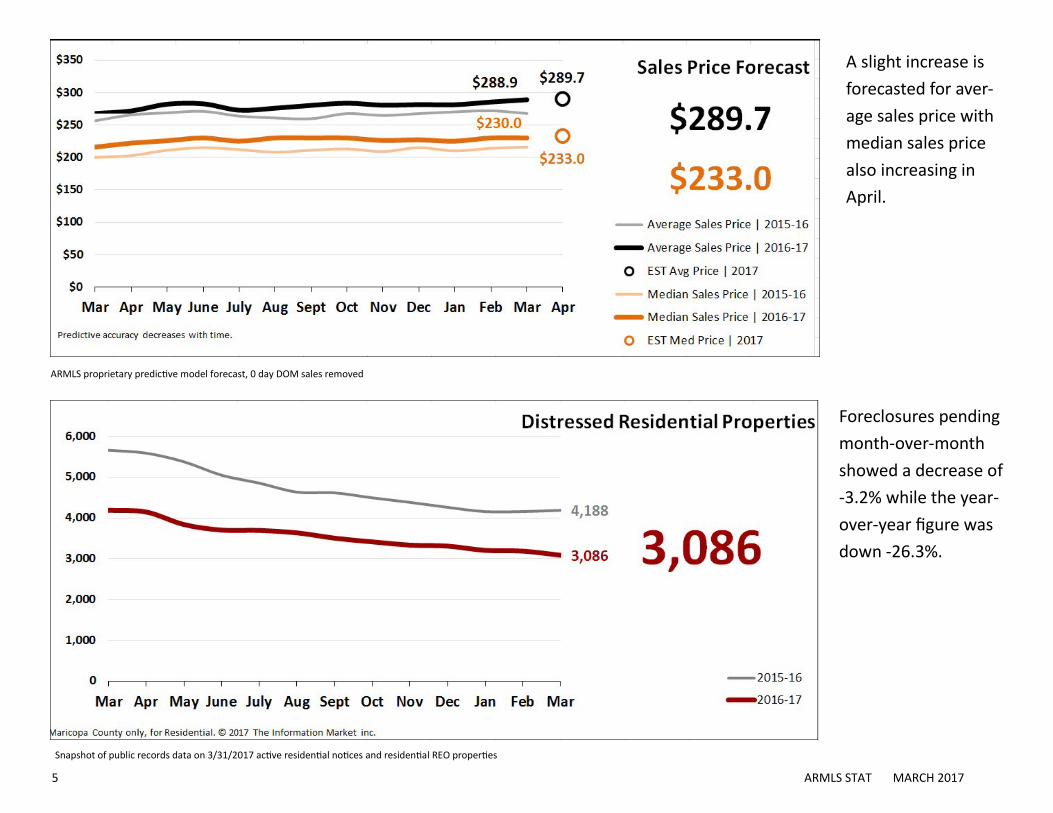
ARMLS proprietary predictive model forecast, 0 day DOM sales removed
A slight increase is
forecasted for aver-
age sales price with
median sales price
also increasing in
April.
Snapshot of public records data on 3/31/2017 active residential notices and residential REO properties
Foreclosures pending
month-over-month
showed a decrease of
-3.2% while the year-
over-year figure was
down -26.3%.

6 ARMLS STAT MARCH 2017
Distressed sales ac-
counted for 3.4% of
total sales, down from
the previous month of
3.9%.
Short sales dropped
-27.4% year-over-year.
Lender owned sales
dropped -10.2% year-
over-year.
Days on market
were down -3 days
year-over-year
while month-over-
month decreased -5
days.
Lender owned sales are MLS sales 3/1/2017 to 3/31/2017 where Lender Owned/REO, HUD Owned Property special listing conditions were selected
Short sales are MLS sales 3/1/2017 to 3/31/2017 where Short Sale Aprvl Req, Previously Aprved SS or Lender Approved SS special listing conditions were selected
Average of all closed listings 3/1/2017 to 3/31/2017 where DOM was greater than 0

7 ARMLS STAT MARCH 2017
COMMENTARY
by Tom Ruff of The Information Market
Sales continue to be hot, even taking into consideration the fact that we
are in the high season. MLS sales volume for the first three months of
2017 was 11.54% higher than 2016. There were 21,483 sales reported in
Q1 2017 compared to 19,261 for the first quarter of 2016.
Looking at public record resale sales volume in Maricopa County for the
first quarter of 2017, we see that it was the third highest volume in the 19
years we’ve reported data. Only the peak bubble years of 2005 and 2006
had higher resale sales volume.
A cool top and a smoking hot bottom doesn’t just describe my upcoming
summer wardrobe, it’s also an apt description of the current state of our
resale housing market. This month in STAT we take a closer look at our fe-
verish bottom price ranges.
Contract ratios were created by Michael Orr of the Cromford Report as a
means to communicate the relationship between supply and demand in a
given market area. Cromford translates the contract ratio as: 0-20 is Cool,
21-40 is Warm, 41-74 is Warmer, 75-99 is Hot and 100+ is a FRENZY!
The next map below shows the contract ratio by ZIP code for the frenzied
markets in the Phoenix Metropolitan Area. The contract ratio is calculated
by dividing the number of homes under contract by the number of active
listings. The map below also identifies the areas where the contract ratio is
greater than 100, meaning the number of homes under contract is greater
than the number of active listings. An example would be 85033 where cur-
rently there are 108 homes under contract and 73 active listings leaving a
contract ratio of 147. Also displayed are the frenzied ZIP codes, not to be
confused with the friend zone.

8 ARMLS STAT MARCH 2017
The common thread for the hottest of the hot sectors of our market is price
point. When we view a zip code map showing the average sales price be-
tween $100,000 and $200,000 and then again $200,000 to $300,000, we see
a remarkable similarity between the two maps.
With insufficient supply and strong demand from entry level buyers, I see no
relief in sight. We are just now seeing the beginning ground swell of millennial
buyers. Couple a large population base of looming buyers with a median new
build price of $320,000 and I see little to no immediate relief of added inven-
tory for homes priced below $300,000. Home prices in these areas will contin-
ue to rise as will our overall median sales price. Properties listed in these areas
and price points find the selling agents confident and the buying agents fran-
tic.
The ARMLS Pending Price Index (PPI)
Last month STAT projected a median sales price for March of $229,000. The
actual median sales price was $230,000, $1,000 higher than the $229,000 pro-
jected by our mathematical model. In 2016 our mathematical projections
tended to be lower than the actual results for most of the year, it appears our
model is following a similar path in 2017. Looking ahead to April, the ARMLS
Pending Price Index projects a median sales price of $233,000. With limited
supply and steady demand, particularly at the lower price points, I fully expect
the median in April to exceed March.
MLS sales volume in March was 9,116 or 8.4% higher than the total of 8,412
last year, accounting for 166 more sales than our projected total of 8,950.
Sales volume for the first three months of 2017 is 11.54% higher than 2017,
with 21,483 sales in 2017 compared to 19,261 in the first quarter of 2016. We
begin April with 7,616 pending contracts, 4,629 UCB listings and 544 CCBS giv-
ing us a total of 12,789 residential listings practically under contract. This com-
9 ARMLS STAT MARCH 2017
pares to 12,545 of the same type of listings at this time last year suggesting
the sales volume in April 2017 will surpass the 8,293 of April 2016. STAT is
projecting 8,800 sales in April. Note, there were 21 business days in 2016
and only 20 business days this year.