army educational outreach program...to encourage and help prepare students to pursue college-level...
TRANSCRIPT
ARMY EDUCATIONAL OUTREACH PROGRAM Unite
2018 Annual Program Evaluation Report
Findings June 2019
2018 Annual Program Evaluation Report | 1 |
1 | AEOP Consortium Contacts U.S. Army Contacts Matthew Willis, Ph.D. Andrea Simmons Director, Laboratory Management Army Educational Outreach Program (AEOP) Director Office of the Deputy Assistant Secretary of the Army Office of the Deputy Assistant Secretary of the for Research and Technology Army for Research and Technology [email protected] [email protected] AEOP Cooperative Agreement Manager Battelle Memorial Institute – Lead Organization Christina Weber David Burns AEOP Cooperative Agreement Manager Project Director, AEOP CA U.S. Army Combat Capabilites Development Director of STEM Innovation Networks Command (CCDC) [email protected] [email protected] Unite Program Administrators Hillary Lee Roseanne White, Ph.D. Unite Program Director Principal Investigator Technology Student Association Technology Student Association [email protected] [email protected] Evaluation Team Contacts – NC State University Carla C. Johnson, Ed.D. Toni A. Sondergeld, Ph.D. Janet B. Walton, Ph.D. Evaluation Director, AEOP CA Assistant Director, AEOP CA Assistant Director, AEOP CA [email protected] [email protected] [email protected] Report Unite_02_061519 has been prepared for the AEOP Cooperative Agreement and the U.S. Army by NC State University College of Education on behalf of Battelle Memorial Institute (Lead Organization) under award W911 SR-15-2-0001.
1
2018 Annual Program Evaluation Report | 2 |
2 | Table of Contents
AEOP Consortium Contacts Page 1
Table of Contents Page 2
Introduction Page 3
FY18 Evaluation At-A-Glance Page 9
Priority #1 Findings Page 18
Priority #2 Findings Page 29
Priority #3 Findings Page 41
Findings & Recommendations Page 56
2
2018 Annual Program Evaluation Report | 3 |
3 | Introduction
The Army Educational Outreach Program (AEOP) vision is to offer a
collaborative and cohesive portfolio of Army sponsored science,
technology, engineering and mathematics (STEM) programs that
effectively engage, inspire, and attract the next generation of STEM
talent through K-college programs and expose participants to
Department of Defense (DoD) STEM careers. The consortium, formed
by the Army Educational Outreach Program Cooperative Agreement
(AEOP CA), supports the AEOP in this mission by engaging non-profit,
industry, and academic partners with aligned interests, as well as a
management structure that collectively markets the portfolio among
members, leverages available resources, and provides expertise to
ensure the programs provide the greatest return on investment in
achieving the Army’s STEM goals and objectives.
This report documents the evaluation of one of the AEOP elements,
Unite. The Unite program is administered on behalf of the Army by the Technology Student Association
(TSA). The evaluation study was performed by Purdue University in cooperation with Battelle, the Lead
Organization (LO) in the AEOP CA consortium.
Program Overview
Unite, an initiative in the AEOP portfolio, is a pre-collegiate, academic, summer program for rising 9th
through 12th grade students from groups historically underserved in science, technology, engineering,
and mathematics (STEM). Managed by the Technology Student Association (TSA), the program is designed
to encourage and help prepare students to pursue college-level studies and, ultimately, careers in STEM
fields.
In 2018, 19 college/university sites were funded through Unite/AEOP. Although Unite site programs differ
from one another, they all must meet universal requirements. This results in a general consistency in student
experiences and outcomes, with the flexibility for sites to design their program to meet the unique needs of
their students.
3
AEOP Priorities
Goal 1: STEM Literate Citizenry. Broaden, deepen, and diversify the
pool of STEM talent in support of our defense industry base.
Goal 2: STEM Savvy Educators.
Support and empower educators with unique Army research and
technology resources.
Goal 3: Sustainable Infrastructure. Develop and implement a cohesive, coordinated, and sustainable STEM
education outreach infrastructure across the Army.
2018 Annual Program Evaluation Report | 4 |
Unite leverages university partnerships and their existing summer programs to collectively develop
academically prepared students for post-secondary STEM studies. All Unite programs are designed to meet
the following objectives:
1. Effectively show participants the real-world applications of math and science;
2. Raise participant confidence in the ability to participate in engineering activities;
3. Inspire participants to consider engineering majors in college;
4. Remove social barriers and negative attitudes about engineering;
5. Promote collaboration and problem-solving in a team environment;
6. Expose participants to STEM careers in the Army and DoD; and,
7. Increase the number of STEM graduates to fill the projected shortfall of scientists and engineers
in national and Department of Defense (DoD) careers.
Unite included 19 host sites, which were comprised of 10 HBCUs/MSIs. Unite received applications from
731 students, 429 of whom were enrolled in the program. This represents a 17% increase in enrollment
over 2017 when 358 students were enrolled. The placement rate was also higher in FY18 (59%) than in
FY17 (43%) and FY16 (41%).
Adult participants in Unite included university faculty and students, local teachers, and industry STEM
professionals who played important roles as mentors to Unite students. In FY18, 401 adults participated
in varying roles. This number included 27 Army S&Es, a decrease from FY17 when 38 Army S&Es
participated but an increase as compared to FY16 when 18 Army S&Es participated in Unite. A total of 152
educators (including university faculty) participated in the program. The number of K-12 teachers
participating in 2018 (49), decreased as compared to FY17 when 65 K-12 teachers participated, but
increased relative to FY16 when 37 K-12 teachers participated in Unite.
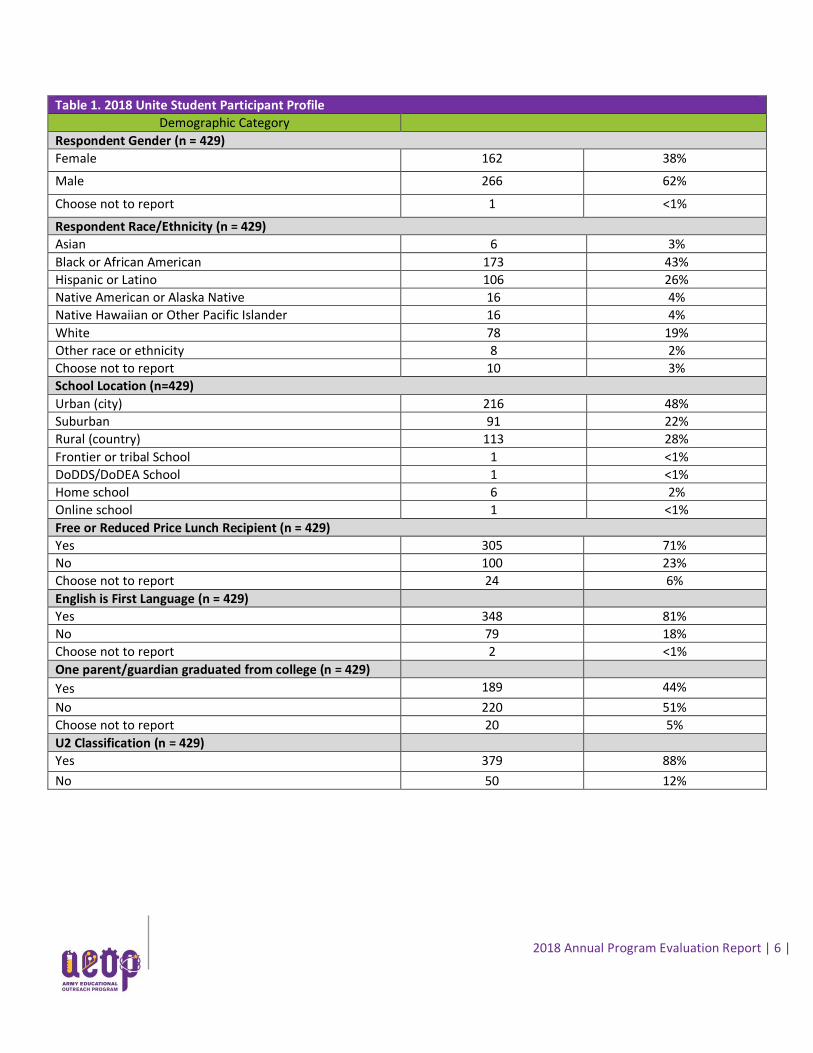
Table 1 contains an overview of demographic data for the 429 Unite participants who registered through
Cvent. A large majority of FY18 Unite students (88%) met the AEOP definition of underserved.1 In
particular, over a third (43%) of students identified themselves as Black or African American. This is a
decrease from the 68% of students who identified as Black or African American in FY17. More than half of
FY18 Unite participants (62%) were female, an increase over the FY17 when 46% of participants were
1 AEOP’s definition of underserved (U2) includes at least two of the following: Underserved populations include low‐income students (FARMS); students belonging to race and ethnic minorities that are historically underrepresented in STEM (HUR) (i.e., Alaska Natives, Native Americans, Blacks or African Americans, Hispanics, Native Hawaiians and other Pacific Islanders); students with disabilities (ADA); students with English as a second language (ELLs); first‐generation college students (1stGEN); students in rural, frontier, or other Federal targeted outreach schools (GEO); and females in certain STEM fields (Gender) (e.g., physical science, computer science, mathematics, or engineering).
2018 Annual Program Evaluation Report | 5 |
female. A majority of students (71%) indicated that they receive free or reduced-price lunch, a commonly
used indicator of family income, an increase as compared to FY17 when 61% of students reported
receiving free or reduced price lunch. Over half of students (51%) reported that they did not have a parent
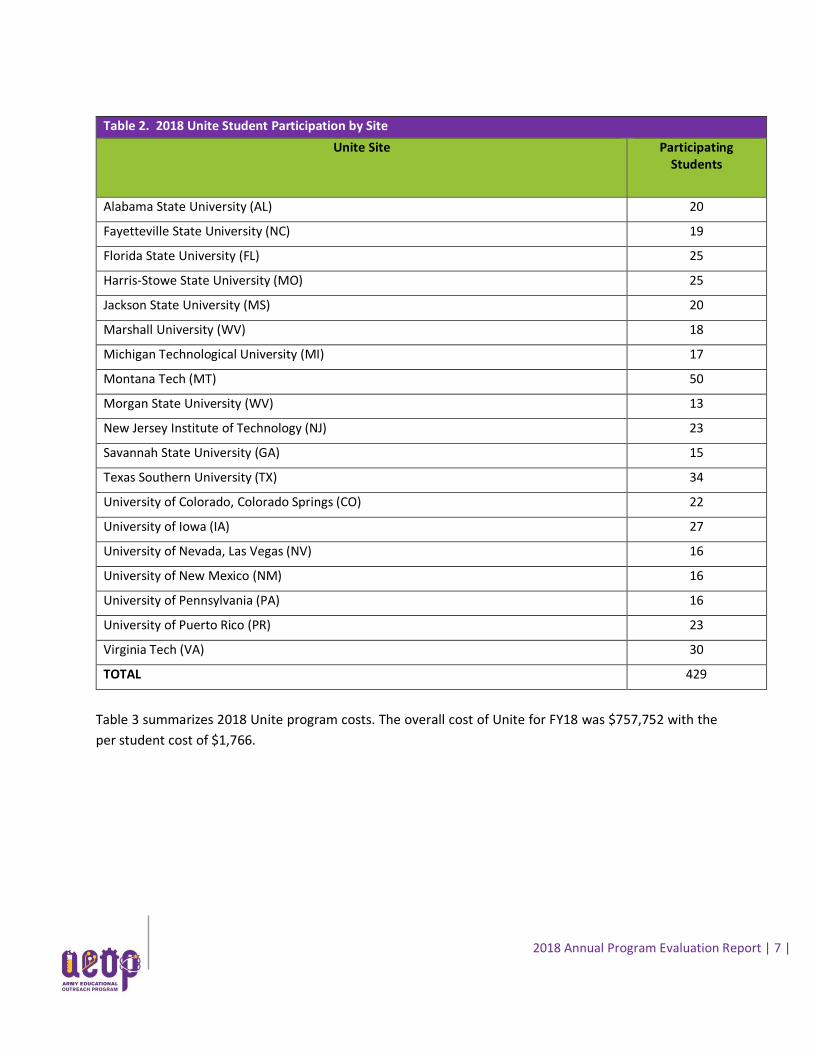
or guardian who graduated from college, an increase from 31% in FY17. Table 2 provides the number of
students who participated at each Unite site.
2018 Annual Program Evaluation Report | 6 |
Table 1. 2018 Unite Student Participant Profile
Demographic Category
Respondent Gender (n = 429)
Female 162 38%
Male 266 62%
Choose not to report 1 <1%
Respondent Race/Ethnicity (n = 429)
Asian 6 3%
Black or African American 173 43%
Hispanic or Latino 106 26%
Native American or Alaska Native 16 4%
Native Hawaiian or Other Pacific Islander 16 4%
White 78 19%
Other race or ethnicity 8 2%
Choose not to report 10 3%
School Location (n=429)
Urban (city) 216 48%
Suburban 91 22%
Rural (country) 113 28%
Frontier or tribal School 1 <1%
DoDDS/DoDEA School 1 <1%
Home school 6 2%
Online school 1 <1%
Free or Reduced Price Lunch Recipient (n = 429)
Yes 305 71%
No 100 23%
Choose not to report 24 6%
English is First Language (n = 429)
Yes 348 81%
No 79 18%
Choose not to report 2 <1%
One parent/guardian graduated from college (n = 429)
Yes 189 44%
No 220 51%
Choose not to report 20 5%
U2 Classification (n = 429)
Yes 379 88%
No 50 12%
2018 Annual Program Evaluation Report | 7 |
Table 2. 2018 Unite Student Participation by Site
Unite Site Participating Students
Alabama State University (AL) 20
Fayetteville State University (NC) 19
Florida State University (FL) 25
Harris-Stowe State University (MO) 25
Jackson State University (MS) 20
Marshall University (WV) 18
Michigan Technological University (MI) 17
Montana Tech (MT) 50
Morgan State University (WV) 13
New Jersey Institute of Technology (NJ) 23
Savannah State University (GA) 15
Texas Southern University (TX) 34
University of Colorado, Colorado Springs (CO) 22
University of Iowa (IA) 27
University of Nevada, Las Vegas (NV) 16
University of New Mexico (NM) 16
University of Pennsylvania (PA) 16
University of Puerto Rico (PR) 23
Virginia Tech (VA) 30
TOTAL 429
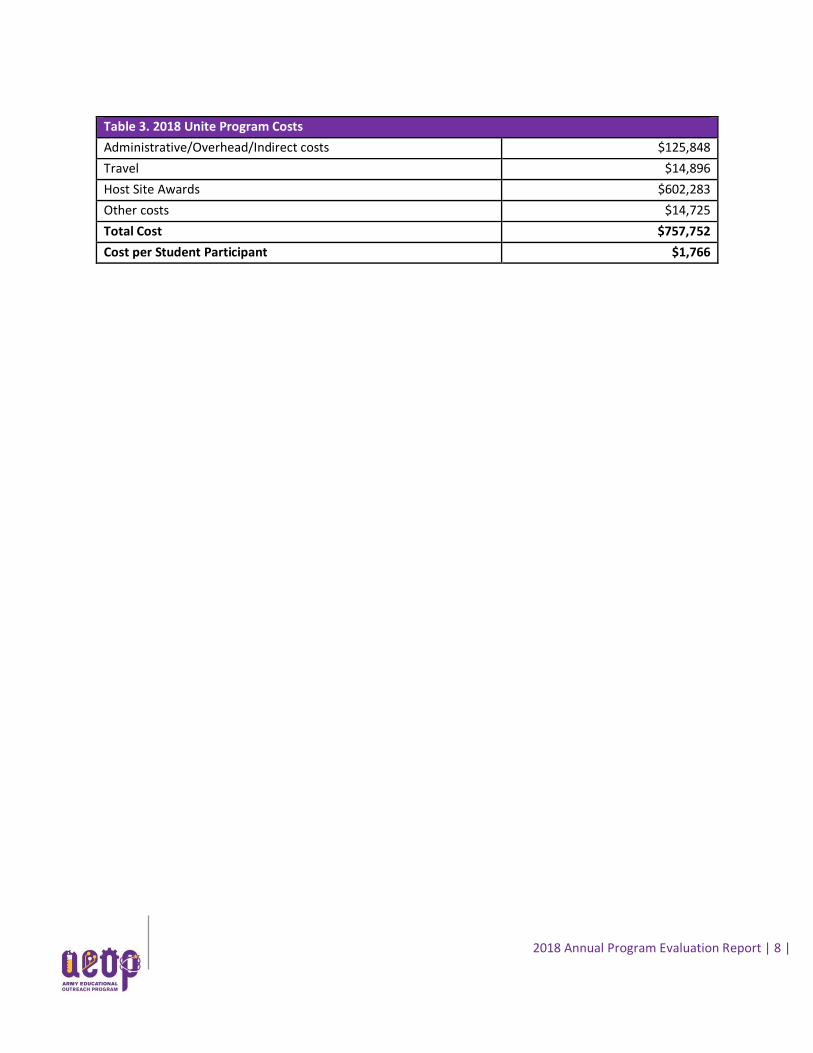
Table 3 summarizes 2018 Unite program costs. The overall cost of Unite for FY18 was $757,752 with the
per student cost of $1,766.
2018 Annual Program Evaluation Report | 8 |
Table 3. 2018 Unite Program Costs
Administrative/Overhead/Indirect costs $125,848
Travel $14,896
Host Site Awards $602,283
Other costs $14,725
Total Cost $757,752
Cost per Student Participant $1,766
2018 Annual Program Evaluation Report | 9 |
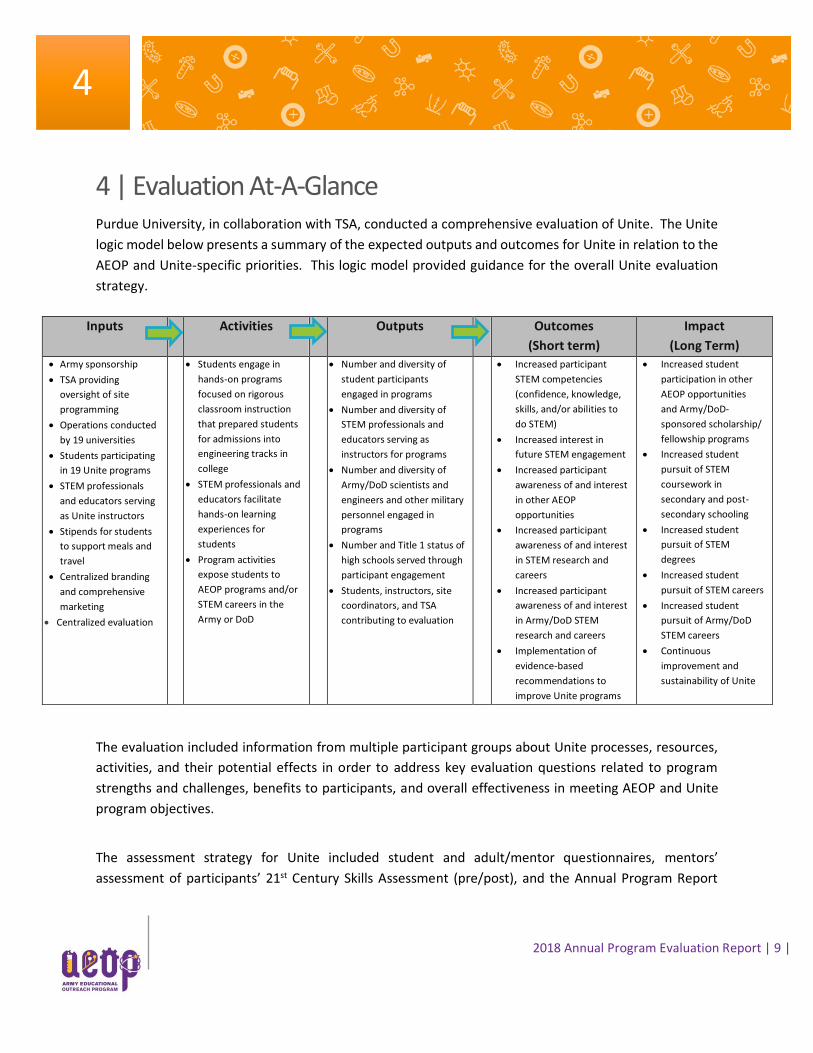
4 | Evaluation At-A-Glance Purdue University, in collaboration with TSA, conducted a comprehensive evaluation of Unite. The Unite
logic model below presents a summary of the expected outputs and outcomes for Unite in relation to the
AEOP and Unite-specific priorities. This logic model provided guidance for the overall Unite evaluation
strategy.
Inputs Activities Outputs Outcomes
(Short term)
Impact
(Long Term)
• Army sponsorship
• TSA providing
oversight of site
programming
• Operations conducted
by 19 universities
• Students participating
in 19 Unite programs
• STEM professionals
and educators serving
as Unite instructors
• Stipends for students
to support meals and
travel
• Centralized branding
and comprehensive
marketing
• Centralized evaluation
• • Students engage in
hands-on programs
focused on rigorous
classroom instruction
that prepared students
for admissions into
engineering tracks in
college
• STEM professionals and
educators facilitate
hands-on learning
experiences for
students
• Program activities
expose students to
AEOP programs and/or
STEM careers in the
Army or DoD
• Number and diversity of
student participants
engaged in programs
• Number and diversity of
STEM professionals and
educators serving as
instructors for programs
• Number and diversity of
Army/DoD scientists and
engineers and other military
personnel engaged in
programs
• Number and Title 1 status of
high schools served through
participant engagement
• Students, instructors, site
coordinators, and TSA
contributing to evaluation
• Increased participant
STEM competencies
(confidence, knowledge,
skills, and/or abilities to
do STEM)
• Increased interest in
future STEM engagement
• Increased participant
awareness of and interest
in other AEOP
opportunities
• Increased participant
awareness of and interest
in STEM research and
careers
• Increased participant
awareness of and interest
in Army/DoD STEM
research and careers
• Implementation of
evidence-based
recommendations to
improve Unite programs
• Increased student
participation in other
AEOP opportunities
and Army/DoD-
sponsored scholarship/
fellowship programs
• Increased student
pursuit of STEM
coursework in
secondary and post-
secondary schooling
• Increased student
pursuit of STEM
degrees
• Increased student
pursuit of STEM careers
• Increased student
pursuit of Army/DoD
STEM careers
• Continuous
improvement and
sustainability of Unite
The evaluation included information from multiple participant groups about Unite processes, resources,
activities, and their potential effects in order to address key evaluation questions related to program
strengths and challenges, benefits to participants, and overall effectiveness in meeting AEOP and Unite
program objectives.
The assessment strategy for Unite included student and adult/mentor questionnaires, mentors’
assessment of participants’ 21st Century Skills Assessment (pre/post), and the Annual Program Report
4
2018 Annual Program Evaluation Report | 10 |
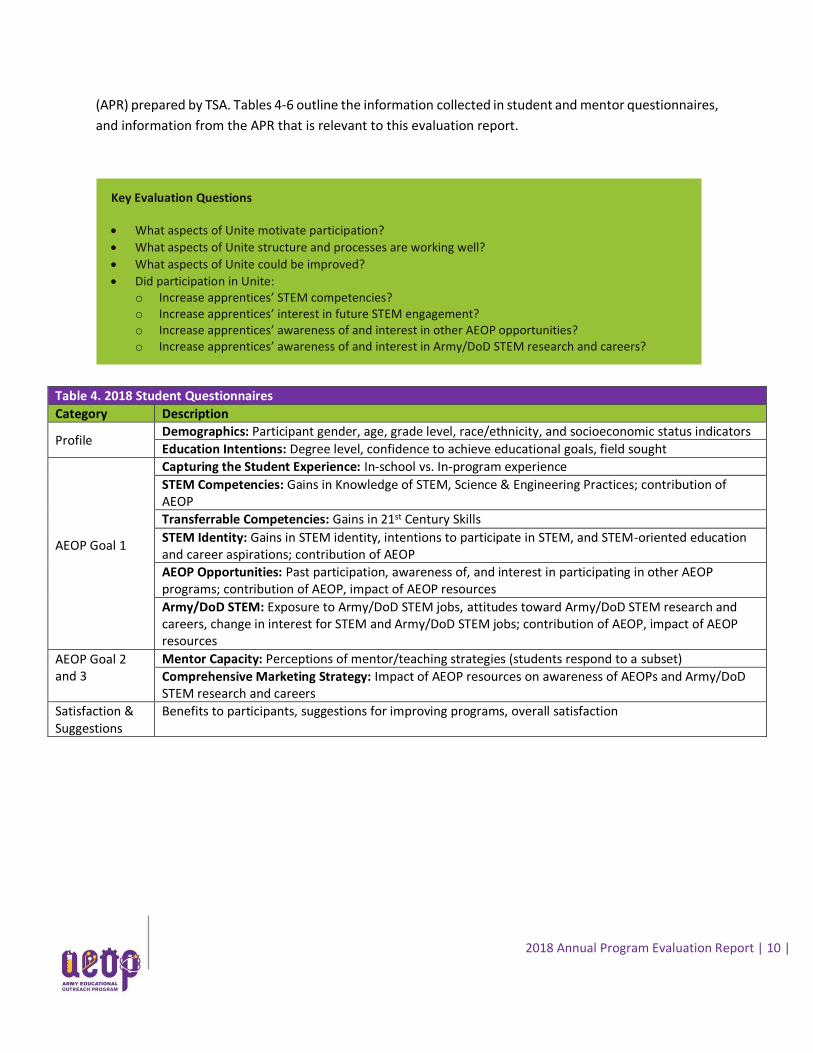
(APR) prepared by TSA. Tables 4-6 outline the information collected in student and mentor questionnaires,
and information from the APR that is relevant to this evaluation report.
Table 4. 2018 Student Questionnaires
Category Description
Profile Demographics: Participant gender, age, grade level, race/ethnicity, and socioeconomic status indicators
Education Intentions: Degree level, confidence to achieve educational goals, field sought
AEOP Goal 1
Capturing the Student Experience: In-school vs. In-program experience
STEM Competencies: Gains in Knowledge of STEM, Science & Engineering Practices; contribution of AEOP
Transferrable Competencies: Gains in 21st Century Skills
STEM Identity: Gains in STEM identity, intentions to participate in STEM, and STEM-oriented education and career aspirations; contribution of AEOP
AEOP Opportunities: Past participation, awareness of, and interest in participating in other AEOP programs; contribution of AEOP, impact of AEOP resources
Army/DoD STEM: Exposure to Army/DoD STEM jobs, attitudes toward Army/DoD STEM research and careers, change in interest for STEM and Army/DoD STEM jobs; contribution of AEOP, impact of AEOP resources
AEOP Goal 2 and 3
Mentor Capacity: Perceptions of mentor/teaching strategies (students respond to a subset)
Comprehensive Marketing Strategy: Impact of AEOP resources on awareness of AEOPs and Army/DoD STEM research and careers
Satisfaction & Suggestions
Benefits to participants, suggestions for improving programs, overall satisfaction
Key Evaluation Questions
• What aspects of Unite motivate participation?
• What aspects of Unite structure and processes are working well?
• What aspects of Unite could be improved?
• Did participation in Unite: o Increase apprentices’ STEM competencies? o Increase apprentices’ interest in future STEM engagement? o Increase apprentices’ awareness of and interest in other AEOP opportunities? o Increase apprentices’ awareness of and interest in Army/DoD STEM research and careers?
2018 Annual Program Evaluation Report | 11 |
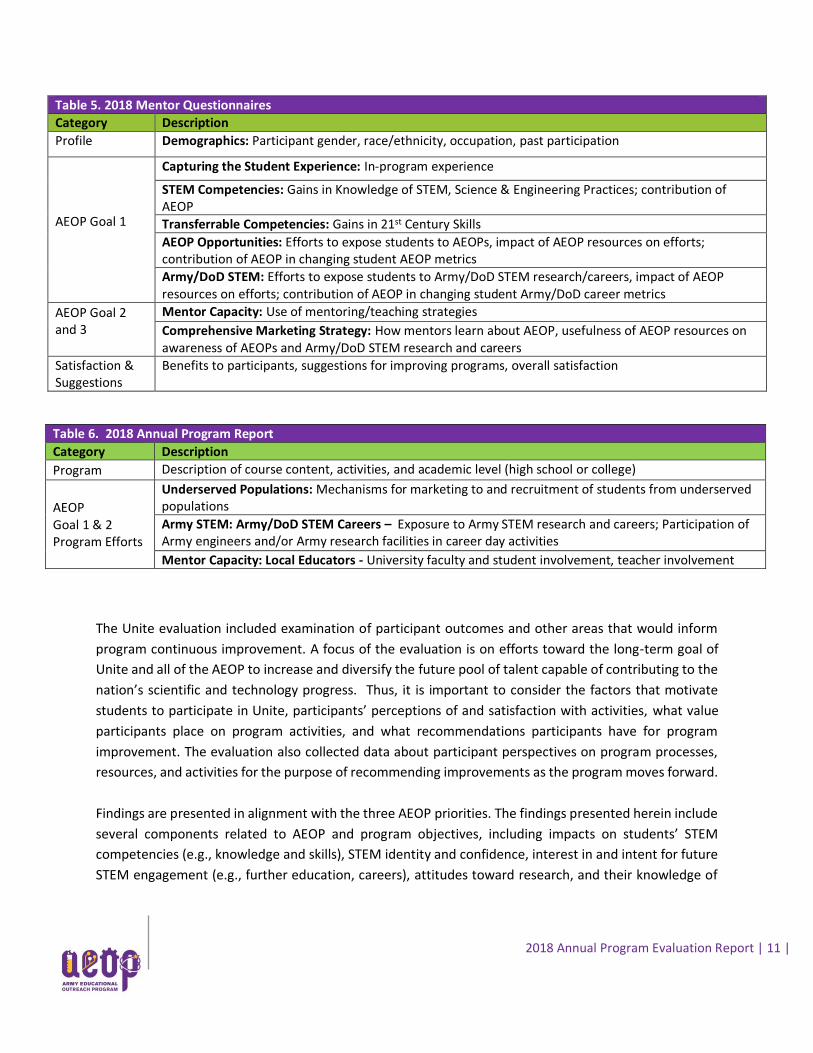
Table 5. 2018 Mentor Questionnaires
Category Description
Profile Demographics: Participant gender, race/ethnicity, occupation, past participation
AEOP Goal 1
Capturing the Student Experience: In-program experience
STEM Competencies: Gains in Knowledge of STEM, Science & Engineering Practices; contribution of AEOP
Transferrable Competencies: Gains in 21st Century Skills
AEOP Opportunities: Efforts to expose students to AEOPs, impact of AEOP resources on efforts; contribution of AEOP in changing student AEOP metrics
Army/DoD STEM: Efforts to expose students to Army/DoD STEM research/careers, impact of AEOP resources on efforts; contribution of AEOP in changing student Army/DoD career metrics
AEOP Goal 2 and 3
Mentor Capacity: Use of mentoring/teaching strategies
Comprehensive Marketing Strategy: How mentors learn about AEOP, usefulness of AEOP resources on awareness of AEOPs and Army/DoD STEM research and careers
Satisfaction & Suggestions
Benefits to participants, suggestions for improving programs, overall satisfaction
Table 6. 2018 Annual Program Report
Category Description
Program Description of course content, activities, and academic level (high school or college)
AEOP Goal 1 & 2 Program Efforts
Underserved Populations: Mechanisms for marketing to and recruitment of students from underserved populations
Army STEM: Army/DoD STEM Careers – Exposure to Army STEM research and careers; Participation of Army engineers and/or Army research facilities in career day activities
Mentor Capacity: Local Educators - University faculty and student involvement, teacher involvement
The Unite evaluation included examination of participant outcomes and other areas that would inform
program continuous improvement. A focus of the evaluation is on efforts toward the long-term goal of
Unite and all of the AEOP to increase and diversify the future pool of talent capable of contributing to the
nation’s scientific and technology progress. Thus, it is important to consider the factors that motivate
students to participate in Unite, participants’ perceptions of and satisfaction with activities, what value
participants place on program activities, and what recommendations participants have for program
improvement. The evaluation also collected data about participant perspectives on program processes,
resources, and activities for the purpose of recommending improvements as the program moves forward.
Findings are presented in alignment with the three AEOP priorities. The findings presented herein include
several components related to AEOP and program objectives, including impacts on students’ STEM
competencies (e.g., knowledge and skills), STEM identity and confidence, interest in and intent for future
STEM engagement (e.g., further education, careers), attitudes toward research, and their knowledge of
2018 Annual Program Evaluation Report | 12 |
and interest in participating in additional AEOP opportunities.2 STEM competencies are necessary for a
STEM-literate citizenry and include foundational knowledge, skills, and abilities in STEM, as well as the
confidence to apply them appropriately. STEM competencies are important not only for those engaging
in STEM enterprises, but also for all members of society as critical consumers of information and effective
decision makers in a world that is heavily reliant on STEM. The evaluation of Unite measured students’
self-reported gains in STEM competencies and engagement in opportunities intended to develop what
are considered to be critical STEM skills in the 21st Century—collaboration and teamwork.
Detailed information about methods and instrumentation, sampling and data collection, and analysis are
described in the appendices. The reader is strongly encouraged to review Appendix A to clarify how data
are summarized, analyzed, and reported in this document. Findings of statistical and/or practical
significance are noted in the report narrative, with tables and footnotes providing results from tests for
significance. The student questionnaire is provided in Appendix B and the mentor questionnaire is
provided in Appendix C. The tool used by mentors to assess students’ 21st Century Skills is included in
Appendix D. Major trends in data and analyses are reported herein.
Study Sample
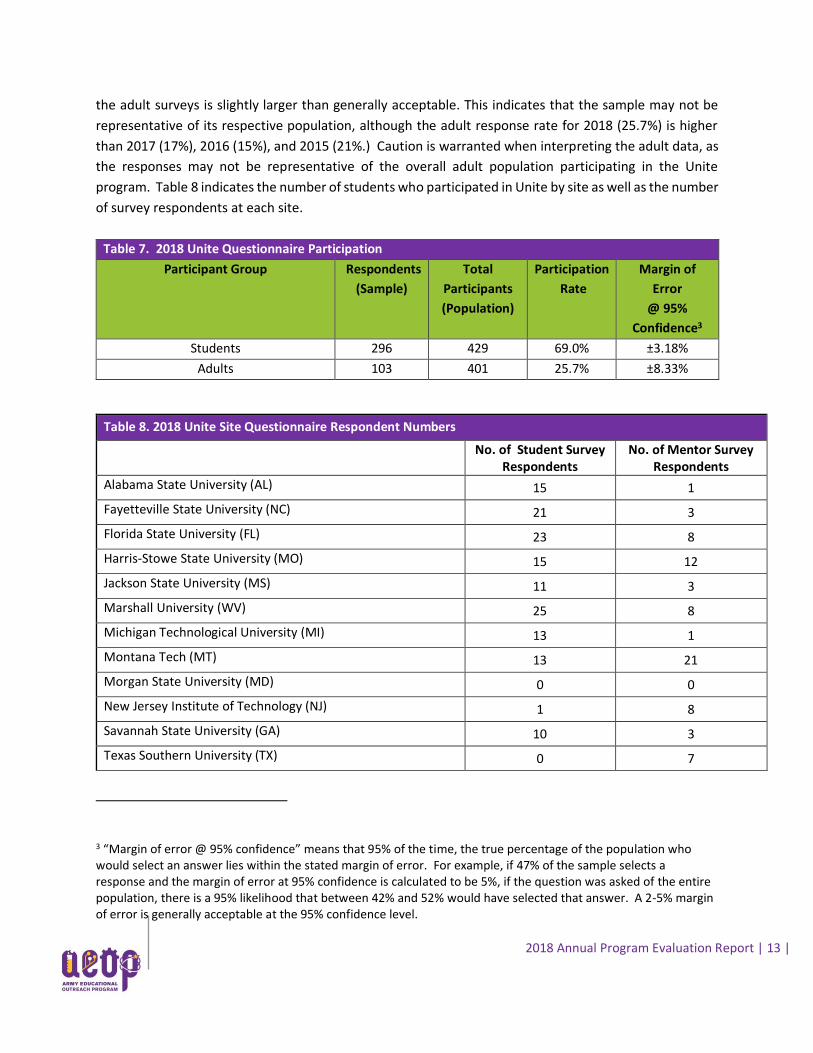
Student and adult data for questionnaire participation are provided in Table 7, which outlines
questionnaire response rate and margin of error at the 95% confidence level (a measure of how
representative the sample is of the population) for both students and adults. The student response rate
for 2018 (61.2%) is slightly lower than 2017 (65%), but is higher than in 2016 (58%) and 2015 (56%).
Furthermore, the student response rate falls within an acceptable margin of error. The margin of error for
2 The outcomes measured in the evaluation study were informed by the following documents:
Committee on STEM Education. (2013). Federal Science, Technology, Engineering, and Mathematics (STEM) education 5-
year strategic plan: A report from the Committee on STEM Education, National Science and Technology Council. Washington,
DC: The White House, Office of Science and Technology Policy.
National Research Council. (2009). Learning Science in Informal Environments: People, Places, and Pursuits. Committee on
Learning Science in Informal Environments. Philip Bell, Bruce Lewenstein, Andrew W. Shouse, and Michael A. Feder, Editors.
Board on Science Education, Center for Education. Division of Behavioral and Social Sciences and Education. Washington, DC:
The National Academies Press.
President’s Council of Advisors on Science and Technology (P-CAST). (February 2012). Engage to Excel: Producing One
Million Additional College Graduates with Degrees in Science, Technology, Engineering, and Mathematics. Executive Office of
the President.
Report of the Academic Competitiveness Council (ACC). (2007). U.S. Department of Education. Available on the Department’s Web site at: http://www.ed.gov/about/inits/ed/competitiveness/acc-mathscience/index.html.
2018 Annual Program Evaluation Report | 13 |
the adult surveys is slightly larger than generally acceptable. This indicates that the sample may not be
representative of its respective population, although the adult response rate for 2018 (25.7%) is higher
than 2017 (17%), 2016 (15%), and 2015 (21%.) Caution is warranted when interpreting the adult data, as
the responses may not be representative of the overall adult population participating in the Unite
program. Table 8 indicates the number of students who participated in Unite by site as well as the number
of survey respondents at each site.
Table 7. 2018 Unite Questionnaire Participation
Participant Group Respondents
(Sample)
Total
Participants
(Population)
Participation
Rate
Margin of
Error
@ 95%
Confidence3
Students 296 429 69.0% ±3.18%
Adults 103 401 25.7% ±8.33%
Table 8. 2018 Unite Site Questionnaire Respondent Numbers
No. of Student Survey Respondents
No. of Mentor Survey Respondents
Alabama State University (AL) 15 1
Fayetteville State University (NC) 21 3
Florida State University (FL) 23 8
Harris-Stowe State University (MO) 15 12
Jackson State University (MS) 11 3
Marshall University (WV) 25 8
Michigan Technological University (MI) 13 1
Montana Tech (MT) 13 21
Morgan State University (MD) 0 0
New Jersey Institute of Technology (NJ) 1 8
Savannah State University (GA) 10 3
Texas Southern University (TX) 0 7
3 “Margin of error @ 95% confidence” means that 95% of the time, the true percentage of the population who would select an answer lies within the stated margin of error. For example, if 47% of the sample selects a response and the margin of error at 95% confidence is calculated to be 5%, if the question was asked of the entire population, there is a 95% likelihood that between 42% and 52% would have selected that answer. A 2-5% margin of error is generally acceptable at the 95% confidence level.
2018 Annual Program Evaluation Report | 14 |
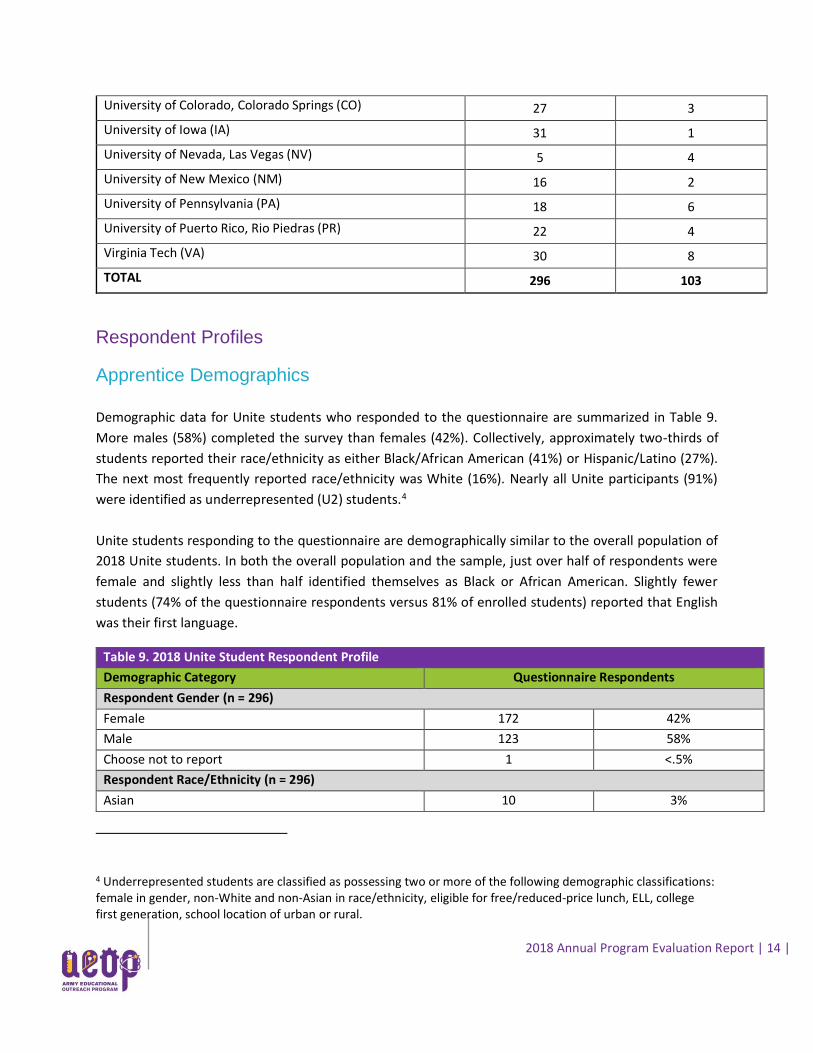
University of Colorado, Colorado Springs (CO) 27 3
University of Iowa (IA) 31 1
University of Nevada, Las Vegas (NV) 5 4
University of New Mexico (NM) 16 2
University of Pennsylvania (PA) 18 6
University of Puerto Rico, Rio Piedras (PR) 22 4
Virginia Tech (VA) 30 8
TOTAL 296 103
Respondent Profiles
Apprentice Demographics
Demographic data for Unite students who responded to the questionnaire are summarized in Table 9.
More males (58%) completed the survey than females (42%). Collectively, approximately two-thirds of
students reported their race/ethnicity as either Black/African American (41%) or Hispanic/Latino (27%).
The next most frequently reported race/ethnicity was White (16%). Nearly all Unite participants (91%)
were identified as underrepresented (U2) students.4
Unite students responding to the questionnaire are demographically similar to the overall population of
2018 Unite students. In both the overall population and the sample, just over half of respondents were
female and slightly less than half identified themselves as Black or African American. Slightly fewer
students (74% of the questionnaire respondents versus 81% of enrolled students) reported that English
was their first language.
4 Underrepresented students are classified as possessing two or more of the following demographic classifications: female in gender, non-White and non-Asian in race/ethnicity, eligible for free/reduced-price lunch, ELL, college first generation, school location of urban or rural.
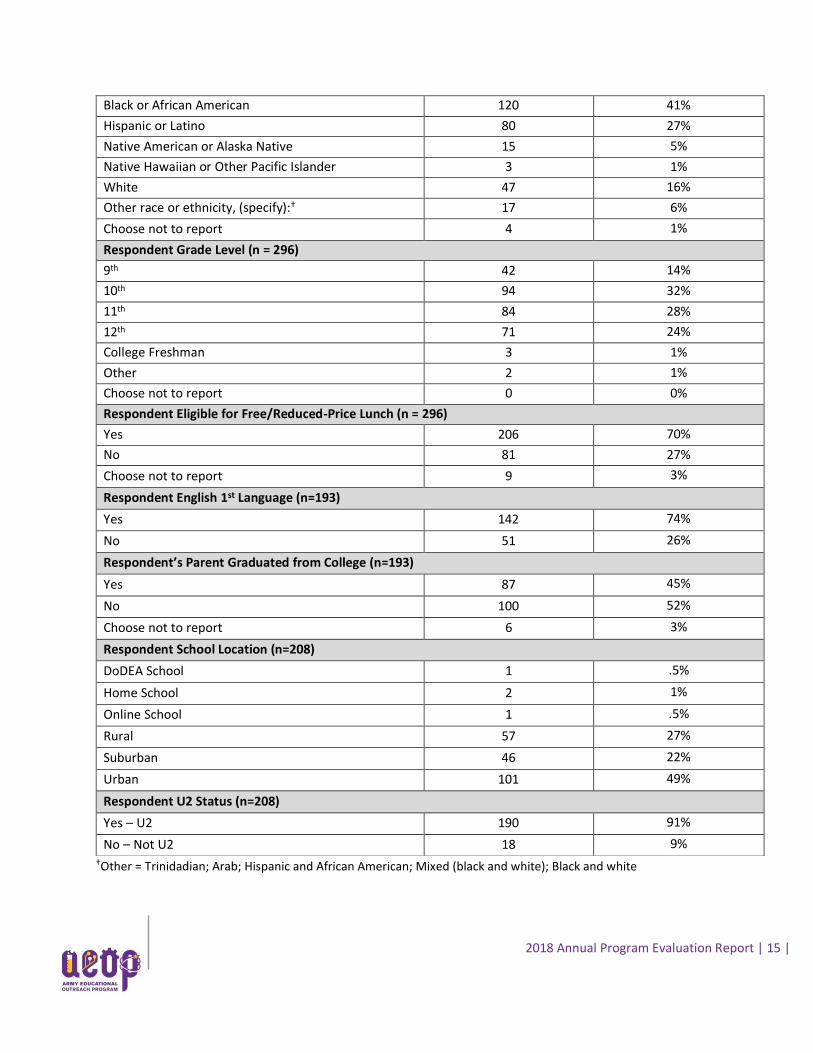
Table 9. 2018 Unite Student Respondent Profile
Demographic Category Questionnaire Respondents
Respondent Gender (n = 296)
Female 172 42%
Male 123 58%
Choose not to report 1 <.5%
Respondent Race/Ethnicity (n = 296)
Asian 10 3%
2018 Annual Program Evaluation Report | 15 |
†Other = Trinidadian; Arab; Hispanic and African American; Mixed (black and white); Black and white
Black or African American 120 41%
Hispanic or Latino 80 27%
Native American or Alaska Native 15 5%
Native Hawaiian or Other Pacific Islander 3 1%
White 47 16%
Other race or ethnicity, (specify):† 17 6%
Choose not to report 4 1%
Respondent Grade Level (n = 296)
9th 42 14%
10th 94 32%
11th 84 28%
12th 71 24%
College Freshman 3 1%
Other 2 1%
Choose not to report 0 0%
Respondent Eligible for Free/Reduced-Price Lunch (n = 296)
Yes 206 70%
No 81 27%
Choose not to report 9 3%
Respondent English 1st Language (n=193)
Yes 142 74%
No 51 26%
Respondent’s Parent Graduated from College (n=193)
Yes 87 45%
No 100 52%
Choose not to report 6 3%
Respondent School Location (n=208)
DoDEA School 1 .5%
Home School 2 1%
Online School 1 .5%
Rural 57 27%
Suburban 46 22%
Urban 101 49%
Respondent U2 Status (n=208)
Yes – U2 190 91%
No – Not U2 18 9%
2018 Annual Program Evaluation Report | 16 |
Mentor Demographics
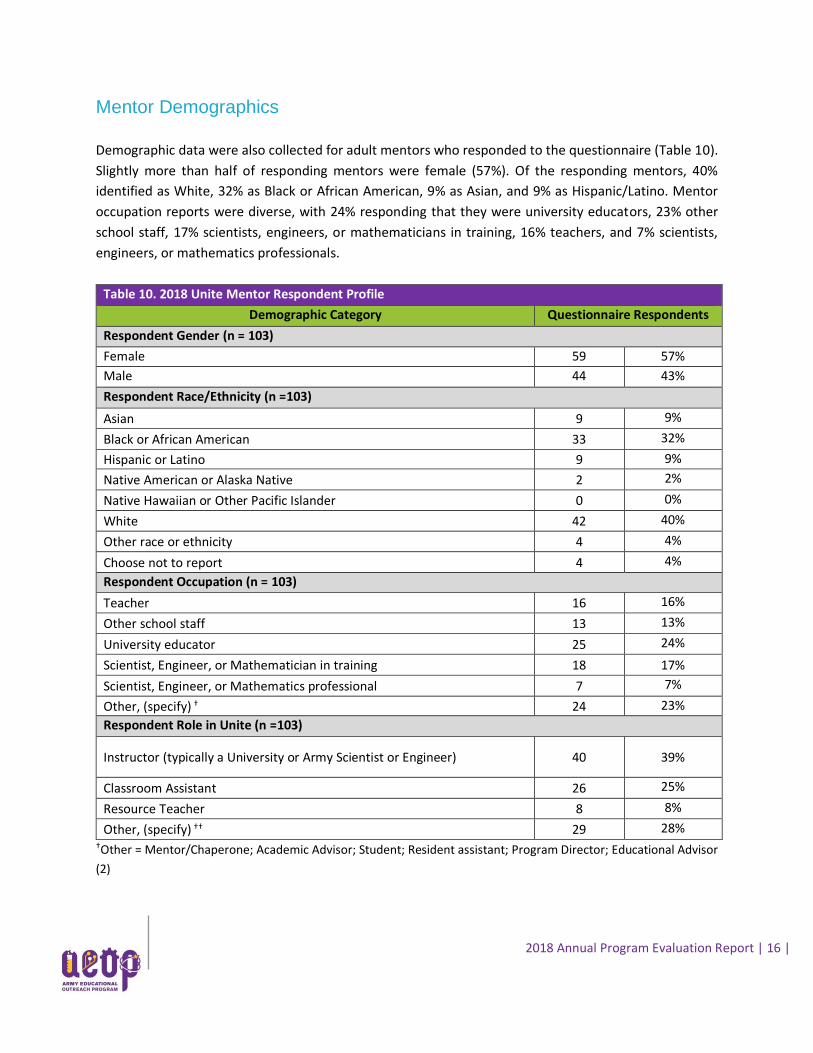
Demographic data were also collected for adult mentors who responded to the questionnaire (Table 10).
Slightly more than half of responding mentors were female (57%). Of the responding mentors, 40%
identified as White, 32% as Black or African American, 9% as Asian, and 9% as Hispanic/Latino. Mentor
occupation reports were diverse, with 24% responding that they were university educators, 23% other
school staff, 17% scientists, engineers, or mathematicians in training, 16% teachers, and 7% scientists,
engineers, or mathematics professionals.
Table 10. 2018 Unite Mentor Respondent Profile
Demographic Category Questionnaire Respondents
Respondent Gender (n = 103)
Female 59 57%
Male 44 43%
Respondent Race/Ethnicity (n =103)
Asian 9 9%
Black or African American 33 32%
Hispanic or Latino 9 9%
Native American or Alaska Native 2 2%
Native Hawaiian or Other Pacific Islander 0 0%
White 42 40%
Other race or ethnicity 4 4%
Choose not to report 4 4%
Respondent Occupation (n = 103)
Teacher 16 16%
Other school staff 13 13%
University educator 25 24%
Scientist, Engineer, or Mathematician in training 18 17%
Scientist, Engineer, or Mathematics professional 7 7%
Other, (specify) † 24 23%
Respondent Role in Unite (n =103)
Instructor (typically a University or Army Scientist or Engineer) 40 39%
Classroom Assistant 26 25%
Resource Teacher 8 8%
Other, (specify) †† 29 28% †Other = Mentor/Chaperone; Academic Advisor; Student; Resident assistant; Program Director; Educational Advisor
(2)
2018 Annual Program Evaluation Report | 17 |
†† Other = teacher; Program Coordinator; Instructor and PI for the grant; Program Organizer and Instructor; Director
(3); Academic Advisor; Resident Assistant/Mentor; Resident Assistant; Site director; Staff; Director-Professor;
Research Mentor
2018 Annual Program Evaluation Report | 18 |
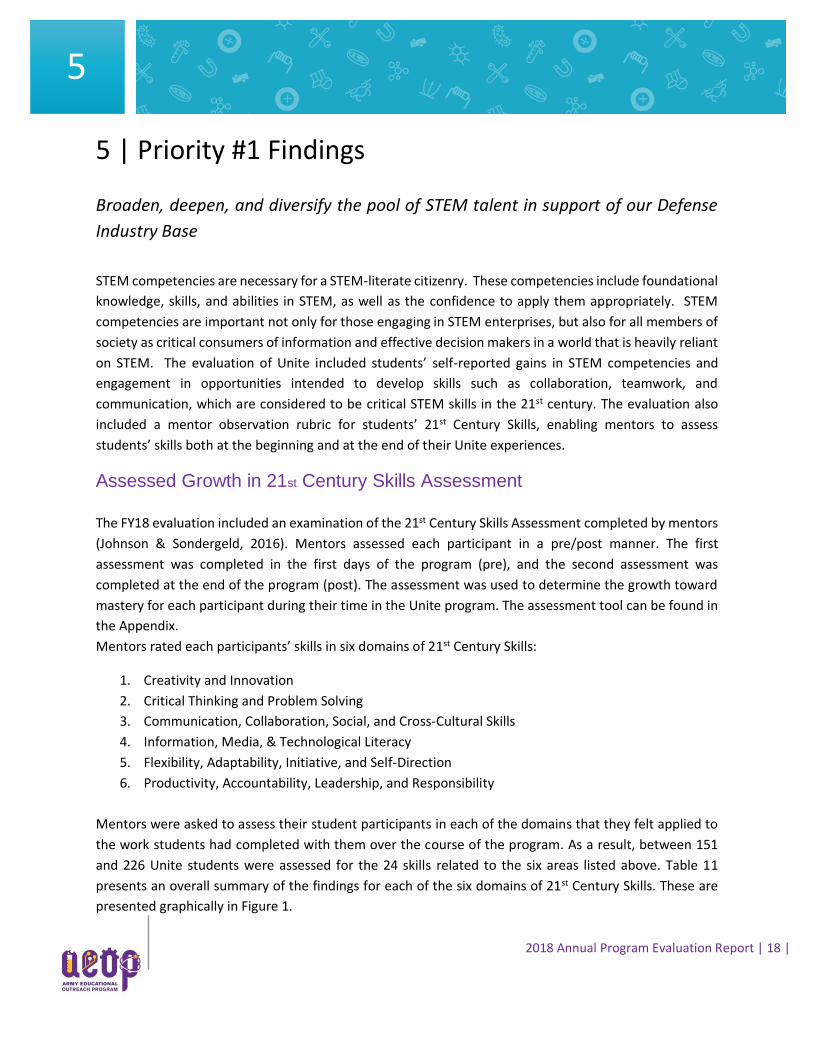
5 | Priority #1 Findings
Broaden, deepen, and diversify the pool of STEM talent in support of our Defense
Industry Base
STEM competencies are necessary for a STEM-literate citizenry. These competencies include foundational
knowledge, skills, and abilities in STEM, as well as the confidence to apply them appropriately. STEM
competencies are important not only for those engaging in STEM enterprises, but also for all members of
society as critical consumers of information and effective decision makers in a world that is heavily reliant
on STEM. The evaluation of Unite included students’ self-reported gains in STEM competencies and
engagement in opportunities intended to develop skills such as collaboration, teamwork, and
communication, which are considered to be critical STEM skills in the 21st century. The evaluation also
included a mentor observation rubric for students’ 21st Century Skills, enabling mentors to assess
students’ skills both at the beginning and at the end of their Unite experiences.
Assessed Growth in 21st Century Skills Assessment
The FY18 evaluation included an examination of the 21st Century Skills Assessment completed by mentors
(Johnson & Sondergeld, 2016). Mentors assessed each participant in a pre/post manner. The first
assessment was completed in the first days of the program (pre), and the second assessment was
completed at the end of the program (post). The assessment was used to determine the growth toward
mastery for each participant during their time in the Unite program. The assessment tool can be found in
the Appendix.
Mentors rated each participants’ skills in six domains of 21st Century Skills:
1. Creativity and Innovation
2. Critical Thinking and Problem Solving
3. Communication, Collaboration, Social, and Cross-Cultural Skills
4. Information, Media, & Technological Literacy
5. Flexibility, Adaptability, Initiative, and Self-Direction
6. Productivity, Accountability, Leadership, and Responsibility
Mentors were asked to assess their student participants in each of the domains that they felt applied to
the work students had completed with them over the course of the program. As a result, between 151
and 226 Unite students were assessed for the 24 skills related to the six areas listed above. Table 11
presents an overall summary of the findings for each of the six domains of 21st Century Skills. These are
presented graphically in Figure 1.
5
2018 Annual Program Evaluation Report | 19 |
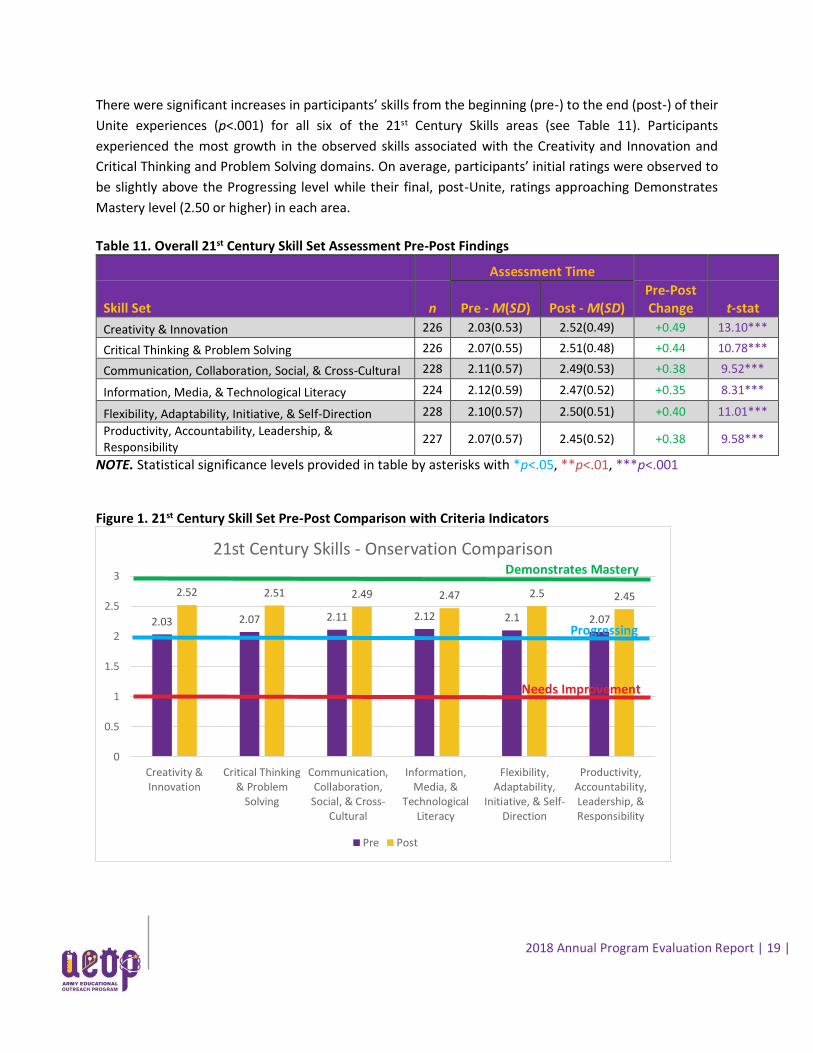
There were significant increases in participants’ skills from the beginning (pre-) to the end (post-) of their
Unite experiences (p<.001) for all six of the 21st Century Skills areas (see Table 11). Participants
experienced the most growth in the observed skills associated with the Creativity and Innovation and
Critical Thinking and Problem Solving domains. On average, participants’ initial ratings were observed to
be slightly above the Progressing level while their final, post-Unite, ratings approaching Demonstrates
Mastery level (2.50 or higher) in each area.
Table 11. Overall 21st Century Skill Set Assessment Pre-Post Findings
Assessment Time
Skill Set n Pre - M(SD) Post - M(SD) Pre-Post Change t-stat
Creativity & Innovation 226 2.03(0.53) 2.52(0.49) +0.49 13.10***
Critical Thinking & Problem Solving 226 2.07(0.55) 2.51(0.48) +0.44 10.78***
Communication, Collaboration, Social, & Cross-Cultural 228 2.11(0.57) 2.49(0.53) +0.38 9.52***
Information, Media, & Technological Literacy 224 2.12(0.59) 2.47(0.52) +0.35 8.31***
Flexibility, Adaptability, Initiative, & Self-Direction 228 2.10(0.57) 2.50(0.51) +0.40 11.01***
Productivity, Accountability, Leadership, & Responsibility
227 2.07(0.57) 2.45(0.52) +0.38 9.58***
NOTE. Statistical significance levels provided in table by asterisks with *p<.05, **p<.01, ***p<.001 Figure 1. 21st Century Skill Set Pre-Post Comparison with Criteria Indicators
2.03 2.07 2.11 2.12 2.1 2.07
2.52 2.51 2.49 2.47 2.5 2.45
0
0.5
1
1.5
2
2.5
3
Creativity &Innovation
Critical Thinking& Problem
Solving
Communication,Collaboration,
Social, & Cross-Cultural
Information,Media, &
TechnologicalLiteracy
Flexibility,Adaptability,
Initiative, & Self-Direction
Productivity,Accountability,Leadership, &Responsibility
21st Century Skills - Onservation Comparison
Pre Post
Demonstrates Mastery
Needs Improvement
Progressing
2018 Annual Program Evaluation Report | 20 |
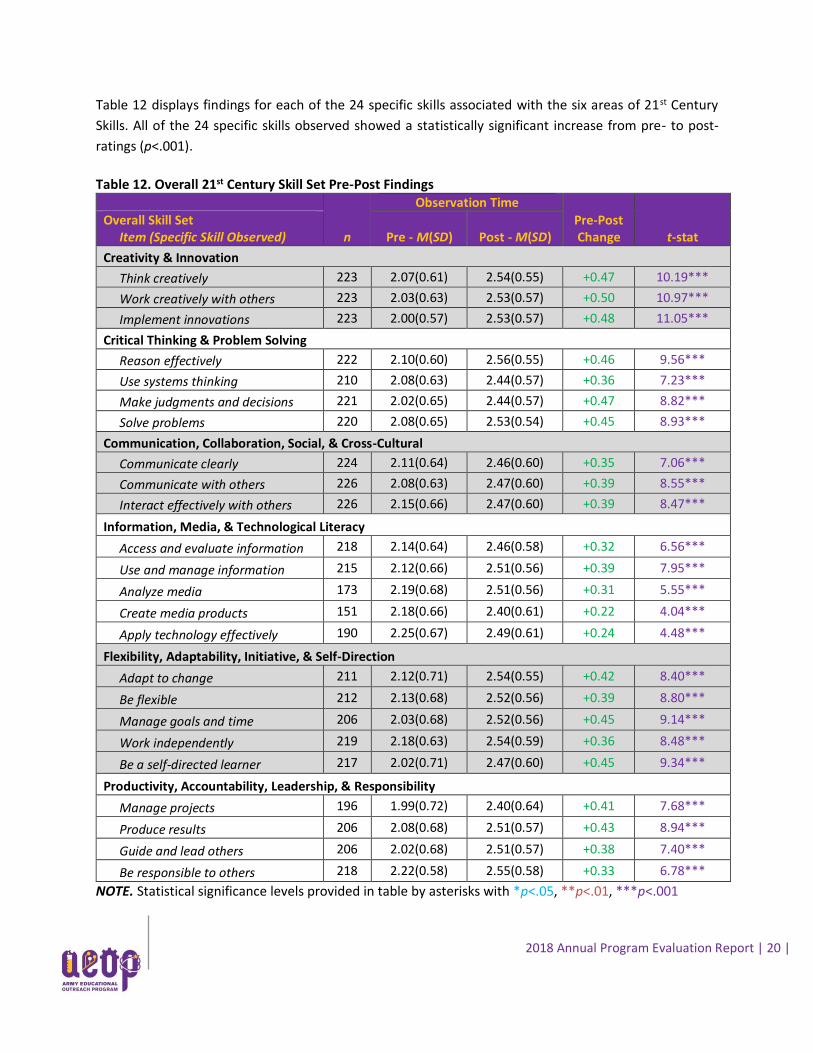
Table 12 displays findings for each of the 24 specific skills associated with the six areas of 21st Century
Skills. All of the 24 specific skills observed showed a statistically significant increase from pre- to post-
ratings (p<.001).
Table 12. Overall 21st Century Skill Set Pre-Post Findings
n
Observation Time
Pre-Post Change t-stat
Overall Skill Set Item (Specific Skill Observed) Pre - M(SD) Post - M(SD)
Creativity & Innovation
Think creatively 223 2.07(0.61) 2.54(0.55) +0.47 10.19***
Work creatively with others 223 2.03(0.63) 2.53(0.57) +0.50 10.97***
Implement innovations 223 2.00(0.57) 2.53(0.57) +0.48 11.05***
Critical Thinking & Problem Solving
Reason effectively 222 2.10(0.60) 2.56(0.55) +0.46 9.56***
Use systems thinking 210 2.08(0.63) 2.44(0.57) +0.36 7.23***
Make judgments and decisions 221 2.02(0.65) 2.44(0.57) +0.47 8.82***
Solve problems 220 2.08(0.65) 2.53(0.54) +0.45 8.93***
Communication, Collaboration, Social, & Cross-Cultural
Communicate clearly 224 2.11(0.64) 2.46(0.60) +0.35 7.06***
Communicate with others 226 2.08(0.63) 2.47(0.60) +0.39 8.55***
Interact effectively with others 226 2.15(0.66) 2.47(0.60) +0.39 8.47***
Information, Media, & Technological Literacy
Access and evaluate information 218 2.14(0.64) 2.46(0.58) +0.32 6.56***
Use and manage information 215 2.12(0.66) 2.51(0.56) +0.39 7.95***
Analyze media 173 2.19(0.68) 2.51(0.56) +0.31 5.55***
Create media products 151 2.18(0.66) 2.40(0.61) +0.22 4.04***
Apply technology effectively 190 2.25(0.67) 2.49(0.61) +0.24 4.48***
Flexibility, Adaptability, Initiative, & Self-Direction
Adapt to change 211 2.12(0.71) 2.54(0.55) +0.42 8.40***
Be flexible 212 2.13(0.68) 2.52(0.56) +0.39 8.80***
Manage goals and time 206 2.03(0.68) 2.52(0.56) +0.45 9.14***
Work independently 219 2.18(0.63) 2.54(0.59) +0.36 8.48***
Be a self-directed learner 217 2.02(0.71) 2.47(0.60) +0.45 9.34***
Productivity, Accountability, Leadership, & Responsibility
Manage projects 196 1.99(0.72) 2.40(0.64) +0.41 7.68***
Produce results 206 2.08(0.68) 2.51(0.57) +0.43 8.94***
Guide and lead others 206 2.02(0.68) 2.51(0.57) +0.38 7.40***
Be responsible to others 218 2.22(0.58) 2.55(0.58) +0.33 6.78***
NOTE. Statistical significance levels provided in table by asterisks with *p<.05, **p<.01, ***p<.001
2018 Annual Program Evaluation Report | 21 |
STEM Practices
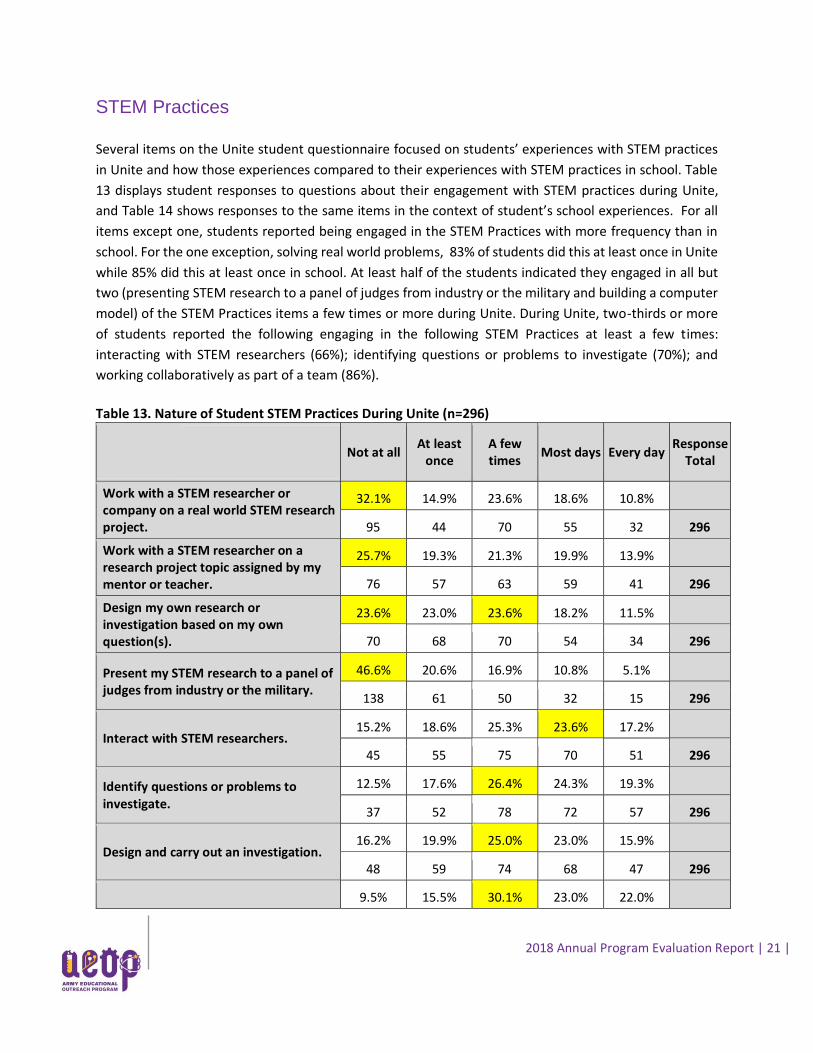
Several items on the Unite student questionnaire focused on students’ experiences with STEM practices
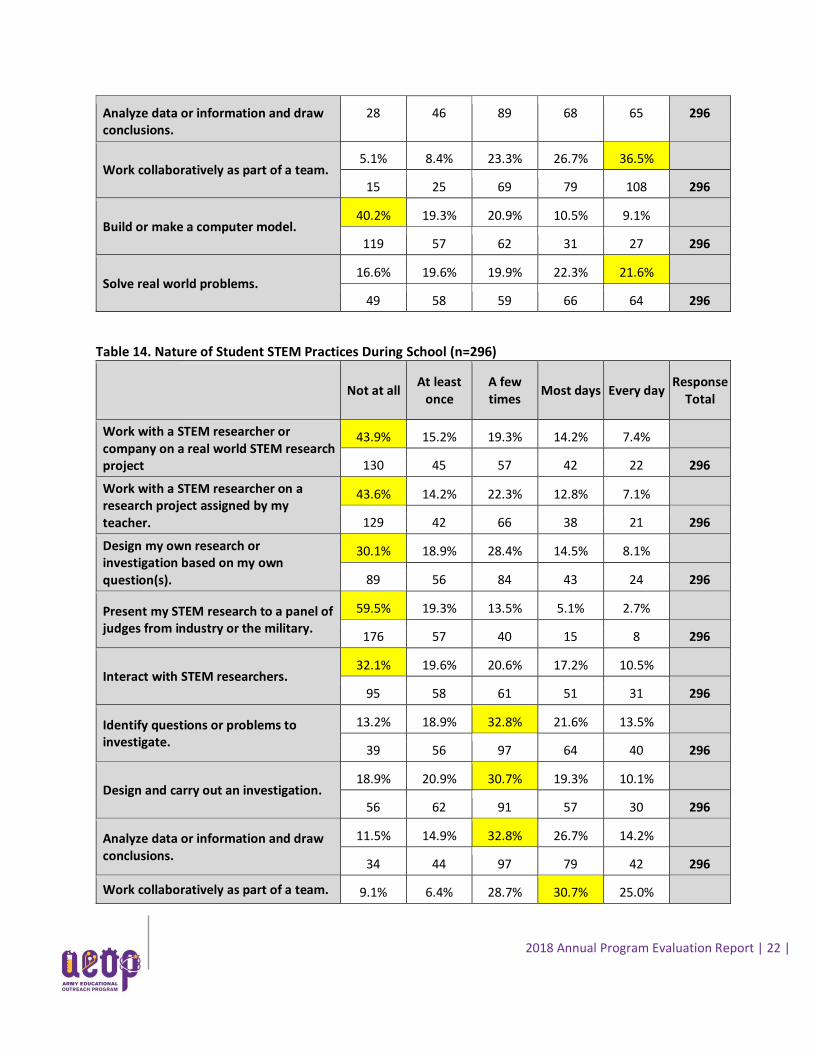
in Unite and how those experiences compared to their experiences with STEM practices in school. Table
13 displays student responses to questions about their engagement with STEM practices during Unite,
and Table 14 shows responses to the same items in the context of student’s school experiences. For all
items except one, students reported being engaged in the STEM Practices with more frequency than in
school. For the one exception, solving real world problems, 83% of students did this at least once in Unite
while 85% did this at least once in school. At least half of the students indicated they engaged in all but
two (presenting STEM research to a panel of judges from industry or the military and building a computer
model) of the STEM Practices items a few times or more during Unite. During Unite, two-thirds or more
of students reported the following engaging in the following STEM Practices at least a few times:
interacting with STEM researchers (66%); identifying questions or problems to investigate (70%); and
working collaboratively as part of a team (86%).
Table 13. Nature of Student STEM Practices During Unite (n=296)
Not at all At least
once A few times
Most days Every day Response
Total
Work with a STEM researcher or company on a real world STEM research project.
32.1% 14.9% 23.6% 18.6% 10.8%
95 44 70 55 32 296
Work with a STEM researcher on a research project topic assigned by my mentor or teacher.
25.7% 19.3% 21.3% 19.9% 13.9%
76 57 63 59 41 296
Design my own research or investigation based on my own question(s).
23.6% 23.0% 23.6% 18.2% 11.5%
70 68 70 54 34 296
Present my STEM research to a panel of judges from industry or the military.
46.6% 20.6% 16.9% 10.8% 5.1%
138 61 50 32 15 296
Interact with STEM researchers. 15.2% 18.6% 25.3% 23.6% 17.2%
45 55 75 70 51 296
Identify questions or problems to investigate.
12.5% 17.6% 26.4% 24.3% 19.3%
37 52 78 72 57 296
Design and carry out an investigation. 16.2% 19.9% 25.0% 23.0% 15.9%
48 59 74 68 47 296
9.5% 15.5% 30.1% 23.0% 22.0%
2018 Annual Program Evaluation Report | 22 |
Analyze data or information and draw conclusions.
28 46 89 68 65 296
Work collaboratively as part of a team. 5.1% 8.4% 23.3% 26.7% 36.5%
15 25 69 79 108 296
Build or make a computer model. 40.2% 19.3% 20.9% 10.5% 9.1%
119 57 62 31 27 296
Solve real world problems. 16.6% 19.6% 19.9% 22.3% 21.6%
49 58 59 66 64 296
Table 14. Nature of Student STEM Practices During School (n=296)
Not at all At least
once A few times
Most days Every day Response
Total
Work with a STEM researcher or company on a real world STEM research project
43.9% 15.2% 19.3% 14.2% 7.4%
130 45 57 42 22 296
Work with a STEM researcher on a research project assigned by my teacher.
43.6% 14.2% 22.3% 12.8% 7.1%
129 42 66 38 21 296
Design my own research or investigation based on my own question(s).
30.1% 18.9% 28.4% 14.5% 8.1%
89 56 84 43 24 296
Present my STEM research to a panel of judges from industry or the military.
59.5% 19.3% 13.5% 5.1% 2.7%
176 57 40 15 8 296
Interact with STEM researchers. 32.1% 19.6% 20.6% 17.2% 10.5%
95 58 61 51 31 296
Identify questions or problems to investigate.
13.2% 18.9% 32.8% 21.6% 13.5%
39 56 97 64 40 296
Design and carry out an investigation. 18.9% 20.9% 30.7% 19.3% 10.1%
56 62 91 57 30 296
Analyze data or information and draw conclusions.
11.5% 14.9% 32.8% 26.7% 14.2%
34 44 97 79 42 296
Work collaboratively as part of a team. 9.1% 6.4% 28.7% 30.7% 25.0%
2018 Annual Program Evaluation Report | 23 |
27 19 85 91 74 296
Build or make a computer model. 47.6% 21.3% 16.9% 9.5% 4.7%
141 63 50 28 14 296
Solve real world problems. 14.9% 21.3% 25.0% 19.9% 18.9%
44 63 74 59 56 296
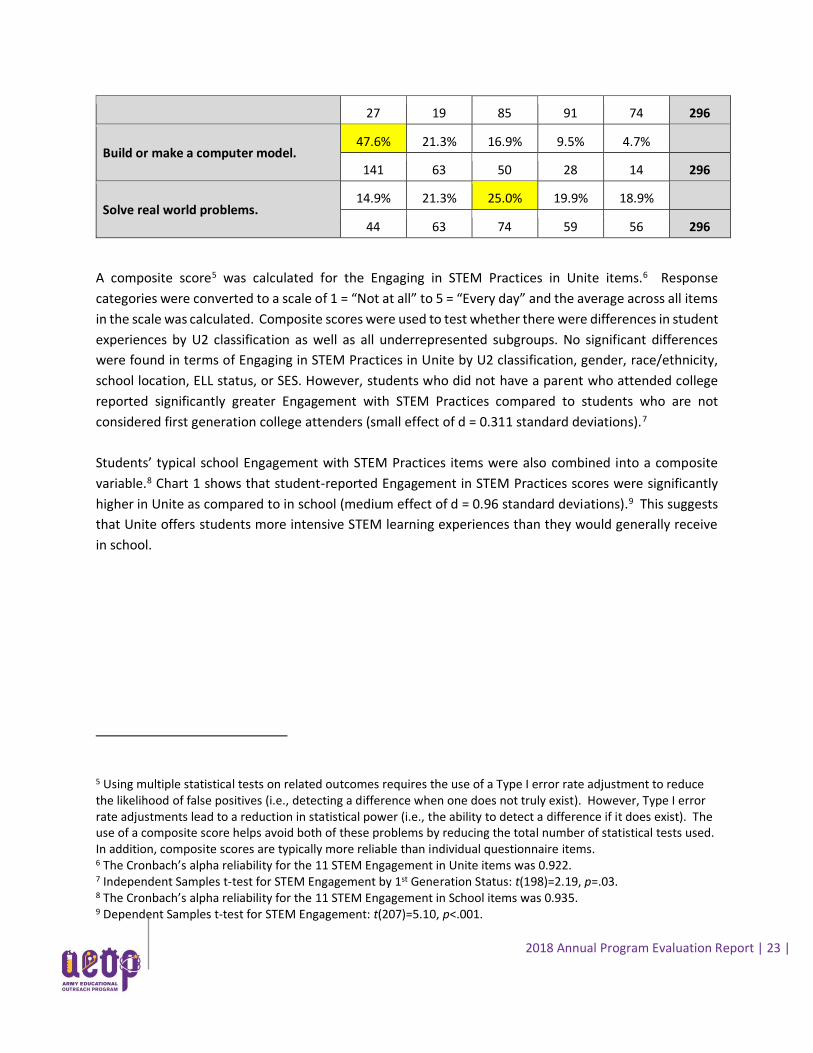
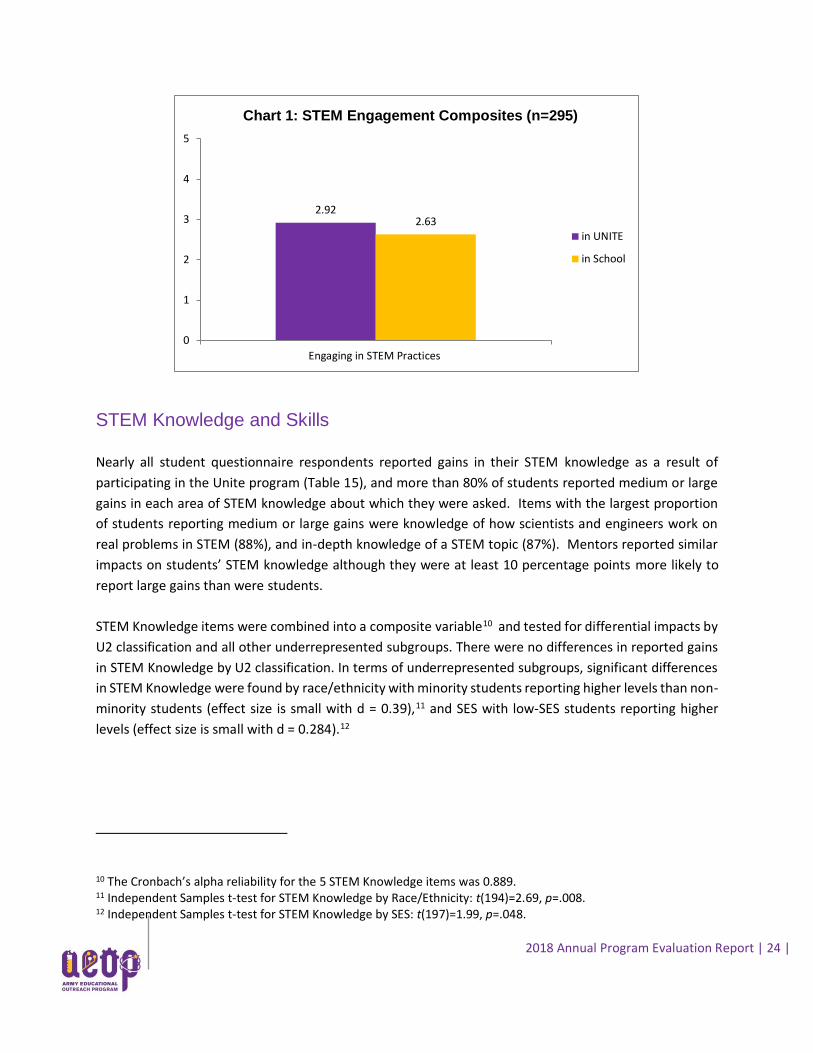
A composite score5 was calculated for the Engaging in STEM Practices in Unite items.6 Response
categories were converted to a scale of 1 = “Not at all” to 5 = “Every day” and the average across all items
in the scale was calculated. Composite scores were used to test whether there were differences in student
experiences by U2 classification as well as all underrepresented subgroups. No significant differences
were found in terms of Engaging in STEM Practices in Unite by U2 classification, gender, race/ethnicity,
school location, ELL status, or SES. However, students who did not have a parent who attended college
reported significantly greater Engagement with STEM Practices compared to students who are not
considered first generation college attenders (small effect of d = 0.311 standard deviations).7
Students’ typical school Engagement with STEM Practices items were also combined into a composite
variable.8 Chart 1 shows that student-reported Engagement in STEM Practices scores were significantly
higher in Unite as compared to in school (medium effect of d = 0.96 standard deviations).9 This suggests
that Unite offers students more intensive STEM learning experiences than they would generally receive
in school.
5 Using multiple statistical tests on related outcomes requires the use of a Type I error rate adjustment to reduce the likelihood of false positives (i.e., detecting a difference when one does not truly exist). However, Type I error rate adjustments lead to a reduction in statistical power (i.e., the ability to detect a difference if it does exist). The use of a composite score helps avoid both of these problems by reducing the total number of statistical tests used. In addition, composite scores are typically more reliable than individual questionnaire items. 6 The Cronbach’s alpha reliability for the 11 STEM Engagement in Unite items was 0.922. 7 Independent Samples t-test for STEM Engagement by 1st Generation Status: t(198)=2.19, p=.03. 8 The Cronbach’s alpha reliability for the 11 STEM Engagement in School items was 0.935. 9 Dependent Samples t-test for STEM Engagement: t(207)=5.10, p<.001.
2018 Annual Program Evaluation Report | 24 |
STEM Knowledge and Skills
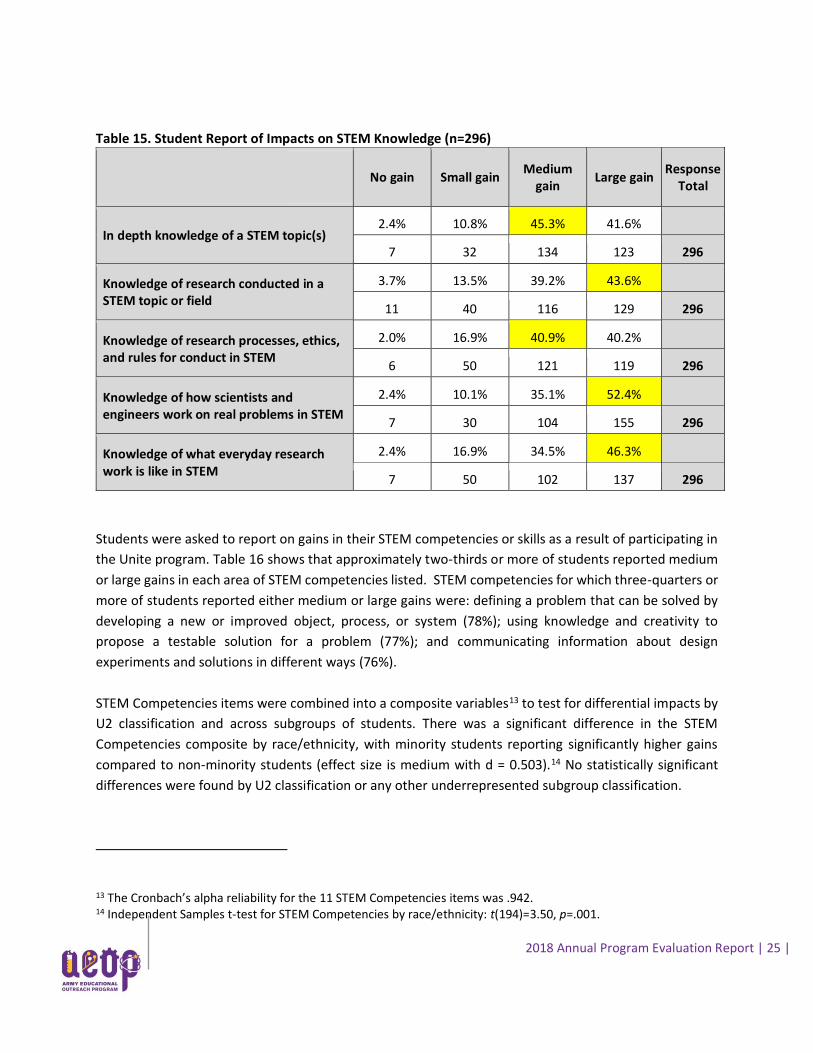
Nearly all student questionnaire respondents reported gains in their STEM knowledge as a result of
participating in the Unite program (Table 15), and more than 80% of students reported medium or large
gains in each area of STEM knowledge about which they were asked. Items with the largest proportion
of students reporting medium or large gains were knowledge of how scientists and engineers work on
real problems in STEM (88%), and in-depth knowledge of a STEM topic (87%). Mentors reported similar
impacts on students’ STEM knowledge although they were at least 10 percentage points more likely to
report large gains than were students.
STEM Knowledge items were combined into a composite variable10 and tested for differential impacts by
U2 classification and all other underrepresented subgroups. There were no differences in reported gains
in STEM Knowledge by U2 classification. In terms of underrepresented subgroups, significant differences
in STEM Knowledge were found by race/ethnicity with minority students reporting higher levels than non-
minority students (effect size is small with d = 0.39),11 and SES with low-SES students reporting higher
levels (effect size is small with d = 0.284).12
10 The Cronbach’s alpha reliability for the 5 STEM Knowledge items was 0.889. 11 Independent Samples t-test for STEM Knowledge by Race/Ethnicity: t(194)=2.69, p=.008. 12 Independent Samples t-test for STEM Knowledge by SES: t(197)=1.99, p=.048.
2.922.63
0
1
2
3
4
5
Engaging in STEM Practices
Chart 1: STEM Engagement Composites (n=295)
in UNITE
in School
2018 Annual Program Evaluation Report | 25 |
Table 15. Student Report of Impacts on STEM Knowledge (n=296)
No gain Small gain Medium
gain Large gain
Response Total
In depth knowledge of a STEM topic(s) 2.4% 10.8% 45.3% 41.6%
7 32 134 123 296
Knowledge of research conducted in a STEM topic or field
3.7% 13.5% 39.2% 43.6%
11 40 116 129 296
Knowledge of research processes, ethics, and rules for conduct in STEM
2.0% 16.9% 40.9% 40.2%
6 50 121 119 296
Knowledge of how scientists and engineers work on real problems in STEM
2.4% 10.1% 35.1% 52.4%
7 30 104 155 296
Knowledge of what everyday research work is like in STEM
2.4% 16.9% 34.5% 46.3%
7 50 102 137 296
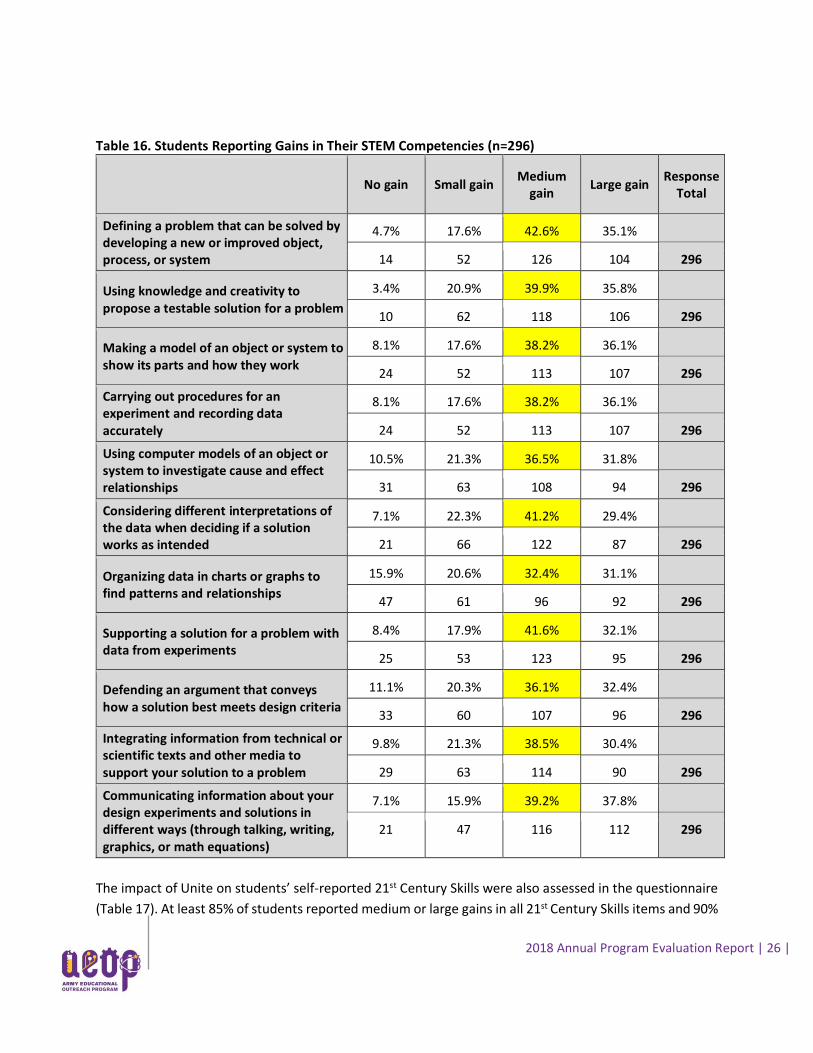
Students were asked to report on gains in their STEM competencies or skills as a result of participating in
the Unite program. Table 16 shows that approximately two-thirds or more of students reported medium
or large gains in each area of STEM competencies listed. STEM competencies for which three-quarters or
more of students reported either medium or large gains were: defining a problem that can be solved by
developing a new or improved object, process, or system (78%); using knowledge and creativity to
propose a testable solution for a problem (77%); and communicating information about design
experiments and solutions in different ways (76%).
STEM Competencies items were combined into a composite variables13 to test for differential impacts by
U2 classification and across subgroups of students. There was a significant difference in the STEM
Competencies composite by race/ethnicity, with minority students reporting significantly higher gains
compared to non-minority students (effect size is medium with d = 0.503).14 No statistically significant
differences were found by U2 classification or any other underrepresented subgroup classification.
13 The Cronbach’s alpha reliability for the 11 STEM Competencies items was .942. 14 Independent Samples t-test for STEM Competencies by race/ethnicity: t(194)=3.50, p=.001.
2018 Annual Program Evaluation Report | 26 |
Table 16. Students Reporting Gains in Their STEM Competencies (n=296)
No gain Small gain Medium
gain Large gain
Response Total
Defining a problem that can be solved by developing a new or improved object, process, or system
4.7% 17.6% 42.6% 35.1%
14 52 126 104 296
Using knowledge and creativity to propose a testable solution for a problem
3.4% 20.9% 39.9% 35.8%
10 62 118 106 296
Making a model of an object or system to show its parts and how they work
8.1% 17.6% 38.2% 36.1%
24 52 113 107 296
Carrying out procedures for an experiment and recording data accurately
8.1% 17.6% 38.2% 36.1%
24 52 113 107 296
Using computer models of an object or system to investigate cause and effect relationships
10.5% 21.3% 36.5% 31.8%
31 63 108 94 296
Considering different interpretations of the data when deciding if a solution works as intended
7.1% 22.3% 41.2% 29.4%
21 66 122 87 296
Organizing data in charts or graphs to find patterns and relationships
15.9% 20.6% 32.4% 31.1%
47 61 96 92 296
Supporting a solution for a problem with data from experiments
8.4% 17.9% 41.6% 32.1%
25 53 123 95 296
Defending an argument that conveys how a solution best meets design criteria
11.1% 20.3% 36.1% 32.4%
33 60 107 96 296
Integrating information from technical or scientific texts and other media to support your solution to a problem
9.8% 21.3% 38.5% 30.4%
29 63 114 90 296
Communicating information about your design experiments and solutions in different ways (through talking, writing, graphics, or math equations)
7.1% 15.9% 39.2% 37.8%
21 47 116 112 296
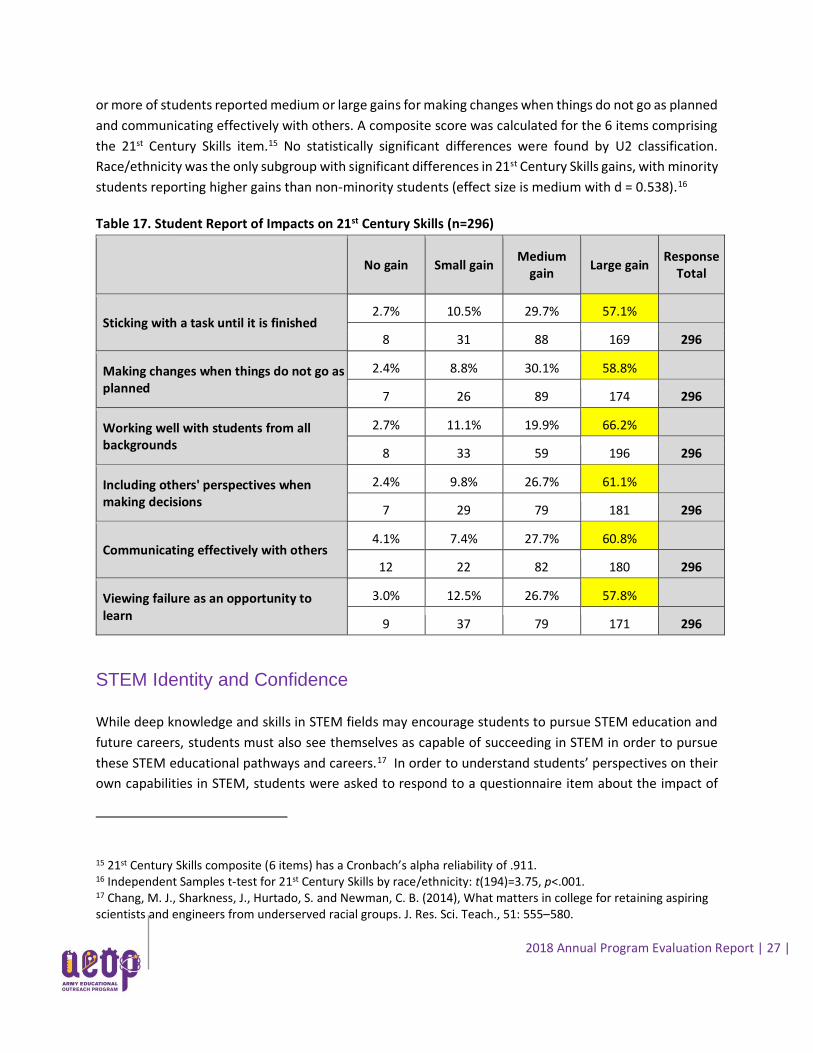
The impact of Unite on students’ self-reported 21st Century Skills were also assessed in the questionnaire
(Table 17). At least 85% of students reported medium or large gains in all 21st Century Skills items and 90%
2018 Annual Program Evaluation Report | 27 |
or more of students reported medium or large gains for making changes when things do not go as planned
and communicating effectively with others. A composite score was calculated for the 6 items comprising
the 21st Century Skills item.15 No statistically significant differences were found by U2 classification.
Race/ethnicity was the only subgroup with significant differences in 21st Century Skills gains, with minority
students reporting higher gains than non-minority students (effect size is medium with d = 0.538).16
Table 17. Student Report of Impacts on 21st Century Skills (n=296)
No gain Small gain Medium
gain Large gain
Response Total
Sticking with a task until it is finished 2.7% 10.5% 29.7% 57.1%
8 31 88 169 296
Making changes when things do not go as planned
2.4% 8.8% 30.1% 58.8%
7 26 89 174 296
Working well with students from all backgrounds
2.7% 11.1% 19.9% 66.2%
8 33 59 196 296
Including others' perspectives when making decisions
2.4% 9.8% 26.7% 61.1%
7 29 79 181 296
Communicating effectively with others 4.1% 7.4% 27.7% 60.8%
12 22 82 180 296
Viewing failure as an opportunity to learn
3.0% 12.5% 26.7% 57.8%
9 37 79 171 296
STEM Identity and Confidence
While deep knowledge and skills in STEM fields may encourage students to pursue STEM education and
future careers, students must also see themselves as capable of succeeding in STEM in order to pursue
these STEM educational pathways and careers.17 In order to understand students’ perspectives on their
own capabilities in STEM, students were asked to respond to a questionnaire item about the impact of
15 21st Century Skills composite (6 items) has a Cronbach’s alpha reliability of .911. 16 Independent Samples t-test for 21st Century Skills by race/ethnicity: t(194)=3.75, p<.001. 17 Chang, M. J., Sharkness, J., Hurtado, S. and Newman, C. B. (2014), What matters in college for retaining aspiring scientists and engineers from underserved racial groups. J. Res. Sci. Teach., 51: 555–580.
2018 Annual Program Evaluation Report | 28 |
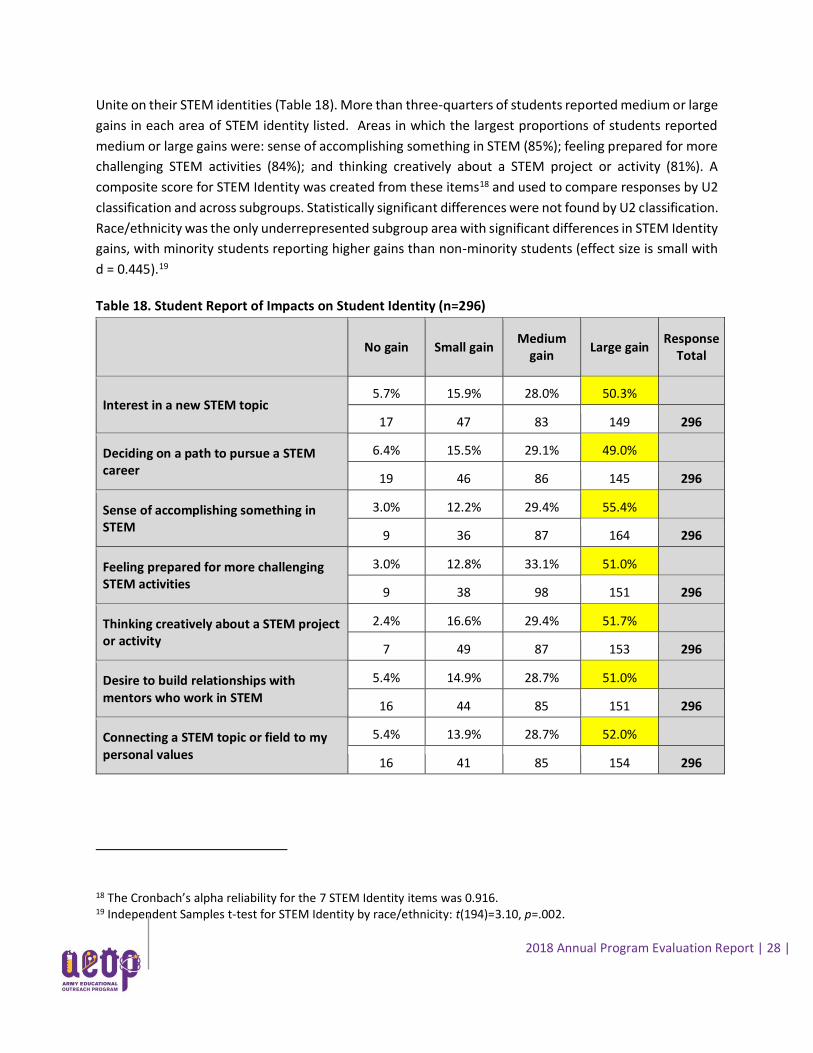
Unite on their STEM identities (Table 18). More than three-quarters of students reported medium or large
gains in each area of STEM identity listed. Areas in which the largest proportions of students reported
medium or large gains were: sense of accomplishing something in STEM (85%); feeling prepared for more
challenging STEM activities (84%); and thinking creatively about a STEM project or activity (81%). A
composite score for STEM Identity was created from these items18 and used to compare responses by U2
classification and across subgroups. Statistically significant differences were not found by U2 classification.
Race/ethnicity was the only underrepresented subgroup area with significant differences in STEM Identity
gains, with minority students reporting higher gains than non-minority students (effect size is small with
d = 0.445).19
Table 18. Student Report of Impacts on Student Identity (n=296)
No gain Small gain Medium
gain Large gain
Response Total
Interest in a new STEM topic 5.7% 15.9% 28.0% 50.3%
17 47 83 149 296
Deciding on a path to pursue a STEM career
6.4% 15.5% 29.1% 49.0%
19 46 86 145 296
Sense of accomplishing something in STEM
3.0% 12.2% 29.4% 55.4%
9 36 87 164 296
Feeling prepared for more challenging STEM activities
3.0% 12.8% 33.1% 51.0%
9 38 98 151 296
Thinking creatively about a STEM project or activity
2.4% 16.6% 29.4% 51.7%
7 49 87 153 296
Desire to build relationships with mentors who work in STEM
5.4% 14.9% 28.7% 51.0%
16 44 85 151 296
Connecting a STEM topic or field to my personal values
5.4% 13.9% 28.7% 52.0%
16 41 85 154 296
18 The Cronbach’s alpha reliability for the 7 STEM Identity items was 0.916. 19 Independent Samples t-test for STEM Identity by race/ethnicity: t(194)=3.10, p=.002.
2018 Annual Program Evaluation Report | 29 |
6 | Priority #2 Findings Support and empower educators with unique Army research and technology
resources.
Mentor Strategies and Support
Mentors play a critical role in the Unite program. Mentors design and facilitate learning activities, deliver
content through instruction, supervise and support collaboration and teamwork, provide one-on-one
support to students, chaperone students, advise students on educational and career paths, and generally
serve as STEM role models for Unite students.
Mentors were asked whether or not they used a number of strategies when working with students (see
Tables 20-24). These strategies comprised five main areas of effective mentoring:20
1. Establishing the relevance of learning activities;
2. Supporting the diverse needs of students as learners;
3. Supporting students’ development of collaboration and interpersonal skills;
4. Supporting students’ engagement in “authentic” STEM activities; and
5. Supporting students’ STEM educational and career pathways.
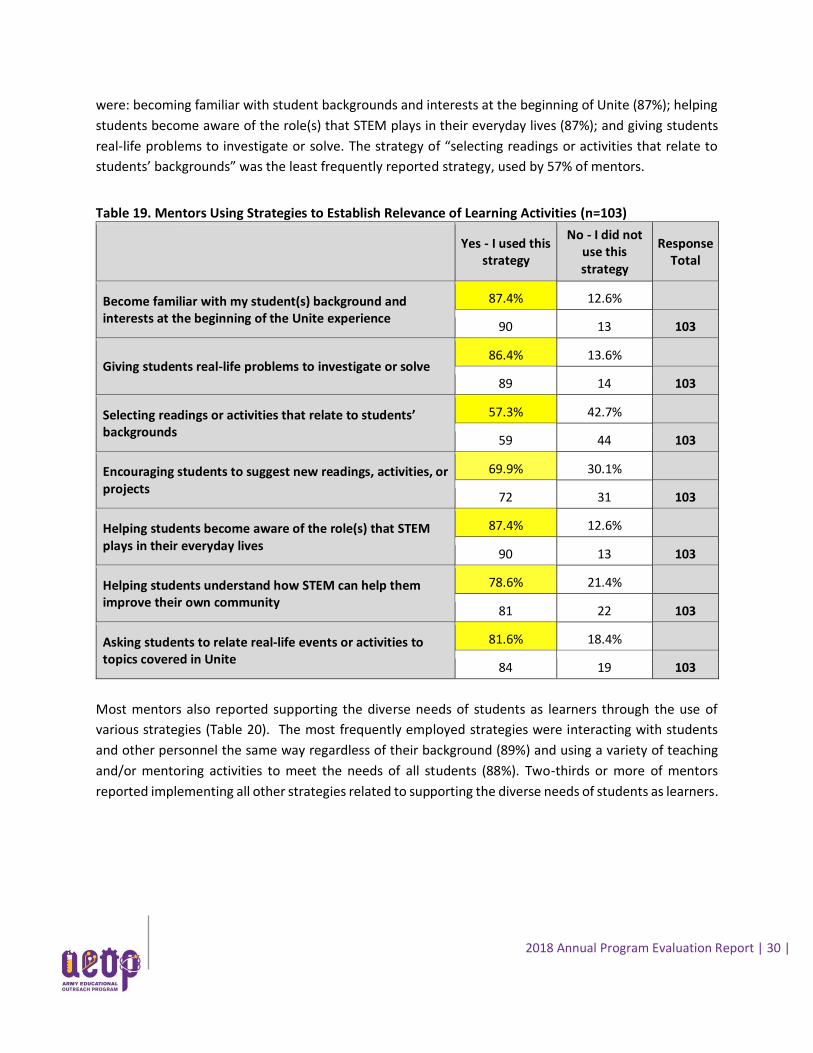
When asked about their use of strategies to help make learning activities relevant to students, more than
half of mentors reported using all strategies listed (Table 19). The most frequently reported strategies
20 Mentoring strategies examined in the evaluation were best practices identified in various articles including:
Maltese, A. V., & Tai, R. H. (2011). Pipeline persistence: Examining the association of educational experiences with earned degrees in STEM among US students. Science Education, 95(5), 877-907.
Ornstein, A. (2006). The frequency of hands-on experimentation and student attitudes toward science: A statistically significant relation (2005-51-Ornstein). Journal of Science Education and Technology, 15(3-4), 285-297.
Sadler, P. M., Sonnert, G., Hazari, Z., & Tai, R. (2012). Stability and volatility of STEM career interest in high school: A gender study. Science Education, 96(3), 411-427.
6
2018 Annual Program Evaluation Report | 30 |
were: becoming familiar with student backgrounds and interests at the beginning of Unite (87%); helping
students become aware of the role(s) that STEM plays in their everyday lives (87%); and giving students
real-life problems to investigate or solve. The strategy of “selecting readings or activities that relate to
students’ backgrounds” was the least frequently reported strategy, used by 57% of mentors.
Table 19. Mentors Using Strategies to Establish Relevance of Learning Activities (n=103)
Yes - I used this strategy
No - I did not use this strategy
Response Total
Become familiar with my student(s) background and interests at the beginning of the Unite experience
87.4% 12.6%
90 13 103
Giving students real-life problems to investigate or solve 86.4% 13.6%
89 14 103
Selecting readings or activities that relate to students’ backgrounds
57.3% 42.7%
59 44 103
Encouraging students to suggest new readings, activities, or projects
69.9% 30.1%
72 31 103
Helping students become aware of the role(s) that STEM plays in their everyday lives
87.4% 12.6%
90 13 103
Helping students understand how STEM can help them improve their own community
78.6% 21.4%
81 22 103
Asking students to relate real-life events or activities to topics covered in Unite
81.6% 18.4%
84 19 103
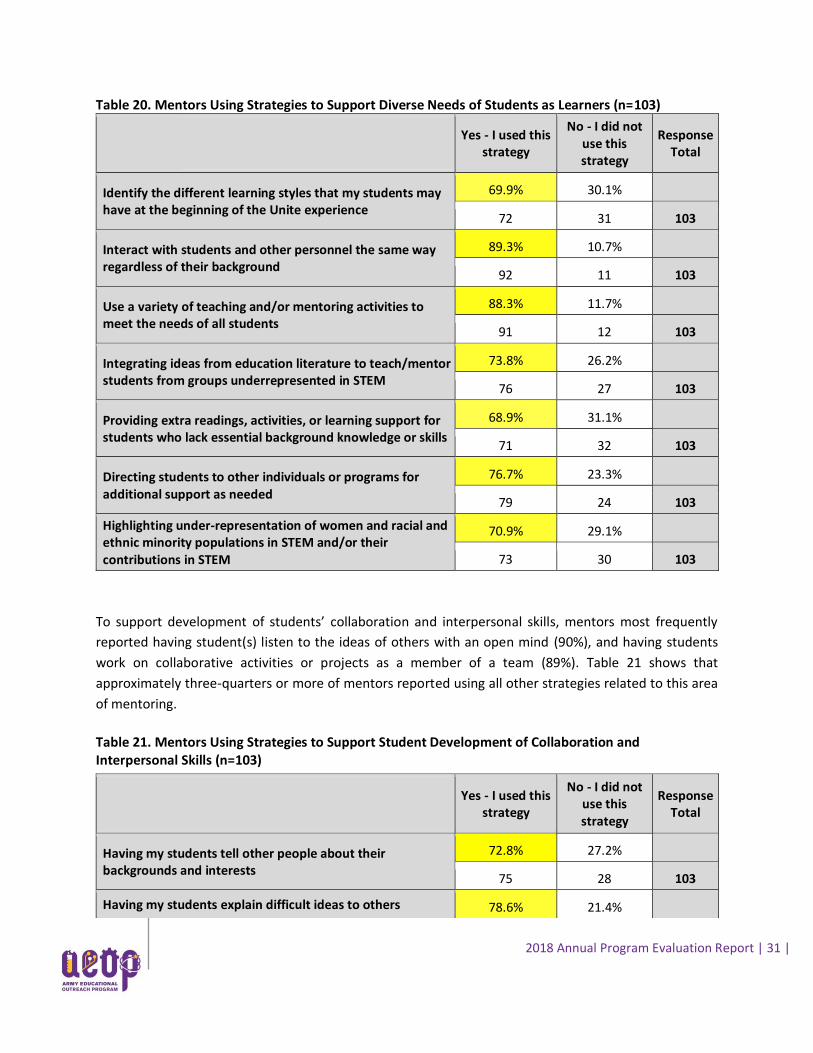
Most mentors also reported supporting the diverse needs of students as learners through the use of
various strategies (Table 20). The most frequently employed strategies were interacting with students
and other personnel the same way regardless of their background (89%) and using a variety of teaching
and/or mentoring activities to meet the needs of all students (88%). Two-thirds or more of mentors
reported implementing all other strategies related to supporting the diverse needs of students as learners.
2018 Annual Program Evaluation Report | 31 |
Table 20. Mentors Using Strategies to Support Diverse Needs of Students as Learners (n=103)
Yes - I used this strategy
No - I did not use this strategy
Response Total
Identify the different learning styles that my students may have at the beginning of the Unite experience
69.9% 30.1%
72 31 103
Interact with students and other personnel the same way regardless of their background
89.3% 10.7%
92 11 103
Use a variety of teaching and/or mentoring activities to meet the needs of all students
88.3% 11.7%
91 12 103
Integrating ideas from education literature to teach/mentor students from groups underrepresented in STEM
73.8% 26.2%
76 27 103
Providing extra readings, activities, or learning support for students who lack essential background knowledge or skills
68.9% 31.1%
71 32 103
Directing students to other individuals or programs for additional support as needed
76.7% 23.3%
79 24 103
Highlighting under-representation of women and racial and ethnic minority populations in STEM and/or their contributions in STEM
70.9% 29.1%
73 30 103
To support development of students’ collaboration and interpersonal skills, mentors most frequently
reported having student(s) listen to the ideas of others with an open mind (90%), and having students
work on collaborative activities or projects as a member of a team (89%). Table 21 shows that
approximately three-quarters or more of mentors reported using all other strategies related to this area
of mentoring.
Table 21. Mentors Using Strategies to Support Student Development of Collaboration and Interpersonal Skills (n=103)
Yes - I used this strategy
No - I did not use this strategy
Response Total
Having my students tell other people about their backgrounds and interests
72.8% 27.2%
75 28 103
Having my students explain difficult ideas to others 78.6% 21.4%
2018 Annual Program Evaluation Report | 32 |
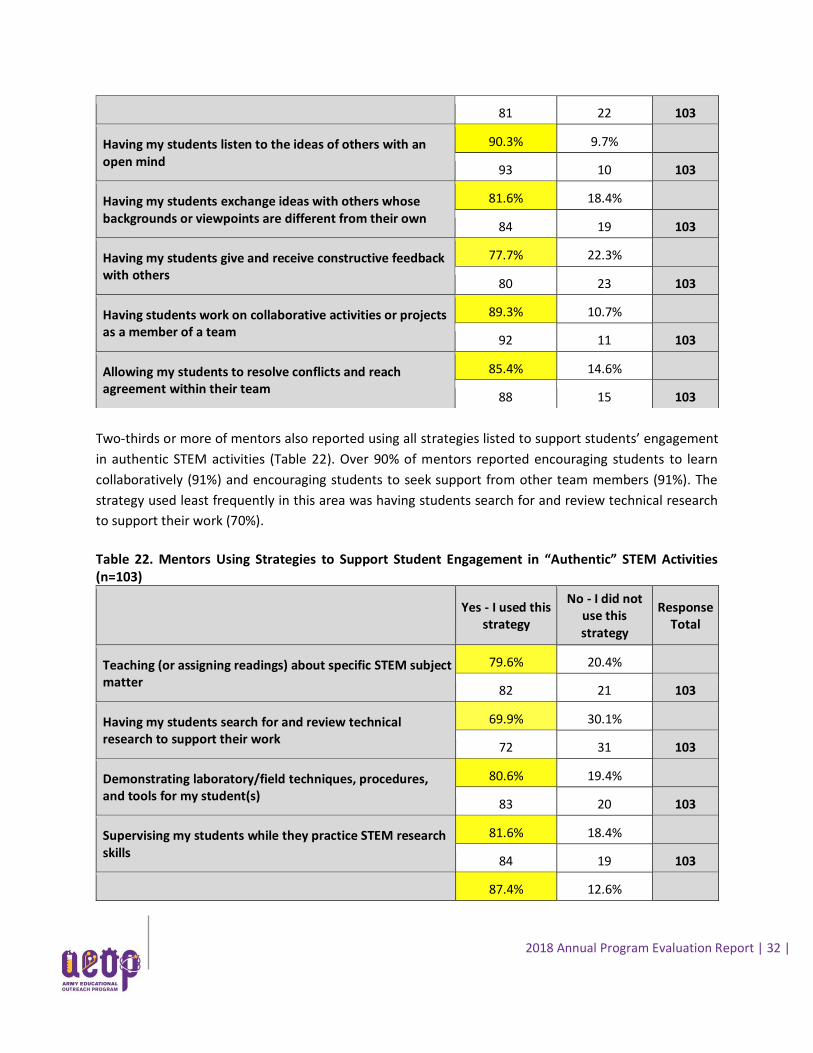
Two-thirds or more of mentors also reported using all strategies listed to support students’ engagement
in authentic STEM activities (Table 22). Over 90% of mentors reported encouraging students to learn
collaboratively (91%) and encouraging students to seek support from other team members (91%). The
strategy used least frequently in this area was having students search for and review technical research
to support their work (70%).
Table 22. Mentors Using Strategies to Support Student Engagement in “Authentic” STEM Activities (n=103)
Yes - I used this strategy
No - I did not use this strategy
Response Total
Teaching (or assigning readings) about specific STEM subject matter
79.6% 20.4%
82 21 103
Having my students search for and review technical research to support their work
69.9% 30.1%
72 31 103
Demonstrating laboratory/field techniques, procedures, and tools for my student(s)
80.6% 19.4%
83 20 103
Supervising my students while they practice STEM research skills
81.6% 18.4%
84 19 103
87.4% 12.6%
81 22 103
Having my students listen to the ideas of others with an open mind
90.3% 9.7%
93 10 103
Having my students exchange ideas with others whose backgrounds or viewpoints are different from their own
81.6% 18.4%
84 19 103
Having my students give and receive constructive feedback with others
77.7% 22.3%
80 23 103
Having students work on collaborative activities or projects as a member of a team
89.3% 10.7%
92 11 103
Allowing my students to resolve conflicts and reach agreement within their team
85.4% 14.6%
88 15 103
2018 Annual Program Evaluation Report | 33 |
Providing my students with constructive feedback to improve their STEM competencies
90 13 103
Allowing students to work independently to improve their self-management abilities
89.3% 10.7%
92 11 103
Encouraging students to learn collaboratively (team projects, team meetings, journal clubs, etc.)
91.3% 8.7%
94 9 103
Encouraging students to seek support from other team members
91.3% 8.7%
94 9 103
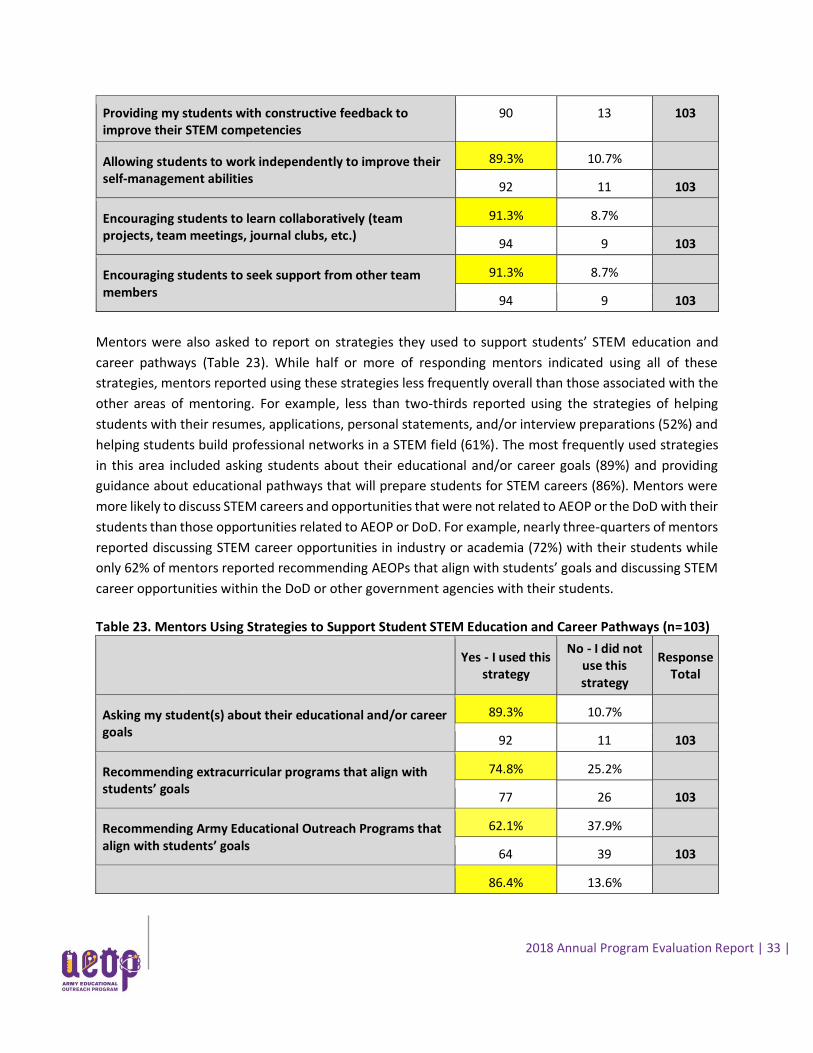
Mentors were also asked to report on strategies they used to support students’ STEM education and
career pathways (Table 23). While half or more of responding mentors indicated using all of these
strategies, mentors reported using these strategies less frequently overall than those associated with the
other areas of mentoring. For example, less than two-thirds reported using the strategies of helping
students with their resumes, applications, personal statements, and/or interview preparations (52%) and
helping students build professional networks in a STEM field (61%). The most frequently used strategies
in this area included asking students about their educational and/or career goals (89%) and providing
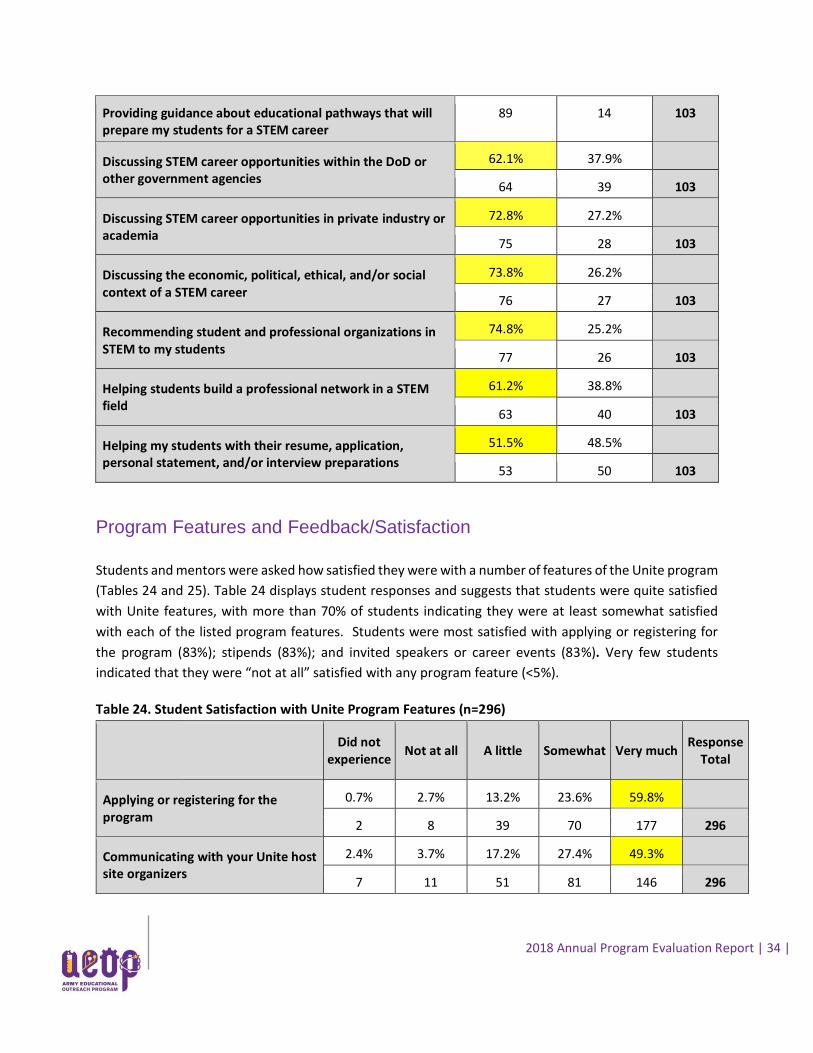
guidance about educational pathways that will prepare students for STEM careers (86%). Mentors were
more likely to discuss STEM careers and opportunities that were not related to AEOP or the DoD with their
students than those opportunities related to AEOP or DoD. For example, nearly three-quarters of mentors
reported discussing STEM career opportunities in industry or academia (72%) with their students while
only 62% of mentors reported recommending AEOPs that align with students’ goals and discussing STEM
career opportunities within the DoD or other government agencies with their students.
Table 23. Mentors Using Strategies to Support Student STEM Education and Career Pathways (n=103)
Yes - I used this strategy
No - I did not use this strategy
Response Total
Asking my student(s) about their educational and/or career goals
89.3% 10.7%
92 11 103
Recommending extracurricular programs that align with students’ goals
74.8% 25.2%
77 26 103
Recommending Army Educational Outreach Programs that align with students’ goals
62.1% 37.9%
64 39 103
86.4% 13.6%
2018 Annual Program Evaluation Report | 34 |
Providing guidance about educational pathways that will prepare my students for a STEM career
89 14 103
Discussing STEM career opportunities within the DoD or other government agencies
62.1% 37.9%
64 39 103
Discussing STEM career opportunities in private industry or academia
72.8% 27.2%
75 28 103
Discussing the economic, political, ethical, and/or social context of a STEM career
73.8% 26.2%
76 27 103
Recommending student and professional organizations in STEM to my students
74.8% 25.2%
77 26 103
Helping students build a professional network in a STEM field
61.2% 38.8%
63 40 103
Helping my students with their resume, application, personal statement, and/or interview preparations
51.5% 48.5%
53 50 103
Program Features and Feedback/Satisfaction
Students and mentors were asked how satisfied they were with a number of features of the Unite program
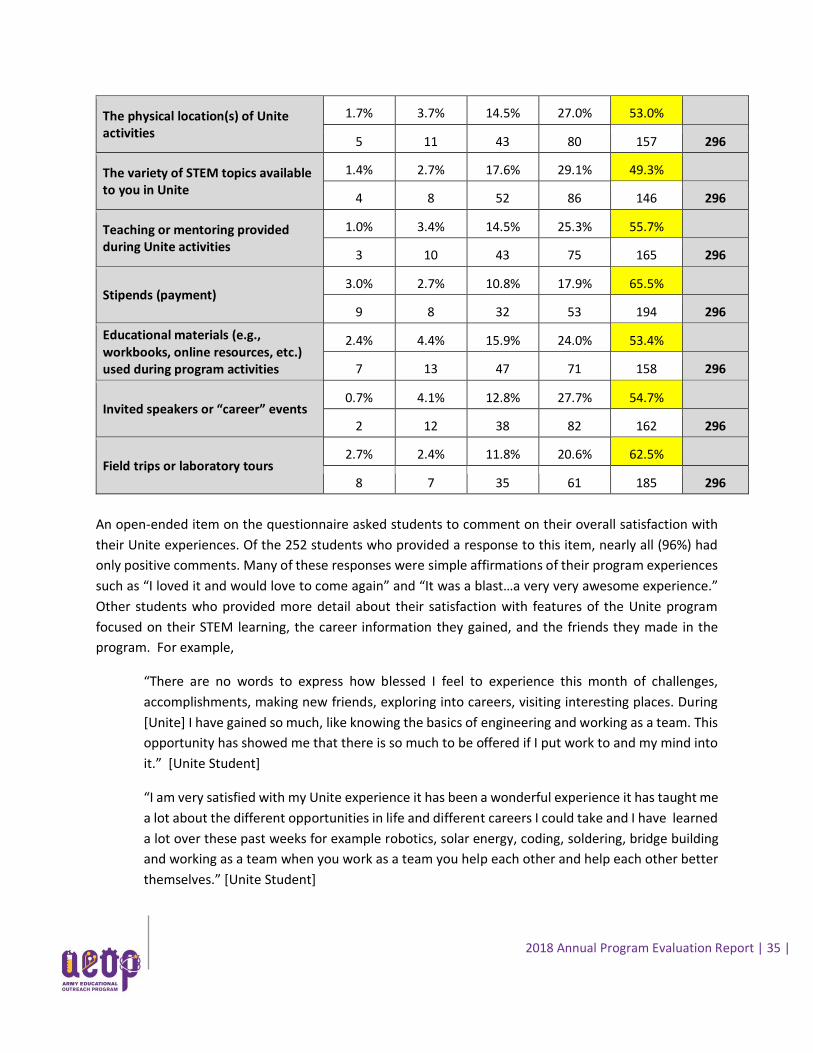
(Tables 24 and 25). Table 24 displays student responses and suggests that students were quite satisfied
with Unite features, with more than 70% of students indicating they were at least somewhat satisfied
with each of the listed program features. Students were most satisfied with applying or registering for
the program (83%); stipends (83%); and invited speakers or career events (83%). Very few students
indicated that they were “not at all” satisfied with any program feature (<5%).
Table 24. Student Satisfaction with Unite Program Features (n=296)
Did not experience
Not at all A little Somewhat Very much Response
Total
Applying or registering for the program
0.7% 2.7% 13.2% 23.6% 59.8%
2 8 39 70 177 296
Communicating with your Unite host site organizers
2.4% 3.7% 17.2% 27.4% 49.3%
7 11 51 81 146 296
2018 Annual Program Evaluation Report | 35 |
The physical location(s) of Unite activities
1.7% 3.7% 14.5% 27.0% 53.0%
5 11 43 80 157 296
The variety of STEM topics available to you in Unite
1.4% 2.7% 17.6% 29.1% 49.3%
4 8 52 86 146 296
Teaching or mentoring provided during Unite activities
1.0% 3.4% 14.5% 25.3% 55.7%
3 10 43 75 165 296
Stipends (payment) 3.0% 2.7% 10.8% 17.9% 65.5%
9 8 32 53 194 296
Educational materials (e.g., workbooks, online resources, etc.) used during program activities
2.4% 4.4% 15.9% 24.0% 53.4%
7 13 47 71 158 296
Invited speakers or “career” events 0.7% 4.1% 12.8% 27.7% 54.7%
2 12 38 82 162 296
Field trips or laboratory tours 2.7% 2.4% 11.8% 20.6% 62.5%
8 7 35 61 185 296
An open-ended item on the questionnaire asked students to comment on their overall satisfaction with
their Unite experiences. Of the 252 students who provided a response to this item, nearly all (96%) had
only positive comments. Many of these responses were simple affirmations of their program experiences
such as “I loved it and would love to come again” and “It was a blast…a very very awesome experience.”
Other students who provided more detail about their satisfaction with features of the Unite program
focused on their STEM learning, the career information they gained, and the friends they made in the
program. For example,
“There are no words to express how blessed I feel to experience this month of challenges,
accomplishments, making new friends, exploring into careers, visiting interesting places. During
[Unite] I have gained so much, like knowing the basics of engineering and working as a team. This
opportunity has showed me that there is so much to be offered if I put work to and my mind into
it.” [Unite Student]
“I am very satisfied with my Unite experience it has been a wonderful experience it has taught me
a lot about the different opportunities in life and different careers I could take and I have learned
a lot over these past weeks for example robotics, solar energy, coding, soldering, bridge building
and working as a team when you work as a team you help each other and help each other better
themselves.” [Unite Student]
2018 Annual Program Evaluation Report | 36 |
“It was a wonderful experience and I would definitely participate again. I have enjoyed exploring
new careers and career options and different things about myself.” [Unite Student]
Only 1 respondent had nothing positive to say about Unite, answering simply “No” when asked about his
overall satisfaction with the program. Another 10 students had positive things to say about Unite but
included some caveats. These caveats included dissatisfaction with the topics, lack of understanding of
content, a wish for more field trips or more interesting field trips, a complaint about other program
participants, and comments about preferring a shorter or less stressful program. For example,
“Overall [I am] satisfied, but I would have preferred it if it was more mechanical engineering
rather than computer science/software engineering.” [Unite Student]
“[Unite] was ok but would have been better had we had more field trips to talk about the DoD
and AEOP program. This was basically just a STEM camp with the experiments that we've done
numerous amounts of times.” [Unite Student]
Students were also asked to list three benefits of participating in Unite. A total of 234 students identified
at least one benefit of participating. The most frequently mentioned benefits were STEM learning (115
students, or 49%) and career information (105 students, or 45%). Benefits mentioned by about 20% of
students included teamwork (47 students), STEM-related skills (46 students), the opportunity to make
friends (44 students), and receiving educational and/or college information (44 students). Between 12%
and 15% of students cited gaining communication skills (34 students), increases in their interest or
motivation for STEM (30 students), and the opportunities for hands-on experiences (28 students) as
benefits of Unite. Other benefits, mentioned by 17 or fewer students (7% or less) included being exposed
to new opportunities, increasing their confidence, increasing their self-knowledge, the stipend,
developing patience, the field trips, improving their organization and/or time management, the field trips,
and the opportunity to network with STEM professionals and/or build their resumes.
Another open-ended questionnaire item asked students to list three ways that the program could be
improved. Of the 211 students who made at least one suggestion for program improvement, the most
frequently mentioned improvements, mentioned by around a quarter of students, included providing
more hands-on content (62 students); more or better field trips and/or college visits (57 students); and
improvements in scheduling (57 students), including providing a longer or shorter program, a less packed
schedule, more sleep and/or a later start time, more breaks, and more free time. About 17% of students
suggested improvements in mentors, including providing more mentors, better mentors, improving
teaching methods, and providing more diverse instructors. Improvements mentioned by between 12%
and 14% of students included improving organization and/or communication from the program (30
students) providing more or more choice of topics (26 students), a longer program (24 students), and
improving the food (24 students). Other improvements mentioned by 14 or fewer students (7%) included
providing more group activities, providing more in-depth information or focus on specific topics, more
2018 Annual Program Evaluation Report | 37 |
participants, more career connections, a larger stipend, and more recreational activities. For example,
Unite students responded that improvements would include:
“I would like to have more activities and less videos. I liked doing lab stuff and building
everyday.”
“More field trips that are hands on.”
“More visits with college students that are in STEM because we can relate to them more.”
“Visit other Engineering fields that don't revolve around mechanical engineering.”
“Elongate the program to allow for more advanced and prepared projects.”
“More engaging, even-paced lessons”
“More connections to jobs (not just this is something engineers do).”
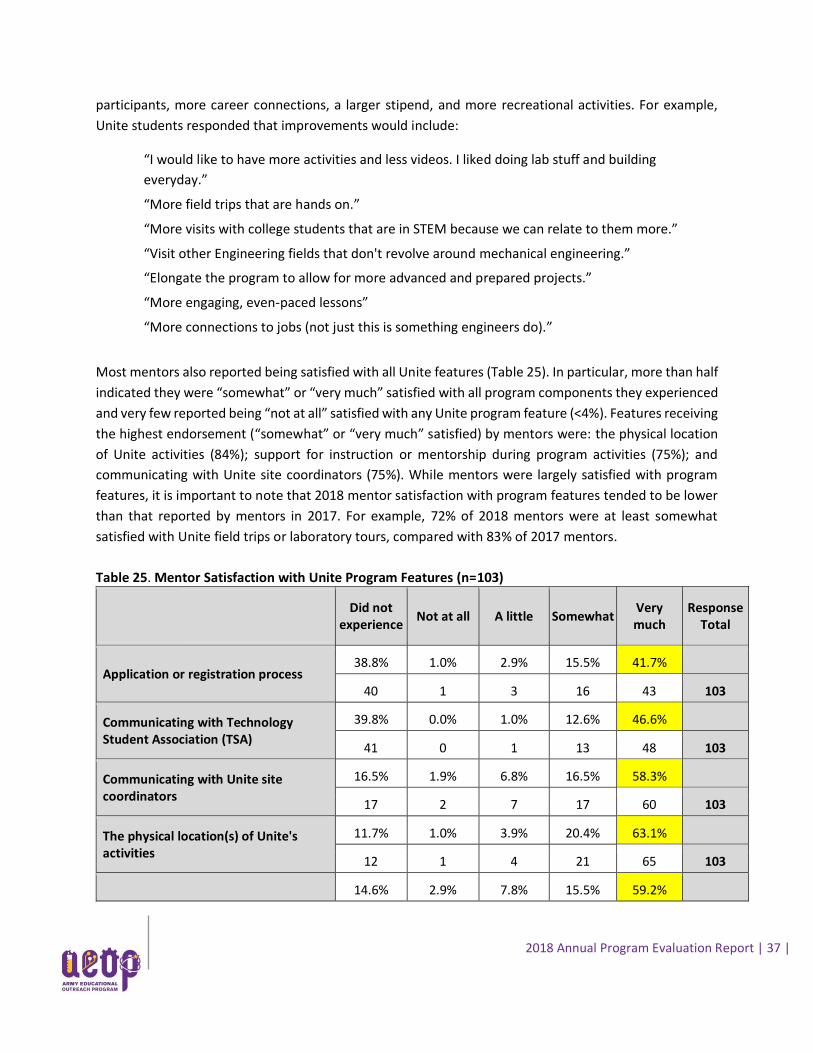
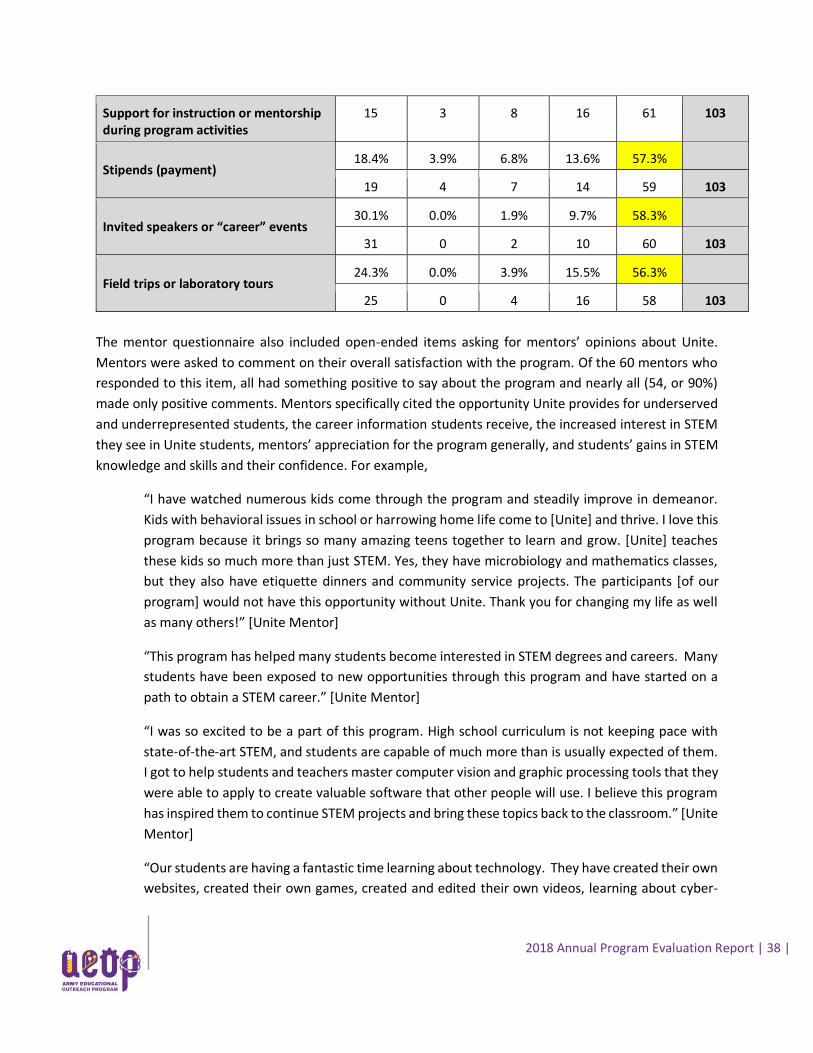
Most mentors also reported being satisfied with all Unite features (Table 25). In particular, more than half
indicated they were “somewhat” or “very much” satisfied with all program components they experienced
and very few reported being “not at all” satisfied with any Unite program feature (<4%). Features receiving
the highest endorsement (“somewhat” or “very much” satisfied) by mentors were: the physical location
of Unite activities (84%); support for instruction or mentorship during program activities (75%); and
communicating with Unite site coordinators (75%). While mentors were largely satisfied with program
features, it is important to note that 2018 mentor satisfaction with program features tended to be lower
than that reported by mentors in 2017. For example, 72% of 2018 mentors were at least somewhat
satisfied with Unite field trips or laboratory tours, compared with 83% of 2017 mentors.
Table 25. Mentor Satisfaction with Unite Program Features (n=103)
Did not experience
Not at all A little Somewhat Very much
Response Total
Application or registration process 38.8% 1.0% 2.9% 15.5% 41.7%
40 1 3 16 43 103
Communicating with Technology Student Association (TSA)
39.8% 0.0% 1.0% 12.6% 46.6%
41 0 1 13 48 103
Communicating with Unite site coordinators
16.5% 1.9% 6.8% 16.5% 58.3%
17 2 7 17 60 103
The physical location(s) of Unite's activities
11.7% 1.0% 3.9% 20.4% 63.1%
12 1 4 21 65 103
14.6% 2.9% 7.8% 15.5% 59.2%
2018 Annual Program Evaluation Report | 38 |
Support for instruction or mentorship during program activities
15 3 8 16 61 103
Stipends (payment) 18.4% 3.9% 6.8% 13.6% 57.3%
19 4 7 14 59 103
Invited speakers or “career” events 30.1% 0.0% 1.9% 9.7% 58.3%
31 0 2 10 60 103
Field trips or laboratory tours 24.3% 0.0% 3.9% 15.5% 56.3%
25 0 4 16 58 103
The mentor questionnaire also included open-ended items asking for mentors’ opinions about Unite.
Mentors were asked to comment on their overall satisfaction with the program. Of the 60 mentors who
responded to this item, all had something positive to say about the program and nearly all (54, or 90%)
made only positive comments. Mentors specifically cited the opportunity Unite provides for underserved
and underrepresented students, the career information students receive, the increased interest in STEM
they see in Unite students, mentors’ appreciation for the program generally, and students’ gains in STEM
knowledge and skills and their confidence. For example,
“I have watched numerous kids come through the program and steadily improve in demeanor.
Kids with behavioral issues in school or harrowing home life come to [Unite] and thrive. I love this
program because it brings so many amazing teens together to learn and grow. [Unite] teaches
these kids so much more than just STEM. Yes, they have microbiology and mathematics classes,
but they also have etiquette dinners and community service projects. The participants [of our
program] would not have this opportunity without Unite. Thank you for changing my life as well
as many others!” [Unite Mentor]
“This program has helped many students become interested in STEM degrees and careers. Many
students have been exposed to new opportunities through this program and have started on a
path to obtain a STEM career.” [Unite Mentor]
“I was so excited to be a part of this program. High school curriculum is not keeping pace with
state-of-the-art STEM, and students are capable of much more than is usually expected of them.
I got to help students and teachers master computer vision and graphic processing tools that they
were able to apply to create valuable software that other people will use. I believe this program
has inspired them to continue STEM projects and bring these topics back to the classroom.” [Unite
Mentor]
“Our students are having a fantastic time learning about technology. They have created their own
websites, created their own games, created and edited their own videos, learning about cyber-
2018 Annual Program Evaluation Report | 39 |
security, and so much more. This has truly been a great opportunity for our instructors and
educators as well.” [Unite Mentor]
Six of the mentors made positive comments but also offered some caveats. These caveats focused on
students’ academic preparation and behavior and mentor preparation for related issues, the curriculum,
and a lack of AEOP information. For example,
“Many of my concerns are with the UNITE students, not the program. Students come from a
background of social survival. Science often requires putting your social setting second. These two
scenarios conflict. Students spent a lot of time on social media and not focused on science. We
got the sense that several students did not want to participate, but were obligated somehow. I
fully understand that this is a condition of their environment, generation, and why they are with
us…the hidden message is that they are likely frustrated, too, but express it differently and/or
they may be projecting what their peers at home think of this experience. These are the students
who need UNITE the most. Getting these students to build the confidence in themselves enough
so they can evolve their thinking (and attitude) is a challenge and we could all use more training
to help bridge that intellectual and social gap.” [Unite Mentor]
“I am happy with most of my students' progression throughout the course of this program. I truly
believe that many of them have learned a great deal and have a deeper understanding of various
STEM topics. However, I feel that if a more stable curriculum was developed before the program
started, all of the students would have taken more away from the program.” [Unite Mentor]
Mentors also commented upon the strengths of Unite in response to an open-ended questionnaire item
asking them to list three strengths of the program. A total of 72 mentors listed at least one strength of
the program. The most frequently mentioned strength, mentioned by 38% (27) mentors was students’
STEM learning. Nearly a quarter (22%-24%) mentioned the value of the teamwork and collaboration
students experience (17 mentors), the opportunities Unite provides for underserved and
underrepresented students (16 mentors), and the real-world and hands-on experiences in Unite (16
mentors). Between 10% and 17% of mentors also mentioned as benefits program organization and
support (12 mentors), specific STEM skills and research skills that students gain (11 mentors), the
opportunity to network and work with STEM professionals (11 mentors), the career information students
receive (9 mentors), students’ communication skills (9 mentors), the quality of the instructors and
mentors (9 mentors), and the college information students receive (7 mentors). For example, Unite
mentors said that benefits included:
“Reaching underserved and underrepresented community.”
“Learning to communicate effectively with others.”
“Allows students access to professionals and mentors in tech disciplines and majors.”
“Freedom to develop the lesson to fit the students.”
“Encouraging students to explore different ways of looking at the world.”
2018 Annual Program Evaluation Report | 40 |
“UNITE increased the ability of the students to understand engineering design problems.”
Mentors were also asked in an open-ended questionnaire item to list three ways in which Unite could be
improved for future participants. A total of 60 mentors provided at least one suggestion. These mentors
offered a wide variety of suggestions. Eleven mentors (18%) suggested improving Unite by including more
field trips and/or speakers or visitors. Nine mentors each (or 15%) suggested providing more outreach or
advertising about the program, more hands-on content and/or more research experience for students,
and improving student selection processes and/or student accountability once enrolled in Unite. Another
8 mentors (13%) suggested drawing more connections and/or having more interaction between Unite and
the Army or DoD, and the same number suggested having more field trips, mentor information or teaching
materials. Seven mentors (12%) also suggested improving organization, planning, and/or communication
and another 7 suggested increasing the budget and/or staff stipends. A range of other improvements
were suggested by five or fewer mentors (8% or less), including providing more career information;
improving the food; increasing the amount of free time or the number of breaks during program activities;
continuing program activities and/or mentor-student communication during the school year; providing
more AEOP information; providing flexibility in funding to pay for housing, food, and transportation; and
including more technology or addressing technology issues.
The following are examples of Unite mentors’ responses when asked to provide suggestions for program
improvement:
“Research based lessons/equipment provided to high school level students.”
“Provide instructors with the clear objectives (i.e.: exposure to DoD) that we should integrate.”
“Provide clear info. to students about the program.”
“Better communication with teachers.”
“The mentors spent time everyday prepping for the UNITE students and should be compensated
for it.”
“More trips to varying locations.”
“More actual engineers visit.”
“Molecular biology is expensive, so some funds to cover students' experiments would be
welcomed.”
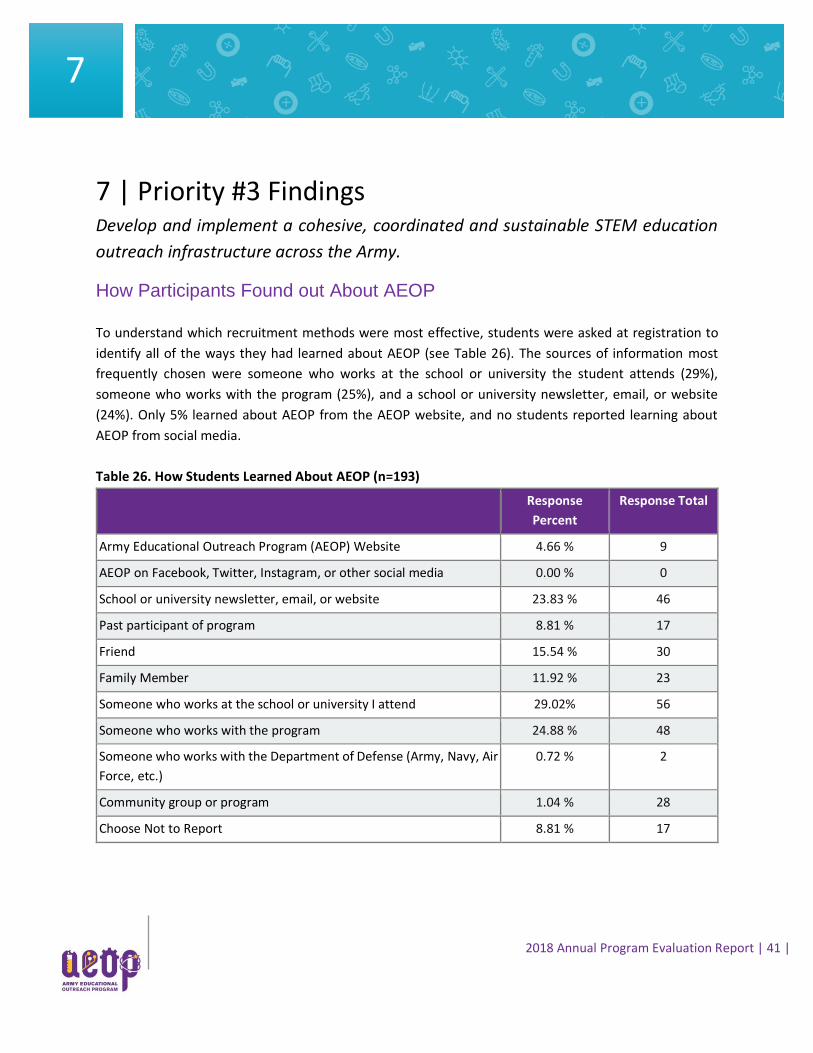
2018 Annual Program Evaluation Report | 41 |
7 | Priority #3 Findings
Develop and implement a cohesive, coordinated and sustainable STEM education
outreach infrastructure across the Army.
How Participants Found out About AEOP
To understand which recruitment methods were most effective, students were asked at registration to
identify all of the ways they had learned about AEOP (see Table 26). The sources of information most
frequently chosen were someone who works at the school or university the student attends (29%),
someone who works with the program (25%), and a school or university newsletter, email, or website
(24%). Only 5% learned about AEOP from the AEOP website, and no students reported learning about
AEOP from social media.
Table 26. How Students Learned About AEOP (n=193)
Response
Percent
Response Total
Army Educational Outreach Program (AEOP) Website 4.66 % 9
AEOP on Facebook, Twitter, Instagram, or other social media 0.00 % 0
School or university newsletter, email, or website 23.83 % 46
Past participant of program 8.81 % 17
Friend 15.54 % 30
Family Member 11.92 % 23
Someone who works at the school or university I attend 29.02% 56
Someone who works with the program 24.88 % 48
Someone who works with the Department of Defense (Army, Navy, Air
Force, etc.)
0.72 % 2
Community group or program 1.04 % 28
Choose Not to Report 8.81 % 17
7
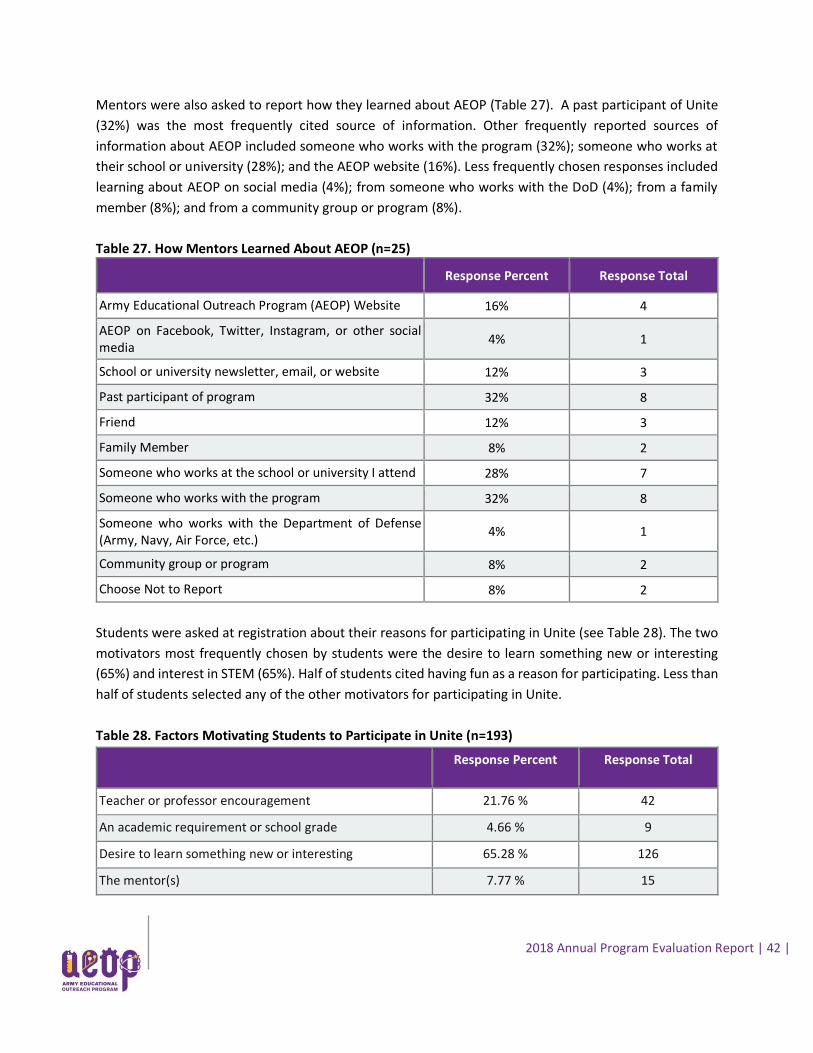
2018 Annual Program Evaluation Report | 42 |
Mentors were also asked to report how they learned about AEOP (Table 27). A past participant of Unite
(32%) was the most frequently cited source of information. Other frequently reported sources of
information about AEOP included someone who works with the program (32%); someone who works at
their school or university (28%); and the AEOP website (16%). Less frequently chosen responses included
learning about AEOP on social media (4%); from someone who works with the DoD (4%); from a family
member (8%); and from a community group or program (8%).
Table 27. How Mentors Learned About AEOP (n=25)
Response Percent Response Total
Army Educational Outreach Program (AEOP) Website 16% 4
AEOP on Facebook, Twitter, Instagram, or other social media
4% 1
School or university newsletter, email, or website 12% 3
Past participant of program 32% 8
Friend 12% 3
Family Member 8% 2
Someone who works at the school or university I attend 28% 7
Someone who works with the program 32% 8
Someone who works with the Department of Defense (Army, Navy, Air Force, etc.)
4% 1
Community group or program 8% 2
Choose Not to Report 8% 2
Students were asked at registration about their reasons for participating in Unite (see Table 28). The two
motivators most frequently chosen by students were the desire to learn something new or interesting
(65%) and interest in STEM (65%). Half of students cited having fun as a reason for participating. Less than
half of students selected any of the other motivators for participating in Unite.
Table 28. Factors Motivating Students to Participate in Unite (n=193)
Response Percent Response Total
Teacher or professor encouragement 21.76 % 42
An academic requirement or school grade 4.66 % 9
Desire to learn something new or interesting 65.28 % 126
The mentor(s) 7.77 % 15
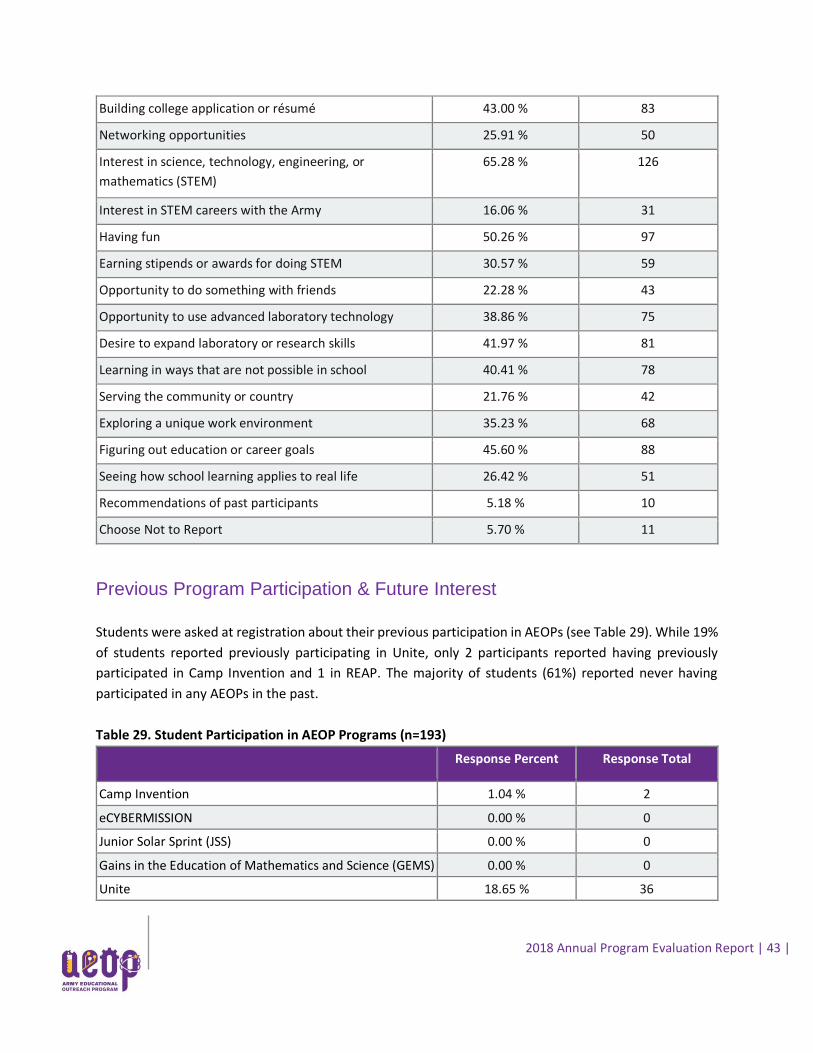
2018 Annual Program Evaluation Report | 43 |
Building college application or résumé 43.00 % 83
Networking opportunities 25.91 % 50
Interest in science, technology, engineering, or
mathematics (STEM)
65.28 % 126
Interest in STEM careers with the Army 16.06 % 31
Having fun 50.26 % 97
Earning stipends or awards for doing STEM 30.57 % 59
Opportunity to do something with friends 22.28 % 43
Opportunity to use advanced laboratory technology 38.86 % 75
Desire to expand laboratory or research skills 41.97 % 81
Learning in ways that are not possible in school 40.41 % 78
Serving the community or country 21.76 % 42
Exploring a unique work environment 35.23 % 68
Figuring out education or career goals 45.60 % 88
Seeing how school learning applies to real life 26.42 % 51
Recommendations of past participants 5.18 % 10
Choose Not to Report 5.70 % 11
Previous Program Participation & Future Interest
Students were asked at registration about their previous participation in AEOPs (see Table 29). While 19%
of students reported previously participating in Unite, only 2 participants reported having previously
participated in Camp Invention and 1 in REAP. The majority of students (61%) reported never having
participated in any AEOPs in the past.
Table 29. Student Participation in AEOP Programs (n=193)
Response Percent Response Total
Camp Invention 1.04 % 2
eCYBERMISSION 0.00 % 0
Junior Solar Sprint (JSS) 0.00 % 0
Gains in the Education of Mathematics and Science (GEMS) 0.00 % 0
Unite 18.65 % 36
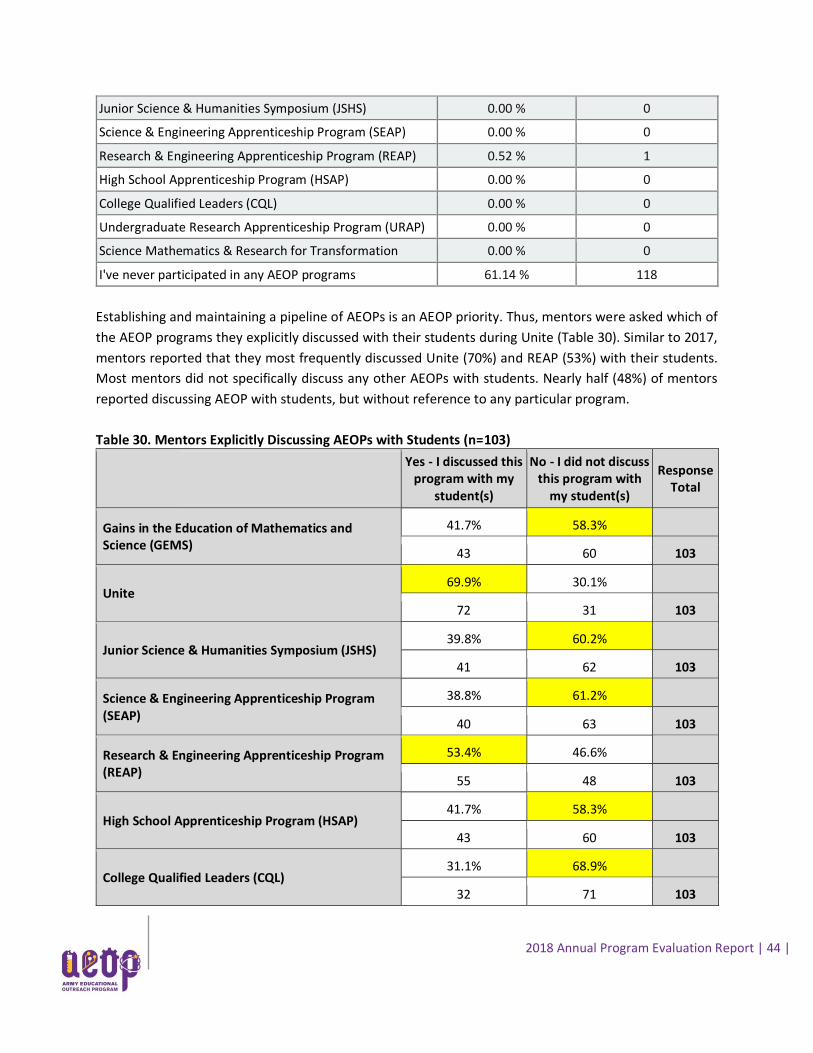
2018 Annual Program Evaluation Report | 44 |
Junior Science & Humanities Symposium (JSHS) 0.00 % 0
Science & Engineering Apprenticeship Program (SEAP) 0.00 % 0
Research & Engineering Apprenticeship Program (REAP) 0.52 % 1
High School Apprenticeship Program (HSAP) 0.00 % 0
College Qualified Leaders (CQL) 0.00 % 0
Undergraduate Research Apprenticeship Program (URAP) 0.00 % 0
Science Mathematics & Research for Transformation
(SMART) College Scholarship
0.00 % 0
I've never participated in any AEOP programs 61.14 % 118
Establishing and maintaining a pipeline of AEOPs is an AEOP priority. Thus, mentors were asked which of
the AEOP programs they explicitly discussed with their students during Unite (Table 30). Similar to 2017,
mentors reported that they most frequently discussed Unite (70%) and REAP (53%) with their students.
Most mentors did not specifically discuss any other AEOPs with students. Nearly half (48%) of mentors
reported discussing AEOP with students, but without reference to any particular program.
Table 30. Mentors Explicitly Discussing AEOPs with Students (n=103)
Yes - I discussed this program with my
student(s)
No - I did not discuss this program with
my student(s)
Response Total
Gains in the Education of Mathematics and Science (GEMS)
41.7% 58.3%
43 60 103
Unite 69.9% 30.1%
72 31 103
Junior Science & Humanities Symposium (JSHS) 39.8% 60.2%
41 62 103
Science & Engineering Apprenticeship Program (SEAP)
38.8% 61.2%
40 63 103
Research & Engineering Apprenticeship Program (REAP)
53.4% 46.6%
55 48 103
High School Apprenticeship Program (HSAP) 41.7% 58.3%
43 60 103
College Qualified Leaders (CQL) 31.1% 68.9%
32 71 103
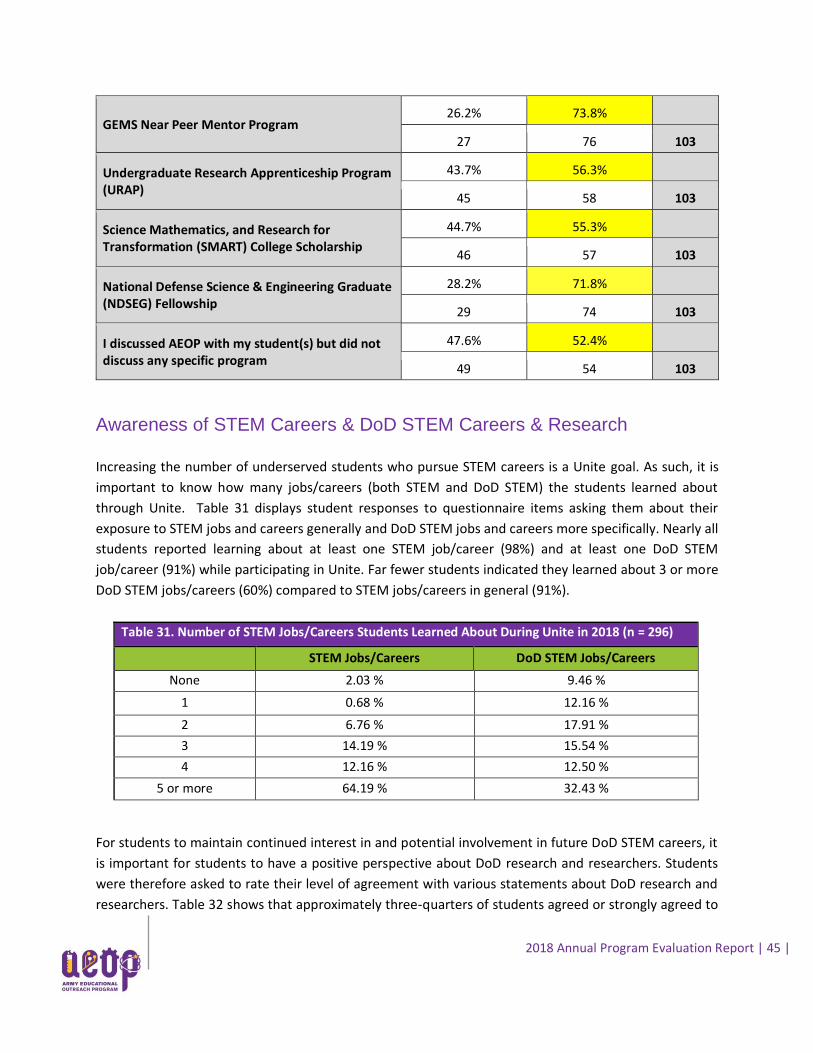
2018 Annual Program Evaluation Report | 45 |
GEMS Near Peer Mentor Program 26.2% 73.8%
27 76 103
Undergraduate Research Apprenticeship Program (URAP)
43.7% 56.3%
45 58 103
Science Mathematics, and Research for Transformation (SMART) College Scholarship
44.7% 55.3%
46 57 103
National Defense Science & Engineering Graduate (NDSEG) Fellowship
28.2% 71.8%
29 74 103
I discussed AEOP with my student(s) but did not discuss any specific program
47.6% 52.4%
49 54 103
Awareness of STEM Careers & DoD STEM Careers & Research
Increasing the number of underserved students who pursue STEM careers is a Unite goal. As such, it is
important to know how many jobs/careers (both STEM and DoD STEM) the students learned about
through Unite. Table 31 displays student responses to questionnaire items asking them about their
exposure to STEM jobs and careers generally and DoD STEM jobs and careers more specifically. Nearly all
students reported learning about at least one STEM job/career (98%) and at least one DoD STEM
job/career (91%) while participating in Unite. Far fewer students indicated they learned about 3 or more
DoD STEM jobs/careers (60%) compared to STEM jobs/careers in general (91%).
Table 31. Number of STEM Jobs/Careers Students Learned About During Unite in 2018 (n = 296)
STEM Jobs/Careers DoD STEM Jobs/Careers
None 2.03 % 9.46 %
1 0.68 % 12.16 %
2 6.76 % 17.91 %
3 14.19 % 15.54 %
4 12.16 % 12.50 %
5 or more 64.19 % 32.43 %
For students to maintain continued interest in and potential involvement in future DoD STEM careers, it
is important for students to have a positive perspective about DoD research and researchers. Students
were therefore asked to rate their level of agreement with various statements about DoD research and
researchers. Table 32 shows that approximately three-quarters of students agreed or strongly agreed to
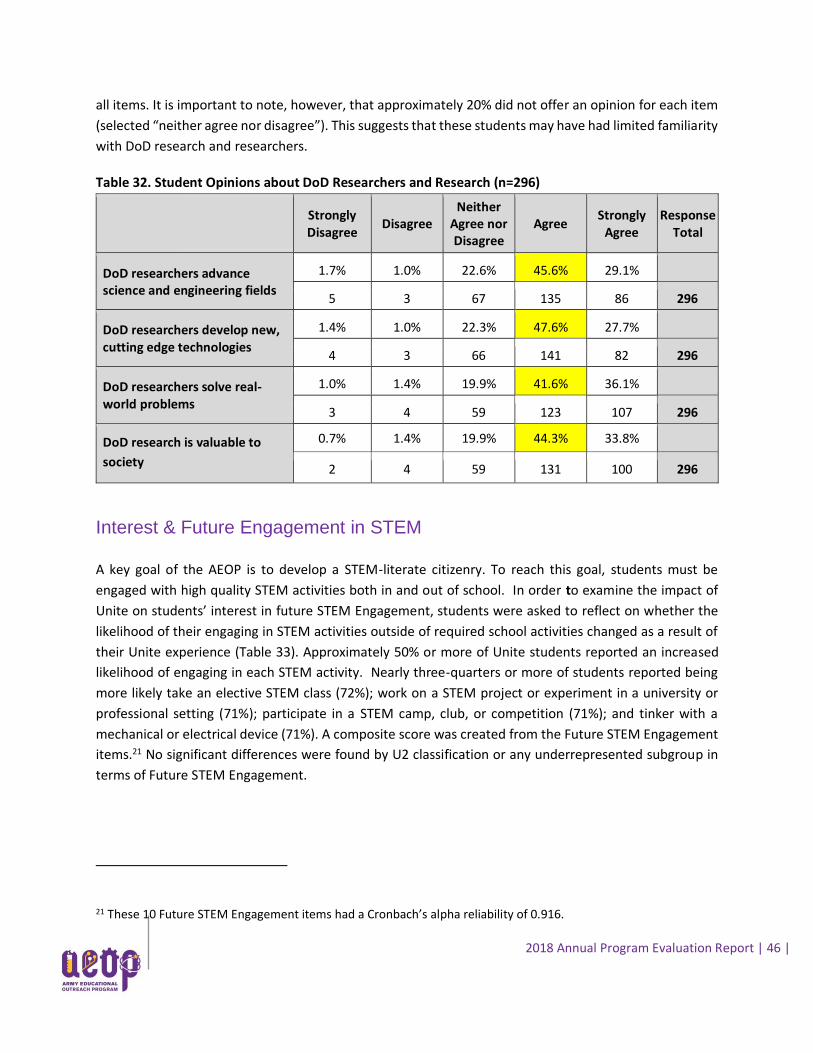
2018 Annual Program Evaluation Report | 46 |
all items. It is important to note, however, that approximately 20% did not offer an opinion for each item
(selected “neither agree nor disagree”). This suggests that these students may have had limited familiarity
with DoD research and researchers.
Table 32. Student Opinions about DoD Researchers and Research (n=296)
Strongly Disagree
Disagree Neither
Agree nor Disagree
Agree Strongly
Agree Response
Total
DoD researchers advance science and engineering fields
1.7% 1.0% 22.6% 45.6% 29.1%
5 3 67 135 86 296
DoD researchers develop new, cutting edge technologies
1.4% 1.0% 22.3% 47.6% 27.7%
4 3 66 141 82 296
DoD researchers solve real-world problems
1.0% 1.4% 19.9% 41.6% 36.1%
3 4 59 123 107 296
DoD research is valuable to
society
0.7% 1.4% 19.9% 44.3% 33.8%
2 4 59 131 100 296
Interest & Future Engagement in STEM
A key goal of the AEOP is to develop a STEM-literate citizenry. To reach this goal, students must be
engaged with high quality STEM activities both in and out of school. In order to examine the impact of
Unite on students’ interest in future STEM Engagement, students were asked to reflect on whether the
likelihood of their engaging in STEM activities outside of required school activities changed as a result of
their Unite experience (Table 33). Approximately 50% or more of Unite students reported an increased
likelihood of engaging in each STEM activity. Nearly three-quarters or more of students reported being
more likely take an elective STEM class (72%); work on a STEM project or experiment in a university or
professional setting (71%); participate in a STEM camp, club, or competition (71%); and tinker with a
mechanical or electrical device (71%). A composite score was created from the Future STEM Engagement
items.21 No significant differences were found by U2 classification or any underrepresented subgroup in
terms of Future STEM Engagement.
21 These 10 Future STEM Engagement items had a Cronbach’s alpha reliability of 0.916.
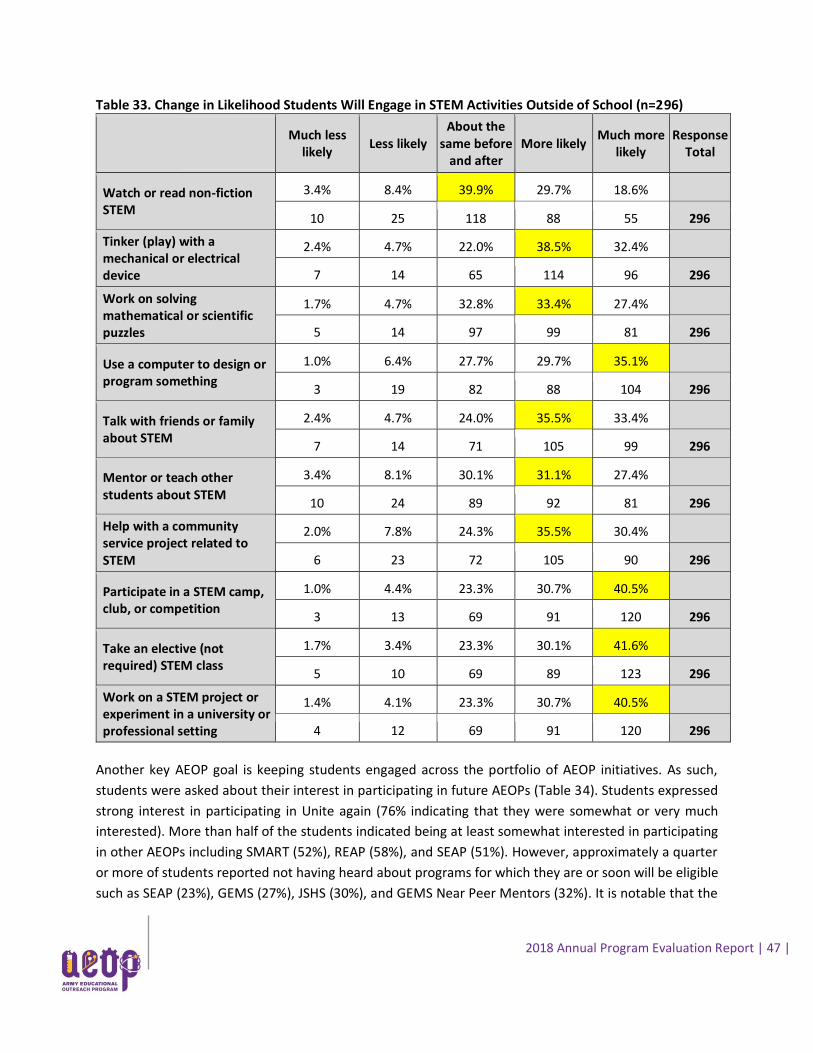
2018 Annual Program Evaluation Report | 47 |
Table 33. Change in Likelihood Students Will Engage in STEM Activities Outside of School (n=296)
Much less likely
Less likely About the
same before and after
More likely Much more
likely Response
Total
Watch or read non-fiction STEM
3.4% 8.4% 39.9% 29.7% 18.6%
10 25 118 88 55 296
Tinker (play) with a mechanical or electrical device
2.4% 4.7% 22.0% 38.5% 32.4%
7 14 65 114 96 296
Work on solving mathematical or scientific puzzles
1.7% 4.7% 32.8% 33.4% 27.4%
5 14 97 99 81 296
Use a computer to design or program something
1.0% 6.4% 27.7% 29.7% 35.1%
3 19 82 88 104 296
Talk with friends or family about STEM
2.4% 4.7% 24.0% 35.5% 33.4%
7 14 71 105 99 296
Mentor or teach other students about STEM
3.4% 8.1% 30.1% 31.1% 27.4%
10 24 89 92 81 296
Help with a community service project related to STEM
2.0% 7.8% 24.3% 35.5% 30.4%
6 23 72 105 90 296
Participate in a STEM camp, club, or competition
1.0% 4.4% 23.3% 30.7% 40.5%
3 13 69 91 120 296
Take an elective (not required) STEM class
1.7% 3.4% 23.3% 30.1% 41.6%
5 10 69 89 123 296
Work on a STEM project or experiment in a university or professional setting
1.4% 4.1% 23.3% 30.7% 40.5%
4 12 69 91 120 296
Another key AEOP goal is keeping students engaged across the portfolio of AEOP initiatives. As such,
students were asked about their interest in participating in future AEOPs (Table 34). Students expressed
strong interest in participating in Unite again (76% indicating that they were somewhat or very much
interested). More than half of the students indicated being at least somewhat interested in participating
in other AEOPs including SMART (52%), REAP (58%), and SEAP (51%). However, approximately a quarter
or more of students reported not having heard about programs for which they are or soon will be eligible
such as SEAP (23%), GEMS (27%), JSHS (30%), and GEMS Near Peer Mentors (32%). It is notable that the
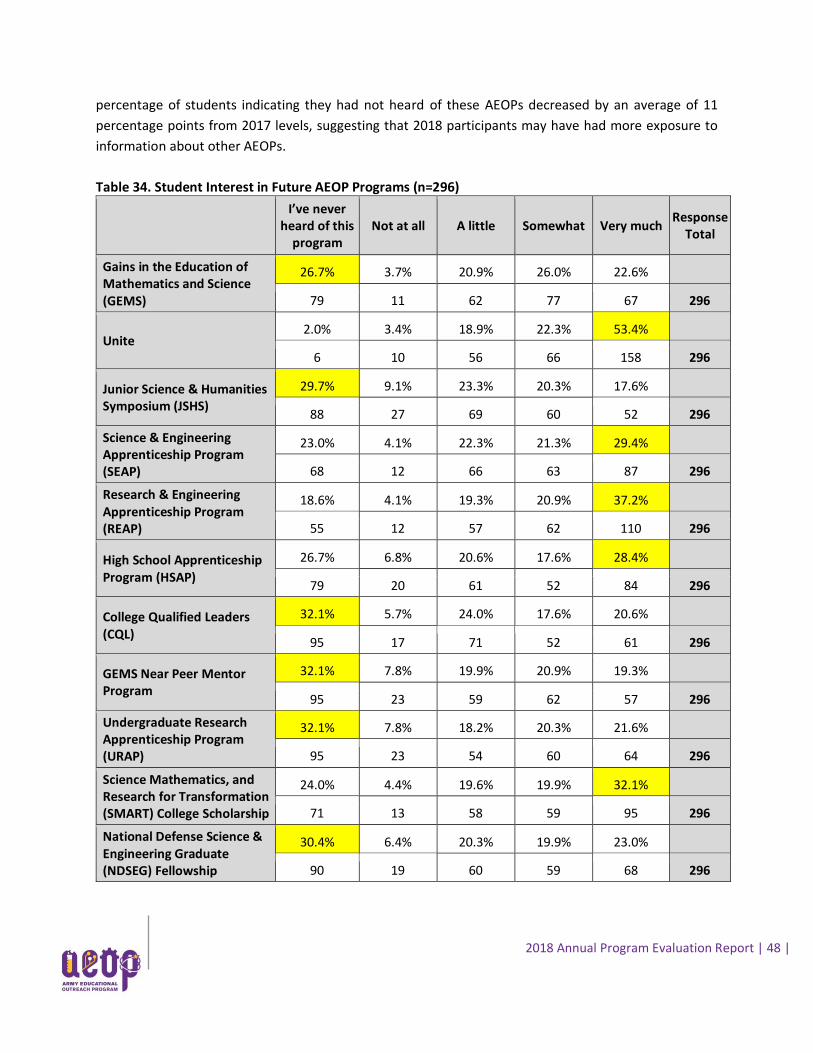
2018 Annual Program Evaluation Report | 48 |
percentage of students indicating they had not heard of these AEOPs decreased by an average of 11
percentage points from 2017 levels, suggesting that 2018 participants may have had more exposure to
information about other AEOPs.
Table 34. Student Interest in Future AEOP Programs (n=296)
I’ve never heard of this
program Not at all A little Somewhat Very much
Response Total
Gains in the Education of Mathematics and Science (GEMS)
26.7% 3.7% 20.9% 26.0% 22.6%
79 11 62 77 67 296
Unite 2.0% 3.4% 18.9% 22.3% 53.4%
6 10 56 66 158 296
Junior Science & Humanities Symposium (JSHS)
29.7% 9.1% 23.3% 20.3% 17.6%
88 27 69 60 52 296
Science & Engineering Apprenticeship Program (SEAP)
23.0% 4.1% 22.3% 21.3% 29.4%
68 12 66 63 87 296
Research & Engineering Apprenticeship Program (REAP)
18.6% 4.1% 19.3% 20.9% 37.2%
55 12 57 62 110 296
High School Apprenticeship Program (HSAP)
26.7% 6.8% 20.6% 17.6% 28.4%
79 20 61 52 84 296
College Qualified Leaders (CQL)
32.1% 5.7% 24.0% 17.6% 20.6%
95 17 71 52 61 296
GEMS Near Peer Mentor Program
32.1% 7.8% 19.9% 20.9% 19.3%
95 23 59 62 57 296
Undergraduate Research Apprenticeship Program (URAP)
32.1% 7.8% 18.2% 20.3% 21.6%
95 23 54 60 64 296
Science Mathematics, and Research for Transformation (SMART) College Scholarship
24.0% 4.4% 19.6% 19.9% 32.1%
71 13 58 59 95 296
National Defense Science & Engineering Graduate (NDSEG) Fellowship
30.4% 6.4% 20.3% 19.9% 23.0%
90 19 60 59 68 296
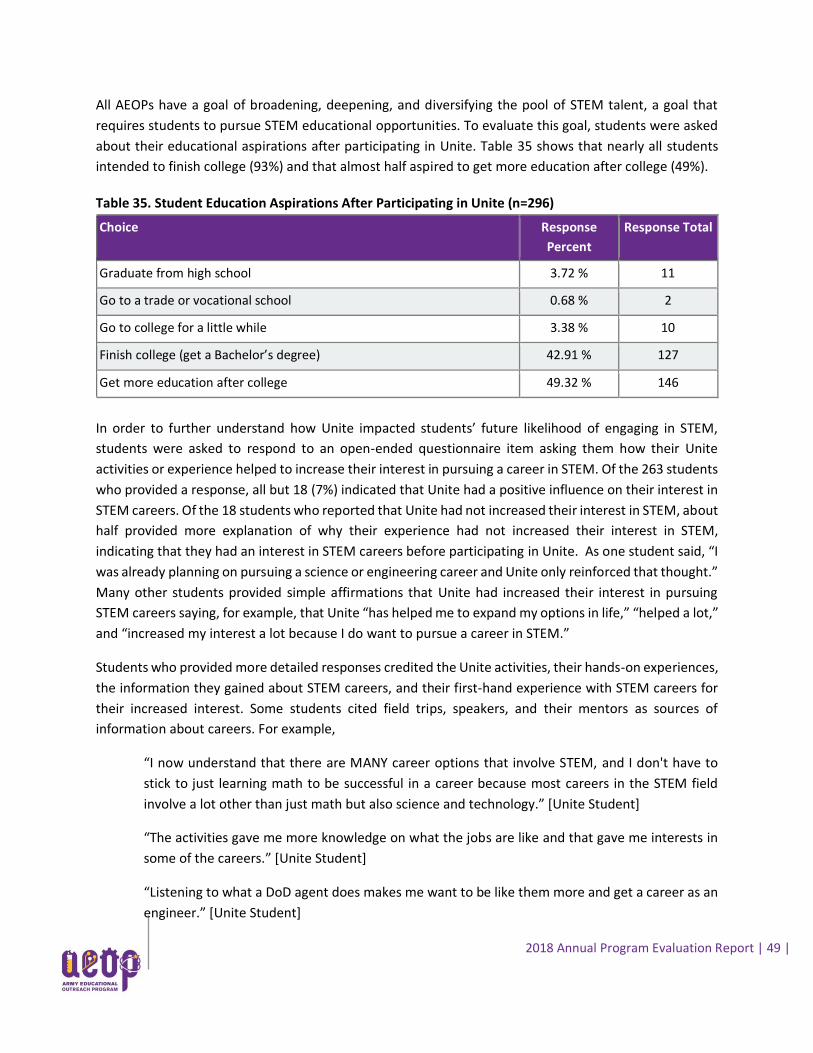
2018 Annual Program Evaluation Report | 49 |
All AEOPs have a goal of broadening, deepening, and diversifying the pool of STEM talent, a goal that
requires students to pursue STEM educational opportunities. To evaluate this goal, students were asked
about their educational aspirations after participating in Unite. Table 35 shows that nearly all students
intended to finish college (93%) and that almost half aspired to get more education after college (49%).
Table 35. Student Education Aspirations After Participating in Unite (n=296)
Choice Response
Percent
Response Total
Graduate from high school 3.72 % 11
Go to a trade or vocational school 0.68 % 2
Go to college for a little while 3.38 % 10
Finish college (get a Bachelor’s degree) 42.91 % 127
Get more education after college 49.32 % 146
In order to further understand how Unite impacted students’ future likelihood of engaging in STEM,
students were asked to respond to an open-ended questionnaire item asking them how their Unite
activities or experience helped to increase their interest in pursuing a career in STEM. Of the 263 students
who provided a response, all but 18 (7%) indicated that Unite had a positive influence on their interest in
STEM careers. Of the 18 students who reported that Unite had not increased their interest in STEM, about
half provided more explanation of why their experience had not increased their interest in STEM,
indicating that they had an interest in STEM careers before participating in Unite. As one student said, “I
was already planning on pursuing a science or engineering career and Unite only reinforced that thought.”
Many other students provided simple affirmations that Unite had increased their interest in pursuing
STEM careers saying, for example, that Unite “has helped me to expand my options in life,” “helped a lot,”
and “increased my interest a lot because I do want to pursue a career in STEM.”
Students who provided more detailed responses credited the Unite activities, their hands-on experiences,
the information they gained about STEM careers, and their first-hand experience with STEM careers for
their increased interest. Some students cited field trips, speakers, and their mentors as sources of
information about careers. For example,
“I now understand that there are MANY career options that involve STEM, and I don't have to
stick to just learning math to be successful in a career because most careers in the STEM field
involve a lot other than just math but also science and technology.” [Unite Student]
“The activities gave me more knowledge on what the jobs are like and that gave me interests in
some of the careers.” [Unite Student]
“Listening to what a DoD agent does makes me want to be like them more and get a career as an
engineer.” [Unite Student]
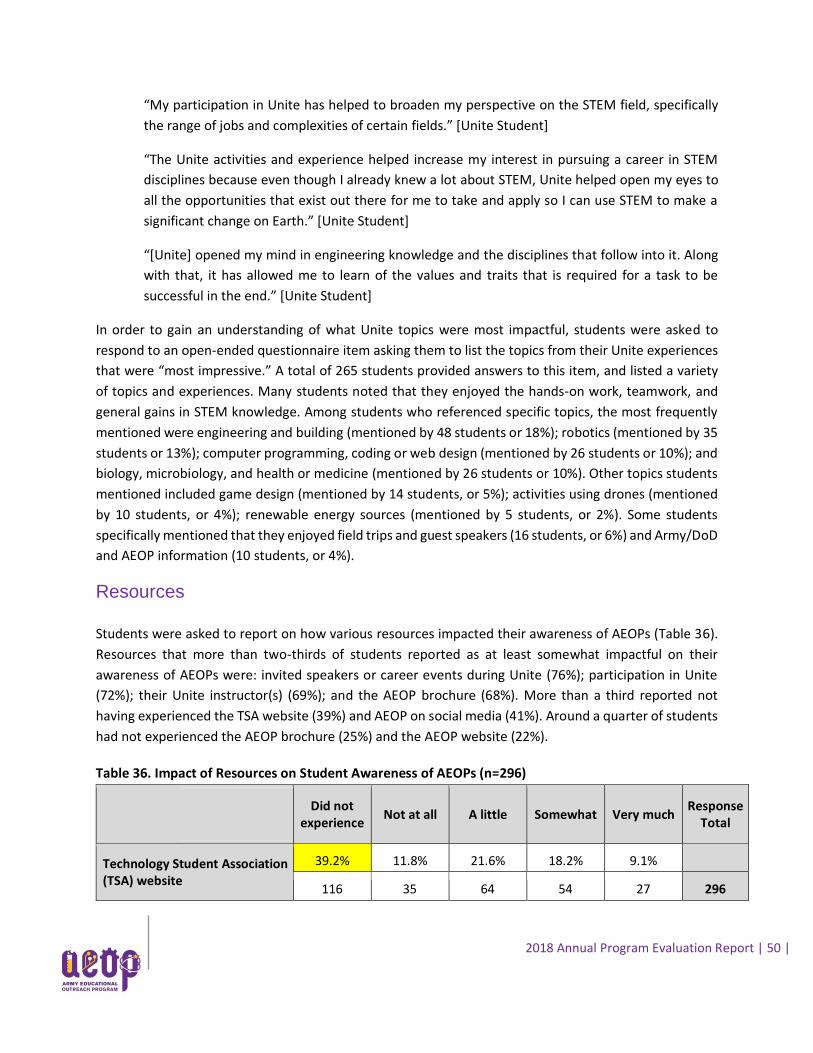
2018 Annual Program Evaluation Report | 50 |
“My participation in Unite has helped to broaden my perspective on the STEM field, specifically
the range of jobs and complexities of certain fields.” [Unite Student]
“The Unite activities and experience helped increase my interest in pursuing a career in STEM
disciplines because even though I already knew a lot about STEM, Unite helped open my eyes to
all the opportunities that exist out there for me to take and apply so I can use STEM to make a
significant change on Earth.” [Unite Student]
“[Unite] opened my mind in engineering knowledge and the disciplines that follow into it. Along
with that, it has allowed me to learn of the values and traits that is required for a task to be
successful in the end.” [Unite Student]
In order to gain an understanding of what Unite topics were most impactful, students were asked to
respond to an open-ended questionnaire item asking them to list the topics from their Unite experiences
that were “most impressive.” A total of 265 students provided answers to this item, and listed a variety
of topics and experiences. Many students noted that they enjoyed the hands-on work, teamwork, and
general gains in STEM knowledge. Among students who referenced specific topics, the most frequently
mentioned were engineering and building (mentioned by 48 students or 18%); robotics (mentioned by 35
students or 13%); computer programming, coding or web design (mentioned by 26 students or 10%); and
biology, microbiology, and health or medicine (mentioned by 26 students or 10%). Other topics students
mentioned included game design (mentioned by 14 students, or 5%); activities using drones (mentioned
by 10 students, or 4%); renewable energy sources (mentioned by 5 students, or 2%). Some students
specifically mentioned that they enjoyed field trips and guest speakers (16 students, or 6%) and Army/DoD
and AEOP information (10 students, or 4%).
Resources
Students were asked to report on how various resources impacted their awareness of AEOPs (Table 36).
Resources that more than two-thirds of students reported as at least somewhat impactful on their
awareness of AEOPs were: invited speakers or career events during Unite (76%); participation in Unite
(72%); their Unite instructor(s) (69%); and the AEOP brochure (68%). More than a third reported not
having experienced the TSA website (39%) and AEOP on social media (41%). Around a quarter of students
had not experienced the AEOP brochure (25%) and the AEOP website (22%).
Table 36. Impact of Resources on Student Awareness of AEOPs (n=296)
Did not experience
Not at all A little Somewhat Very much Response
Total
Technology Student Association (TSA) website
39.2% 11.8% 21.6% 18.2% 9.1%
116 35 64 54 27 296
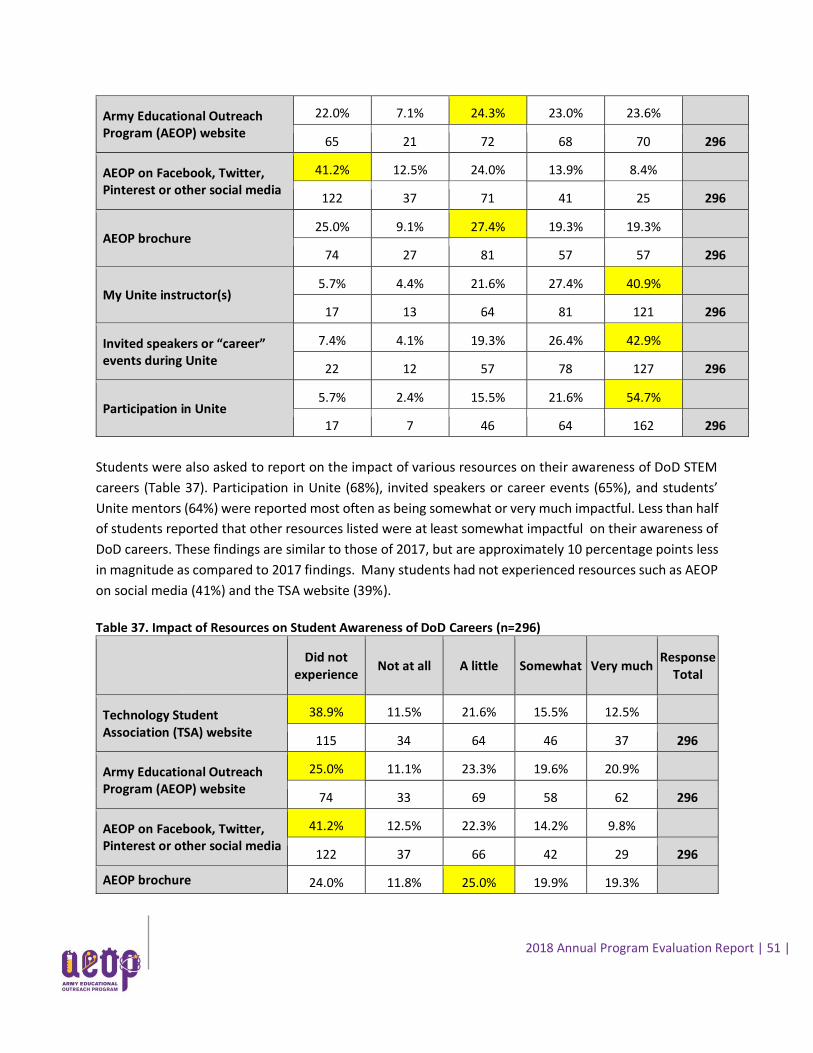
2018 Annual Program Evaluation Report | 51 |
Army Educational Outreach Program (AEOP) website
22.0% 7.1% 24.3% 23.0% 23.6%
65 21 72 68 70 296
AEOP on Facebook, Twitter, Pinterest or other social media
41.2% 12.5% 24.0% 13.9% 8.4%
122 37 71 41 25 296
AEOP brochure 25.0% 9.1% 27.4% 19.3% 19.3%
74 27 81 57 57 296
My Unite instructor(s) 5.7% 4.4% 21.6% 27.4% 40.9%
17 13 64 81 121 296
Invited speakers or “career” events during Unite
7.4% 4.1% 19.3% 26.4% 42.9%
22 12 57 78 127 296
Participation in Unite 5.7% 2.4% 15.5% 21.6% 54.7%
17 7 46 64 162 296
Students were also asked to report on the impact of various resources on their awareness of DoD STEM
careers (Table 37). Participation in Unite (68%), invited speakers or career events (65%), and students’
Unite mentors (64%) were reported most often as being somewhat or very much impactful. Less than half
of students reported that other resources listed were at least somewhat impactful on their awareness of
DoD careers. These findings are similar to those of 2017, but are approximately 10 percentage points less
in magnitude as compared to 2017 findings. Many students had not experienced resources such as AEOP
on social media (41%) and the TSA website (39%).
Table 37. Impact of Resources on Student Awareness of DoD Careers (n=296)
Did not experience
Not at all A little Somewhat Very much Response
Total
Technology Student Association (TSA) website
38.9% 11.5% 21.6% 15.5% 12.5%
115 34 64 46 37 296
Army Educational Outreach Program (AEOP) website
25.0% 11.1% 23.3% 19.6% 20.9%
74 33 69 58 62 296
AEOP on Facebook, Twitter, Pinterest or other social media
41.2% 12.5% 22.3% 14.2% 9.8%
122 37 66 42 29 296
AEOP brochure 24.0% 11.8% 25.0% 19.9% 19.3%
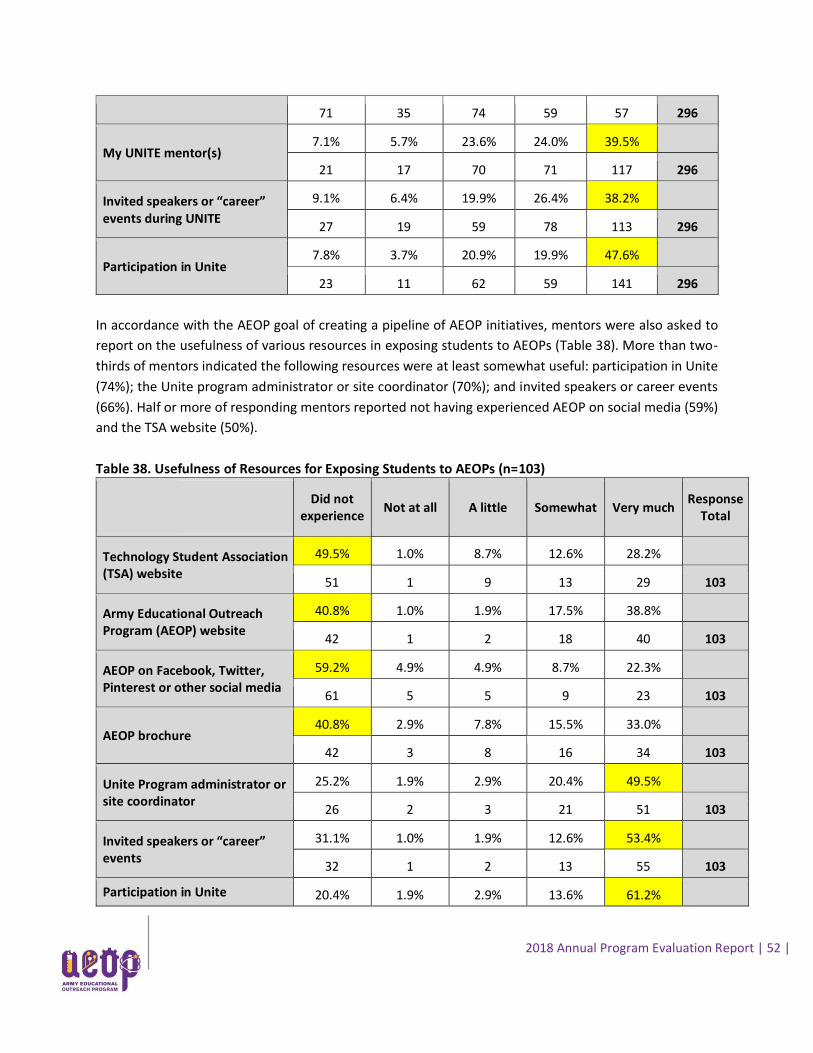
2018 Annual Program Evaluation Report | 52 |
71 35 74 59 57 296
My UNITE mentor(s) 7.1% 5.7% 23.6% 24.0% 39.5%
21 17 70 71 117 296
Invited speakers or “career” events during UNITE
9.1% 6.4% 19.9% 26.4% 38.2%
27 19 59 78 113 296
Participation in Unite 7.8% 3.7% 20.9% 19.9% 47.6%
23 11 62 59 141 296
In accordance with the AEOP goal of creating a pipeline of AEOP initiatives, mentors were also asked to
report on the usefulness of various resources in exposing students to AEOPs (Table 38). More than two-
thirds of mentors indicated the following resources were at least somewhat useful: participation in Unite
(74%); the Unite program administrator or site coordinator (70%); and invited speakers or career events
(66%). Half or more of responding mentors reported not having experienced AEOP on social media (59%)
and the TSA website (50%).
Table 38. Usefulness of Resources for Exposing Students to AEOPs (n=103)
Did not experience
Not at all A little Somewhat Very much Response
Total
Technology Student Association (TSA) website
49.5% 1.0% 8.7% 12.6% 28.2%
51 1 9 13 29 103
Army Educational Outreach Program (AEOP) website
40.8% 1.0% 1.9% 17.5% 38.8%
42 1 2 18 40 103
AEOP on Facebook, Twitter, Pinterest or other social media
59.2% 4.9% 4.9% 8.7% 22.3%
61 5 5 9 23 103
AEOP brochure 40.8% 2.9% 7.8% 15.5% 33.0%
42 3 8 16 34 103
Unite Program administrator or site coordinator
25.2% 1.9% 2.9% 20.4% 49.5%
26 2 3 21 51 103
Invited speakers or “career” events
31.1% 1.0% 1.9% 12.6% 53.4%
32 1 2 13 55 103
Participation in Unite 20.4% 1.9% 2.9% 13.6% 61.2%
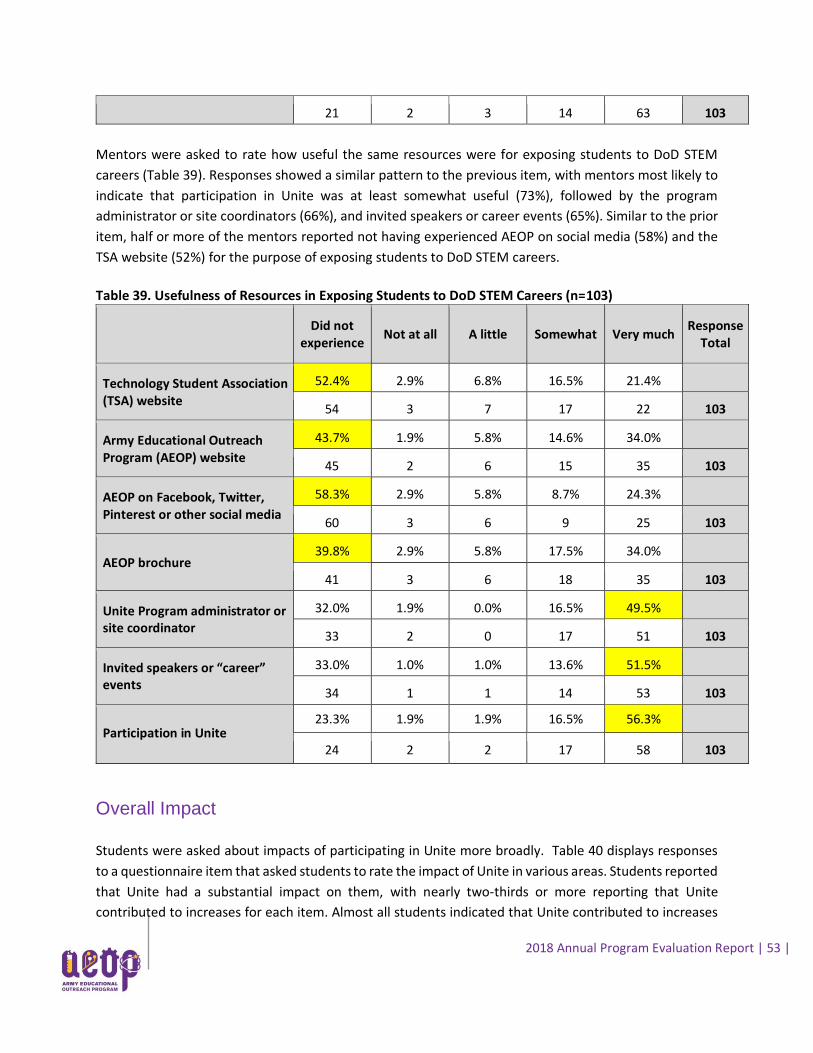
2018 Annual Program Evaluation Report | 53 |
21 2 3 14 63 103
Mentors were asked to rate how useful the same resources were for exposing students to DoD STEM
careers (Table 39). Responses showed a similar pattern to the previous item, with mentors most likely to
indicate that participation in Unite was at least somewhat useful (73%), followed by the program
administrator or site coordinators (66%), and invited speakers or career events (65%). Similar to the prior
item, half or more of the mentors reported not having experienced AEOP on social media (58%) and the
TSA website (52%) for the purpose of exposing students to DoD STEM careers.
Table 39. Usefulness of Resources in Exposing Students to DoD STEM Careers (n=103)
Did not experience
Not at all A little Somewhat Very much Response
Total
Technology Student Association (TSA) website
52.4% 2.9% 6.8% 16.5% 21.4%
54 3 7 17 22 103
Army Educational Outreach Program (AEOP) website
43.7% 1.9% 5.8% 14.6% 34.0%
45 2 6 15 35 103
AEOP on Facebook, Twitter, Pinterest or other social media
58.3% 2.9% 5.8% 8.7% 24.3%
60 3 6 9 25 103
AEOP brochure 39.8% 2.9% 5.8% 17.5% 34.0%
41 3 6 18 35 103
Unite Program administrator or site coordinator
32.0% 1.9% 0.0% 16.5% 49.5%
33 2 0 17 51 103
Invited speakers or “career” events
33.0% 1.0% 1.0% 13.6% 51.5%
34 1 1 14 53 103
Participation in Unite 23.3% 1.9% 1.9% 16.5% 56.3%
24 2 2 17 58 103
Overall Impact
Students were asked about impacts of participating in Unite more broadly. Table 40 displays responses
to a questionnaire item that asked students to rate the impact of Unite in various areas. Students reported
that Unite had a substantial impact on them, with nearly two-thirds or more reporting that Unite
contributed to increases for each item. Almost all students indicated that Unite contributed to increases
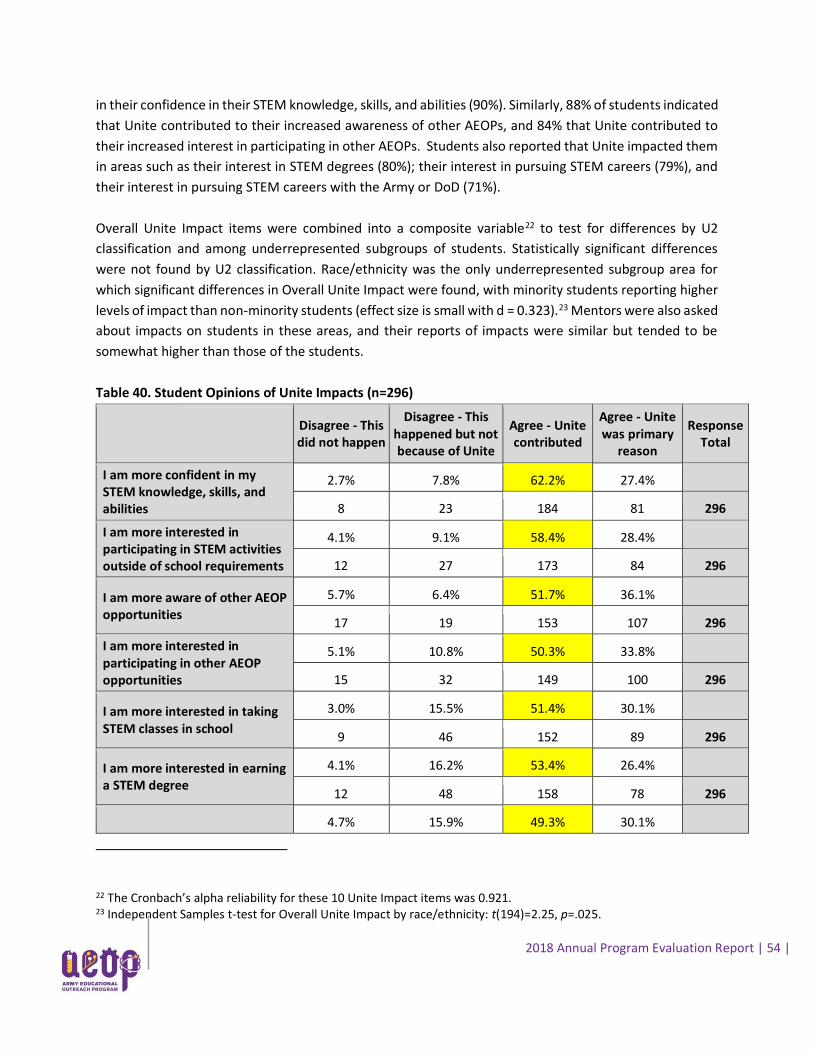
2018 Annual Program Evaluation Report | 54 |
in their confidence in their STEM knowledge, skills, and abilities (90%). Similarly, 88% of students indicated
that Unite contributed to their increased awareness of other AEOPs, and 84% that Unite contributed to
their increased interest in participating in other AEOPs. Students also reported that Unite impacted them
in areas such as their interest in STEM degrees (80%); their interest in pursuing STEM careers (79%), and
their interest in pursuing STEM careers with the Army or DoD (71%).
Overall Unite Impact items were combined into a composite variable22 to test for differences by U2
classification and among underrepresented subgroups of students. Statistically significant differences
were not found by U2 classification. Race/ethnicity was the only underrepresented subgroup area for
which significant differences in Overall Unite Impact were found, with minority students reporting higher
levels of impact than non-minority students (effect size is small with d = 0.323).23 Mentors were also asked
about impacts on students in these areas, and their reports of impacts were similar but tended to be
somewhat higher than those of the students.
Table 40. Student Opinions of Unite Impacts (n=296)
Disagree - This did not happen
Disagree - This happened but not because of Unite
Agree - Unite contributed
Agree - Unite was primary
reason
Response Total
I am more confident in my STEM knowledge, skills, and abilities
2.7% 7.8% 62.2% 27.4%
8 23 184 81 296
I am more interested in participating in STEM activities outside of school requirements
4.1% 9.1% 58.4% 28.4%
12 27 173 84 296
I am more aware of other AEOP opportunities
5.7% 6.4% 51.7% 36.1%
17 19 153 107 296
I am more interested in participating in other AEOP opportunities
5.1% 10.8% 50.3% 33.8%
15 32 149 100 296
I am more interested in taking STEM classes in school
3.0% 15.5% 51.4% 30.1%
9 46 152 89 296
I am more interested in earning a STEM degree
4.1% 16.2% 53.4% 26.4%
12 48 158 78 296
4.7% 15.9% 49.3% 30.1%
22 The Cronbach’s alpha reliability for these 10 Unite Impact items was 0.921. 23 Independent Samples t-test for Overall Unite Impact by race/ethnicity: t(194)=2.25, p=.025.
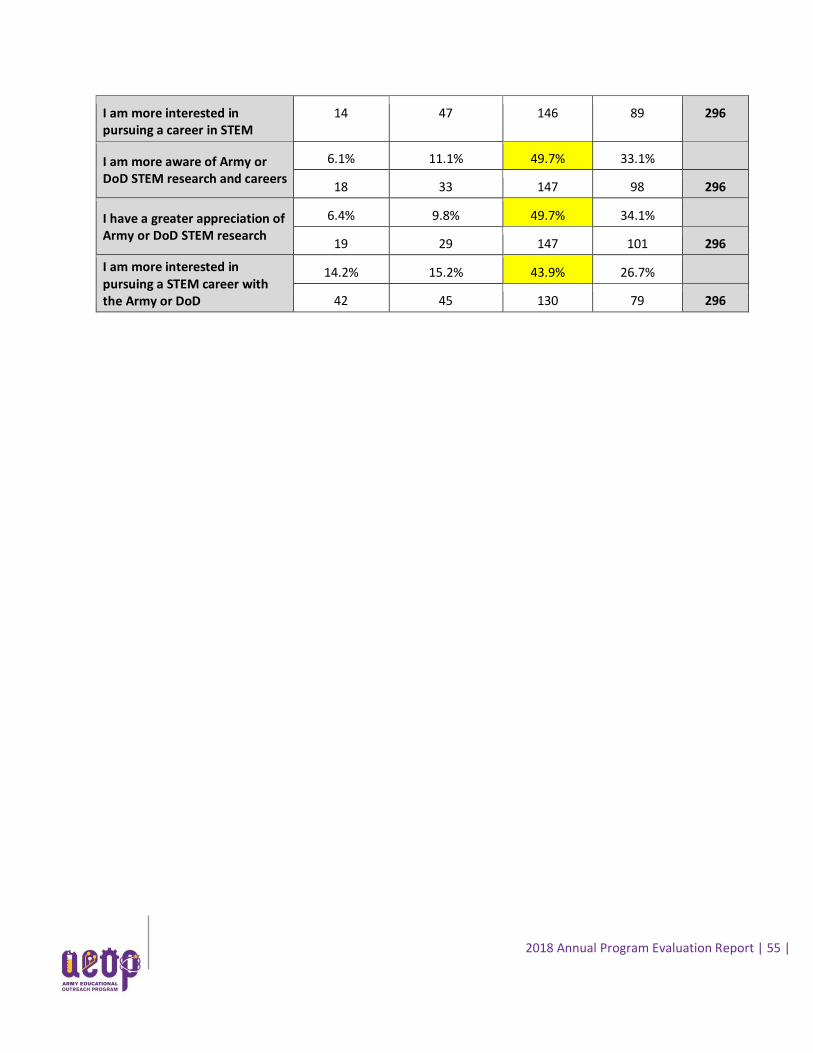
2018 Annual Program Evaluation Report | 55 |
I am more interested in pursuing a career in STEM
14 47 146 89 296
I am more aware of Army or DoD STEM research and careers
6.1% 11.1% 49.7% 33.1%
18 33 147 98 296
I have a greater appreciation of Army or DoD STEM research
6.4% 9.8% 49.7% 34.1%
19 29 147 101 296
I am more interested in pursuing a STEM career with the Army or DoD
14.2% 15.2% 43.9% 26.7%
42 45 130 79 296
2018 Annual Program Evaluation Report | 56 |
8 | Findings and Recommendations
Summary of Findings The FY18 evaluation of Unite collected data about participants; their perceptions of program processes,
resources, and activities; and indicators of achievement in outcomes related to AEOP and program
objectives. A summary of findings is provided in Table 41 below.
Table 41. 2018 Unite Evaluation Findings
Priority #1:
Broaden, deepen, and diversify the pool of STEM talent in support of our Defense Industry Base
Participation in Unite increased
in FY18
A new host site was added in 2018 for a total of 19 host sites for Unite. The
program received applications from 731 students, 429 of whom were
enrolled in the program, a 17% increase in enrollment compared to 2017.
The student placement rate was higher in FY18 (59%) than in FY17 (43%)
and FY16 (41%).
Most Unite students had not
previously participated in any
AEOP.
While 19% of students reported previously participating in Unite, only 1 or
2 students reported at registration that they had participated in another
AEOP previously (Camp Invention and REAP). The majority of students (61%)
reported never having participated in any AEOPs .
Unite continues to successfully
serve students from groups
historically underserved and
underrepresented in STEM
A large majority of 2018 Unite students (88%) met the AEOP definition of
underserved.
Over a third (43%) of students identified themselves as Black or African
American. This is a decrease from the 68% of students who identified as
Black or African American in 2017.
More than half of 2018 Unite participants (62%) were female, an increase
over the 2017 when 46% of participants were female.
More students (71%) indicated that they receive free or reduced-price lunch
as compared to 2017 when 61% of students reported receiving free or
reduced price lunch.
8
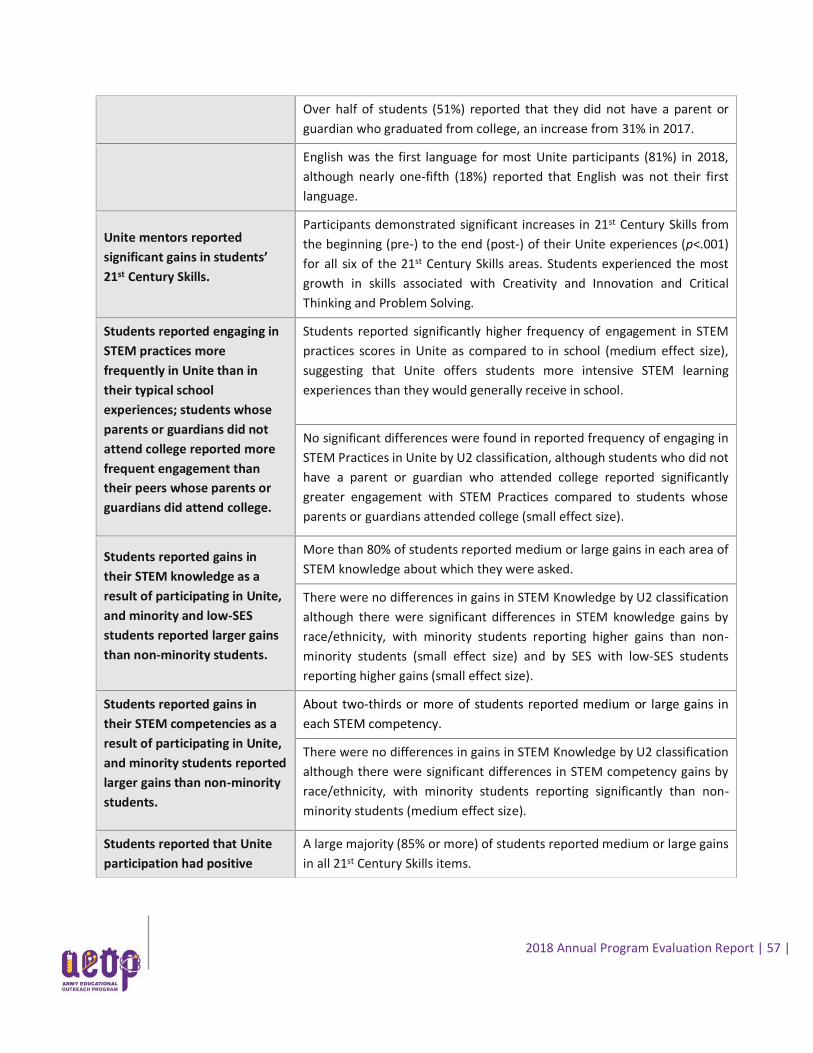
2018 Annual Program Evaluation Report | 57 |
Over half of students (51%) reported that they did not have a parent or
guardian who graduated from college, an increase from 31% in 2017.
English was the first language for most Unite participants (81%) in 2018,
although nearly one-fifth (18%) reported that English was not their first
language.
Unite mentors reported
significant gains in students’
21st Century Skills.
Participants demonstrated significant increases in 21st Century Skills from
the beginning (pre-) to the end (post-) of their Unite experiences (p<.001)
for all six of the 21st Century Skills areas. Students experienced the most
growth in skills associated with Creativity and Innovation and Critical
Thinking and Problem Solving.
Students reported engaging in
STEM practices more
frequently in Unite than in
their typical school
experiences; students whose
parents or guardians did not
attend college reported more
frequent engagement than
their peers whose parents or
guardians did attend college.
Students reported significantly higher frequency of engagement in STEM
practices scores in Unite as compared to in school (medium effect size),
suggesting that Unite offers students more intensive STEM learning
experiences than they would generally receive in school.
No significant differences were found in reported frequency of engaging in
STEM Practices in Unite by U2 classification, although students who did not
have a parent or guardian who attended college reported significantly
greater engagement with STEM Practices compared to students whose
parents or guardians attended college (small effect size).
Students reported gains in
their STEM knowledge as a
result of participating in Unite,
and minority and low-SES
students reported larger gains
than non-minority students.
More than 80% of students reported medium or large gains in each area of
STEM knowledge about which they were asked.
There were no differences in gains in STEM Knowledge by U2 classification
although there were significant differences in STEM knowledge gains by
race/ethnicity, with minority students reporting higher gains than non-
minority students (small effect size) and by SES with low-SES students
reporting higher gains (small effect size).
Students reported gains in
their STEM competencies as a
result of participating in Unite,
and minority students reported
larger gains than non-minority
students.
About two-thirds or more of students reported medium or large gains in
each STEM competency.
There were no differences in gains in STEM Knowledge by U2 classification
although there were significant differences in STEM competency gains by
race/ethnicity, with minority students reporting significantly than non-
minority students (medium effect size).
Students reported that Unite
participation had positive
A large majority (85% or more) of students reported medium or large gains
in all 21st Century Skills items.
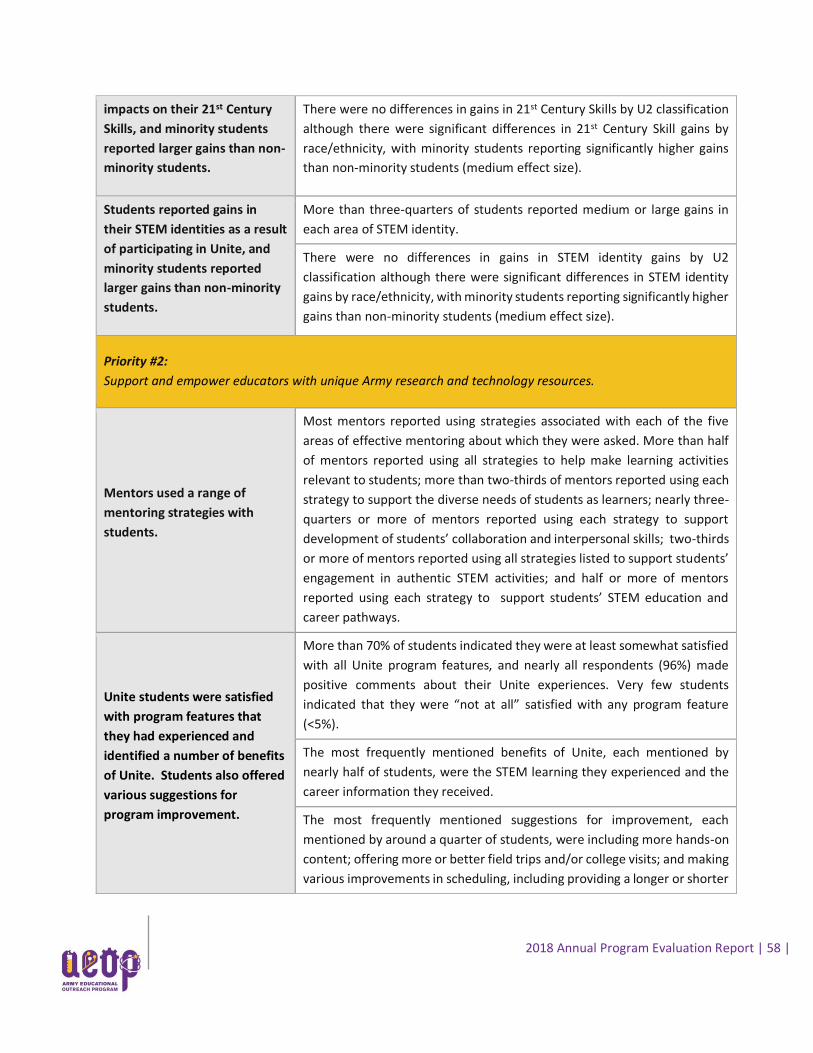
2018 Annual Program Evaluation Report | 58 |
impacts on their 21st Century
Skills, and minority students
reported larger gains than non-
minority students.
There were no differences in gains in 21st Century Skills by U2 classification
although there were significant differences in 21st Century Skill gains by
race/ethnicity, with minority students reporting significantly higher gains
than non-minority students (medium effect size).
Students reported gains in
their STEM identities as a result
of participating in Unite, and
minority students reported
larger gains than non-minority
students.
More than three-quarters of students reported medium or large gains in
each area of STEM identity.
There were no differences in gains in STEM identity gains by U2
classification although there were significant differences in STEM identity
gains by race/ethnicity, with minority students reporting significantly higher
gains than non-minority students (medium effect size).
Priority #2:
Support and empower educators with unique Army research and technology resources.
Mentors used a range of
mentoring strategies with
students.
Most mentors reported using strategies associated with each of the five
areas of effective mentoring about which they were asked. More than half
of mentors reported using all strategies to help make learning activities
relevant to students; more than two-thirds of mentors reported using each
strategy to support the diverse needs of students as learners; nearly three-
quarters or more of mentors reported using each strategy to support
development of students’ collaboration and interpersonal skills; two-thirds
or more of mentors reported using all strategies listed to support students’
engagement in authentic STEM activities; and half or more of mentors
reported using each strategy to support students’ STEM education and
career pathways.
Unite students were satisfied
with program features that
they had experienced and
identified a number of benefits
of Unite. Students also offered
various suggestions for
program improvement.
More than 70% of students indicated they were at least somewhat satisfied
with all Unite program features, and nearly all respondents (96%) made
positive comments about their Unite experiences. Very few students
indicated that they were “not at all” satisfied with any program feature
(<5%).
The most frequently mentioned benefits of Unite, each mentioned by
nearly half of students, were the STEM learning they experienced and the
career information they received.
The most frequently mentioned suggestions for improvement, each
mentioned by around a quarter of students, were including more hands-on
content; offering more or better field trips and/or college visits; and making
various improvements in scheduling, including providing a longer or shorter
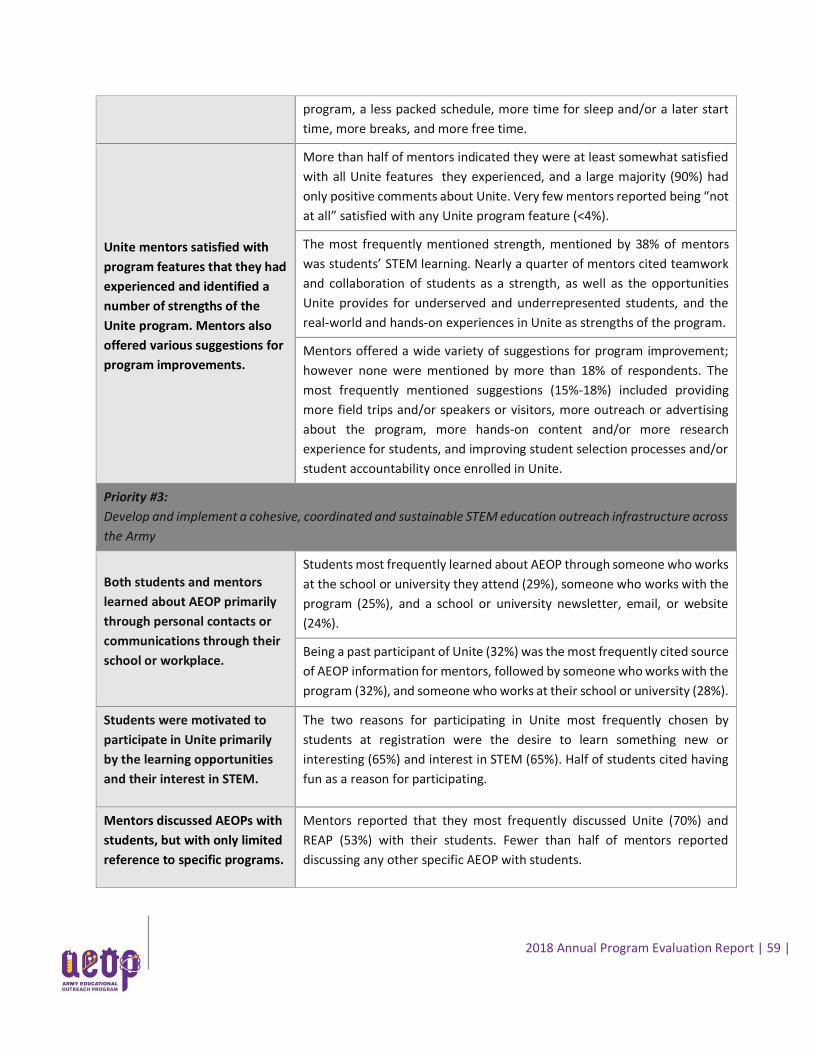
2018 Annual Program Evaluation Report | 59 |
program, a less packed schedule, more time for sleep and/or a later start
time, more breaks, and more free time.
Unite mentors satisfied with
program features that they had
experienced and identified a
number of strengths of the
Unite program. Mentors also
offered various suggestions for
program improvements.
More than half of mentors indicated they were at least somewhat satisfied
with all Unite features they experienced, and a large majority (90%) had
only positive comments about Unite. Very few mentors reported being “not
at all” satisfied with any Unite program feature (<4%).
The most frequently mentioned strength, mentioned by 38% of mentors
was students’ STEM learning. Nearly a quarter of mentors cited teamwork
and collaboration of students as a strength, as well as the opportunities
Unite provides for underserved and underrepresented students, and the
real-world and hands-on experiences in Unite as strengths of the program.
Mentors offered a wide variety of suggestions for program improvement;
however none were mentioned by more than 18% of respondents. The
most frequently mentioned suggestions (15%-18%) included providing
more field trips and/or speakers or visitors, more outreach or advertising
about the program, more hands-on content and/or more research
experience for students, and improving student selection processes and/or
student accountability once enrolled in Unite.
Priority #3:
Develop and implement a cohesive, coordinated and sustainable STEM education outreach infrastructure across
the Army
Both students and mentors
learned about AEOP primarily
through personal contacts or
communications through their
school or workplace.
Students most frequently learned about AEOP through someone who works
at the school or university they attend (29%), someone who works with the
program (25%), and a school or university newsletter, email, or website
(24%).
Being a past participant of Unite (32%) was the most frequently cited source
of AEOP information for mentors, followed by someone who works with the
program (32%), and someone who works at their school or university (28%).
Students were motivated to
participate in Unite primarily
by the learning opportunities
and their interest in STEM.
The two reasons for participating in Unite most frequently chosen by
students at registration were the desire to learn something new or
interesting (65%) and interest in STEM (65%). Half of students cited having
fun as a reason for participating.
Mentors discussed AEOPs with
students, but with only limited
reference to specific programs.
Mentors reported that they most frequently discussed Unite (70%) and
REAP (53%) with their students. Fewer than half of mentors reported
discussing any other specific AEOP with students.
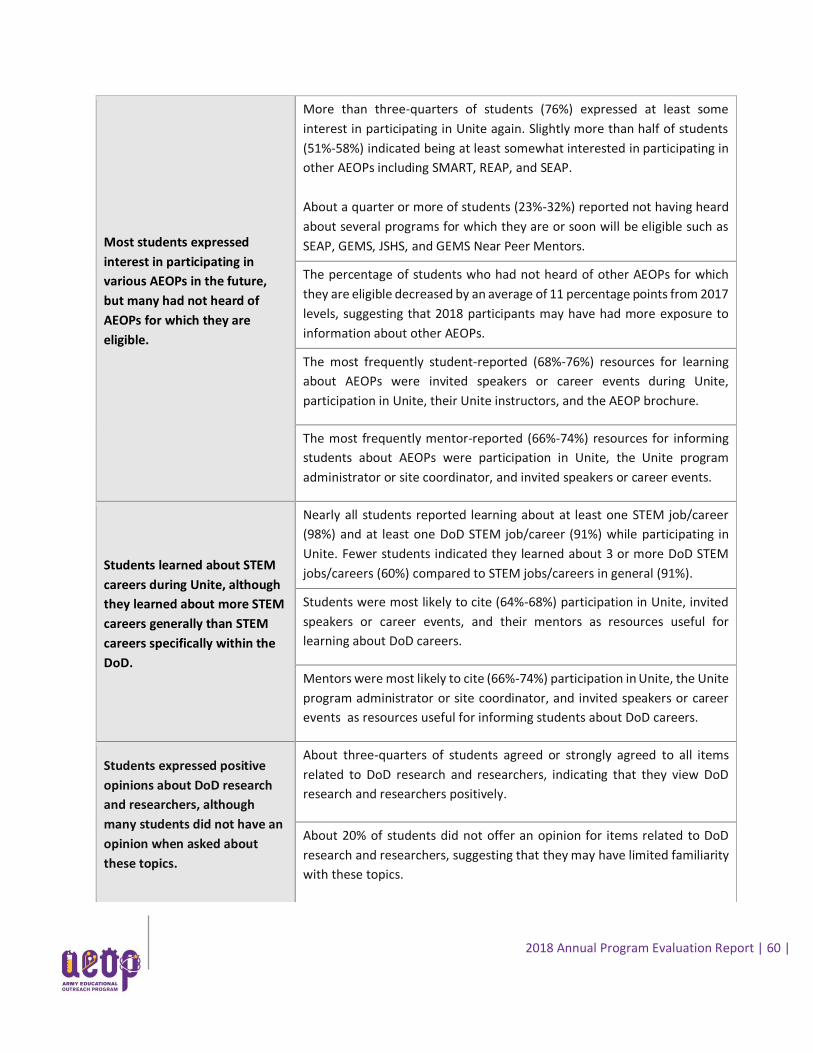
2018 Annual Program Evaluation Report | 60 |
Most students expressed
interest in participating in
various AEOPs in the future,
but many had not heard of
AEOPs for which they are
eligible.
More than three-quarters of students (76%) expressed at least some
interest in participating in Unite again. Slightly more than half of students
(51%-58%) indicated being at least somewhat interested in participating in
other AEOPs including SMART, REAP, and SEAP.
About a quarter or more of students (23%-32%) reported not having heard
about several programs for which they are or soon will be eligible such as
SEAP, GEMS, JSHS, and GEMS Near Peer Mentors.
The percentage of students who had not heard of other AEOPs for which
they are eligible decreased by an average of 11 percentage points from 2017
levels, suggesting that 2018 participants may have had more exposure to
information about other AEOPs.
The most frequently student-reported (68%-76%) resources for learning
about AEOPs were invited speakers or career events during Unite,
participation in Unite, their Unite instructors, and the AEOP brochure.
The most frequently mentor-reported (66%-74%) resources for informing
students about AEOPs were participation in Unite, the Unite program
administrator or site coordinator, and invited speakers or career events.
Students learned about STEM
careers during Unite, although
they learned about more STEM
careers generally than STEM
careers specifically within the
DoD.
Nearly all students reported learning about at least one STEM job/career
(98%) and at least one DoD STEM job/career (91%) while participating in
Unite. Fewer students indicated they learned about 3 or more DoD STEM
jobs/careers (60%) compared to STEM jobs/careers in general (91%).
Students were most likely to cite (64%-68%) participation in Unite, invited
speakers or career events, and their mentors as resources useful for
learning about DoD careers.
Mentors were most likely to cite (66%-74%) participation in Unite, the Unite
program administrator or site coordinator, and invited speakers or career
events as resources useful for informing students about DoD careers.
Students expressed positive
opinions about DoD research
and researchers, although
many students did not have an
opinion when asked about
these topics.
About three-quarters of students agreed or strongly agreed to all items
related to DoD research and researchers, indicating that they view DoD
research and researchers positively.
About 20% of students did not offer an opinion for items related to DoD
research and researchers, suggesting that they may have limited familiarity
with these topics.
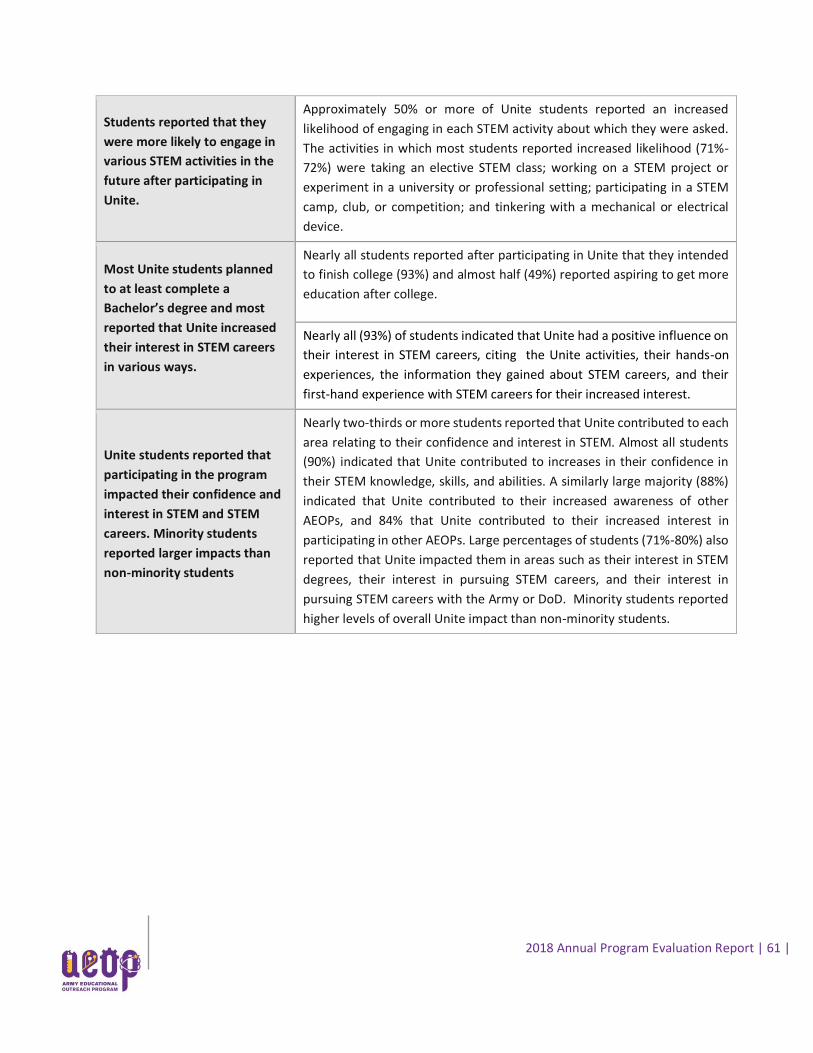
2018 Annual Program Evaluation Report | 61 |
Students reported that they
were more likely to engage in
various STEM activities in the
future after participating in
Unite.
Approximately 50% or more of Unite students reported an increased
likelihood of engaging in each STEM activity about which they were asked.
The activities in which most students reported increased likelihood (71%-
72%) were taking an elective STEM class; working on a STEM project or
experiment in a university or professional setting; participating in a STEM
camp, club, or competition; and tinkering with a mechanical or electrical
device.
Most Unite students planned
to at least complete a
Bachelor’s degree and most
reported that Unite increased
their interest in STEM careers
in various ways.
Nearly all students reported after participating in Unite that they intended
to finish college (93%) and almost half (49%) reported aspiring to get more
education after college.
Nearly all (93%) of students indicated that Unite had a positive influence on
their interest in STEM careers, citing the Unite activities, their hands-on
experiences, the information they gained about STEM careers, and their
first-hand experience with STEM careers for their increased interest.
Unite students reported that
participating in the program
impacted their confidence and
interest in STEM and STEM
careers. Minority students
reported larger impacts than
non-minority students
Nearly two-thirds or more students reported that Unite contributed to each
area relating to their confidence and interest in STEM. Almost all students
(90%) indicated that Unite contributed to increases in their confidence in
their STEM knowledge, skills, and abilities. A similarly large majority (88%)
indicated that Unite contributed to their increased awareness of other
AEOPs, and 84% that Unite contributed to their increased interest in
participating in other AEOPs. Large percentages of students (71%-80%) also
reported that Unite impacted them in areas such as their interest in STEM
degrees, their interest in pursuing STEM careers, and their interest in
pursuing STEM careers with the Army or DoD. Minority students reported
higher levels of overall Unite impact than non-minority students.
2018 Annual Program Evaluation Report | 62 |
Responsiveness to FY17 Evaluation Recommendations The primary purpose of the AEOP program evaluation is to serve as a vehicle to inform future
programming and continuous improvement efforts with the goal of making progress toward the AEOP
priorities. In previous years the timing of the delivery of the annual program evaluation reports has
precluded the ability of programs to use the data as a formative assessment tool. The goal is for programs
to be able to leverage the evaluation reports as a means to target specific areas for improvement and
growth.
Evaluation recommendations from FY17 made to programs are highlighted along with a summary of
efforts and outcomes reflected in the FY18 APR toward these areas.
AEOP Priority: Broaden, deepen, and diversify the pool of STEM talent in support of our Defense Industry
Base
FY17 Recommendation: As in FY16, participants continue to report that personal connections (family
member) is the primary way they learned about the program (25%). This was followed by other means of
marketing: school or university communication (22%), someone who works with the program (22%), and
someone who works at their school or university (21%). Unite should continue efforts to support site
distribution of emails and newsletters locally.
Unite FY18 Efforts and Outcomes: Sites selected to receive 2018 funding appeared to have a compelling
STEM program in place – one that could deliver a program that features STEM academics and hands-on
activities, and that could expose students to STEM career information and professionals. Sites received AEOP
videos, electronic AEOP and STEM career flyers, and information about connections to SWE mentors for the
purpose of enhancing the recruitment process and increasing enrollment.
AEOP Priority: Support and empower educators with unique Army research and technology resources
FY17 Recommendation: None
Unite FY18 Efforts and Outcomes: N/A
AEOP Priority: Develop and implement a cohesive, coordinated and sustainable STEM education
outreach infrastructure across the Army
FY17 Recommendation: As in FY16, most mentors reported they did not specifically discuss any other
AEOPs with students (57%). However, 62% did report discussing REAP with students. Findings revealed
that many students had not heard of SEAP (31%), JSHS (41%), and GEMS Near Peer Mentors (46%). It is
2018 Annual Program Evaluation Report | 63 |
recommended that Unite invest significant efforts in providing support for local sites to promote AEOPs
widely.
Unite FY18 Efforts and Outcomes: This year, high emphasis was placed on instructors/mentors/undergraduate
and graduate assistants gaining knowledge about AEOP opportunities and helping to transfer that knowledge
to students. AEOP promotional videos were distributed electronically to sites for recruitment and
education/training, as were electronic flyers about AEOP opportunities and STEM careers. Sites were
encouraged to have REAP students on campus connect with Unite students, and this happened at a number of
sites. A “meet and greet” of HSAP, URAP, and Unite students was proposed to be held at one site.
Recommendations for FY19 Program Improvement/Growth
Evaluation findings revealed that Unite experienced another successful year of programming in FY18.
Unite added a new host site in FY18, growing to 19 sites, student applicant placement rate grew to 59%,
and the overall percentage of underserved students was 88%, including 62% female participants. There
was significant growth toward mastery for Unite participants in their assessed 21st Century Skills during
the program, and more than 80% of participants reported large gains in STEM knowledge.
While the successes for Unite detailed above are commendable, there are some areas that have potential
for growth and/or improvement. The evaluation team therefore offers the following recommendations
for FY19 and beyond.
AEOP Priority: Broaden, deepen, and diversify the pool of STEM talent in support of our Defense
Industry Base
No recommendations for FY19.
AEOP Priority: Support and empower educators with unique Army research and technology
resources
The FY18 evaluation continued to provide evidence of the consistently positive impact of Unite on
participants. However, students in the program shared that they would like to have more hands-on
experiences/content in the program. The content for Unite is driven locally in most cases by the university
and the focus of the proposal. It is our recommendation that Unite work with the evaluation team to
refine the Request for Proposals (RFP) for Unite to incorporate a strategy to have more common hands-
on experiences across the program that could be branded Unite activities, and/or a framework for local
universities to use to plan required experiences to be determined for the program.
2018 Annual Program Evaluation Report | 64 |
AEOP Priority: Develop and implement a cohesive, coordinated, and sustainable STEM education
outreach infrastructure across the Army
As in FY16 and FY17, nearly half of mentors reported they did not specifically discuss any other AEOPs
with students (48%). While improved slightly from FY17, this has been a recurring and persistent area of
concern for Unite. It is recommended that Unite develop a centralized and required component of the
program that includes activities that are specifically designed to introduce participants to the relevant
AEOPs within their pipeline.