arousal responses to regular acceleration events divide
TRANSCRIPT

Arousal Responses to Regular Acceleration Events Divide Drivers Into High and Low Groups
A Naturalistic Pilot Study of Accelarousal and Its Implications to Human-Centered Design
Tung Huynh University of Houston
Mike Manser Texas A&M Transportation Institute
Ioannis Pavlidis University of Houston
Houston, Texas, USA College Station, Texas, USA Houston, Texas, USA [email protected] [email protected] [email protected]
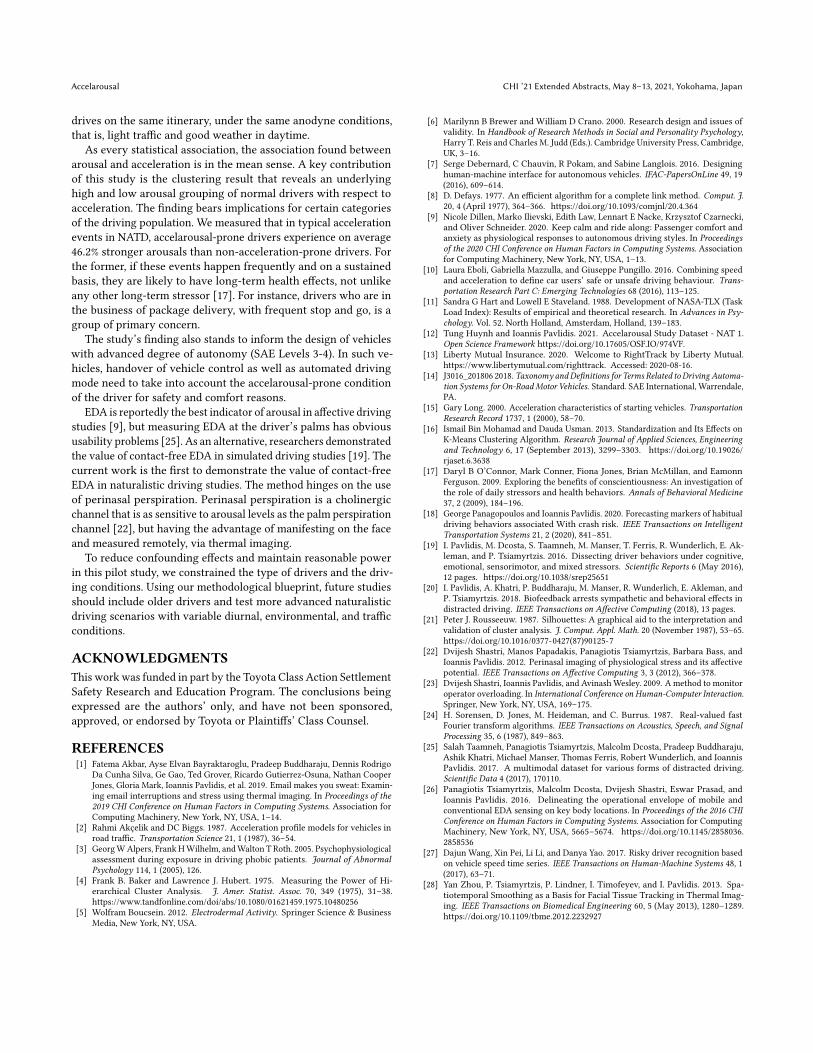
Figure 1: Visualization of acceleration and the associated arousal of accelarousal-prone driver S07, shortly after her entry onto a highway. LEFT: The hyphenated blue circle on the map indicates the position associated with the fgure’s snapshots. MIDDLE: Visual images captured from a dash camera and a facial camera show the surrounding environment and the driver’s facial expressions, respectively. RIGHT: Thermal facial image, where the red rectangle outlines the tracked region of interest (ROI). The preponderance of black dots on the zoomed in thermal ROI (see inset) suggests strong transient activation of perspiration pores, a phenomenon associated with the onset of hyperarousal.
ABSTRACT We conducted a daytime naturalistic driving study that involved the same 19 km town itinerary under similar light trafc and fair-weather conditions. We applied a real-time unobtrusive design that could serve as template in future driving studies. In this design, driving parameters and drivers’ arousal levels were captured via a vehicle data acquisition and thermal imaging system, respectively. Analyzing the data, we found that about half of the n = 11 healthy participants exhibited signifcantly larger arousal reactions to accel-eration with respect to the rest of the sample. Acceleration events were of the mundane type, such as entering a highway from an entrance ramp or starting from a red light. The results suggest an underlying grouping of normal drivers with respect to the loading
Permission to make digital or hard copies of all or part of this work for personal or classroom use is granted without fee provided that copies are not made or distributed for proft or commercial advantage and that copies bear this notice and the full citation on the frst page. Copyrights for components of this work owned by others than ACM must be honored. Abstracting with credit is permitted. To copy otherwise, or republish, to post on servers or to redistribute to lists, requires prior specifc permission and/or a fee. Request permissions from [email protected]. CHI ’21 Extended Abstracts, May 8–13, 2021, Yokohama, Japan © 2021 Association for Computing Machinery. ACM ISBN 978-1-4503-8095-9/21/05. . . $15.00 https://doi.org/10.1145/3411763.3451809
induced by commonplace acceleration. The fnding carries implica-tions for certain professions and the design of semi-autonomous vehicles.
CCS CONCEPTS • Human-centered computing → Empirical studies in HCI.
KEYWORDS Acceleration, arousal, thermal imaging, perinasal perspiration, EDA, afective computing, machine learning, hierarchical clustering, nat-uralistic driving study, driving behavior, autonomous vehicles
ACM Reference Format: Tung Huynh, Mike Manser, and Ioannis Pavlidis. 2021. Arousal Responses to Regular Acceleration Events Divide Drivers Into High and Low Groups: A Naturalistic Pilot Study of Accelarousal and Its Implications to Human-Centered Design. In CHI Conference on Human Factors in Computing Systems Extended Abstracts (CHI ’21 Extended Abstracts), May 8–13, 2021, Yokohama, Japan. ACM, New York, NY, USA, 7 pages. https://doi.org/10.1145/3411763. 3451809

CHI ’21 Extended Abstracts, May 8–13, 2021, Yokohama, Japan Huynh et al.
1 INTRODUCTION An important variable that features in most investigations on driver style and safety is acceleration. Acceleration is constitutional to driving [2]. First, it is the way drivers bring an idle vehicle to a target speed in order to reach their destination [15]. Second and most important, drivers frequently adjust acceleration throughout a drive to cope with dynamic trafc conditions. Diferent drivers have diferent acceleration preferences. For example, some drivers prefer rapid acceleration changes, a style that in current Driver Assistance Systems (DAS) is captured in the Sport drive mode; others prefer exactly the opposite, which is captured in the Economy drive mode.
In addition to style preferences associated with comfort and driv-ing satisfaction, volitional acceleration profles are also predictive of crash propensity [18]. Interestingly, while speed limits are enforced by state laws, acceleration limits are not. In lieu of regulation, ag-gressive acceleration patterns are targeted by telematics-based safe driver insurance programs [13]. In this direction, recent research eforts focused either on defning operational envelopes of safe ac-celeration and speed [10] or on developing methods for recognizing risky driving behaviors [27].
Either as a safety or as a style factor, acceleration has been linked to physiological responses both in simulated [18] and test-track ex-periments [9]. Hence, in addition to subjective ratings, acceleration efects on drivers could be objectively monitored via cholinergic (e.g., electrodermal activity) or adrenergic (e.g., heart rate) measure-ments. Dillen et al. [9] found that acceleration positively correlates with electrodermal activity (EDA) in passengers’ palms. They also showed that palm EDA was predictive of passenger discomfort. Alpers et al. [3] demonstrated that palm EDA, respiratory, and electrocardiographic measurements difered signifcantly between normal drivers and drivers diagnosed with phobias. Our research builds upon this prior body of work, aiming to address the following research question: RQ: How arousal responses of normal drivers relate to acceleration and other driving variables in the context of a standard commute? Is there any underlying grouping in these responses?
As acceleration is nearly ever-present and because arousal in-dicates coping capacity [19], answering the said RQ will not only elucidate driving behaviors in current vehicles, but will also inform human-centered design in future vehicles with higher levels of automation. Indeed, in SAE Level 3 and Level 4 vehicles, where driving will interleave between humans and machines [14], one of the thorniest issues is safe handover of vehicle control from the machine back to the human driver [7]. Knowing when is the best time to do this handover is a challenging multi-factorial problem, to which our research aspires to make a contribution. For example, if the machine knows that the human driver tends to be overloaded under certain conditions, this information may beneft the handover decision-making process.
It is generally accepted in the literature that naturalistic driving studies provide the best ecological validity [6]. At the same time, however, naturalistic drives pose analytic challenges due to the presence of confounding factors [9]. In this respect, we struck a careful balance by performing a naturalistic driving study but con-trolling for itinerary, trafc levels, weather, and driver profles. In more detail, we collected physiological, driving, and psychometric
data from n = 11 young but experienced drivers who drove a 19 km itinerary in Bryan - College Station, TX not unlike their daily commute. The drives took place in the morning under light trafc and fair-weather conditions. We quantifed arousal by measuring EDA on the driver’s face via thermal imaging - a method with high accuracy and ecological validity [22]. The said method circumvents the problems associated with palm EDA sensing at the driver’s hands, as these are busy handling the steering wheel [9, 25].
Extending Dillen et al.’s [9] results for passengers in test-track drives, we show that a positive correlation between acceleration and EDA levels also exists for drivers in naturalistic drives. Furthermore, we show that there is an underlying grouping of normal drivers determined by their arousal responses to commonplace acceleration. This result is intriguing and, due to the ecological validity of our study, it is also promising. It suggests that there is likely a category of normal drivers who are hyperaroused during routine acceleration events - a phenomenon we call accelarousal (Fig. 1), and which carries behavioral and design implications.
We contribute: 1) Initial evidence that hyperarousal responses to acceleration is an innate condition to some drivers, irrespective of other contextual factors. 2) An ecologically valid method to measure and detect hyperarousal in driving studies. 3) Public release of the data [12] and code associated with this paper to ensure reproducibility and encourage further research. The fndings of our study stand to beneft the design of physiological feedback loops for SAE Level 3 and Level 4 vehicles. We envision such feedback loops informing machine handover systems to avoid relinquishing control during accelarousal conditions - a safety consideration.
2 DESIGN OF NATURALISTIC DRIVING STUDY - NAT1
Arousal is indicative of the driver’s load [23]. Undue load is linked to stressors, leading to deterioration of driving performance and experience [20]. Stressors that have been studied extensively in the literature are distractions, particularly in the form of texting while driving [19]. The main goal of NAT 1 was to explore the arousing efect of variables that are constitutional to driving, such as acceleration and speed, under the most benign circumstances. Accordingly, the study design called for an easy, non-distracted town drive in daylight and good weather.
The experimental protocol was approved by the institutional review boards of the universities participating in this study. After giving informed consent, the participants completed a biographic questionnaire, providing demographic information. Subsequently, the participants went through two sessions.
Baseline session (BL). The purpose of the BL session was to establish the baseline arousal level of participants. Baseline arousal levels exhibit signifcant inter-individual variability in human beings [5], which means that the ‘efective zero lines’ vary. Accordingly, in stress studies what matters is not the absolute arousal value, but how much the task raised the subjects’ arousal level from their respective baseline. Hence, by subtracting the corresponding mean baseline levels from subsequent phasic arousal measurements, we ameliorate measurement bias between participants [1]. To bring par-ticipants close to their baseline levels, we asked them to sit

Accelarousal CHI ’21 Extended Abstracts, May 8–13, 2021, Yokohama, Japan
quietly in the parked experimental vehicle, listening to spa music for 5 minutes. A thermal imaging sensor was acquir-ing participants’ physiological signals in real-time during this period.
Naturalistic drive (NATD). Upon completion of the BL ses-sion, participants drove a designated itinerary in the Bryan -College Station, TX area (population about 210,000), using a 2015 Toyota Sienna. Figure 2a shows this itinerary, which in-cluded a segment of a highway as well as residential streets. The length of the itinerary was 19 km and took participants 25-35 min to complete it with speeds that ranged from 0 to 120 kph. Trafc was light in all instances.
After the BL and NATD sessions, the participants completed the NASA TLX questionnaire [11] - a subjective workload assessment tool that complements the objective assessment of task-induced sympathetic arousal; it features the following sub-scales: Mental Demand, Physical Demand, Temporal Demand, Own Performance, Efort, and Frustration.
2.1 Participants We recruited participants from the communities of Bryan and Col-lege Station, TX through emails and fyer postings. Participants had to have normal or corrected to normal vision and a valid driving license. We excluded subjects on medications afecting their ability to drive safely. We selected individuals with at least two years of driving experience, who commuted daily, and were between 18 and 27 years of age. Hence, we focused on young but experienced drivers to safeguard the power of the pilot study. This is because sys-tematic diferences between young and old drivers were reported in other afective driving studies [19], rendering large age variance a potential confounder that would need a bigger study to resolve. A total of n = 12 subjects conforming to the inclusion-exclusion criteria volunteered for the study. Raw data for one participant were not adequately recorded due to technical issues. Raw data for n = 11 participants (5 males/6 females, 21.6 ± 1.7 years of age) were largely complete, comprising our working set.
2.2 Experimental Setup Figure 2: Design of NAT 1 Study. [a] NATD itinerary. The Facial thermophysiology, facial observations, and frst person ob- white arrows indicate the direction of driving. The superim-servations were recorded via a thermal and two visual cameras, posed speed heatmap was generated from participant’s S01 respectively. These video recordings took place during both the driving data. [b] Setup of the thermal, facial, and dash cam-BL and NATD sessions. All three cameras were located ∼ 1m from eras in the vehicle employed in the study (a specially instru-the driver, tucked atop the dashboard (Fig. 2b). A data acquisition mented 2015 Toyota Sienna). In the back seat shows the com-system was capturing several driving variables during the NATD puter screen of the experimenter. session. All the sensors were time-synced.
In more detail, we used a Tau 640 long-wave infrared (LWIR) camera (FLIR Systems Inc, Wilsonville, OR) with < 50 mK thermal
acceleration, brake force, and steering angle. The DAQ also collected resolution and 640×512 pixels spatial resolution. Thermal data were GPS data. collected at a frame rate of 7.5 fps and were used for computing
the driver’s arousal. Visual facial imagery, collected via a webcam, 3 DATA PREPARATION was meant to be used for qualitative assessment purposes. Another
webcam was placed on the dashboard, aiming out towards the While driving variables were readily available from the DAQ system, front of the vehicle. It was meant to record the itinerary from the the arousal variable was not immediately available, because it was driver’s point of view. We also used a Dewetron Data Acquisition embedded in the captured thermophysiological data. Hence, we (DAQ) system (Dewerton Inc, East Greenwich, RI) to record driving needed to extract the arousal signals from the facial thermal imaging variables from diferent channels. These variables included speed, streams. We also needed to extract feature variables.

CHI ’21 Extended Abstracts, May 8–13, 2021, Yokohama, Japan Huynh et al.
Figure 3: Extracted raw and noise-reduced perinasal perspiration signals (PP) of participant S12 in the NATD session. TOP: Thermal facial snapshots demonstrating natural head motions and other challenging actions during driving (e.g., putting on sunglasses). MIDDLE: Details of thermal ROIs outlined by the red rectangles in the thermal facial snapshots. BOTTOM: The raw PP signal in grey and the noise-reduced PP signal in red. The algorithm extracts perinasal perspiration values in the vast majority of cases. In a few instances where reliable extraction is not possible (e.g., extreme head turn moment at t = 845 s), the algorithm does not report a value (NA), thus safeguarding the reliability of the physiological measurement.
3.1 Extraction of Arousal Signal We used the thermal facial videos to extract perinasal perspiration (PP) signals, known to commensurate with electrodermal (EDA) activity in the palm [22]; thus, PP is a reliable proxy of arousal. As the drivers’ heads were moving freely, to ameliorate the efect of motion in the PP signal extraction, we used a proven tissue tracker reported by Zhou et al. [28]. We initiated the tracking algorithm by selecting the participant’s perinasal region in the frst frame. In every subsequent frame, the tracker determined the best matching section of the thermal clip via spatiotemporal smoothing. In this temporally tracked region, activated perspiration pores appear as ‘cold’ (dark) spots, amidst ‘hot’ surrounding tissue - a phenomenon quantifed by a morphology-based algorithm [22], which yields the arousal signal (Fig. 3).
Although PP signal extraction is robust, PP values still contain high-frequency noise stemming from tracking imperfections [28]. We used a low-pass Fast Fourier Transform (FFT) flter with thresh-old f = 1/2.5 to suppress such noise [24]. Figure 3 shows superim-posed the PP signals of participant S12 before and after applying FFT fltering.
In order to ameliorate bias due to signifcant inter-individual variability of baseline arousal levels among participants, we ad-justed their PPNATD signals by subtracting their corresponding mean PPBL signals. Efectively, this normalization allows analysis to be performed on the participants’ diferential arousal induced by the driving task, rather than the absolute arousal, which may be deceptively high or low, depending on the baseline level from which participants started. Please also note that because PP signals are of exponential nature [22], we apply a logarithmic correction to comply with normality assumptions in subsequent analytic cal-culations. Equation (1) shows the formula we used to compute the corrected normalized arousal of participant Si at time t of NATD.
∆PPNATDi (t) = ln(PPNATDi (t)) − ln(PPBLi ). (1)
3.2 Feature Extraction A key issue in the operationalization of analytic investigations in driving studies is the choice of the past and future time windows. Here we follow the lead of prior research in aggressive vs. non-aggressive driving, where acceleration and other driving variables play a key role; this research has documented that a past window

Accelarousal CHI ’21 Extended Abstracts, May 8–13, 2021, Yokohama, Japan
of 30 seconds is sufcient for robust predictions 5 to 10 seconds out [18]. We settled on a 5 second future window, taking into account the time constant of cholinergic responses, which ranges between 2 and 5 s [26].
Accordingly, we performed feature extraction using a sliding past → f uture time window of 30 s → 5 s. This windowing applied to all the models described in the present paper. Assuming the currently examined time is t , we compute driving features in [t − 30, t] and arousal features in (t , t + 5]. The features are of statistical or correlative nature. Statistical features include the mean and standard deviation of speed, acceleration, brake force, and steering for the last 30 seconds. Statistical features also include the mean (corrected and normalized) driver arousal in the next 5 seconds. The said features provide information about the variables’ distributions in the time window of interest. Correlative features include the Pearson correlation among driving statistical features in the window [t − 30, t] and arousal features in the window (t , t + 5]. Hence, correlative features capture the relationship between driving variables in the recent past and driver state in the immediate future. We computed the correlation strength between all feature pairs and found that the brake force features are highly collinear with the features of other driving variables (correlation coefcient up to r = ±0.8). For this reason, we will exclude break force features from subsequent analytical models.
4 ANALYTIC METHODS AND RESULTS The R scripts that implement the analytic methods described in this section reside in GitHub (Huynh, T. & Pavlidis, I. Accelarousal-Study-Methods. GitHub https://github.com/UH-CPL/Accelarousal-Study-NAT1-Methods). These scripts operate on the study’s cu-rated data, which are freely available on the Open Science Frame-work (OSF) [12]. In more detail, the OSF repository holds bio-graphic/psychometric data, quantitative data, and ancillary media. The quantitative data include physiological and driving signals, while the ancillary media feature video recordings from the facial and dash cameras.
4.1 Linear Regression Model First, in Eq. (2) we constructed a mixed efects model to check if statistical features of driving variables over 30 second increments in the past, can account for the drivers’ arousal responses 5 seconds into the future. The dependent variable ∆PPNATDi (t , t +5] indicates the mean corrected and normalized arousal response for participant i , 5 seconds out. As the time t shifts for participant i , mean (x ·) and standard deviation (s ·) predictors are computed over the past t −30 seconds for speed, acceleration, and steering. The fxed efects term ∆PPNATDi denotes the overall mean corrected and normalized arousal of participant i , while 1|S indicates the incorporation of random efects and ϵ is white noise.
∆PPNATDi (t , t + 5] = βx speed xspeedi, [t −30, t ] + βsspeed sspeedi, [t −30, t ]
+ βx accelxacceli, [t −30, t ] + βsaccelsacceli, [t −30, t ] + βx steer xsteeri, [t −30,t ] + βssteer ssteeri, [t −30, t ] + ∆PPNATDi + βo + ϵ + 1|S .
(2)
Coef. Estim. Std. Err. df t-val Pr(> |t|) 0.000 51 0.000 13 2326 3.894 < 0.001∗∗∗ βx speed
−0.001 26 0.000 41 2325 −3.045 0.002∗∗ βsspeed
0.002 28 0.000 65 2326 3.466 < 0.001∗∗∗ βx accel 0.006 51 0.001 05 2326 6.223 < 0.001∗∗∗ βsaccel −0.000 69 0.000 32 2327 −2.155 0.031∗ βx steer −0.000 77 0.000 19 2326 4.056 < 0.001∗∗∗ βssteer
Table 1: Results of linear model (2) instantiated with 30 s → 5 s window split, between predictors → response, respec-tively. *: p ≤ 0.05, **: p ≤ 0.01, ***: p ≤ 0.001
Table 1 shows the results of linear model (2). All driving variables account to various degrees for the upcoming arousal state of the driver. Acceleration, however, appears to account the most with both its moments exhibiting high signifcance (p < 0.001). Further-more, the positive coefcients βx accel and βsaccel suggest that the higher the mean acceleration or the acceleration variance of the vehicle, the higher the arousal of the driver. After acceleration, the second most predictive variable appears to be speed, followed by steering.
4.2 Hierarchical Clustering - Types of Drivers We used a clustering algorithm to identify any underlying grouping, which could provide deeper insights into the results of linear model (2). For a dataset with a small number of participants, such as the NATD dataset, hierarchical clustering is a good methodological choice [4]. To maximize the discrimination between clusters, we selected the complete linkage function [8] as the linkage criterion. All correlative features have a range between -1 and 1, and thus, standardization was not necessary [16]. We used Silhouettes [21] to determine the optimal number of clusters, which came to be c = 2. Table 2 shows the resulting two groups of drivers based on clustering the correlative features of driving variables the last 30 seconds with the drivers’ arousal the next 5 seconds. Drivers in the group highlighted in red exhibit consistently signifcant positive association of acceleration with arousal, as well as speed with arousal. Drivers in the group highlighted in blue are bereft of such a pattern. Furthermore, the NASA-TLX scores of the red group 32.75 ± 14.43 trend higher than the scores of the blue group 19.67 ± 9.07 (t-test, p = 0.08) - a psychometric confrmation that the red group’s acceleration- and speed-driven hyperarousal is accompanied with a sense of overloading.
We named drivers in the red group accelarousal-prone. One could also name them tachoarousal-prone, as speed intensity also correlates with their arousal status. However, acceleration appears to be the strongest and most consistent factor across all the models we employed, that is, linear (section 4.1) and clustering (section 4.2). Hence, acceleration is likely the primary contributor to this phenomenon with speed coming second and as a result of it. Fig-ure 4 depicts the intensity evolution of driving and arousal vari-ables along the itinerary for non-accelarousal-prone driver S01 vs. accelarousal-prone driver S07. The speed column of panels shows that both drivers were speeding in the state highway portion of the itinerary. As the acceleration column indicates, this speeding was achieved through bouts of acceleration. The arousal column, shows

CHI ’21 Extended Abstracts, May 8–13, 2021, Yokohama, Japan Huynh et al.
pi xspeed sspeed xaccel saccel xsteer ssteer
S01 0.174 0.013 0.041 0.061 −0.114 −0.167
S02 0.045 0.030 0.182 0.432∗∗∗ 0.109 0.259∗
S03 0.392∗∗ −0.122 0.313∗ 0.237 0.049 0.187
S04 0.069 −0.034 −0.002 0.297 −0.019 0.278
S05 0.483∗∗ 0.201 0.523∗∗ 0.262 −0.211 0.207
S06 0.066 0.071 0.312∗∗ 0.262∗ −0.042 0.107
S07 0.062 0.446∗∗ 0.073 0.229
S08 −0.036 −0.163 0.142 0.100 −0.022 0.073
S10 −0.338∗∗∗ 0.044 −0.092 0.026 0.182 0.092
S11 0.365∗∗∗ 0.152 0.420∗∗∗ 0.471∗∗∗ −0.080 0.154
S12 0.443∗∗∗ −0.004 0.439∗∗∗ 0.314∗∗ −0.217 0.225
0.388∗∗∗ 0.420∗∗∗
Table 2: Clustering results of the correlative features between driving variables and drivers’ arousal with a 30 s → 5 s time windowing, respectively. Red text shows cases where acceleration and speed intensity consistently correlate with arousal (accelarousal-prone), while blue text shows cases where such a pattern is absent (non-accelarousal-prone). Star notation indi-cates signifcance level.
Figure 4: Visualization of driving and arousal variables through the NATD itinerary for non-accelarousal-prone driver S01 and accelarousal-prone driver S07. The dotted blue ellipses with the arrows point to the highway portion of the itinerary where speeding through bouts of acceleration produce very diferent arousal responses in the two drivers.
the diferent efects these otherwise similar driving behaviors had 5 DISCUSSION on the drivers’ arousal states: The non-accelarousal-prone driver This pilot research demonstrated that normal, young, and experi-S01 maintains low levels of arousal (dark color in the heatmap), enced drivers are aroused with respect to variables endogenous while the accelarousal-prone driver S07 undergoes a hyperarousal to driving, notably acceleration, but also speed. This association episode throughout this process (light color in the heatmap). appears to be free of confounders, as it is the result of naturalistic
Accelarousal CHI ’21 Extended Abstracts, May 8–13, 2021, Yokohama, Japan
drives on the same itinerary, under the same anodyne conditions, that is, light trafc and good weather in daytime.
As every statistical association, the association found between arousal and acceleration is in the mean sense. A key contribution of this study is the clustering result that reveals an underlying high and low arousal grouping of normal drivers with respect to acceleration. The fnding bears implications for certain categories of the driving population. We measured that in typical acceleration events in NATD, accelarousal-prone drivers experience on average 46.2% stronger arousals than non-acceleration-prone drivers. For the former, if these events happen frequently and on a sustained basis, they are likely to have long-term health efects, not unlike any other long-term stressor [17]. For instance, drivers who are in the business of package delivery, with frequent stop and go, is a group of primary concern.
The study’s fnding also stands to inform the design of vehicles with advanced degree of autonomy (SAE Levels 3-4). In such ve-hicles, handover of vehicle control as well as automated driving mode need to take into account the accelarousal-prone condition of the driver for safety and comfort reasons.
EDA is reportedly the best indicator of arousal in afective driving studies [9], but measuring EDA at the driver’s palms has obvious usability problems [25]. As an alternative, researchers demonstrated the value of contact-free EDA in simulated driving studies [19]. The current work is the frst to demonstrate the value of contact-free EDA in naturalistic driving studies. The method hinges on the use of perinasal perspiration. Perinasal perspiration is a cholinergic channel that is as sensitive to arousal levels as the palm perspiration channel [22], but having the advantage of manifesting on the face and measured remotely, via thermal imaging.
To reduce confounding efects and maintain reasonable power in this pilot study, we constrained the type of drivers and the driv-ing conditions. Using our methodological blueprint, future studies should include older drivers and test more advanced naturalistic driving scenarios with variable diurnal, environmental, and trafc conditions.
ACKNOWLEDGMENTS This work was funded in part by the Toyota Class Action Settlement Safety Research and Education Program. The conclusions being expressed are the authors’ only, and have not been sponsored, approved, or endorsed by Toyota or Plaintifs’ Class Counsel.
REFERENCES [1] Fatema Akbar, Ayse Elvan Bayraktaroglu, Pradeep Buddharaju, Dennis Rodrigo
Da Cunha Silva, Ge Gao, Ted Grover, Ricardo Gutierrez-Osuna, Nathan Cooper Jones, Gloria Mark, Ioannis Pavlidis, et al. 2019. Email makes you sweat: Examin-ing email interruptions and stress using thermal imaging. In Proceedings of the 2019 CHI Conference on Human Factors in Computing Systems. Association for Computing Machinery, New York, NY, USA, 1–14.
[2] Rahmi Akçelik and DC Biggs. 1987. Acceleration profle models for vehicles in road trafc. Transportation Science 21, 1 (1987), 36–54.
[3] Georg W Alpers, Frank H Wilhelm, and Walton T Roth. 2005. Psychophysiological assessment during exposure in driving phobic patients. Journal of Abnormal Psychology 114, 1 (2005), 126.
[4] Frank B. Baker and Lawrence J. Hubert. 1975. Measuring the Power of Hi-erarchical Cluster Analysis. J. Amer. Statist. Assoc. 70, 349 (1975), 31–38. https://www.tandfonline.com/doi/abs/10.1080/01621459.1975.10480256
[5] Wolfram Boucsein. 2012. Electrodermal Activity. Springer Science & Business Media, New York, NY, USA.
[6] Marilynn B Brewer and William D Crano. 2000. Research design and issues of validity. In Handbook of Research Methods in Social and Personality Psychology, Harry T. Reis and Charles M. Judd (Eds.). Cambridge University Press, Cambridge, UK, 3–16.
[7] Serge Debernard, C Chauvin, R Pokam, and Sabine Langlois. 2016. Designing human-machine interface for autonomous vehicles. IFAC-PapersOnLine 49, 19 (2016), 609–614.
[8] D. Defays. 1977. An efcient algorithm for a complete link method. Comput. J. 20, 4 (April 1977), 364–366. https://doi.org/10.1093/comjnl/20.4.364
[9] Nicole Dillen, Marko Ilievski, Edith Law, Lennart E Nacke, Krzysztof Czarnecki, and Oliver Schneider. 2020. Keep calm and ride along: Passenger comfort and anxiety as physiological responses to autonomous driving styles. In Proceedings of the 2020 CHI Conference on Human Factors in Computing Systems. Association for Computing Machinery, New York, NY, USA, 1–13.
[10] Laura Eboli, Gabriella Mazzulla, and Giuseppe Pungillo. 2016. Combining speed and acceleration to defne car users’ safe or unsafe driving behaviour. Trans-portation Research Part C: Emerging Technologies 68 (2016), 113–125.
[11] Sandra G Hart and Lowell E Staveland. 1988. Development of NASA-TLX (Task Load Index): Results of empirical and theoretical research. In Advances in Psy-chology. Vol. 52. North Holland, Amsterdam, Holland, 139–183.
[12] Tung Huynh and Ioannis Pavlidis. 2021. Accelarousal Study Dataset - NAT 1. Open Science Framework https://doi.org/10.17605/OSF.IO/974VF.
[13] Liberty Mutual Insurance. 2020. Welcome to RightTrack by Liberty Mutual. https://www.libertymutual.com/righttrack. Accessed: 2020-08-16.
[14] J3016_201806 2018. Taxonomy and Defnitions for Terms Related to Driving Automa-tion Systems for On-Road Motor Vehicles. Standard. SAE International, Warrendale, PA.
[15] Gary Long. 2000. Acceleration characteristics of starting vehicles. Transportation Research Record 1737, 1 (2000), 58–70.
[16] Ismail Bin Mohamad and Dauda Usman. 2013. Standardization and Its Efects on K-Means Clustering Algorithm. Research Journal of Applied Sciences, Engineering and Technology 6, 17 (September 2013), 3299–3303. https://doi.org/10.19026/ rjaset.6.3638
[17] Daryl B O’Connor, Mark Conner, Fiona Jones, Brian McMillan, and Eamonn Ferguson. 2009. Exploring the benefts of conscientiousness: An investigation of the role of daily stressors and health behaviors. Annals of Behavioral Medicine 37, 2 (2009), 184–196.
[18] George Panagopoulos and Ioannis Pavlidis. 2020. Forecasting markers of habitual driving behaviors associated With crash risk. IEEE Transactions on Intelligent Transportation Systems 21, 2 (2020), 841–851.
[19] I. Pavlidis, M. Dcosta, S. Taamneh, M. Manser, T. Ferris, R. Wunderlich, E. Ak-leman, and P. Tsiamyrtzis. 2016. Dissecting driver behaviors under cognitive, emotional, sensorimotor, and mixed stressors. Scientifc Reports 6 (May 2016), 12 pages. https://doi.org/10.1038/srep25651
[20] I. Pavlidis, A. Khatri, P. Buddharaju, M. Manser, R. Wunderlich, E. Akleman, and P. Tsiamyrtzis. 2018. Biofeedback arrests sympathetic and behavioral efects in distracted driving. IEEE Transactions on Afective Computing (2018), 13 pages.
[21] Peter J. Rousseeuw. 1987. Silhouettes: A graphical aid to the interpretation and validation of cluster analysis. J. Comput. Appl. Math. 20 (November 1987), 53–65. https://doi.org/10.1016/0377-0427(87)90125-7
[22] Dvijesh Shastri, Manos Papadakis, Panagiotis Tsiamyrtzis, Barbara Bass, and Ioannis Pavlidis. 2012. Perinasal imaging of physiological stress and its afective potential. IEEE Transactions on Afective Computing 3, 3 (2012), 366–378.
[23] Dvijesh Shastri, Ioannis Pavlidis, and Avinash Wesley. 2009. A method to monitor operator overloading. In International Conference on Human-Computer Interaction. Springer, New York, NY, USA, 169–175.
[24] H. Sorensen, D. Jones, M. Heideman, and C. Burrus. 1987. Real-valued fast Fourier transform algorithms. IEEE Transactions on Acoustics, Speech, and Signal Processing 35, 6 (1987), 849–863.
[25] Salah Taamneh, Panagiotis Tsiamyrtzis, Malcolm Dcosta, Pradeep Buddharaju, Ashik Khatri, Michael Manser, Thomas Ferris, Robert Wunderlich, and Ioannis Pavlidis. 2017. A multimodal dataset for various forms of distracted driving. Scientifc Data 4 (2017), 170110.
[26] Panagiotis Tsiamyrtzis, Malcolm Dcosta, Dvijesh Shastri, Eswar Prasad, and Ioannis Pavlidis. 2016. Delineating the operational envelope of mobile and conventional EDA sensing on key body locations. In Proceedings of the 2016 CHI Conference on Human Factors in Computing Systems. Association for Computing Machinery, New York, NY, USA, 5665–5674. https://doi.org/10.1145/2858036. 2858536
[27] Dajun Wang, Xin Pei, Li Li, and Danya Yao. 2017. Risky driver recognition based on vehicle speed time series. IEEE Transactions on Human-Machine Systems 48, 1 (2017), 63–71.
[28] Yan Zhou, P. Tsiamyrtzis, P. Lindner, I. Timofeyev, and I. Pavlidis. 2013. Spa-tiotemporal Smoothing as a Basis for Facial Tissue Tracking in Thermal Imag-ing. IEEE Transactions on Biomedical Engineering 60, 5 (May 2013), 1280–1289. https://doi.org/10.1109/tbme.2012.2232927