arpa-e workshop: business models in transportation her… · · 2014-04-23arpa-e workshop:...
TRANSCRIPT

Monali Shah
HERE, A division of Nokia
March 13, 2014
ARPA-E Workshop: Business Models in Transportation
Agenda
Business Model Framework Application in Data & Technology Business Model Shifts Examples
© HERE 2013 2

3
Business Model Innovation Framework
What do we provide? Benefits/solutions Products & services
How do we provide it? Channels Partnerships Supply chain configuration
How do we make money? Value levers Cost levers Pricing rationale
How do we differentiate & sustain? Brands Quality, consistency Core competency
Who do we serve? Target consumers Value chain locations Roles performed

4
Individual Mode Optimization, Mode Selection, Network Optimization
Who do we serve? Guiding & Optimizing Transportation
Driving Transit Pedestrian/Biking
Navigate to destination considering • time, distance, road characteristics (260+ attributes) • real-time conditions (traffic flow, congestion, weather, incidents) • energy/eco impact, safety (slope and curvature of roads)
Passenger
Freight/Truck What are the biggest pain points?
What can we best address using our assets?

5 5
What needs are addressed? Mobility, Safety, and Eco Efficiency
Traffic Management
Consumer Information
Operations
Planning
Performance Measurement
HERE Maps and Real-Time Data are combined in different ways to serve different needs

How do we provide? Shifted to an index and platform centered view
6 © HERE 2013
Real Life Index

7 © HERE 2013
What do we provide & where do we invest? Investment in true-to-real-life index of the world
. M

Partnerships/Value Chain: Powering Automated Vehicle Technology
8 © 2013 HERE | Nike Presentation v 2.1 | 05-14-2013 | CMD
Jan 2014 North American Auto Show 2014: Continental and HERE team up to map out the future of vehicle connectivity Joint development for next generation Electronic Horizon, Automated Driving and new Intelligent Transportation Systems based on high precision map technology
Nov 2013 HERE has teamed up with Mercedes Benz to jointly develop smart maps for connected cars and ultimately, self driving cars.

9
Digitized Maps to get from A to B 25 years ago map creation started out by digitizing physical map sources
Computable Roads to Guide My Way Precise road geometries with rich sets of attributes to make them computable
Computable Reality Fully interconnected and attributed 3D models, combining aerial and street level technologies and real-time data
Transforming the way the world moves
HERE’s Ambition
To produce state of the art computable index of the world around us

10
HERE HD Map • Derived from LiDAR • 3D spline based surface model • Lane-level and intersection
mapping • Slope, Elevation, Curvature • Ability to model non-drivable
surfaces • …
30 30 70 90 70
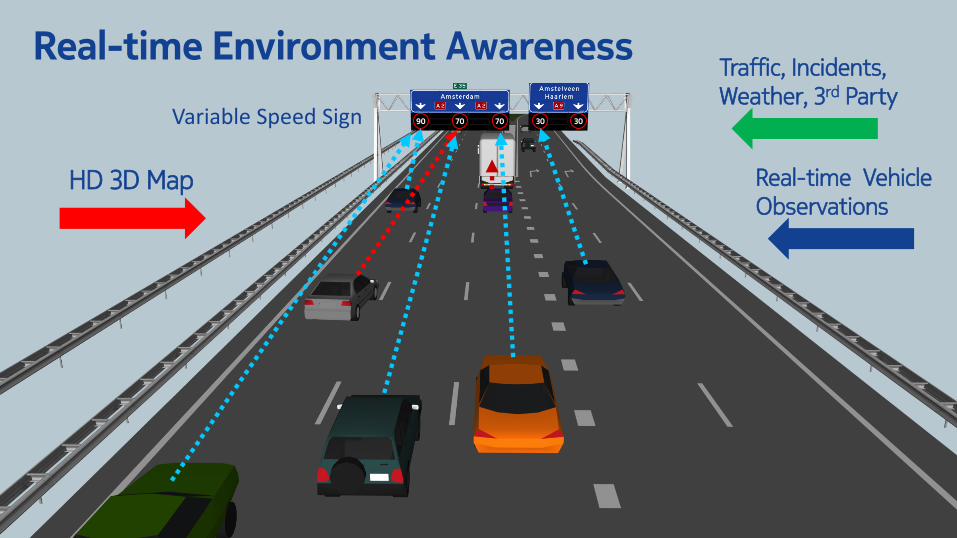
Real-time Environment Awareness
HD 3D Map Real-time Vehicle Observations
Traffic, Incidents, Weather, 3rd Party
Variable Speed Sign

Driver Behavior Behavior in sharp curve
12 12 © 2013 HERE | Company confidential
Centroid
Last second braking
Points of first brake application
Initial Speed 50-59kph

13 13 © 2013 HERE | Company confidential
Southbound driving, rainstorm

14 © HERE 2013
Automotive Cloud Leveraging vehicle sensors and location data to enable new solutions
Vehicle Sensor Data
Urban Planning
Traffic Management Road Infrastructure Planning
Multi-modal
Enterprise
Fleet Management & Optimization
Cloud-Based Analytics Services
Flow, Direction, Time of Day
Behavioral Data
Demographics
Braking, Skidding, Suspension
Origin / Destination
Etc.
Sensor Data
High Definition Maps & Traffic
+
Auto Safety
Partially Automated Driving Highly Automated Driving

Business Models
• Value chain specific (automotive, mobile, enterprise, government)
− Players in the value chain
− Sources of value
− Roles are shifting in virtually every sector
• Shift from license and sell content to access platform and conduct transactions
• Build and sell applications
− Free to consumer
− Built into cost of device and/or automobile
− Some location based advertising
• Public/Private Partnerships
• Create intelligence out of data assets and continue to fuel and improve the data and experience
© HERE 2013

16
Eco-Routing Example

17
Optimizing Truck Routing & Efficiency
18
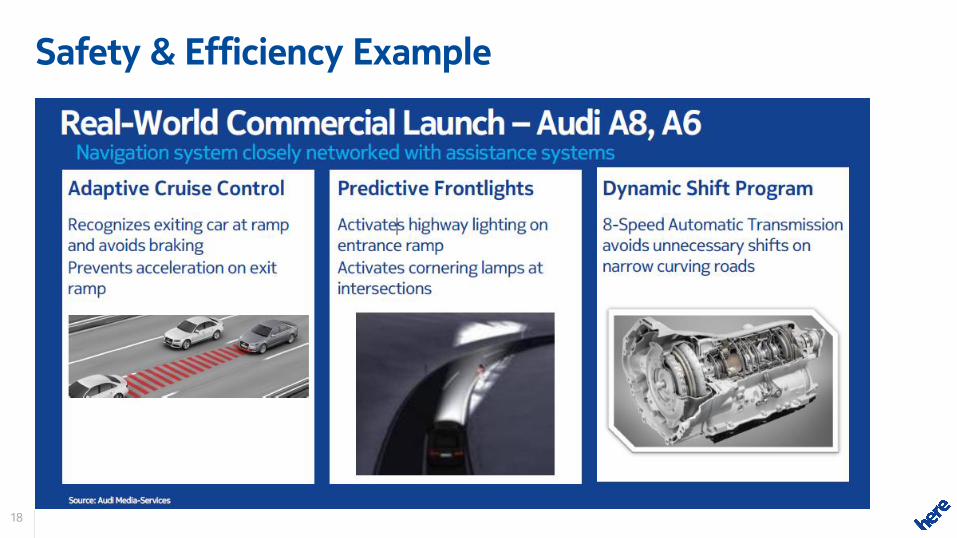
Safety & Efficiency Example

19
Multi-Modal Routing
• Automotive-grade global maps for effective car routing
• Extended navigation roads at key sites (malls, stadiums, etc.) to appropriate venue entrances
• Public transport (rail, bus, etc.) lines, stops and routes based on timetables (where available) or estimated routing
• Pedestrian routes including paths, connectors (stairs) and more
• Millions of POIs to route to
• Addresses the transportation needs of all residents and visitors, thereby increasing the percentage of people that may access government services and facilities
• Increases use of public transport and walking: healthier people and healthier planet
Car, Public Transport and Pedestrian Routing
Key HERE Functionality
Benefits
Public transport , pedestrian , and biking are becoming more central to the way people travel based on consumer choices, government initiatives, and urban growth.

20 © 2013 HERE | Title | Author | Company confidential
Transforming the way the world moves

ADAS-RP (Research Platform)
21

Green Routing Plugins
22
Allows one to customize the route cost calculations using the various NAVTEQ traffic and map attributes.

23
Compare Results with Predicted Values
Compare Results with Predicted Values to Validate

24
Compare Results
Run through large number of routes with cost equations and analyze predicted results with ground truth realities.

Drive & Study Flow 1. A pre-test survey was filled out to capture
stated frustration responses of drivers, prior to
the drive.
2. Drivers wore the unobtrusive biometric belt
while driving in each of the conditions depicted
on the left.
3. Each driver was instructed to drive from for
approximately 30 minutes, with multiple
destinations made in the city of Boston.
4. Following the driving experience, participants
were asked to fill out a short post-test survey
aimed at measuring cognitive load and self-
reported driver experience.
Condition 1 Drive with Paper Directions
Condition 2 Drive using Standard GPS System
Condition 3 Drive using Natural Guidance

26
Eco Routing

27
Fuel Efficiency Saves Money and Reduces CO2 Commercial Vehicle Savings Based on Fuel Economy Improvement
Annual
Distance
Driven (km)
Average Fuel
Consumption
Rate
(litre/100km))
Total Annual
Fuel
Consumption
(litre)
Unit Fuel Cost
(€/litre)
Annual Fuel
Cost (€)
Slope Fuel
Economy
Improvement
Annual
Savings
(€)
Annual
CO2
Reduction
(kg)
120,000 40.0 48,000 € 1.40 € 67,200 1.00% € 672 1297
120,000 40.0 48,000 € 1.40 € 67,200 3.00% € 2,016 3892
120,000 40.0 48,000 € 1.40 € 67,200 5.00% € 3,360 6487
160,000 40.0 64,000 € 1.40 € 89,600 1.00% € 896 1730
160,000 40.0 64,000 € 1.40 € 89,600 3.00% € 2,688 5190
160,000 40.0 64,000 € 1.40 € 89,600 5.00% € 4,480 8650
200,000 40.0 80,000 € 1.40 € 112,000 1.00% € 1,120 2162
200,000 40.0 80,000 € 1.40 € 112,000 3.00% € 3,360 6487
200,000 40.0 80,000 € 1.40 € 112,000 5.00% € 5,600 10812
Passenger Vehicle Savings Based on Fuel Economy Improvement
Annual
Distance
Driven (km)
Average Fuel
Consumption
Rate
(litre/100km))
Total Annual
Fuel
Consumption
(litre)
Unit Fuel Cost
(€/litre)
Annual Fuel
Cost (€)
Slope Fuel
Economy
Improvement
Annual
Savings
(€)
Annual
CO2
Reduction
(kg)
10,000 9.0 900 € 1.40 € 1,260 1.00% € 13 24
10,000 9.0 900 € 1.40 € 1,260 3.00% € 38 73
10,000 9.0 900 € 1.40 € 1,260 5.00% € 63 122
20,000 9.0 1,800 € 1.40 € 2,520 1.00% € 25 49
20,000 9.0 1,800 € 1.40 € 2,520 3.00% € 76 146
20,000 9.0 1,800 € 1.40 € 2,520 5.00% € 126 243
30,000 9.0 2,700 € 1.40 € 3,780 1.00% € 38 73
30,000 9.0 2,700 € 1.40 € 3,780 3.00% € 113 219
30,000 9.0 2,700 € 1.40 € 3,780 5.00% € 189 365
Annual Savings
€4,480
8650 kg CO2
Annual Savings
€126
243 kg CO2

28
Fuel Economy and Emissions Some Numbers (2002 Base):
226 million
4.7 trillion
637 billion
1.5 trillion
……………… number of vehicles on the road in the U.S. ……………… number of kilometers driven annually in the U.S. ……………… number of liters of petrol consumed annually in
the U.S. ……………… number of kilograms of CO2 emitted annually by
vehicles in the U.S.
Some Solutions (4% fuel savings with ADAS):
25 billion ……………… number of liters of petrol saved annually - enough for 7.3 million cars!
58 billion ……………… number of kilograms of CO2 eliminated annually
29
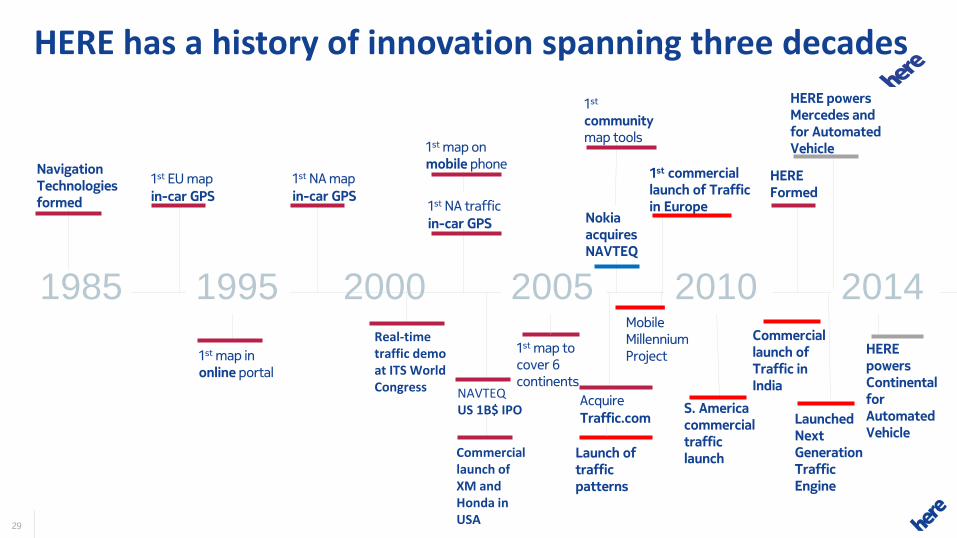
HERE has a history of innovation spanning three decades
Navigation Technologies formed
1st EU map in-car GPS
1st map in online portal
1st NA map in-car GPS
1st NA traffic in-car GPS
NAVTEQ US 1B$ IPO
1st map on mobile phone
1st map to cover 6 continents
Acquire
Traffic.com
Nokia acquires NAVTEQ
1st commercial launch of Traffic in Europe
Mobile Millennium Project
1st community map tools
1985 1995 2000 2005 2010 2014 Real-time traffic demo at ITS World Congress
Commercial launch of XM and Honda in USA
Launch of traffic patterns
Commercial launch of Traffic in India
S. America commercial traffic launch
HERE Formed
HERE powers Continental for Automated Vehicle
Launched Next Generation Traffic Engine
HERE powers Mercedes and for Automated Vehicle

HERE Traffic
© HERE 2013 30
Real-time Traffic in 33 countries
Historic Traffic in 74 countries
Global Traffic Distribution Services
Incident Management Centers
Sensor Network
Large & Diverse Customer Set

31
Learning Platform
© 2014 HERE | Travel Time Reliability | Mike Finn | Company confidential
Accidents & Events
Construction & short term trends
Weather
Observed Historical Conditions
Filters, Clustering & Regression Persistent Trends
• Regional Holidays • Months • Seasonality
Champion Challenger
Comparison Published
Regression Trees

Past HISTORIC TRAFFIC
Learning Platform
Model Historical
Data
Collect Influencers
Predict Future
EVENTS SEASONS WEATHER
Now REAL-TIME TRAFFIC Real-Time Engine
Data Inputs Processing Outputs
GPS-Probe Data
Sensor Data
Historical Data
Incident Data
PREDICTIVE TRAFFIC Future
Halo
Halo: Real-Time Data Processing Engine
33
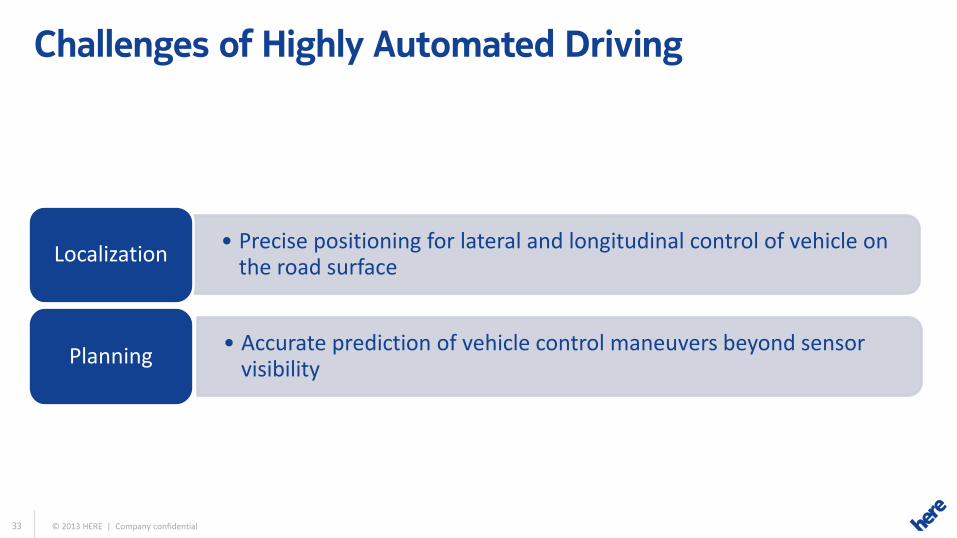
• Precise positioning for lateral and longitudinal control of vehicle on the road surface
Localization
• Accurate prediction of vehicle control maneuvers beyond sensor visibility
Planning
Challenges of Highly Automated Driving
© 2013 HERE | Company confidential

34
Mode Selection, Individual Mode Optimization, Network Optimization
© 2013 HERE | Title | Author | Company confidential
• Mode – Driving, Transit, Pedestrian
• Driving – Eco, Safety, Mobility
– Passenger
- Eco routing
- Real- time data
– Trucks
- Eco routing
- Predictive cruise control
- Real-time data