ars.els-cdn.com · web viewa total of 34 polyurethane foam passive air samplers (puf-pas) (8 pas...
TRANSCRIPT

SUPPORTING INFORMATION
Occurrence and fate of Organophosphate Ester Flame Retardants and
Plasticizers in indoor air and dust of Nepal: Implication for human exposureIshwar Chandra Yadav1, Ningombam Linthoingambi Devi2, Guancai Zhong1, Jun Li1, Gan Zhang1, Adrian Covaci3
1State key Laboratory of Organic Geochemistry, Guangzhou Institute of Geochemistry, Chinese Academy of Sciences, Guangzhou-510640, P.R. China
2Centre for Environmental Sciences, Central University of South Bihar, BIT Campus Patna-800014, Bihar, India
3Toxicological Centre, University of Antwerp, Universiteitsplein 1, 2610 Wilrijk, Belgium
*Corresponding author
Tel. no. +86-15626134294
E-mail: [email protected] (I C Yadav)
SI-1
1
2
3
4
56
78
910
11
12
13
14
15
16
17
1819
20
21
22
23
24
25
26
27
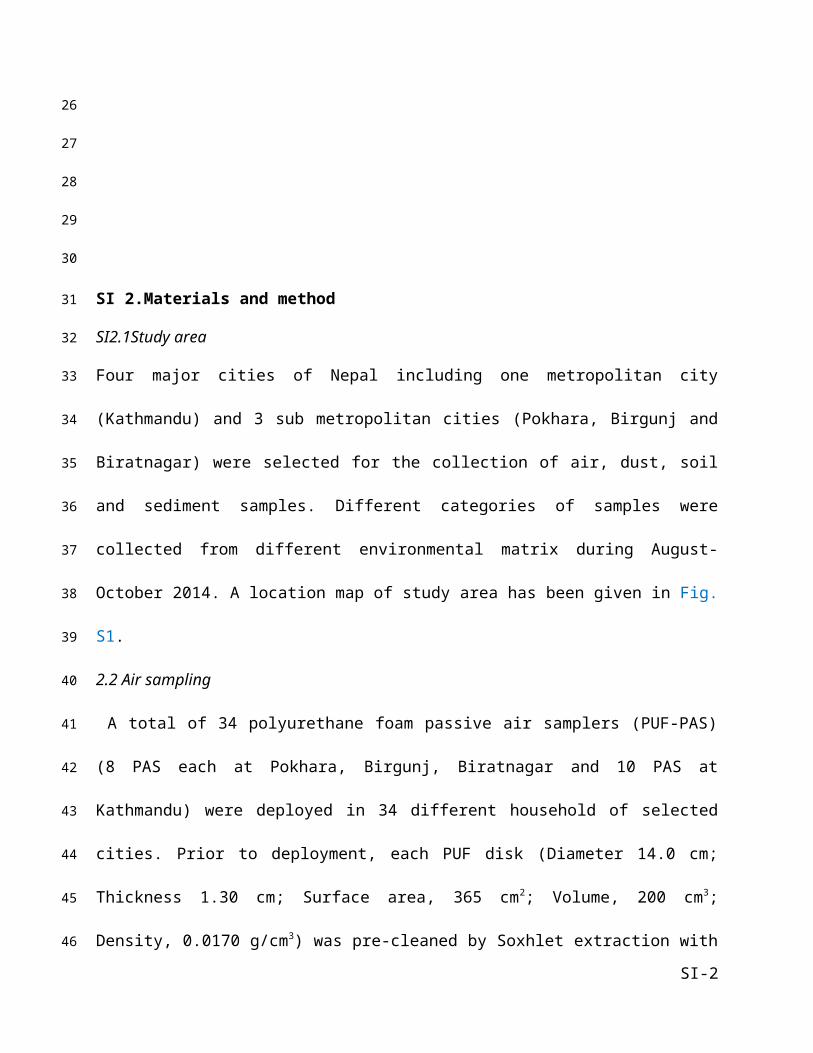
SI 2.Materials and method
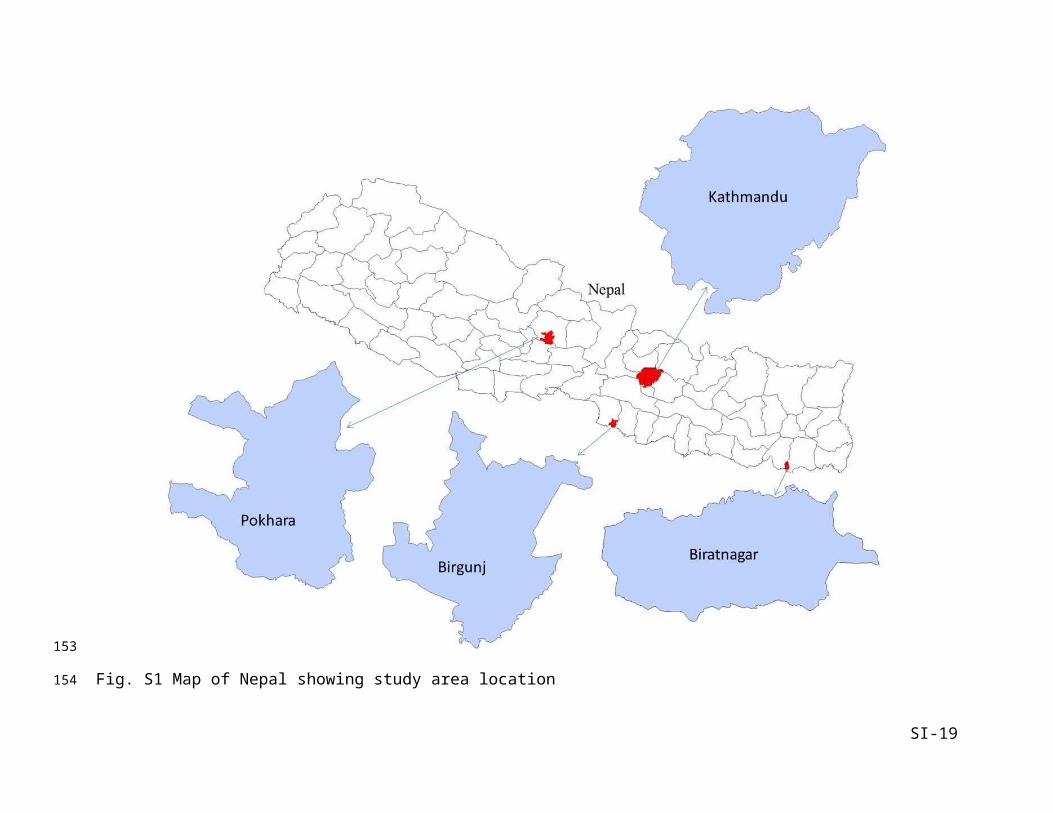
SI2.1Study area
Four major cities of Nepal including one metropolitan city (Kathmandu) and 3 sub metropolitan
cities (Pokhara, Birgunj and Biratnagar) were selected for the collection of air, dust, soil and
sediment samples. Different categories of samples were collected from different environmental
matrix during August-October 2014. A location map of study area has been given in Fig. S1.
2.2 Air sampling
A total of 34 polyurethane foam passive air samplers (PUF-PAS) (8 PAS each at Pokhara,
Birgunj, Biratnagar and 10 PAS at Kathmandu) were deployed in 34 different household of
selected cities. Prior to deployment, each PUF disk (Diameter 14.0 cm; Thickness 1.30 cm;
Surface area, 365 cm2; Volume, 200 cm3; Density, 0.0170 g/cm3) was pre-cleaned by Soxhlet
extraction with acetone and dichloromethane (DCM) each for 48 h. After the exposure, all PUF
samples were transported to the laboratory immediately and stored at −20 °C until analysis. The
details about passive air sampling procedure for collection of air samples has been described
elsewhere (Liu et al., 2016).
2.3. Dust sampling
Twenty eight dust (7 each) samples were collected from indoor environment representing
domestic, occupational and public environments. Samples were collected by sweeping of kitchen
room, study room, bed room, living room, office and passage of concerned household. About 50
g of dust samples were collected and packed in zipper bag before transporting to the laboratory.
Dust samples were sieved with mess size of 500µm and stored at −20 °C until analysis.
2.4 Sample preparation and analysis
Extraction and cleanup: PUF disks or/and freeze-dried dusts, soils and sediments samples were
spiked with 1000 ng of deuterated tris (2-chloroethyl) phosphate (TCEP-d12), and d-PAH
SI-2
28
29
30
31
32
33
34
35
36
37
38
39
40
41
42
43
44
45
46
47
48
49
50
51

(naphthalene-d8, acenaphthene-d10, phenanthrene-d10, chrysene-d12 and perylene-d12) as
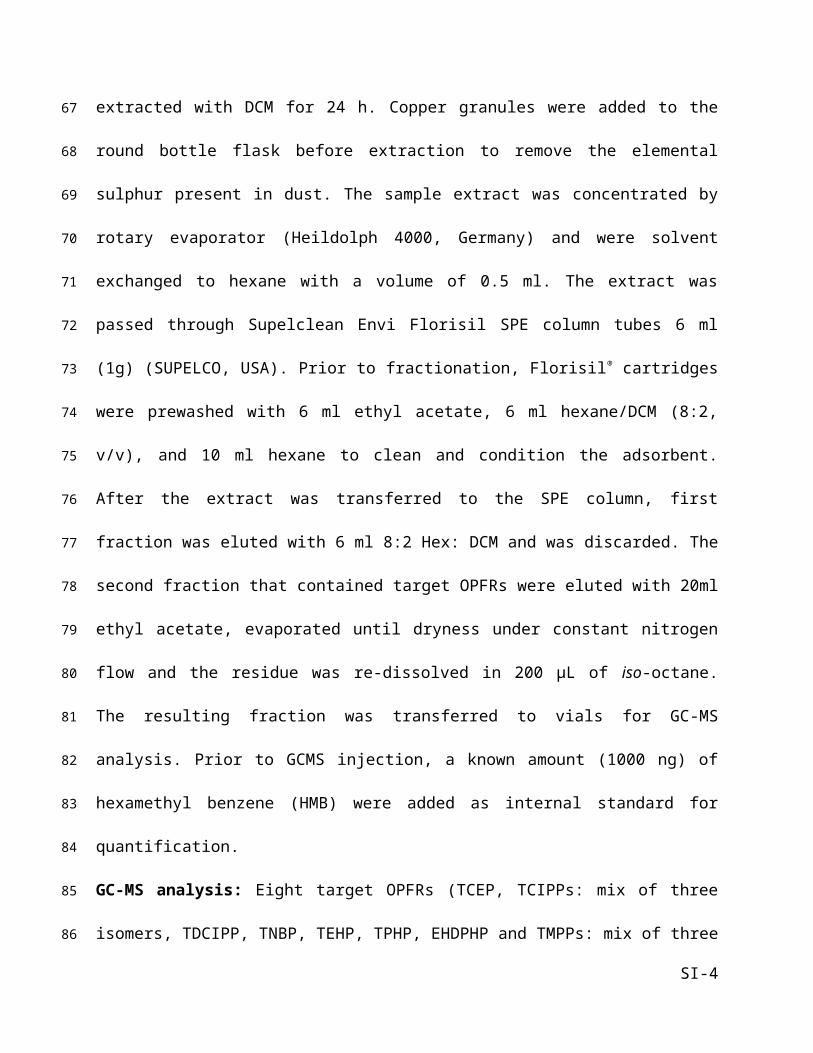
surrogate standard and were Soxhlet extracted with DCM for 24 h. Copper granules were added
to the round bottle flask before extraction to remove the elemental sulphur present in dust. The
sample extract was concentrated by rotary evaporator (Heildolph 4000, Germany) and were
solvent exchanged to hexane with a volume of 0.5 ml. The extract was passed through
Supelclean Envi Florisil SPE column tubes 6 ml (1g) (SUPELCO, USA). Prior to fractionation,
Florisil® cartridges were prewashed with 6 ml ethyl acetate, 6 ml hexane/DCM (8:2, v/v), and 10
ml hexane to clean and condition the adsorbent. After the extract was transferred to the SPE
column, first fraction was eluted with 6 ml 8:2 Hex: DCM and was discarded. The second
fraction that contained target OPFRs were eluted with 20ml ethyl acetate, evaporated until
dryness under constant nitrogen flow and the residue was re-dissolved in 200 µL of iso-octane.
The resulting fraction was transferred to vials for GC-MS analysis. Prior to GCMS injection, a
known amount (1000 ng) of hexamethyl benzene (HMB) were added as internal standard for
quantification.
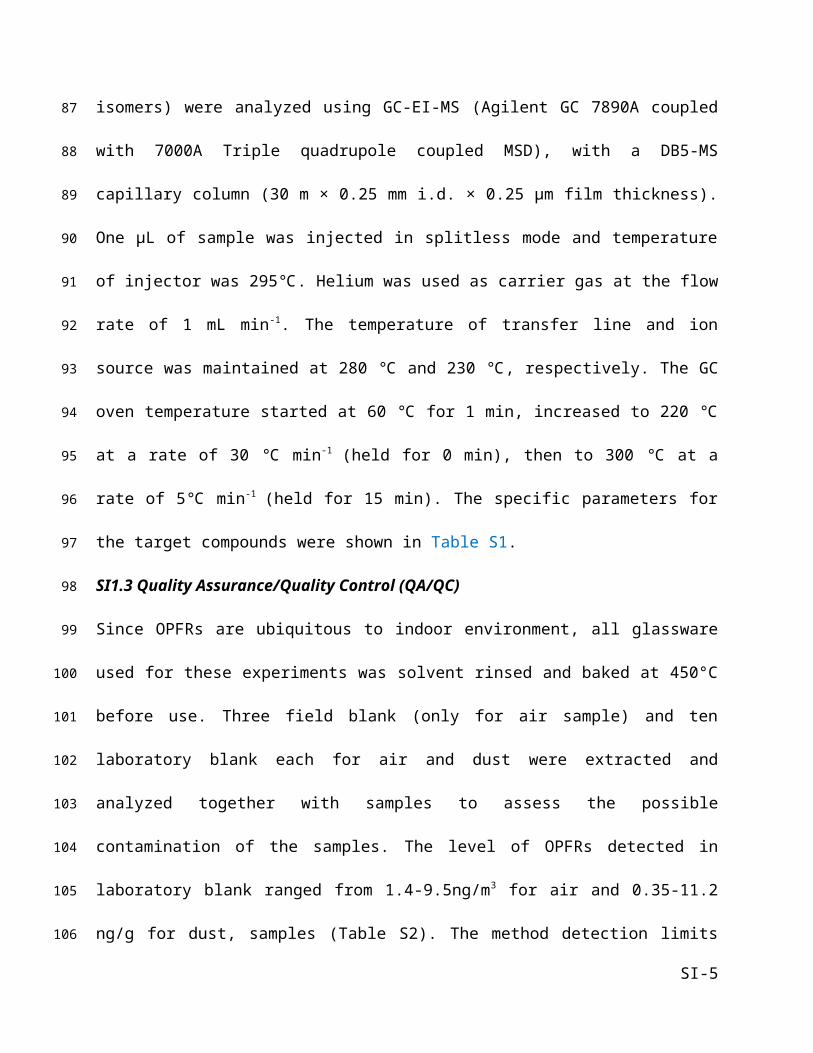
GC-MS analysis: Eight target OPFRs (TCEP, TCIPPs: mix of three isomers, TDCIPP, TNBP,
TEHP, TPHP, EHDPHP and TMPPs: mix of three isomers) were analyzed using GC-EI-MS
(Agilent GC 7890A coupled with 7000A Triple quadrupole coupled MSD), with a DB5-MS
capillary column (30 m × 0.25 mm i.d. × 0.25 μm film thickness). One µL of sample was
injected in splitless mode and temperature of injector was 295℃. Helium was used as carrier gas
at the flow rate of 1 mL min-1. The temperature of transfer line and ion source was maintained at
280 ℃ and 230 ℃, respectively. The GC oven temperature started at 60 ℃ for 1 min, increased
to 220 ℃ at a rate of 30 ℃ min-1 (held for 0 min), then to 300 ℃ at a rate of 5℃ min-1 (held for
15 min). The specific parameters for the target compounds were shown in Table S1.
SI-3
52
53
54
55
56
57
58
59
60
61
62
63
64
65
66
67
68
69
70
71
72
73
74
SI1.3 Quality Assurance/Quality Control (QA/QC)
Since OPFRs are ubiquitous to indoor environment, all glassware used for these experiments was
solvent rinsed and baked at 450°C before use. Three field blank (only for air sample) and ten
laboratory blank each for air and dust were extracted and analyzed together with samples to
assess the possible contamination of the samples. The level of OPFRs detected in laboratory
blank ranged from 1.4-9.5ng/m3 for air and 0.35-11.2 ng/g for dust, samples (Table S2). The
method detection limits (MDLs) is the mean plus 3 times standard deviation of all the blanks
samples. When the compounds were detected in blank, the MDL was calculated as 3 times signal
to noise ratio obtained from lowest spiked standard. The MDLs of OPFRs ranged from 0.88-14.4
ng/m3 and 0.38-27.93 ng/g, for air and dust samples, respectively. The average recovery of
surrogate standard (TCEP-d12) was 80-101% and 108-124% for air and dust, respectively. The
concentrations of target OPFRs in this study were blank corrected, but not corrected for
recovery. Detailed about QA/QC is given in SI.
SI 1.4 Conversion of initial concentration of OPFR sequester in PUF/PAS to air
concentration (ng/m3)
The initial atmospheric results of OPFRs were converted in air concentration (ng/m3) by dividing
the sequestered amounts with the product of deployment period and the sampling rate of PAS
using following equation.
C air = CPUF/Rt
Where, Cair is the concentration of OPFR in air over t (days) deployment period. CPUF is the
concentration of OPFR sequestered in PUF disk. R is the sampling uptake rate. We used an
SI-4
75
76
77
78
79
80
81
82
83
84
85
86
87
88
89
90
91
92
93
94
95
96
average uptake rate of 3.3 m3/d for calculating the concentration of OPFRs in air samples as
suggested by Liu et al (2016). All the PAS were simultaneously deployed for 60 days from
August-October, 2014.
SI-5
97
98
99
100
101

Table S1 Full name and GS-MS parameter of OPFRs
Acronym Full name CAS No. Chemicalformula
Mol. Wt. Quantifier/Qualifier
RT
TNBP Tri-n-butyl phosphate 126-73-8 C12H27O4P 266.3 155/99 7.063TCEP Tris(2-chloroethyl)phosphate 115-96-8 C6H12Cl3O4P 285.5 249/143 7.696TCIPP-1 Tris (1-chloro-2-propyl) phosphate
(mix of three isomers)13674-84-5 C9H18Cl3O4P 327.6 125/277 7.877
TCIPP-2 125/277 7.952TCIPP-3 125/277 8.022TDCIPP Tris (1,3-dichloropropyl) phosphate 13674-87-8 C9H15Cl6O4P 430.9 191/381 12.210TPHP Triphenyl phosphate 115-86-6 C18H15O4P 326.3 170/228 13.107EHDPHP 2-Ethylhexyl diphenyl phosphate 1241-94-7 C20H27O4P 362.4 251/170 13.329TEHP Tri (2-ethylhexyl)phosphate 78-42-2 C24H51O4P 434.6 113/211 13.592TMPP-1 Tri-cresyl phosphate
(mix of three isomers) 1330-78-5 C21H21O4P 368.4243/170 16.020
TMPP-2 243/170 16.400TMPP-3 243/170 16.790TCEP-d12 deuterated tris (2-chloroethyl)
phosphate1276500-47-0
C6H12Cl3O4P 297.5 261/148 7.635
HMB Hexamethylbenzene 87-85-4 C12H18 162.3 162/147 6.330
SI-6
102
103
104

Table S2 Level of average OPFR and RSD detected in blank samples of air, dust, soil and sediments.
OPFRs Air blank (ng/m3) Dust blank (ng/g)
Field(n=3)
RSD (%) Lab(n=10) RSD (%) Lab (n=10) RSD (%)
TNBP 8.10 4.10 2.38 1.50 3.12 1.11
TCEP 6.33 1.94 3.80 3.41 8.46 3.21
TCIPPs 8.73 2.50 4.62 1.82 11.2 4.30
TDCIPP 9.5 2.61 6.60 2.60 ND 0
TPHP 5.9 1.20 1.72 1.41 0.35 0.01
EHDPHP 5.8 0.07 2.45 1.43 2.68 1.30
TEHP 7.9 4.52 4.9 3.20 ND 0
TMPPs 1.4 0.01 0.82 0.02 16.2 3.91
SI-7
105
106
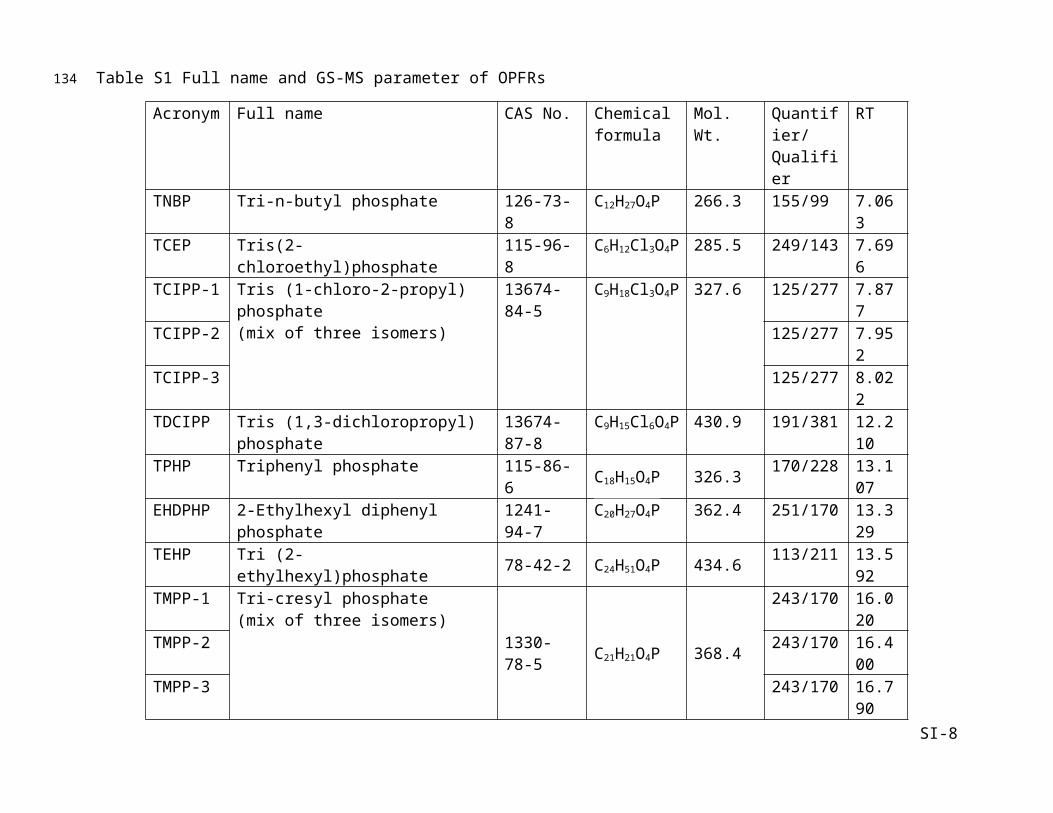
Table 3 Site-wide concentration of OPFR (ng/PAS)
OPFR (ng/PAS
TNBP TCEP
TCIPP-1 TCIPP-2 TCIPP-3 ∑TCIPPs
TDCIPP
TPHP EHDPHP
TEHP TMPP-1
TMPP-2
TMPP-3
∑TMPP
KTM-1 40.11 93.93 18.18 23.31 180.5 222.1 14.38 38.50 1761 257.9 514.2 20.30 11.17 545.6KTM-2 96.38 174.2 32.28 402.9 5805 6240 15.30 59.85 857.4 25.21 214.6 52.42 9.71 276.7KTM-3 12.17 23.58 16.69 0.48 3.46 20.62 11.99 21.69 3.77 17.51 86.51 32.70 15.70 134.9KTM-4 685.2 1019 16.40 10.18 93.01 119.6 15.10 59.05 50.72 26.03 181.5 28.13 15.64 225.3KTM-5 35.77 57.01 23.00 1.880 44.43 69.31 11.93 29.51 40.37 3.97 138.8 18.86 12.86 170.5KTM-6 39.55 49.25 16.80 2.120 101.6 120.5 16.15 37.52 79.31 346.3 514.2 33.63 22.05 569.9KTM-7 28.82 43.18 16.82 10.96 86.00 113.7 12.60 42.41 61.53 126.3 670.8 23.67 10.56 705.1KTM-8 21.38 57.67 25.01 2.440 38.26 65.70 14.18 32.06 50.16 124.6 466.4 14.86 12.41 493.7KTM-9 80.09 59.34 18.64 25.21 207.0 250.8 16.29 46.46 185.0 196.3 1000 29.46 18.08 1048KTM-10 56.69 49.75 17.33 6.550 10.01 33.88 15.16 35.02 61.91 154.2 239.5 40.17 8.05 287.7PKH-1 47.82 87.08 20.87 0.990 52.41 74.27 13.65 83.46 28.56 262.4 455.4 26.67 16.64 498.7PKH-2 29.47 113.6 22.43 3.090 32.48 58.00 16.66 24.19 153.0 436.9 545.2 43.22 56.26 644.7PKH-3 54.55 184.5 16.31 3.320 2770 2790 17.44 78.33 202.3 446.2 702.9 31.55 23.15 757.6PKH-4 26.09 136.1 16.52 7.500 66.28 90.30 13.44 111.2 91.78 311.8 440.5 12.84 12.61 466.0PKH-5 45.44 151.3 16.68 16.12 136.1 168.8 13.28 86.51 79.78 363.1 511.2 39.19 26.14 576.5PKH-6 30.20 85.49 16.81 11.90 68.95 97.66 11.87 76.65 128.9 85.28 625.6 28.09 33.18 686.9PKH-7 45.94 54.53 16.88 21.70 150.8 189.3 13.24 217.5 398.1 418.2 521.2 38.49 62.57 622.2PKH-8 610.8 57.78 17.26 106.9 988.2 1112 13.35 63.77 184.2 141.0 394.0 41.71 11.58 447.3BRG-1 24.05 81.18 75.66 10.35 16.78 102.8 15.91 29.08 41.36 177.0 756.7 19.52 46.30 822.6BRG-2 41.70 92.34 16.53 7.550 63.03 87.12 11.19 30.87 26.08 9.66 352.1 22.11 15.92 390.1BRG-3 19.35 82.53 21.10 20.01 255.4 296.5 12.34 45.58 80.60 880.3 1149.3 566.6 24.14 1740BRG-4 35.87 61.63 16.78 15.90 143.8 176.4 11.95 45.39 83.23 241.7 342.5 27.05 22.93 392.4BRG-5 33.91 79.32 22.37 0.560 61.82 84.75 12.02 39.88 22.41 106.9 200.2 21.74 21.45 243.4BRG-6 28.54 49.94 22.12 1.710 14.28 38.11 11.33 33.82 28.81 11.45 329.9 30.41 19.59 379.9BRG-7 18.79 38.29 25.62 3.580 3.38 32.58 13.95 30.39 27.96 192.8 307.4 16.14 15.68 339.2BRG-8 8.120 9.10 18.01 1.910 0.00 19.91 2.870 48.93 2.78 7.92 0.58 0.210 0.02 0.810BRT-1 104.6 56.24 17.15 8.060 66.69 91.90 12.13 116.3 111.7 227.5 814.6 19.11 41.69 875.4BRT-2 53.50 118.1 17.11 19.26 157.8 194.2 11.87 228.3 267.8 383.2 603.5 30.47 36.71 670.7BRT-3 62.87 68.96 17.10 20.44 187.9 225.4 12.59 100.5 155.7 4.85 762.9 19.76 39.69 822.4BRT-4 42.66 44.35 17.05 39.43 323.3 379.7 12.54 124.4 111.0 81.21 606.1 21.58 37.11 664.8BRT-5 116.7 61.83 17.56 11.69 100.3 129.5 11.40 28.17 37.54 61.55 274.4 19.07 14.40 307.9BRT-6 82.30 113.1 17.36 29.65 275.8 322.8 16.33 65.94 174.3 158.9 1030 22.06 34.02 1086BRT-7 43.58 67.99 17.81 13.86 146.7 178.3 12.37 45.58 60.16 12.12 346.1 19.77 18.36 384.1BRT-8 22.84 31.35 17.51 4.820 129.8 152.1 11.72 30.69 87.02 304.1 379.2 31.96 80.57 491.7
SI-8
107

Table S4 Comparison of average concentration of OPFRs (ng/m3) in indoor air with relevant studies available across the world
Country N Location types TCEP TCIPPs TDCIPP TNBP TPHP EHDPHP TEHP TMPPs
∑OPFRs References
USA 16 apartment 2-8.3 3.4-172 nd 4.6-21 - - - - - Bergh et al., 2010
Sweden 10 House nd-28 2.4-64 nd-17 3.5-45 nd-0.8 - - - 25-149 Bergh et al., 2011
Japan 41 House 12.6-297 15.5-2,660
11.5-61.4 7.1-121 15.6-32.1 - - - - Kanazawa et al., 2010
Switzerland 4 office 6.1-56 nd-130 - nd-8.1 0.93-3.1 - nd-0.6 nd-0.37 7.37-169 Hartmann et al., 2004
Norway 2 office 2.7-23 10-21 0.4-7.1 8.2-16 2300-36,000
0.2-0.42 - - 2,410-36,000
Green et al., 2008
Finland 4 office 3-200 9-40 nd-40 nd-5 - - nd-2 nd-4 50-150 Makinen et al 2009
China 90 House 1.03-13.4 0.83-81 0.04-14.3 0.01-90.3 0.25-10.2 0.06-0.75 0.29-2.58 0.03-0.2 5-148 Yang et al., 2014Germany 7 House 0.20-0.56 4.15-33.9 0.10-0.42 0.62-5.85 nd-0.16 - nd-0.06 - 12.5-59.3 Zhou et al., 2016Japan 30 House 6.7 10 3.6 10 nd - 3.1 - 52.5 Takeuchi et al.
2014China 55 Urban
center0.23-10.5 0.03-16.9 0.03-16.9 0.06-6.1 0.22-32 - - 0.03-
6.281.83-53.7 Ren et al., 2016
Nepal 34 House 0.05-5.15 0.08-31.7 0.01-0.09 0.04-3.46 0.11-1.15 0.01-8.9 0.02-4.45 nd-9.07 0.32-63.9 This study-: data not available; nd: not detected
SI-9
108
109
110

Table S5 Comparison of average concentration of OPFRs (ng/g) in house dust with relevant studies available across the world
Country N TCEP TCIPPs TDCIPP TNBP TPHP EHDPHP TEHP TMPPs ∑OPFRs ReferencesSweden 10
nd-33,000700-11,000
2,200-27,000 nd-1,700 - - nd-2,200 100-4200 7,000-79,000
Bergh et al 2011
Germany 6140-280 370-960 80-110 30-250 180-1,300 - - 40-240 800-6,000
Brommer et al 2012
Spain 5250-9,800
350-10,300 nd-1,100 70-650 290-9,500 - - - 3,910-34,800
Garcia et al 2007
Belgium 3380-2,650
190-73,700 80-6,640 30-2,700 40-29,800 - - 40-5,070 1920-94,700
Van den Eede et al 2011
New Zealand* 34 110 350 230 80 600 - - 120 5,510 Ali et al 2012USA 16 610-
160,000340-120,000 730-24,000 80-1800 - 180-3000
200-3,700
330-4,400 -
Dodson et al 2012
Japan 148 1,300-338,000
1,120-430,000
1,180-864,000
730-133,000
1,600-245,000 -
1,340-51,000
4,000-59,800 33,900-5,980,000
Araki et al 2014
Philippines 17 20-1,200 - - 6-80 8-2,100 8-770 4-970 3-250 20-4,300 Kim et al 2013Egypt 20
8-130 10-120 9-560 10-30 8-300 20-100 - - 40-960Abdallah and Covaci,2014
Romania 47 20-1,160 20-16,400 20-460 20-380 20-22,600 - - 50-5500 nd-29,000 Dirtu et al 2012Pakistan 15
10-180 20-90 5-260nd-116,000 20-150 2-360 5-50 - 70-900
Ali et al 2013
Nepal 25 0.1-69.1 24-805 1-1,420 15-116 9.81-3670 26-531 26-750 51-4740 153-12,100 This study* Median value; -: data not available; nd: not detected
SI-10
111
112

Table S6 Spearman’s rank correlation between air-dust
Rho
(n=28)
p
TNBP 0.02 P<0.05
TCEP -0.06 P<0.05
TCIPPs 0-.172 P<0.05
TDCIPP 0.290 P<0.05
TPHP -0.142 P<0.05
EHDPHP 0.148 P<0.05
TEHP 0.517 P<0.05
TMPPs -0.095 P<0.05
SI-11
113
114
115

Table S7 Physicochemical characteristics of OPFRs analyzed in this study
OPFRs Mol. Wt.
Boiling point (°C)
Melting point
(°C)
Vapor pressure at 25°C (Pa)
Water solubility (mg/l) at 25°C
Octanol-air partition coefficient (Log Koa)
Octanol-water partitioning coefficient (Log Kow)
Soil sediment-water sorption(Log Koc)
Henry’s law constant at 25°C(pa/m3/mol)
References
TNBP 266.3 289 -79 0.150 27 8.2 3.82 3.28 0.323 European Commission, 2008a, 2008b, 2009, U.S. EPA. 2003
TCEP 285.5 347 -35 1.14×10⁻³ 7400 5.3 1.44 2.48 2.58×10⁻³
TCIPPs 327.6 359 72.2 1.4×10⁻³ 1200 7.5 2.68 3.11 6.04×10⁻³
TDCIPP 430.9 457 88.2 5.6×10⁻⁶ 29 10.6 3.69 3.96 2.65×10⁻⁴
TPHP 326.3 412 86.5 6.3×10⁻⁵ 3 9.8 4.59 3.72 4.03×10⁻³
EHDPHP 362.4 421 86.6 6.67×10⁻³ 1.9 8.3 5.73 4.50 2.51×10⁻²
TEHP 434.6 406 86.9 1.10×10⁻⁵ 0.6 14.9 9.49 6.39 9.69TMPPs 368.4 265 -33 6.6×10⁻⁵ 0.36 12 5.11 - 0.068 Brooke et
al., 2009
SI-12
116
117
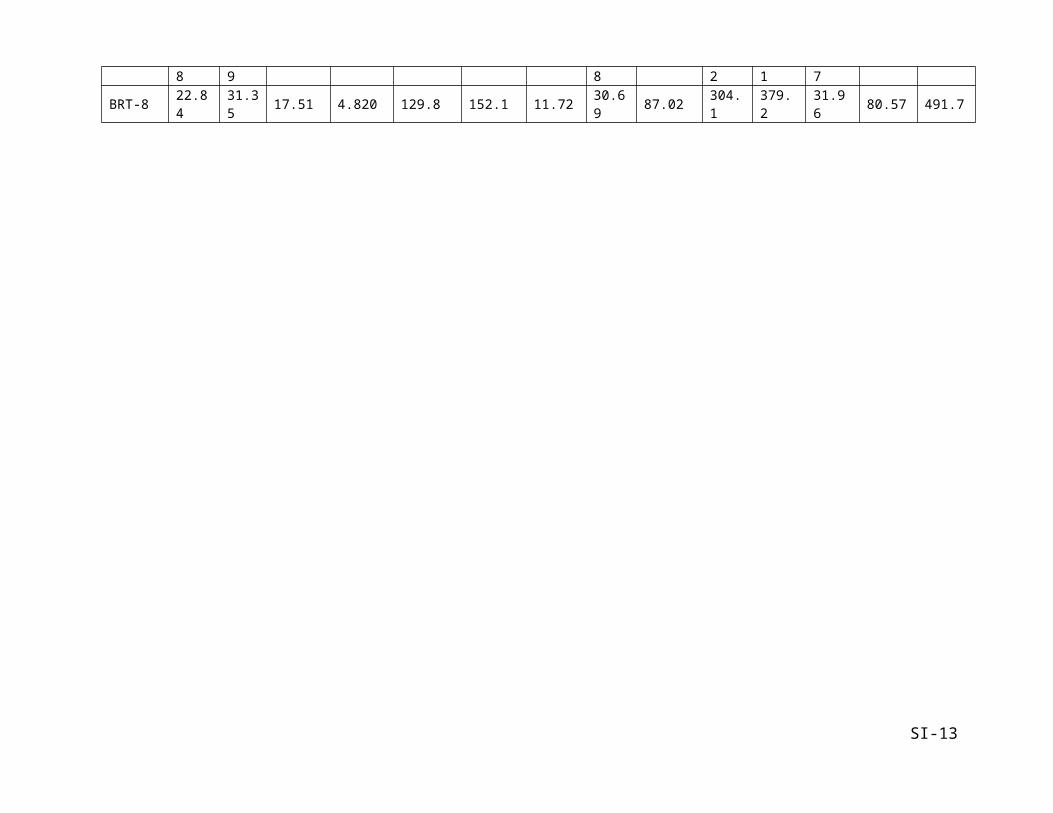
Fig. S1 Map of Nepal showing study area location
SI-13
118
119
120

Fig. S2 Site-specific composition profiles of OPFRs in air and dust (top to bottom)
SI-14
121
122
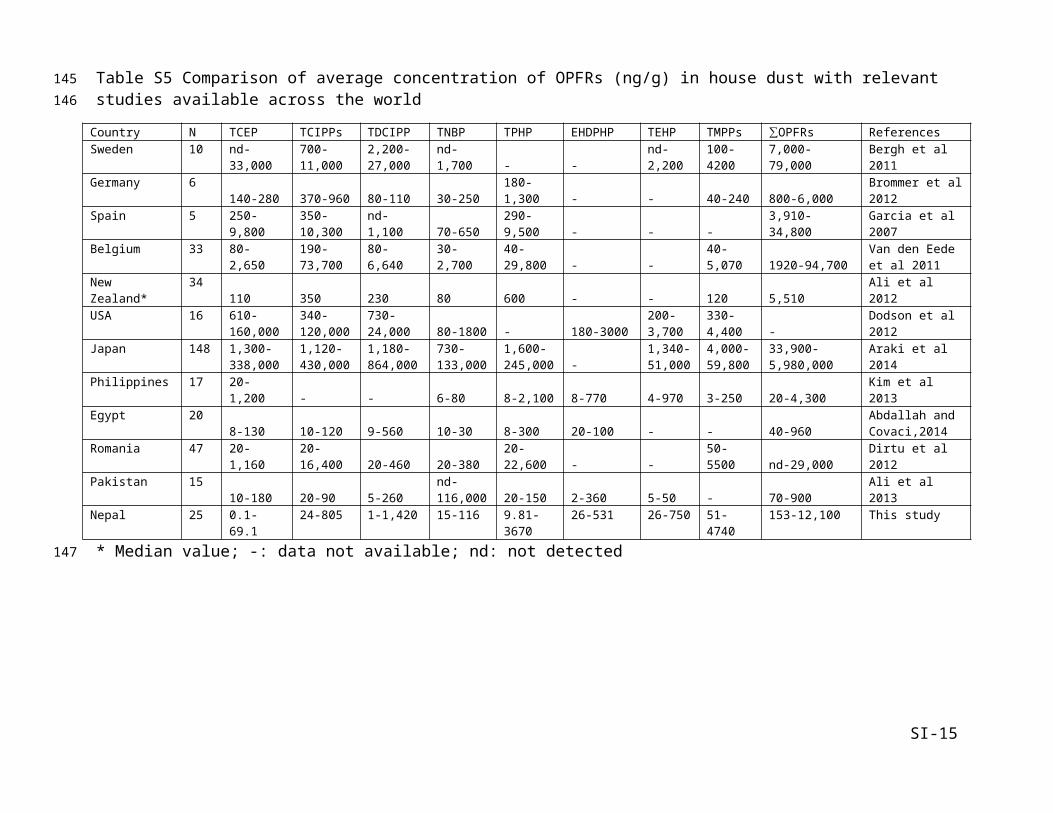
Fig. S3 Relative contribution of OPFRs in different environmental matrix from Nepal
SI-15
123
124
125
126
127

Fig
S4
Abundance profile of OPFRs in indoor air based on average value within the same cities
SI-16
Biratnagar
Pokhara
Birgunj
Kathmandu
Relative abundance(%)
Biratnagar
Pokhara
Birgunj
Kathmandu
Relative abundance%)
128
129
130
131
132
133
134
135

Fig.S5 Abundance profile of OPFRs in house dust based on average value within the same cities
SI-17
Relative abundance(%)
136
137
138

ReferencesAbdallah, M.A., Covaci, A., 2014. Organophosphate flame retardants in indoor dust from Egypt:
Implications for human exposure. Environ. Sci. Technol. 48: 4782-4789.Ali, N., Ali, L., Mehdi, T., Dirtu, A.C., Al-Shammari, F., Neels, H., Covaci, A., 2013.Levels and
profiles of organochlorines and flame retardants in car and house dust from Kuwait and Pakistan: implication for human exposure via dust ingestion. Environ. Int. 55, 62-70.
Ali, N., Ali, L., Mehdi, T., Dirtu, A.C., Al-Shammari, F., Neels, H., Covaci, A., 2013.Levels and profiles of organochlorines and flame retardants in car and house dust from Kuwait and Pakistan: implication for human exposure via dust ingestion. Environ. Int. 55, 62-70.
Ali, N., Dirtu, A.C., Van den Eede, N., Goosey, E.,Harrad, S., Neels, H., Mannetje, A.t., Coakley, J., Douwes, J., Covaci, A., 2012.Occurrence of alternative flame retardants in indoor dust from New Zealand Indoor sources and human exposure assessment. Chemosphere 88, 1276-1282.
Araki, A., Saito, I., Kanazawa, A., Morimoto, K., Nakayama, K., Shibata, E., Tanaka, M., Takigawa, T., Yoshimura, T., Chikara, H., Saijo, Y., Kishi, R., 2014.Phosphorus flame retardants in indoor dust and their relation to asthma and allergies of inhabitants. Indoor Air 24, 3-15.
Araki, A., Saito, I., Kanazawa, A., Morimoto, K., Nakayama, K., Shibata, E., Tanaka, M., Takigawa, T., Yoshimura, T., Chikara, H., Saijo, Y., Kishi, R., 2014.Phosphorus flame retardants in indoor dust and their relation to asthma and allergies of inhabitants. Indoor Air 24, 3-15.
Bergh, C., Torgrip, R., Emenius, G., Ostman, C., 2011. Organophosphate and phthalate esters in air and settled dust: a multi-location indoor study. Indoor Air 21, 67-76.
Bergh, C., Torgrip, R., Östman, C., 2010. Simultaneous selective detection of organophosphate and phthalate esters using gas chromatography with positive ion chemical ionization tandem mass spectrometry and its application to indoor air and dust. Rapid Commun. Mass Spectrom. 24, 28592867.
Brommer, S., Harrad, S., Van den Eede, N., Covaci, A., 2012.Concentrations of organophosphate esters and brominated flame retardants in German indoor dust samples. J. Environ. Monit. 14, 2482-2487.
Brommer, S., Harrad, S., Van den Eede, N., Covaci, A., 2012.Concentrations of organophosphate esters and brominated flame retardants in German indoor dust samples. J. Environ. Monit. 14, 2482-2487.
Dirtu, A.C., Ali, N., Van den Eede, N., Neels, H., Covaci, A., 2012.Country specific comparison for profile of chlorinated, brominated and phosphate organic contaminants in indoor dust. Case study for Eastern Romania, 2010. Environ. Int. 49, 1-8.
Dodson, R.E., Perovich, L.J., Covaci, A., Ionas, A.C., Dirtu, A.C., Brody, J.G., Rudel, R.A., 2012. After the PBDE phase-out: A broad suite of flame retardants in repeat house dust Samples from California. Environ. Sci. Technol. 46, 13056-13066.
García, M., Rodríguez, I., Cela, R., 2007.Microwave-assisted extraction of organophosphate flame retardants and plasticizers from indoor dust samples. J. Chromatogr. A 1152, 280-286.
García-López, M., Rodríguez, I., Cela, R., Kroening, K.K., Caruso, J.A., 2009b.Determination of organophosphate flame retardants and plasticizers in sediment samples using microwave-
SI-18
139
140141
142143144
145146147
148149150151
152153154155
156157158159
160161
162163164165
166167168
169170171
172173174
175176177
178179
180181
assisted extraction and gas chromatography with inductively coupled plasma mass spectrometry. Talanta 79, 824-829.
Hartmann, P.C., Bürgi, D., Giger, W., 2004.Organophosphate flame retardants and plasticizers in indoor air. Chemosphere 57, 781-787.
Kanazawa, A., Saito, I., Araki, A., Takeda, M., Ma, M., Saijo, Y., Kishim, R., 2010.Association between indoor exposure to semi-volatile organic compounds and building-related symptoms among the occupants of residential dwellings. Indoor Air 20, 72-84.
Kim, J.-W., Isobe, T., Sudaryanto, A., Malarvannan, G., Chang, K.-H., Muto, M., Prudente, M., Tanabe, S., 2013.Organophosphorus flame retardants in house dust from the Philippines: occurrence and assessment of human exposure. Environ. Sci. Pollut. Res. 20, 812-822.
Makinen, M.S.E., Makinen, M.R.A., Koistinen, J.T.B., Pasanen, A.L., Pasanen, P.O., Kalliokoski, P.I., Korpi, A.M., 2009. Respiratory and dermal exposure to organophosphorus flame retardants and tetrabromobisphenol A at five work environments. Environ. Sci. Technol. 43, 941-947.
Van de Eede, N., Dirtu, A., Neels, H., Covaci, A., 2011. Analytical developments and preliminary assessment of human exposure to organophosphate flame retardants from indoor dust. Environ. Int. 37, 454-461.
Yang, F.X., Ding, J.J.,Huang, W., Xie, W., Liu, W.P., 2014. Particle size-specific distributions and preliminary exposure assessments of organophosphate flame retardants in office air particulate matter. Environ. Sci. Technol. 48, 63-70.
SI-19
182183
184185
186187188
189190191
192193194195
196197198
199200201