ars.els-cdn.com · web viewof pomegranate beverage on dss-induced colonic inflammation,...
TRANSCRIPT

Figure Legends
Fig. 1. Experimental design and activities of pomegranate beverage on DSS-induced colonic
inflammation, ulceration and colonocyte proliferation in rats. (A) Experimental design of the in vivo
rat study. (B) The inflammation and ulceration scores were decreased by the pomegranate beverage intake
compared to the control in DSS-treated rats (p=0.05 and 0.045, respectively). Colonic inflammation and
ulceration were assessed by a veterinary pathologist (C.P.) in a blinded manner. Scores were assessed on
a scale of 0-3. (C) Representative images of H&E-stained colon sections in the control and pomegranate
groups. (D) Pomegranate beverage significantly suppressed colonocyte proliferation in the central and
basal regions compared to control in DSS-treated rats. The measurement of Ki-67 was used to determine
cell proliferation. (E) Ki-67 immunohistochemistry in rat colon mucosa in control and pomegranate
groups. Values are mean ± SEM (n=10 per group). *p < 0.05.
Fig. 2. Effects of pomegranate beverage on pro-inflammatory cytokines, NF-b, COX-2 and iNOS
in DSS-treated rats. (A) Expression of pro-inflammatory cytokines, COX-2 and iNOS mRNA in DSS-
treated rats with pomegranate beverage compared to control. (B) Expression of pro-inflammatory
cytokines and levels of total NF-B in the intestinal mucosa. (C) Expression of iNOS and COX-2 protein.
Values are mean ± SEM (n=10 per group). *p<0.05.
Fig. 3. Effects of pomegranate beverage on the p70S6K1/HIF1 signaling in DSS-treated rats. (A)
Expression of mRNA, (B) total and phosphorylated protein involved in the p70S6K1/HIF1signaling in
DSS-treated rats with pomegranate beverage compared to control. (C) Expression of HIF1 protein in
DSS-treated rats. (D) miRNA/mRNA pairing regions between miR-145 and the target p70S6K1. (E)
Expression of miR-145 in colonic mucosa in DSS-treated rats with pomegranate beverage compared to
control beverage. Values are mean ± SEM (n=10 per group). *p<0.05.
1

Fig. 4. Effects of pomegranate extract and their metabolites on the p70S6K1/HIF1 signaling
pathway in LPS-treated CCD-18 cells. (A) Cell viability in HT-29 cells treated with pomegranate
extract and their metabolites, ellagic acid and urolithin A. (B) Expression of p70S6K1, and (C) HIF1
mRNA in LPS-treated CCD-18 cells treated with pomegranate extract and their metabolites, ellagic acid
and urolithin A. (D) Expression of p70S6K1 and HIF1 protein treated with pomegranate extract. (E)
Expression of miR-145 in LPS-treated CCD-18 cells after treatment with pomegranate extract. All
experiments were performed at least three times, and the results were expressed as mean ± SEM (n=3).
Different letters indicate significance at p<0.05. *p<0.05.
Fig. 5. Effects of pomegranate extract on miR-145 and p70S6K1 mRNA levels in LPS-treated CCD-
18 cells. (A) miR-145 and its antagomiR pairing region. (B) Effects of pomegranate extract on expression
of miR-145 in CCD-18 cells treated with miR-145 antigomiR and LPS. Expression of (C) p70S6K1
mRNA and (D) protein in CCD-18 cells treated with miR-145 antigomiR and LPS. miR-145 was
analyzed as a ratio to the miR-NU6B endogenous control, and p70S6K1 was assayed as ratio to GAPDH.
All experiments were performed at least three times, and the results were expressed as mean ± SEM
(n=3). Different letters indicate significance at p<0.05. *p < 0.05. (E) Schematic representation showing
molecular mechanisms involved in ulcerative colitis treated with pomegranate polyphenolics.
2

Fig. 1
3

Fig. 2
4

Fig. 3
5
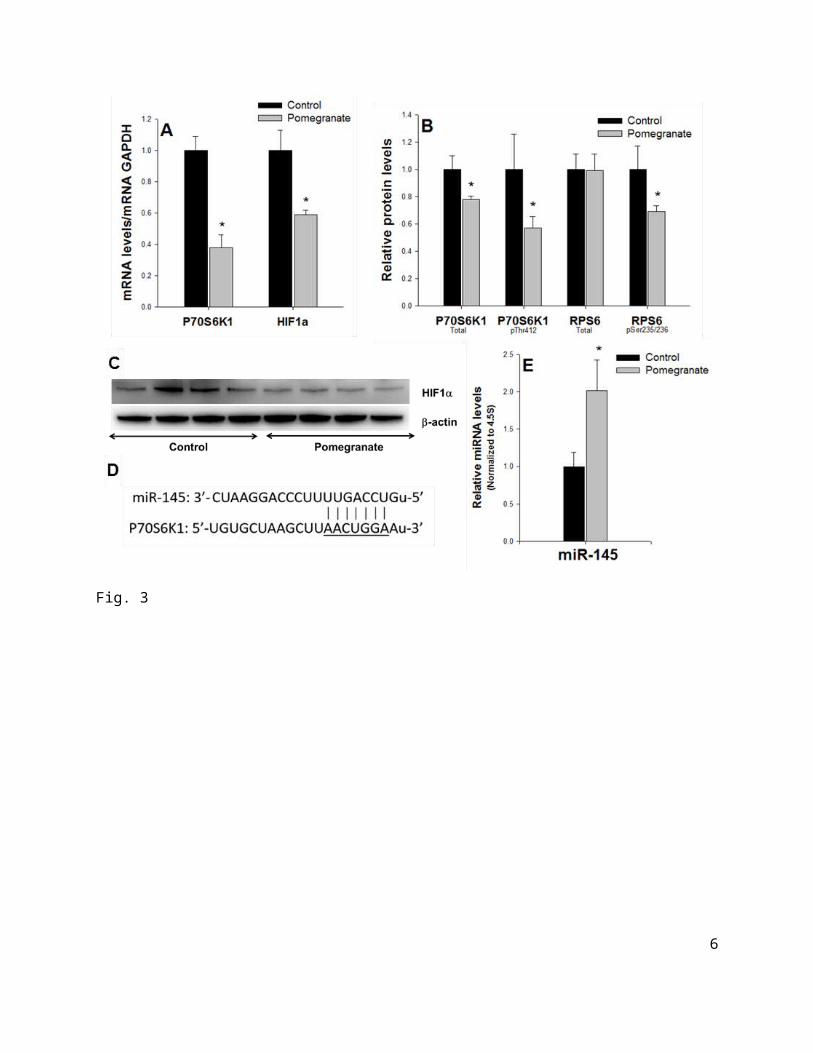
Fig. 4
6
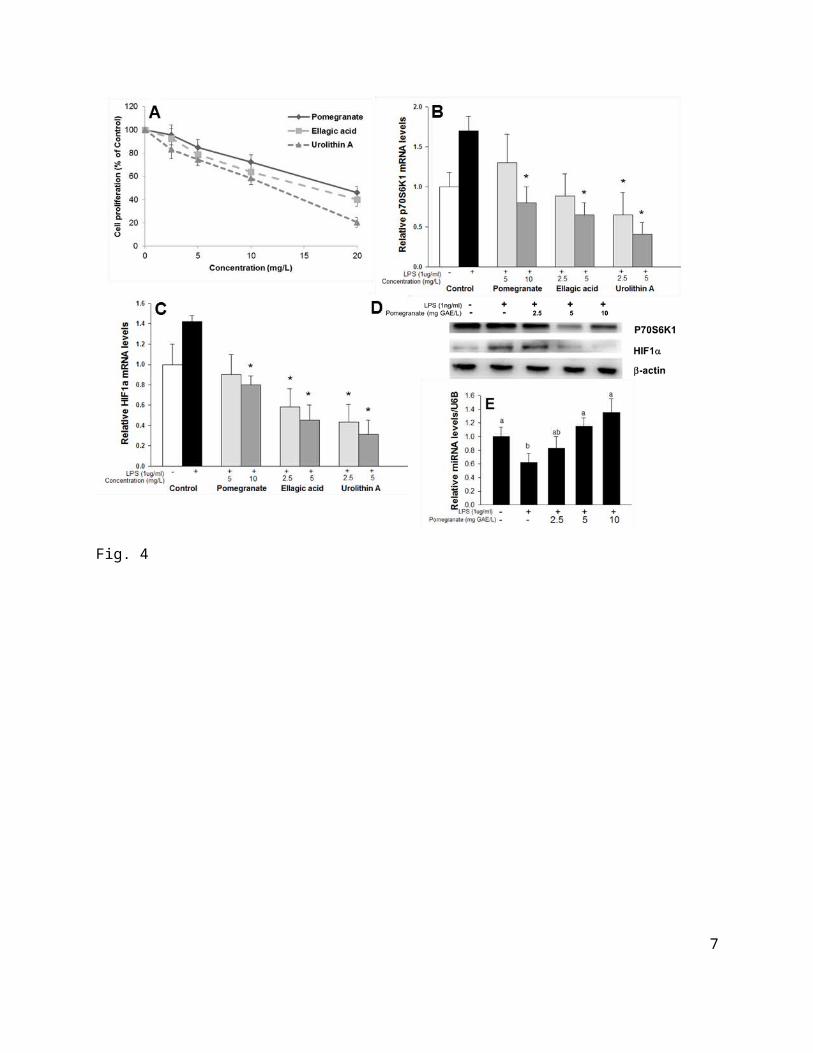
Fig. 5
7

Table 1Total polyphenol content in pomegranate beverage and extract as determined by HPLC-PDA.
ID Compound Beverage ExtractAveragea StError Averagea StError
1 punicalagin I 119.62 1.152 546.29 16.0422 peduncalagin 119.80 8.583 166.06 15.6213 granatin B 57.60 3.513 189.68 33.1084 punicalagin II 269.47 4.956 1,116.15 42.5115 galloyl-HHDP-hexose 130.44 34.757 322.43 43.5386 quercetin-glucosideb 22.77 2.909 27.72 11.757 ellagic acid 95.11 7.811 56.41 2.177
aAll of compounds except quercetin-glucoside are expressed as mg ellagic acid equivalents/L. bQuercetin-glucoside is expressed as mg quercetin equivalents/L.The concentrations of total phenolics of pomegranate beverage and extract were 2504.74 and 2500 mg gallic acid equivalents/L, respectively.
8

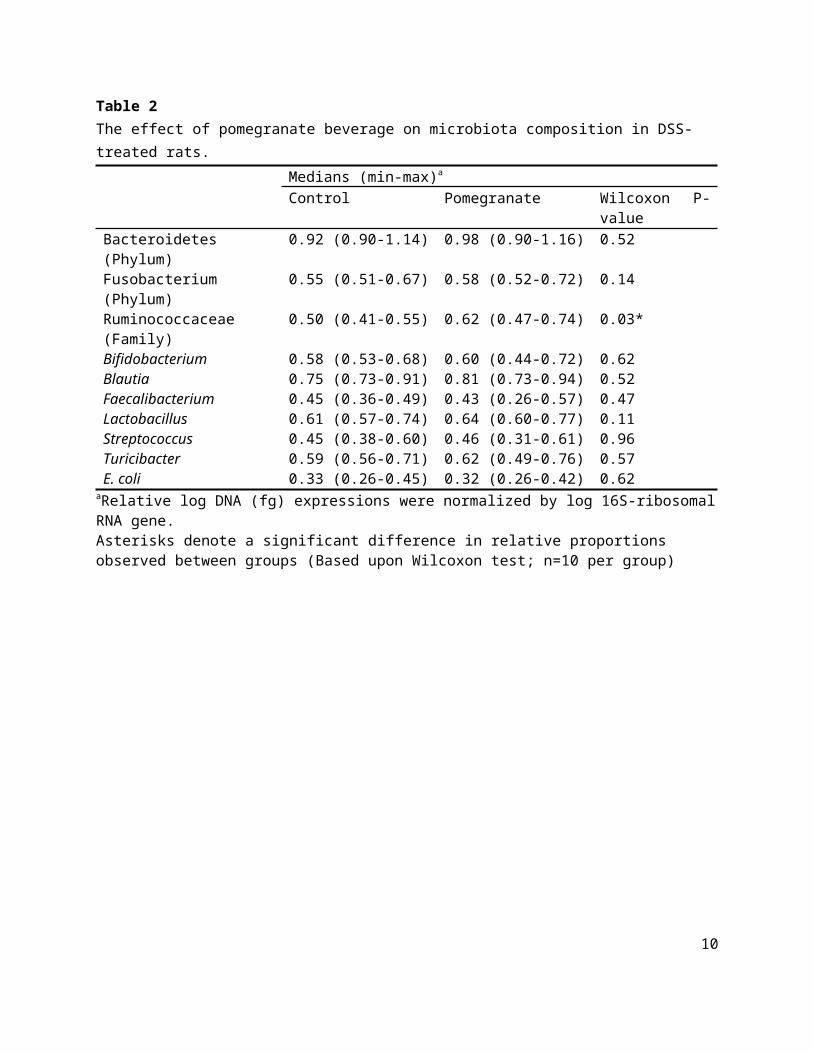
Table 2The effect of pomegranate beverage on microbiota composition in DSS-treated rats.
Medians (min-max)a
Control Pomegranate Wilcoxon P-valueBacteroidetes (Phylum) 0.92 (0.90-1.14) 0.98 (0.90-1.16) 0.52Fusobacterium (Phylum) 0.55 (0.51-0.67) 0.58 (0.52-0.72) 0.14Ruminococcaceae (Family) 0.50 (0.41-0.55) 0.62 (0.47-0.74) 0.03*Bifidobacterium 0.58 (0.53-0.68) 0.60 (0.44-0.72) 0.62Blautia 0.75 (0.73-0.91) 0.81 (0.73-0.94) 0.52Faecalibacterium 0.45 (0.36-0.49) 0.43 (0.26-0.57) 0.47Lactobacillus 0.61 (0.57-0.74) 0.64 (0.60-0.77) 0.11Streptococcus 0.45 (0.38-0.60) 0.46 (0.31-0.61) 0.96Turicibacter 0.59 (0.56-0.71) 0.62 (0.49-0.76) 0.57E. coli 0.33 (0.26-0.45) 0.32 (0.26-0.42) 0.62
aRelative log DNA (fg) expressions were normalized by log 16S-ribosomal RNA gene.Asterisks denote a significant difference in relative proportions observed between groups (Based upon Wilcoxon test; n=10 per group)
9
Supplement Fig. 1. Representative HPLC-PDA chromatographic profile at 280 nm of phenolic compounds in pomegranate (A) beverage and (B) extract. Tentative peak assignments: 1 punicalagin I; 2 peduncalagin; 3 granatin B; 4 punicalagin II; 5 galloyl-HHDP-hexose; 6 quercetin-glucoside; 7 ellagic acid.
10
A B
Time (min)Time (min)
AU AU