ars.els-cdn.com · web viewuncertainty) used in the hybrid mm-cmb model. wood smoke. primary...
TRANSCRIPT
Supplementary Information
Fine and Ultrafine Particulate Organic Carbon in the Los Angeles Basin: Trends in Sources and Composition
Farimah Shirmohammadi1, Sina Hasheminassab1, Arian Saffari1, James J. Schauer2, Ralph J. Delfino3, Constantinos Sioutas1*
1 University of Southern California, Department of Civil and Environmental Engineering, Los Angeles, CA, USA2 University of Wisconsin-Madison, Environmental Chemistry and Technology Program, Madison, WI, USA
3University of California, Irvine, Department of Epidemiology, School of Medicine, Irvine, CA, USA*Corresponding author: [email protected]
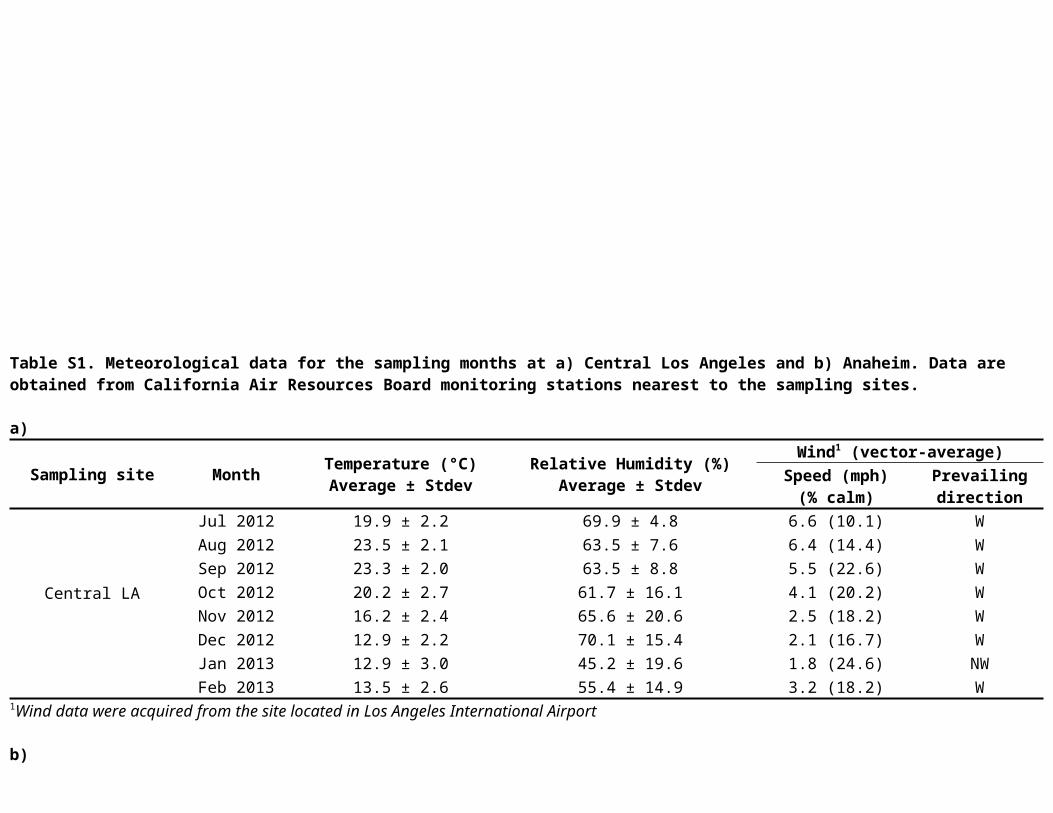
Table S1. Meteorological data for the sampling months at a) Central Los Angeles and b) Anaheim. Data are obtained from California Air Resources Board monitoring stations nearest to the sampling sites.
a)
Sampling site Month Temperature (°C)Average ± Stdev
Relative Humidity (%)Average ± Stdev
Wind1 (vector-average)Speed (mph)
(% calm)Prevailingdirection
Central LA
Jul 2012 19.9 ± 2.2 69.9 ± 4.8 6.6 (10.1) WAug 2012 23.5 ± 2.1 63.5 ± 7.6 6.4 (14.4) WSep 2012 23.3 ± 2.0 63.5 ± 8.8 5.5 (22.6) WOct 2012 20.2 ± 2.7 61.7 ± 16.1 4.1 (20.2) WNov 2012 16.2 ± 2.4 65.6 ± 20.6 2.5 (18.2) WDec 2012 12.9 ± 2.2 70.1 ± 15.4 2.1 (16.7) WJan 2013 12.9 ± 3.0 45.2 ± 19.6 1.8 (24.6) NWFeb 2013 13.5 ± 2.6 55.4 ± 14.9 3.2 (18.2) W
1Wind data were acquired from the site located in Los Angeles International Airport
b)
Sampling site Month Temperature (°C)Average ± Stdev
Relative Humidity (%)Average ± Stdev
Wind (vector-average)Speed(mph)
(% calm)Prevailingdirection
Anaheim
Jul 2013 21.7 ± 1.3 64.8 ± 5.7 2.5 (41.0) SWAug 2013 22.6 ± 2.8 61.5 ± 8.3 2.2 (45.9) SWSep 2013 22.4 ± 2.7 60.3 ± 12.9 1.8 (48.3) SWOct 2013 18.7 ± 3.0 59.3 ± 19.5 1.1 (51.4) SNov 2013 17.1 ± 2.1 54.7 ± 15.7 0.9 (54.1) SDec 2013 14.7 ± 3.6 45.9 ± 20.4 0.5 (56.4) SEJan 2014 16.3 ± 3.4 50.9 ± 25.0 0.5 (67.2) SFeb 2014 14.9 ± 1.8 65.9 ± 11.0 1.8 (47.6) S
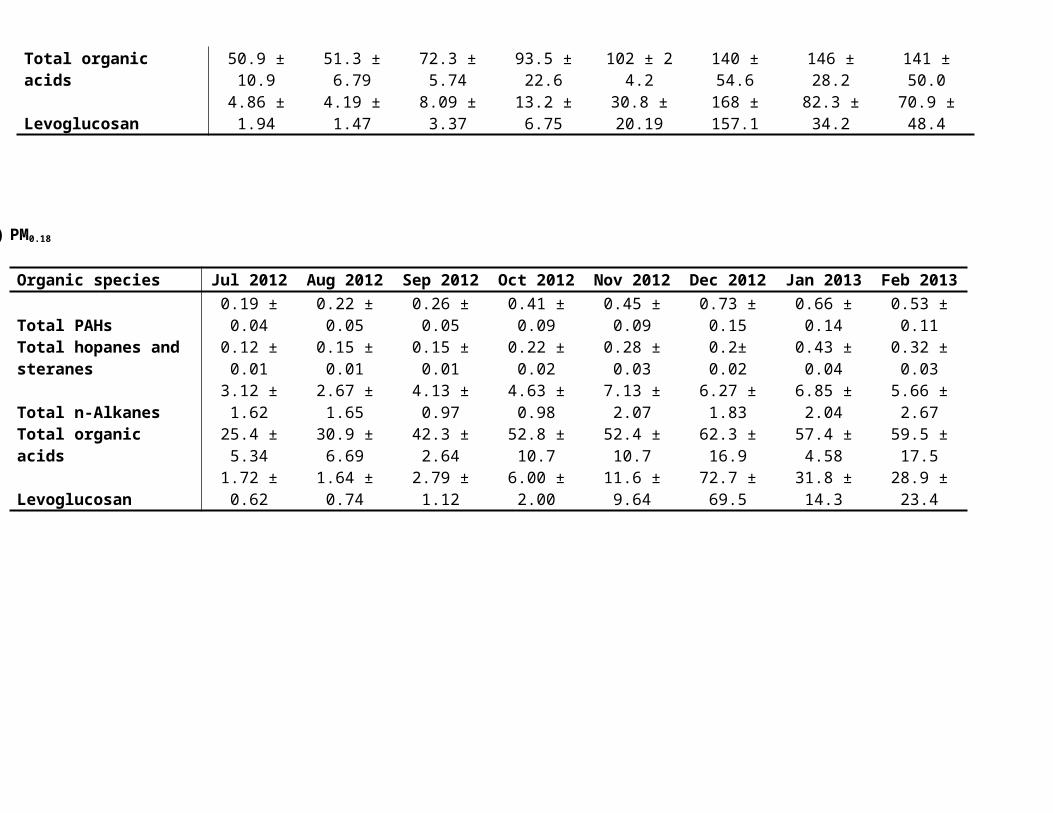
Table S2 a-b. Monthly average concentration (± standard deviation) of total polycyclic aromatic hydrocarbons (PAHs), hopanes and steranes, n-Alkanes, organic acids and levoglucosan (ng/m3) for a) PM2.5 and b) PM0.18 size fractions at Central Los Angeles.
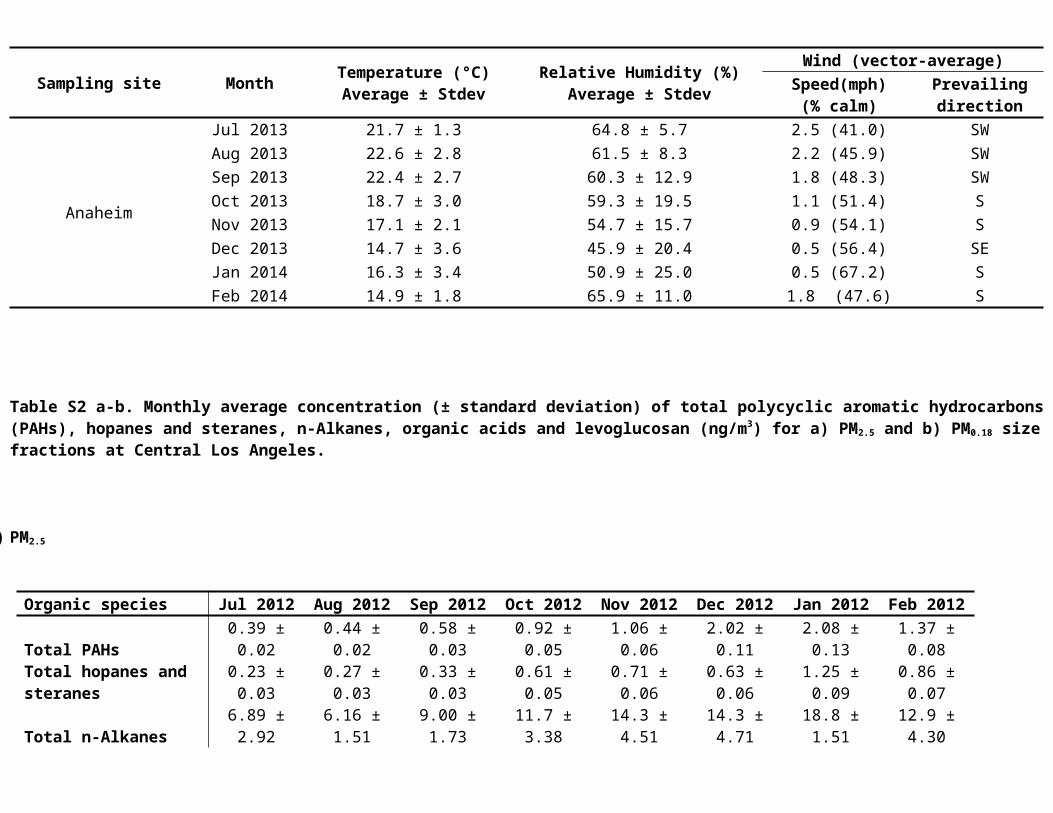
PM2.5
Organic species Jul 2012 Aug 2012 Sep 2012 Oct 2012 Nov 2012 Dec 2012 Jan 2012 Feb 2012Total PAHs 0.39 ± 0.02 0.44 ± 0.02 0.58 ± 0.03 0.92 ± 0.05 1.06 ± 0.06 2.02 ± 0.11 2.08 ± 0.13 1.37 ± 0.08Total hopanes and steranes 0.23 ± 0.03 0.27 ± 0.03 0.33 ± 0.03 0.61 ± 0.05 0.71 ± 0.06 0.63 ± 0.06 1.25 ± 0.09 0.86 ± 0.07
Total n-Alkanes 6.89 ± 2.92 6.16 ± 1.51 9.00 ± 1.73 11.7 ± 3.38 14.3 ± 4.51 14.3 ± 4.71 18.8 ± 1.51 12.9 ± 4.30Total organic acids 50.9 ± 10.9 51.3 ± 6.79 72.3 ± 5.74 93.5 ± 22.6 102 ± 2 4.2 140 ± 54.6 146 ± 28.2 141 ± 50.0Levoglucosan 4.86 ± 1.94 4.19 ± 1.47 8.09 ± 3.37 13.2 ± 6.75 30.8 ± 20.19 168 ± 157.1 82.3 ± 34.2 70.9 ± 48.4
PM0.18
Organic species Jul 2012 Aug 2012 Sep 2012 Oct 2012 Nov 2012 Dec 2012 Jan 2013 Feb 2013Total PAHs 0.19 ± 0.04 0.22 ± 0.05 0.26 ± 0.05 0.41 ± 0.09 0.45 ± 0.09 0.73 ± 0.15 0.66 ± 0.14 0.53 ± 0.11Total hopanes and steranes 0.12 ± 0.01 0.15 ± 0.01 0.15 ± 0.01 0.22 ± 0.02 0.28 ± 0.03 0.2± 0.02 0.43 ± 0.04 0.32 ± 0.03
Total n-Alkanes 3.12 ± 1.62 2.67 ± 1.65 4.13 ± 0.97 4.63 ± 0.98 7.13 ± 2.07 6.27 ± 1.83 6.85 ± 2.04 5.66 ± 2.67Total organic acids 25.4 ± 5.34 30.9 ± 6.69 42.3 ± 2.64 52.8 ± 10.7 52.4 ± 10.7 62.3 ± 16.9 57.4 ± 4.58 59.5 ± 17.5Levoglucosan 1.72 ± 0.62 1.64 ± 0.74 2.79 ± 1.12 6.00 ± 2.00 11.6 ± 9.64 72.7 ± 69.5 31.8 ± 14.3 28.9 ± 23.4
Table S3 a-b. Monthly average concentration (± standard deviation) of total polycyclic aromatic hydrocarbons (PAHs), hopanes and steranes, n-Alkanes, organic acids and levoglucosan (ng/m3) for a) PM2.5 and b) PM0.18 size fractions at Anaheim.
a) PM2.5
Organic species Jul 2013 Aug 2013 Sep 2013 Oct 20131 Nov 2013 Dec 2013 Jan 2014 Feb 2014Total PAHs 0.10 ± 0.01 0.24 ± 0.02 0.15 ± 0.01 0.65 1.39 ± 0.08 1.29 ± 0.08 0.96 ± 0.06Total hopanes and steranes 0.04 ± 0.01 0.11 ± 0.02 0.05 ± 0.01 0.21 0.57 ± 0.06 0.55 ± 0.06 0.57 ± 0.07
Total n-Alkanes 6.97 ± 3.12 9.79 ± 3.19 7.00 ± 2.89 8.53 18.4 ± 5.05 19.0 ± 7.47 16.3 ± 2.67Total organic acids 59.0 ± 12.0 74.9 ± 28.9 58.7 ± 10.5 61.67 90.6 ± 30.4 117 ± 44.3 116 ± 34.1Levoglucosan 8.01 ± 3.00 9.58 ± 7.99 7.53 ± 4.66 14.41 47.2 ± 28.4 74.3 ± 40.1 64.8 ± 11.9
b) PM0.18
Organic species Jul 2013 Aug 2013 Sep 2013 Oct 20131 Nov 2013 Dec 2013 Jan 2014 Feb 2014Total PAHs 0.06 ± 0.01 0.12 ± 0.01 0.09 ± 0.01 0.29 0.57 ± 0.04 0.49 ± 0.03 0.40 ± 0.03Total hopanes and steranes 0.03 ± 0.01 0.04 ± 0.01 0.04 ± 0.01 0.09 0.20 ± 0.02 0.27 ± 0.03 0.27 ± 0.03
Total n-Alkanes 3.39 ± 1.65 2.25 ± 0.49 3.45 ± 0.92 4.42 7.48 ± 2.78 7.76 ± 2.53 10.3 ± 5.10Total organic acids 39.60 ± 9.95 51.7 ± 16.4 40.2 ± 7.46 42.03 41.1 ± 14.9 50.7 ± 11.9 64.4 ± 63.3Levoglucosan 2.54 ± 0.57 3.11 ± 1.44 2.54 ± 1.11 5.92 8.81 ± 3.54 18.1 ± 10.5 15.5 ± 16.9
1 reported values correspond to one set of sampling
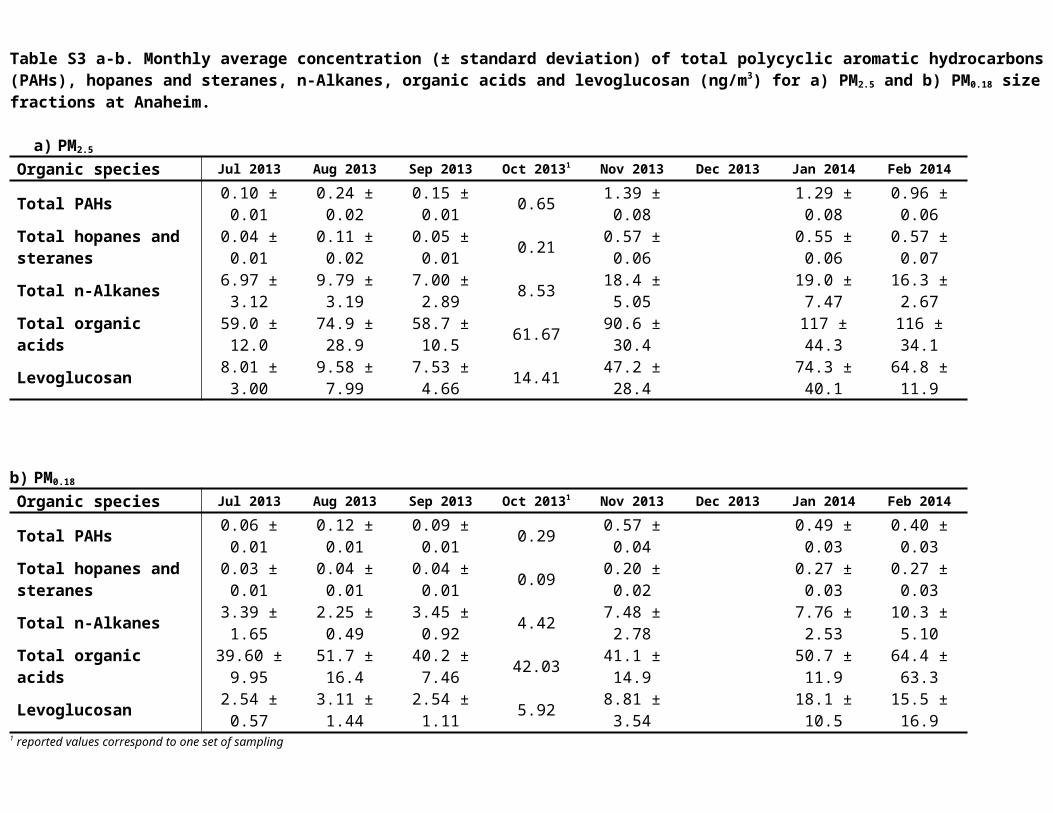
Table S4 a-b. Carbon Preference Index (CPI) values (± standard deviation) of n- alkanes for PM2.5 and PM0.18 at a) Central Los Angeles and b) Anaheim.
a) Central LA
Sampling month PM0.18 PM2.5
Jul 2012 1.21 ± 0.27 1.18 ± 0.17Aug 2012 1.50 ± 0.20 1.33 ± 0.13Sep 2012 1.19 ± 0.20 1.27 ± 0.28Oct 2012 1.57 ± 0.12 1.36 ± 0.15Nov 2012 1.05 ± 0.14 1.11 ± 0.09Dec 2012 1.25 ± 0.15 1.27 ± 0.10Jan 2013 1.30 ± 0.28 1.23 ± 0.06Feb 2013 1.09 ± 0.22 1.17 ± 0.21
b) Anaheim
Sampling month PM0.18 PM2.5
Jul 2013 1.19 ± 0.1 1.12 ± 0.21Aug 2013 1.6 ± 0.06 1.14 ± 0.2Sep 2013 1.26 ± 0.11 1.25 ± 0.18Oct 20131 1.49 1.56Nov 2013 1.41 ± 0.12 1.33 ± 0.01Dec 2013Jan 2014 1.18 ± 0.15 1.26 ± 0.05Feb 2014 1.25 ± 0.06 1.29 ± 0.21
1 reported values correspond to one set of sampling

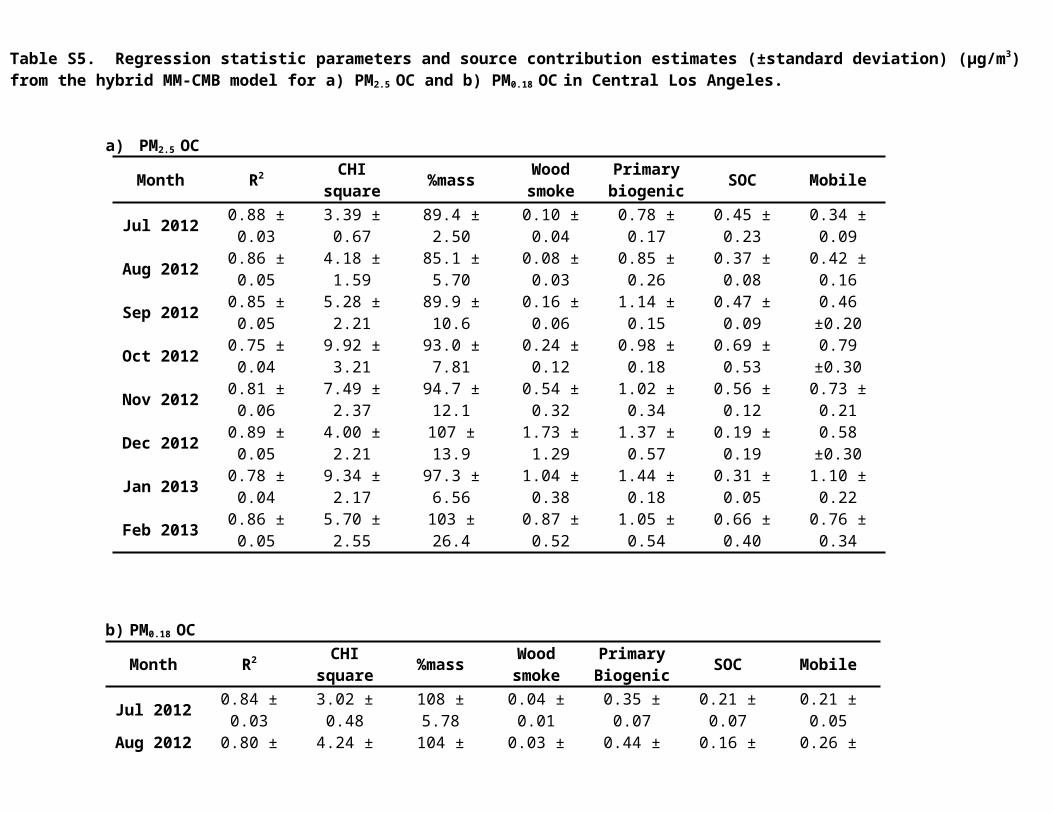
Table S5. Regression statistic parameters and source contribution estimates (±standard deviation) (µg/m3) from the hybrid MM-CMB model for a) PM2.5 OC and b) PM0.18 OC in Central Los Angeles.
a) PM2.5 OC
Month R2 CHI square %mass Wood smoke
Primary biogenic SOC Mobile
Jul 2012 0.88 ± 0.03 3.39 ± 0.67 89.4 ± 2.50 0.10 ± 0.04 0.78 ± 0.17 0.45 ± 0.23 0.34 ± 0.09Aug 2012 0.86 ± 0.05 4.18 ± 1.59 85.1 ± 5.70 0.08 ± 0.03 0.85 ± 0.26 0.37 ± 0.08 0.42 ± 0.16Sep 2012 0.85 ± 0.05 5.28 ± 2.21 89.9 ± 10.6 0.16 ± 0.06 1.14 ± 0.15 0.47 ± 0.09 0.46 ±0.20Oct 2012 0.75 ± 0.04 9.92 ± 3.21 93.0 ± 7.81 0.24 ± 0.12 0.98 ± 0.18 0.69 ± 0.53 0.79 ±0.30Nov 2012 0.81 ± 0.06 7.49 ± 2.37 94.7 ± 12.1 0.54 ± 0.32 1.02 ± 0.34 0.56 ± 0.12 0.73 ± 0.21Dec 2012 0.89 ± 0.05 4.00 ± 2.21 107 ± 13.9 1.73 ± 1.29 1.37 ± 0.57 0.19 ± 0.19 0.58 ±0.30Jan 2013 0.78 ± 0.04 9.34 ± 2.17 97.3 ± 6.56 1.04 ± 0.38 1.44 ± 0.18 0.31 ± 0.05 1.10 ± 0.22Feb 2013 0.86 ± 0.05 5.70 ± 2.55 103 ± 26.4 0.87 ± 0.52 1.05 ± 0.54 0.66 ± 0.40 0.76 ± 0.34
b) PM0.18 OC
Month R2 CHI square %mass Wood smoke
Primary Biogenic SOC Mobile
Jul 2012 0.84 ± 0.03 3.02 ± 0.48 108 ± 5.78 0.04 ± 0.01 0.35 ± 0.07 0.21 ± 0.07 0.21 ± 0.05Aug 2012 0.80 ± 0.97 4.24 ± 13.3 104 ± 0.01 0.03 ± 0.01 0.44 ± 0.12 0.16 ± 0.04 0.26 ± 0.09Sep 2012 0.83 ± 0.04 4.20 ± 1.29 109 ± 9.93 0.06 ± 0.02 0.58 ± 0.13 0.19 ± 0.01 0.21 ± 0.08Oct 2012 0.74 ± 0.02 7.77 ± 2.39 92.0 ± 12.3 0.10 ± 0.03 0.53 ± 0.07 0.22 ± 0.10 0.33 ± 0.1Nov 2012 0.82 ± 0.06 5.20 ± 1.22 122 ± 16.9 0.19 ± 0.13 0.49 ± 0.12 0.24 ± 0.08 0.32 ± 0.14Dec 2012 0.89 ± 0.06 2.91 ± 1.71 129 ± 15.3 0.62 ± 0.45 0.69 ± 0.31 0.09 ± 0.06 0.18 ± 0.14Jan 2013 0.84 ± 0.03 5.00 ± 0.92 111 ± 4.38 0.33 ± 0.10 0.64 ± 0.07 0.14 ± 0.03 0.41 ± 0.06Feb 2013 0.87 ± 0.02 3.95 ± 1.43 125 ± 26.4 0.32 ± 0.17 0.56 ± 0.29 0.21 ± 0.09 0.32 ± 0.13
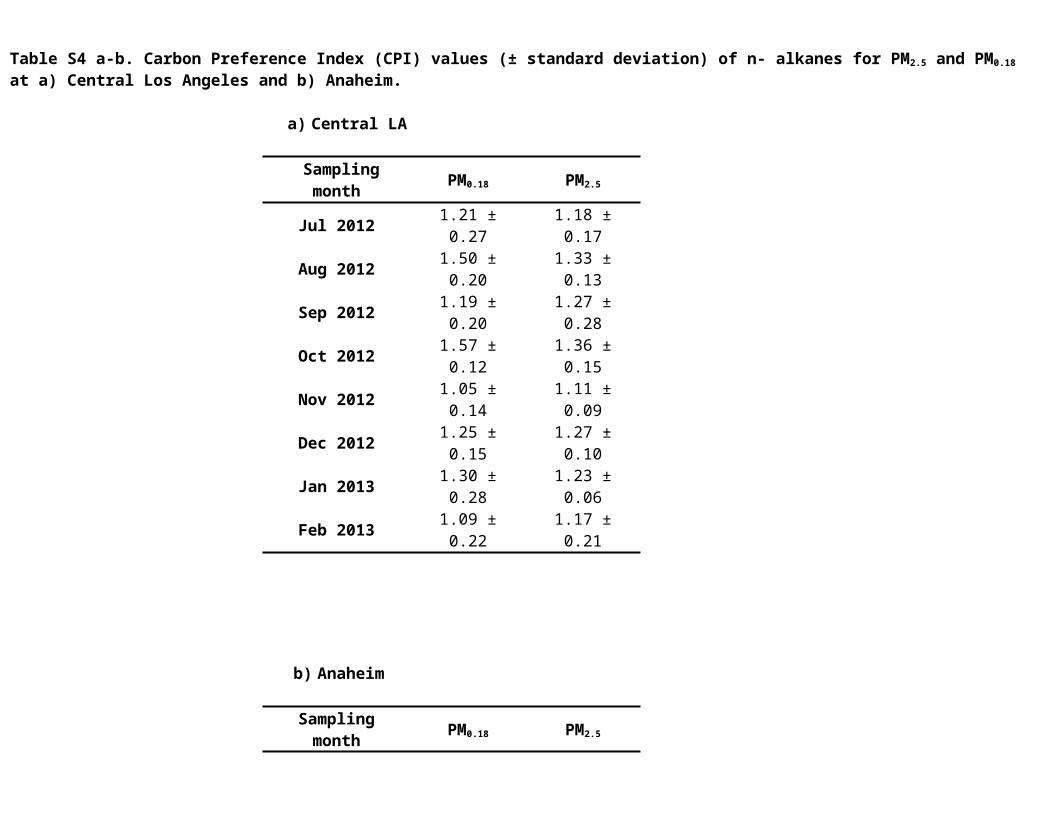
Table S6. Regression statistic parameters and source contribution estimates (±standard deviation) (µg/m3) from the hybrid MM-CMB model for a) PM2.5 OC and b) PM0.18 OC in Anaheim. October 2013 data correspond to only one sample.
a) PM2.5 OC
Month R2 CHI square %mass Wood smoke
Primary biogenic SOC Mobile
Jul 2013 0.76 ± 0.03 6.27 ± 1.11 78.9 ± 37.8 0.15 ± 0.06 0.82 ± 0.45 0.29 ± 0.04 0.04 ± 0.03Aug 2013 0.81 ± 0.04 5.11 ± 1.00 74.6 ± 31.4 0.18 ± 0.15 1.03 ± 0.42 0.47 ± 0.18 0.21 ± 0.19Sep 2013 0.73 ± 0.06 7.66 ± 1.76 62.6 ± 14.6 0.13 ± 0.08 0.59 ± 0.17 0.40 ± 0.06 0.08 ± 0.06Oct 20131 0.74 9.51 57.1 0.21 0.76 0.55 0.21Nov 2013 0.75 ±0.00 11.3 ± 0.96 66.8 ± 3.68 0.59 ± 0.25 1.43 ± 0.45 0.46 ± 0.20 0.58 ± 0.07Dec 2013Jan 2014 0.85 ± 0.04 6.28 ± 1.88 93.7 ± 8.19 0.93 ± 0.52 1.27 ± 0.33 0.80 ± 0.40 0.52 ± 0.23Feb 2014 0.68 ± 0.17 16.4 ± 11.0 99.1 ± 46.1 0.60 ± 0.02 1.17 ± 0.34 0.54 ± 0.12 0.64 ± 0.06
b) PM0.18 OC
Month R2 CHI square %mass Wood smoke
Primary Biogenic SOC Mobile
Jul 2013 0.79 ± 0.06 4.68 ± 1.35 65.2 ± 17.6 0.05 ± 0.01 0.43 ± 0.18 0.14 ± 0.03 0.06 ± 0.05Aug 2013 0.86 ± 0.03 2.97 ± 0.84 83.2 ± 21.9 0.06 ± 0.03 0.71 ± 0.26 0.22 ± 0.04 0.04 ± 0.07Sep 2013 0.77 ± 0.05 5.21 ± 1.34 59.5 ± 9.88 0.04 ± 0.02 0.34 ± 0.05 0.21 ± 0.06 0.07 ± 0.04Oct 20131 0.79 5.62 55.1 0.09 0.46 0.25 0.13Nov 2013 0.82 ± 0.07 5.47 ± 0.68 72.5 ± 7.16 0.16 ± 0.07 0.76 ± 0.20 0.15 ± 0.08 0.25 ± 0.04Dec 2013Jan 2014 0.85 ± 0.02 4.93 ± 0.60 88.9 ± 12.64 0.27 ± 0.14 0.65 ± 0.18 0.14 ± 0.05 0.32 ± 0.13Feb 2014 0.69 ± 0.01 9.50 ± 2.47 79.2 ± 58.0 0.18 ± 0.19 0.51 ± 0.53 0.17 ± 0.12 0.38 ± 0.05
1 reported values correspond to one set of sampling
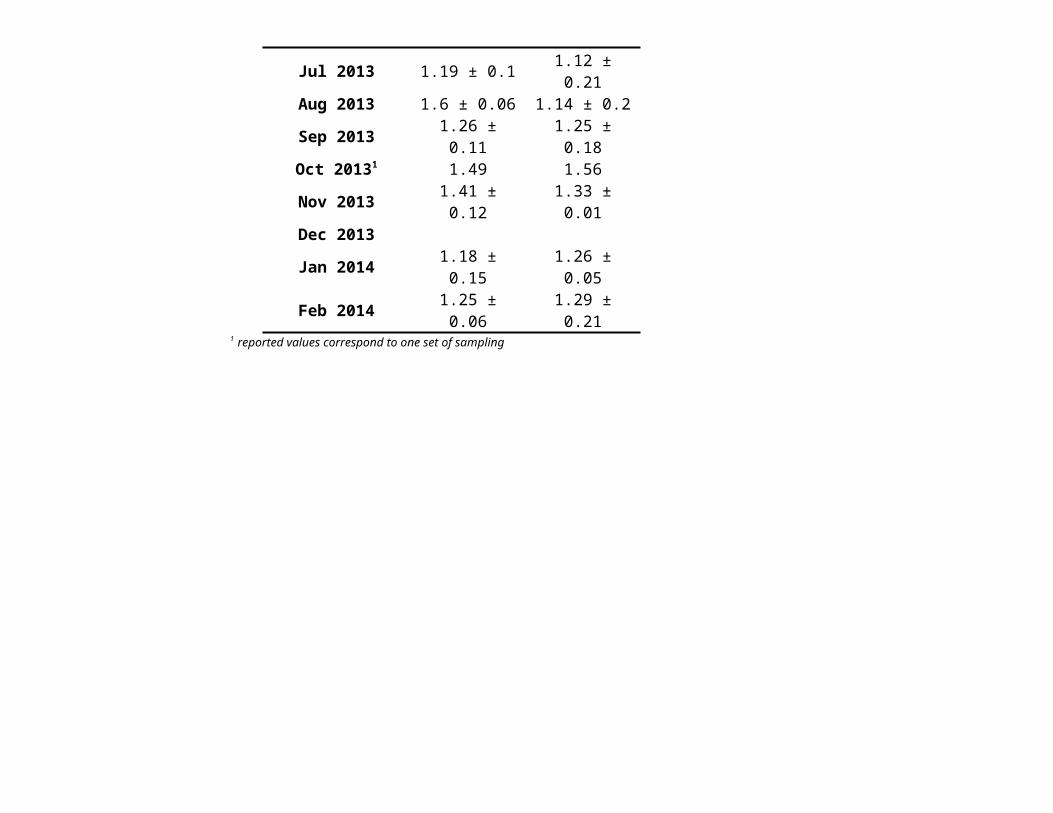
Table S7. Source profiles (tracer to OC ratios) (± uncertainty) used in the hybrid MM-CMB model.
Wood smoke Primary biogenic SOC Diesel Gasoline Smoking vehicles
concentration uncertainty concentration uncertainty concentration uncertainty concentration uncertainty concentration uncertainty concentration uncertainty
EC 2.06E-01 6.55E-02 1.45E-01 4.15E-02 7.23E-04 2.15E-02 2.56E+00 2.34E-01 2.88E-01 1.59E-02 1.94E-02 3.57E-03
benzo(b)fluoranthene 1.08E-04 1.67E-05 1.89E-05 8.82E-06 8.69E-06 7.36E-06 2.07E-05 4.14E-06 2.29E-04 4.65E-05 2.27E-05 4.54E-06
benzo(k)fluoranthene 8.66E-05 9.79E-06 6.18E-06 2.53E-06 8.22E-10 2.50E-07 2.90E-05 5.80E-06 1.72E-04 3.49E-05 1.26E-05 2.53E-06
benzo(e)pyrene 9.86E-05 1.48E-05 1.42E-05 6.41E-06 4.86E-09 1.44E-06 3.40E-05 6.79E-06 3.15E-04 6.46E-05 1.76E-05 3.51E-06
indeno(1,2,3-cd)pyrene 1.01E-04 2.37E-05 1.67E-05 7.81E-06 3.39E-09 1.02E-06 1.15E-07 2.93E-08 1.83E-04 3.79E-05 0.00E+00 1.00E-08
benzo(GHI)perylene 1.47E-04 2.14E-05 3.03E-05 8.77E-06 4.82E-06 6.01E-06 6.22E-06 1.25E-06 6.62E-04 1.33E-04 2.76E-05 5.52E-06
coronene 7.83E-05 1.25E-05 1.16E-05 6.60E-06 1.13E-07 5.61E-06 -9.90E+01 -9.90E+01 -9.90E+01 -9.90E+01 -9.90E+01 -9.90E+01
17A(H)-22,29,30-Trisnorhopane 2.33E-05 5.53E-06 8.59E-06 3.63E-06 2.50E-09 7.49E-07 6.28E-06 1.26E-06 5.68E-05 1.14E-05 7.41E-05 1.48E-05
17B(H)-21A(H)-30-Norhopane 3.28E-05 1.49E-05 2.57E-05 9.44E-06 1.27E-05 6.39E-06 3.62E-05 7.24E-06 1.80E-04 3.64E-05 1.69E-04 3.38E-05
17A(H)-21B(H)-Hopane 1.61E-05 1.69E-05 1.80E-05 1.15E-05 1.58E-05 8.40E-06 1.65E-05 3.30E-06 2.02E-04 4.11E-05 1.40E-04 2.81E-05
22S-Homohopane 1.20E-05 6.90E-06 1.33E-05 4.84E-06 1.26E-05 3.70E-06 -9.90E+01 -9.90E+01 -9.90E+01 -9.90E+01 -9.90E+01 -9.90E+01
22R-Homohopane 1.33E-05 6.12E-06 1.07E-05 4.19E-06 9.81E-06 3.19E-06 -9.90E+01 -9.90E+01 -9.90E+01 -9.90E+01 -9.90E+01 -9.90E+01
ABB-20R-C27-Cholestane 4.28E-06 4.61E-06 3.66E-09 8.87E-07 3.47E-09 7.24E-07 7.43E-06 1.49E-06 6.71E-05 1.34E-05 8.06E-05 1.61E-05
ABB-20R-C29-Sitostane 1.75E-05 6.01E-06 1.10E-08 1.98E-06 3.20E-09 6.85E-07 6.37E-06 1.27E-06 1.25E-04 2.49E-05 9.53E-05 1.91E-05
n-pentacosane 2.90E-04 2.62E-04 3.14E-04 1.75E-04 8.08E-05 1.11E-04 4.36E-04 8.72E-05 1.61E-04 3.26E-05 4.07E-04 8.13E-05
n-hexacosane 2.11E-04 2.49E-04 2.66E-04 1.88E-04 1.10E-04 1.40E-04 2.51E-04 5.02E-05 0.00E+00 1.00E-08 3.93E-04 7.87E-05
n-heptacosane 2.12E-04 2.16E-04 4.97E-04 2.02E-04 1.50E-04 1.27E-04 1.13E-04 2.26E-05 0.00E+00 1.00E-08 0.00E+00 1.00E-08
n-octacosane 1.87E-04 1.54E-04 2.94E-04 1.27E-04 5.24E-05 8.87E-05 9.52E-05 1.90E-05 1.06E-05 2.99E-06 0.00E+00 1.00E-08
nonacosane 2.65E-04 1.73E-04 6.39E-04 1.84E-04 1.53E-04 1.14E-04 6.52E-05 1.31E-05 1.79E-04 5.06E-05 0.00E+00 1.00E-08
triacontane 2.02E-04 1.35E-04 2.43E-04 1.15E-04 1.16E-04 9.41E-05 0.00E+00 1.00E-08 0.00E+00 1.00E-08 0.00E+00 1.00E-08
hentriacontane 3.14E-04 1.68E-04 5.52E-04 1.73E-04 1.89E-04 1.24E-04 1.52E-04 3.04E-05 3.56E-06 1.01E-06 0.00E+00 1.00E-08
dotriacontane 2.60E-04 1.43E-04 1.64E-04 1.08E-04 4.99E-05 8.12E-05 3.97E-05 7.94E-06 7.15E-06 2.02E-06 0.00E+00 1.00E-08
tritriacontane 2.59E-04 1.47E-04 3.01E-04 1.32E-04 6.80E-05 9.55E-05 8.27E-06 1.66E-06 2.29E-06 6.49E-07 0.00E+00 1.00E-08
octadecanoic acid 1.70E-02 3.20E-03 3.15E-03 1.76E-03 2.53E-03 1.53E-03 0.00E+00 1.00E-05 0.00E+00 1.00E-05 0.00E+00 1.00E-05
nonadecanoic acid 1.34E-04 6.15E-05 1.98E-04 6.49E-05 4.79E-06 3.62E-05 0.00E+00 1.00E-05 0.00E+00 1.00E-05 0.00E+00 1.00E-05
ficosanoic acid 7.22E-04 1.69E-04 8.68E-04 1.68E-04 9.29E-05 9.76E-05 0.00E+00 1.00E-05 0.00E+00 1.00E-05 0.00E+00 1.00E-05
heneicosanoic acid 1.27E-04 4.10E-05 3.89E-04 5.63E-05 8.65E-05 3.42E-05 0.00E+00 1.00E-05 0.00E+00 1.00E-05 0.00E+00 1.00E-05
docosanoic acid 1.08E-03 1.95E-04 1.56E-03 2.19E-04 1.13E-05 1.03E-04 0.00E+00 1.00E-05 0.00E+00 1.00E-05 0.00E+00 1.00E-05
tricosanoic acid 2.23E-04 8.00E-05 6.26E-04 1.03E-04 6.13E-05 6.09E-05 0.00E+00 1.00E-05 0.00E+00 1.00E-05 0.00E+00 1.00E-05
tetracosanoic acid 1.21E-03 1.83E-04 1.63E-03 2.03E-04 3.44E-07 7.27E-05 0.00E+00 1.00E-05 0.00E+00 1.00E-05 0.00E+00 1.00E-05
pentacosanoic acid 9.55E-05 5.11E-05 3.71E-04 6.59E-05 5.87E-05 4.36E-05 0.00E+00 1.00E-05 0.00E+00 1.00E-05 0.00E+00 1.00E-05
hexacosanoic acid 5.38E-04 1.03E-04 9.14E-04 1.15E-04 1.44E-07 3.64E-05 0.00E+00 1.00E-05 0.00E+00 1.00E-05 0.00E+00 1.00E-05
heptacosanoic acid 1.21E-05 3.36E-05 2.19E-04 4.67E-05 5.45E-05 3.29E-05 0.00E+00 1.00E-05 0.00E+00 1.00E-05 0.00E+00 1.00E-05
octacosanoic acid 1.20E-04 6.11E-05 6.26E-04 8.66E-05 9.48E-05 4.64E-05 0.00E+00 1.00E-05 0.00E+00 1.00E-05 0.00E+00 1.00E-05
nonacosanoic acid 2.91E-05 3.73E-05 2.01E-04 5.12E-05 5.27E-05 3.66E-05 0.00E+00 1.00E-05 0.00E+00 1.00E-05 0.00E+00 1.00E-05
triacontanoic acid 1.61E-05 6.69E-05 4.46E-04 9.89E-05 1.30E-04 6.02E-05 0.00E+00 1.00E-05 0.00E+00 1.00E-05 0.00E+00 1.00E-05
phthalic acid 6.58E-04 4.08E-04 1.59E-03 5.71E-04 7.68E-03 7.26E-04 0.00E+00 1.00E-05 0.00E+00 1.00E-05 0.00E+00 1.00E-05
pinonic acid 1.07E-03 1.70E-04 9.55E-05 7.83E-05 1.75E-07 3.96E-05 0.00E+00 1.00E-05 0.00E+00 1.00E-05 0.00E+00 1.00E-05
isophthalic acid 3.29E-04 1.16E-04 1.76E-04 8.85E-05 3.76E-04 7.63E-05 0.00E+00 1.00E-05 0.00E+00 1.00E-05 0.00E+00 1.00E-05
terephthalic acid 7.74E-04 2.30E-04 2.50E-04 1.38E-04 4.30E-04 1.17E-04 0.00E+00 1.00E-05 0.00E+00 1.00E-05 0.00E+00 1.00E-05
methylphthalic acid 1.29E-04 1.52E-04 4.99E-04 2.02E-04 1.95E-03 2.22E-04 0.00E+00 1.00E-05 0.00E+00 1.00E-05 0.00E+00 1.00E-05
succinic acid 1.19E-03 3.88E-04 1.88E-06 2.64E-04 8.73E-03 9.44E-04 0.00E+00 1.00E-05 0.00E+00 1.00E-05 0.00E+00 1.00E-05
glutaric acid 4.96E-04 2.50E-04 3.78E-05 2.18E-04 3.28E-03 4.03E-04 0.00E+00 1.00E-05 0.00E+00 1.00E-05 0.00E+00 1.00E-05
adipic acid 2.76E-04 1.98E-04 1.49E-04 1.81E-04 1.65E-03 2.48E-04 0.00E+00 1.00E-05 0.00E+00 1.00E-05 0.00E+00 1.00E-05
pimelic acid 1.81E-04 8.12E-05 1.93E-04 9.31E-05 5.60E-04 8.62E-05 0.00E+00 1.00E-05 0.00E+00 1.00E-05 0.00E+00 1.00E-05
suberic acid 6.87E-05 9.72E-05 3.98E-04 1.16E-04 6.19E-04 1.02E-04 0.00E+00 1.00E-05 0.00E+00 1.00E-05 0.00E+00 1.00E-05
azelaic acid 5.03E-06 4.08E-04 1.86E-03 4.72E-04 2.19E-03 3.83E-04 0.00E+00 1.00E-05 0.00E+00 1.00E-05 0.00E+00 1.00E-05
sebacic acid 6.65E-05 5.44E-05 2.44E-04 6.06E-05 2.25E-04 4.97E-05 0.00E+00 1.00E-05 0.00E+00 1.00E-05 0.00E+00 1.00E-05
T-3 (2,3-dihydroxy-4-oxopentanoic acid) 6.91E-07 7.70E-05 1.19E-07 3.97E-05 1.05E-03 1.57E-04 0.00E+00 1.00E-05 0.00E+00 1.00E-05 0.00E+00 1.00E-05
PNA (pinonic acid) 1.06E-03 2.28E-04 5.75E-07 1.00E-04 3.19E-07 7.26E-05 0.00E+00 1.00E-05 0.00E+00 1.00E-05 0.00E+00 1.00E-05
I-2 (2-methylthreitol) 2.55E-06 9.18E-05 2.70E-05 8.44E-05 1.31E-04 9.45E-05 0.00E+00 1.00E-05 0.00E+00 1.00E-05 0.00E+00 1.00E-05
I-3 (2-methylthreitol) 7.75E-07 8.16E-05 2.07E-05 8.41E-05 1.44E-04 9.47E-05 0.00E+00 1.00E-05 0.00E+00 1.00E-05 0.00E+00 1.00E-05
A-5 (3-hydroxyglutaric acid) 1.71E-06 1.03E-04 6.19E-05 1.78E-04 4.41E-03 4.06E-04 0.00E+00 1.00E-05 0.00E+00 1.00E-05 0.00E+00 1.00E-05
PA (pinic acid) 6.93E-05 9.80E-05 9.52E-08 3.18E-05 1.02E-04 9.17E-05 0.00E+00 1.00E-05 0.00E+00 1.00E-05 0.00E+00 1.00E-05
A-6 (2-hydroxy-4,4-dimethylglutaric acid) 2.75E-07 5.34E-05 6.82E-08 2.39E-05 1.04E-03 1.60E-04 0.00E+00 1.00E-05 0.00E+00 1.00E-05 0.00E+00 1.00E-05
A-4 (3-acetyl hexanedioic acid) 2.77E-05 1.15E-04 5.91E-08 2.10E-05 1.10E-03 1.76E-04 0.00E+00 1.00E-05 0.00E+00 1.00E-05 0.00E+00 1.00E-05
A-3 (2-hydroxy-4-ispropyladipic acid) 1.05E-06 1.81E-04 2.83E-07 9.35E-05 4.78E-04 1.80E-04 0.00E+00 1.00E-05 0.00E+00 1.00E-05 0.00E+00 1.00E-05
C-1 (b-carophyllinic acid) 3.12E-07 6.10E-05 6.00E-08 2.10E-05 2.46E-04 9.35E-05 0.00E+00 1.00E-05 0.00E+00 1.00E-05 0.00E+00 1.00E-05
levoglucosan 5.78E-02 7.51E-03 6.41E-07 2.23E-04 2.82E-06 4.37E-04 0.00E+00 1.00E-08 0.00E+00 1.00E-08 0.00E+00 1.00E-08
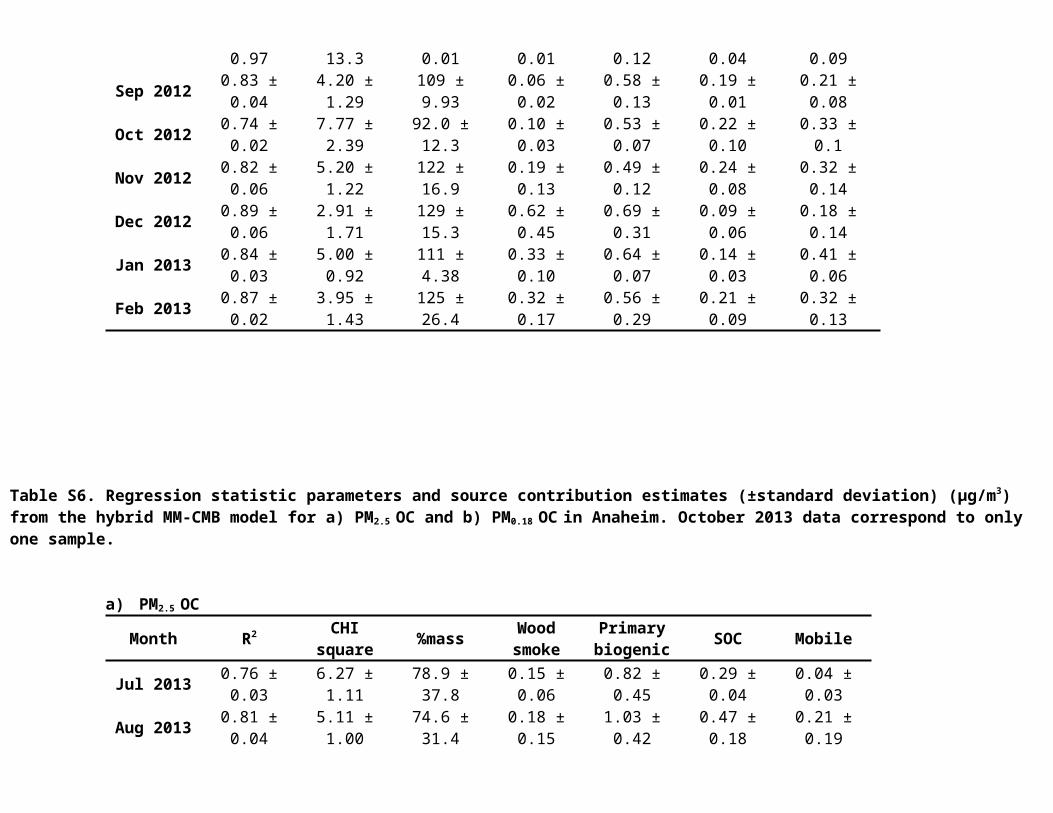
Figure S1. Location of sampling sites.
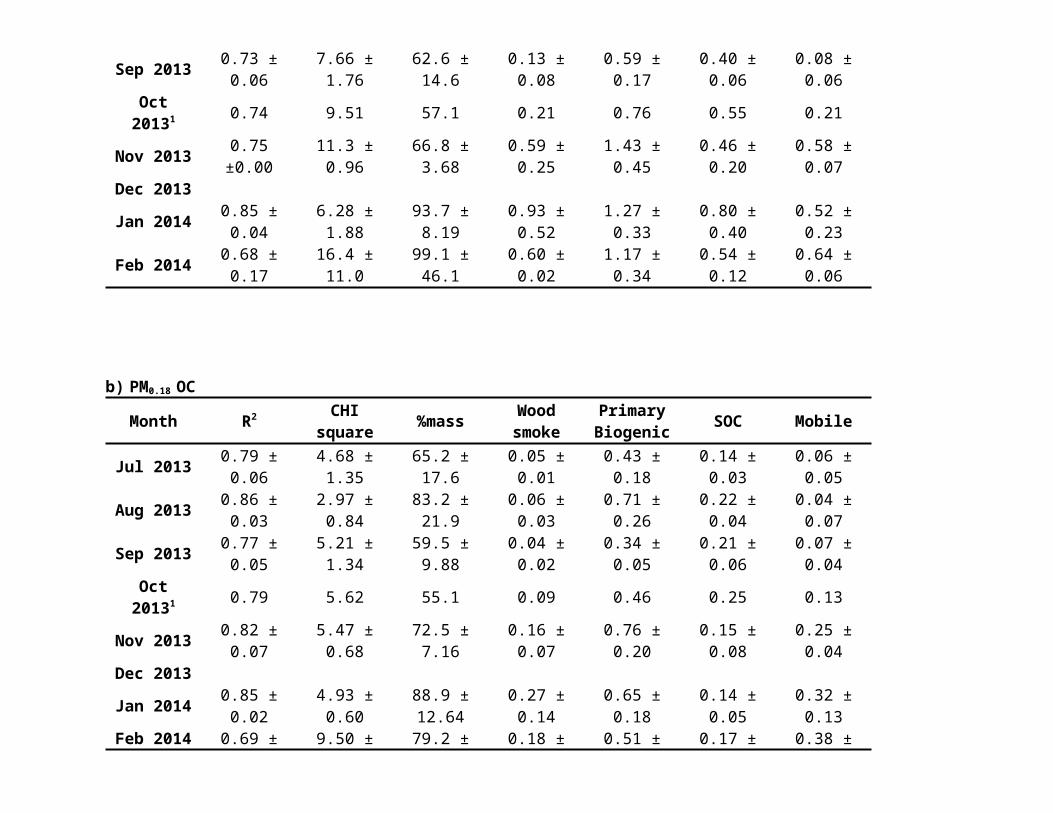
Figure S2. Monthly average concentration of selected organic acids (ng/m3) for PM2.5 and PM0.18 in a) Central Los Angeles and b) Anaheim. Black dots are the Carbon Preference Index (CPI). Error bars correspond to one standard deviation.
a) Central LA b) Anaheim
Jul 2
012
Aug 2
012
Sep 2
012
Oct 2
012
Nov 2
012
Dec 2
012
Jan 2
013
Feb 2
013
0102030405060708090
100
0
2
4
6
8
10
12
14
16PM2.5
C15 C16 C17 C18 C19 C20 C21 C22 C23 C24 C25 C26 C27 C28
C29 C30 CPI (C14-C30)
Conc
entra
tion
(ng/
m3)
CPI
Jul 20
13
Aug 2
013
Sep 2
013
Oct 2
013
Nov 2
013
Dec 2
013
Jan 20
14
Feb 2
014
0
10
20
30
40
50
60
70
80
90
100
0
2
4
6
8
10
12
14PM2.5
Conc
entra
tion (
ng/m
3)
CPI
Jul 2
013
Aug 2
013
Sep 2
013
Oct 2
013
Nov 2
013
Dec 2
013
Jan 20
14
Feb 2
014
0
5
10
15
20
25
30
35
40
45
0
2
4
6
8
10
12
14PM0.18
Conc
entra
tion (
ng/m
3)
CPI

Figure S3 a-b. Monthly average source contributions (µg/m3) to ambient OC for PM2.5 and PM0.18, using traditional source profiles, in a) Central Los Angeles and b) Anaheim.
a) Central LA b) AnaheimJul
2012
Aug 2
012
Sep 2
012
Oct 2
012
Nov 2
012
Dec 2
012
Jan 20
13
Feb 2
013
0
0.5
1
1.5
2
2.5
3
3.5
4
4.5
5PM2.5
mobile Vegetative detritus Wood smoke Other OC
PM2.5
OC co
ncentr
ation
(µg/m
3)
Jul 20
13
Aug 2
013
Sep 2
013
Oct 2
013
Nov 2
013
Dec 2
013
Jan 20
14
Feb 2
014
0
0.5
1
1.5
2
2.5
3
3.5
4
4.5
5
PM2.5
PM2.5
OC c
once
ntrati
on (µ
g/m3
)
Jul 2
012
Aug 2
012
Sep 2
012
Oct 2
012
Nov 2
012
Dec 2
012
Jan 20
13
Feb 2
013
0
0.2
0.4
0.6
0.8
1
1.2
1.4
1.6
1.8
2PM0.18
PM0.1
8 OC c
once
ntra
tion (
µg/m
3)
Jul 2
012
Aug 2
012
Sep 2
012
Oct 2
012
Nov 2
012
Dec 2
012
Jan 20
13
Feb 2
013
0
5
10
15
20
25
30
35
40
45
0
2
4
6
8
10
12
14
16
18PM0.18
Conc
entra
tion (
ng/m
3)
CPI
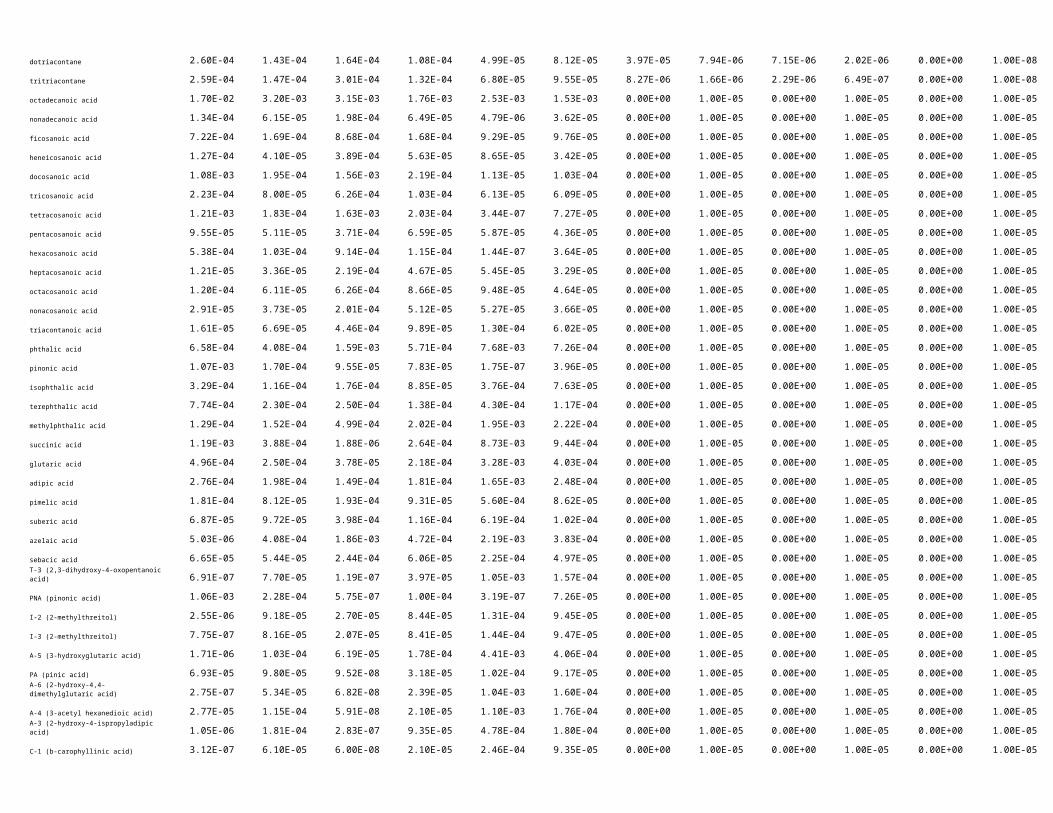
Figure S4. Mobile source apportionment sensitivity analysis between traditional and Hybrid model for PM2.5 and PM0.18 in a) Central Los Angeles and b) Anaheim. Error bars correspond to one standard deviation. Error bar for October 2013 is missing as the concentrations correspond to only one sample. For the scatter plots, weekly source contributions from both sites were combined together.
a) Central LA b) Anaheim
Jul 2
012
Aug
201
2
Sep
2012
Oct
201
2
Nov
201
2
Dec
201
2
Jan
2013
Feb
2013
0
0.2
0.4
0.6
0.8
1
1.2
1.4
1.6
PM2.5
Hybrid source profiles Traditional source profiles
OC
co
ncen
trati
on (µ
g/m
3)
0 0.2 0.4 0.6 0.8 1 1.2 1.4 1.6 1.8 20
0.2
0.4
0.6
0.8
1
1.2
1.4
1.6
1.8f(x) = 1.18248649566232 x + 0.1149187067511R² = 0.931606927627079
PM2.5
Hybrid source profiles (µg/m3)
Trad
ition
al so
urce
pro
files
(µg/
m3)
0 0.1 0.2 0.3 0.4 0.5 0.6 0.7 0.80
0.2
0.4
0.6
0.8
f(x) = 1.15805257541212 x + 0.0691109098609282R² = 0.901428447924855
PM0.18
Hybrid source profiles (µg/m3)
Trad
ition
al so
urce
pro
files
(µg/
m3)
Jul 20
13
Aug 2
013
Sep 2
013
Oct 2
013
Nov 2
013
Dec 2
013
Jan 20
14
Feb 2
014
0
0.2
0.4
0.6
0.8
1
1.2
1.4
1.6
1.8
2PM0.18
PM0.1
8 OC c
once
ntrati
on (µ
g/m
3)
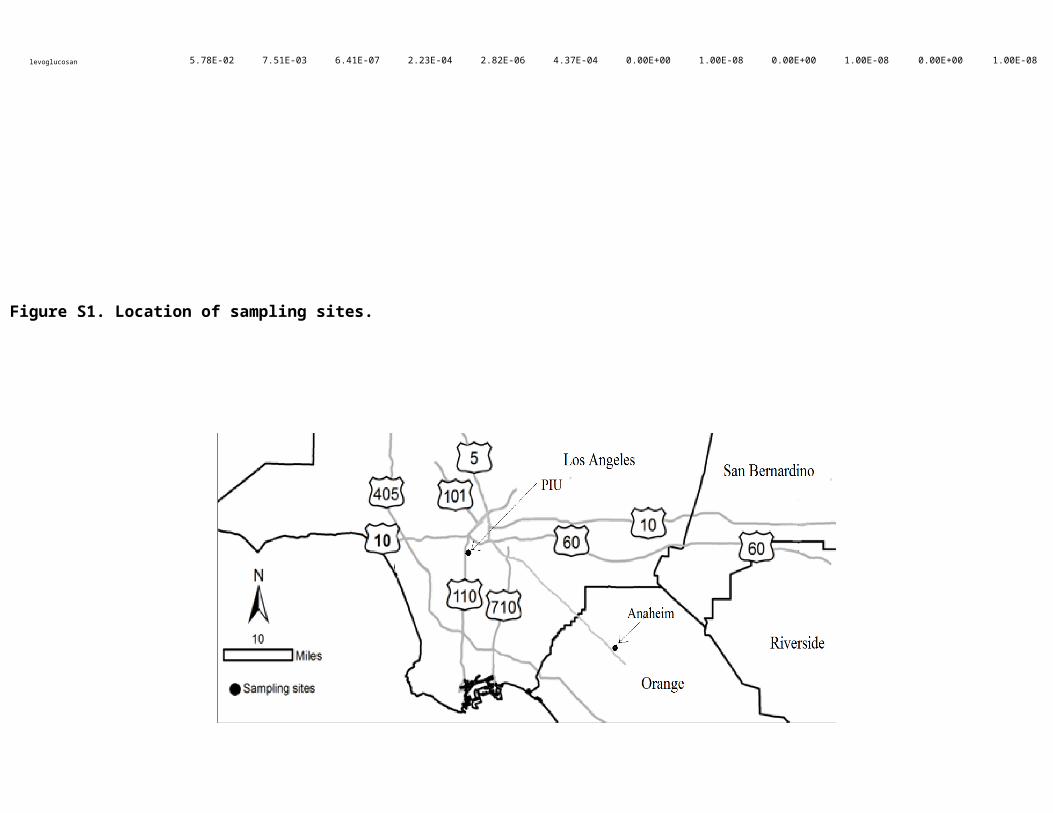
Figure S5. Wood smoke source apportionment sensitivity analysis between traditional and Hybrid model for PM2.5 and PM0.18 in a) Central Los Angeles and b) Anaheim. Error bars correspond to one standard deviation. Error bar for October 2013 is missing as the concentrations correspond to only one sample. For the scatter plots, weekly source contributions from both sites were combined together.
a) Central LA b) Anaheim
0 0.5 1 1.50
0.2
0.4
0.6
0.8
1
1.2
1.4
f(x) = 0.703703977368266 x − 0.0240389820924768R² = 0.972628136564318
PM0.18
Hybrid source profiles (µg/m3)
Trad
ition
also
urce
pro
files
(µg/
m3)
Jul 2
01
3
Aug
201
3
Sep
201
3
Oct
20
13
Nov
201
3
Dec
201
3
Jan
201
4
Feb
20
14
0
0.5
1
1.5
2
2.5
3
3.5
PM2.5
OC
co
nce
ntr
atio
n (µ
g/m
3)
Jul 2
012
Aug
2012
Sep
2012
Oct
201
2
Nov
201
2
Dec
2012
Jan
2013
Feb
2013
00.20.40.60.8
11.21.41.61.8
2
PM2.5
Hybrid source profiles Traditional source profiles
OC
conc
entr
ation
(µg/
m3) Ju
l 20
12
Au
g 2
01
2
Sep
20
12
Oct
20
12
No
v 2
01
2
Dec
20
12
Jan
20
13
Feb
20
130
0.2
0.4
0.6PM0.18
OC
Co
nce
ntr
atio
n (µ
g/m
3)
Jul 2
013
Aug
201
3
Sep
2013
Oct
201
3
Nov
201
3
Dec
201
3
Jan
2014
Feb
2014
00.20.40.60.8
11.21.41.61.8
2
PM2.5
OC
Co
nce
ntr
atio
n (µ
g/m
3)
Jul 2
01
3
Au
g 2
01
3
Sep
20
13
Oct
20
13
No
v 2
01
3
Dec
20
13
Jan
20
14
Feb
20
140
0.1
0.2
0.3
0.4
0.5
0.6
0.7
0.8PM0.18
OC
Co
nce
ntr
atio
n (µ
g/m
3)
0 0.5 1 1.5 2 2.5 3 3.5 40
0.5
1
1.5
2
2.5
3
3.5
4
f(x) = 0.772400793684885 x − 0.0866709137242709R² = 0.963075375040029
PM2.5
Hybrid source profiles (µg/m3)
Trad
ition
alsou
rce p
rofil
es (µ
g/m
3)
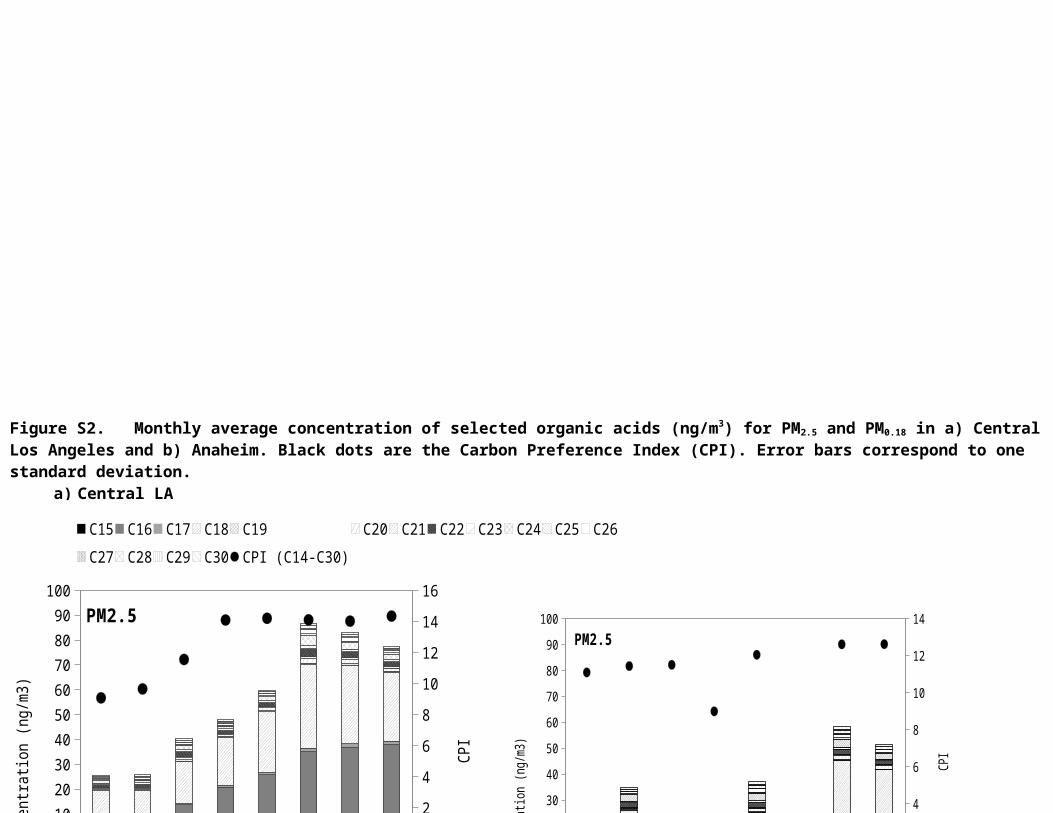
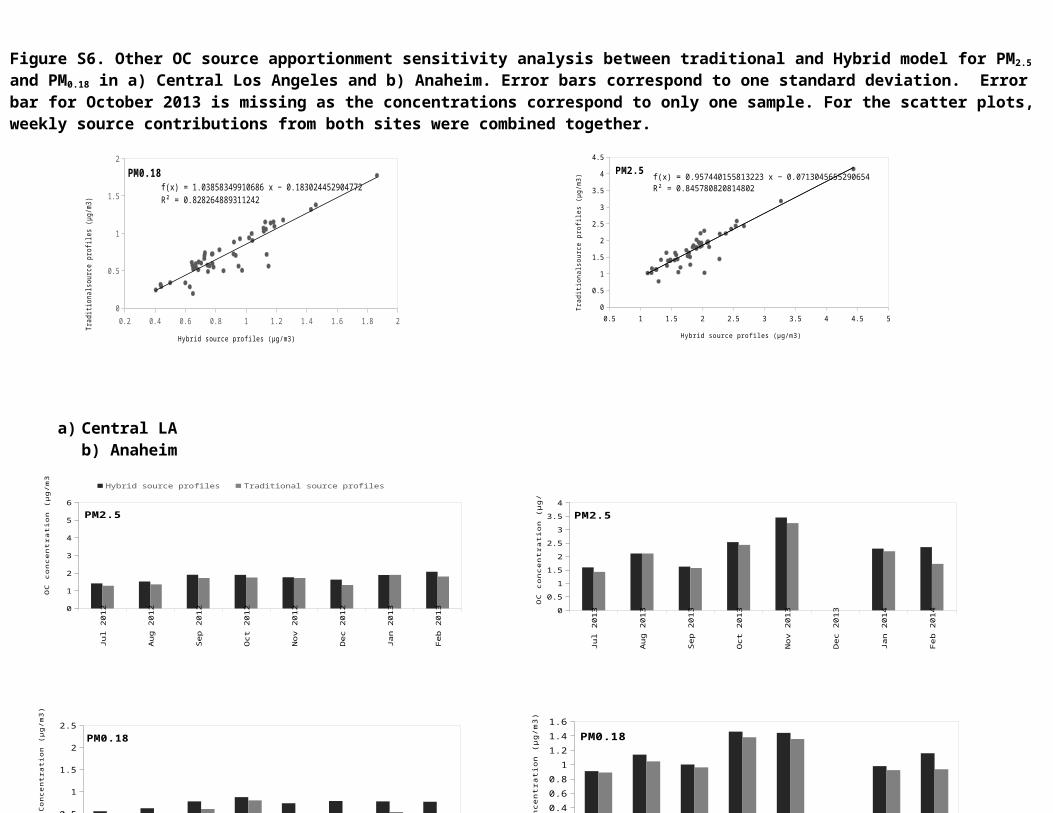
Figure S6. Other OC source apportionment sensitivity analysis between traditional and Hybrid model for PM2.5 and PM0.18 in a) Central Los Angeles and b) Anaheim. Error bars correspond to one standard deviation. Error bar for October 2013 is missing as the concentrations correspond to only one sample. For the scatter plots, weekly source contributions from both sites were combined together.
a) Central LA b) Anaheim
Jul 2
012
Aug
2012
Sep
2012
Oct
201
2
Nov
2012
Dec 2
012
Jan
2013
Feb
2013
0
0.5
1
1.5
2
2.5PM0.18
OC
Conc
entr
ation
(µg/
m3)
Jul 2
013
Aug
201
3
Sep
2013
Oct
201
3
Nov
201
3
Dec
201
3
Jan
2014
Feb
2014
0
0.5
1
1.5
2
2.5
3
3.5
4PM2.5
OC
co
nce
ntr
atio
n (µ
g/m
3)
Jul 2
01
2
Aug
20
12
Sep
2012
Oct
201
2
No
v 2
012
Dec
20
12
Jan
2013
Feb
2013
0
1
2
3
4
5
6PM2.5
Hybrid source profiles Traditional source profiles
OC
co
nce
ntr
atio
n (µ
g/m
3)
0.2 0.4 0.6 0.8 1 1.2 1.4 1.6 1.8 20
0.5
1
1.5
2
f(x) = 1.03858349910686 x − 0.183024452904772R² = 0.828264889311242
PM0.18
Hybrid source profiles (µg/m3)
Trad
ition
alsou
rce p
rofil
es (µ
g/m
3)
0.5 1 1.5 2 2.5 3 3.5 4 4.5 50
0.5
1
1.5
2
2.5
3
3.5
4
4.5
f(x) = 0.957440155813224 x − 0.0713045655290654R² = 0.845780820814802
PM2.5
Hybrid source profiles (µg/m3)
Trad
ition
also
urce
pro
files
(µg/
m3)
Jul 2
01
2
Au
g 2
01
2
Sep
20
12
Oct
20
12
No
v 2
01
2
Dec
20
12
Jan
20
13
Feb
20
130
0.2
0.4
0.6
0.8PM0.18
OC
Co
nce
ntr
atio
n (µ
g/m
3)
Jul 2
013
Au
g 20
13
Sep
20
13
Oct
201
3
Nov
201
3
Dec
20
13
Jan
201
4
Feb
20
14
0
0.2
0.4
0.6
0.8
1
1.2PM0.18
OC
Co
nce
ntr
atio
n (µ
g/m
3)

Jul 2
013
Aug
201
3
Sep
2013
Oct
201
3
Nov
201
3
Dec
201
3
Jan
2014
Feb
2014
0
0.2
0.4
0.6
0.8
1
1.2
1.4
1.6PM0.18
OC
Co
nce
ntr
atio
n (µ
g/m
3)
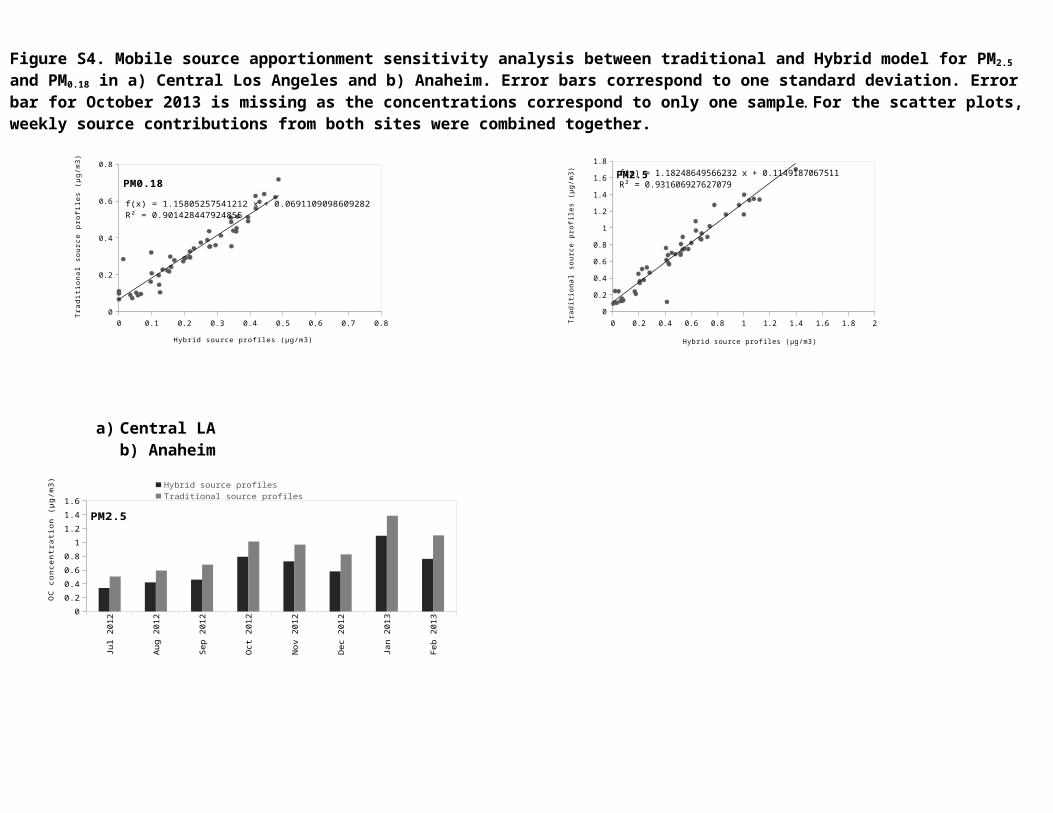
Figure S7. Box plots of PM2.5 mass concentrations (µg/m3) between July 2012- February 2013 by MOUDI sampling (current study) and parallel BAM sampling continuous measurement at Central LA. Black dots correspond to the 5th and 95th percentiles.
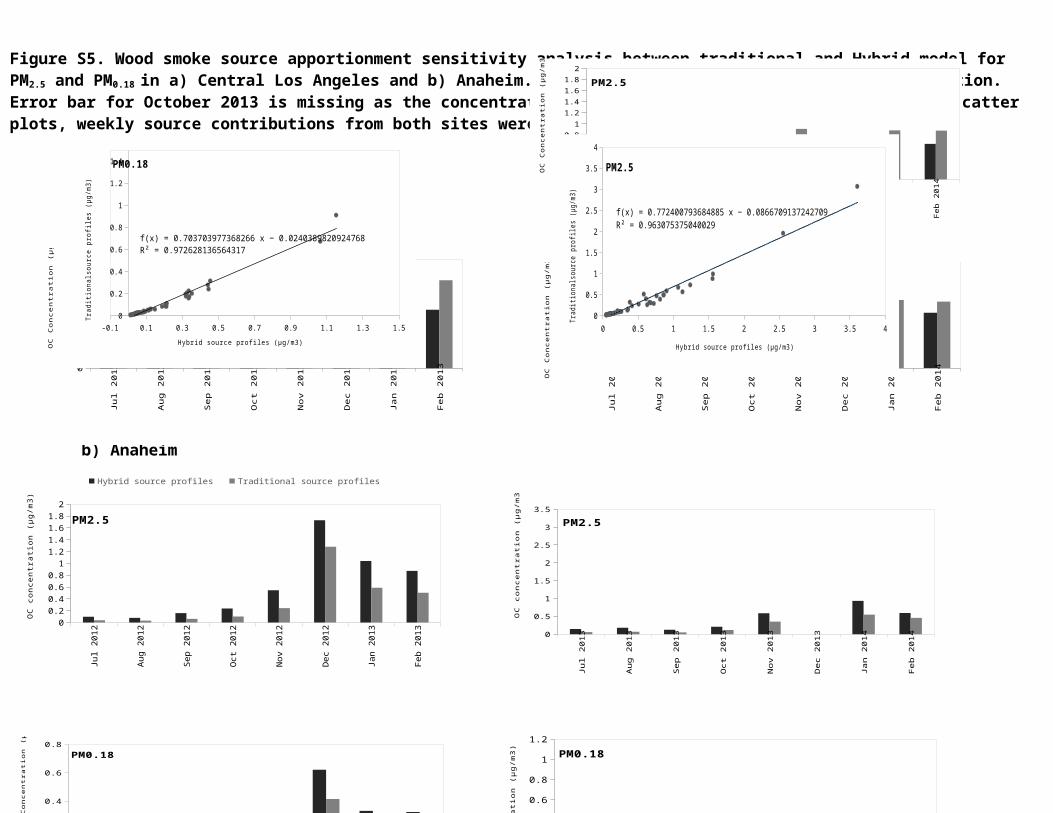
Figure S8. Box plots of PM0.18 mass concentrations (µg/m3) between November 2012- February 2013 of MOUDI sampling measurements (current study) and PM0.18 mass concentration calculated from volume size distribution obtained from SPMS at Central LA. Black dots correspond to the 5th and 95th
percentiles.
Comparison of Micro-Orifice Uniform Deposit Impactors (MOUDI) sampling to continuous measurements.
We do acknowledge the possibility of partial volatilization of organic compounds during the sampling, but we believe that this is probably not a major issue in our study given the specific sampling procedure and the selection of fitting species for the MM-CMB model. Regarding the collection efficiency of the MOUDI, we should point out that only 2 out of 8 collection stages were used in this study. As a result, the measured pressure drop across the MOUDI operating with these two stages (i.e. 2.5 and 0.18 µm) was approximately 17 kPa, while the nominal pressure drop across a MOUDI with all of stages is 30 kPa (Marple et al., 1991). This lower pressure drop likely reduces the chances of evaporation of organic compounds.
We compared MOUDI’s PM2.5 mass concentrations with continuous (hourly) measurements of ambient PM2.5 data (measured by a Beta Attenuation Monitor (BAM 1020; Met One Instruments)) running in parallel (Figure S7). Our comparison indicated that the median PM2.5 mass concentration measured by MOUDI is lower by about 15% than that measured by BAM, and a Mann-Whitney Rank Sum test indicated that the difference between the concentrations measured by the two instruments approaches significance (p = 0.08). Part of the lower MOUDI concentrations can be attributed to internal wall losses inside the impactor (of at least 5-10%), as reported by Cabada et al. (2004) and Marple et al. (1991) while the rest is probably a result of some volatilization of labile species from the MOUDI stages. These relatively small evaporative losses in the MOUDI do not affect our overall discussion, considering that we used only chemicals that should be mostly or completely in the particle phase in our source apportionment analysis. Moreover, the relatively lower PM2.5 MOUDI concentrations probably rule out substantial particle bouncing from the upper MOUDI stages, as this process would increase rather than decrease the PM2.5 concentrations.
In addition to the PM2.5 comparison, PM0.18 mass concentrations were compared to those determined through continuous (hourly) measurement of ambient size distributions by means of a Scanning Mobility Particle Sizer (SMPS, Model 3081; TSI Inc., St. Paul, MN) running in parallel with MOUDI filter sampling at the same sampling site between Nov 2012- Feb 2013 (Figure S8). Volume size distributions determined by the SMPS were integrated up to 0.18 µm and PM 0.18 mass concentration was estimated by converting the volume to mass concentration, assuming an apparent density of 1.2 g/cm3 (based on the study by Hasheminassab et al., 2014). As shown in Figure b, the median value of MOUDI sampling (2.3 µg/m3) is very comparable to the median value of SMPS data (2.5 µg/m3) and there is no statistically significant difference between the two sampling methods (p = 0.7). Evaporative losses of semi-volatile PM species would probably be higher in the MOUDI after-filter collecting PM0.18 because of the higher pressure drop across that final MOUDI stage. Based on the above comparisons and discussion, we believe that evaporative losses of semi-volatile organics from either impactor stages or the MOUDI after filter, while possible, do not create a substantial bias in the reported mass concentrations and certainly do not affect our source apportionment analysis.

Reference:
Cabada, J.C., Rees, S., Takahama, S., Khlystov, A., Pandis, S.N., Davidson, C.I., Robinson, A.L., 2004. Mass size distributions and size resolved chemical composition of fine particulate matter at the Pittsburgh supersite. Atmos. Environ., Findings from EPA’s Particulate Matter Supersites Program 38, 3127–3141. doi:10.1016/j.atmosenv.2004.03.004
Hasheminassab, S., Pakbin, P., Delfino, R.J., Schauer, J.J., Sioutas, C., 2014. Diurnal and seasonal trends in the apparent density of ambient fine and coarse particles in Los Angeles. Environ. Pollut. 187, 1–9.
Marple, V.A., Rubow, K.L., Behm, S.M., 1991. A Microorifice Uniform Deposit Impactor (MOUDI): Description, Calibration, and Use. Aerosol Sci. Technol. 14, 434–446. doi:10.1080/02786829108959504