art as an alternative asset class: risk and return ... · pdf fileno. 494 . roman kräussl...
TRANSCRIPT

No. 494
Roman Kräussl
Art as an Alternative Asset Class: Risk and Return Characteristics of the Middle Eastern & Northern African Art Markets

Electronic copy available at: http://ssrn.com/abstract=2518131
Art as an Alternative Asset Class: Risk and Return Characteristics of
the Middle Eastern & Northern African Art Markets1
Roman Kräussl
Luxembourg School of Finance
June 2014
Abstract
This chapter analyzes the risk and return characteristics of investments in artists from the Middle East and Northern Africa (MENA) region over the sample period 2000 to 2012. With hedonic regression modeling we create an annual index that is based on 3,544 paintings created by 663 MENA artists. Our empirical results prove that investing in such a hypothetical index provides strong financial returns. While the results show an exponential growth in sales since 2006, the geometric annual return of the MENA art index is a stable13.9 percent over the whole period. We conclude that investing in MENA paintings would have been profitable but also note that we examined the performance of an emerging art market that has only seen an upward trend without any correction, yet. Keywords: Alternative investments, Art price index, Optimal Asset Allocation JEL Code: G11, Z11
1 You can reach Dr. Roman Kräussl at the Luxembourg School of Finance via [email protected] and via the website www.art-finance.com. I would like to thank Maaike Hofstra for excellent research assistance, Blouin Art Sales Index (BASI) for providing the data, Sarah P. Hanson and Sehba Mohammad at Art + Auction as well as Ali NasserEdine for fruitful discussions.
1
I. Introduction
The year 2011 has seen important political developments in the Middle East and North Africa
(MENA) region. A wave of popular protests, demanding more social equity and stronger
economic development has led to political change at an unprecedented and unexpected scale.
Social unrest affected many countries, but the degree of resulting political change varied across
the region. Protests triggered economic, social, and political reforms in a number of countries,
and culminated in the resignation of ruling presidents in Tunisia and Egypt, and a forceful regime
change in Libya. While these events have contributed to uncertainty in the short-term, they
hopefully present great promise for the future development of the region as a whole.
Despite the political and social developments in the MENA region, the economies of many
MENA countries have continued to grow substantially. When most regions of the world were
affected by the recent global financial crisis, Qatar has become one of the fastest growing
economies in the world. The Qatari economy grew by 18.8% in real terms in 2011, while other
Islamic countries’ economies like Morocco, Saudi Arabia, and Turkey were also booming
(International Monetary Fund, 2012). Capgemini and Merrill Lynch (2011) note in their World
Wealth Report that the size of the high-net-worth individuals (HNWIs)2 population in the Middle
East gained 10.4 percent in 2010 to 0.4 million, while their wealth jumped in a single year by
12.5 percent to USD 1.7 trillion. These individuals want to invest a portion of their wealth in
alternative investments like art and in particular in art of their own heritage (Citi Private Bank,
2012). This might imply that lagging the booming economy of the MENA region, its art market
will follow, and new HNWIs will spend portion of their wealth on their culture’s art. According
to Capgemini and Merrill Lynch (2011), art accounted for 22 percent of passion investments
globally.3 Moreover, art is most likely to be seen as a financial investment vehicle. In fact, 42
percent of advisors interviewed in the Capgemini and Merrill Lynch (2011) survey believe that
their HNWI clients invest in art primarily for its potential to gain value.
The global art market has experienced an extraordinary growth over the last years. The year
2011 was the most prolific year ever recorded for the global art market. Whereas the S&P 500
closed the year 1% down with an 18% drop between July and October, the art market posted a
15% increase in revenue (Artprice, 2012). As a result, the international market grew dramatically
during this time, from less than $150 million in 1970 to $60.8 billion in 2011 (Renneboog and
2 HNWIs are defined as those having investable assets of US$1 million or more, excluding primary
residence, collectibles, consumables, and consumer durables. 3 Investments of passion are luxury collectibles (e.g. luxury automobiles, boats, jets), art, jewelry, gems and
watches, along with other collectibles (e.g. wine, antiques, coins, memorabilia), and sports investments.
2
van Houtte, 2000; Artprice, 2012). At the origin of this growth is the vast global increase in the
demand for art. Indeed, a new generation of buyers, both private and institutional, attracted by the
potential of generating high returns and ability to use art as a mean of diversifying investment
portfolios because of its low correlations with other asset classes, has come into the art market
(Bruno and Nocera, 2008). Moreover, other non-financial motivations such as status, leisure,
being part of the art world, have played a prominent role as well (Capgemini and Merrill Lynch,
2011).
Since Christie’s 2006 inaugural sale in Dubai, the Middle Eastern art market has become a
regular feature in the international auction calendar with auction sales increasing from USD 1.7
million in 2006 to USD 29.8 million in 2010 (Artprice, 2012). Investments in large museum
infrastructure in Qatar and Abu Dhabi have raised the profile regionally and internationally
(Lawrie, 2008). Dubai and Abu Dhabi art fairs have played key roles in educating and generating
interest in art investment in the region. As the Middle Eastern art market expands, and the interest
in art as an asset class develops, art investment funds could potentially be an attractive addition to
the current range of Shari’ah compliant alternative investment products (Deloitte, 2011; Hayat
and Kräussl, 2011). Moreover, the appetite for Contemporary Arab art outside the Middle East is
stimulated by a strong presence at major cultural meetings and exhibitions, the development of
specialized acquisition committees at major art museums like the Tate Modern, the British
Museum and the Guggenheim, and by other major events devoted to art from the region such as
the exhibition dedicated to Turkish art at Saatchi in 2011 (Artprice, 2012).
These developments are partly driven by the interest for opening and establishing new
museums, fairs and galleries, which are expanding in the Middle East since 2006 with the first
edition of Art Dubai and opening of Christie’s Dubai (Deloitte, 2011). In Dubai, there were only
five art galleries a decade ago, while currently there are 85. For example, both the Museum of
Middle East Modern Art (MOMEMA) in Dubai and the Museum of Islamic Art (MIA) were
opened in 2008, while 2010 had seen the opening of the Arab Museum of Modern Art in Doha
(Amirsadeghi and Eisler, 2010). Nowadays, there are art fairs in Beirut, Morocco, Dubai and Abu
Dhabi. In addition to the Middle Eastern countries, some of the world’s leading museums, such as
Guggenheim, the Louvre and the British Museum have built separate Islamic Art wings.
Guggenheim is also building a franchise in Abu Dhabi that will focus on contemporary art of the
Middle East.
In recent years, numerous papers have examined the financial characteristics of the art
markets (see, e.g., Renneboog and Spaenjers, 2013). However, aside from Kräussl and Logher,
(2010) little attention has been paid to the risk and return characteristics of emerging art markets
3

such as fine art from countries within the MENA region. To our knowledge, the only paper
dedicated to the performance of MENA art is Seckin and Atukeren (2006) who construct a
hedonic price index and finds that the art market in Turkey is driven by economic fundamentals.
They examine the performance of investments in art compared to those in stocks, foreign
exchange, gold, and bank deposits over the period 1989 to 2005. They find that investing in
paintings by Turkish artists is a viable alternative to conventional investments, especially in an
emerging market, i.e., in an environment of high inflation, macroeconomic volatility, and political
uncertainty.
This chapter will close the gap in the literature and provide the first extensive financial
analysis of the MENA art world. In particular we analyze the risk and return characteristics of
investments in artworks by artists from the MENA region over the sample period 2000 to 2012.
By using hedonic regression modeling techniques, we create an annual index that is based on
3,544 paintings, created by 663 MENA artists, and sold by international auction houses
worldwide. Our empirical results prove that investing in an index of MENA artists provides
strong returns. While the results show an exponential growth in sales since 2006, the geometric
annual return of the MENA index is 13.9 percent over the whole period. We find that investing in
MENA paintings would have been profitable but it is important to note that we have examined
the performance of an emerging art market that has only seen an upward trend without any
correction, yet.
The remainder of this chapter is organized as follows. Section 2 presents the sample
underlying our MENA art index and discusses the methodology. Section 3 introduces the
constructed MENA art index, analyzes the risk and return characteristics of this index, and
investigates within an optimal asset allocation framework whether investing in MENA art is a
good investment. Section 4 concludes and presents an outlook on the MENA art markets.
II. Data and Methodology
According to the International Monetary Fund (2012), the MENA region comprises the following
countries: Algeria, Bahrain, Djibouti, Egypt, Iran, Iraq, Jordan, Kuwait, Lebanon, Libya,
Mauritania, Morocco, Oman, Qatar, Saudi Arabia, Sudan, Syria, Tunisia, United Arab Emirates,
and Yemen. We have added Turkey to this list. All data on MENA artists is obtained from Blouin
Art Sales Index (BASI).4 We only consider paintings sold at auctions. As a starting point, a list of
4 As a robustness check both databases of Artnet (www.artnet.com) and Artprice (www.artprice.com) were consulted to check whether an artist auctioned additional paintings that are not covered by BASI and to conduct more information.
4

all painters qualified for the MENA regional criteria is created. Then, all relevant information
about the artist such as date of birth, day of death, and nationality is collected. Thereafter, all
paintings that were sold or bought-in are compiled. Each auction record is accompanied with the
following features regarding the individual painting: title, surface, sales price converted to USD,
whether the artwork is signed or not, name of the auction house, medium and material used, and
sale date. Only records that have at least these features are included in the dataset.
Our final sample contains 663 individual artists from the MENA region who had 3,544
paintings sold over the period 2000 to 2012 in 59 different auction houses. We observe a total
auction turnover of over $155 million with an average price for a painting of $43,736. The
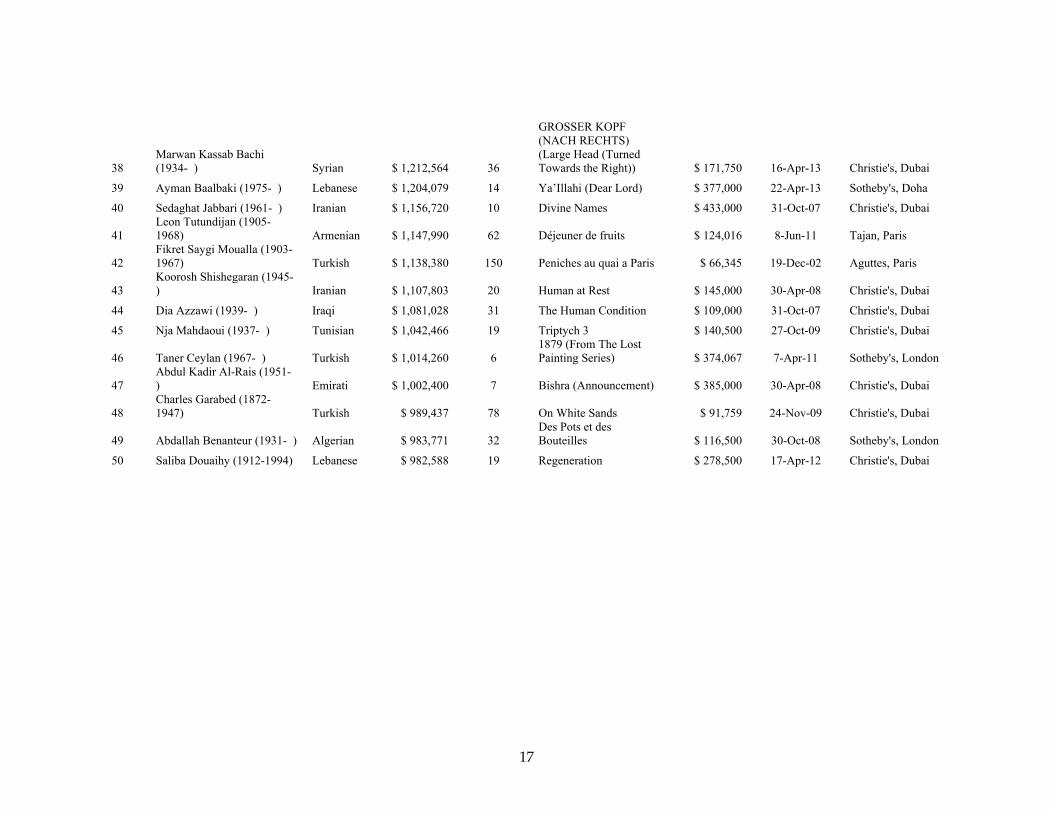
average number of sales per year is 273. Figure 1 indicates that Turkish artists had the maximum
number of sales during the period under review. With 814 paintings, they accounted for nearly a
quarter of the segment’s total volume. When it comes to turnover, however, the Iranians and
Egyptians paintings, with 650 and 476 auction sales respectively, both represented larger
percentages of sales by USD turnover. This implies that the average Iranian or Egyptian painting
is more expensive than the Turkish one.
Figure 2 shows a summary of the auction houses with most frequent sales in our dataset,
accompanied with the number of paintings they had sold. We observe that Christie’s Dubai
auctioned with 988 sales the highest number of paintings from MENA artists, but the major part
is still auctioned in Western countries, especially in Europe. Sotheby’s London auctioned the
most expensive piece of art in our sample, which is an oil on canvas painting created by the
Turkish artist Osman Handy-Bey and titled “A Lady of Constantinople”, for over $5.5 million.
Figure 3 shows a summary of the different mediums used in the MENA database for the same
period, along with the percentage of paintings for each medium. We see that within the sample of
MENA artworks, more than 46% (1,644 pieces) of the auction sales were oil on canvas paintings.
As it can be observed from the figure, the other most commonly used mediums in the dataset are
mixed media (on canvas), oil on panel, and acrylic (on canvas).
Figure 4 shows that most of the auctioned MENA artworks seem to have been sold for
reasonable prices, with 70 percent of them sold for below $50,000. Just a small number of
artworks (34 in total, less than 1%) fetched prices above $500,000 in the period under study.
Table 1 presents the top 50 artists by USD turnover in our MENA database.5 The total USD
turnover of the artist is represented in the fourth column, while column five shows the total
5 We note here that data provided by Artnet or Artprice deliver a slightly different ranking of the top 50 MENA painters.
5

number of sold paintings. Table 1 also illustrates the record sale for each artist.
Art markets differ substantially from financial markets, and this potentially limits the strict
applicability of well-known financial techniques. Investing in art requires typically an extensive
knowledge of art and its market, and a substantial amount of capital to acquire the work of
famous artists. The market is highly segmented and dominated by few large auction houses, and
only a small number of artworks are presented for sale throughout the year. Art investment comes
with risk, deriving from both the physical risk of fire and theft, and the possibility of reattribution
to a different artist. As a result, the cost of insurance can be prohibitive. While auction prices
represent the value of art works, it comes with a complex and subjective set of beliefs that is
based on past, present and future prices, and individual tastes and fashion.
Paintings are heterogeneous assets and a variety of physical and non-physical characteristics
contribute to the uniqueness of each one. To construct our MENA art index, we follow standard
hedonic modeling to separate the characteristics that determine the price of a painting (see
Kräussl, 2010). The dependent variable in our hedonic model is the natural logarithm of the sale
price in USD. The independent variables used in our model describe the following characteristics:
medium, auction house, surface, signature, estimate price, living status, artist reputation, and date
of sale. A major disadvantage that comes with the regression of the hedonic pricing model is
multicollinearity. A high correlation between the considered variables increases the standard error
of the regression coefficients. In order to overcome the problem of multicollinearity, each dummy
variable contains a reference variable, which is deleted from the sample.
Sales date: These dummy variables are based on the sales date of the paintings. Each dummy
variable represents one year starting from 2000 to 2012. A value of one indicates the painting is
created in period t using the MENA art index.
Country of origin: As illustrated in Figure 1, most of the paintings in our dataset were created
by artists with Turkish nationality and additionally, whose paintings are highly valued. Hence,
Turkey will be used as the reference variable, thereby expecting that most other country dummies
will show negative coefficients, except for Egyptian and Iranian art, since they are highly valued
as well.
Auction house: According to de la Barre et al. (1994) the more renowned auction houses have
a positive significant effect on the price of a painting. They reason that the more established and
famous auction houses will offer the ‘best’ work, while the less familiar and smaller auction
houses will have less quality paintings (see also, Renneboog and Spaenjers (2013)). Figure 2
shows the most common auction houses in our sample. We assign those auction houses a separate
dummy variable, i.e., a dummy’s value of one indicates that the painting was auctioned by one of
6

these leading auction houses: Christie’s Dubai and Sotheby’s London. We expect that the
coefficient estimates will have a positive sign, assuming that the better and more expensive artists
(paintings) will be auctioned by these auction houses.
Medium: We know from the seminal art market literature that oil on canvas is the most used
material by painters and has the highest sales prices (de la Barre et al., 1994; Kräussl, 2010).
Figure 3 shows that this statement is shared, since the MENA sample shows that more than 46%
of the paintings sold at auction are oil on canvas. Therefore we will specify oil on canvas as the
reference variable in our hedonic regression model; we assign other mediums, such as oil on
panel a separate dummy variable. The dummy Dit will have a value of one, when one of the
dummies has the appointed medium. We expect negative coefficient estimates since the reference
variable oil on canvas is assumed to fetch the highest prices.
Surface: The variable surface explains the impact of the size of a painting and is calculated as
the width multiplied by the height of the painting. These continuous surface values are logged in
the hedonic regression model.
Signature: Anderson (1974) explains that the strength of the attribution towards the painter is
a significant feature of the sales price. Paintings who are signed by the painter are more expensive
than unsigned pieces. A dummy value of one indicates that the artist did not sign the painting. We
expect that signed paintings are more valuable than unsigned painters and will thereby have
positive coefficients.
To make use of our time dummy variables and to perform an OLS regression on the pooled
data from all available sales, we construct the following hedonic regression model:
),0(~ ln 2
01
NDxPt
itittj
ijjit
, (1)
where Pit represents the price of painting i at time t, α is the regression intercept, βj is the
coefficient value of quality characteristic x, Xij is the quality characteristic value of the painting,
the antilog of λt reflects the coefficient value for the time dummy, and Dit represents the time
dummy variable, which has the value of one when the painting was sold in the considered time
period t.
The estimated coefficients on the time dummies, i.e., the outcome from the hedonic
regression model, are used to create the MENA art price index over the period 2000 to 2012. The
MENA art index is computed using the following equation:
)(
)( 11
t
tt YExp
YExpIndex
. (2)
7
The antilog (or exponential) of the sequence of time dummies is taken. We set the first year,
i.e., the base year to 100 and compute the relative changes to this base year for the next years.
Hence, the MENA art price index is conducted.
III. Risk and Return Characteristics of the MENA Art Index
Figure 5 shows the development of the MENA art index we created over the period 2000 to 2012.
This index is based on more than 3,544 artworks created by 663 Middle Eastern and North
African artists. Their works were sold at 59 different international auction houses and fetched
more than $155 million.
In unreported results, the hedonic regression analyses show that, as expected, far-famed
auction houses, surface and living status of the painter have a huge impact on the price of a
painting and thereby supporting the findings of previous studies. Paintings from Iranian artists are
more valuable than paintings from any other Islamic countries in the MENA region.
The segment “art of the MENA region” is one of the international auction world’s most
recent creations. Figure 5 indicates that the first five years show little variation in the sales
volume and the index climbs to just 154, representing a healthy but modest return on investment.
In the following seven years, the index soared fourfold, and the number of lots sold annually grew
from 87 to 580, representing a growth of nearly sevenfold. Despite the global financial crisis of
2008 the MENA art index steadily (even exponentially) grew from 256 in 2008 to 565 at the end
of 2012. These empirical findings demonstrate very strong and solid growth. The geometric
annual return of the MENA art price index for the period 2000 to 2012 is 13.9 percent,
representing an extremely positive return.6
To determine whether MENA art is a worthy investment and not to get blinded by the high
13.9 percent p.a., the risk and return characteristics needs to be compared with other asset classes.
Previous research had already looked into the performance of art investments and its eligibility of
inclusion in an optimal portfolio. Baumol (1986) finds that art prices behave randomly, and stock
markets perform much better. Goetzmann (1993) finds a positive correlation with equity and an
upward price trend prices over the years. Pesando (1993) concludes that art market returns are
inferior to those of stocks, bonds and T-bills. Mei and Moses (2002) find that art underperforms
stocks but outperforms fixed-income securities and can be a useful tool for portfolio
diversification.
6 Common art market return estimates are ranging between 5% and 10% for different styles such as Old Masters and Contemporary over the last decade. See the website www.art-finance.com for a number of available art market indices.
8

We obtain daily returns from Datastream for the following asset classes: the MSCI World
index as a proxy for the global equity returns, the Citigroup World Government Bond index
(WGBI) for government bonds, the Merrill Lynch US Corporate Master Bond index for corporate
bonds, the Datastream World Real Estate index as a proxy for the global real estate market, the
GSCI Commodity index for international commodities, the DJ Credit Suisse Hedge index is used
to measure hedge funds returns, and private equity returns are proxied by the LPX50. We use the
three-month Treasury bills as the risk-free rate.
In order to measure whether investing in the MENA art index would yield diversification
benefits, we construct in the following an optimal portfolio. The framework we use to calculate
the optimal assets allocation is based on the standard Markowitz (1952) mean-variance
optimization approach:
wwRiwREwMax fw '
2)'1(]['
, (3)
where is the expected portfolio return on the assets calculated on portfolio weight w, ][' REw
2
is the investor’s risk aversion parameter, and ww ' is the covariance matrix of the asset
returns. We do not allow short selling and all individual weights sum up to one. We specify and
investigate three different risk aversion parameters, namely λ = 1, 2, and 10, where one denotes
an investor with a low level of risk aversion, and λ = 10 indicates that the investor is highly risk
averse (and should probably not invest at all in volatile asset classes).
Table 2 provides the descriptive statistics of our constructed MENA art index and the other
asset classes. The geometric average return of the MENA index shows 8.9% and has thereby the
second best return after government bonds during the years 2000 to 2012. Notable is the
geometric average return of real estate at -2.0%, which indicates that over the last 13 years real
estate investments yielded negative returns. With a standard deviation of 0.315, the MENA art
index is a less volatile investment than private equity (0.433) and shows a higher return over the
sample period. When looking at the risk and return characteristics, investing in MENA art seems
to be a better investment than investing in private equity, which is also supported by the Sharpe
Ratios: for private equity we observe a Sharpe Ratio of only 0.527, while the corresponding one
for the MENA art index is, with 2.387, substantially higher. Corporate and government bonds
show a higher Sharpe Ratio, which indicates that the return compensates the risk-taken and that
both bond classes perform better than art. This also holds for hedge funds. Table 2 proves that
according to its Sharpe Ratio, MENA art investments have strongly outperformed public equity,
9

private equity, real estate, and commodities, but slightly underperformed hedge funds and
corporate bonds, while government bonds had the best performance over the studied period.
In a second step we are going to measure the risk and return characteristics of each index
separately using the single-index CAPM model. The regression results are shown in Table 3. The
second column presents the estimated α coefficient for the different asset class indices. A positive
α indicates an abnormal (positive) return and therefore the asset class should have a higher weight
in an optimal, well-diversified portfolio. On the other hand, a negative α coefficient indicates that
the index is overpriced and should have less weight in the portfolio. When looking at Table 3,
both corporate bonds and government bonds have a negative α coefficient. On the contrary, the
MENA art index shows the highest α coefficient of 0.096, which indicates that MENA art
investments earn an abnormal return that is not attributed to systemic risk. However, we have to
be careful in drawing conclusions out of these findings since none of these CAPM regression
results for α are statistically significant.
The fourth column of Table 3 shows that we find the MENA art index has a very high and
positive β coefficient of 1.103 over the period 2000 to 2012, which is significant at 1%. Our
constructed MENA art index does not only move in the same direction as public equity but also
present more systemic risk than MSCI World Equity index. Despite the highest Treynor Ratio of
all asset classes considered, these findings imply that art investments in the MENA region are not
an interesting alternative to hedge returns of global equity.
Nevertheless, MENA art can be an interesting asset to diversify an optimal portfolio. In a
final step we therefore construct an optimal asset allocation. The pair-wise correlation matrix in
Table 4 is calculated and used to construct the optimal asset allocation. The constructed portfolio
for the optimal asset allocation includes all other asset classes accompanied with the MENA art
index and evaluates for different levels of investor’s risk aversion. Panel A of Table 5 presents
the optimal asset allocation for λ = 1, 5, and 10, respectively. We observe that MENA art
investments would be included in all optimal, well-diversified portfolios. We also see that the
highly risk-averse investors (λ = 10) almost invest in government bonds only. This finding is in
line with the standard finance literature, which states that government bonds are among the safest
investments. On the contrary, investors with a low risk aversion (λ = 1) should invest 65.6% in
the MENA index and only 34.4% in government bonds. For investors with a risk aversion level of
two, the results are vice versa.
It is remarkable that no other asset class would be included in our optimal portfolios, neither
for low nor for high levels of risk aversion. However, we note here once again that both asset
classes, MENA art and government bonds showed over the period 2000 to 2012 extremely strong
10

returns, i.e., the non-inclusion of any other asset class in an optimal portfolio of a mean-variance
investor is surprising, but only at first sight. Panel B of Table 5 presents the optimal asset
allocation exercise for the same risk aversion constraints, but additionally we restrict the classical
mean-variance optimizing investor to not include more than 30% of one asset class in her
portfolio. The results show more diversification between the assets but almost no changes in the
optimal asset allocation for risk aversion levels of one or two. Only for the highly risk averse
investors (λ = 10) we observe some variation between the different asset classes. Interestingly, we
observe once again that public equity would have received zero weights for any level of risk
aversion, even in the 30% restricted scenario. We clearly observe here the impact of the “lost
decade” of public equity during our sample period between 2000 and 2012.
Summarizing our empirical analysis of the risk and return characteristics of the MENA art
index, we can conclude that investing in MENA art, i.e., including it in our optimal, well-
diversified portfolio would have been profitable, and wise decision. We note that this is mostly
due to the fact that, in our scope of research, we examined the performance of an emerging art
market that has only seen an upward trend without any correction, yet.
IV. Outlook
The language of contemporary art is global, and collectors are increasingly interested in seeing
differences in dialogue. Diversity is the other big trend in terms of geography as well as in the
individual artists’ practices. Today, artists may be born in the Middle East, live in Europe, and
sell to collectors in Asia and America (Sloman, 2009). Since Christie’s 2006 inaugurated annual
auctions in Dubai, the market for Post-war and Contemporary art of the MENA region has grown
at a staggering rate. Additionally, with the regional presence of other international leading auction
houses such as Sotheby’s in Doha and Bonhams in Dubai, the market has started to mature and
come into focus.
Moreover, large museum infrastructure investments in Qatar and Abu Dhabi has raised the
profile in the region and internationally. The Dubai and Abu Dhabi art fairs have played key roles
in educating and generating interest in art buying and investment in the region. As the MENA art
market expands, and the interest in art as an asset class develops, art investment funds could
potentially be an attractive addition to the current range of Shari’ah compliant alternative
investment products (Deloitte, 2011). Also outside the MENA region, the appetite for MENA
artworks is stimulated by a strong presence at major cultural meetings due to exhibitions and by
the development of specialized acquisition committees at major art museums like the Tate
11
Modern, the British Museum and the Guggenheim, as well as by other major events such as the
exhibition dedicated to Turkish art at Saatchi in 2011.
This chapter is the first thorough quantitative analysis of the financial aspects of the MENA
art market. We construct an annual MENA art index over the period 2000 to 2012. We observe
the financial characteristics and the risk-return trade-off and calculate a very strong geometric
annual return of 13.9%. The MENA art index outperforms global equity markets, as measured by
the MSCI World, but also performs very strong in comparison with other alternative asset classes
such as private equity, real estate, and commodities. This finding is supported by the optimal
asset allocation exercise, which is performed using the Markowitz (1952) framework. The results
show that with or without constraints and for different levels of risk aversion, the MENA index is
included in a well-diversified portfolio.
The positive performance and growth of the MENA art market in the last 13 years have
coincided with a dramatic increase in their HNWI population. Because the economy in many of
the MENA regions is booming, expectations are that the MENA art market will continue to grow.
Moreover, the middle classes in these countries, who are perhaps not yet buying art to any large
extent, will create new customers over the next decade. For instance, since Christie’s opened its
first auction house in Dubai in 2006, its client base grew each year with more than 20% (Deloitte
(2011)). As such, we assign a favorable outlook for future growth in the MENA art markets,
implying more record sales. We would like to mention once again that the MENA art market is an
emerging one, which hasn’t experienced in our sample period any substantial correction. An
average annual return of 13.9 percent is very high and there is no guarantee that the MENA art
index will continue with strong growth. Nonetheless, we are confident to say that MENA art
investment is a good asset allocation decision; for sure for someone with an interest in MENA art.
References
Amirsadeghi, H., and M. Eisler, 2010. 50 Great Collectors and Art Patrons of the Near and
Middle East. TransGlobe Publishing.
Anderson, R., 1974. Paintings as an Investment. Economic Inquiry 12, 13-26.
Artprice, 2012. The Art Market in 2011. (available via the website:
http://imgpublic.artprice.com/pdf/trends2013_en_fr_de_es_online.pdf)
Baumol, W., 1986. Unnatural Value, or Art Investment as Floating Crap Game. American
Economic Review 76(5), 10-14.
12

Blouin Art Sales Index, 2014. BASI Database. (available via the website:
http://artsalesindex.artinfo.com)
Bruno, B., and G. Nocera, 2008. Investing in Art: The Informational Content of Italian Painting
Pre-Sale Estimates, Working Paper, Bocconi University.
Capgemini and Merrill Lynch Global Wealth Management, 2011. World Wealth Report 2011.
Capgemini and RBC Wealth Management, 2012. World Wealth Report 2012.
Citi Private Bank, 2012. Wealth Report 2012.
De la Barre, M., S. Docclo, and V. Ginsburgh (1994). Returns of Impressionist, Modern and
Contemporary European Paintings 1962-1991. Annales d’Economie et de Statistique 35,
143-181.
Deloitte, 2011. Art & Finance Report 2011. Luxembourg
Goetzmann, W., 1993. Accounting for Taste: Art and the Financial Markets over Three Centuries.
American Economic Review 83(5), 1370-76.
Hayat, R., and R. Kräussl, 2011. Risk and Return Characteristics of Islamic Equity Funds.
Emerging Markets Review 12(2), 189-203.
International Monetary Fund, 2012. Regional Economic Outlook April 2012 Update. IMF,
Washington.
Kräussl, R., 2010. Art Price Indices, in C. McAndrew (ed.): Fine Art and High Finance: Expert
Advice on the Economics of Ownership, chap. 3, Bloomberg Press, NY.
Kräussl, R., 2011. Following Their Passions, Art+Auction Databank, July/August, 82.
Kräussl, R., 2012. Crescent Rising, Art+Auction Databank, November, 170-71.
Kräussl, R., and R. Logher, 2010. Emerging Art Markets. Emerging Markets Review 11(4), 301-
318.
Lawrie, W., 2008. Historical Development of Modern and Contemporary Arab and Iranian Art, in
J. Goodwin (ed.): The International Art Markets – The Essential Guide for Collectors and
Investors, Kogan Page.
Markowitz, H., 1952. Portfolio Selection. Journal of Finance 7(1), 77-91.
Mei, J., and M. Moses, 2002. Art as an Investment and the Underperformance of Masterpieces.
American Economic Review 92(5), 1656-68.
Pesando, J., 1993. Art as an Investment: The Market for Modern Prints. American Economic
Review 83(5), 1075-89.
Renneboog, L., and T. van Houtte, 2000. From Realism to Surrealism: Investing in Belgian Art.
Cahiers Economiques de Bruxelles 1, 69-106.
Renneboog, L., and C. Spaenjers, 2013. Buying Beauty: On Prices and Returns in the Art Market.
13

14
Management Science 59(1), 36-53.
Seçkin, A., and E. Atukeren, 2006. Art and the Economy: A First Look at the Market for
Paintings in Turkey. Economics Bulletin 26(3), 1-13.
Sloman, P., 2009. Artworld – Contemporary Art in the Middle East. Black Dog Pub.
TEFAF, 2011. The Global Art Market 2010 – Crisis and Recovery. TEFAF Maastricht, March
2011.

Table 1. Top 50 MENA Artists, 2000-2012 This table presents the top 50 MENA artists in our sample over the years 2000 to 2012. We sort the overall 663 artists by their total turnover USD figures. This table also presents the artist’s nationality, the total sales at auction, the title of the painting that fetched the record price at auction, as well as the record price in USD, and the date and place of the record.
Rank Artist Nationality Total
Turnover Total Sales at Auction Artwork Price in USD Date Auction House
1 Mahmud Said (1897-1964) Egyptian $ 13,878,886 41 The Whirling Dervishes $ 2,546,500 26-Oct-10 Christie's, Dubai
2 Martiros Saryan (1880-1972) Armenian $ 11,365,629 70 The Poet (On The Foothills Of Aragats) $ 623,650 26-Nov-12 Sotheby's, London
3 Farhad Moshiri (1963- ) Iranian $ 11,362,864 62 Secret Garden $ 987,750 16-Apr-13 Christie's, Dubai
4 Osman Hamdy-Bey (1842-1910) Turkish $ 9,557,110 14
A Lady Of Constantinople $ 3,380,500 30-May-08 Sotheby's, London
5 Mohammad Ehsai (1939- ) Iranian $ 8,800,584 47 He Is The Merciful $ 1,161,000 30-Apr-08 Christie's, Dubai
6 Charles Hossein Zenderoudi (1937- ) Iranian $ 7,647,047 59 Tchaar-Bagh $ 1,609,000 30-Apr-08 Christie's, Dubai
7 Mubin Orhon (1924-1981) Turkish $ 6,362,012 84 Composition abstraite $ 372,298 1-Jun-10
Artcurial - Briest, Poulain, F. Tajan, Paris
8 Fateh Moudarres (1922-1999) Syrian $ 5,429,229 108 Untitled $ 374,500 26-Oct-10 Christie's, Dubai
9 Fahr-El-Nissa Zeid (1901-1991) Turkish $ 5,396,992 36
Break of the Atom and Vegetal Life $ 2,741,000 29-Oct-13 Christie's, Dubai
10 Ahmed Alsoudani (1975- ) Iraqi $ 5,274,147 14 Baghdad I $ 713,250 14-Oct-11 Christie's, London
11 Paul Guiragossian (1926-1993) Lebanese $ 4,924,603 61 La Lutte de l'Existence $ 605,000 29-Oct-13 Christie's, Dubai
12 Abdel Hadey El-Gazzar (1925-1965) Egyptian $ 4,681,760 17 Fishing $ 746,500 19-Apr-11 Christie's, Dubai
13 Sohrab Sepehri (1928-1980) Iranian $ 4,390,896 16 Untitled (from the Tree-Trunks series) $ 662,500 25-Oct-11 Christie's, Dubai
14 Louai Kayali (1934-1978) Syrian $ 4,338,631 62 Fisherman in Arwad $ 194,500 25-Oct-11 Christie's, Dubai
15 Chafik Abboud (1926-2004) Lebanese $ 4,089,546 154 LE CHEMIN D'ALEP $ 387,750 16-Apr-13 Christie's, Dubai
16 Nejad Devrim (1923-1994) Turkish $ 3,857,010 98 Abstract Composition $ 1,190,502 26-Apr-12 Sotheby's, London
17 Hamed Nada (1924-1990) Egyptian $ 3,696,312 30 Henna Eve $ 602,500 27-Apr-10 Christie's, Dubai
18 Ahmed Moustafa (1943- ) Egyptian $ 3,595,716 11 The Night Journey And Ascension $ 842,500 16-Dec-10 Sotheby's, Doha
19 Mihr Ali (1795-1830) Persian $ 3,276,217 5 Portrait of Fath Ali $ 1,430,320 12-Oct-04 Sotheby's, London
15

Shah seated against a jewelled bolster
20 Ghada Amer (1963- ) Egyptian $ 3,254,602 50 The Golden Painting 2 $ 223,515 27-Jun-13 Sotheby's, London
21 Jilali Gharbaoui (1930-1971) Moroccan $ 2,694,076 30 Composition $ 257,400 18-Dec-10
Compagnie Marocaine des Objets d'Art, Casablanca
22 Burhan Cahit Dogancay (1929-2013) Turkish $ 2,604,228 34 Pink door $ 454,725 14-Jun-10 Aguttes, Paris
23 Mirza Baba (1795-1830) Persian $ 2,512,840 3 A Portrait of A Lady $ 1,524,500 6-Oct-10 Sotheby's, London
24 Ismail Jalayir (1830-1875) Persian $ 2,373,410 3
Portrait of Mirza Ali Asghar Khan Amin al-Sultan $ 1,392,525 11-Oct-06 Sotheby's, London
25 Afshin Pirhashemi (1974- ) Iranian $ 2,359,588 22 Rapture $ 554,500 27-Apr-10 Christie's, Dubai
26 Erol Akyavas (1932-1999) Turkish $ 2,220,002 20 End of encounter $ 872,269 5-Apr-11 Bonhams, London
27 Ahmed Cherkaoui (1934-1967) Moroccan $ 2,145,038 31 Talisman rouge, Paris $ 410,200 11-May-13
Compagnie Marocaine des Objets d'Art, Casablanca
28 Safwan Dahoul (1961- ) Syrian $ 2,141,644 27 Rêve 16 $ 219,750 16-Apr-13 Christie's, Dubai
29 Mario Prassinos (1916-1985) Turkish $ 2,009,430 181 Les Epines $ 108,827 10-Nov-08 Bonhams, London
30 Chant Avedissian (1951- ) Egyptian $ 1,915,344 11 Icons Of The Nile $ 1,565,000 22-Apr-13 Sotheby's, Doha
31 Reza Derakshani (1952- ) Iranian $ 1,817,971 39 Prelude in Pink $ 146,500 25-Oct-11 Christie's, Dubai
32 Nasrollah Afjehei (1933- ) Iranian $ 1,744,991 24 Wave $ 218,500 19-Apr-11 Christie's, Dubai
33 Selim Turan (1915-1994) Turkish $ 1,592,398 61 Composition $ 288,197 29-Jun-09
Artcurial - Briest, Poulain, F. Tajan, Paris
34 Massoud Arabshahi (1935- ) Iranian $ 1,462,220 32 Untitled $ 277,000 30-Apr-08 Christie's, Dubai
35 Rachid Koraichi (1947- ) Algerian $ 1,323,085 6
Scrutateur De l’Arrière Passion (Scrutineer Of The Hidden Passion) $ 665,000 22-Apr-13 Sotheby's, Doha
36 Miloud Labied (1939-2008) Moroccan $ 1,306,080 33 Composition $ 164,080 11-May-13
Compagnie Marocaine des Objets d'Art, Casablanca
37 Faramarz Pilaram (1937-1982) Iranian $ 1,291,990 17 Untitled $ 385,000 30-Apr-08 Christie's, Dubai
16
17
38 Marwan Kassab Bachi (1934- ) Syrian $ 1,212,564 36
GROSSER KOPF (NACH RECHTS) (Large Head (Turned Towards the Right)) $ 171,750 16-Apr-13 Christie's, Dubai
39 Ayman Baalbaki (1975- ) Lebanese $ 1,204,079 14 Ya’Illahi (Dear Lord) $ 377,000 22-Apr-13 Sotheby's, Doha
40 Sedaghat Jabbari (1961- ) Iranian $ 1,156,720 10 Divine Names $ 433,000 31-Oct-07 Christie's, Dubai
41 Leon Tutundijan (1905-1968) Armenian $ 1,147,990 62 Déjeuner de fruits $ 124,016 8-Jun-11 Tajan, Paris
42 Fikret Saygi Moualla (1903-1967) Turkish $ 1,138,380 150 Peniches au quai a Paris $ 66,345 19-Dec-02 Aguttes, Paris
43 Koorosh Shishegaran (1945- ) Iranian $ 1,107,803 20 Human at Rest $ 145,000 30-Apr-08 Christie's, Dubai
44 Dia Azzawi (1939- ) Iraqi $ 1,081,028 31 The Human Condition $ 109,000 31-Oct-07 Christie's, Dubai
45 Nja Mahdaoui (1937- ) Tunisian $ 1,042,466 19 Triptych 3 $ 140,500 27-Oct-09 Christie's, Dubai
46 Taner Ceylan (1967- ) Turkish $ 1,014,260 6 1879 (From The Lost Painting Series) $ 374,067 7-Apr-11 Sotheby's, London
47 Abdul Kadir Al-Rais (1951- ) Emirati $ 1,002,400 7 Bishra (Announcement) $ 385,000 30-Apr-08 Christie's, Dubai
48 Charles Garabed (1872-1947) Turkish $ 989,437 78 On White Sands $ 91,759 24-Nov-09 Christie's, Dubai
49 Abdallah Benanteur (1931- ) Algerian $ 983,771 32 Des Pots et des Bouteilles $ 116,500 30-Oct-08 Sotheby's, London
50 Saliba Douaihy (1912-1994) Lebanese $ 982,588 19 Regeneration $ 278,500 17-Apr-12 Christie's, Dubai

Table 2. Descriptive Statistics This table lists the descriptive statistics of the MENA index and all other alternative asset classes. All figures are calculated from annual returns calculated over the period 2000-2012. All data are converted to compounded returns. The risk-free rate used to calculate the Sharpe Ratio is the average 3-month T-bill secondary market rate over the same period.
MENA Equity Corporate
bonds Government
bonds Real estate Commodities Private equity
Hedge funds
Observations 13 13 13 13 13 13 13 13
Artihm. Mean 0.139 0.045 0.066 0.084 0.027 0.050 0.041 0.098
Geom. Mean 0.089 0.027 0.076 0.095 -0.020 0.050 0.048 0.084
Median 0.196 0.116 0.059 0.091 0.116 0.172 0.166 0.111
Maximum 0.557 0.269 0.220 0.236 0.311 0.404 0.821 0.231
Minimum -0.703 -0.546 -0.084 -0.088 -0.696 -0.625 -1.119 -0.212
Std. Dev. 0.315 0.219 0.068 0.084 0.263 0.310 0.433 0.108
Sharpe Ratio 2.387 0.645 2.407 3.934 0.907 0.582 0.527 2.727
Skewness -1.462 -1.440 0.092 -0.074 -1.265 -0.947 -0.983 -1.367
Kurtosis 4.769 4.331 3.757 2.702 4.456 2.638 4.630 5.194
Jarque-Bera 7.785 6.707 0.405 0.074 5.678 2.481 4.346 8.190
Probability 0.020 0.035 0.817 0.964 0.058 0.289 0.114 0.017
Sum 2.222 0.727 1.048 1.348 0.437 0.805 0.658 1.575
Sum Sq. Dev. 1.493 0.718 0.070 0.106 1.041 1.437 2.812 0.176
18

Table 3. CAPM Regression Results This table shows the outcome of the single index model (CAPM) using the equation
itmtiiit RR * . The dependent variable is one of the considered asset classes shown in the
table and the independent variable is the global equity index (MSCI World) minus the risk-free rate (3-month T-bill). The significance levels are indicated as ***, **, and *, indicating statistical significance at 1%, 5%, and 10%, respectively.
α β
Asset class Coef. (Std. Error) Coef. (Std. Error) R-squared F-statistic Treynor
Ratio MENA 0.096 -0.118 1.103 0.148 *** 0.756 55.731 *** 0.428 Equities 0.000 0.000 1.000 0.000 *** 1.000 *** 0.257 Corporate bonds -0.002 0.032 1.083 0.052 *** 0.926 437.681 *** 0.268 Government bonds -0.008 0.038 1.140 0.053 *** 0.950 457.142 *** 0.314 Real estate 0.001 0.042 0.932 0.049 *** 0.963 360.983 *** 0.394 Commodities 0.054 0.047 0.815 0.075 *** 0.765 117.299 *** 0.345 Private equity 0.040 0.054 0.930 0.013 *** 0.923 178.829 *** 0.360 Hedge funds 0.027 0.034 1.080 0.039 *** 0.980 750.512 *** 0.350
19

Table 4. Correlation Matrix This table displays the correlation coefficients of the log returns of all alternative asset classes over the period from 2000 to 2012.
Correlation MENA Equity Corp. bonds
Gov. bonds
Real estate Commodities
Private equity
Hedge funds
MENA 1
Equities -0.202 1
Corp. bonds -0.223 0.169 1
Gov. bonds -0.358 0.160 0.420 1
Real estate -0.134 0.781 0.051 -0.151 1
Commodities 0.134 0.109 -0.096 -0.118 0.623 1
Private equity -0.033 0.904 0.128 -0.309 0.826 0.526 1
Hedge funds -0.254 0.768 0.049 -0.078 0.701 0.563 0.755 1
20

Table 5. Optimal Asset Allocation This table presents the results of the optimal asset allocation. The numbers represent the weights of each asset used in the portfolio. Short selling is prohibited and the sum of all weights equals one. Each portfolio face as a constraint the level of risk aversion measured by lambda. Panel A presents the unrestricted results, while Panel B restricts the mean-variance portfolio investor to put a maximum of 30% into one asset class.
Panel A. Gamma Constraint
Asset class λ = 1 λ = 2 λ = 10
MENA 0.656 0.335 0.076
Equity 0 0 0
Corporate bonds 0 0 0
Government bonds 0.344 0.665 0.867
Real estate 0 0 0
Commodities 0 0 0
Private equity 0 0 0.058
Hedge funds 0 0 0
Total 1 1 1
Panel B. Gamma Constraint and Restriction <= 30% per asset class
Asset class λ = 1 λ = 2 λ = 10
MENA 0.300 0.300 0.156
Equity 0 0 0
Corporate bonds 0 0 0
Government bonds 0.300 0.300 0.300
Real estate 0 0 0
Commodities 0.040 0.078 0.244
Private equity 0.060 0.022 0
Hedge funds 0.300 0.300 0.300
Total 1 1 1
21
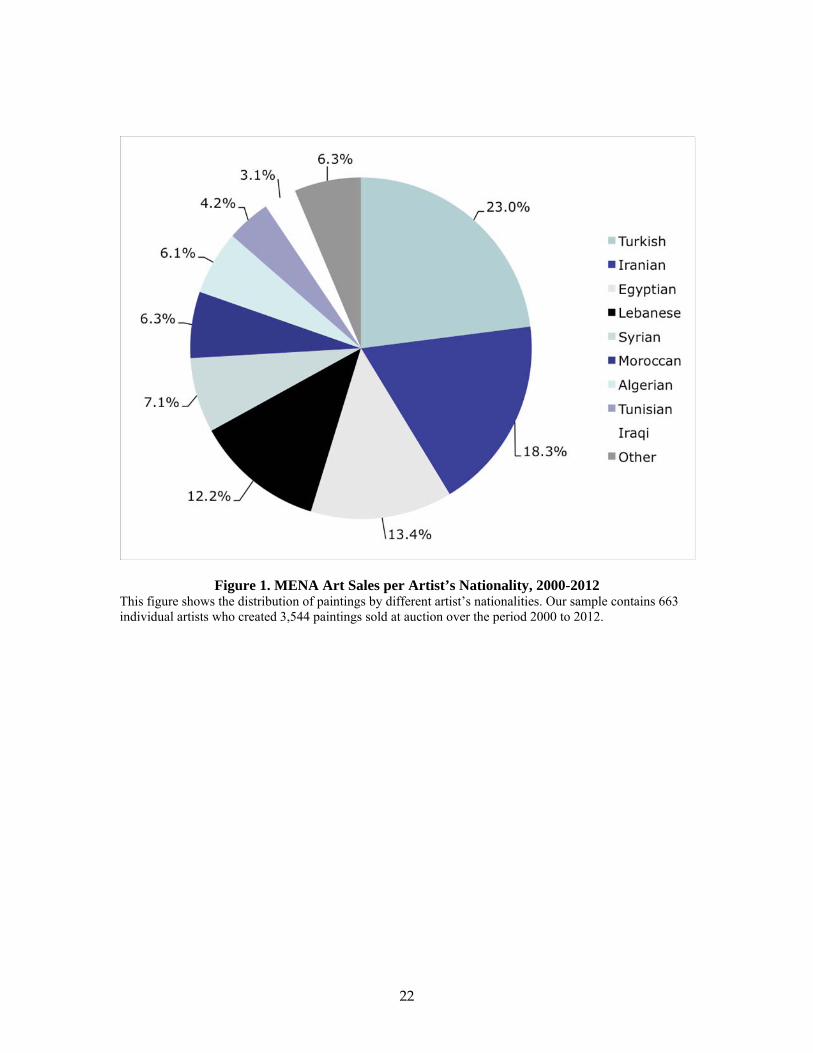
Figure 1. MENA Art Sales per Artist’s Nationality, 2000-2012 This figure shows the distribution of paintings by different artist’s nationalities. Our sample contains 663 individual artists who created 3,544 paintings sold at auction over the period 2000 to 2012.
22

Figure 2. MENA Art Sales per Auction House, 2000-2012 This figure presents at which auction houses the 3,544 MENA artworks in our sample got sold.
23

Figure 3. MENA Art Sales per Medium, 2000-2012 This figure shows the media distribution of the 3,544 MENA paintings in our sample. We differentiate between oil on canvas, oil on panel, oil on board, acrylic on canvas, mixed media (on canvas), and other media.
24

Figure 4. MENA Art Sales Price Range, 2000-2012 This figure indicates the distribution of the price range in which the 3,544 MENA paintings in our sample got sold for over the years 2000 to 2012.
25

Figure 5. The MENA Art Price Index, 2000-2012 This figure shows the MENA art price index over the sample period 2000 to 2012. The hedonic index is based on 3,544 auctioned paintings by 663 individual artists. The bars indicate the volume, i.e. the number of MENA paintings sold at auction in a specific year.
26

Recent Issues All CFS Working Papers are available at www.ifk-cfs.de.
No. Authors Title
493 Roman Kräussl, Thorsten Lehnert, Nicolas Martelin
Is There a Bubble in the Art Market?
492 Roman Kräussl, Elizaveta Mirgorodskaya
News Media Sentiment and Investor Behavior
491 Jill E. Fisch The Broken Buck Stops Here: Embracing Sponsor Support in Money Market Fund Reform
490 Hans A. Holter, Dirk Krueger, Serhiy Stepanchuk
How Does Tax Progressivity and Household Heterogeneity Affect Laffer Curves?
489 Sylwia Hubar, Christos Koulovatianos, Jian Li
Fitting Parsimonious Household-Portfolio Models to Data
488 Dimitris Christelis, Dimitris Georgarakos, Anna Sanz-de-Galdeano
The Impact of Health Insurance on Stockholding: A Regression Discontinuity Approach
487 Lutz Hendricks, Oksana Leukhina The Return to College: Selection and Dropout Risk
486 Marco Pagano Lessons from the European Financial Crisis
485 Marco Di Maggio, Marco Pagano Financial Disclosure and Market Transparency with Costly Information Processing