article 2: does tax drive the headquarters locations of
TRANSCRIPT

37
Does tax drive the headquarters locations of the world’s biggest companies?
Kimberly A. Clausing*
In recent years, policy-makers have given paramount attention to “competitiveness”, working to ensure that domestic economies attract investment, jobs, and tax revenues. Toward this end, countries have steadily lowered corporate tax rates in an attempt to attract mobile international businesses. This paper discusses the desirability of this policy stance in light of data on the world’s biggest companies. Using Forbes lists of the top “Global 2000” companies over the period 2003–2017, the paper analyzes companies’ headquarters locations, focusing on economic, geographic, and policy determinants. The paper then relates these findings to larger policy questions.
Keywords: multinational corporations, headquarters, international taxation, tax competition
1. Introduction
Policy-makers throughout the world frequently emphasize the importance of attracting mobile business activity. Multinational company investments may enhance the potential output of the country and the productivity of labor, leading to higher wage growth. Multinational companies are also associated with other important desiderata: innovation, large profits, a healthy tax base, and even the simple pride of viewing companies as national champions.
Companies often lobby governments, exhorting them to enact economic policies compatible with the crucial goal of competitiveness. Governments have generally been receptive to these concerns, and recent years have seen a steady reduction in the corporate tax rate across countries of the Organization for Economic Cooperation and Development (OECD) (Figure 1). One of the latest moves in that direction was the dramatic decrease of the U.S. corporate tax rate in 2018, when the statutory rate was lowered from 35 to 21 percent.1
1 Still, the impact of this change on mobile companies is more ambiguous than one would think. Prior to the change, effective tax rates were far lower than the U.S. statutory rate; indeed, U.S. multinational companies were often capable of achieving single-digit effective tax rates.
* Kimberly A. Clausing is Thormund A. Miller and Walter Mintz Professor of Economics at Reed College. Contact: [email protected].
Acknowledgement: I am thankful to Nikhita Airi for her excellent research assistance.

38 TRANSNATIONAL CORPORATIONS Volume 25, 2018, Number 2
Although corporate tax revenues have been flat in the wake of these tax rate decreases, in part due to expansions of the tax base in some countries, steady corporate tax revenues are generally occurring alongside strong growth in corporate profits, implying less revenue collected per dollar of profit. For example, corporate tax revenues have averaged about 3 percent of GDP for OECD countries over the past two decades, but corporate profits have increased as a share of GDP for many major economies.2
In the United States, these trends are even more stark. Profits as a share of GDP are 50 percent higher in recent years than in previous decades, even as corporate tax revenues have been flat or declining (Figure 2).
As a result, tax burdens are shifting away from capital and excess profits and toward other tax revenue sources that fall more heavily on labor. Although there is debate among economists regarding how much of the corporate tax burden falls
2 For example, McKinsey Global Institute (2015) documents a strong rise in corporate profits relative to GDP for the world as a whole, over the period 1980 to 2013.
Figure 1. Average statutory corporate tax rate, OECD countries, 1981–2017 (Per cent)
0
5
10
15
20
25
30
35
40
45
50
1981
19
82
1983
19
84
1985
19
86
1987
19
88
1989
19
90
1991
19
92
1993
19
94
1995
19
96
1997
19
98
1999
20
00
2001
20
02
2003
20
04
2005
20
06
2007
20
08
2009
20
10
2011
20
12
2013
20
14
2015
20
16
2017
Aver
age
corp
roat
e ta
x ra
te
Note: The �gure shows the average OECD country corporate tax rate at the central government level. Data are from OECD Statistics.

39Does tax drive the headquarters locations of the world’s biggest companies?
on labor, consensus models place it at about 20 percent, and it would be difficult to argue that alternative taxes (sales taxes, income taxes, etc.) fall less on labor.3
The eroding tax burden on corporations is often described as necessary in order to address competitiveness concerns surrounding the mobility of multinational enterprises, generating an essential tension for tax policy-makers. To protect the competitiveness of countries’ home companies, their tax burdens are accordingly lowered, but this erodes the corporate tax as a revenue source. Yet guarding against corporate tax base erosion, taking measures that combat profit shifting to tax havens and corporate inversions, risks imperiling competitiveness. The two goals of competiveness and a healthy corporate tax base work against each other.4
3 For an overview of this literature, see Clausing (2012). Consensus models include the Tax Policy Center (https://www.taxpolicycenter.org/publications/how-tpc-distributes-corporate-income-tax), the Joint Committee on Taxation (https://www.jct.gov/publications.html?func=startdown&id=4528), the Congressional Budget Office (pages 17 to 18 of https://www.cbo.gov/publication/43373), and the U.S. Treasury (see https://www.ntanet.org/NTJ/66/1/ntj-v66n01p239-62-distributing-corporate-income-tax.pdf), at least until recently.
4 This dilemma is one theme that emerges within the United Nations Conference on Trade and Development (UNCTAD) World Investment Report 2015. See especially pages 176-213.
Figure 2. U.S. corporate pro�ts and corporate tax revenues, as a share of GDP, 1980-2017 (Per cent)
As s
hare
of G
DP
0
2
4
6
8
10
12
1980
1982
1984
1986
1988
1990
1992
1994
1996
1998
2000
2002
2004
2006
2008
2010
2012
2014
2016
Corp pro�t after tax Corporate tax revenue Corp pro�t before tax
Note: Tax revenue data relative to GDP are from the U.S. Congressional Budget Of�ce. Corporate pro�ts data are from the U.S. Federal Reserve FRED database.

40 TRANSNATIONAL CORPORATIONS Volume 25, 2018, Number 2
This paper considers one facet of this dilemma, addressing the location of multinational headquarters as a possible tax policy goal. The headquarters locations of top companies are examined using Forbes data on the operations of the world’s 2000 largest companies. Together, these companies had $39 trillion in sales, $190 trillion in assets, and $57 trillion in market capitalization in 2017.5 In comparison, world GDP was about $80 trillion in the same year.6
These companies are a particularly interesting group to examine since they are the largest and most successful companies in the world. They are a desirable target for policy-makers interested in large-scale economic activity, tax base, innovation, and above-normal profits. Also, the behavior of these companies may not be identical to that of their smaller, more “perfectly” competitive, corporate counterparts.7 Further, these data allow an examination of the 15 most recent years, 2003-2017, allowing the creation of an up-to-date empirical picture; this is especially useful given the rapidly changing corporate tax policy environment.
The empirical analysis indicates that the world’s largest companies are located where we would expect, in large, rich economies. There is some evidence of tax sensitivity, particularly for small countries and in specifications without many control variables. Geographic and governance factors are important, and fundamentals related to education and technology also show strong positive statistical relationships with headquarters measures.
Beyond the behavior of these particular 2000 companies, I also examine the larger issue of whether company headquarters themselves are important, or whether they are mere symptoms of healthy economic fundamentals. Headquarters are associated with increased charitable contributions, as shown in Card, Hallock, and Moretti (2010), and may also generate other beneficial external effects. Still, it remains unclear whether corporate tax policy is the most targeted approach to achieve key policy desiderata.
Also, while the literature often emphasizes the role of tax incentives in changing marginal decisions on company organization and location, it is important to remember that economic fundamentals are a big driver of business activity. Factors such as workforce skill and education, research and development (R&D) spending, infrastructure, property rights, institutional stability, and macroeconomic indicators (inflation, unemployment, economic growth) are all important determinants of a country’s competitiveness. Large, rich economies with well-educated workforces,
5 Data are from the 2018 Forbes Global 2000 list; most data are from 2017.6 Of course, GDP is a value added concept, and none of these values is comparable in that sense.
However, world GDP is provided to give readers a sense of magnitudes.7 For example, Baldwin and Okubo (2009), discussed in the next section, find that large firms are more
tax-sensitive.
41Does tax drive the headquarters locations of the world’s biggest companies?
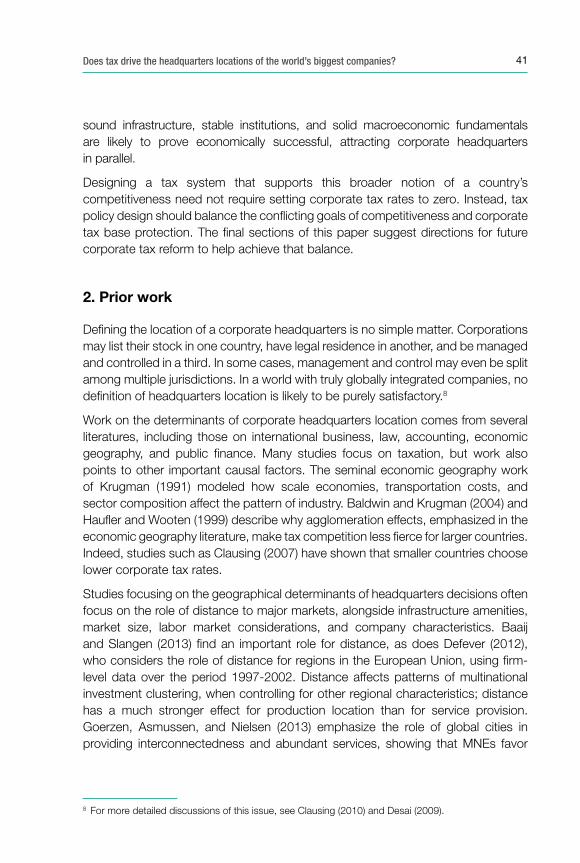
sound infrastructure, stable institutions, and solid macroeconomic fundamentals are likely to prove economically successful, attracting corporate headquarters in parallel.
Designing a tax system that supports this broader notion of a country’s competitiveness need not require setting corporate tax rates to zero. Instead, tax policy design should balance the conflicting goals of competitiveness and corporate tax base protection. The final sections of this paper suggest directions for future corporate tax reform to help achieve that balance.
2. Prior work
Defining the location of a corporate headquarters is no simple matter. Corporations may list their stock in one country, have legal residence in another, and be managed and controlled in a third. In some cases, management and control may even be split among multiple jurisdictions. In a world with truly globally integrated companies, no definition of headquarters location is likely to be purely satisfactory.8
Work on the determinants of corporate headquarters location comes from several literatures, including those on international business, law, accounting, economic geography, and public finance. Many studies focus on taxation, but work also points to other important causal factors. The seminal economic geography work of Krugman (1991) modeled how scale economies, transportation costs, and sector composition affect the pattern of industry. Baldwin and Krugman (2004) and Haufler and Wooten (1999) describe why agglomeration effects, emphasized in the economic geography literature, make tax competition less fierce for larger countries. Indeed, studies such as Clausing (2007) have shown that smaller countries choose lower corporate tax rates.
Studies focusing on the geographical determinants of headquarters decisions often focus on the role of distance to major markets, alongside infrastructure amenities, market size, labor market considerations, and company characteristics. Baaij and Slangen (2013) find an important role for distance, as does Defever (2012), who considers the role of distance for regions in the European Union, using firm-level data over the period 1997-2002. Distance affects patterns of multinational investment clustering, when controlling for other regional characteristics; distance has a much stronger effect for production location than for service provision. Goerzen, Asmussen, and Nielsen (2013) emphasize the role of global cities in providing interconnectedness and abundant services, showing that MNEs favor
8 For more detailed discussions of this issue, see Clausing (2010) and Desai (2009).

42 TRANSNATIONAL CORPORATIONS Volume 25, 2018, Number 2
global cities in their location decisions. Belderbos, Du, and Goerzen (2017) perform a logit analysis of location choice for over 1000 new regional headquarters over the period 2003-2012, showing how well-connected global cities make the role of distance less important; well-connected cities are those with substantial flows of people, knowledge, and services.
Several studies examine location decisions in particular regions or for particular home countries. Wang et al. (2011) consider location decisions within China, focusing on the role of path dependency, institutions, and information. Benito, Lunnan, and Tomassen (2011) consider the location decisions of Norwegian multinational companies between 2000 and 2006, documenting a large movement in headquarters functions in response to business efficiency and legitimacy factors. Baaij et al. (2015) study 58 Dutch multinationals and relate their relocation decisions to the internationalization of the company as well as the attractiveness of locations in terms of communications, capital, talent, services, and legal and regulatory environments. Birkinshaw et al. (2006) focus on a sample of large Swedish multinationals, finding evidence that headquarters relocation is related to the global nature of the company, though relocation is less likely when business climate differences are important, when interdependence between business units is high, or when ownership is concentrated.
Bloom, Sadun, and Van Reenen (2012) show that trust plays an important role in multinational companies’ willingness to decentralize decisions from corporate headquarters. Laamanen, Simula, and Torstila (2012) consider the interplay of tax incentives and business factors in determining European relocations; they find that tax considerations are important, as are labor market conditions and geographic centrality. Baldwin and Okubo (2009) consider both tax incentives and the role of firm size, and find that large firms are more likely to relocate in response to tax considerations.
Tax considerations are the focus of several studies. Becker, Egger, and Merlo (2009) consider the municipal tax sensitivity of multinational headquarters within Germany, using data on over 11,000 German municipalities and finding substantial tax effects. Barrios et al. (2012) consider the tax responsiveness of European firms during 1999-2003. They find that both home and host country tax rates influence the location decisions of multinational companies. Egger, Radulescu, and Strecker (2013) also find that labor taxation affects the location decisions of multinational headquarters.
Huizinga and Voget (2009) examine how the structure of mergers and acquisitions is affected by tax rates and systems, finding that companies avoid headquartering firms in countries with high international tax burdens; Belz et al. (2016) also focus on the tax avoidance incentives behind merger and acquisition activity. Voget (2011) examines European company data over the period 1997-2007, focusing on

43Does tax drive the headquarters locations of the world’s biggest companies?
multinational firms with headquarters relocations. Tax base protections (in the form of controlled foreign corporation laws) and increased repatriation tax burdens both increase the likelihood of multinational firm relocation.9
Dischinger and Riedel (2014a, 2014b) examine agency issues that may lead to profit-shifting toward headquarters, controlling for other variables, including tax differences among countries. Using data on European firms, they find evidence showing that profit shifting is more likely to favor headquarters countries, holding constant other factors.
Finally, Allen and Morse (2013) examine data on companies with United States initial public offerings over the period 1997-2010. They find evidence that the proportion of U.S. incorporated companies that incorporated in tax havens is quite modest, whereas companies that incorporate in China and Hong Kong (China) are more likely to incorporate in tax havens.
3. The world’s biggest companies
Every year, Forbes compiles a list of the 2000 largest publicly traded global companies worldwide. This list is compiled on the basis of four lists that rank companies by sales, profits, market value, and assets. Composite rankings of the top 2000 companies are based on equally weighted rankings of the four lists. For the 2018 list, the four lists included 3480 companies, in order to generate the top 2000 companies for the composite list.10 Most of the data for each year’s published list are based on the prior year’s information, with the exception of market value, which is calculated in the spring of the year of the published list. In what follows, I refer to years not as the publication year, but as the year when the majority of data were gathered, the year before publication. I use data over the period 2003-2017, covering the years that the list has been published; the most recent list was released in June of 2018, providing 2017 data.
Global 2000 companies have become larger and more important over the time period of this sample. The top 2000 companies in 2017 accounted for $39 trillion in sales and $57 trillion in market capitalization, over 50 percent higher than the 2003
9 Much of the prior work on the effects of tax rates and (territorial and worldwide) tax systems has focused on foreign direct investment rather than headquarters. De Mooij and Ederveen (2003, 2008) perform meta-analyses of many studies of foreign direct investment tax elasticities. A nice overview of some of the relevant mechanisms is also provided in the United Nations Conference on Trade and Development (UNCTAD) World Investment Report 2015.
10 Publicly traded subsidiaries of companies that provide consolidated financial information are excluded from the list.

44 TRANSNATIONAL CORPORATIONS Volume 25, 2018, Number 2
figures, when top companies accounted for $25 trillion in sales (in 2017 dollars) and $31 trillion in market capitalization (in 2017 dollars).11
In both years, 18 economies had more than 1 percent of the world’s top firms, and together these economies account for the vast majority of all top 2000 companies. A list of these economies and their share of the world’s top companies is provided in Table 1. The United States has, by far, the most companies from the Global 2000, but the U.S. count has declined by about 200 between 2003 and 2017. Still, considering other measures of headquarters activities, such as sales, market value, assets, or profits, those measures are higher in 2017 (in constant dollars) than in 2003. For instance, sales of U.S.-headquartered Global 2000 companies were $8.8 trillion (in 2017 dollars) in 2003, rising to $11.1 trillion in 2017; profits increased from $570 billion to $980 billion in constant dollars over the same time period. Over this period, the number of Global 2000 companies in China has increased by an order of magnitude, from 25 to 233. In general, poorer countries increase their count of top companies, whereas richer countries decrease their count.
11 Numbers have been adjusted using the GDP deflator. Using the CPI would provide a very similar adjustment for this time period.
Table 1. Economies with more than 1 percent of the top 2000 companies, 2017Rank
in 2017Economy
Number in 2017
Share of totalin 2017 (%)
Number in 2003
Share in 2003 (%)
1 United States 559 28 751 37.62 China 233 11.7 25 1.33 Japan 228 11.4 316 15.84 United Kingdom 88 4.4 137 6.95 Republic of Korea 67 3.4 49 2.56 Hong Kong (China) 58 2.9 24 1.27 India 58 2.9 27 1.48 France 57 2.9 63 3.29 Germany 54 2.7 65 3.3
10 Canada 51 2.6 56 2.811 Taiwan 47 2.4 35 1.812 Switzerland 41 2.1 34 1.713 Australia 39 2 37 1.914 Sweden 27 1.4 26 1.315 Italy 26 1.3 41 2.116 Russia 25 1.3 12 0.617 Spain 25 1.3 29 1.518 Netherlands 22 1.1 28 1.4
Top 18 share 85.3 88.2
Top 18 without U.S. 57.3 50.6
Note: Data are from Forbes Global 2000 lists. The top 18 share is the share of the 18 countries with greater than 1 percent of the top companies in that year. The Russian Federation was not in the top 18 in 2003, but Bermuda was, with 20 companies and a 1 percent share.

45Does tax drive the headquarters locations of the world’s biggest companies?
Figures 3 and 4 give a visual depiction of where the world’s top companies were headquartered in 2017 and 2003. The shift of global economic activity toward emerging Asia is apparent in both Table 1 and these maps; China, India, Hong Kong (China), Taiwan, and the Republic of Korea all experience rising counts of top firms, whereas the United States, Japan, the United Kingdom, and others experience declines.
The four panels of Figure 5 provide a more detailed look at four important countries: the United States, China, Japan, and the United Kingdom. In addition to being the four countries with the largest share of Global 2000 companies in the 2017 list, these countries are also important examples of countries that have focused on attracting headquarters activities in recent years. For example, both Japan and the United Kingdom moved to a territorial system of foreign income taxation in 2009, in part due to competitiveness concerns. A territorial system exempts foreign income from taxation, unlike a worldwide system, where foreign income is typically taxed upon repatriation, although a foreign tax credit is provided.12 In 2018, the United States made a similar policy change, motivated in large part by the sense that the U.S. system was increasingly out of line with international norms, harming the U.S. ability to host prosperous multinational companies. Still, the Forbes Global 2000 data tell a more nuanced story. Although the shares of U.S.-, U.K.-, and Japan-headquartered companies decline over this period, it is far from clear that tax considerations are paramount in explaining this decline, and all three countries retain disproportionate shares of these companies, compared with their shares of the world economy.
For example, the U.S. economy is less than one-quarter the size of the world economy (about 24 percent in 2017), and even smaller when adjusted for purchasing power parity.13 Yet the United States accounts for 28 percent of Global 2000 firms by count, 32 percent by sales, and 44 percent by market value. The economies of Japan and the United Kingdom account for 6 and 3 percent of the world economy, respectively, but they also have an outsized share of Global 2000 companies.
In Figure 5, Panel A shows data for the United States and China. The decline in the count of U.S.-headquartered Global 2000 companies occurs during the early years of the sample; the U.S. share is steady or slightly increasing from 2009 to 2017. The Chinese share rises monotonically in every year from 2004 to 2017; there is an
12 In practice, these labels mask many subtleties that determine the true tax treatment of multinational companies, and most countries employ hybrid systems with characteristics of both territorial and worldwide taxation. For more on this issue, see Clausing (2016a).
13 Purchasing power parity adjustments account for the fact that price levels are higher in richer countries, which makes their purchasing power lower than it would appear when simply comparing dollar measurements across countries, whereas countries like India and China have higher purchasing power than their dollar measures of GDP would indicate.

46 TRANSNATIONAL CORPORATIONS Volume 25, 2018, Number 2Fi
gure
3. L
ocat
ion
of th
e to
p 20
00 c
ompa
nies
in 2
017
Note
: Dat
a ar
e fro
m F
orbe
s Gl
obal
200
0 lis
ts.

47Does tax drive the headquarters locations of the world’s biggest companies?
Figu
re 4
. L
ocat
ion
of th
e to
p 20
00 c
ompa
nies
in 2
003
Note
: Dat
a ar
e fro
m F
orbe
s Gl
obal
200
0 lis
ts.

48 TRANSNATIONAL CORPORATIONS Volume 25, 2018, Number 2
Figure 5. Trends in global 2000 company counts for big countries
Note: Data are from Forbes Global 2000 lists.
Panel A: U.S. and China
U.S.
cou
nt
Chin
a co
unt
0
50
100
150
200
250
400
450
500
550
600
650
700
750
800
2003 2004 2005 2006 2007 2008 2009 2010 2011 2012 2013 2014 2015 2016 2017
U.S. China
Panel C: United Kingdom
60
70
80
90
100
110
120
130
140
150
2003 2004 2005 2006 2007 2008 2009 2010 2011 2012 2013 2014 2015 2016 2017
Panel B: Japan
150
170
190
210
230
250
270
290
310
330
350
2003 2004 2005 2006 2007 2008 2009 2010 2011 2012 2013 2014 2015 2016 2017

49Does tax drive the headquarters locations of the world’s biggest companies?
order of magnitude increase over this period. The United Kingdom and Japan show a pattern similar to that of the United States, despite their adoption of territorial tax systems in 2009, accompanied by lower tax rates in the United Kingdom. There is a steady decline in their count of the top 2000 companies in the early years of the sample, but since 2009, there is a less steady decline in Japan and a flat trend in the United Kingdom.
4. What drives headquarters locations?
There is a clear, if imperfect, relationship between the world’s largest economies and the headquarters locations of the world’s largest public companies. As the economic sizes of China and India have grown relative to those of other big economies, their share of the world’s largest companies has increased, leaving necessarily lower shares for richer countries that were more dominant earlier.
This section undertakes a brief, illustrative econometric analysis of the location of the world’s largest 2000 companies, considering how economic, geographic, and policy factors affect the activities of these important companies. Economic variables that are likely to be associated with headquarters location include GDP, which captures the market size of the local economy, and GDP per capita, which captures the relative standard of living of the economy’s citizens. All else equal, we expect both large economies and those with high standards of living to have more multinational headquarters.14
Geography is also likely to be important. As prior work has emphasized, countries that are well-connected to other economies are more likely to attract economic activity. Thus, a country’s remoteness should be negatively correlated with hosting top global companies. Other geographic factors, such as land area, the absence of ocean ports (i.e. land-locked countries), or island countries, may also be correlated with a country’s ease of market access, as emphasized in the international trade literature.15
14 For example, consider two economies with $400 billion in GDP, one of which has 10 million citizens with $40,000 of per capita income, and one of which has 100 million citizens with $4,000 of per capita income. Although both economies would be expected to have more large companies than counterparts with smaller GDPs, the former economy may have more of the world’s top companies. Richer countries are more likely to have undertaken the investments in human capital, physical capital, and technological knowledge required to generate large publicly traded companies, whereas lower per-capita income countries may be more agrarian and less industrial, and thus less likely to host major companies.
15 Gravity equation models typically include such explanatory variables. Of course, these variables do not vary over time, so they can only be included in specifications that do not utilize country-specific fixed effects.

50 TRANSNATIONAL CORPORATIONS Volume 25, 2018, Number 2
Other country characteristics can affect attractiveness for headquarters activity, including fundamental factors such as the education of the workforce, R&D spending, internet access, and the presence of top universities (which may affect company headquarters by shaping the environment for innovation and the skill levels of those at the top of the skill distribution). For example, there is a clear synergy between Silicon Valley firms and the elite California universities of the Bay Area, Stanford and UC Berkeley.
Government policy can certainly affect these factors, through the channels of education funding, basic research funding, and public infrastructure investment. In addition, other policy factors may influence global headquarters, including the perceived stability of government, the protection of property rights, the level of corruption, and regulatory quality. Finally, a policy lever that has received much attention in the literature is the statutory corporate tax rate.
In addition, other corporate tax provisions are likely important in location decisions. Still, the distinction between territorial and worldwide tax systems may be less important than it seems, once one acknowledges that neither system is a “pure” system. For example, since worldwide tax systems often do not tax foreign income until it is repatriated (and may provide special low tax rates on such occasions), it is unclear that the tax burden on foreign income is higher under such a system than it would be under a territorial system that taxed some types of foreign income currently (through either controlled foreign corporation laws or a minimum tax regime).16
Although the limits of this data set constrain a thorough investigation of all of these mechanisms, a simple regression analysis can capture many of the factors outlined here. The data set contains about 60 economies that consistently hosted top 2000 companies over a period of 15 years from 2003 to 2017. The baseline specification is as follows:
Measureit = a + b1 GDPit + b2 GDP per-capitait + Sz bz Zit
The baseline specification considers measures of headquarters presence in economies (indexed by i) and years (indexed by t), where headquarters presence is defined as the economy’s company count, or the economy’s total sales, profits, assets, or market value from top 2000 global companies. Headquarters are
16 As one clear example of this ambiguity, consider the U.S. international tax law change of 2018. The United States has officially moved from a “worldwide” to a “territorial” system; however, both systems were far from pure. Under the purportedly worldwide system, little if any tax was collected on foreign income, since companies either left earnings offshore indefinitely, or used foreign tax credits to shield foreign income, including royalty income, from U.S. taxation. Under the purportedly territorial system, foreign income of U.S. multinationals will be taxed currently if the foreign tax rate is below the global minimum tax threshold.

51Does tax drive the headquarters locations of the world’s biggest companies?
specified to depend on economies’ GDP, GDP per capita, and other variables (indicated by the vector Z) added alongside baseline controls. The data appendix discusses the sources and definitions of all variables in detail.
Table 2 shows specifications where the dependent variable is the (natural log of) the count of Global 2000 companies. In the first baseline specification, the independent variables are GDP and GDP per capita (again measured in logs) and the statutory corporate tax rate. Unsurprisingly, larger economies, measured by GDP, and richer populations, measured by GDP per capita, are statistically associated with higher counts of Global 2000 companies. This is a robust finding that is upheld in nearly all specifications. In this specification, the corporate tax rate is negatively associated with the count of Global 2000 companies; a tax rate one percentage point higher is associated with about 1.4 percent fewer top companies.
In the second specification, this relationship is modeled with more subtlety, to examine the possibility that economies with larger GDP experience less tax sensitivity, since agglomeration forces make their tax base less sensitive to tax rate differences, as suggested in the economic geography literature. Here, an interaction term between the tax rate and GDP captures this possibility. Indeed, the results in column 2 imply that the statistical relationship between the tax rate and the number of global 2000 companies is negative for economies with GDP less than about $500 billion, but for larger economies, the relationship is no longer negative. In this sample, the largest 22 economies have GDPs above the $500 billion threshold. This pattern would also hold for specifications (3) to (6) if the interaction term were included, but I return to the baseline of equation (1) as I add variables in subsequent columns.17
In equation (3), I add several geographic measures, including a measure of remoteness that is based on the GDP-weighted distance between the country and other countries. Oddly, this variable is positively associated with Global 2000 company counts. However, landlocked countries and countries with larger land areas have fewer top companies. Ceteris paribus, countries that have large land areas, such as Canada and the Russian Federation, are naturally more remote since a typical person or city is further from other nations’ people and cities. In column 3, as well as in subsequent columns (and tables), both GDP and GDP per-capita coefficients typically retain their positive statistically significant relationship with headquarters measures. Yet, the tax coefficient is no longer statistically
17 This decision was due to presumed reader interest in the baseline tax effect. However, some might argue that the nonlinear specification is more theoretically justified, if large countries are likely to experience less tax sensitivity, as suggested by the economic geography literature. The pattern of column (2) tends to be upheld in specifications with additional control variables, suggesting that for small countries (but not large ones) there is a statistically negative relationship between Forbes 2000 measures and statutory tax rates.

52 TRANSNATIONAL CORPORATIONS Volume 25, 2018, Number 2
distinguishable from zero, and tax coefficients often lose their negative statistically significant relationship with headquarters measures as more explanatory variables are added. One clear possibility is that correlations between tax variables and other explanatory variables confound the estimate of the tax variable when other
Table 2. Determinants of global 2000 company count
(1) (2) (3) (4) (5) (6)
GDP0.771*
(0.0212)0.374*
(0.0434)0.951*
(0.0249)0.848*
(0.0192)0.267*
(0.0561)0.541*
(0.0688)
GDP p.c.0.363*
(0.0258)0.310*
(0.0245)0.266*
(0.0274)-0.0134(0.0383)
0.503*(0.0583)
0.249*(0.0757)
Tax rate-1.370*(0.377)
-44.77*(4.238)
-0.207(0.328)
-0.431(0.339)
0.0195(0.484)
-0.309(0.471)
Tax*GDP1.666*(0.162)
Remote0.496*(0.119)
0.387*(0.193)
Land area-0.139*
(0.0162)-0.0635*(0.0187)
Island0.0309
(0.0715)0.0106
(0.0841)
Land-locked-0.416*
(0.0850)-0.526*
(0.0941)
HF Score1.403*(0.304)
0.456(0.428)
Govt. Eff.0.681*(0.102)
0.511*(0.139)
Corruption-0.260*
(0.0851)-0.259*(0.110)
University0.254*
(0.0554)0.167*
(0.0587)
R&D Res.-0.171*
(0.0505)-0.0829(0.0606)
Patents0.315*
(0.0299)0.171*
(0.0390)
N 787 787 770 715 449 449
R2 0.71 0.74 0.80 0.81 0.82 0.85
Note: Standard errors in parentheses. Data sources are described in the data appendix. All variables except tax rate, dummy variables, and government effectiveness and corruption indexes are in natural logs. GDP and GDP per-capita are measured in constant dollars.
*p < 0.05

53Does tax drive the headquarters locations of the world’s biggest companies?
explanatory variables are excluded, since tax variables pick up the influence of omitted variables in basic specifications.18
Column (4) considers three governance measures. A Heritage Foundation measure of economic freedom captures various aspects of institutional strength; this index has been widely used in other cross-country empirical analyses. I also use World Bank indicators of corruption and effective governance. Both the economic freedom and the effective governance measures are positively associated with top companies, though in fact less corrupt countries (since higher values of the index reflect better outcomes) are associated with fewer Global 2000 companies.19
Column (5) adds measures of education and innovation achievement, including the count of top 500 global universities (in natural log form), patent filings (in natural log form), and R&D researchers as a share of the population. Both patents and top universities are associated with higher Global 2000 company counts; however, R&D researchers are negatively associated with top company counts, although this finding disappears in the column (6) specification.
Column (6) includes the complete set of independent variables from columns (3) to (5), and the overall pattern of results is similar. Of some note, the number of observations is necessarily smaller as more variables are included. I also ran specifications where the sample was constrained to a uniform, and smaller, size. The tax coefficient in the first column is then statistically insignificant, but most of the other results are nearly unchanged.
Tables 3 and 4 repeat these same specifications for two other dependent variables, the amount of Global 2000 company sales of each economy, and the amount of Global 2000 company market value of each economy. Similar patterns emerge. In Table 3, both GDP and GDP per capita have larger positive associations with the dependent variable. The tax rate coefficient keeps its statistical significance in columns (5) and (6). In the column (2) specification with the tax*GDP interaction term, tax rates again have a negative relationship with the Global 2000 sales measure only for those countries with GDPs below a threshold, now $630 billion; the 20 largest countries in the sample are beyond the $630 billion threshold. Table 4 results are similar to those in Table 3, although the tax coefficient is again statistically insignificant after the first two columns. Similar specifications were run for the assets and profits headquarters measures, with similar patterns emerging.20
18 Partial correlation matrices indicate that the tax variable is positively correlated with land area, universities, and patents, and negatively correlated with the Heritage Foundation economic freedom score, the World Bank (absence of) corruption indicator, and the World Bank government effectiveness measure.
19 There were a large number of possible governance measures from both the Heritage Foundation and the World Bank; it was a judgment call regarding which variables to include. Those I omitted were often statistically insignificant; including too many measures can create problems of multicollinearity.
20 To conserve space, results are not reported here but are available from the author upon request.

54 TRANSNATIONAL CORPORATIONS Volume 25, 2018, Number 2
Table 3. Determinants of global 2000 company sales (in constant dollars)
(1) (2) (3) (4) (5) (6)
GDP1.121*
(0.0284)0.787*
(0.0607)1.393*
(0.0342)1.197*
(0.0253)0.754*
(0.0693)1.014*
(0.0872)
GDP p.c.0.686*
(0.0347)0.641*
(0.0347)0.497*
(0.0377)0.146*
(0.0505)0.740*
(0.0720)0.518*
(0.0961)
Tax rate-1.572*(0.507)
-38.17*(5.928)
0.246(0.451)
-0.452(0.447)
-1.381*(0.598)
-1.592*(0.597)
Tax*GDP1.405*(0.227)
Remote0.142
(0.164)0.126
(0.245)
Land area-0.188*
(0.0223)-0.128*
(0.0237)
Island-0.0804(0.0983)
-0.273*(0.107)
Land-locked-0.0432(0.117)
-0.374*(0.119)
HF Score0.816*(0.401)
-0.157(0.543)
Govt. Eff.1.220*(0.134)
0.612*(0.177)
Corruption-0.424*(0.112)
-0.282*(0.140)
University0.239*
(0.0684)0.167*
(0.0745)
R&D Res.-0.0744(0.0624)
-0.0949(0.0768)
Patents0.198*
(0.0369)0.120*
(0.0495)
N 787 787 770 715 449 449
R2 0.76 0.77 0.83 0.85 0.85 0.87
Note: Standard errors in parentheses. Data sources are described in the data appendix. All variables except tax rate, dummy variables, and government effectiveness and corruption indexes are in natural logs. GDP and GDP per-capita are measured in constant dollars.
*p < 0.05

55Does tax drive the headquarters locations of the world’s biggest companies?
Table 4. Determinants of global 2000 company market value (in constant dollars)
(1) (2) (3) (4) (5) (6)
GDP1.020*
(0.0284)0.739*
(0.0610)1.223*
(0.0358)1.114*
(0.0259)0.558*
(0.0736)0.928*
(0.0910)
GDP p.c.0.534*
(0.0346)0.496*
(0.0348)0.412*
(0.0395)-0.0245(0.0516)
0.656*(0.0764)
0.238*(0.100)
Tax rate-1.332*(0.506)
-32.04*(5.959)
0.158(0.472)
-0.115(0.458)
-0.726(0.634)
-0.957(0.623)
Tax*GDP1.179*(0.228)
Remote0.371*(0.171)
0.0888(0.255)
Land area-0.148*
(0.0233)-0.0642*(0.0247)
Island-0.0324(0.103)
-0.165(0.111)
Land-locked-0.279*(0.122)
-0.551*(0.125)
HF Score2.252*(0.410)
1.112(0.566)
Govt. Eff.0.724*(0.137)
0.677*(0.185)
Corruption-0.161(0.115)
-0.201(0.146)
University0.226*
(0.0726)0.0304
(0.0778)
R&D Res.-0.171*
(0.0663)-0.114
(0.0802)
Patents0.272*
(0.0392)0.136*
(0.0516)
N 787 787 770 715 449 449
R2 0.71 0.72 0.77 0.81 0.80 0.83
Note: Standard errors in parentheses. Data sources are described in the data appendix. All variables except tax rate, dummy variables, and government effectiveness and corruption indexes are in natural logs. GDP and GDP per-capita are measured in constant dollars.
*p < 0.05

56 TRANSNATIONAL CORPORATIONS Volume 25, 2018, Number 2
I also considered country fixed- effects specifications for the main results. Since cross-section variation dominates this data set, several of the statistically significant relationships become statistically indistinguishable from zero. More tax coefficients are statistically indistinguishable from zero, and that is also true for many independent variables. GDP, at times, is no longer statistically significantly associated with greater top company activity, but GDP per capita now has a consistently larger and statistically significant positive effect. In the typical specification, a 1 percent increase in GDP per capita is associated with a 2 percent increase in Global 2000 company measures.
5. Why are headquarters important?
There are several reasons why countries seek to attract multinational activity. Additional investment can increase an economy’s potential output, worker productivity, and wages. Headquartering the world’s largest companies may attract additional benefits, including the ability to tax companies that are more likely to have excess profits, greater innovation and learning spillovers to the larger economy, and high-wage managerial jobs. Table 5 considers some of the raw correlations between headquarters measures and other measures of valued policy goals: R&D, patent and trademark applications, top universities, and educational achievement. All of these indicators are positively correlated with headquarters measures, with astonishingly high correlations between headquarters measures and top universities as well as non-resident patent applications. Of interest, non-resident patent applications are far more tightly correlated with headquarters measures than resident patent applications.21
Of course, correlation does not imply causality; that adage is important to remember when examining both raw correlations as well as the partial correlations of the prior tables. Top universities may be more likely to fuel top companies than vice versa, but there are likely symbiotic elements to their relationship, and both measures of success are likely deeply reliant on other factors that help nations prosper. A well-educated workforce; stable, inclusive institutions; and macroeconomic stability are all examples of deeply important fundamentals.
I also examined specifications that consider determinants of key indicators of innovation, such top universities, patent applications, and trademark applications. For these indicators, I ran specifications very similar to those of Tables 3-5, and similar patterns emerged.22 Large economies with rich citizens are associated with
21 For this data set, the mean of the nonresident patent variable is 13,284 and the mean of the resident patent variable is 25,581.
22 Full results are available from the author upon request.

57Does tax drive the headquarters locations of the world’s biggest companies?
more top universities, and corporate tax rates have (predictably) little influence. Lower corruption scores and higher Heritage Foundation economic freedom scores are associated with more universities. Patents and trademark applications are strongly positively associated with GDP (but not GDP per capita, surprisingly). They are also positively associated with government effectiveness and the Heritage Foundation economic freedom score.
One essential policy question that should drive thoughtful policy analysis is the relationship between policy tools and goals. If one is seeking R&D and innovation, cutting taxes on corporate profits is likely an indirect path toward that aim. Education funding, basic science funding, open immigration policy, and R&D tax credits are all policies that are more direct.23 If one is targeting high-wage jobs, one should pay attention to all of the policies that affect worker productivity, including investments in infrastructure and education. If one is seeking a strong corporate tax base for revenue purposes, that will also require collecting tax on corporations, rather than seeking to lure their activities with ever lower corporate tax rates and preferable regimes. Still, given the forces of tax competition that drive many governments, it is important to design a corporate tax system that acknowledges these pressures. The following section makes several suggestions for redesigning tax policy in light of global tax competition.
23 For a full discussion of the link between immigration and innovation in the U.S. economy, see chapter 8 of Clausing (2019).
Table 5. Correlations between headquarters measures and other policy goals
Headquarters measure Count Sales Market value
Top university count 0.93 0.95 0.93
Tertiary education (% of population) 0.30 0.31 0.30
Upper 2nd education (% of population) 0.28 0.31 0.28
Lower 2nd education (% of population) 0.25 0.29 0.25
Internet access (% of population) 0.16 0.19 0.15
R&D expenditure (% of GDP) 0.32 0.34 0.26
Patents fi led 0.74 0.74 0.68
Patents fi led by residents 0.60 0.60 0.52
Patents fi led by non-residents 0.89 0.90 0.92
R&D researchers (% of population) 0.19 0.20 0.14
Trademark applications fi led 0.36 0.37 0.36
Note: Data sources are described in the data appendix.

58 TRANSNATIONAL CORPORATIONS Volume 25, 2018, Number 2
6. Policy implications
Most countries want to attract corporate headquarters, yet in their attempt to use tax policy toward this aim, they may be more successful in eroding revenue than enhancing competitiveness, thereby imperiling their ability to fund education, infrastructure, and other urgent priorities. Policy-makers face a clear tradeoff between responding to the corporate community with “competitive” corporate tax policy and protecting the corporate tax base.
In the U.S. case, the current policy environment places too much priority on competitiveness relative to tax base protection. In the United States, more than $100 billion a year is lost in tax revenue as a result of profit shifting, and the recent legislation of 2017, colloquially referred to as the Tax Cuts and Jobs Act (TCJA), actually makes the profit shifting problem slightly worse.24 As Figure 2 shows, U.S. corporate tax revenues as a share of GDP are, at best, stagnant, despite large increases in corporate profits. These trends were before the $650 billion in corporate tax cuts just enacted. Indeed, corporate tax base protection is sorely needed, but the TCJA ultimately prioritizes tax cuts over that goal.25
At the same time, there is little evidence of a competitiveness problem. The United States has a larger share of Forbes Global 2000 companies (by any measure) than of world GDP, and the U.S. count of these companies is higher in 2017 than it was in 2008. After-tax corporate profits and market valuation are at historically high levels.
Yet international tax competition presents a classic collective action problem. For each country, lowering corporate tax rates is often a dominant strategy; regardless of what peer countries are doing, they attract a larger part of the mobile tax base
24 For a study of the revenue lost due to profit shifting, see Clausing (2016b). The Joint Committee on Taxation (JCT) estimates that the international changes in the law lose revenue over the ten-year window, setting to one side the money from a one-time tax on previously unrepatriated profits.
25 In the legislation, there are several confounding influences that are difficult to separate. The lower tax rate should in theory lighten profit shifting incentives, due to the smaller tax rate difference between the United States and trading partners. However, as shown in Clausing (2016b), most profit shifting occurs with respect to the lowest tax rate havens, and there are still substantial incentives to shift profits to havens post-TCJA, since haven income is taxed at half the U.S. rate under the legislation. In addition, the adoption of a territorial regime should increase the incentive to shift profit offshore to low tax locations, since there is no fear of tax due upon repatriation. Finally, there are base protections in the legislation, with the colorful acronyms GILTI and BEAT, that attempt to combat profit shifting. Yet, when all the dust clears, the JCT estimates indicate that the provisions of the law that address the taxation of international income are revenue-losing, implying that the corporate tax base is smaller as a result of the international provisions, at the end of the ten-year window. (This ignores the tax revenue collected due to the one-time tax on prior unrepatriated earnings; while raising revenue, this provision represents a tax cut relative to prior law, and it is a one-time occurrence.)

59Does tax drive the headquarters locations of the world’s biggest companies?
with a lower rate.26 This may generate a situation where the non-cooperative outcome may be inferior to the cooperative outcome, since tax rates and revenues will be sub-optimally low. If countries had the political will and institutional capacity to negotiate an agreement, they might find it in their mutual interest to limit tax competition.
Recently, the OECD/G20 BEPS (base erosion and profit shifting) initiative attempted to respond to similar concerns, suggesting nearly 2000 pages of guidelines to limit corporate tax base erosion. Profit shifting is a huge problem; estimates in Clausing (2016b) suggest a tax revenue loss to major countries of more than $300 billion annually. This problem is more than pressure to lower corporate tax rates. There is also tax regime competition, whereby tax havens siphon off large amounts of tax revenue.
Still, although international cooperation sounds nice, in practice it can be difficult to overcome collective action problems. The OECD/G20 initiative on BEPS was an important step forward, but most feel that the overall approach suffered from undue complexity, gradualism, and discretion. In particular, the guidelines were very complicated, reforms did not address the fundamental problems, and important countries could easily forgo adoption.
However, there are still promising directions for future reforms that would ease tradeoffs between competitiveness and corporate tax base protection. For example, formulary apportionment of global income provides a useful framework for establishing how to assign taxing rights for truly global income. This framework has worked well in many subnational contexts and has been suggested as a reform in the European Union’s common consolidated corporate tax base (CCCTB) project. Under a formulary approach, tax burdens are based on a company’s global income and a formula that determines what fraction of their global profit is taxable in a particular jurisdiction, based on the real economic activities (such as sales and employment) occurring in that jurisdiction, as a share of a company’s global activities. For example, if a company has $10 billion of profit worldwide, and half of their formula factors in the United States (e.g., sales and employment), then half of their global profit would be taxable in the United States.
Under this system, profit shifting is not possible without altering the factors in the formula. And since customers and employees are far less tax-sensitive than paper profits, this system would dramatically lower the tax sensitivity of the tax base. Ideally, countries would agree on the same formula and would all adopt this system.
26 This is a classical prisoners’ dilemma problem. Consider an example with two countries. If the peer country chooses a high rate, the home country has an incentive to chose a lower rate, to lure the mobile tax base away. If the peer country chooses a low rate, the home country has an incentive to chose a low rate to avoid losing tax base. Thus, a race to the bottom in corporate tax rates ensues.

60 TRANSNATIONAL CORPORATIONS Volume 25, 2018, Number 2
However, there is a strong incentive for follower countries to become adopters if leader countries adopt, to defend their own tax base. In particular, adopting countries will become magnets for paper profit-shifting, since profits shifted to formulary countries do not affect tax liabilities in those countries but do reduce non-adopter’s tax revenues. A far more detailed discussion of formulary apportionment is found within Avi-Yonah and Clausing (2008) and Avi-Yonah, Clausing, and Durst (2009), where a sales-based formula is suggested.
A sales-based formulary apportionment system has similar economic effects as a destination-based cash flow tax, or DBCFT. In both cases, tax liabilities are based on the destination of sales, or where the customers of a company’s products are located. In the case of a DBCFT, the tax base is also redefined such that tax burdens fall only on company rents rather than the normal return to capital. (This can also be true under a classic corporate tax base, if the normal return to capital is exempt from taxation.27) A DBCFT can raise some thorny transition issues, however, due to the need for a border adjustment tax; these are discussed further elsewhere.28
For individual countries, there are also useful incremental reforms that are can be implemented unilaterally, acknowledging the starting point. For example, in the United States, the most recent corporate tax law change was accompanied by a global minimum tax at half the level of the new lower U.S. rate (21 percent). Making the minimum tax a per-country minimum tax, rather than a global one, would more effectively discourage profit shifting and support the U.S. corporate tax base. At present, companies have an incentive to earn income in both high-tax and low-tax foreign countries, relative to the United States, since those streams of income can be blended and taxed at the minimum tax rate, a rate far lower than the U.S. domestic rate. Also, raising the minimum tax rate closer to the domestic rate, while addressing the potential for corporate inversions in parallel, would help protect the U.S. corporate tax base. There are many useful policy remedies for tackling inversions, discussed extensively elsewhere.29
In short, while multinational companies come with many important desiderata, cutting tax rates on the income of corporations is not the most direct way to achieve policy aims. There are more direct ways to encourage high-wage jobs, innovation, and productivity. Further, defending the corporate tax base is important, for reasons discussed extensively in Clausing (2016c) and briefly summarized as follows. In addition to meeting revenue needs directly, the corporate tax is an important backstop to the individual tax system, in part because large amounts
27 This can arise from an allowance for corporate equity or expensing. Of note, debt-financed investments are often subsidized under many countries’ tax systems.
28 As one example, see Avi-Yonah and Clausing (2017).29 For example, see Kleinbard (2014), Shay (2014), and Clausing (2014).

61Does tax drive the headquarters locations of the world’s biggest companies?
of capital income go untaxed at the individual level. The corporate tax is also a progressive tax, much more so than other major tax instruments. Recent literature suggests that taxing capital income is no more inefficient than taxing labor income. Further, a large share of the corporate tax base is actually rents, or super-normal profits. And, it has long been understood that taxation of super-normal profits is efficient, unlike most taxes.
7. Conclusion
The world’s largest companies are often coveted by policy-makers, who value their large-scale investment and employment, their higher wages and profits, and their ability to lead markets in innovation, brand recognition, and productivity. Government policy-makers have been attentive to the needs of multinational companies, and there has been a steady downward march in corporate tax rates. Yet policy-makers face a tradeoff between attending to the competitiveness of multinational companies and protecting the corporate tax base.
This paper has considered that tradeoff in light of data on the world’s largest 2000 public companies. The composition of this group of companies has changed substantially in recent years, due in large part to the economic growth of emerging Asia. This group of companies has also become larger and more profitable; their sales totaled $39 trillion in 2017, and their profits have risen by over 200 percent in the last 15 years (in real terms).
Empirical analysis suggests that the most important determinant of a country’s Global 2000 company activity, by any measure (sales, profits, count, etc.), is the size of the economy, both in terms of sheer scale (GDP) and in terms of the average income level of its members (GDP per capita). Governance, geographic, and education variables are also important, and tax rates have a statistically significant negative relationship with headquarters measures in some specifications, especially for countries with small economies and in specifications that do not include other control variables.
The data suggest that countries that have sound fundamentals tend to have both good corporate outcomes and good education and innovation outcomes. Indeed, governments should focus on these fundamental factors, which include strong education systems and institutional strength. Tax revenue is important for addressing many fundamental needs of society, including investments in infrastructure and education. It is therefore important to protect the corporate tax, which has a key role in an efficient and equitable tax system. International tax policy design should focus on reforms that would make the tradeoff between competitiveness and corporate tax base protection less vexing. In this light, formulary apportionment, and destination-based taxation, are promising reforms.
62 TRANSNATIONAL CORPORATIONS Volume 25, 2018, Number 2
While waiting for such fundamental reforms, there are also many useful incremental policy steps that governments can take to protect their corporate tax base without sacrificing competitiveness.
References
Allen, Eric J., and Susan C. Morse. 2013. “Tax Haven Incorporation for U.S. Headquartered Firms: No Exodus Yet.” National Tax Journal 66 (2): 395–420.
Avi-Yonah, Reuven S., and Kimberly A. Clausing. 2008. “Reforming Corporate Taxation in a Global Economy: A Proposal To Adopt Formulary Apportionment.” In Path to Prosperity: Hamilton Project Ideas on Income Security, Education, and Taxes, edited by Jason Furman and Jason E. Bordoff, 319–44. Washington: Brookings Institution Press.
———. 2017. “Problems with Destination-Based Corporate Taxes and the Ryan Blueprint.” Columbia Journal of Tax Law 8: 229–55.
Avi-Yonah, Reuven S., Kimberly A. Clausing, and Michael C. Durst. 2009. “Allocating Business Profits for Tax Purposes: A Proposal to Adopt a Formulary Profit Split.” Florida Tax Review 9 (5): 497–553.
Baaij, Marc G., Tom J. M. Mom, Frans A. J. Van den Bosch, and Henk W. Volberda. 2015. “Why Do Multinational Corporations Relocate Core Parts of Their Corporate Headquarters Abroad?” Long Range Planning 48 (1): 46–58.
Baaij, Marc G., and Arjen H. L. Slangen. 2013. “The Role of Headquarters–Subsidiary Geographic Distance in Strategic Decisions by Spatially Disaggregated Headquarters.” Journal of International Business Studies 44 (9): 941–52.
Baldwin, Richard, and Paul Krugman. 2004. “Agglomeration, Integration, and Tax Harmonisation.” European Economic Review 48 (February): 1–23.
Baldwin, Richard, and Toshihiro Okubo. 2009. “Tax Reform, Delocation, and Heterogenous Firms.” Scandinavian Journal of Economics 111: 741–64.
Barrios, Salvador, Harry Huizinga, Luc Laeven, and Gaëtan Nicodème. 2012. “International Taxation and Multinational Firm Location Decisions.” Journal of Public Economics, Fiscal Federalism, 96 (11): 946–58.
Becker, Sascha O., Peter H. Egger, and Valeria Merlo. 2009. “How Low Business Tax Rates Attract Multinational Headquarters: Municipality-Level Evidence from Germany.” CESIFO Working Paper No. 2517. Munich.
Belderbos, René, Helen S. Du, and Anthony Goerzen. 2017. “Global Cities, Connectivity, and the Location Choice of MNC Regional Headquarters.” Journal of Management Studies 54 (8): 1271–1302.
Belz, Thomas, Leslie A. Robinson, Martin Ruf, and Christian Steffens. 2016. “Tax Avoidance as a Driver of Mergers and Acquisitions.” SSRN Scholarly Paper. Rochester, NY: Social Science Research Network.

63Does tax drive the headquarters locations of the world’s biggest companies?
Benito, Gabriel R. G., Randi Lunnan, and Sverre Tomassen. 2011. “Distant Encounters of the Third Kind: Multinational Companies Locating Divisional Headquarters Abroad.” Journal of Management Studies 48 (2): 373–94.
Birkinshaw, Julian, Pontus Braunerhjelm, Ulf Holm, and Siri Terjesen. 2006. “Why Do Some Multinational Corporations Relocate Their Headquarters Overseas?” Strategic Management Journal 27 (7): 681–700.
Bloom, Nicholas, Raffaella Sadun, and John Van Reenen. 2012. “The Organization of Firms Across Countries.” The Quarterly Journal of Economics 127 (4): 1663–1705.
Card, David, Kevin F. Hallock, and Enrico Moretti. 2010. “The Geography of Giving: The Effect of Corporate Headquarters on Local Charities.” Journal of Public Economics 94 (3): 222–34.
Clausing, Kimberly A. 2007. “Corporate Tax Revenues in OECD Countries.” International Tax and Public Finance 14: 115–33.
———. 2010. “Should Tax Policy Target Multinational Firm Headquarters?” National Tax Journal 63 (4): 741–63.
———. 2012. “In Search of Corporate Tax Incidence.” Tax Law Review 65 (3): 433–72.
———. 2014. “Corporate Inversions.” Washington DC: Tax Policy Center.
———. 2016a. “Competitiveness, Tax Base Erosion, and the Essential Dilemma of Corporate Tax Reform,” BYU Law Review, no. 6: 1649–80.
———. 2016b. “The Effect of Profit Shifting on the Corporate Tax Base in the United States and Beyond.” National Tax Journal 69 (4): 905–34.
———. 2016c. “Strengthening the Indispensable U.S. Corporate Tax.” Equitable Growth. September.
———. 2019. (Forthcoming.) Open: The Progressive Case for Free Trade, Immigration, and Global Capital. Cambridge: Harvard University Press.
Defever, Fabrice. 2012. “The Spatial Organization of Multinational Firms.” Canadian Journal of Economics/Revue Canadienne d’économique 45 (2): 672–97.
De Mooij, Ruud A., and Sjef Ederveen. 2003. “Taxation and Foreign Direct Investment: A Synthesis of Empirical Research.” International Tax and Public Finance 10 (November): 673–93.
———. 2008. “Corporate Tax Elasticities: A Reader’s Guide to Empirical Findings.” Oxford Review of Economic Policy 24: 680–97.
Desai, Mihir A. 2009. “The Decentering of the Global Firm.” World Economy 32 (9): 1271–90.
Dischinger, Matthias, Bodo Knoll, and Nadine Riedel. 2014a. “There’s No Place Like Home: The Profitability Gap between Headquarters and Their Foreign Subsidiaries.” Journal of Economics & Management Strategy 23 (2): 369–95.
———. 2014b. “The Role of Headquarters in Multinational Profit Shifting Strategies.” International Tax and Public Finance 21 (2): 248–71.
Egger, Peter, Doina Radulescu, and Nora Strecker. 2013. “Effective Labor Taxation and the International Relocation of Headquarters.” International Tax and Public Finance 20 (4): 631–52.
64 TRANSNATIONAL CORPORATIONS Volume 25, 2018, Number 2
Goerzen, Anthony, Christian Geisler Asmussen, and Bo Bernhard Nielsen. 2013. “Global Cities and Multinational Enterprise Location Strategy.” Journal of International Business Studies 44 (5): 427–50.
Haufler, Andreas, and Ian Wooton. 1999. “Country Size and Tax Competition for Foreign Direct Investment.” Journal of Public Economics 71: 121–39.
Huizinga, Harry, and Johannes Voget. 2009. “International Taxation and the Direction and Volume of Cross Border M&As.” Journal of Finance LXIV (June): 1217–49.
Kleinbard, Edward D. 2014. “Competitiveness Has Nothing to Do With It.” Tax Notes 144 (September).
Krugman, Paul R. 1991. Geography and Trade. Cambridge: MIT Press.
Laamanen, Tomi, Tatu Simula, and Sami Torstila. 2012. “Cross-Border Relocations of Headquarters in Europe.” Journal of International Business Studies 43 (2): 187–210.
McKinsey Global Institute. 2015. “Playing to Win: The New Global Competition for Corporate Profits.”
Shay, Stephen. 2014. “Mr. Secretary, Take the Tax Juice Out of Corporate Expatriations.” Tax Notes, July.
United Nations Conference on Trade and Development. 2015. World Investment Report 2015: Reforming International Investment Governance. Geneva: United Nations.
Voget, Johannes. 2011. “Relocation of Headquarters and International Taxation.” Journal of Public Economics 95 (9): 1067–81.
Wang, Danny T., Simon X. Zhao, Flora F. Gu, and Wendy Y. Chen. 2011. “Power or Market? Location Determinants of Multinational Headquarters in China.” Environment and Planning A: Economy and Space 43 (10): 2364–83.

65Does tax drive the headquarters locations of the world’s biggest companies?
Appendix
Data sources and definitions
Forbes provides annual rankings of the top 2000 public companies worldwide. The most recent list is provided and discussed here: https://www.forbes.com/global2000/#6e63f2b4335d.
Data on GDP, GDP per capita, and land area are from the World Bank’s World Development Indicators. Data on government effectiveness and corruption are from the World Bank’s World Governance Indicators.
Remoteness is from the UN Human Development Report. It is defined as the GDP-weighted average distance from world markets, calculated as the sum of all bilateral distances between the capitals of one country and all others, weighted by the partner country’s share in world GDP. The measure is calculated with 2012 World Bank GDP data and 2013 CEPII geographic distance data.
Statutory tax rates are from Ernst & Young’s Worldwide Corporate Tax Guides, with occasional supplementary information from the OECD Tax Database, Deloitte International Tax Source, KPMG Corporate Tax Rate Table, PricewaterhouseCoopers’ Paying Taxes Guides, and PKF International. The rates recorded generally reflect the standard statutory rate at the national level.
The annual ranking of world universities is from Shanghai Ranking Consultancy. The top 500 universities are ranked by a weighted index of Nobel Laureates and Field Medalists among alumni (10%) and faculty (20%), faculty citations (20%), faculty publications in Nature or Science (20%), the Science Citation Index-Expanded or Social Science Citation Index (20%), and per-capita academic performance (10%).
Educational attainment data, R&D expenditures, and researchers in R&D are from the UNESCO Institute for Statistics.
Patent and trademark application data are from the World Intellectual Property Organization.
Internet access data are from the International Telecommunication Union, World Telecommunication/ICT Development Report and database.
The Heritage Foundation economic freedom index comprises 12 sub-indexes organized into four broad categories: Rule of Law (property rights, government integrity, judicial effectiveness), Government Size (government spending, tax burden, fiscal health), Regulatory Efficiency (business freedom, labor freedom, monetary freedom), and Open Markets (trade freedom, investment freedom, financial freedom). Each index is graded on a 0-100 scale, and the non-weighted average of the 12 scores is the overall economic freedom score.
