article reflectometry study of the pyroelectric effect on
TRANSCRIPT
Article
Reflectometry Study of the Pyroelectric Effect on Proton-Ex-
change Channel Waveguides in Lithium Niobate
Roman Ponomarev 1,2 *, Yuri Konstantinov 1, Ivan Lobach 3, Maxim Belokrylov 1,2, and Denis Svevtsov 2
1 Perm Federal Research Center, Ural Branch, Russian Academy of Sciences, Perm, Russia; 2 Perm State National Research University, Perm, Russia; 3 Institute of Automation and Electrometry, Siberian Branch, Russian Academy of Sciences, Novosibirsk,
Russia
* Correspondence: [email protected]; Tel.: +7 9223151003
Abstract: This work is devoted to the study of the pyroelectric effect on the qualities of optical wave-
guides formed in a lithium niobate crystal by proton exchange. In the present work, we studied the
cessation effect of the radiation channeling during thermocycling of Y-splitters samples. We exam-
ined the spectral dependence of optical losses on a wavelength using an optical spectrum analyzer.
The results demonstrate that in the range of 1530–1570 nm, all wavelengths are suppressed equally.
The optical reflectometry method in the frequency domain (OFDR) shows that the increase of optical
losses is observed along the entire waveguide, but not only at the Y-splitting point, as supposed
earlier.
Keywords: lithium niobate, modulator, channel waveguide, pyroelectric effect, OFDR
1. Introduction
Integrated-optical circuits based on proton-exchange channel waveguides are the ba-
sis of integrated-optical modulators (IOMs) of radiation used in fiber-optic communica-
tion lines and are also the heart of navigation systems based on fiber-optic gyroscopes [1].
In addition, such modulators are used in quantum cryptography for the transmission of
quantum keys [2] and in single-photon detectors [3].
The undoubted importance of these IOMs applications requires their stable operation
in a wide temperature range, typically from minus 60 to plus 80 °C. The study [4] shows
that heating of the lithium niobate (LN) integrated-optical circuit, pre-cooled to low tem-
peratures, can lead to a significant increase in optical losses in the channel or even com-
plete cessation of radiation channeling. This phenomenon is most dangerous when using
IOMs as part of a fiber-optic gyroscope since the conditions of "switching off" the wave-
guides may well be recreated during actual system operation.
The essence of the phenomenon under study is that the action of the pyroelectric
effect in a lithium niobate crystal results in a redistribution of the charged defects in the
crystal lattice, leading to a local decrease in the refractive index of optical waveguides
with respect to the surrounding crystal. In some cases, the Δn value for waveguides may
become so small that the conditions for channeling of the fundamental mode of radiation
stop being fulfilled. This phenomenon, described theoretically in [5], was not observed in
the experimental works before [4] due to relatively rare conditions for the experiment –
cooling the sample to low temperatures and its rapid heating. Usually, IOMs are not tested
under such conditions; for most commercially available IOMs, the operating temperature
range declared is from 0 to 80 °C. Also, pyroelectric influence to proton exchanged wave-
guides was studied in [6] and it was shown that electrodes play huge role in waveguide
optical properties changing.
In the study [4], we measured only the optical signal power at the IOM output, and
it is not precisely determined which point of the integrated-optical circuit the signal chan-
neling is terminated in, whether this area is extended or point-wise, how does the
Preprints (www.preprints.org) | NOT PEER-REVIEWED | Posted: 1 October 2021 doi:10.20944/preprints202110.0029.v1
© 2021 by the author(s). Distributed under a Creative Commons CC BY license.
restoration of the channel waveguide properties occur, what the spectral sensitivity of the
effect under study is. The present work aims to answer these questions and investigate in
more detail the processes occurring inside the waveguide during a change in the crystal
temperature. Several experimental approaches were used to solve the task. In the first
stage, the IOM transmittance qualities and their temperature dependence were analyzed.
We also used the distributed methods to study the backscattered signal based on coherent
frequency domain reflectometry (optical frequency domain reflectometry, for short),
which, in contrast to classical time-domain reflectometry, allows one to obtain micron
spatial resolution [7]. Its principle is based on the spectral analysis of the interference sig-
nal arising from mixing the probing and scattered radiation. This analysis can be per-
formed by sweeping the optical frequency of continuous probing radiation. In this case,
the spatial coordinate of the reflectors along the line under study is proportional to the
frequency coordinate of the Fourier spectrum from the interference signal measured dur-
ing optical frequency sweep. The essential element of a coherent optical frequency reflec-
tometer is a tunable source of radiation with a long coherence length. In this case, the
spatial resolution is determined by the sweeping range of the probing laser wavelength.
The high sensitivity of such a reflectometer to the reflection coefficient (better than 120
dB/mm) makes it possible to characterize refractive index inhomogeneities embedded in
the optical fiber. In particular, this property makes it possible to use the small frozen-in
fluctuations of the refractive index specific to conventional optical fibers for various sens-
ing tasks [8]. Thus, optical frequency reflectometry is currently the most sensitive method
for studying small optical elements with micron spatial resolution.
2. Experimental procedure
2.1. Samples studied and temperature tests methodology
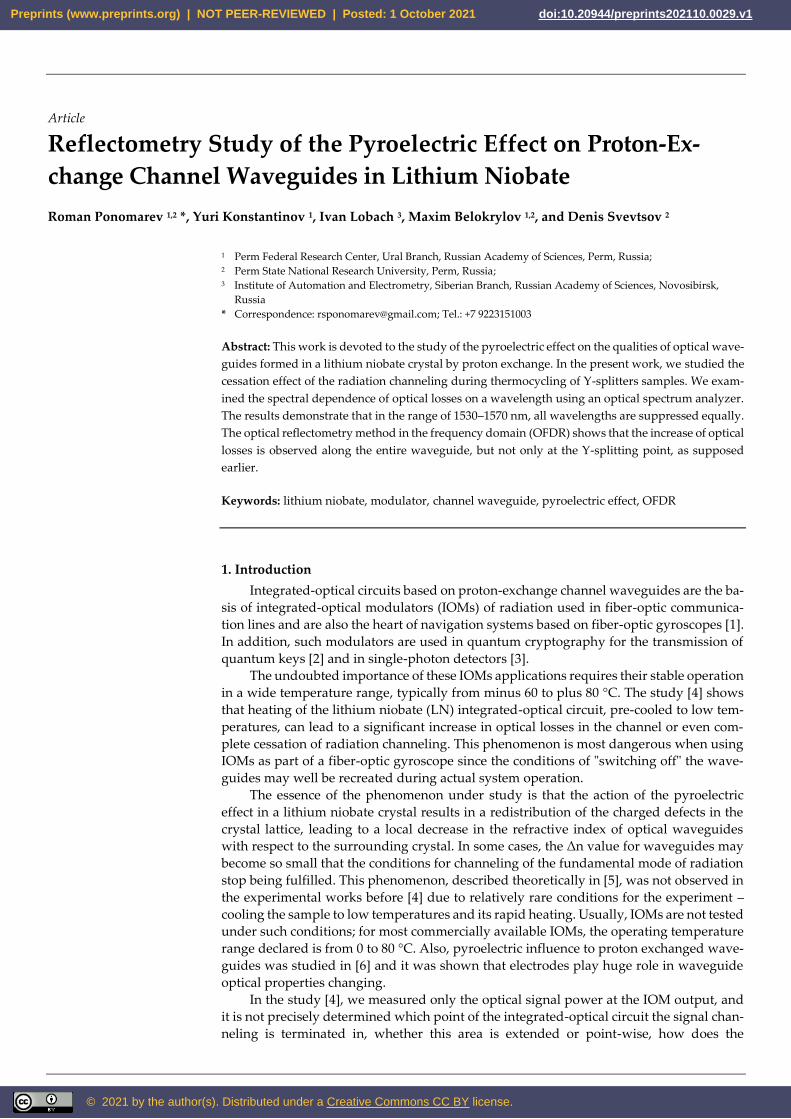
The samples studied were IOMs with the waveguide topology in the form of a Y-
splitter with the electrodes placed on each side (Fig. 1). They were made using X-cut con-
gruent LN produced by Crystal Technology (USA). Channel waveguides were created
using direct photolithography. Channel waveguides with a width of 6 μm were formed
by proton exchange in benzoic acid. Proton exchange was performed in a closed zirco-
nium reactor at 170 °C for 2 hours, followed by cooling at a rate of 10 °C/min. Annealing
was performed at 350 °C for 5.5 hours, followed by cooling together with the furnace. As
a result, optical channel waveguides with Δn = 0.017 were formed, measured by mode
spectroscopy. The final step involved docking the chip with an optical fiber maintaining
the polarization of radiation, type Panda. The pyroelectric effect in the samples was not
suppressed. Before the experiment, the samples were thoroughly cleaned to remove pos-
sible surface contaminants. The physical length of the modulator is l = 38 mm. The wave-
guides in the modulator are located along the Y-axis in the X-cut plane.
Figure 1. Schematic diagram. Studied sample.
In all studies, the examined sample was subjected to temperature tests. For this pur-
pose, the IOM was placed in the heat and cold chamber Espec 712R, where it was exposed
Preprints (www.preprints.org) | NOT PEER-REVIEWED | Posted: 1 October 2021 doi:10.20944/preprints202110.0029.v1

to slow cooling to minus 60 °C at a rate of 0.5 degrees per minute, and then — to abrupt
heating at a rate of 4 degrees per minute to 60 °C.
2.2 Study of transmission characteristics
In the first stage, we studied the transmission characteristics of the IOM depending
on the waveguide mode of operation. The dependences of the output optical power and
transmission spectrum were investigated. The measuring diagram is shown in Fig. 2.
Figure 2. The schematic diagram for measuring IOM transmission characteristics
As probing radiation, we used a broadband radiation source of spontaneous radia-
tion ASE, with illumination in the range from 1520 to 1570 nm, the signal from which was
fed to the standard input of the studied modulator with simultaneous registration of op-
tical power coming out of two other channels of the modulator. Detection was carried out
by photodetectors PD1 and PD2; data acquisition boards recorded the signal. In parallel,
part of the power from the upper channel was transmitted to the OSA optical spectrum
analyzer via a fiber splitter. The optical power was measured at the output of the IOM as
its temperature changed. The dependence graph of the optical power and temperature on
time is shown in Fig. 3.
Figure 3. Dependence of the output power in the two channels (orange and blue curves) of the
IOM and the sample temperature on time.
Simultaneously with the optical power measurement of the, we measured the optical
transmission spectra of the IOM studied. Fig. 4 shows two spectra: at room temperature
Preprints (www.preprints.org) | NOT PEER-REVIEWED | Posted: 1 October 2021 doi:10.20944/preprints202110.0029.v1

and in the radiation channeling suppression mode. Fig. 5 shows the dynamics of the prob-
ing radiation spectrum normalized to the spectrum at the initial moment in the form of a
heat map. It can be seen from Fig. 5-6 that cooling leads to a decrease in the transmittance
of one of the IOM channels.
Figure 4. Transmitted radiation spectra for the modulator in the mode of regular operation and
the radiation channeling suppression.
Figure 5. Temperature dynamics of the normalized radiation spectra. The spectra are normalized
to the spectrum at the initial moment.
Preprints (www.preprints.org) | NOT PEER-REVIEWED | Posted: 1 October 2021 doi:10.20944/preprints202110.0029.v1

Figure 6. Dependence of the normalized losses on time at different wavelengths.
2.3 Study of scattering characteristics
Thus, the experiments on transmission characteristics showed that there is a suppres-
sion of channeling at some temperatures/temperature gradients in the IOM. One question
is the spatial nature of this suppression: the channeling occurs at a single point (e.g., a
branching point) or has a distributed nature. For this purpose, the IOM was examined
using a distributed method of measuring the scattering characteristics based on frequency
reflectometry using the Luna OBR 5T-50 device. The schematic course of the experiment
is presented in Fig.7.
Figure 7. Reflectometric characteristics measuring circuit.
A linearly tunable wavelength coherent laser signal was introduced into the IOM; the
sweeping range was from 1530 to 1570 nm. To exclude the overlapping of signals from
the two IOM arms, radiation was introduced only into one of the output ports of the mod-
ulator under study. The obtained signal – traces (reflectogram) represent the dependence
of the backscattered power from the coordinate inside the waveguides of the studied sam-
ple. In the course of the experiment, the traces were recorded as the temperature of the
IOM changed.
Preprints (www.preprints.org) | NOT PEER-REVIEWED | Posted: 1 October 2021 doi:10.20944/preprints202110.0029.v1

Figure 8. Typical trace of the IOM studied at different moments of the thermal cycle time. Traces
are shifted relative to each other by 20 dB
Typical traces in the IOM area at different moments of the thermal cycle are shown
in Fig. 8. The IOM trace is characterized by peaks corresponding to the points where the
refractive index changes and Fresnel reflection occurs. In particular, the left peak (A) is
due to the reflection of the radiation introduced from the fiber-waveguide interface of the
IOM. The right peak (D) corresponds to the IOM-optical fiber interface. The measured
length of the IOM as the distance between the peaks — 35 mm is consistent with its phys-
ical length. The peaks and the specific areas between them (e.g., areas B and C in Fig.8)
are inside the IOM. The temperature dynamics of the traces are presented as a heat map
in Fig. 9.
Figure 9. Color map of multiple reflectograms.
3. Discussion of the results obtained
The experiments showed a dramatic decrease in the output optical power being ob-
served when the cooled sample is aggressively heated (Fig. 3). The spectral analysis
showed that the decrease occurs uniformly in the whole measured spectral range (Fig.6).
This speaks for the legitimacy of the frequency modulation technique. Reflectometric
Preprints (www.preprints.org) | NOT PEER-REVIEWED | Posted: 1 October 2021 doi:10.20944/preprints202110.0029.v1

measurements demonstrated the changes in the intensities of the return signals in differ-
ent parts of the IOM during the thermal cycle. Initially, it was assumed that a sharp change
in the reflectogram would be observed in the waveguides branching area because it is
there that the dislocation grid surrounding the waveguides has the greatest width, facili-
tating the movement of the charged defects, which affect the waveguide refractive index.
Figure 10. Temperature dynamics of the intensity in the IOM different areas.
Further, we analyzed the temperature behavior in different areas of the IOM (Fig.10):
1. The input peak (A) corresponding to the transition from fiber to IOM. The magni-
tude of the peak has a relatively stable value at -90 dB and has no features. This behavior
is since temperature changes do not affect the fiber feeding the IOM.
2. The input side of the IOM (B). During the period of uniform cooling from room
temperature to -60 °C, the almost constant growth of the optical intensity in this location
from -110 to 100 dB was observed. When changing cooling to heating, the dependence
demonstrates at first a dip to -112 dB (near the time of 100 minutes) and immediately after
– a rise to -97 dB (near the time of 110 minutes). It should be noted that topologically there
are no significant events in the modulator in this location, such as channel splitting or a
sharp drop in the refractive index. The length of the area with similar behavior is about 5
mm (Fig.8). We assume that the pyroeffect introduced the most remarkable surge of the
refractive index at this location in this chip design. Further, the nature of the temperature
behavior changes. The second area inside the IOM is about 20 mm and ends at the output
side of the IOM.
3. The output side of the chip (C). There is a topologically important point in this
area, which is responsible for combining the channels. Previously, it was assumed that the
pyro effect could make the most significant changes in the waveguide properties of the
chip precisely in this area. However, in both experiments conducted, the radiation inten-
sity in this area has only a moderate correlation with the intensity in the input part of the
chip and before the cooling is replaced by heating. During the period of sharp heating, the
character of this curve does not change in both cases as well, which may indicate that the
signal intensity in this area is not related to the pyro effect. It should be noted, however,
more intensive fluctuations of the signal (about 10 dB), the amplitude of which grows with
cooling, and the character itself visually resemble a periodic one. This is quite clearly ob-
served both on individual graphs and on the heat map. The authors cannot explain their
nature now.
4. The output peak (D) corresponds to the radiation output from the IOM into the
optical fiber. It should be noted that the intensity of this peak has a solid and commensu-
rate inverse relationship with the intensity of artifacts in the input part of the chip. At the
start of intensive heating, the output peak significantly decreases its intensity, while the
Preprints (www.preprints.org) | NOT PEER-REVIEWED | Posted: 1 October 2021 doi:10.20944/preprints202110.0029.v1
intensity in the assumed area of the pyro effect grows just as sharply. That is, an anti-
correlation is observed at point D and area B. This is explained by the fact that a significant
portion of the radiation is scattered or reflected in this location and does not reach the
output end of the IOM.
Based on the results obtained, it can be argued that significant losses occur in a par-
ticular location with a length of 5 mm (area C). That is, the effect of channeling suppres-
sion is not point-wise but distributed. At the same time, the losses are due to an increase
in the backscattered signal in this area, which can be associated with a change in the re-
fractive index. Most clearly, this increase occurs during rapid heating at sufficiently low
temperatures.
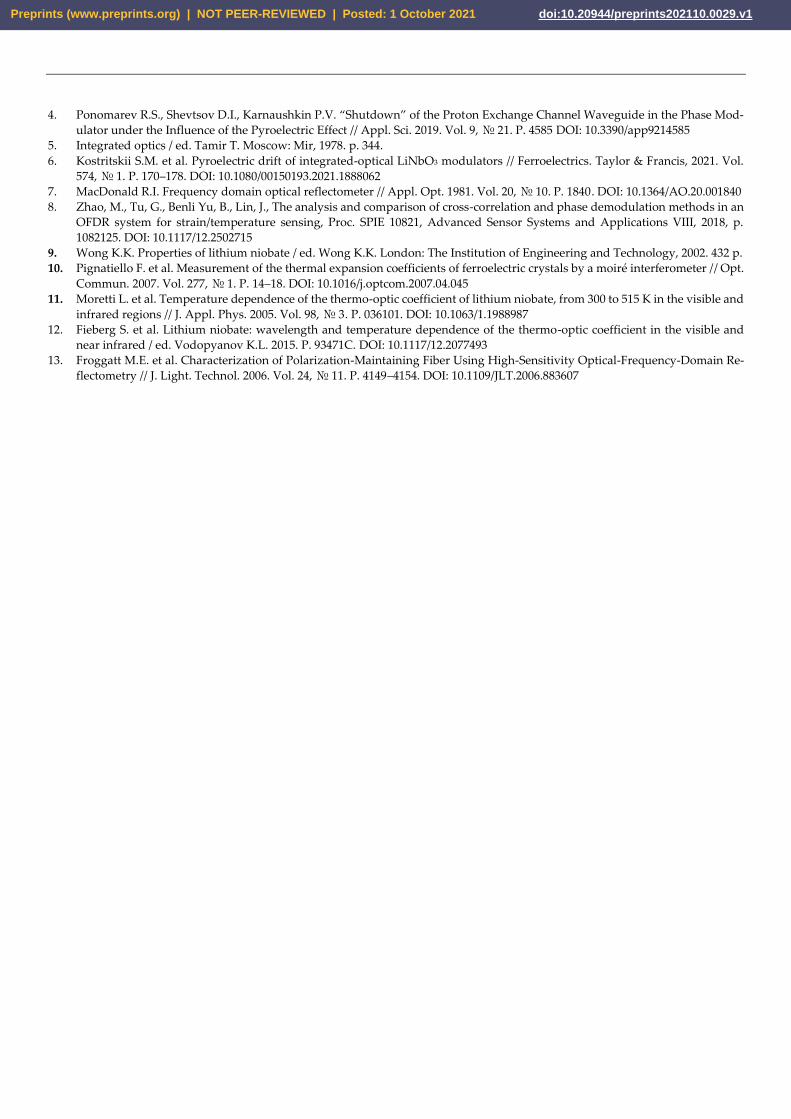
Figure 11. Displacement of coordinates of the beginning (A) and the end (D) of the IOM peaks.
Also, from Fig.9, we can notice the shift of all peaks during the thermal cycle. The
analysis of the trace dynamics shows that all peaks translocate in proportion to the sample
temperature, shifting to the right with increasing temperature and to the left with decreas-
ing temperature. As can be seen from the trace diagrams, both prominent DUT peaks —
both the input and the output shift as the temperature changes along the coordinate
(Fig. 11). It can be assumed that the principal shift of the coordinates of the peaks is due
to a change in the refractive index of the light-feeding optical fiber, the length of which is
much longer than the length of the modulator. Then, to study the processes occurring in
the modulator waveguides, it is necessary to study the difference in coordinates of input
and output peaks as a function of temperature. It is this difference that will characterize
the thermo-optic effect and the linear thermal expansion of the crystal. It should be noted
that, in this consideration, we neglect the minor effects due to the temperature gradient
inside the modulator chip when it is heated unevenly. We are entitled to make such ne-
glect due to the small volume and mass of the crystal compared to the volume of the ther-
mal chamber, the relatively low heat capacity of lithium niobate, and the low rate of tem-
perature change. When changing the modulator temperature, several phenomena simul-
taneously contribute to the shift of peak coordinates: a change in the crystal's refractive
index due to the thermo-optical effect Δlw and a change in the physical length of the crystal
due to linear thermal expansion ΔlTE. Then Δlout - Δlin = Δlw + ΔlTE. Let us evaluate each of
the above contributions for the temperature change ΔT = 120 °C. As indicated in [9], the
coefficient of thermal expansion of LN for X- and Y-cuts depends little on the crystal com-
position and has insignificant changes in the temperature range from 220 to 553 K, which
includes the range of temperature changes of the sample studied. For linear thermal ex-
pansion, we can use the relation ΔlTE = α·l·ΔT, where α is the coefficient of linear thermal
expansion for a given direction, ΔT is the change in the crystal temperature. For the inves-
tigated crystal cut α = 13.4-10-6 1/K [10], as a result, the change in physical length can be
Preprints (www.preprints.org) | NOT PEER-REVIEWED | Posted: 1 October 2021 doi:10.20944/preprints202110.0029.v1

estimated as ΔlTE = α·l·ΔT = 61 μm. The change of optical path is 134 μm. The value of the
average thermo-optical coefficient for the target temperature range is β = 3.35·10-5 1/K for
the uncommon refractive index and the emission wavelength of 1523 nm [11,12]. The
change in length associated with the thermo-optic effect can be calculated by the formula
Δlw = l · Δn = l·(β·ΔT) = 152 μm. Thus, the total change in the optical path is 286 μm.
The experimental shift of peaks in the trace was associated with the sample temper-
ature change (Fig.11) Δl = (4.195-3.545) · ΔT = 78 μm. The change in the optical path makes
171 µm.
The difference between the experimental results and calculation can be explained by
shielding the waveguides of mobile charges from crystal lattice and decreasing of pyroe-
lectric effect.
4. Conclusions
The influence of the pyroelectric effect on the characteristics of proton-exchange
channel waveguides in lithium niobate has been studied using spectroscopic and distrib-
uted methods. It is confirmed that a rapid temperature change can lead to a sharp increase
in optical losses in the channel waveguide up to 50 dB. The study results show that the
suppression effect has no spectral selectivity in the wavelength range from 1530 to
1570 nm. Using the OFDR method, it is shown that during the suppression of channeling
radiation, the reflection in the channel waveguide increases along almost its entire length,
except for short segments near the ends of the chip. The data obtained confirm the validity
of the proposed explanation for the waveguide "off" effect, associated with the movement
of the charged defects in the lattice of lithium niobate and the shielding of the waveguide
relative to the surrounding crystal. The shift in the coordinates of the reflection peaks ob-
served in the experiment, which does not coincide in magnitude with the calculated value,
can also be explained by the fact that the waveguide and the surrounding crystal matrix
do not change their refractive index to the same degree under the action of the pyroelectric
effect. We hope to provide the more detailed studies with the commercial OFDR setups
[13] as well as by using our own equipment to study the phase of the light near the area
with waveguide "switch off".
Author Contributions: Roman Ponomarev and Ivan Lobach — methodology, supervision; Yuri
Konstantinov and Maxim Belokrylov — experiment and discussion; Denis Shevtsov — project ad-
ministration. All authors have read and agreed to the published version of the manuscript.
Funding: The research regarding obtaining and analyzing of traces (section 2.3) was done under the
sponsorship of the Russian Foundation for Basic Research and the Perm region within the scientific
project No. 19-48-590018 r_а; the study of samples spectral characteristics (section 2.2) was per-
formed within the state assignment No.AAАA19-119042590085-2.
Institutional Review Board Statement: Not applicable
Informed Consent Statement: Informed consent was obtained from all subjects involved in the
study.
Acknowledgments: We thank Claude D., the engineer of Photonics Lab PFRC UB RAS for his help
in setting up the experiment and analyzing the results.
Conflicts of Interest: The authors declare no conflict of interest.
References
1. Wooten E., Kissa K., Yi-Yan A. A review of lithium niobate modulators for fiber-optic communications systems // Sel. Top.
Quantum Electron. 2000. Vol. 6, № 1. P. 69–82. DOI: 10.1109/2944.826874
2. Roberts, G. L., Pittaluga, M., Minder, M., Lucamarini, M., Dynes, J. F., Yuan, Z. L., & Shields, A. J. (2018). Patterning-effect
mitigating intensity modulator for secure decoy-state quantum key distribution. Optics Letters, 43(20), 5110 DOI:
10.1364/OL.43.005110
3. Liang, L.-Y., Liang, J.-S., Yao, Q., Zheng, M.-Y., Xie, X.-P., Liu, H., Zhang, Q., & Pan, J.-W. (2019). Compact all-fiber polarization-
independent up-conversion single-photon detector. Optics Communications, 441, 185–189. DOI: 10.1016/j.optcom.2019.02.057
Preprints (www.preprints.org) | NOT PEER-REVIEWED | Posted: 1 October 2021 doi:10.20944/preprints202110.0029.v1
4. Ponomarev R.S., Shevtsov D.I., Karnaushkin P.V. “Shutdown” of the Proton Exchange Channel Waveguide in the Phase Mod-
ulator under the Influence of the Pyroelectric Effect // Appl. Sci. 2019. Vol. 9, № 21. P. 4585 DOI: 10.3390/app9214585
5. Integrated optics / ed. Tamir T. Moscow: Mir, 1978. p. 344.
6. Kostritskii S.M. et al. Pyroelectric drift of integrated-optical LiNbO3 modulators // Ferroelectrics. Taylor & Francis, 2021. Vol.
574, № 1. P. 170–178. DOI: 10.1080/00150193.2021.1888062
7. MacDonald R.I. Frequency domain optical reflectometer // Appl. Opt. 1981. Vol. 20, № 10. P. 1840. DOI: 10.1364/AO.20.001840
8. Zhao, M., Tu, G., Benli Yu, B., Lin, J., The analysis and comparison of cross-correlation and phase demodulation methods in an
OFDR system for strain/temperature sensing, Proc. SPIE 10821, Advanced Sensor Systems and Applications VIII, 2018, p.
1082125. DOI: 10.1117/12.2502715
9. Wong K.K. Properties of lithium niobate / ed. Wong K.K. London: The Institution of Engineering and Technology, 2002. 432 p.
10. Pignatiello F. et al. Measurement of the thermal expansion coefficients of ferroelectric crystals by a moiré interferometer // Opt.
Commun. 2007. Vol. 277, № 1. P. 14–18. DOI: 10.1016/j.optcom.2007.04.045
11. Moretti L. et al. Temperature dependence of the thermo-optic coefficient of lithium niobate, from 300 to 515 K in the visible and
infrared regions // J. Appl. Phys. 2005. Vol. 98, № 3. P. 036101. DOI: 10.1063/1.1988987
12. Fieberg S. et al. Lithium niobate: wavelength and temperature dependence of the thermo-optic coefficient in the visible and
near infrared / ed. Vodopyanov K.L. 2015. P. 93471C. DOI: 10.1117/12.2077493
13. Froggatt M.E. et al. Characterization of Polarization-Maintaining Fiber Using High-Sensitivity Optical-Frequency-Domain Re-
flectometry // J. Light. Technol. 2006. Vol. 24, № 11. P. 4149–4154. DOI: 10.1109/JLT.2006.883607
Preprints (www.preprints.org) | NOT PEER-REVIEWED | Posted: 1 October 2021 doi:10.20944/preprints202110.0029.v1