article tpr dynamics of drug master filings at united states food and drug...
TRANSCRIPT
PRTARTICLE
65THE PHARMA REVIEW ■ MAY - JUNE 2012
Dynamics of Drug Master Filings at United States Food and Drug Administration Rau. B. S1 Appaji P. V2
Abstract: Drug master filing at USFDA in one of the parameters that helps in knowing the potentiality of a country in the field of pharmaceuticals. Filing a drug master file at USFDA implies that the company is claiming manufacturing drug and facility suitable for USFDA rules and regulations. Several incidences are available where a company do have a USFDA approved facility but do not have financial viability of the developed products. Patent Facilitation Center at Pharmexcil of India believes that providing lead information to develop innovative products finally leads to protection of intellectual property. The article mainly concentrates statistics relating to type II drug master filing at USFDA since manufacturing drugs in USFDA approved facilities usually comply global standards.
IntroductionAs per the regulatory guidelines, it is mandatory to file a drug master file and after being approved, releasing the drug into the market. A drug master file may be for a bulk drug or for a formulation. A drug master file declared by the company provides in detail the manufacturing place, physicochemical properties, pharmacodynamic/kinetic, toxicology studies of the bulk drugs and formulations, therapeutic class, dosage form, strength, route of administration, labeling, packaging etc. Filing a drug master file at USFDA by a company is an indication that the company is claiming its capability in manufacturing and having a facility complying USFDA rules and regulations. Filing drug master files from countries other than United States, give a provision to the US pharmaceutical organizations recommending foreign country facilities utilizing the manufactured products upon approval by the USFDA authorities to market in United States.It is necessary to understand DMF filings by pharmaceutical industries give an indication of potential market both in terms of volume and value. Drug master files are classified into five types by the USFDA and are as follows:
Type I : Manufacturing Site, Facilities, Operating Procedures, and Personnel (no longer applicable) Type II : Drug Substance, Drug Substance Intermediate, and Material Used in Their Preparation, or Drug Product Type III : Packaging Material Type IV : Excipient, Colorant, Flavor, Essence, or Material Used in Their Preparation Type V : FDA Accepted Reference InformationAt USFDA, DMF filings are classified as “I”-Inactive, “A”-Active, “N”-Not an assigned number, “P”-DMF Pending Filing Review
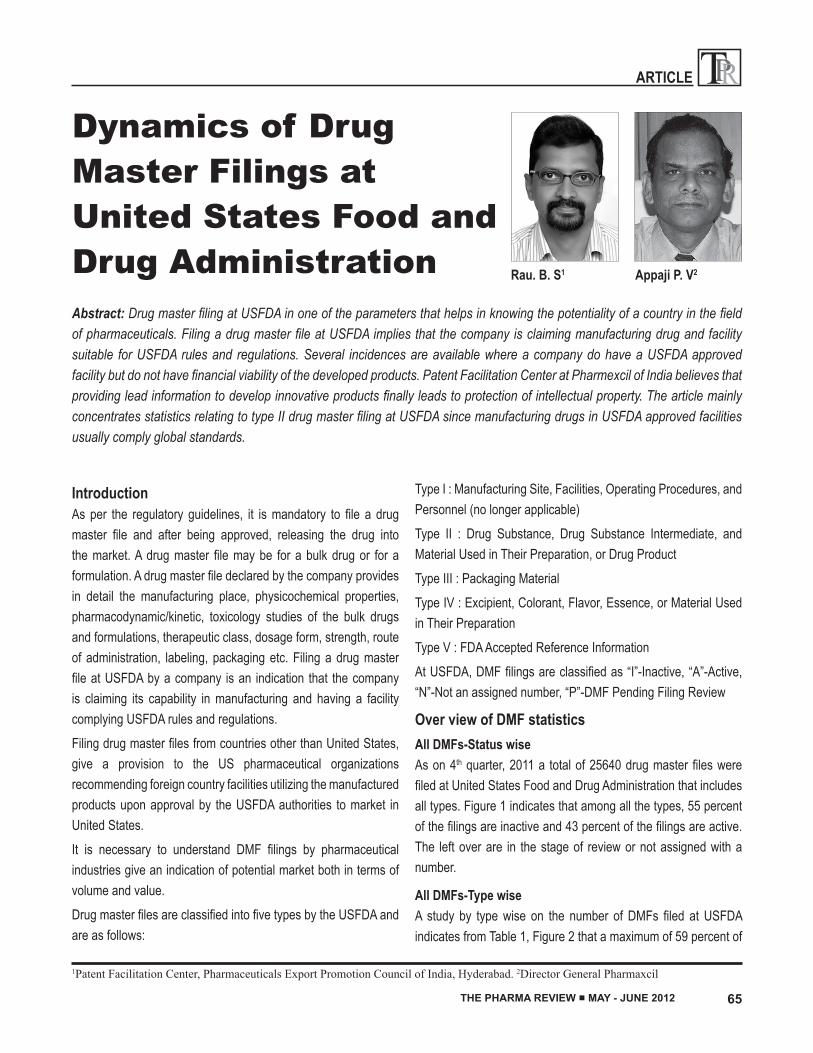
Over view of DMF statisticsAll DMFs-Status wiseAs on 4th quarter, 2011 a total of 25640 drug master files were filed at United States Food and Drug Administration that includes all types. Figure 1 indicates that among all the types, 55 percent of the filings are inactive and 43 percent of the filings are active. The left over are in the stage of review or not assigned with a number.
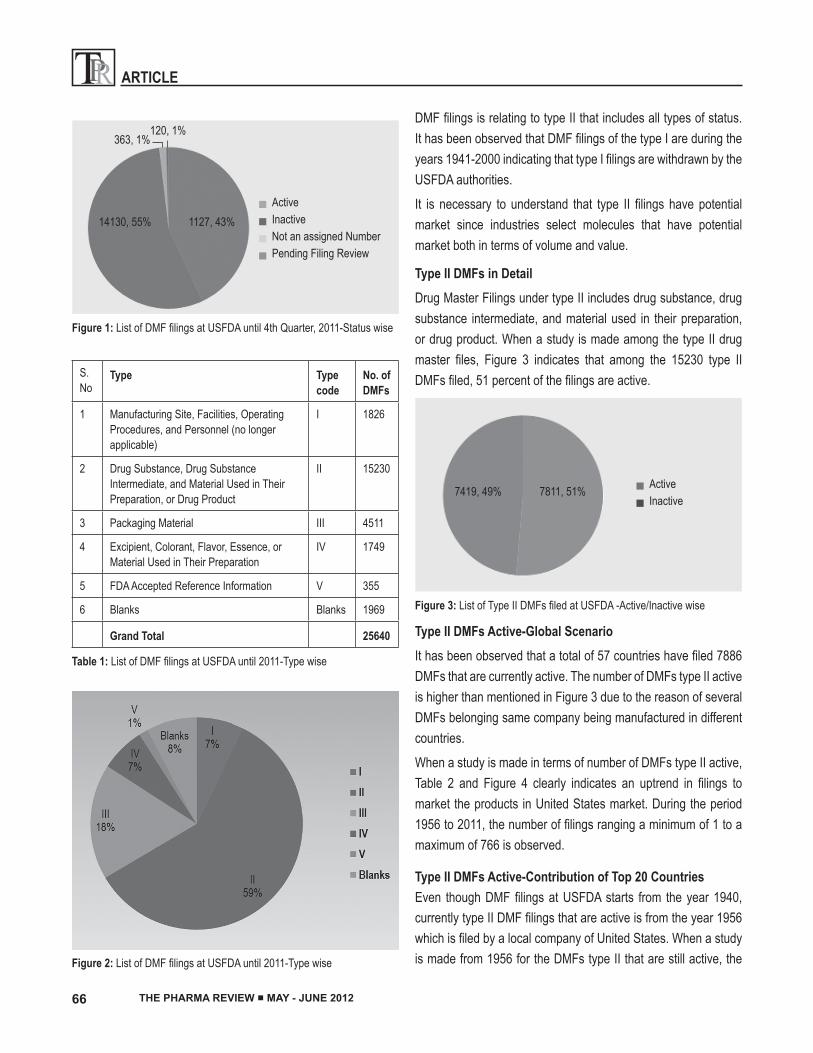
All DMFs-Type wise A study by type wise on the number of DMFs filed at USFDA indicates from Table 1, Figure 2 that a maximum of 59 percent of
1Patent Facilitation Center, Pharmaceuticals Export Promotion Council of India, Hyderabad. 2Director General Pharmaxcil
PRT ARTICLE
66 THE PHARMA REVIEW ■ MAY - JUNE 2012
DMF filings is relating to type II that includes all types of status. It has been observed that DMF filings of the type I are during the years 1941-2000 indicating that type I filings are withdrawn by the USFDA authorities.
It is necessary to understand that type II filings have potential market since industries select molecules that have potential market both in terms of volume and value.
Type II DMFs in DetailDrug Master Filings under type II includes drug substance, drug substance intermediate, and material used in their preparation, or drug product. When a study is made among the type II drug master files, Figure 3 indicates that among the 15230 type II DMFs filed, 51 percent of the filings are active.
Figure 3: List of Type II DMFs filed at USFDA -Active/Inactive wise
ActiveInactive
7811, 51%7419, 49%
Type II DMFs Active-Global ScenarioIt has been observed that a total of 57 countries have filed 7886 DMFs that are currently active. The number of DMFs type II active is higher than mentioned in Figure 3 due to the reason of several DMFs belonging same company being manufactured in different countries.
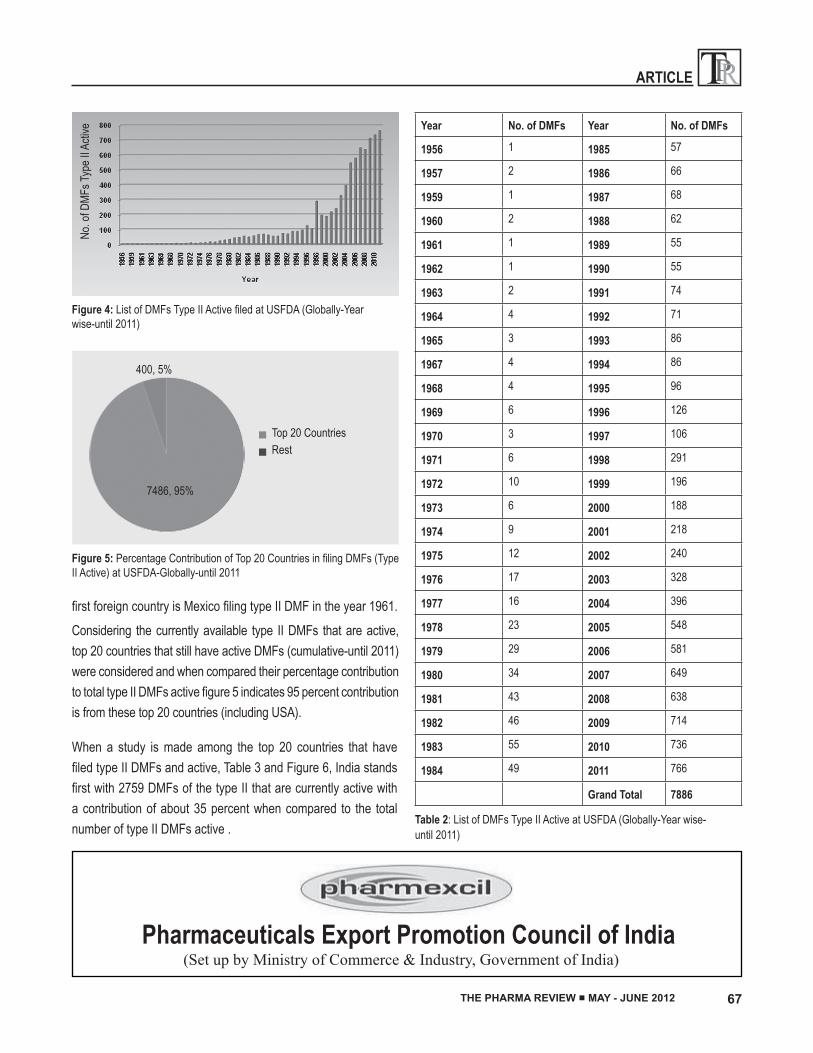
When a study is made in terms of number of DMFs type II active, Table 2 and Figure 4 clearly indicates an uptrend in filings to market the products in United States market. During the period 1956 to 2011, the number of filings ranging a minimum of 1 to a maximum of 766 is observed.
Type II DMFs Active-Contribution of Top 20 CountriesEven though DMF filings at USFDA starts from the year 1940, currently type II DMF filings that are active is from the year 1956 which is filed by a local company of United States. When a study is made from 1956 for the DMFs type II that are still active, the
S. No
Type Type code
No. of DMFs
1 Manufacturing Site, Facilities, Operating Procedures, and Personnel (no longer applicable)
I 1826
2 Drug Substance, Drug Substance Intermediate, and Material Used in Their Preparation, or Drug Product
II 15230
3 Packaging Material III 4511
4 Excipient, Colorant, Flavor, Essence, or Material Used in Their Preparation
IV 1749
5 FDA Accepted Reference Information V 355
6 Blanks Blanks 1969
Grand Total 25640
Table 1: List of DMF filings at USFDA until 2011-Type wise
Figure 2: List of DMF filings at USFDA until 2011-Type wise
Figure 1: List of DMF filings at USFDA until 4th Quarter, 2011-Status wise
ActiveInactive Not an assigned NumberPending Filing Review
1127, 43%14130, 55%
363, 1%120, 1%
PRTARTICLE
67THE PHARMA REVIEW ■ MAY - JUNE 2012
Year No. of DMFs Year No. of DMFs
1956 1 1985 57
1957 2 1986 66
1959 1 1987 68
1960 2 1988 62
1961 1 1989 55
1962 1 1990 55
1963 2 1991 74
1964 4 1992 71
1965 3 1993 86
1967 4 1994 86
1968 4 1995 96
1969 6 1996 126
1970 3 1997 106
1971 6 1998 291
1972 10 1999 196
1973 6 2000 188
1974 9 2001 218
1975 12 2002 240
1976 17 2003 328
1977 16 2004 396
1978 23 2005 548
1979 29 2006 581
1980 34 2007 649
1981 43 2008 638
1982 46 2009 714
1983 55 2010 736
1984 49 2011 766
Grand Total 7886
Table 2: List of DMFs Type II Active at USFDA (Globally-Year wise- until 2011)
Figure 4: List of DMFs Type II Active filed at USFDA (Globally-Year wise-until 2011)
No. o
f DMF
s Typ
e II A
ctive
Figure 5: Percentage Contribution of Top 20 Countries in filing DMFs (Type II Active) at USFDA-Globally-until 2011
Top 20 CountriesRest
7486, 95%
400, 5%
When a study is made among the top 20 countries that have filed type II DMFs and active, Table 3 and Figure 6, India stands first with 2759 DMFs of the type II that are currently active with a contribution of about 35 percent when compared to the total number of type II DMFs active .
first foreign country is Mexico filing type II DMF in the year 1961. Considering the currently available type II DMFs that are active, top 20 countries that still have active DMFs (cumulative-until 2011) were considered and when compared their percentage contribution to total type II DMFs active figure 5 indicates 95 percent contribution is from these top 20 countries (including USA).
Pharmaceuticals Export Promotion Council of India(Set up by Ministry of Commerce & Industry, Government of India)
PRT ARTICLE
68 THE PHARMA REVIEW ■ MAY - JUNE 2012
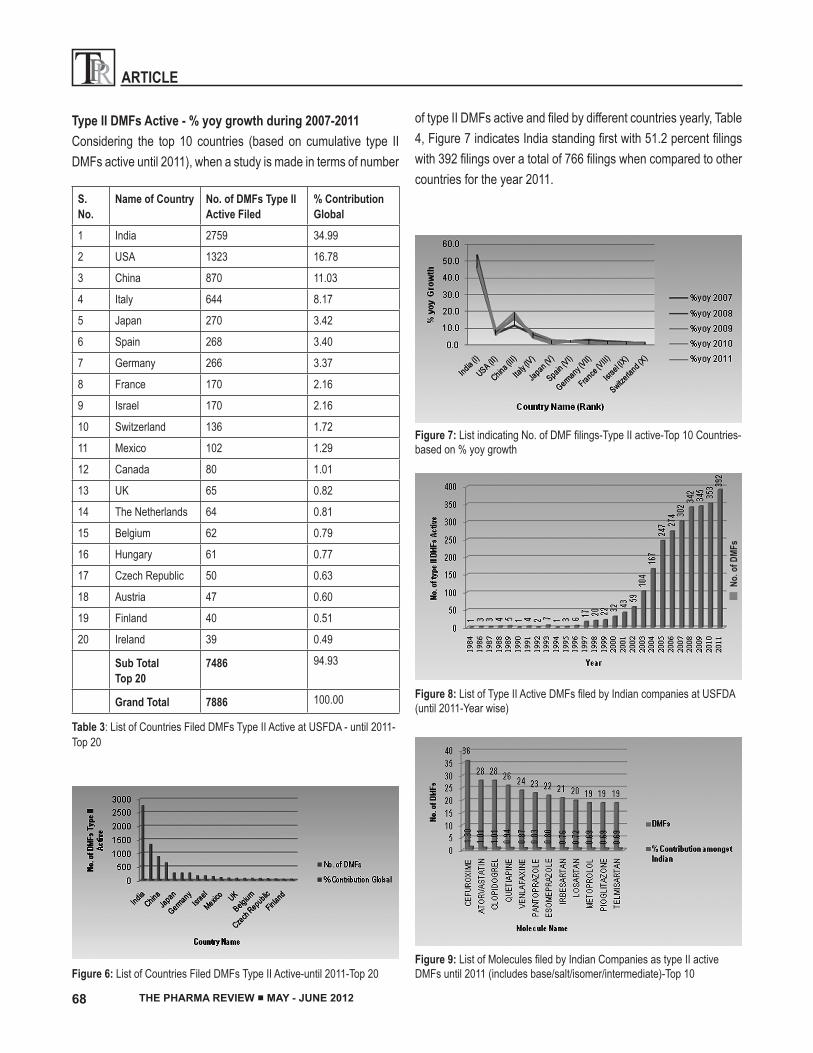
Figure 7: List indicating No. of DMF filings-Type II active-Top 10 Countries-based on % yoy growth
Figure 8: List of Type II Active DMFs filed by Indian companies at USFDA (until 2011-Year wise)
No. o
f DMF
s
Figure 9: List of Molecules filed by Indian Companies as type II active DMFs until 2011 (includes base/salt/isomer/intermediate)-Top 10Figure 6: List of Countries Filed DMFs Type II Active-until 2011-Top 20
S. No.
Name of Country No. of DMFs Type II Active Filed
% Contribution Global
1 India 2759 34.99
2 USA 1323 16.78
3 China 870 11.03
4 Italy 644 8.17
5 Japan 270 3.42
6 Spain 268 3.40
7 Germany 266 3.37
8 France 170 2.16
9 Israel 170 2.16
10 Switzerland 136 1.72
11 Mexico 102 1.29
12 Canada 80 1.01
13 UK 65 0.82
14 The Netherlands 64 0.81
15 Belgium 62 0.79
16 Hungary 61 0.77
17 Czech Republic 50 0.63
18 Austria 47 0.60
19 Finland 40 0.51
20 Ireland 39 0.49
Sub Total Top 20
7486 94.93
Grand Total 7886 100.00
Table 3: List of Countries Filed DMFs Type II Active at USFDA - until 2011-Top 20
Type II DMFs Active - % yoy growth during 2007-2011Considering the top 10 countries (based on cumulative type II DMFs active until 2011), when a study is made in terms of number
of type II DMFs active and filed by different countries yearly, Table 4, Figure 7 indicates India standing first with 51.2 percent filings with 392 filings over a total of 766 filings when compared to other countries for the year 2011.
PRTARTICLE
69THE PHARMA REVIEW ■ MAY - JUNE 2012
Rank (as a whole- cumulative-2011)
Year/ Country (Rank 2011)
2007 %yoy 2007
2008 %yoy 2008
2009 %yoy 2009
2010 %yoy 2010
2011 %yoy 2011
Grand Total (as a whole cumulative)
%yoy Grand Total
1 India (I) 302 46.5 342 53.6 345 48.3 353 48.0 392 51.2 2759 35.02 USA (II) 52 8.0 45 7.1 66 9.2 67 9.1 50 6.5 1323 16.83 China (III) 104 16.0 75 11.8 113 15.8 142 19.3 137 17.9 870 11.04 Italy (IV) 44 6.8 42 6.6 54 7.6 33 4.5 43 5.6 644 8.25 Japan (V) 18 2.8 16 2.5 21 2.9 9 1.2 17 2.2 270 3.46 Spain (VI) 15 2.3 15 2.4 13 1.8 17 2.3 20 2.6 268 3.4
7Germany (VII)
20 3.1 20 3.1 14 2.0 13 1.8 9 1.2 266 3.4
8 France (VIII) 14 2.2 6 0.9 7 1.0 11 1.5 12 1.6 170 2.29 Israel (IX) 12 1.8 8 1.3 9 1.3 9 1.2 3 0.4 170 2.2
10Switzerland (X)
7 1.1 8 1.3 8 1.1 2 0.3 11 1.4 136 1.7
Grand Total 649 638 714 736 766 7886
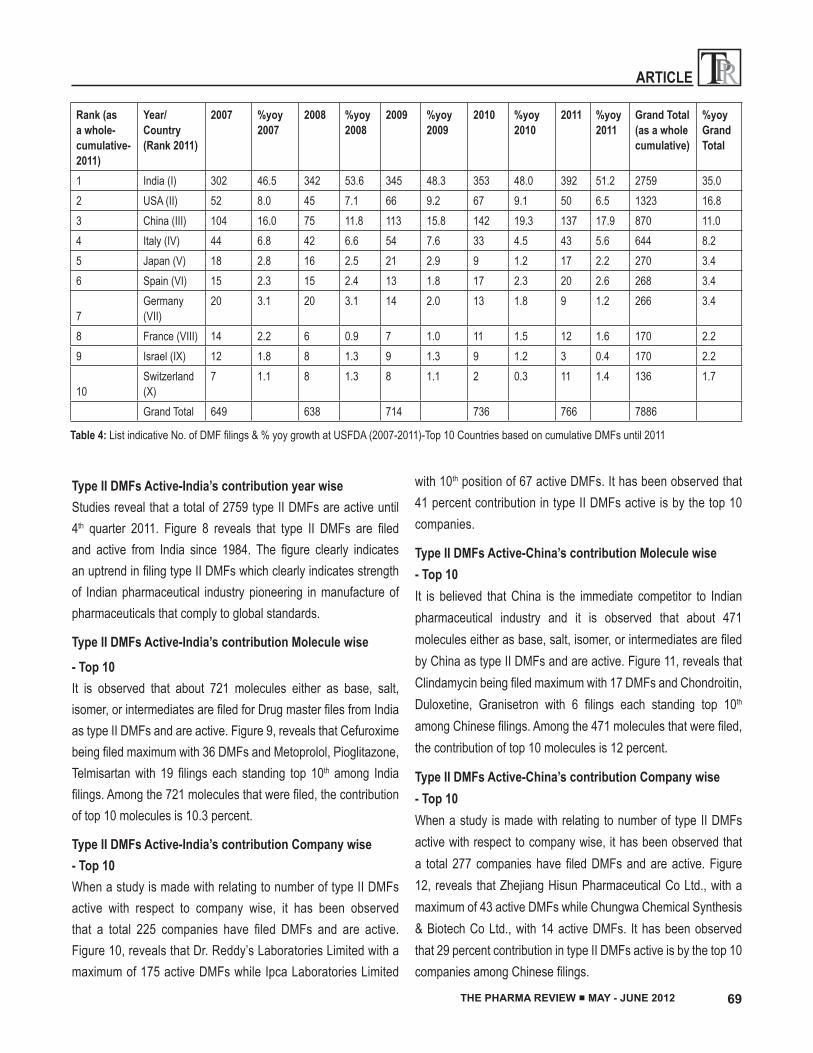
Table 4: List indicative No. of DMF filings & % yoy growth at USFDA (2007-2011)-Top 10 Countries based on cumulative DMFs until 2011
Type II DMFs Active-India’s contribution year wiseStudies reveal that a total of 2759 type II DMFs are active until 4th quarter 2011. Figure 8 reveals that type II DMFs are filed and active from India since 1984. The figure clearly indicates an uptrend in filing type II DMFs which clearly indicates strength of Indian pharmaceutical industry pioneering in manufacture of pharmaceuticals that comply to global standards.
Type II DMFs Active-India’s contribution Molecule wise
- Top 10It is observed that about 721 molecules either as base, salt, isomer, or intermediates are filed for Drug master files from India as type II DMFs and are active. Figure 9, reveals that Cefuroxime being filed maximum with 36 DMFs and Metoprolol, Pioglitazone, Telmisartan with 19 filings each standing top 10th among India filings. Among the 721 molecules that were filed, the contribution of top 10 molecules is 10.3 percent.
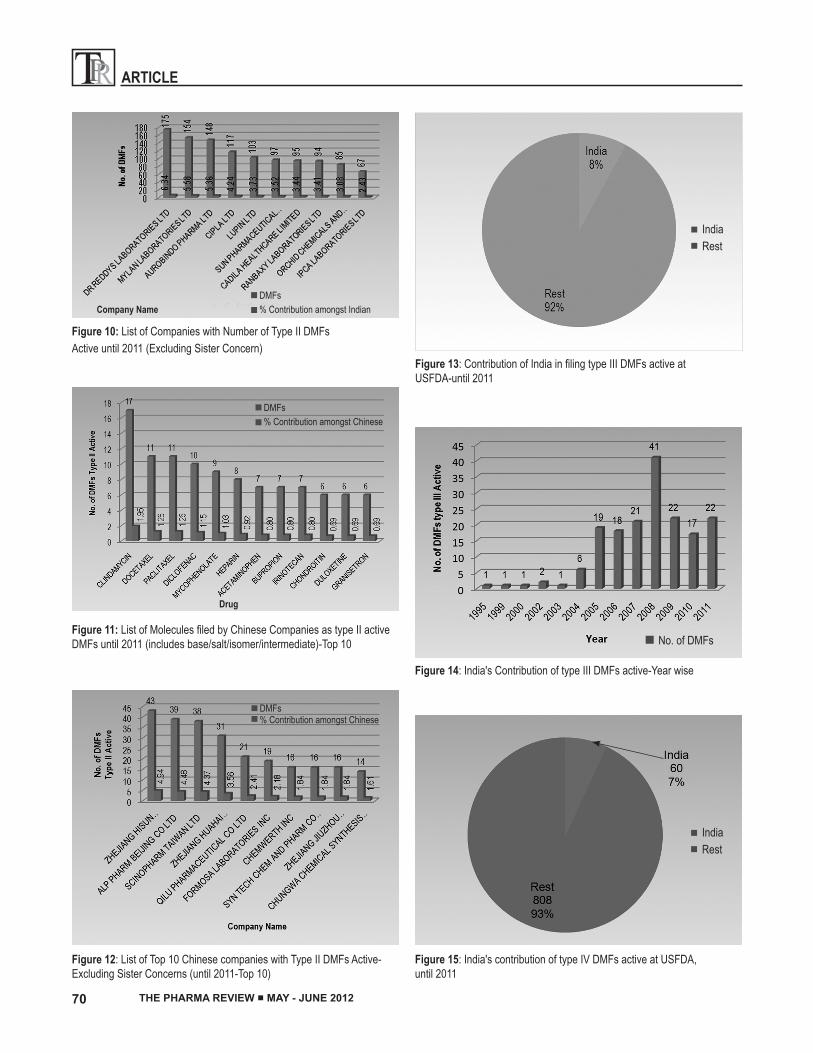
Type II DMFs Active-India’s contribution Company wise - Top 10When a study is made with relating to number of type II DMFs active with respect to company wise, it has been observed that a total 225 companies have filed DMFs and are active. Figure 10, reveals that Dr. Reddy’s Laboratories Limited with a maximum of 175 active DMFs while Ipca Laboratories Limited
with 10th position of 67 active DMFs. It has been observed that 41 percent contribution in type II DMFs active is by the top 10 companies.
Type II DMFs Active-China’s contribution Molecule wise - Top 10It is believed that China is the immediate competitor to Indian pharmaceutical industry and it is observed that about 471 molecules either as base, salt, isomer, or intermediates are filed by China as type II DMFs and are active. Figure 11, reveals that Clindamycin being filed maximum with 17 DMFs and Chondroitin, Duloxetine, Granisetron with 6 filings each standing top 10th among Chinese filings. Among the 471 molecules that were filed, the contribution of top 10 molecules is 12 percent.
Type II DMFs Active-China’s contribution Company wise - Top 10When a study is made with relating to number of type II DMFs active with respect to company wise, it has been observed that a total 277 companies have filed DMFs and are active. Figure 12, reveals that Zhejiang Hisun Pharmaceutical Co Ltd., with a maximum of 43 active DMFs while Chungwa Chemical Synthesis & Biotech Co Ltd., with 14 active DMFs. It has been observed that 29 percent contribution in type II DMFs active is by the top 10 companies among Chinese filings.
PRT ARTICLE
70 THE PHARMA REVIEW ■ MAY - JUNE 2012
Figure 13: Contribution of India in filing type III DMFs active at USFDA-until 2011
IndiaRest
Figure 14: India's Contribution of type III DMFs active-Year wise
No. of DMFs
Figure 15: India's contribution of type IV DMFs active at USFDA, until 2011
IndiaRest
DMFs% Contribution amongst Chinese
Figure 12: List of Top 10 Chinese companies with Type II DMFs Active-Excluding Sister Concerns (until 2011-Top 10)
Figure 10: List of Companies with Number of Type II DMFs Active until 2011 (Excluding Sister Concern)
DMFs% Contribution amongst IndianCompany Name
Figure 11: List of Molecules filed by Chinese Companies as type II active DMFs until 2011 (includes base/salt/isomer/intermediate)-Top 10
DMFs% Contribution amongst Chinese
Drug
PRTARTICLE
71THE PHARMA REVIEW ■ MAY - JUNE 2012
Figure 17: India's contribution of type V DMFs active at USFDA-until 2011
IndiaRest
Figure 18: India's contribution of type V DMFs active at USFDA, until 2011
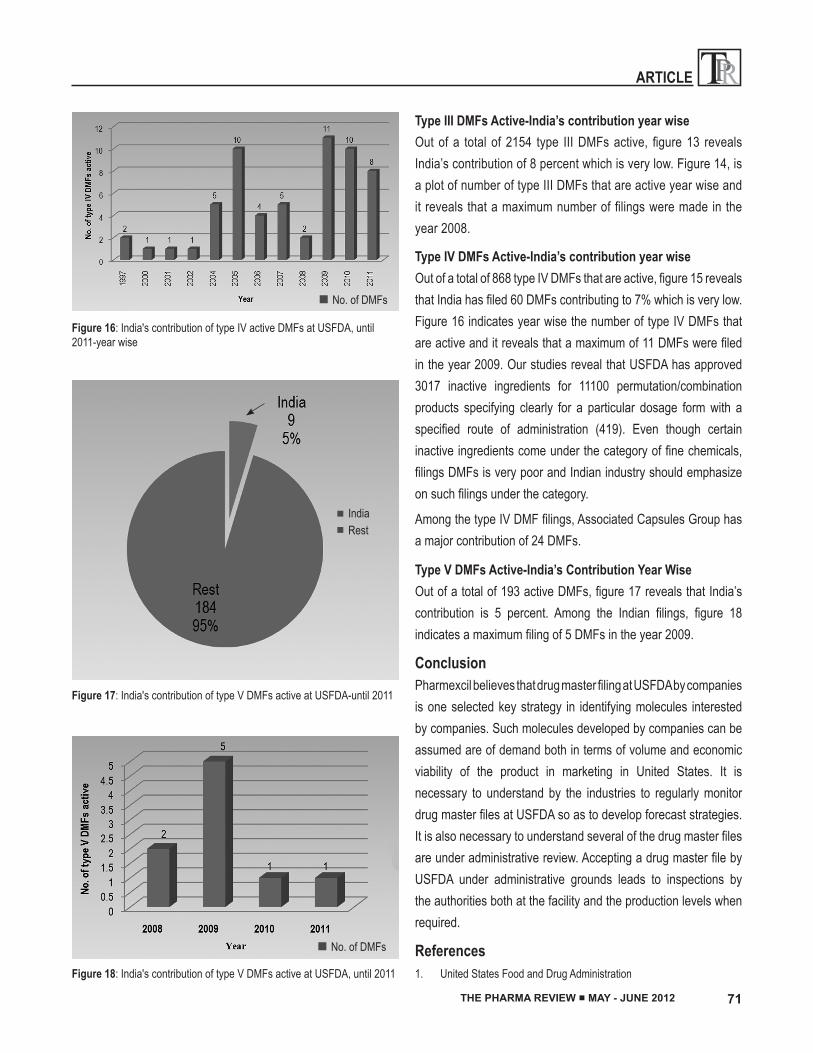
Figure 16: India's contribution of type IV active DMFs at USFDA, until 2011-year wise
No. of DMFs
Type III DMFs Active-India’s contribution year wiseOut of a total of 2154 type III DMFs active, figure 13 reveals India’s contribution of 8 percent which is very low. Figure 14, is a plot of number of type III DMFs that are active year wise and it reveals that a maximum number of filings were made in the year 2008.
Type IV DMFs Active-India’s contribution year wiseOut of a total of 868 type IV DMFs that are active, figure 15 reveals that India has filed 60 DMFs contributing to 7% which is very low. Figure 16 indicates year wise the number of type IV DMFs that are active and it reveals that a maximum of 11 DMFs were filed in the year 2009. Our studies reveal that USFDA has approved 3017 inactive ingredients for 11100 permutation/combination products specifying clearly for a particular dosage form with a specified route of administration (419). Even though certain inactive ingredients come under the category of fine chemicals, filings DMFs is very poor and Indian industry should emphasize on such filings under the category.
Among the type IV DMF filings, Associated Capsules Group has a major contribution of 24 DMFs.
Type V DMFs Active-India’s Contribution Year WiseOut of a total of 193 active DMFs, figure 17 reveals that India’s contribution is 5 percent. Among the Indian filings, figure 18 indicates a maximum filing of 5 DMFs in the year 2009.
ConclusionPharmexcil believes that drug master filing at USFDA by companies is one selected key strategy in identifying molecules interested by companies. Such molecules developed by companies can be assumed are of demand both in terms of volume and economic viability of the product in marketing in United States. It is necessary to understand by the industries to regularly monitor drug master files at USFDA so as to develop forecast strategies. It is also necessary to understand several of the drug master files are under administrative review. Accepting a drug master file by USFDA under administrative grounds leads to inspections by the authorities both at the facility and the production levels when required.
References1. United States Food and Drug Administration
No. of DMFs