artificial intelligence for inferential control of crude...
TRANSCRIPT

Chemical Engineering
Iranian Journal of Oil & Gas Science and Technology, Vol. 7 (2018), No. 1, pp. 70-92
http://ijogst.put.ac.ir
Artificial Intelligence for Inferential Control of Crude Oil Stripping
Process
Mehdi Ebnali1, Mehdi Shahbazian
2*, and Houshang Jazayerirad
3
1 M.S. Student, Department of Instrumentation and Automation Engineering, Ahwaz Faculty of Petroleum
Engineering, Ahwaz, Iran 2 Associate Professor, Department of Instrumentation and Automation Engineering, Ahwaz Faculty of
Petroleum Engineering, Ahwaz, Iran 3 Associate Professor, Department of Instrumentation and Automation Engineering, Ahwaz Faculty of
Petroleum Engineering, Ahwaz, Iran
Received: June 01, 2016; revised: May 18, 2017; accepted: July 08, 2017
Abstract
Stripper columns are used for sweetening crude oil, and they must hold product hydrogen sulfide
content as near the set points as possible in the faces of upsets. Since product quality cannot be
measured easily and economically online, the control of product quality is often achieved by
maintaining a suitable tray temperature near its set point. Tray temperature control method, however,
is not a proper option for a multi-component stripping column because the tray temperature does not
correspond exactly to the product composition. To overcome this problem, secondary measurements
can be used to infer the product quality and adjust the values of the manipulated variables. In this
paper, we have used a novel inferential control approach base on adaptive network fuzzy inference
system (ANFIS) for stripping process. ANFIS with different learning algorithms is used for modeling
the process and building a composition estimator to estimate the composition of the bottom product.
The developed estimator is tested, and the results show that the predictions made by ANFIS structure
are in good agreement with the results of simulation by ASPEN HYSYS process simulation package.
In addition, inferential control by the implementation of ANFIS-based online composition estimator
in a cascade control scheme is superior to traditional tray temperature control method based on less
integral time absolute error and low duty consumption in reboiler.
Keywords: Stripping Column, Composition Control, Inferential Estimator, Adaptive Network Fuzzy
Inference System
1. Introduction
Stripping multi-component mixtures is one of the most common separation operations in the
petroleum upstream industry. Stripping process takes place at the lower section of distillation
columns. The stripping control system must hold product composition as near the set point as possible
in the faces of upsets. The control is difficult because the product quality cannot be measured easily
and economically online. This is because the instrumentation is either very expensive, and / or
measurement lags and sampling delays make designing an effective control system impossible.
A solution to this problem is the use of tray temperature control method. The temperature control is
* Corresponding Author:

M. Ebnali et al. / Artificial Intelligence for Inferential Control … 71
based on the assumption that the product composition can satisfy its specification when an appropriate
tray temperature is kept constant at its set point. If tray temperatures are to be used, the issue is
selecting the best tray or trays on which temperature is held constant. This problem has been
discussed in the distillation literature for over half a century. Hundreds of papers, each of which uses
one particular method for temperature control and tray selection, have been presented. The discussion
of one approach to this problem is given by Jorgensen et al. 1998.
Tray temperature control method is a proper option for binary distillation columns at a constant
pressure, but where feed composition or feed flow rate changes in a multi-component
distillation/stripping tower, it is quite difficult to keep product quality at its set point by using
temperature control; this is due to the fact that the tray temperature does not correspond exactly to the
product composition. Moreover, pressure changes also cause temperature variation. To solve this
problem, secondary measurements in conjunction with a mathematical/empirical model of process can
be used to estimate the product quality.
The distillation/stripping process can be modeled using input-output data from experimental tests.
Regression and neural network modeling techniques are commonly used for this purpose.
Sivakumar et al. 2010 proposed a fuzzy model predictive control strategy for multivariable nonlinear
control problem in distillation columns. They reported that fuzzy model predictive controller offers
better control response than conventional PID controllers for multivariable processes.
Tonnang et al. 2010 developed a neural network controller for the control of an industrial distillation
process. Field data was used for the development and testing the effectiveness of the controller. The
developed controller performed optimally when compared with the installed distributed control
system based on proportional integral and derivative algorithm.
Barcelo-Rico et al. 2011 designed a fuzzy controller for distillation process based on local fuzzy
models and velocity linearization. The results showed that the fuzzy controller was able to keep the
target output in the desired range for different input disturbances, changing smoothly from a
predefined target output to another.
Rani et al. 2011 used intelligent controller to control the temperature profile of the reactive distillation
process. Four intelligent controllers were designed based on fuzzy logic, adaptive linear network
(Adaline), and hybrids of these two techniques. The fuzzy logic controller provides a better steady
state response whereas the adaptive linear network controller provides better transient responses. The
hybrid fuzzy-neural network controller and fuzzy Adaline controller were proposed to combine the
advantages of the two techniques.
Araromi et al. 2012 developed a hybrid fuzzy Hammerstein (FH) model consisting of nonlinear fuzzy
model and linear state space model for a reactive distillation column. The developed model was
compared with linear autoregressive input exogenous (ARX) and nonlinear autoregressive input
exogenous (NARX). The results showed that the FH model can provisionally capture the nonlinear
dynamic behavior of reactive distillation system and the model can be found suitable for real time
applications.
Gupta et al. 2013 designed an adaptive neuro-fuzzy controller to control a binary distillation process.
The designed controllers were tested for set point tracking and disturbance rejection in feed
composition. It was observed that the proposed ANFIS controller performed better than the
conventional PID controllers.

72 Iranian Journal of Oil & Gas Science and Technology, Vol. 7 (2018), No. 1
Al-Naimi et al. 2013 used different control strategies to control the distillate and bottom composition
of a packed distillation column to separate the mixture of methanol and water. They reported that
adaptive fuzzy logic controller is better than feedback, PID fuzzy logic, and artificial neural network
controllers because it uses an auxiliary variable used as another input to select the region in which the
process is operating.
Popoola et al. 2013 investigated the expert system design and control of crude oil distillation column
using an artificial neural networks model which was validated using experimental data. They
concluded that an artificial neural networks model is an effective tool for the design and control of
crude oil distillation column.
Popoola et al. 2013 presented a comprehensive review of various traditional systems of crude oil
distillation column design, modeling, simulation, optimization, and control methods. Artificial neural
network, fuzzy logic, and genetic algorithm framework were chosen as the best methodologies for
design, optimization, and control of crude oil distillation column.
Giwa et al. 2013 developed ANFIS models for the reactive distillation process used for the production
of isopropyl alcohol from the hydration reaction of propylene. The high fit values and low means of
absolute error obtained respectively from the training and testing of the ANFIS models have revealed
that the developed ANFIS models represented the reactive distillation process very well.
Arumugam et al. 2014 proposed a fuzzy logic controller for methanol/water arrangement of bubble
cap distillation column. It was concluded that the fuzzy logic control led to lower integral square
error, smaller integral absolute error, and smaller integral time absolute error compared to the PID
controller.
Miccio et al. 2014 developed a type-1 and a type-2 fuzzy logic PID controller for the control of a
binary distillation column, the mathematical model of which is characterized by both high
nonlinearities and parameter uncertainties. The performance of the type-1 fuzzy logic controller was
compared with that of the type-2 fuzzy logic controller, and the robustness and effective control
action of each fuzzy controller, with evident advantages for the type-2 controller, were investigated.
Ahmadi et al. 2014 modeled and optimized an industrial hydrocracker unit by means of adaptive
neuro fuzzy inference system. The obtained networks were used to predict the plant optimum
operating condition in order to maximize the volume percent of gas oil, kerosene, heavy naphtha and
light naphtha as objective functions.
Sangster et al. 2016 developed a fuzzy supervisory controller which included a feed forward and two
feedback controllers for the purpose of improving the dual product quality control of an existing pilot
binary distillation column. Positive results were achieved as the majority of the simulated controller
outputs were within 10% of the actual values.
In this research, we used a novel inferential composition control approach based on adaptive network
fuzzy inference system (ANFIS) for a stripping process. In previous studies, ANFIS has been used for
the identification of the process or the estimation of controller output, but the composition of the
product was not reported as the measured variable of the controller. The main aim of this paper is to
present a novel nonlinear modeling and control study concerning an industrial stripping column using
adaptive network fuzzy inference systems with different learning algorithms. ANFIS structure is used
for building a nonlinear model of the column. The investigated column operates the separation of
hydrogen sulfide from the outlet stream of a production unit. The H2S concentration in the bottom
product has to be controlled.
M. Ebnali et al. / Artificial Intelligence for Inferential Control … 73
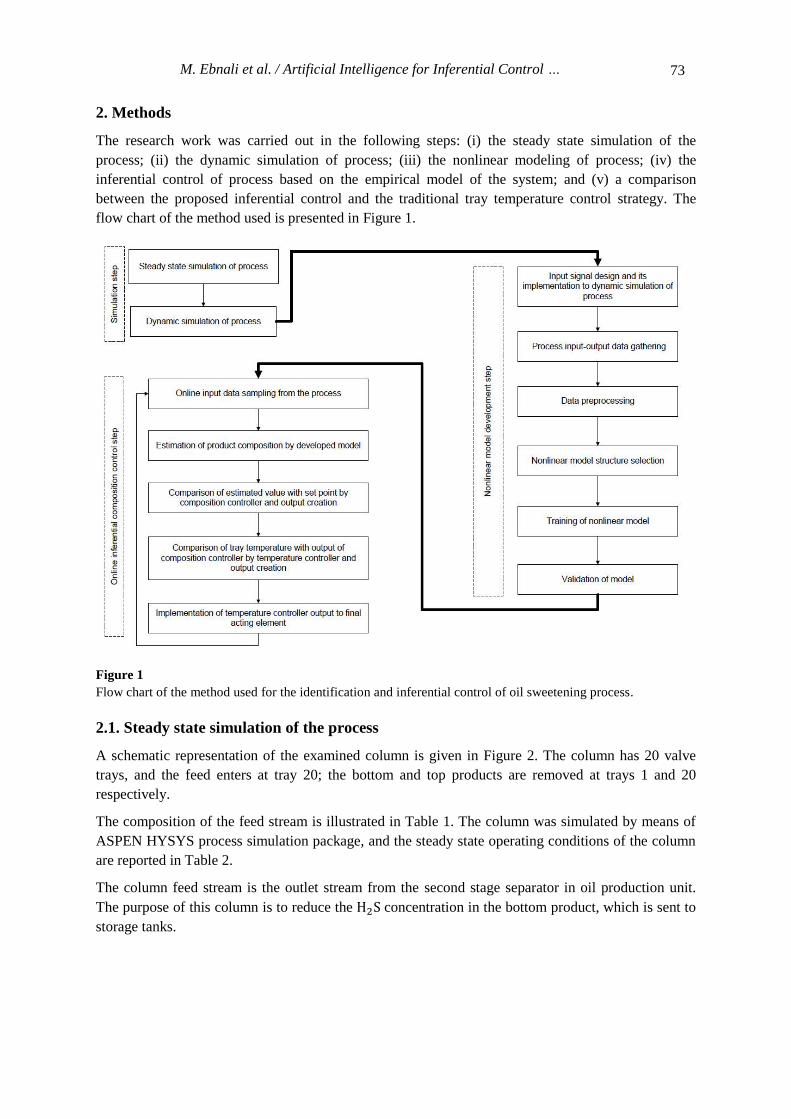
2. Methods
The research work was carried out in the following steps: (i) the steady state simulation of the
process; (ii) the dynamic simulation of process; (iii) the nonlinear modeling of process; (iv) the
inferential control of process based on the empirical model of the system; and (v) a comparison
between the proposed inferential control and the traditional tray temperature control strategy. The
flow chart of the method used is presented in Figure 1.
Figure 1
Flow chart of the method used for the identification and inferential control of oil sweetening process.
2.1. Steady state simulation of the process
A schematic representation of the examined column is given in Figure 2. The column has 20 valve
trays, and the feed enters at tray 20; the bottom and top products are removed at trays 1 and 20
respectively.
The composition of the feed stream is illustrated in Table 1. The column was simulated by means of
ASPEN HYSYS process simulation package, and the steady state operating conditions of the column
are reported in Table 2.
The column feed stream is the outlet stream from the second stage separator in oil production unit.
The purpose of this column is to reduce the H2S concentration in the bottom product, which is sent to
storage tanks.

74 Iranian Journal of Oil & Gas Science and Technology, Vol. 7 (2018), No. 1
Figure 2
Schematic layout of the column.
Table 1
Composition of the column feed.
Component name Concentration (wt.%)
Methane 0.0011
Ethane 0.0066
Propane 0.0149
iButane 0.0062
nButane 0.0186
iPentane 0.0128
nPentane 0.0162
Hexane 0.0396
Hydrogen sulfide 0.0089
Carbon dioxide 0.0005
𝐂𝟕+ 0.8745
𝐂𝟕+ Properties
Molecular weight 199
Specific gravity 0.8632

M. Ebnali et al. / Artificial Intelligence for Inferential Control … 75
Table 2
Steady state operating conditions of the column.
Stream Property Unit Value
Feed
Flow rate kg/hr. 115000
Temperature °C 60
H2S concentration PPM 8900
Gas Flow rate kg/hr. 4800
H2S concentration PPM 211852
Bottom
Flow rate kg/hr. 110200
H2S concentration PPM 60
Reboiler duty kJ/hr. 1.45×10⁷
2.2. Dynamic simulation of the process
The dynamic behavior of the column was simulated by ASPEN HYSYS DYNAMIC simulation
package. Tray liquid hydraulic was predicted by Glitsch procedure, and the equilibrium constants
were calculated by the SRK relation. The simulation model takes into account the stripper tower as
well as all the auxiliary apparatus (reboiler, measuring devices, and control elements).
As illustrated in Figure 3, for the design of stripper column control system, it is proposed that the
tower pressure is controlled by manipulating top gas flow rate, that the reboiler liquid level is
controlled by manipulating bottom product flow rate, and that tray 2 temperature is controlled by
manipulating reboiler duty in order to keep the bottom product H2S concentration constant.
Figure 3
Traditional tray temperature control technique applied to the stripping column.

76 Iranian Journal of Oil & Gas Science and Technology, Vol. 7 (2018), No. 1
2.3. Nonlinear modeling
2.3.1. Input signal design and data collection
The simulated data for building inferential estimator are obtained under the following conditions. The
pseudo random binary signals of bound and varying amplitude are introduced as the feed temperature
(within ±5% of the steady state values) and total flow rate changes (within ±20% of the steady state
values) during simulations. For realizing slow composition changes, each signal is filtered by a first
order lag model. Total simulation time is 48 hours, and process data are sampled every one minutes.
The simulated data for validating inferential models are obtained in almost the same conditions as
described above. The total simulation time is 24 hours.
If the input-output data described above are obtained when the temperature controller is in the
automatic mode, the data do not include the operational conditions when the controlled temperatures
undergo large changes. However, when inferential composition control, instead of temperature
control, is applied, the trays temperature fluctuates greatly. Thus, when an inferential model is used
for composition control, the accuracy of estimation may deteriorate due to large changes of tray
temperature. In order to improve the accuracy, the inferential model must be built using appropriate
data, which include large fluctuation of the temperature. For this purpose, the proportional gain of the
bottom temperature controller is changed between ±50% of the base controller gain in the simulation
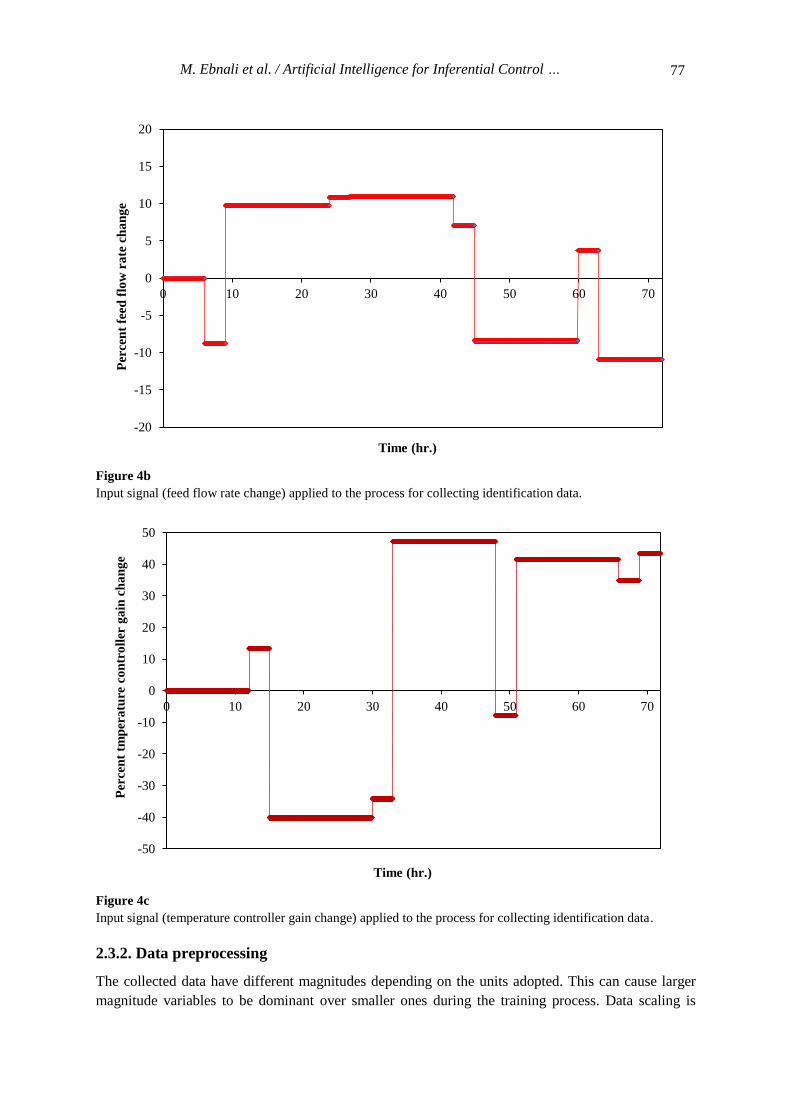
in order to change the reboiler duty. Figures 4a, 4b, and 4c represent the input signals applied to the
process for collecting identification data.
Figure 4a
Input signal (feed temperature change) applied to the process for collecting identification data.
-5
-4
-3
-2
-1
0
1
2
3
4
5
0 10 20 30 40 50 60 70
Per
cen
t fe
ed
tem
per
atu
re c
ha
ng
e
Time (hr.)
M. Ebnali et al. / Artificial Intelligence for Inferential Control … 77
Figure 4b
Input signal (feed flow rate change) applied to the process for collecting identification data.
Figure 4c
Input signal (temperature controller gain change) applied to the process for collecting identification data.
2.3.2. Data preprocessing
The collected data have different magnitudes depending on the units adopted. This can cause larger
magnitude variables to be dominant over smaller ones during the training process. Data scaling is
-20
-15
-10
-5
0
5
10
15
20
0 10 20 30 40 50 60 70
Per
cen
t fe
ed
flo
w r
ate
ch
an
ge
Time (hr.)
-50
-40
-30
-20
-10
0
10
20
30
40
50
0 10 20 30 40 50 60 70
Per
cen
t tm
per
atu
re c
on
tro
ller
ga
in c
ha
ng
e
Time (hr.)

78 Iranian Journal of Oil & Gas Science and Technology, Vol. 7 (2018), No. 1
therefore needed. Min-max normalization method is one of the common scaling methods; min-max
normalization is given by:
𝑎′ =𝑎 − 𝑚𝑖𝑛𝑎
𝑚𝑎𝑥𝑎 − 𝑚𝑖𝑛𝑎
(𝑚𝑎𝑥𝑎′ − 𝑚𝑖𝑛𝑎′) + 𝑚𝑖𝑛𝑎′ (1)
Where, 𝑎 is the unscaled variable, and 𝑎′ is the scaled variable; 𝑚𝑖𝑛𝑎 is the minimum value of the
unscaled variable, and 𝑚𝑎𝑥𝑎 is the maximum value of the unscaled variable; 𝑚𝑖𝑛𝑎′ is the minimum
value of the scaled variable, and 𝑚𝑎𝑥𝑎′ is the maximum value of the scaled variable.
In this research, the collected data are scaled to [0, 1] interval. Since the collected data are the results
of the simulation and have no inconsistent data, other preprocessing operations such as outlier
detection, missing value replacement, and data de-noising are not required.
2.3.3. Model structure selection
One modification of a neural network structure is to replace some of or all of the components of
neuron by fuzzy logic operations. Conventional neural networks are used to approximate functions
from numerical input-output data. Fuzzy-neural networks are a more general computational structure
with which function approximation can be extended to linguistic data.
To illustrate the use of neural networks for fuzzy inference, consider a fuzzy rule base consisting of
only two Sugeno-Takagi rules:
𝑅1: 𝐼𝑓 𝑥1 𝑖𝑠 𝐴 1 𝑎𝑛𝑑 𝑥2 𝑖𝑠 𝐵1 , 𝑡ℎ𝑒𝑛 𝑦 = 𝑓1(𝑥) (2)
𝑅2: 𝐼𝑓 𝑥1 𝑖𝑠 𝐴 2 𝑎𝑛𝑑 𝑥2 𝑖𝑠 𝐵2 , 𝑡ℎ𝑒𝑛 𝑦 = 𝑓2(𝑥) (3)
where, 𝐴𝑖 and 𝐵𝑖 are fuzzy sets and
𝑓1(𝑥) = 𝑍11𝑥1 + 𝑍12𝑥2+𝑍13 (4)
𝑓2(𝑥) = 𝑍21𝑥1 + 𝑍22𝑥2+𝑍23 (5)
When numerical input 𝑥 = (𝑥1, 𝑥2) is presented, the inference mechanism will produce the numerical
output:
𝑦∗ =𝐴1(𝑥1)𝐵1(𝑥2)𝑓1(𝑥) + 𝐴2(𝑥1)𝐵2(𝑥2)𝑓2(𝑥)
𝐴1(𝑥1)𝐵1(𝑥2) + 𝐴2(𝑥1)𝐵2(𝑥2) (6)
A fuzzy neural network for implementing the above formula is shown in Figure 5. The observed input
𝑥 = (𝑥1, 𝑥2) is presented to layer 1 by input layer 0. The output of layer 1 is given by:
(𝑂11, 𝑂12, 𝑂13 , 𝑂14) = (𝐴1(𝑥1), 𝐴2(𝑥1), 𝐵1(𝑥2), 𝐵2(𝑥2)) (7)

M. Ebnali et al. / Artificial Intelligence for Inferential Control … 79
Figure 5
First order Sugeno fuzzy model with two rules.
Layer 2 consists of fuzzy neurons with an aggregation operator being some T-norm. If product T-
norm is used the output of layer 2 is defined by:
(𝑂21, 𝑂22) = (𝐴1(𝑥1)𝐵1(𝑥2), 𝐴2(𝑥1)𝐵2(𝑥2)) (8)
Layer 3 is normalizer. The output of layer 3 is:
(𝑂31, 𝑂32) = (𝑂21
𝑂21 + 𝑂22 ,
𝑂22
𝑂21 + 𝑂22) (9)
The fuzzy neurons in layer 4 output the below values:
(𝑂41, 𝑂42) = (𝑂31𝑓1, 𝑂32𝑓2) (10)
Finally, the output layer calculates the estimated output by summing:
𝑦∗ = 𝑂41 + 𝑂42 (11)
Of course, this neural network type for representing the inference procedure for a rule base of two
rules can be extended in an obvious way to an arbitrary number of rules.
In the ANFIS structure, the parameters of the premise and consequence play the role of weights in
neural network systems. The ANFIS learning algorithm consists of adjusting the mentioned
parameters from sample data ((𝑥1𝑘 , 𝑥2
𝑘), 𝑦𝑘), 𝑘 = 1, … , 𝑁.
2.3.4. Validation of model
The estimated model can be evaluated on the basis of the mean squared error of the prediction
(MSEP), which is calculated by applying the models to the validation data.
𝑀𝑆𝐸𝑃 =1
𝑁∑(𝑏(𝑛) − �̂�(𝑛))2
𝑁
𝑛=1
(12)
where, 𝑏 is a measurement of the product composition, and �̂� is its estimate; N is the number of
measurements.
80 Iranian Journal of Oil & Gas Science and Technology, Vol. 7 (2018), No. 1
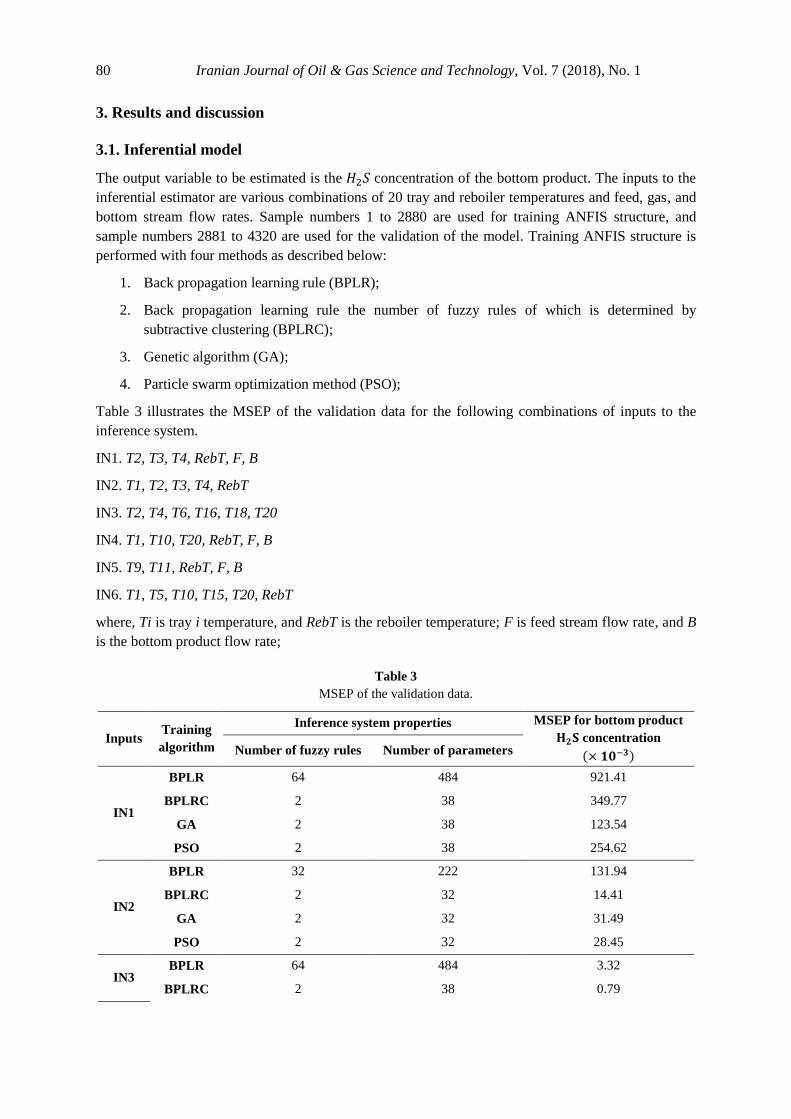
3. Results and discussion
3.1. Inferential model
The output variable to be estimated is the 𝐻2𝑆 concentration of the bottom product. The inputs to the
inferential estimator are various combinations of 20 tray and reboiler temperatures and feed, gas, and
bottom stream flow rates. Sample numbers 1 to 2880 are used for training ANFIS structure, and
sample numbers 2881 to 4320 are used for the validation of the model. Training ANFIS structure is
performed with four methods as described below:
1. Back propagation learning rule (BPLR);
2. Back propagation learning rule the number of fuzzy rules of which is determined by
subtractive clustering (BPLRC);
3. Genetic algorithm (GA);
4. Particle swarm optimization method (PSO);
Table 3 illustrates the MSEP of the validation data for the following combinations of inputs to the
inference system.
IN1. T2, T3, T4, RebT, F, B
IN2. T1, T2, T3, T4, RebT
IN3. T2, T4, T6, T16, T18, T20
IN4. T1, T10, T20, RebT, F, B
IN5. T9, T11, RebT, F, B
IN6. T1, T5, T10, T15, T20, RebT
where, Ti is tray i temperature, and RebT is the reboiler temperature; F is feed stream flow rate, and B
is the bottom product flow rate;
Table 3
MSEP of the validation data.
Inputs Training
algorithm
Inference system properties MSEP for bottom product
𝐇𝟐𝐒 concentration
(× 𝟏𝟎−𝟑) Number of fuzzy rules Number of parameters
IN1
BPLR 64 484 921.41
BPLRC 2 38 349.77
GA 2 38 123.54
PSO 2 38 254.62
IN2
BPLR 32 222 131.94
BPLRC 2 32 14.41
GA 2 32 31.49
PSO 2 32 28.45
IN3 BPLR 64 484 3.32
BPLRC 2 38 0.79

M. Ebnali et al. / Artificial Intelligence for Inferential Control … 81
Inputs Training
algorithm
Inference system properties MSEP for bottom product
𝐇𝟐𝐒 concentration
(× 𝟏𝟎−𝟑) Number of fuzzy rules Number of parameters
GA 2 38 54.26
PSO 2 38 87.35
IN4
BPLR 64 484 1.86
BPLRC 2 38 0.37
GA 2 38 8.27
PSO 2 38 2.40
IN5
BPLR 32 222 9.31
BPLRC 2 32 5.49
GA 2 32 922.54
PSO 2 32 124.78
IN6
BPLR 64 484 1.01
BPLRC 2 38 0.73
GA 2 38 10.36
PSO 2 38 2.10
The examination of various combinations of the inputs show that the combination recommended in
case IN4 is the most efficient for the estimation of H2S concentration in the bottom product based on
MSEP.
The stripping process is a complicated process, and any change in the feed condition does not change
the product quality simultaneously; on the other hand, the system has some time delay. This time
delay can also be considered in the selection of the inputs to the ANFIS structure. Table 4 illustrates
the MSEP of the validation data for the following combination of the delayed inputs to inference
system. The numbers in bracket correspond to the number of the sampling time delay.
IN7. T1[1], T5[3], T10[5], T15[6], T20[6], RebT[0]
IN8. T1[1,2], T5[3,4], T10[5,6], T15[6,7], T20[6,7], RebT[0]
IN9. T1[1], T10[5], T20[6], RebT[0], F[6], B[0]
IN10. T1[1,2], T10[5,6], T20[6,7], RebT[0], F[6,7], B[0]
Table 4
MSEP of the validation data for the delayed inputs to the ANFIS structure.
Inputs Training
algorithm
Inference system properties MSEP for bottom product
𝐇𝟐𝐒 concentration
(× 𝟏𝟎−𝟑) Number of fuzzy rules Number of parameters
IN7
BPLR 64 484 0.90
BPLRC 2 38 0.48
GA 2 38 7.51
PSO 2 38 5.20
IN8 BPLR 2048 16130 1.52
BPLRC 2 68 0.84

82 Iranian Journal of Oil & Gas Science and Technology, Vol. 7 (2018), No. 1
Inputs Training
algorithm
Inference system properties MSEP for bottom product
𝐇𝟐𝐒 concentration
(× 𝟏𝟎−𝟑) Number of fuzzy rules Number of parameters
GA 2 68 6.32
PSO 2 68 6.74
IN9
BPLR 64 484 2.08
BPLRC 2 38 0.29
GA 2 38 5.37
PSO 2 38 2.48
IN10
BPLR 1024 8081 2.11
BPLRC 2 62 0.38
GA 2 62 4.33
PSO 2 62 4.86
From the above analysis, it can be concluded that the inference system represented in Table 5 is the
most efficient model for the estimation of the H2S concentration of the bottom product. The best
training algorithm for the ANFIS structure is the back propagation learning algorithm accompanied by
subtractive clustering. Figure 6 illustrates the block diagram of the proposed model.
Table 5
Property of the optimum model for the estimation of the bottom product H2S concentration.
Inputs to ANFIS structure Training
algorithm
MSEP for bottom product H2S
concentration (× 10−3)
T1[1], T10[5], T20[6], RebT[0], F[6], B[0] BPLRC 0.29
Figure 6
Block diagram of the proposed model for the estimation of the bottom product H2S concentration.
Figure 7 visualizes the estimated values versus the actual ones for both the training (sample numbers
1 to 2880) and the validation data (sample numbers 2881 to 4320) of the proposed model. It is

M. Ebnali et al. / Artificial Intelligence for Inferential Control … 83
obvious that the estimated values are in good agreement with the actual ones, and the model is
satisfactory.
Figure 7
Estimated and actual values of the H2S concentration of the product stream.
For the prediction of the bottom product H2S concentration, the optimum inputs to the inference
system are:
Tray 1 temperature with one sample time delay;
Tray 10 temperature with five samples time delay;
Tray 20 temperature with six samples time delay;
Reboiler temperature with zero sample time delay;
Feed stream flow rate with six samples time delay;
Bottom product flow rate with zero sample time delay;
3.2. Control strategy and results
On the basis of the control analysis reported in section 3.1, the inferential control strategy of the
column shown in Figure 8 was adopted. A cascade control scheme has been assumed for control
variable, with 𝐻2𝑆 concentration on the primary (master) loop and tray temperature on the secondary
(slave) one.
The efficiency of the control strategy was examined on the basis of the responses of the process to
step the changes of H2S composition of the feed stream (±10%), feed stream temperature (±5%),
and total feed flow rate (±10%). The evaluation of control efficiency was conducted by calculating
the integral time absolute error (ITAE) (see Table 6) over a horizon of 2 hours after the
implementation of disturbance.
0.0
0.1
0.2
0.3
0.4
0.5
0.6
0.7
0.8
0.9
1.0
0 500 1000 1500 2000 2500 3000 3500 4000
No
rma
lize
d H
2S
co
nce
ntr
ati
on
Sample
Estimated Value
Actual Value

84 Iranian Journal of Oil & Gas Science and Technology, Vol. 7 (2018), No. 1
Figure 8
Layout of column inferential control configuration.
Table 6
ITAE of H2S concentration for different control schemes.
Disturbance Control strategy ITAE
H2S composition of feed (+10%) Tray temperature 1.30
Inferential 2.24×10⁻⁴
H2S composition of feed (−10%) Tray temperature 1.95
Inferential 2.41×10⁻⁴
Temperature of feed (+5%) Tray temperature 166.10
Inferential 9.36×10⁻⁴
Temperature of feed (−5%) Tray temperature 15.32
Inferential 8.97×10⁻⁴
Total flow rate of feed (+10%) Tray temperature 5.93
Inferential 3.45×10⁻⁴
Total flow rate of feed (−10%) Tray temperature 7.95
Inferential 2.82×10⁻⁴
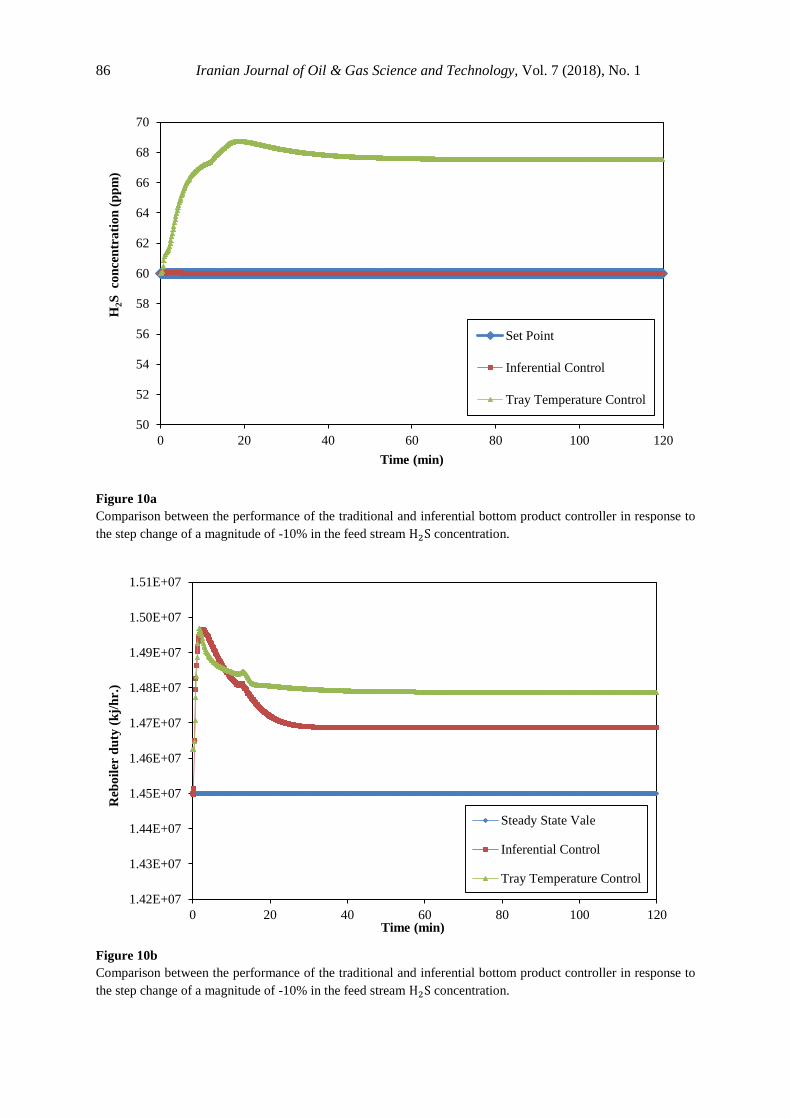
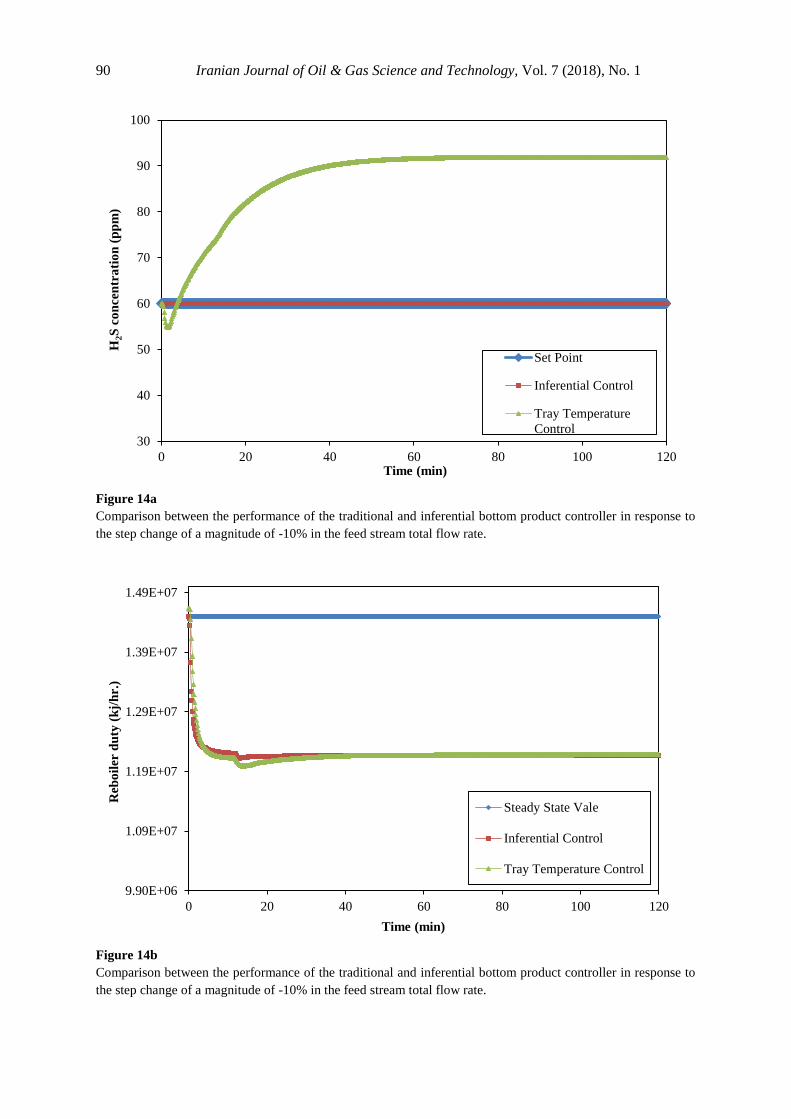
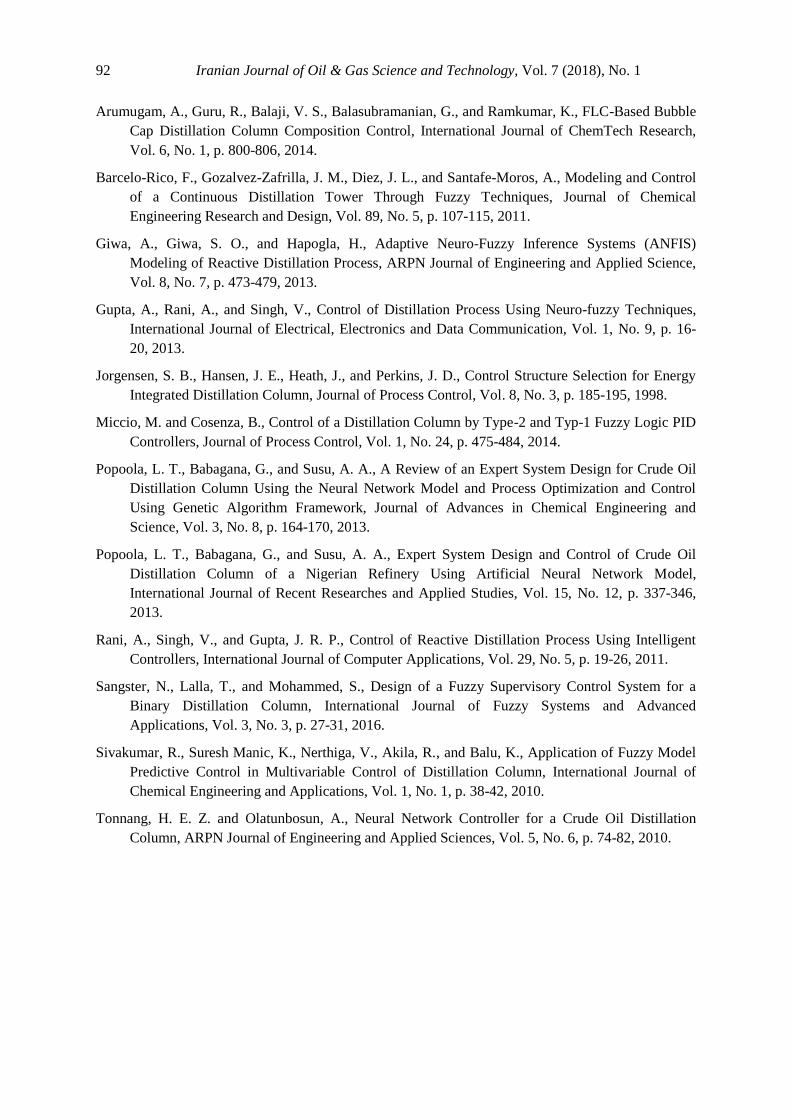
The responses of the system to step changes of the H2S composition of the feed stream, feed stream
temperature, and total feed flow rate when the H2S concentration of the product stream is controlled
by the cascade inferential scheme or by keeping the relevant tray temperature constant are compared
in Figures 9-14. Tray temperature control method leads to a decrease in H2S concentration below the
set point (60 ppm) in Figures 9a, 12a, and 13a, and this is favorable from a process point of view;

M. Ebnali et al. / Artificial Intelligence for Inferential Control … 85
however, from an economic point of view, this is not reasonable because considerable heat duty is
consumed in the reboiler to decrease the H2S below the set point without any necessity to do so (see
Figures 9b, 12b, and 13b).
Figure 9a
Comparison between the performance of the traditional and inferential bottom product controller in response to
the step change of a magnitude of +10% in the feed stream H2S concentration.
Figure 9b
Comparison between the performance of the traditional and inferential bottom product controller in response to
the step change of a magnitude of +10% in the feed stream H2S concentration.
50
52
54
56
58
60
62
64
0 20 40 60 80 100 120
H2S
co
nce
ntr
ati
on
(p
pm
)
Time (min)
Set Point
Inferential Control
Tray Temperature Control
1.40E+07
1.41E+07
1.42E+07
1.43E+07
1.44E+07
1.45E+07
1.46E+07
0 20 40 60 80 100 120
Reb
oil
er d
uty
(k
j/h
r.)
Time (min)
Steady State Vale
Inferential Control
Tray Temperature Control
86 Iranian Journal of Oil & Gas Science and Technology, Vol. 7 (2018), No. 1
Figure 10a
Comparison between the performance of the traditional and inferential bottom product controller in response to
the step change of a magnitude of -10% in the feed stream H2S concentration.
Figure 10b
Comparison between the performance of the traditional and inferential bottom product controller in response to
the step change of a magnitude of -10% in the feed stream H2S concentration.
50
52
54
56
58
60
62
64
66
68
70
0 20 40 60 80 100 120
H2S
co
nce
ntr
ati
on
(p
pm
)
Time (min)
Set Point
Inferential Control
Tray Temperature Control
1.42E+07
1.43E+07
1.44E+07
1.45E+07
1.46E+07
1.47E+07
1.48E+07
1.49E+07
1.50E+07
1.51E+07
0 20 40 60 80 100 120
Reb
oil
er d
uty
(k
j/h
r.)
Time (min)
Steady State Vale
Inferential Control
Tray Temperature Control

M. Ebnali et al. / Artificial Intelligence for Inferential Control … 87
Figure 11a
Comparison between the performance of the traditional and inferential bottom product controller in response to
the step change of a magnitude of +5% in the feed stream temperature.
Figure 11b
Comparison between the performance of the traditional and inferential bottom product controller in response to
the step change of a magnitude of +5% in the feed stream temperature.
0
100
200
300
400
500
600
700
800
0 20 40 60 80 100 120
H2S
co
nce
ntr
ati
on
(p
pm
)
Time (min)
Set Point
Inferential Control
Tray Temperature Control
1.00E+07
1.05E+07
1.10E+07
1.15E+07
1.20E+07
1.25E+07
1.30E+07
1.35E+07
1.40E+07
1.45E+07
1.50E+07
0 20 40 60 80 100 120
Reb
oil
er d
uty
(k
j/h
r.)
Time (min)
Steady State Vale
Inferential Control
Tray Temperature
Control

88 Iranian Journal of Oil & Gas Science and Technology, Vol. 7 (2018), No. 1
Figure 12a
Comparison between the performance of the traditional and inferential bottom product controller in response to
the step change of a magnitude of -5% in the feed stream temperature.
Figure 12b
Comparison between the performance of the traditional and inferential bottom product controller in response to
the step change of a magnitude of -5% in the feed stream temperature.
0
10
20
30
40
50
60
70
0 20 40 60 80 100 120
H2S
co
nce
ntr
ati
on
(p
pm
)
Time (min)
Set Point
Inferential Control
Tray Temperature Control
1.10E+07
1.20E+07
1.30E+07
1.40E+07
1.50E+07
1.60E+07
1.70E+07
1.80E+07
1.90E+07
2.00E+07
0 20 40 60 80 100 120
Reb
oil
er d
uty
(k
j/h
r.)
Time (min)
Steady State Vale
Inferential Control
Tray Temperature Control

M. Ebnali et al. / Artificial Intelligence for Inferential Control … 89
Figure 13a
Comparison between the performance of the traditional and inferential bottom product controller in response to
the step change of a magnitude of +10% in the feed stream total flow rate.
Figure 13b
Comparison between the performance of the traditional and inferential bottom product controller in response to
the step change of a magnitude of +10% in the feed stream total flow rate.
0
10
20
30
40
50
60
70
0 20 40 60 80 100 120
H2S
co
nce
ntr
ati
on
(p
pm
)
Time (min)
Set Point
Inferential Control
Tray Temperature Control
1.20E+07
1.30E+07
1.40E+07
1.50E+07
1.60E+07
1.70E+07
1.80E+07
0 20 40 60 80 100 120
Reb
oil
er d
uty
(k
j/h
r.)
Time (min)
Steady State Vale
Inferential Control
Tray Temperature Control
90 Iranian Journal of Oil & Gas Science and Technology, Vol. 7 (2018), No. 1
Figure 14a
Comparison between the performance of the traditional and inferential bottom product controller in response to
the step change of a magnitude of -10% in the feed stream total flow rate.
Figure 14b
Comparison between the performance of the traditional and inferential bottom product controller in response to
the step change of a magnitude of -10% in the feed stream total flow rate.
30
40
50
60
70
80
90
100
0 20 40 60 80 100 120
H2S
co
ncen
tra
tio
n (
pp
m)
Time (min)
Set Point
Inferential Control
Tray Temperature
Control
9.90E+06
1.09E+07
1.19E+07
1.29E+07
1.39E+07
1.49E+07
0 20 40 60 80 100 120
Reb
oil
er d
uty
(k
j/h
r.)
Time (min)
Steady State Vale
Inferential Control
Tray Temperature Control

M. Ebnali et al. / Artificial Intelligence for Inferential Control … 91
4. Conclusions
In this paper, a novel inferential control system was developed based on ANFIS composition
estimator for a stripper column. Four training algorithms (back propagation, back propagation with
subtractive clustering, genetic algorithm, and particle swarm optimization method) are used for
training ANFIS structure in an offline mode, and it is observed that back propagation algorithm with
subtractive clustering is the best algorithm of training based on the mean squared error of the
prediction of the validation data of the model.
The simulation results show that the proposed ANFIS-based composition estimator leads to the
predictions that are in good agreement with the results of the simulation by ASPEN HYSYS process
simulation package. ANFIS online composition estimator is also used in a cascade control scheme to
control the quality of the product of a stripper column. It is observed that the inferential control of
stripper column by the implementation of ANFIS-based online composition estimator is superior to
traditional tray temperature control method based on less integral time absolute error and low heat
consumption in the reboiler.
Nomenclature
B : Bottom stream flow rate (kg/hr.)
CC : Composition controller
F : Feed stream flow rate (kg/hr.)
G : Gas stream flow rate (kg/hr.)
H2S : Hydrogen sulfide
INi : Input i to ANFIS structure
LC : Level controller
PC : Pressure controller
PPM : Part per million
Q : Reboiler duty (kJ/hr.)
RebT : Reboiler temperature (°C)
SP : Set point
TC : Temperature controller
Ti : Tray i temperature (°C)
Wt. : Weight (kg)
X : Mass fraction
References
Ahmadi, M. and Vasseghian, Y., Artificial Intelligent Modeling and Optimizing of an Industrial
Hydrocracker Plant, Journal of Chemical and Petroleum Engineering, Vol. 48, No. 2, p. 125-
137, 2014.
Al-Naimi, S. A. and Jaid, G. M., Neuro-fuzzy Controller for Methanol Recovery Distillation Column,
Journal of Engineering and Technology, Vol. 31, No. 6, p. 1026-1044, 2013.
Araromi, D. O., Emuoyibofarhe, J. O., and Sonibare, J. A., Fuzzy Hybrid Modeling of a Reactive
Distillation Column for Ethyl Acetate Process, International Journal of Engineering and
Technology, Vol. 2, No. 5, p. 888-899, 2012.
92 Iranian Journal of Oil & Gas Science and Technology, Vol. 7 (2018), No. 1
Arumugam, A., Guru, R., Balaji, V. S., Balasubramanian, G., and Ramkumar, K., FLC-Based Bubble
Cap Distillation Column Composition Control, International Journal of ChemTech Research,
Vol. 6, No. 1, p. 800-806, 2014.
Barcelo-Rico, F., Gozalvez-Zafrilla, J. M., Diez, J. L., and Santafe-Moros, A., Modeling and Control
of a Continuous Distillation Tower Through Fuzzy Techniques, Journal of Chemical
Engineering Research and Design, Vol. 89, No. 5, p. 107-115, 2011.
Giwa, A., Giwa, S. O., and Hapogla, H., Adaptive Neuro-Fuzzy Inference Systems (ANFIS)
Modeling of Reactive Distillation Process, ARPN Journal of Engineering and Applied Science,
Vol. 8, No. 7, p. 473-479, 2013.
Gupta, A., Rani, A., and Singh, V., Control of Distillation Process Using Neuro-fuzzy Techniques,
International Journal of Electrical, Electronics and Data Communication, Vol. 1, No. 9, p. 16-
20, 2013.
Jorgensen, S. B., Hansen, J. E., Heath, J., and Perkins, J. D., Control Structure Selection for Energy
Integrated Distillation Column, Journal of Process Control, Vol. 8, No. 3, p. 185-195, 1998.
Miccio, M. and Cosenza, B., Control of a Distillation Column by Type-2 and Typ-1 Fuzzy Logic PID
Controllers, Journal of Process Control, Vol. 1, No. 24, p. 475-484, 2014.
Popoola, L. T., Babagana, G., and Susu, A. A., A Review of an Expert System Design for Crude Oil
Distillation Column Using the Neural Network Model and Process Optimization and Control
Using Genetic Algorithm Framework, Journal of Advances in Chemical Engineering and
Science, Vol. 3, No. 8, p. 164-170, 2013.
Popoola, L. T., Babagana, G., and Susu, A. A., Expert System Design and Control of Crude Oil
Distillation Column of a Nigerian Refinery Using Artificial Neural Network Model,
International Journal of Recent Researches and Applied Studies, Vol. 15, No. 12, p. 337-346,
2013.
Rani, A., Singh, V., and Gupta, J. R. P., Control of Reactive Distillation Process Using Intelligent
Controllers, International Journal of Computer Applications, Vol. 29, No. 5, p. 19-26, 2011.
Sangster, N., Lalla, T., and Mohammed, S., Design of a Fuzzy Supervisory Control System for a
Binary Distillation Column, International Journal of Fuzzy Systems and Advanced
Applications, Vol. 3, No. 3, p. 27-31, 2016.
Sivakumar, R., Suresh Manic, K., Nerthiga, V., Akila, R., and Balu, K., Application of Fuzzy Model
Predictive Control in Multivariable Control of Distillation Column, International Journal of
Chemical Engineering and Applications, Vol. 1, No. 1, p. 38-42, 2010.
Tonnang, H. E. Z. and Olatunbosun, A., Neural Network Controller for a Crude Oil Distillation
Column, ARPN Journal of Engineering and Applied Sciences, Vol. 5, No. 6, p. 74-82, 2010.