artificial recharge to the snake plain aquifer · artificial recharge to the snake plain aquifer in...
TRANSCRIPT
ARTIFICIAL RECHARGE TO THE
SNAKE PLAIN AQUIFER AN EVALUATION OF
\ \ POTENTIAL AND EFFECT
\ I I
I
I
I
I I
, /
I
I
\ \ \ I I AUGUST 1969
~ \ \ 'I ' ······ ·~
Water Information Bulletin No. 12 Idaho Department of Reclamation
WATER INFORMATION BULLETIN NO. 12
ARTIFICIAL RECHARGE TO THE SNAKE PLAIN AQUIFER IN IDAHO;
AN EVALUATION OF POTENTIAL AND EFFECT
By
R. F. Norvitch, C. A. Thomas, and R. J. Madison
United States Geological Survey
Prepared by the United States Geological Survey
in Cooperation with
Idaho Department of Reclamation
Published by
Idaho Department of Reclamation
R. Keith Higginson
State Reclamation Engineer
August 1969
Abstract . .
Introduction
Acknowledgments
Status of irrigation
History
Present irrigation
Surface water
Ground water .
CONTENTS
Availability of water for artificial recharge
Aquifer discharge and storage
Ground-water discharge .
Changes in ground-water storage
Quality of water
Surface water
Ground water.
Water quality and artificial recharge
Effects of artificial recharge on water levels and spring flow
Methods available for analysis .....
Physical conditions affecting ground-water flow
Analog model construction and use
Validation of model
Using the model
Deficiencies of data and need for future studies
Summary and conclusions
References . , . , ...
III
Page
VI
l
2
5
5
6
7
9
15
18
18
20
22
22
26
30
32
32
35
42
44
45
50
54
57
ILLUSTRATIONS
Page
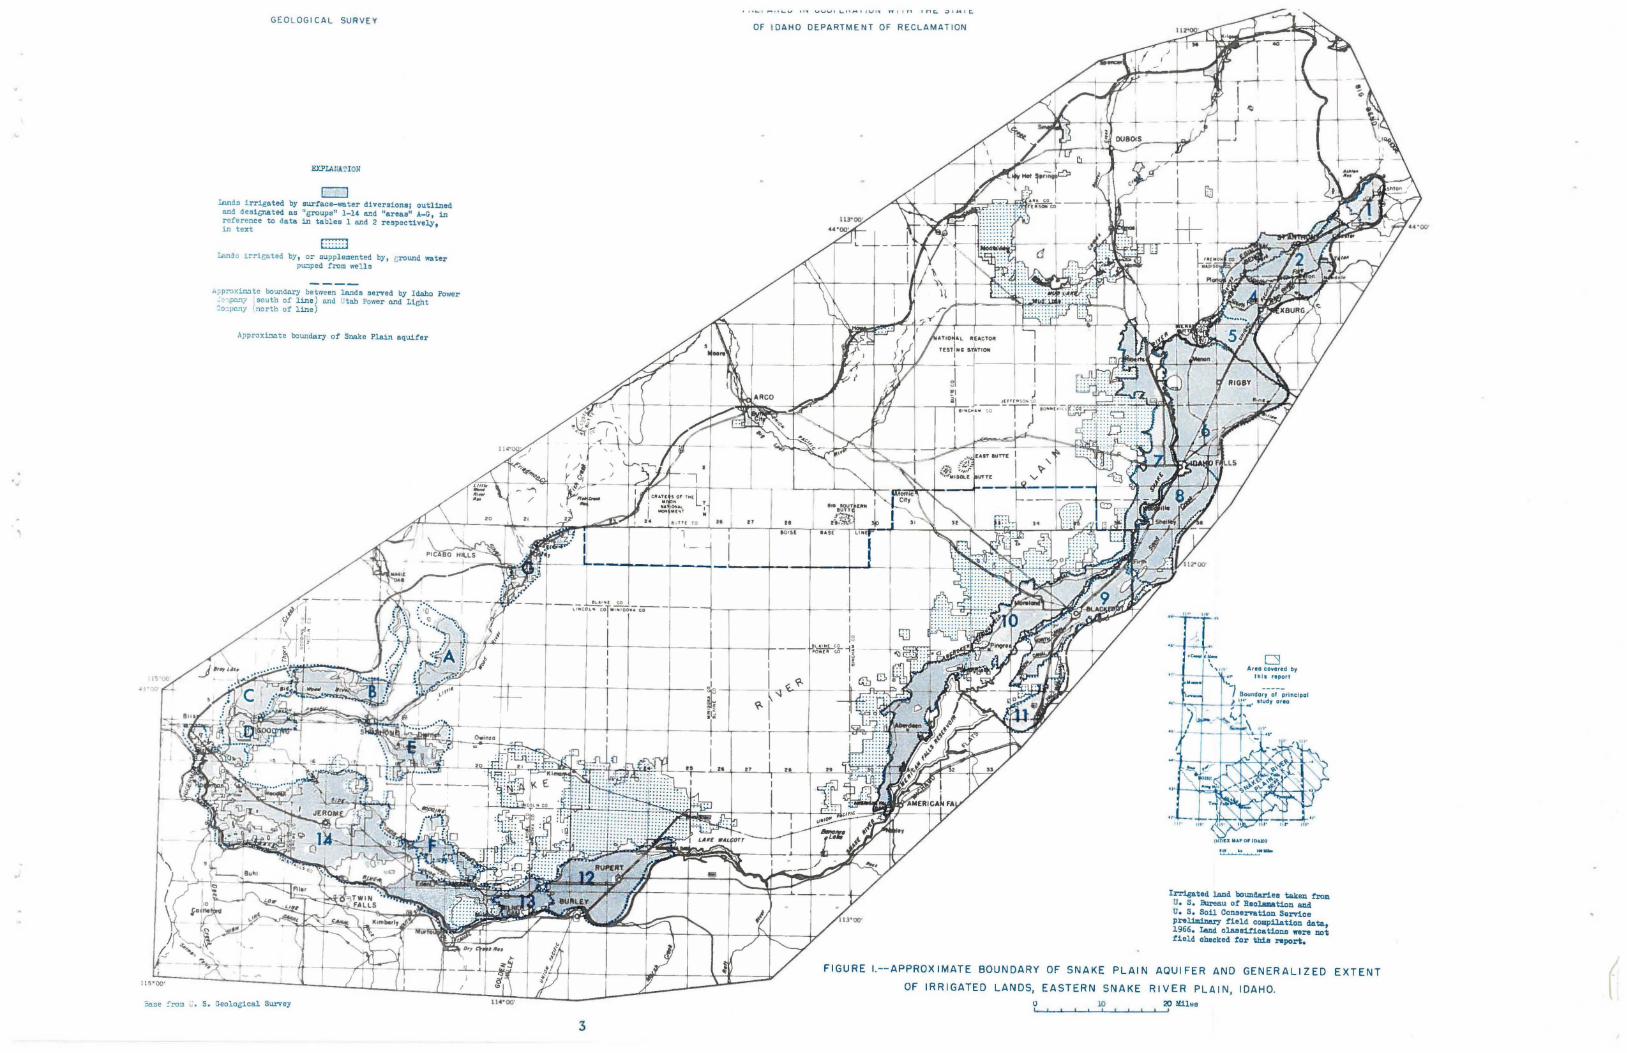
1 Map showing location of area, approximate boundary of
Snake Plain aquifer and generalized extent of irrigated
lands 3
2, Graph showing estimated annual volumes of ground water pump-
ed for irrigation on lands served by Idaho Power Co. 10
3. Graph showing estimated annual volumes of ground water
pumped for irrigation on lands served by Utah Power
and Light Company .
4. Map showing hydrologic data of eastern Snake River
basin in
5, Graph showing recurrence interval of annual mean dis-
charge of Snake River at Milner
6. Graph showing recurrence interval of annual mean dis-
charge of Snake River near Heise
7' Graph showing recurrence interval of annual mean dis-
charge of Henrys Fork near Ashton
8. Graph showing annual mean discharge from the two major
groups of springs draining the Snake Plain aquifer
9, Map showing chemical data for surface and ground
water
10. Graph showing comparison of quality of recharge water
and ground water
11. Graph showing specific conductance of water at Thousand
Springs (sec. 8, T. 8 S., R. 14 E.) near Wendell,
1949-66
IV
in
10
17
19
19
21
27
29
ILLUSTRATIONS (Cont'd.)
Page
Figure 12. Map showing distribution of aquifer characteristics and
Table
geohydrologic boundaries 37
13. Map showing contours on the water table and flow net of
the Snake Plain aquifer .... in pocket
14. Map showing generalized water-level rises and related
effects resulting from hypothetical recharge of the
Snake Plain aquifer .. 47
TABLES
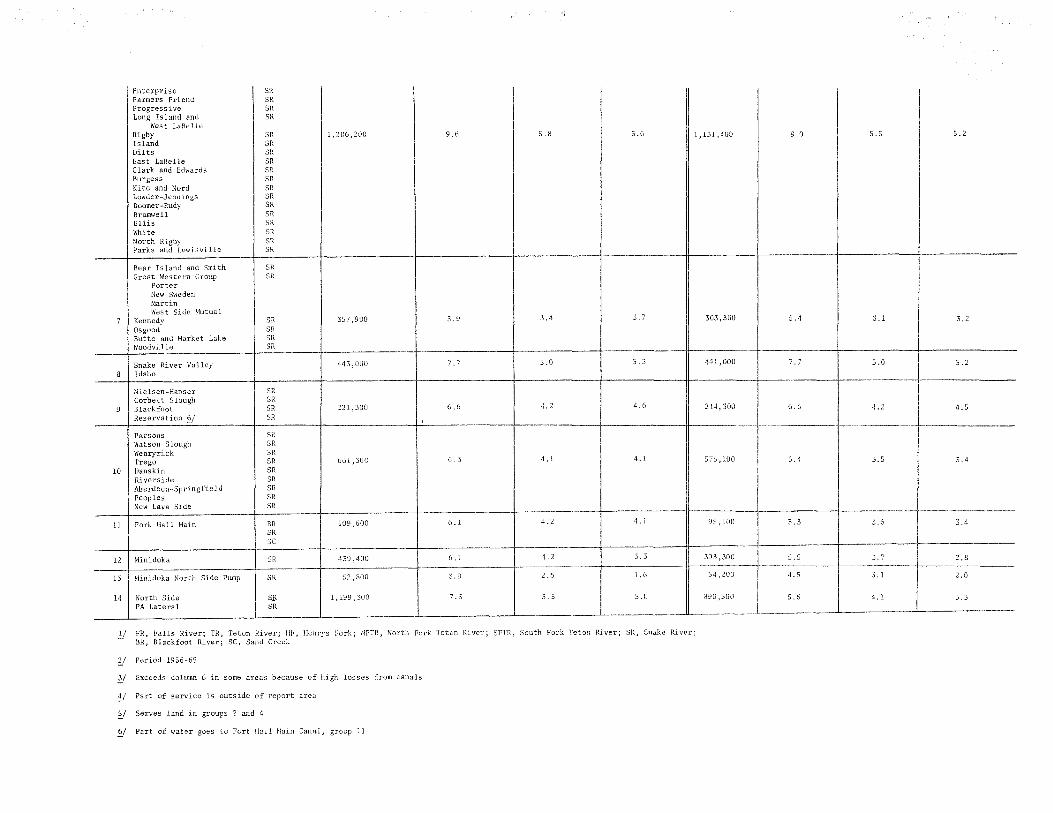
1. Distribution of surface water applied for irrigation on
lands adjacent to Henrys Fork and the Snake River . 12
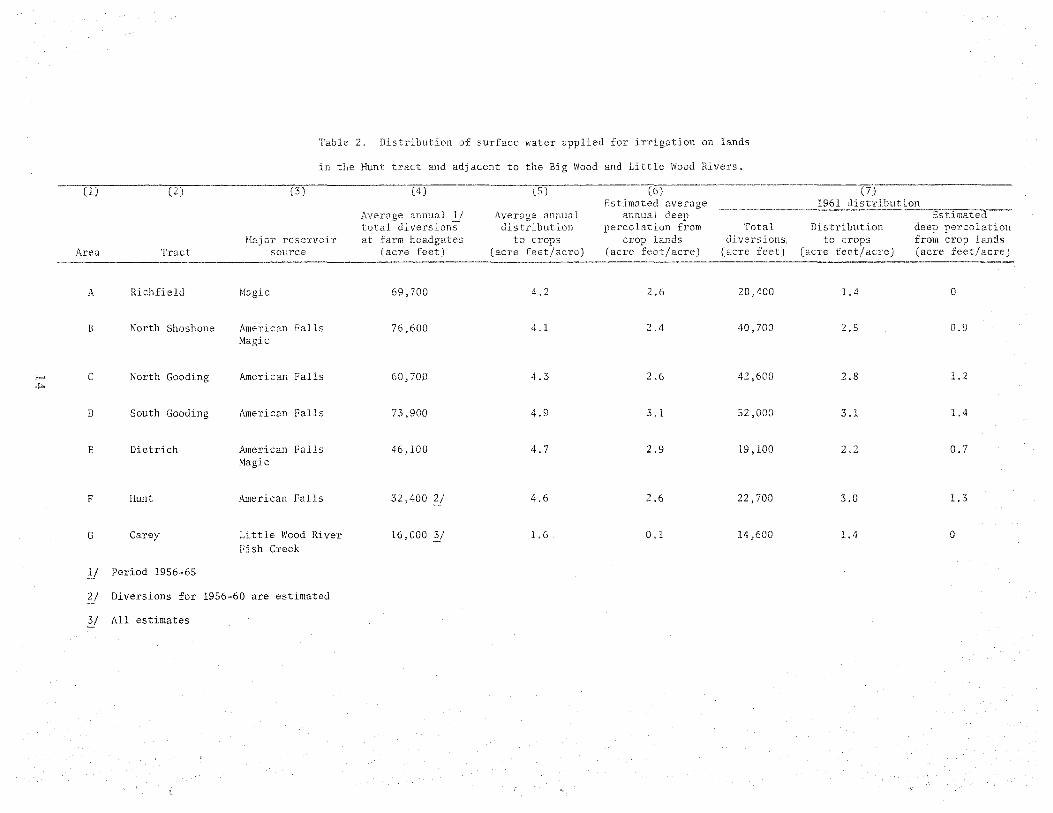
2. Distribution of surface water applied for irrigation on
lands in the Hunt tract and adjacent to the Big Wood
and Little Wood Rivers
3. Observation-well data ...
V
14
23
ARTIFICIAL RECHARGE TO THE SNAKE PLAIN AQUIFER IN IDAHO
AN EVALUATION OF POTENTIAL AND EFFECT
By R. F. Norvitch, C. A. Thomas, and R. J. Madison
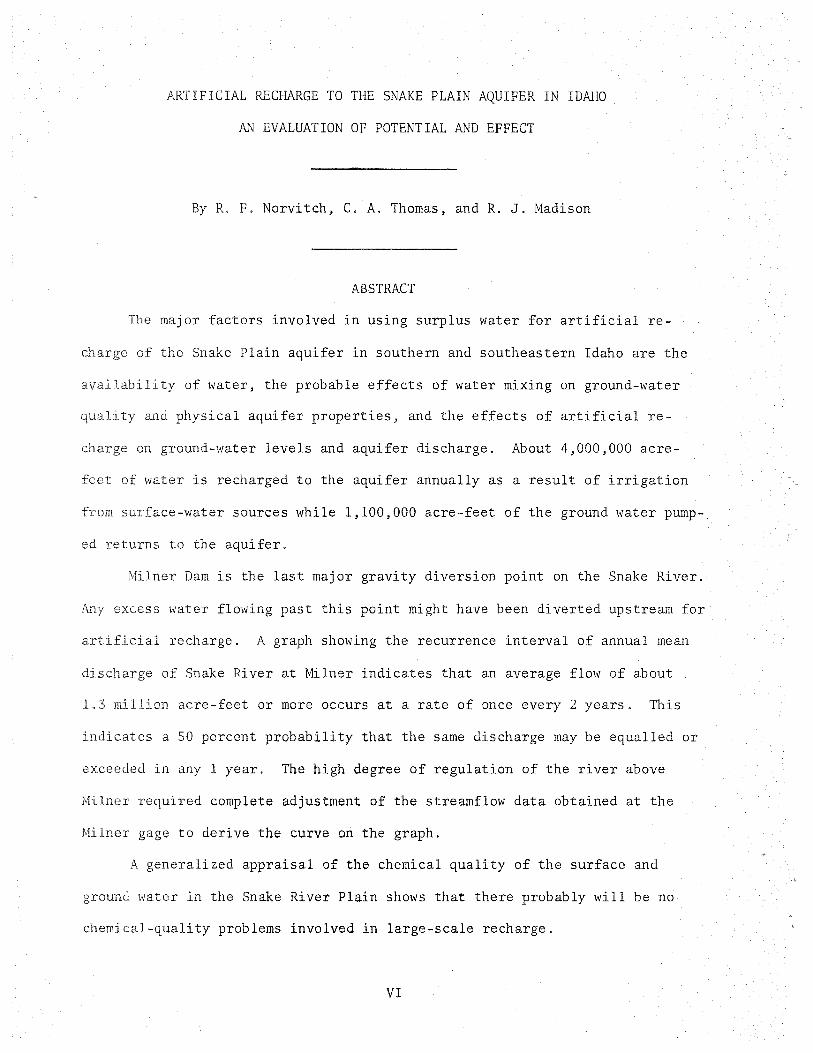
ABSTRACT
The major factors involved in using surplus water for artificial re
of the Snake Plain aquifer in southern and southeastern Idaho are the
ability of water, the probable effects of water mixing on ground-water
and physical aquifer properties, and the effects of artificial re-
on ground-water levels and aquifer discharge. About 4,000,000 acre
feet of water is recharged to the aquifer annually as a result of irrigation
from surface-water sources while 1,100,000 acre-feet of the ground water pump-
returns to the aquifer.
Milner Dam is the last major gravity diversion point on the Snake River.
excess water flowing past this point might have been diverted upstream for
ificial recharge. A graph showing the recurrence interval of annual mean
dis of Snake River at Milner indicates that an average flow of about
.3 million acre-feet or more occurs at a rate of once every 2 years. This
indicates a 50 percent probability that the same discharge may be equalled or
exceeded in any 1 year. The high degree of regulation of the river above
Milner required complete adjustment of the streamflow data obtained at the
Milner gage to derive the curve on the graph.
A generalized appraisal of the chemical quality of the surface and
ground water in the Snake River Plain shows that there probably will be no
chemical-quality problems involved in large-scale recharge.
VI
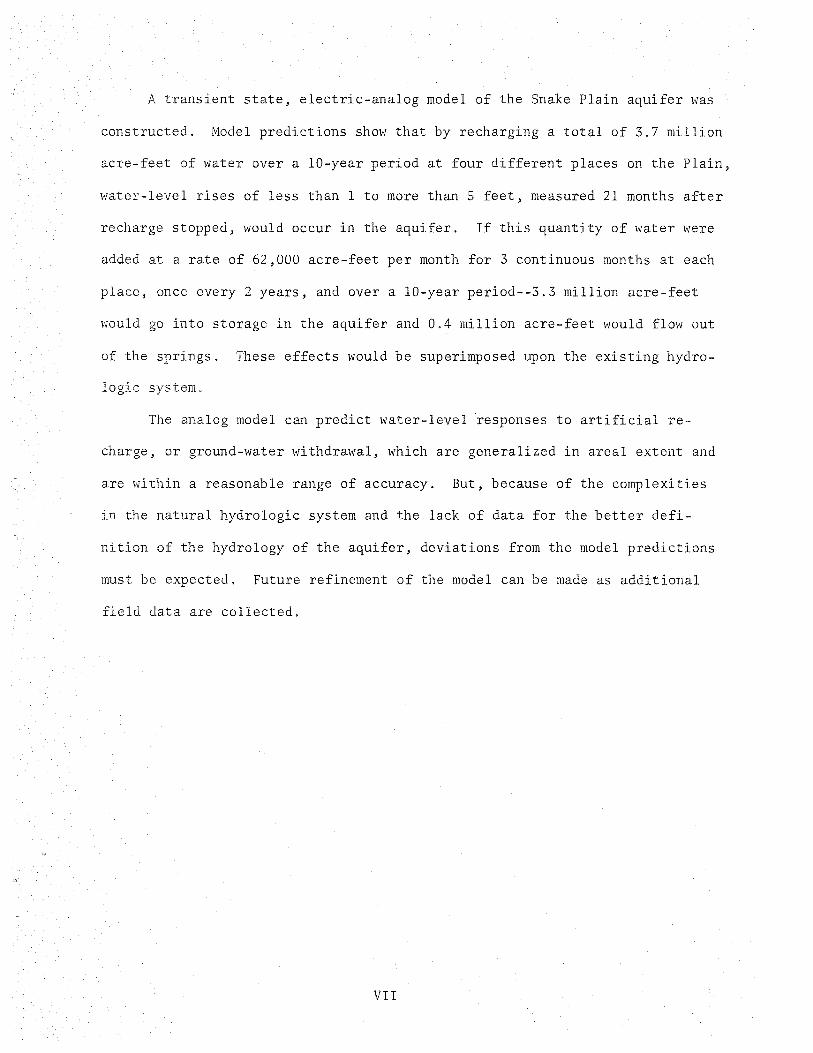
A transient state, electric-analog model of the Snake Plain aquifer was
constructed, Model predictions show that by recharging a total of 3.7 million
acre-feet of water over a 10-year period at four different places on the Plain,
water-level rises of less than 1 to more than 5 feet, measured 21 months after
recharge stopped, would occur in the aquifer. If this quantity of water were
added at a rate of 62,000 acre-feet per month for 3 continuous months at each
place, once every 2 years, and over a 10-year period--3.3 million acre-feet
would go into storage in the aquifer and 0.4 million acre-feet would flow out
of the springs. These effects would be superimposed upon the existing hydro
logic system.
The analog model can predict water-level responses to artificial re
charge, or ground-water withdrawal, which are generalized in areal extent and
are within a reasonable range of accuracy. But, because of the complexities
in the natural hydrologic system and the lack of data for the better defi
nition of the hydrology of the aquifer, deviations from the model predictions
must be expected, Future refinement of the model can be made as additional
field data are collected.
VII
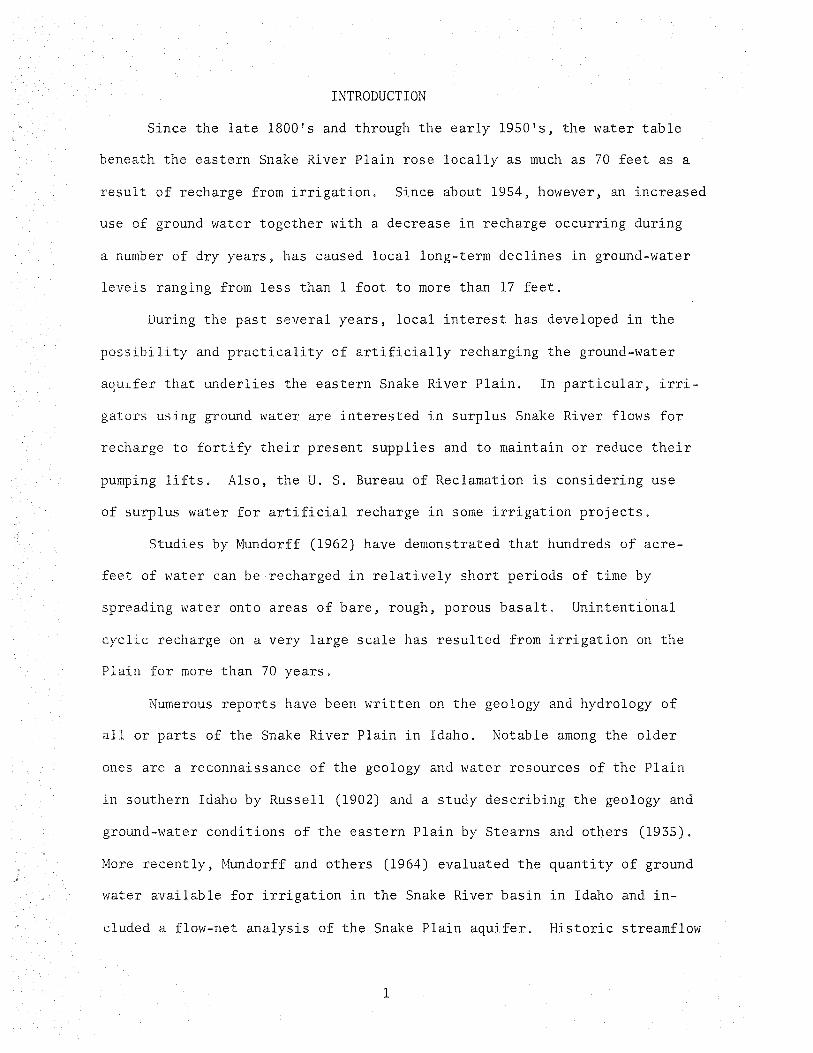
INTRODUCTION
Since the late 1800's and through the early 1950's, the water table
beneath the eastern Snake River Plain rose locally as much as 70 feet as a
result of recharge from irrigation. Since about 1954, however, an increased
use of ground water together with a decrease in recharge occurring during
a number of dry years, has caused local long-term declines in ground-water
levels ranging from less than 1 foot to more than 17 feet.
During the past several years, local interest has developed in the
possibility and practicality of artificially recharging the ground-water
aquifer that underlies the eastern Snake River Plain. In particular, irri
gators using ground water are interested in surplus Snake River flows for
recharge to fortify their present supplies and to maintain or reduce their
pumping lifts. Also, the U. S. Bureau of Reclamation is considering use
of surplus water for artificial recharge in some irrigation projects.
Studies by Mundorf£ (1962) have demonstrated that hundreds of acre
feet of water can be recharged in relatively short periods of time by
spreading water onto areas of bare, rough, porous basalt. Unintentional
cyclic recharge on a very large scale has resulted from irrigation on the
Plain for more than 70 years.
Numerous reports have been written on the geology and hydrology of
all or parts of the Snake River Plain in Idaho. Notable among the older
ones are a reconnaissance of the geology and water resources of the Plain
in southern Idaho by Russell (1902) and a study describing the geology and
ground-water conditions of the eastern Plain by Stearns and others (1935).
More recently, Mundorf£ and others (1964) evaluated the quantity of ground
water available for irrigation in the Snake River basin in Idaho and in
cluded a flow-net analysis of the Snake Plain aquifer. Historic streamflow
1
data, as
contained
U, S. Geo
The eastern Snake
tends 200 ffil
1) a
east, and
and on the s
eastward
ing the Plain are
terflow beds of
the Snake Plain fer, the
in Idaho The Snake
val
arbi trari the foot
the
The purpose
of the distribution
avai abi
(3 evaluate the
the fer· and
ficial re on
An aJ_S
from voluminous bas
and
compi ation
s of kind
lected
of the 1rri
the Idaho State
2
data
g
the
p
that
ser1
asin
ex-
of
drawn
s the mouths of
t
the
fer;
and the
ffe::ts of arti
fer,
ed are in
of Reclamation and
,.
GEO L OGICAL SURVEY
EXPLA1ano11
CJ lllnds i rrigated by aur!ace-water diversiona1 outlined and desi{;nated as 11 groups" 1-14 and 0 areaa11 A-G, in reference to data in tables l and 2 respe?ctively, in text
:.c.n.1 ..1 1rrit;o.ted by , or supplemented by, c round water p~ped from wel ls
"'-i P!'OXic.'.ltc boundary bet\'leen lands senred by Idaho Power · ,pany south of line ) and ll tall Power and Lii:ht :o -JJMY t north of l ine )
Apprnxi=tc boundary o:f Snake Plain aqui!er
5a.se :'rom . S. Geological Survey
.. ,_
1
I
I
~: ;1~
3
OF I DAHO DEPARTMENT OF RECLAMATION
., II
.a,st
I
I ~
~ i
use LI N
I
J__ I
Is !ha.!!!!.L.C!L -12 oow,, '° Ji
.. "'
D Areo eovered by
th is report
Irrigated land bounclaries taken !rem U. s. Bureau o! l!eclsmation and u. s. Soil Conservation Service prellminery field compilation data, l.966. Lend ol.aaaiti cations were not field checked tor th1a report.
FIGURE 1.--APPROXIMATE BOUNDARY OF SNAKE PLAIN AQUIFER AND GENERALIZED EXTENT
OF IRRIGATED LANDS, EASTERN SNAKE RIVER PLAIN, IDAHO.
<J 10 20 !ill••
(

Water Districts 36, 7-AB and 11-AB. The Northside Pumping Division,
Minidoka Project, Rupert, Idaho, and the Snake River Plain Development Office,
Boise, Idaho, both of the U. S. Bureau of Reclamation, furnished irrigation
records, Records on the distribution of irrigation water on the Fort Hall
Indian Reservation were supplied by the Land Operations and Irrigation De
partment, Fort Hall Agency of the U. S. Bureau of Indian Affairs, Fort Hall,
Idaho. The Big Wood Canal Co., Shoshone, Idaho, supplied reports on dis
tribution of irrigation water to lands in the northwestern part of the study
area, The Idaho Power Company, Boise, Idaho and the Rexburg, Idaho Branch
of the Utah Power and Light Company, Salt Lake City, Utah, provided records
which were necessary to make estimates of ground-water pumpage for irrigation
on the Plain, The authors are sincerely grateful to these organizations.
Special acknowledgment is due Mr. Reid J. Newby, Watermaster of Water
Districts 7-AB and 11-AB for time and effort so generously given in explan
ation of the operation of his district. Thanks also are given to the many
individuals and communities who allowed water-level measurements to be made
and water samples to be collected in their wells.
The authors are particularly grateful to personnel of the Geological
Survey Analog-Model Unit, Pheonix, Arizona, who brought the electric-analog
model of the Snake Plain aquifer to its present level of development.
STATUS OF IRRIGATION
History
Except for the relatively recent growth of the nuclear industry at NRTS
(National Reactor Testing Station), the economy of the Plain is dependent
almost wholly on agriculture. Because the climate is largely semiarid, the
success of agriculture is dependent on the availability and management of
water for irrigation.
5
Irrigation began on the Plain in the latter half of the nineteenth
century. The Carey Act of 1894 and the Federal Reclamation Act of 1902 pro
vided the primary incentives and the means for a rapid growth of irrigation
in the early 1900's.
Most of the easily accessible, arable land on the Plain was developed
by the mid-1920's. The first lands irrigated were those to which water
could be conveyed by gravity flow in canals adjacent to the streams. Since
the mid-1920's and continuing until about the late 1940's, a tapering off
occurred in the growth of irrigated acreage. In the late 1940's, a resur
gence in land development was brought about by the use of ground water for
irrigation. By late 1965, an estimated 43 percent of all irrigated land
within the Plain was either wholly or supplementally supplied by ground water
pumped from wells. The percentage continues to rise because arable lands
that were formerly considered economically inaccessible for irrigation can
now be supplied with water from deep wells.
Present Irrigation
As of the end of the 1965 irrigation season, an estimated 1,510,000
acres were irrigated within the area shown on figure 1--910,000 acres by sur
face-water diversions and 600,000 acres by ground-water pumping. About 6
percent (52,000 acres) of the area irrigated by surface water is supple
mented with ground water.
The generalized areal extent of the irrigated lands is shown on fig
ure 1. Classification of these lands as to source of irrigation water was
done by gleaning information from county compilation maps, from previously
compiled irrigated-area maps, and from limited field observations.
The boundaries of irrigated lands drawn in this report are approximate,
and the water distributions given are estimates. They were made solely for
6
us in this study of the Snake Plain hydrologic system. They do not preclude
the need for a detailed quantitative study of water use on the Plain.
Surface Water
An average of about 6,600,000 acre-feet of surface water is delivered
annually to the heads of the main canals which distribute water to the lands
classified as "irrigated by surface-water di version" on figure 1. (Note
3 percent of total lands excepted below.) Of this total, about 4,000,000
acre-feet, or about 60 percent, seeps into the ground and recharges the Snake
Plain aquifer.
Inorder to summarize herein the distribution of this tremendous volume
of irrigation water, the lands classified as "irrigated by surface-water di
version" on figure 1 were subdivided into "groups" (designated by numbers 1-14)
and 11 areas 11 (designated by letters A-G). Lands along the northern boundary
of the Plain that were not included in either "groups" or "areas" account
for less than 3 percent of the total lands irrigated by surface-water diver
sion, No attempt was made to describe their distribution.
An analysis of the distribution of irrigation water was made for each
parcel of land subdivided as above. The total quantity of water distributed
to each subdivision was equated to that part of the water that leaves plus
that part of the water that remains in a subdivision. That is, the sum of
the water that leaves, including (1) consumptive irrigation requirements
(Jensen and Criddle, 1962), (2) evaporation from water surfaces in the main
canals, and (3) waste water returned to the streams was combined with the sum
of the water that remains, including (4) deep percolation losses through
canal beds and (5) deep percolation from farm fields. The two combined sums
then were made to equal the total quantity of water distributed. Estimates
of water volumes were made for the first four items above; the fifth item,
7
then was computed to be the difference between the total of the first four
items and the total quantity of water distributed to the subdivision. No
direct means were available to obtain values for items 2, 3, and 4 above;
therefore, estimates of S percent, 3 to 20 percent, and 10 to 30 percent,
respectively, were used. These estimates, based largely on fragmentary evi
dence and on judgment, were varied in different parts of the Plain.
Data used in table 1 were derived from the annual records compiled by
Water District 36. Because little change has occurred in the distribution
system since activation of Palisades Reservoir in 1956, the average annual
(1956-65) figures shown in table 1 probably represent the status of irri
gation to date. In table 1, column 4 is the average annual total diversions
at the head of the main canals in each group and was obtained from records
of flow measurements. Column S was obtained by dividing column 4 by the
total irrigated acreage in each group thus column 4 divided by column 5 gives
the average number of acres irrigated annually in each group. Column 6 was
derived by adjusting column S for estimates of deep percolation through canal
beds, evaporation from the canal distribution system, and waste water return
to streams, and thus gives an estimate of the volume of water per acre spread
on the crops. Column 7 is column 6 minus the consumptive irrigation require
ment and plus the percolation losses through canal beds. It shows, for each
canal group, the total amount of water per irrigated acre that recharges the
Snake Plain aquifer, and in some areas exceeds the value for water spread
because canal losses are so high.
Data used in table 2 were derived from reports compiled by the Big Wood
Canal Co., and from records collected by Water Districts 7-AB and 11-AB. The
distribution breakdown in table 2 begins with total diversions at farm head
gates (column 4) rather than at the head of main canals, as is done in table 1.
8
Therefore, column 6 shows the estimated deep percolation only from crop lands;
it does not include the deep percolation from the main canals. The average
annual total di versions at the head of the distribution systems to the let
tered "areas" A-Fare estimated to be 260,000 acre-feet, or 7,3 acre-feet
per acre from Magic Reservoir; and 422,000 acre-feet or 7.1 acre-feet per
acre, through the Milner-Gooding Canal.
Data are included in both tables 1 (column 8) and 2 (column 7) so that
di versions for 1961, the lowest year in the decade for water availability,
an be compared with the average annual diversions. Comparison shows that
the distribution of water to lands in the lettered "areas II is considerably
less during a low-water year. Although not affected as greatly, lands in the
numbered "groups" lost from 0.0 to 1.4 acre-feet per acre in water distributed
to the crops and from 0.1 to 1.7 acre-feet per acre in water recharged to the
Snake Plain aquifer. Although the crops received enough water for growth,
there was a significant reduction in recharge to the aquifer.
Ground Water
In 1965, an estimated 2,100,000 acre-feet of water was pumped from wells
t irrigate the lands classified as "irrigated by, or supplemented by, ground
water" shown on figure l, This amounts to about 3. 3 acre-feet per acre per
1 ion season for lands irrigated solely by ground water, and about 1.8
acre-feet per acre for lands supplemented by ground water. Of the total,
about 1,100,000 acre-feet, or 52 percent, of the pumped water re-entered the
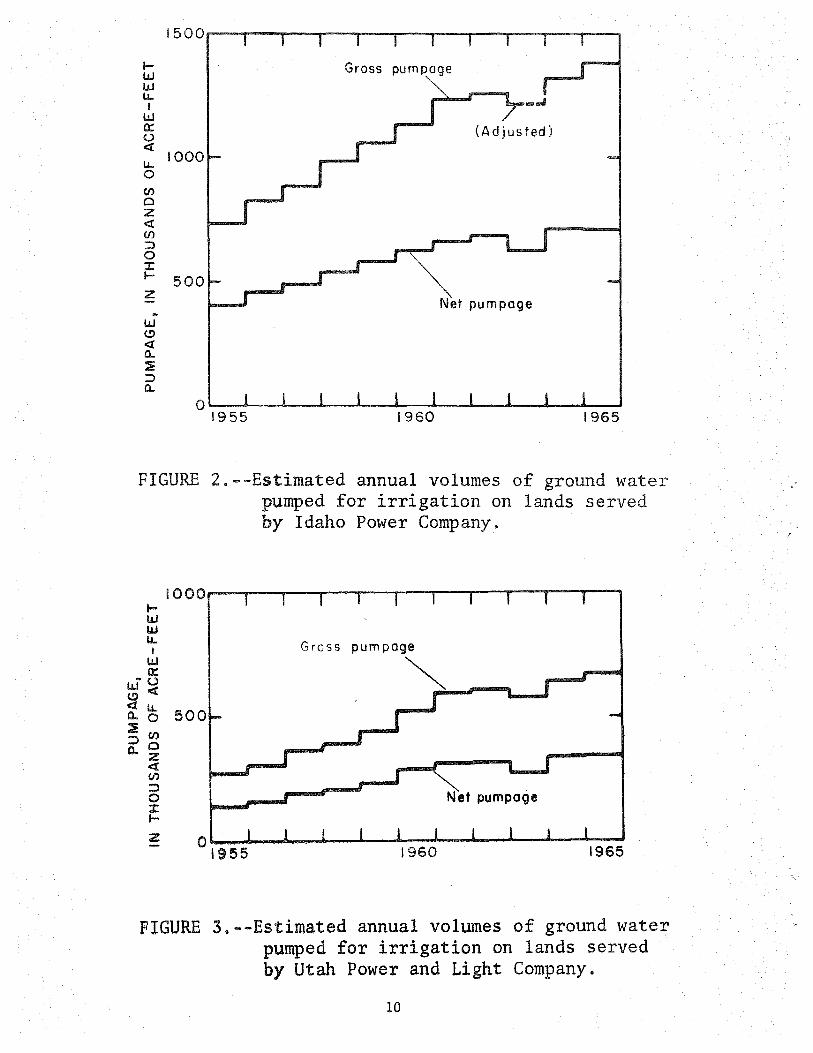
ground as return flow to the Snake Plain aquifer. The ground-water pumpage
estimates were derived from data obtained from IPCo (Idaho Power Co,) and
UPLCo (Utah Power and Light Co.). The line separating the territories served
by each power company is shown on figure 1. Figures 2 and 3 are graphs show
ing the estimated gross and net pumpage (gross pumpage minus consumptive
9
1500
I-w Gross pumpoge w LL .... ..J I / w a:: (Adjusted) u <(
LL 1000
0 (/)
0 z <( (/) ::)
0 :c I- 500 z
Net pumpage . w (!) <( a. ~ ::) a.
0 !955 1960 1965
FIGURE 2.--Estimated annual volumes of ground water pumped for irrigation on lands served by Idaho Power Company.
1000 I-w w LL
Gross pump age I w
~ a:: ~u w <( (!) <( LL a. 0 500 :Ii (/) ::, 0 a. z
<( (/) ~ :;:) 0 Net pumpage :c I-
z 0 1955 1960 1965
FIGURE 3.--Estimated annual volumes of ground water pumped for irrigation on lands served by Utah Power and Light Company.
10
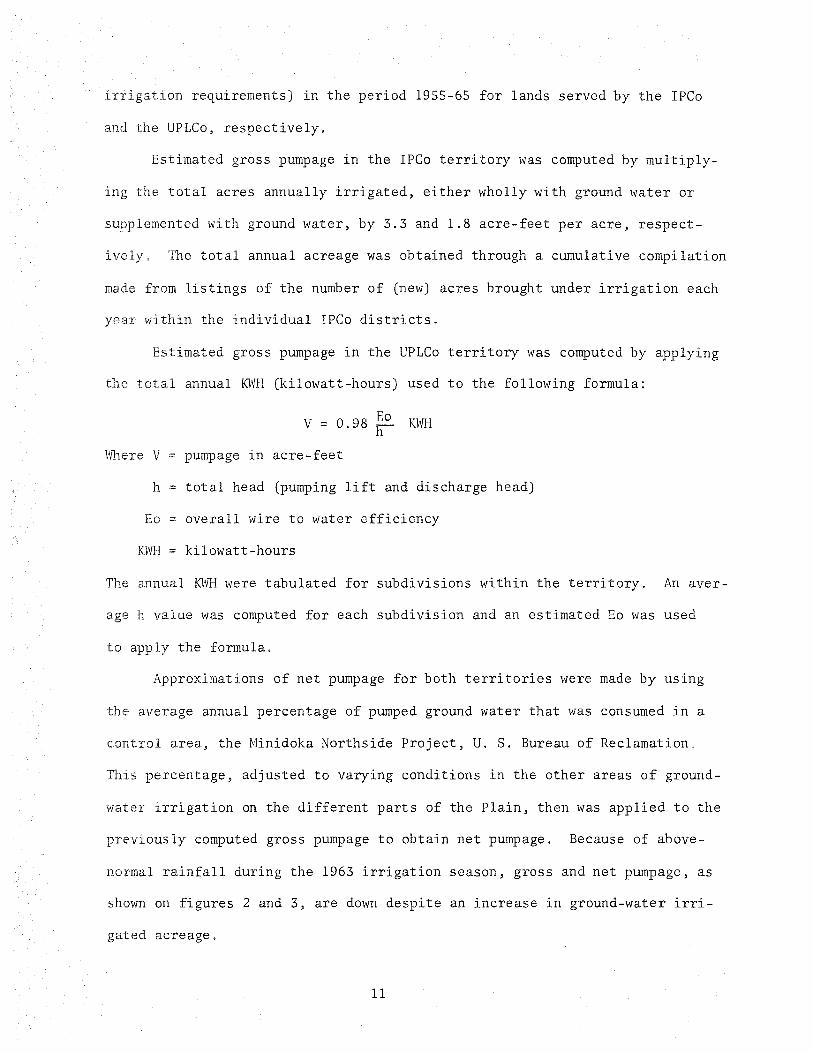
requirements) in the period 1955-65 for lands served by the IPCo
and the UPLCo, respectively.
Estimated gross pumpage in the IPCo territory was computed by multiply
ing the total acres annually irrigated, either wholly with ground water or
supplemented with ground water, by 3.3 and 1.8 acre-feet per acre, respect-
ive The total annual acreage was obtained through a cumulative compilation
made from listings of the number of (new) acres brought under irrigation each
year within the individual IPCo districts.
Estimated gross pumpage in the UPLCo territory was computed by applying
the total annual KWH (kilowatt-hours) used to the following formula:
V = 0.98 ~o KWH
Where V = pumpage in acre-feet
h = total head (pumping lift and discharge head)
Eo = overall wire to water efficiency
KWH= kilowatt-hours
The annual KWH were tabulated for subdivisions within the territory. An aver
age h value was computed for each subdivision and an estimated Eo was used
to apply the formula.
Approximations of net pumpage for both territories were made by using
the average annual percentage of pumped ground water that was consumed in a
control area, the Minidoka Northside Project, U. S. Bureau of Reclamation.
This percentage, adjusted to varying conditions in the other areas of ground
water irrigation on the different parts of the Plain, then was applied to the
previously computed gross pumpage to obtain net pumpage. Because of above
normal rainfall during the 1963 irrigation season, gross and net pumpage, as
shown on figures 2 and 3, are down despite an increase in ground-water irri
gated acreage.
11
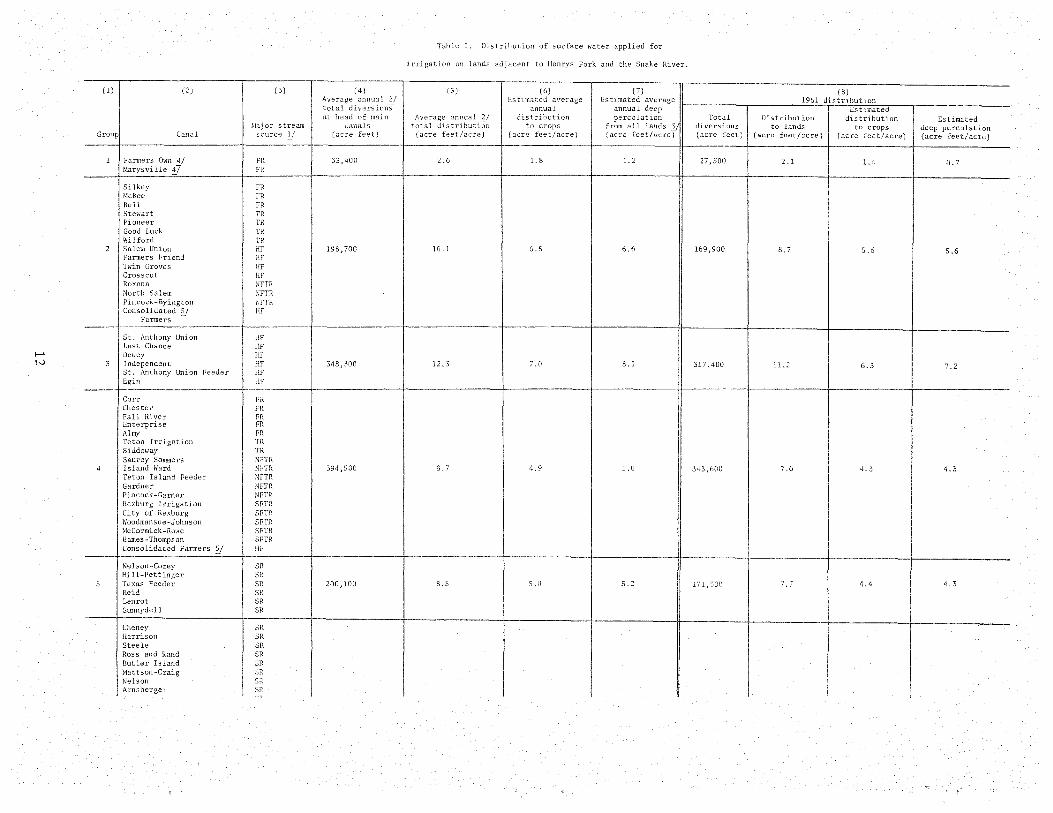
Table l. Distribution of surface water applied for
irrigation on lands adjacent to llcnrys Fork and the Snake River.
(I) (2) (3) [4) (SJ annual average average 1961 <listrilmtion
annual annual deep Estimated at head of main annual dis tr ibut:i on percolation Total Distr.:i but ion distribution Estimated
stream canals total from all lands :c}/ di versions to lands to deep percolation Group Canal source (acre feet) (acre feet/acre) (acre (acre (acre feet) (acre feet/acre) (acre (acre feet/acre)
1 Farmers Own4
7_1 FR 33,400 2. (> I. 8 1. 27,300 1 I. 4 0. 7 Marysville FR
Silkey FR McBee FR Bell FR Stewart TR Pioneer TR Good Luck TR Wilford TR
2 Salem Union HF 198,700 10. I 6.6 169,900 8. 7 5 .6 Farmers Friend IIF Twin Groves IIF Crosscut IIF Roxana NFTR North Salem NFTR Pincock-Byington NFTR Consolidated !;_/ IIF
Farmers
St. Anthony Union HF Last Chance IIF Dewey HF
3 In<lependent HF 348,300 7. II 8 .1 317,400 6.3 7. 2 St. Anthony Union Feeder HF Egin
Curr FR Chester FR Fall River FR Enterprise FR Almy FR Teton Irrigation TR Siddoway TR
Saurey Sommers NFTR 4 Island Ward NFTR 394,500 4 .9 5 .0 343,600 7 .6 4.3
Teton Island Feeder NFTR Gardner NFTR Pincock-Garner NFTR
Irrigation SFTR City Rexburg SFTR Woodmansee-Johnson SFTR McCormick-Rowe SFTR Eames-Thompson SFTR Consolidated Farmers 'd HF
Nelson-Corey SR Hill-Pettinger SR
5 Texas Feeder SR 200,100 8. 8 5 .0 4. 3 Reid SR Len rot SR Sunnydell SR
Cheney SR Harrison SR Steele SR Ross und Rand SR Butler Island SR Mattson-Craig Nelson Arnsberger SR
Enterprise SR Fanners Friend SR Progressive SR Long Island and SR
West LaBelle Rigby SR 1,206,200 9. 6 5. 8 S .6 l, 131,400 Island SR Dilts SR East LaBelle SR Clark and Edwards SR Burgess SR Kite and Nord SR Lowder-Jennings SR Boomer-Rudy SR Bramwell SR Ellis SR
White SR North SR Parks SR
Bear Island and Smith SR Great Western Group SR
Porter New Sweden Martin West Side Mutual
Kennedy SR 357,900 5. 9 3. 7
Osgood SR Butte and Market Lake SR Woodville SR
Snake River Valley 443,000 5 .ll . 3
8 Idaho
Nielsen-Hanser SR Corbett Slough SR
9 Blackfoot SR 221,300 6 .6 4. 6
Reservation 6/ SR '
Parsons SR Watson Slough SR
Wearyrick SR Trego SR 661,300 3 4 .1 4.1
10 Dans kin SR
Riverside SR
Aberdeen-Springfie 1 d SR
Peoples SR
New Lava Side SR
11 Fork Hal 1 Main BR 109,600 6.1 4.1
SR
12 Minidoka SR 439,400 6.1 3
13 Minidoka North Side Pump SR ,800 3. 9 2. 6 l .6
14 North Side S.R l, 199,300 7. 5 5. 5 5 .0 PA Lateral SR
ij FR, Falls River; TR, Teton River; HF, Henrys Fork; NFTR, North Fork Teton River; SFTR, South Fork Teton River; SR, Snake River; BR, Blackfoot River; SC, Sand Creek
y Period 1956-65
y Exceeds colwnn 6 in some areas because of h:i gh losses from canals
±f Part of service is outside of report area
?} Serves land in gxoups 2 and 4
5!.J Part of water goes to Fort Hal 1 Main Canal, group 11
303,300
441,000
214,300
,!00
95,100
393,300
54,200
890,500
9.0 . s 5. 2
5 .4 3. 2
7. 7 5 .0 5. 2
6. 4 .5
5. 4
5. 3
5. 5 7 2. 8
4. 5 3.1
5. 6 3. 3
Area
A
B
I-' C +'>
D
E
F
G
y
y
Table 2. Distribution of surface water for irrigation on lands
in the Hunt tract and adjacent to the Big Wood and Little Wood Rivers.
or reservoir Tract source
Richfield Magic
North Shoshone American Falls Magic
North Gooding American Falls
South Gooding American Falls
Dietrich American Falls Magic
Hunt American Falls
Carey Little Wood River Fish Creek
Period 1956-65
Diversions for 1956-60 are estimated
All estimates
69,700
76,600
60,700
73,900
46,100
32,400
16,000
annual distribution
to (acre
4.2
4.1
4.3
4.9
4.7
4.6
1.6
Estimated average annual
percolation lands
.6
2.4
2.6
3.1
2.9
2.6
0.1
diversions. (acre feet)
20,400
40,700
42,600
52,000
19,100
22,700
14,600
Distribution to
(acre
.4
2.5
2.8
3.1
. 2
3.0
1.4
deep percolation from crop lands (acre feet/acre)
0
0.
1. 2
1.4
0.7
1. 3
0
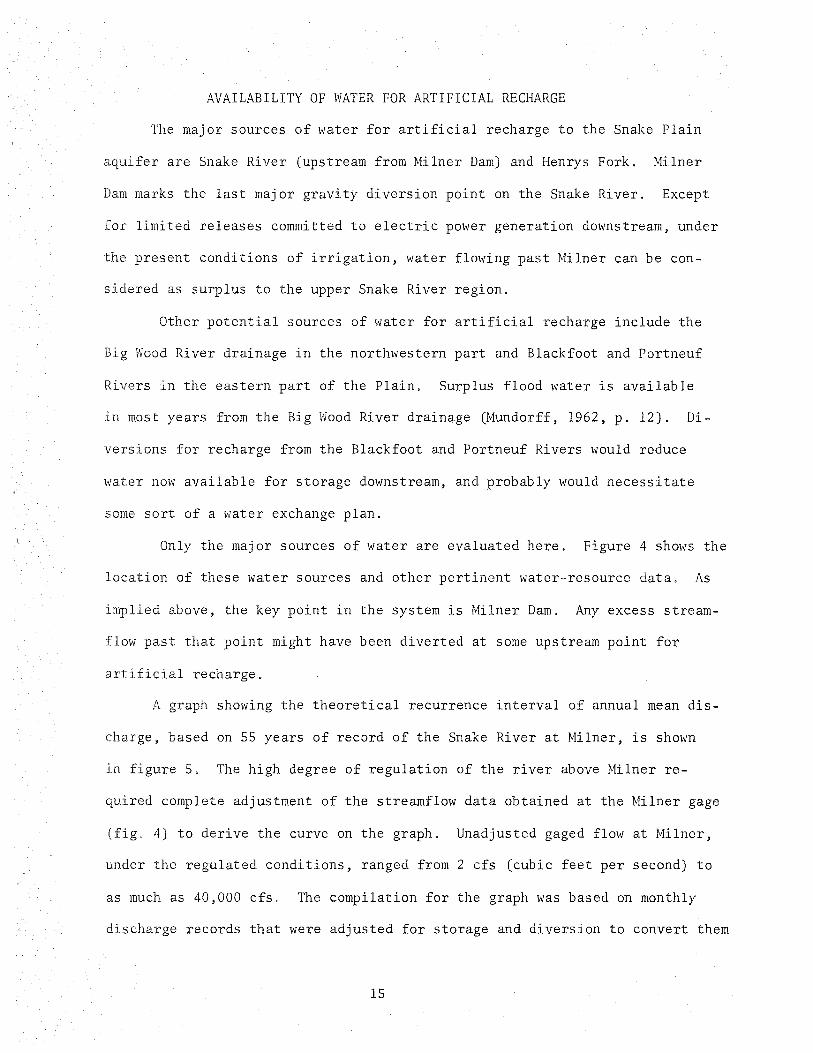
AVAILABILITY OF WATER FOR ARTIFICIAL RECHARGE
The major sources of water for artificial recharge to the Snake Plain
aquifer are Snake River (upstream from Milner Dam) and Henrys Fork. Milner
Dam marks the last major gravity diversion point on the Snake River. Except
for limited releases committed to electric power generation downstream, under
the present conditions of irrigation, water flowing past Milner can be con
sidered as surplus to the upper Snake River region.
Other potential sources of water for artificial recharge include the
Big Wood River drainage in the northwestern part and Blackfoot and Portneuf
Rivers in the eastern part of the Plain. Surplus flood water is available
in most years from the Big Wood River drainage (Mundorf£, 1962, p. 12). Di
versions for recharge from the Blackfoot and Portneuf Rivers would reduce
water now available for storage downstream, and probably would necessitate
some sort of a water exchange plan.
Only the major sources of water are evaluated here. Figure 4 shows the
location of these water sources and other pertinent water-resource data. As
implied above, the key point in the system is Milner Dam. Any excess stream
past that point might have been diverted at some upstream point for
artificial recharge.
A graph showing the theoretical recurrence interval of annual mean dis
charge, based on 55 years of record of the Snake River at Milner, is shown
in figure 5. The high degree of regulation of the river above Milner re
quired complete adjustment of the streamflow data obtained at the Milner gage
(fig. 4) to derive the curve on the graph. Unadjusted gaged flow at Milner,
under the regulated conditions, ranged from 2 cfs (cubic feet per second) to
as much as 40,000 cfs. The compilation for the graph was based on monthly
discharge records that were adjusted for storage and diversion to convert them
15
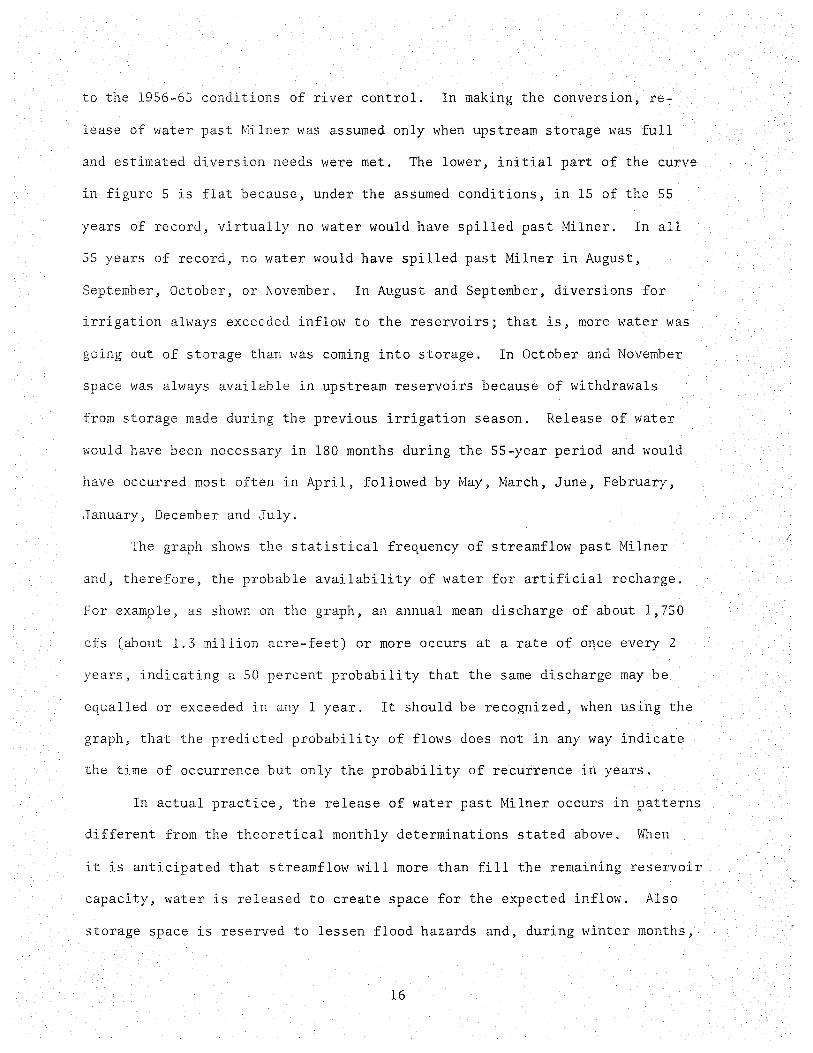
to the 1956-65 conditions of river control. In making the conversion, re
lease of water past Milner was assumed only when upstream storage was full
and estimated diversion needs were met. The lower, initial part of the curve
in figure 5 is flat because, under the assumed conditions, in 15 of the 55
years of record, virtually no water would have spilled past Milner. In all
55 years of record, no water would have spilled past Milner in August,
September, October, or November. In August and September, diversions for
irrigation always exceeded inflow to the reservoirs; that is, more water was
going out of storage than was coming into storage. In October and November
space was always available in upstream reservoirs because of withdrawals
from storage made during the previous irrigation season. Release of water
would have been necessary in 180 months during the 55-year period and would
have occurred most often in April, followed by May, March, June, February,
January, December and July.
The graph shows the statistical frequency of streamflow past Milner
and, therefore, the probable availability of water for artificial recharge.
For example, as shown on the graph, an annual mean discharge of about 1,750
cfs (about 1.3 million acre-feet) or more occurs at a rate of once every 2
years, indicating a 50 percent probability that the same discharge may be
equalled or exceeded in any l year. It should be recognized, when using the
graph, that the predicted probability of flows does not in any way indicate
the time of occurrence but only the probability of recurrence in years.
In actual practice, the release of water past Milner occurs in patterns
different from the theoretical monthly determinations stated above. When
it is anticipated that streamflow will more than fill the remaining reservoir
capacity, water is released to create space for the expected inflow. Also
storage space is reserved to lessen flood hazards and, during winter months,
16

I-' --..]
6 0 4
(/) z 0 0
I-u z w w <( (/) w (/) 3 LL :::) 4 I
0 er:: zw
I w - ... er::
I- a.. UJ u I- CD <(
z w er: 2 <{ LL
-- w IO W LL CD
2 u (./)
a:: u (./) z <( - oO I m
(Reference point, in text) u :::) ....J 0 ....J (./)
0 LL ~ 0
0 0 I. 0 I I.I 0 2 10 60
RECURRENCE INTERVAL, IN YEARS
FIGURE 5.--Recurrence interval of annual mean discharge of Snake River at Milner, Idaho.
er:: <(
UJ >-
er:: w 0...
to prevent damage ice Therefore, releases may occur at almost any time
of the year, depending on the judgment of the watermaster, The most opportune
time to artificially recharge the aquifer would coincide, of course, with the
decision to release surplus water at Milner,
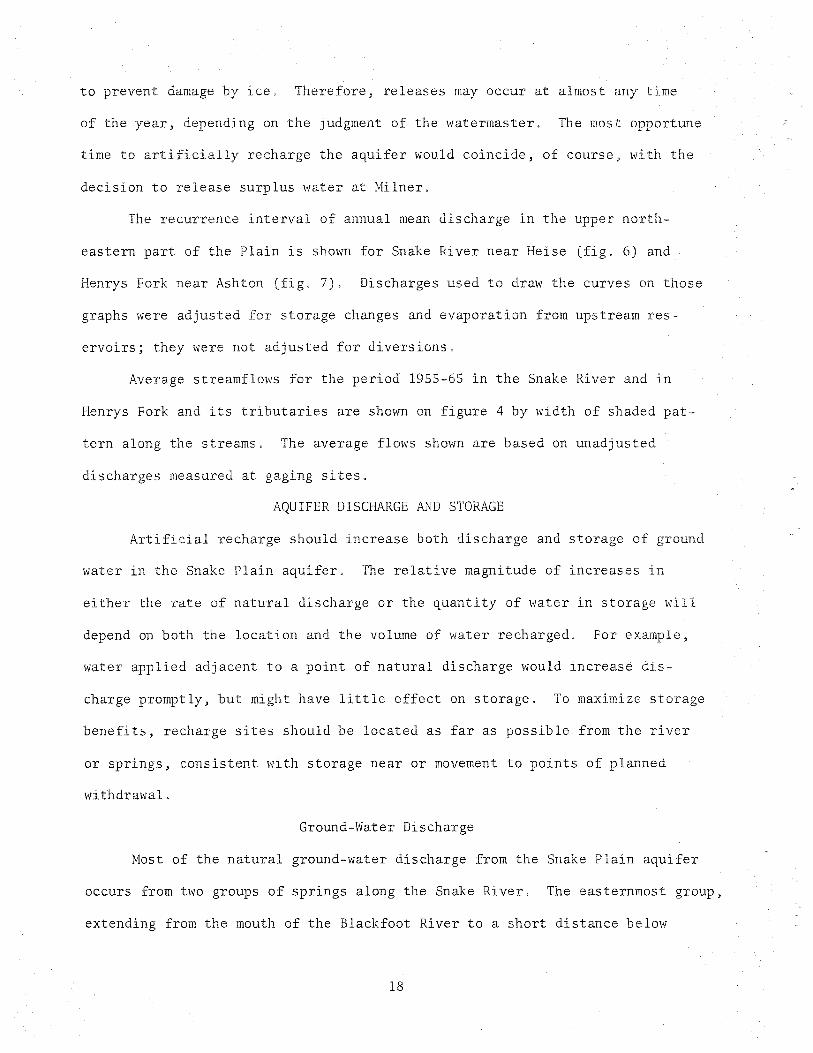
The recurrence interval of annual mean discharge in the upper north
eastern part of the Plain is shown for Snake River near Heise (fig, 6) and
Henrys Fork near Ashton g, 7) Discharges used to draw the curves on those
graphs were adjusted for storage changes and evaporation from upstream res
ervoirs; they were not adjusted for diversions
Average streamflows for the period 1955-65 in the Snake River and in
Henrys Fork and its tributaries are shown on figure 4 by width of shaded pat
tern along the streams The average flows shown are based on unadjusted
discharges measured at gaging sites,
AQUIFER DISCHARGE AND STORAGE
Artificial recharge should increase both discharge and storage of ground
water in the Snake Plain aquifer, The relative magnitude of increases in
either the rate of natural discharge or the quantity of water in storage wi 1
depend on both the location and the volume of water recharged, For example,
water applied adjacent to a point of natural discharge would increase dis
charge promptly, but might have little effect on storage, To maximize storage
benefits, recharge sites should be located as far as possible from the river
or springs, consistent with storage near or movement to points of planned
withdrawal,
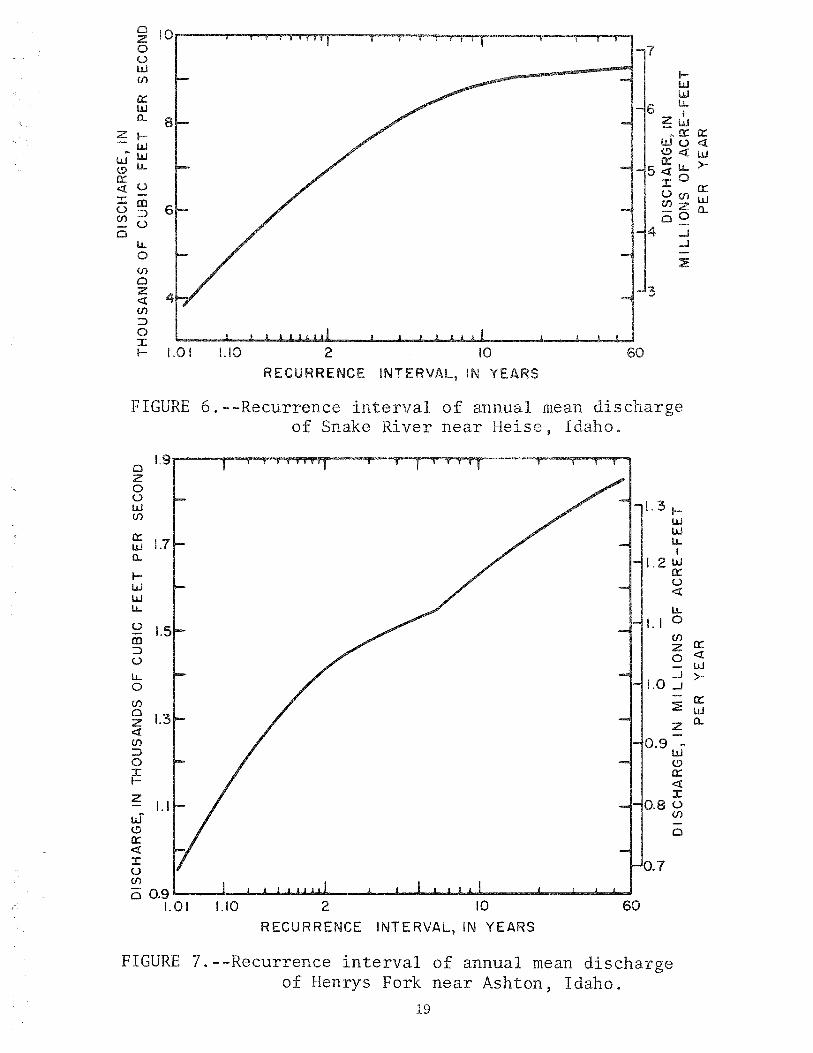
Ground-Water Discharge
Most of the natural ground-water discharge from the Snake Plain aquifer
occurs from two groups of springs along the Snake River, The easternmost group,
extending from the mouth of the Blackfoot River to a short distance below
18
0 10 :z 0 7 u w i-(I) w 0::: w
6 LL w z' a.. 8 _w
:z i- ~ 0::: 0::: w u <{ w (!) <{ w ~w
I.LI u.. 5 ~ I.L )-(.!:)
0::: IO <{ u 0:: u (/) w J.: cc ~ 0.. u :J (/) 0 u
4 ....I 0 lL ....l 0 (/)
~
0 :z 3 <I (/)
::)
0 J.: i- 1.0 I 1.10 2 10
RECURRENCE INTERVAL, IN Y s
FIGURE 6.--Recurrence interval of annual mean discharge of Snake River near Heise, Idaho.
0 1.9----.-.......................... ._..-........,,..-..__,.._...,_l""T' ______ ""'l"""'_,......,.,"""'I
:z 0 u w (/)
0:::: w 1.7 0..
i-w w LL
u 1.5 cc ::)
u I.I.. 0 (/)
0 :z 1.3 <I (/) ::)
0
~ z
w (!)
0::: <{
I u (/)
I. I
o 0.9"-~--1.~ ..... ....ii...,...1.,1,,,1,.i..a..,~~ ...... ..-. ...... ...-............. .._~~ ...... ~ .........................
1.01 1.10 2 10 60
RECURRENCE INTERVAL, IN YEARS
I. 3 i-w w I.I.. I
1.2 w 0:::: u <I
LL
I. I 0 (/)
:z 0 ....J
1.0 ....l -~
:z -0.9 ~
w (!)
0:: <I I
0.8 u (/)
0
0.1
FIGURE 7.--Recurrence interval of annual mean discharge of Henrys Fork near Ashton, Idaho.
19
a:: <! w >-
a:: w a..

8 s , or about
s of the
4 7 A minor group
di
a
the river
abo water
tern
Snake
canyon
groups
was de
e;rm1ned the flow at
Res
ow
t
the Snake
f ' J lumes of
the north and
s souths
remainder considered
t:o
ng an increase
fer, as
20
0 7 z 5 0 springs t) w Milner and King Hill (f)
I-0::: w w w a. 6 u..
I I- w w 0::: w 4 u u.. <t
u u.. 5 0
CD 0::: => (f) <t 0 z w u.. 0 >-0 ....J
(.f) _J 0:::
0 3 w z 4 ~ CL
<t z (J) :::)
N 0 w I-' :r: t?
I- 0:::
z <t 3 :r:
(.) w 2 (.f) <.!'.) 0::: <t
0
:r: Springs between Blackfoot and Neeley 0
(J) 1.5 0 2
0 0 0 0 0 0 © C\J r<) ,;t LO © ©
(J') (J') 0) (J') (J') 0) 0)
FIGURE 8.--Annual mean discharge from the two major groups of springs drain the Snake Plain aquifer.
ed
the
he:d
veals
about 10
dee
Jerome
The
a
p
of Some reasons for
fer were lain-
) '
se ervation we ls in
of water
different fer, 4 and table 3,J
some
1950's to the
an area of
are not shown
1960 s water
2,000 mi
figure 4, re
lined
The
that the few s for which records are available are rep-
ab
tire place the tern of the
Snake River, in southeastern Lincoln eastern
and the southern of Blaine
on the crudest estimates of in ground-water
mixed, the
ion of
to be in the of 2 million acre
Sub to 1965 levels show
trend in those same counties
ITY OF
where waters from different en-
cal character of both should be known,
lems that may arise and,
9 ct an overall
and
enable
al of the
cance of this
the eastern Snake
is as fo lows,
Surface Water
of the Snake basin irri ion return flows
the di solved o ids and the sodium content the
22

Table 3.--0bservation-well data
Well number Location
1 SE\NE\ sec. 11, T. 9 N., R. 34 E.
2 SE\NW\ sec. 34, T. 7 N., R. 31 E.
3 NW\SW\ sec. 20, T. 7 N., R. 35 E.
4 NW\SE\ sec. 23, T. 7 N., R. 38 E.
5 SE\NW\ sec. 9, T. 5 N., R. 34 E.
6 SE\NE\ sec. 14, T. 3 N., R. 29 E.
7 NW\NW\ sec. 30, T. 1 N., R. 29 E.
8 SW\SW\ sec. 1, T. 1 N., R. 36 E.
9 NW\NW\ sec . 6, T. 4 S . , R. 2 4 E .
10 NW\SW\ sec. 3, T. 4 S., R. 33 E.
11 SW\NE~ sec. 26, T. 5 S., R. 17 E.
12 NW~NE~ sec. 27, T. 5 S., R. 31 E.
13 SW\NW~ sec. 16, T. 8 S., R. 14 E.
14 NE~NW~ sec. 2, T. 8 S., R. 23 E.
15 NW~NE~ sec. 27, T. 8 S., R. 26 E.
16 NE~SE~ sec. 1, T. 9 S., R. 20 E.
* Altimeter determination
Land surf ace altitude
(Feet above mean sea level)
4955*
4848.8
4818.2
4852.4
4 791. 3
4917.9
5066.9
4674.0
4493.4
4447.9
3972 .6
4399.8
3175.3
4263.6
4238.5
4211. 3
Depth of well (Feet below land surface)
192
320
58
236
553
588
704
217
445
53
254
46
53
290
225
400
surface waters. However, most of the water is still satisfactory for irriga-
tion of the crops being grown; but, in some areas, treatment would be required
before the water could be used for municipal or industrial supply. Some de-
terioration of water quality should be expected and could become a problem in
the future if large increases in irrigation occur.
The headwaters of mo'st tributaries entering the Snake River Plain are
of the calcium bicarbonate type and are relatively dilute, containing 160 mg/1
23
grams per 1 solved-solids or less.
and sodium increase markedly downstream,
use. However, waste disposal, mineral zed
contribute to the downstream increase. The dis
streams entering the Snake River is as much ass
in their headwaters (Laird, 1964, p. 1).
s
Waters in the or tributaries
of the calcium-magnesium bicarbonate
the Snake
with
, chloride, and sulfate. Their dissolved-so
than 100 to slight more than 300 mg/1 and
sodium age normally averages less than 25.
Waters in tributaries entering the Snake
more hi mineralized than the northern
of sodium, chloride and sulfate. The
attributed to a combination of several
conditions, more extensive irrigation, relative
val fill sediments, and
main tern of the Snake shows
reflect both man's use and the effe
the stream. Samples co 1
1965, in the reach from the
a progressive increase in both SAR
s lved-solids content (McConnell, 1967). The SAR
and dissolved solids increased from about 175 to more
Buh the dissolved-solids content decreased to 340
of less mineralized spring water.
24
than

In parts of the Henrys Fork basin, unusually high concentrations of
fluoride occur. Laird (1964, p. 14) reported concentrations of more than
4 mg/1 in places. Fluoride content in Henrys Fork, from Island Park Res-
ervoir to its mouth, ranged from 1.4 to 1.8 mg/1. The higher fluoride
concentrations occur in streams draining the volcanic rocks in the northern
and eastern parts of the basin.
Little is known of the sediment-transport characteristics of the
streams on the Snake River Plain. Rainwater (1962) delineated the area into
;ones of average annual discharge-weighted mean concentrations of suspended
sediment Those zones covered three ranges: less than 270 mg/1, 270-1900
mg/1 and 1900-5600 mg/1. The zones of highest concentration were in the
southwest corner of the study area and in a wide band north of the Snake
River and west of Henrys Fork, extending from near Ashton to King Hill. The
zones of lowest concentration covered the upper reaches of the tributaries
from the north and northeast and a narrow strip along the Snake River up-
stream from Burley.
Measurements of suspended-sediment concentration were made by the U. S.
Geological Survey and the U. S. Bureau of Reclamation at sites (fig. 9) on
several streams on the Snake River Plain during the period 1960-66. The data
obtained are from spot measurements and are summarized in the following table:
Station Days Observed concentration (mg/1) Number Station Sampled Maximum Minimum
13-375 Snake River near Heise 10 63 8 13-505 Henrys Fork at St. Anthony 26 80 5 13-550 Teton River near St. Anthony 27 369 25 13-600 Snake River near Shelley 9 165 25 13-695 Snake River near Blackfoot 6 151 34 13-755 Portneuf River at Pocatello 6 2600 62 13- 770 Snake River at Neeley l 22 13-1170 Birch Creek near Reno 12 32 5
25

Although these data are insufficient to give conclusive results, they
do indicate that the concentration shown on the map by Rainwater (1962) may
be somewhat high in places.
Ground Water
The chemical character of the ground water in the Snake Plain aquifer
is determined primarily by the chemical character of the water recharging the
aquifer. Most water entering the Plain on the north and recharging the aquifer
(fig, 9) has a dissolved-solids content averaging less than about 250 mg/1.
Ground water in the down-gradient part of the Plain and distant from irrigated
areas also contains less than 250 mg/1 dissolved solids, indicating that nat
ural increases from dissolving of minerals in the basalt aquifer are slight.
The greatest change in the chemical quality of the ground water in the
aquifer occurs probably as a result of recharge from irrigation water. The
isopleth lines shown in figure 9 enclose areas where most of the ground waters
sampled contain more than 250 mg/1 dissolved solids. Those areas coincide
closely with areas of irrigation.
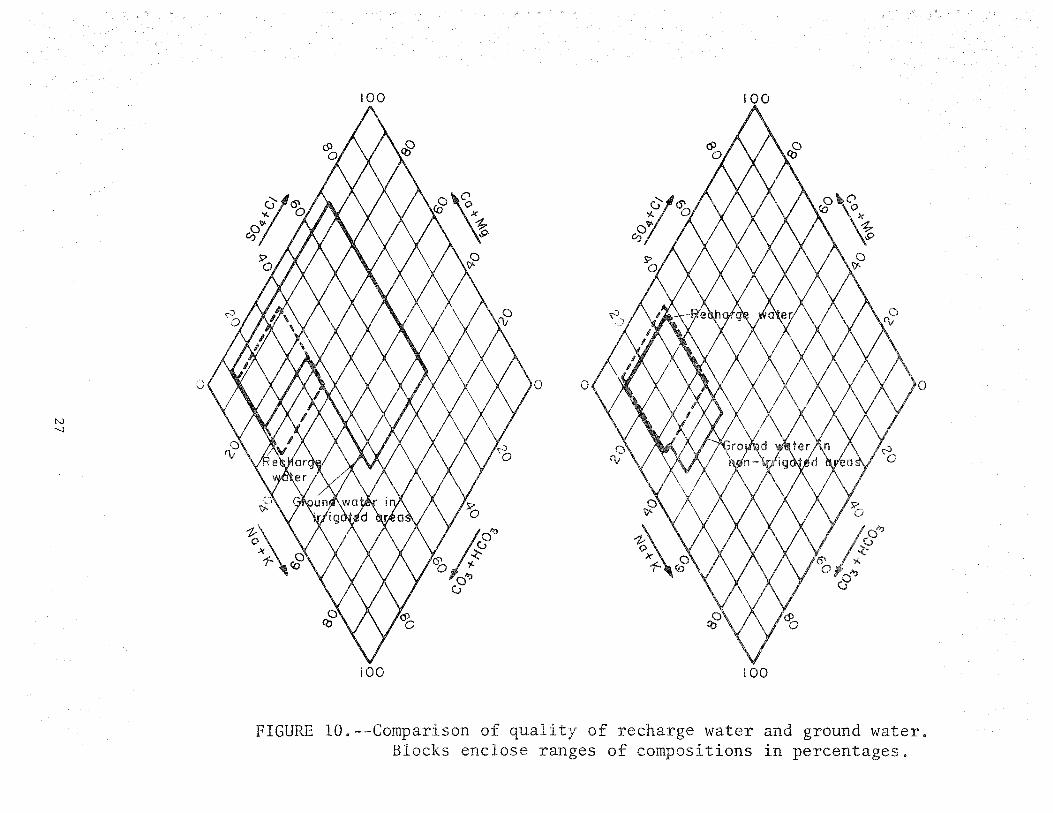
As irrigation water percolates through the soils, leaching and ion-ex
change reactions take place. When the water reaches the aquifer, it contains
a larger percentage of chloride, sulfate, and sodium and a smaller percentage
of bicarbonate than originally. Figure 10 shows diagrams which compare the
different waters. In the irrigated areas, the sodium content of ground waters
ranges from less than 10 to more than 60 percent of the dissolved cations and
sulfate-plus-chloride content ranges from 10 to 70 percent of the dissolved
anions. Where the ground water is not affected by recharge from irrigation,
the percentage of sodium, and of sulfate plus chloride is usually much less.
The NRTS discharges waste water underground in the area east of
Arco, Idaho, but the gross chemical effects are small compared with those of
26
100 100
0 0 0
100 100
FIGURE 10.--Comparison of qual of recharge water and ground water. Blocks enclose ranges of compositions in percentages.
of fl
Fal
lS
ed
ati
of
than
of
so ds
on s
of
ere as
The
of
,000
bodies of
s do
ls in the NRTS
area ranges from
caused
seem to move
ion
central
Plain have les
sd
the cultural area between American Falls and Twin
affected material the water,
the mineral content of ome such as
9 S, 8 fl is mos affe
that of ome further downstream,
solids content of the water seems
time, there a rel-
0 so the firs mas
late 800' 1900 1 but this cannot be
on chemi
were lected areas
e amples
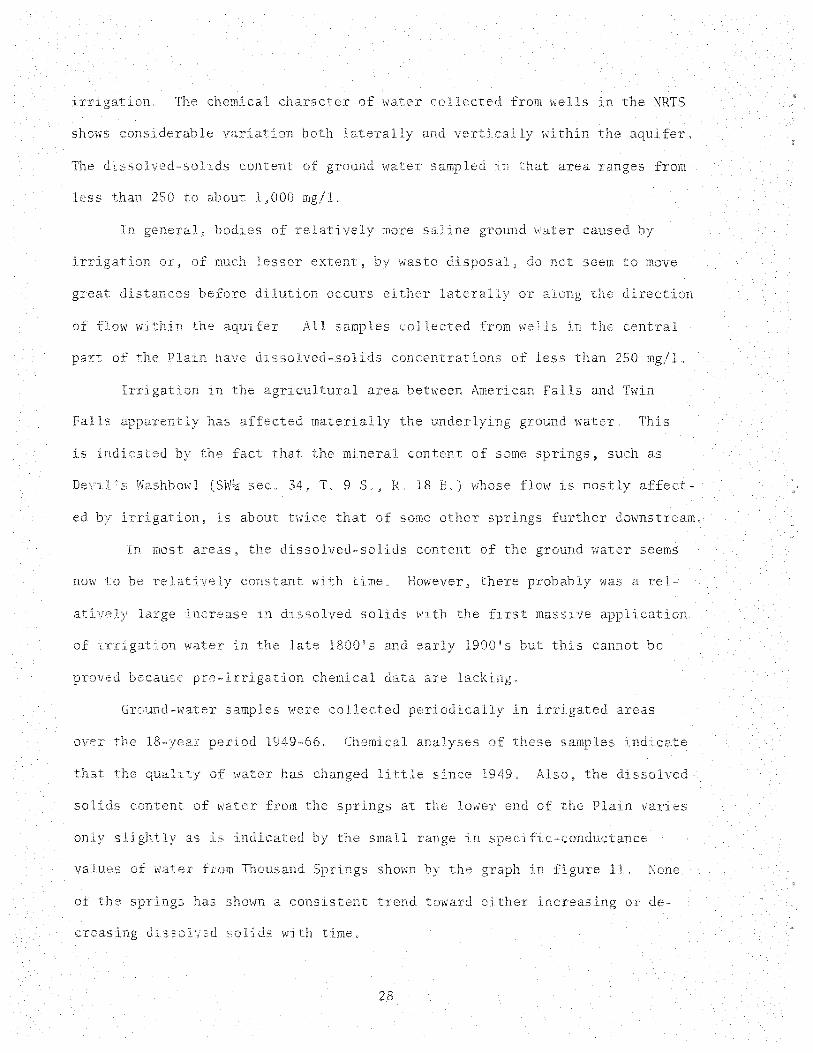
water has ittle 19 Als the dis lved-
from the lower end of Plain varies
indicat the small range in fi -conductance
gure 1 and
a consistent trend ther ing
28

N t..O
450
0 264 0
34
269c) 0
0 0 0
0 0
Numbers near circles are dissolved-solids content determined in the laboratory as residue on evaporation at 180 degrees Celsius.
0
400----~--~--~ .......... ~----,-----~--~------------~---~--~--....--------1949 1955 1960 1966
FIGURE 11 .. --Specific conductance of wate at Thousanc!. Springs (sec. 8, T. 8 S., R. 14 Em) near Wendell, Idah.
1 cient
its initiation the pres
of water fer sys ed
of the las 20 years
acreage could e
water a hazardous Of
the Snake
s
at actual
me
tems and the
3
fi b
chemical, and ol cal properti er that
artificial- program
cherni itat on
le fi of
in are discussed in the
ffect on artifi ain
aquifer, but they do warrant consideration.
Although a careful and comprehensive analysis of the effect of chemical
reactions between dissolved constituents in the surface water to be used for
artificial recharge and the native waters in the Snake Plain aquifer itself
was beyond the scope of this report, no serious problems are foreseen. It
seems that the recharge water most likely would be compatible with the ground
water in both irrigated and nonirrigated parts of the Plain. (See fig, 10.)
Even though some of the ground water in irrigated parts of the area contains
more sodium, sulfate, and chloride ions than the surface waters, a mixing of
the two probably would not cause significant chemical precipitation.
The approximate range in ground-water temperatures is from 10° to 16°
Celsius (50° to 60° Fahrenheit). Depending on the time of application, the
recharge water at the land surface may be as much as 15° Celsius (27° Fahr
enheit) cooler than the ground water. This temperature difference could
effect a resistance to mixing and thus cause density layering of water in the
aquifer, wherein the cold recharged water would tend to seek the lower levels.
The cold water also would be more viscous and thus slow down the process of
recharge.
Monitoring of the suspended-sediment content of the recharge water is
advisable, Ideally, water used for artificial recharge, especially for in
jection through wells, should be free of suspended sediment. Although the
openings in the basalt aquifer may be large enough to carry sediment away from
the recharge sites, accumulations of sediment eventually could reduce the
ability of the aquifer to accept recharge, as previously stated. For example,
a suspended-sediment load of 80 mg/1, the maximum observed concentration for
Henrys Fork at St. Anthony (p. 25), amounts to about 11,000 tons per 100,000
acre-feet of water. At places where the danger of clogging by sediment is
31
fo
Plain
be ab
The
bui d up
remains
goes
of an a
al re;;harge,
the of ection .,
to
to
ARTIF
be
of
the
de
1
of
could
ids of
becomes a
now are used,
water,
a
of
the Snake ver
lved in
ome areas
program
ong-range effects on the
IAL RECHARGE ON WATER LEVELS AND SPRING FLOW
from an ihcial program are de-
added fer the sub
and the th
re water
the added would
duration of the re However the
and water would
ca Pre di f the atter two
rmine the feasib 1 and desirabi l
Methods A11 lab
an aquifer to man made as art
it coefficient of and 1
32
and by internal and peripheral hydraulic boundaries. Mathematical methods of
analysis have been devised to enable prediction of some of the effects on
ground-water flow caused by man's activity (Ferris and others, 1962). Appli
cation of those methods discussed by Ferris requires idealization of aquifer
properties, including the necessity of regarding the aquifer as homogeneous
and isotropic. Where the permeability varies from place to place, the aquifer
is nonhomogeneous, and inasmuch as no aquifer is of infinite extent, boundary
conditions exist which must be described. Mathematical solutions by ordinary
methods under nonideal conditions are tedious, time consuming, and, for all
but the simplest determinations of total aquifer response, impractical to at
tempt.
An alternative tool available to the hydrologist for the analysis of
aquifers is the electric-analog model. The theory, instrumentation, and use
of analog models for analysis of ground-water flow systems are described
in many reports, among which are those by Skibitzke (1960), Patten (1965)
and an earlier, unpublished manuscript, written by H. E. Skibitzke and G. M.
Robinson in 1954, entitled "The use of numerical and electrical methods in
solution of ground-water flow problems." The theory of analog modeling is
based on an analogy between the flow of electricity and the flow of ground
water. The analogous elements in the two systems are as follows:
Electric system
Conductance--reciprocal
of resistance (ohms)
Capacitance (farads)
Voltage (volts)
Current (amperes)
Time (micro-seconds)
33
Ground-water system
Transmissibility (gallons per day per
foot)
Storage coefficient (percent)
Head (feet)
Volume rate of flow (acre-feet per year)
Time (days)
These analogous elements are scaled to be directly proportional to one
another and the physical limits of the electrical system are modeled propor
tionally to the physical limits of the aquifer. When the analogy is completed,
almost any stress combination (including pumping and recharging) may be pro
grammed into the model. The resultant responses, such as changes in water
levels or discharge, are read throughout the entire model.
Some of the advantages of an analog model as a hydrologic tool are as
follows:
1. An electric analog model can be used to analyze a complex nonhomo
geneous ground-water system.
2. The model can integrate large amounts of geologic and hydrologic
data into one system. Responses to either changing or continuous stresses
such as pumping or recharge, can be measured and recorded at selected places
throughout the entire system.
3. Because time in the model is in micro-seconds, predictive responses
that represent many years into the future or past can be recorded in less
than 1 second in the model.
4. When used as an experimental tool, resistors and capacitors rep
resenting values of transmissibility and storage, can be readily changed.
5. The model aids in pointing out places where field data are defi
cient or where further refinement of collected data is needed.
6. The model is readily adaptable to revisions or changes that may
need to be made as additional data are obtained.
7. Initial construction can be done in a relatively short time and at
a relatively low cost.
An electric-analog model was made of the Snake Plain aquifer so that
the effects on ground-water levels and spring flows caused by recharging the
34
aquifer at selected sites could be determined.
An early, somewhat simplified, electric-analog model of the Snake Plain
aquifer was made for an idealized analysis of the flow system by Skibitzke
and da Costa (1962). The simplified model was suited to the purposes of that
study but would not have been sophisticated enough to suit the purposes of
this study. As stated by the authors of that report (p. 49), "If all the data
available today (1962) had been used, a much more detailed model and analysis
could have been made."
Physical Conditions Affecting Ground-Water Flow
The Snake Plain aquifer comprises a series of basaltic lava flows which
include interflow beds composed of pyroclastic and sedimentary materials.
Ground-water movement is largely in and related to interflow zones, where per
meable openings may range in size from cavernous lava tubes to capillary
openings in sedimentary interbeds. Massive basalt, which makes up the central
part of each individual lava flow, has few if any interconnected pore spaces
and, therefore, is practically impermeable. The interflow zones are not com
pletely separated one from another, but are interconnected along vertical rock
joints or along fault zones, and at places where individual flows terminate.
Also, feeder dikes for the lava may extend up through large thicknesses of ba
salt, and may extend laterally for miles. Individual dikes may terminate
permeability channels in the flow rocks, or they may create additional permea
bility channels as a result of structural breakage attendant to their emplace
ment. Thus the ground-water flow system is anisotropic and nonhomogeneous, in
contrast to an ideal sand and gravel aquifer where the flow system can be con
sidered isotropic and homogeneous (permeability constant in all directions).
Anisotropy should result in disproportionate water-level responses
within the aquifer when external stresses, such as changes in recharge and
35

s arge, are applied. The disproportionate responses will tend to be maxi
mum in local parts of the aquifer over relatively short periods of time.
However, if the aquifer is viewed over many square miles, over long periods
of time, the effects of the anisotropy should tend to a minimum; and, all
p ract cal purposes, the aquifer should respond like an isotropic system.
fore, in constructing an analog model of the entire aquifer, as was done
for this study, a condition of isotropy was assumed.
The effects cauc;P,d nonhomogeneity (p. 33) are difficult to evaluate,
buts lification of analysis can be accomplished by assuming the aquifer
to be uniform in thickness, which largely may be the case. Hence, changes
in transmissibili ty reflect only changes in permeability. (See Ski bi tzke and
da Costa, 1962, p, 56.) Thus, the analog model, programmed with transmissibi1-
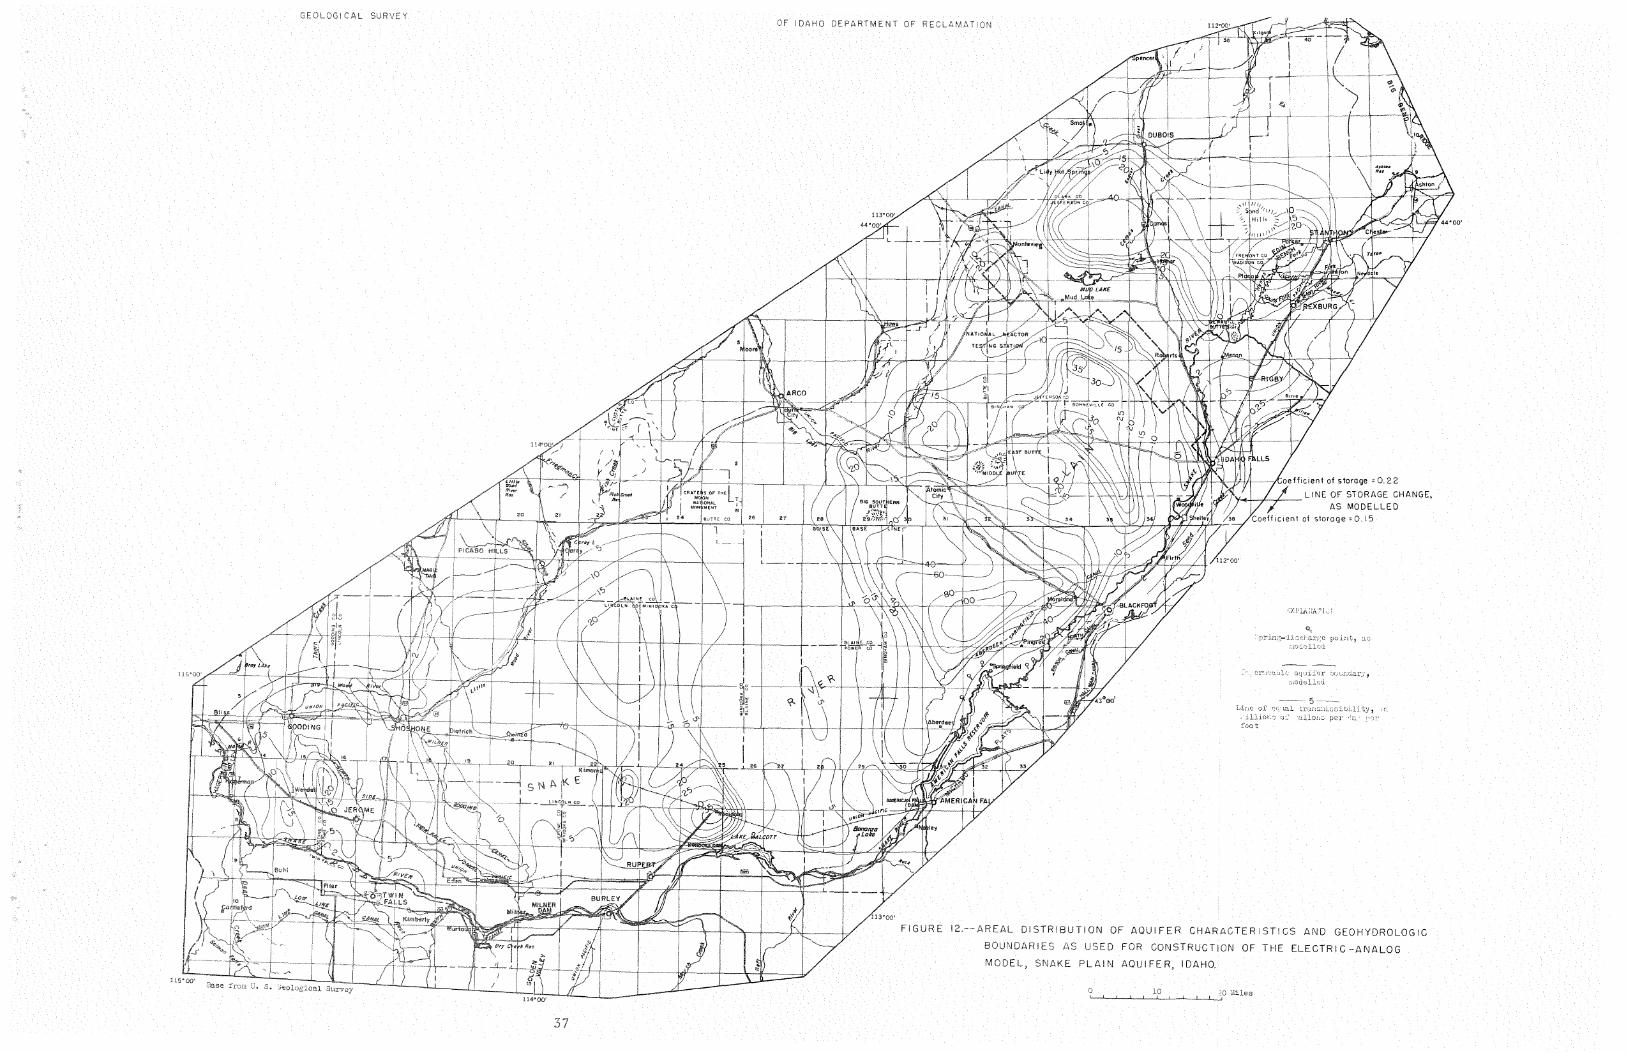
values (fig. 12), can account for the nonhomogeneity of the aquifer.
The rat of storage coefficient, S, to the transmissibility, T, ex-
ses the diffusivity of the aquifer, that is, the rate at which thee cts
either pumping or recharging will spread about the center of as
The storage coefficient is defined as the volume of water an aquifer re
leases from or takes into storage per unit surface area of the aquifer
unit in the component of head normal to that surface. The transmissi-
bili coefficient may be defined as the number of gallons of water, at the
1 temperature, that will pass in 1 day through a 1-foot wide verti-
cal st of an aquifer, extending the saturated thickness of the aquifer,
under a hydraulic gradient of 1 foot per foot. The smaller the ratio,
the more rapid the spread of effects; and, conversely, the larger the ratio,
the slower the spread. The transmissibility values used in this study are
shown in figure 12. They were computed from the flow net drawn by Mundorff
and others (1964; pl. 4), which is reintroduced in this report as figure 13.
36
CAL y OF IDAHO DEPARTMENT OF RECLt,MATlON
-1--+,.r-,e:11++-''l.-+l'+lt--,l'Loeff1c1ent of storage= 0. 22
LINE OF STORAGE CHANGE, -.,..,+-+----+-~- AS MODELLED
poJ.:-1t,
foot
FIGURE 12.--AREAL DISTRIBUTION OF AQUIFER CHARACTERISTICS AND GEOHYDROLOGIC
BOUNDARIES USED FOR CONSTRUCTION OF THE ELECTRIC-ANALOG
MODEL, SNAKE PLAIN AQUIFER, IDAHO.
:Jiles
37

practical application of flow-net analysis is given by Bennett and Meyer,
1952,) Originally, all the T values derived from the flow net were used in
the analog model, but upon testing, too much simulated water-level buildup
occurred in the northeastern part of the aquifer (model). Therefore, in order
to more closely match historical data, T values in a strip of the aquifer
between Roberts and Monteview were increased. Because a perched water body
is suspected to exist in the Mud Lake region, it was reasoned that possible
error may have been introduced in the original flow net for that part of
the aquifer" Furthermore, it was reasoned that the regional water table in
that part of the aquifer south of Mud Lake may extend beneath the suspected
perched water body and merge with the water table in the upper Mud Lake
Henrys Fork region, thus giving rise to assumption 11 on page 43. The truth
of that assumption is contingent upon additional hydrologic field study.
The need for additional study was exemplified by a well (NE~ NW~ sec. 2,
T, 5 N., R. 36 E.) drilled by the U. S. Bureau of Reclamation in 1968 in the
vicinity between the two parts of the aquifer referred to above. The well
was drilled to a depth of 995 feet and penetrated basalt, cinders, and sedi
ments, finally ending in clay at 990-995 feet. Three differing hydraulic
pressure heads were obtained from different depths in the well. The pressure
head in the depth interval between about 410 to 850 feet was above land sur
face, Thus, the aquifer interconnection in this part of the Plain is known
to be very complex.
The values of the storage coefficient of the aquifer, shown on figure 12,
were selected on the basis of results from pumping tests, laboratory determin
ations of porosity of basalts of the Snake River group, and results obtained
from verifying the model. The values of S obtained during most of the pumping
tests made in the aquifer were indicative of water-table conditions. (See
39
Ferris and others, 1962, p. 74-78.) However, some tests showed that artesian
conditions also exist in places. Data were not available for describing an
areal distribution of values for Sas was done for values of T. For this
reason it was necessary to use average values covering extremely wide areas
of the aquifer. As shown by the diffusivity ratio, the values of Swill have
a decided effect upon what the water-level responses will be in different
parts of the aquifer, at different periods of time.
Because the aquifer is largely a water-table aquifer, the value of S
is essentially equal to the specific yield, that is, the volume of water in
volved in the gravity drainage or refilling of the aquifer, divided by the
volume of the zone through which the water table moves. Thus the S value also
has an effect on the magnitude of response due to recharge. Therefore, when
recharged with equal volumes of water, a part of the aquifer having a large
S value will show a lesser water-level rise than a part having a smaller S
value.
In addition to the inhomogeneities within the main aquifer, the situ
ation is complicated further by perched or semiperched water bodies which
overlie the main aquifer. Probable perched-water bodies of poorly defined
areal and vertical extent occur in the vicinities of Mud and Market Lakes, as
inferred previously, Egin Bench, American Falls Reservoir, and in the Rupert
Burley and Bonanza Lake areas. The downward rate of percolation from the
perched or semiperched water bodies to the main aquifer is unknown. The same
factors are unknown where the Snake River is perched above the main aquifer.
If the hydraulic characteristics of the perched-water bodies and their hy
draulic connection with the main aquifer were known, it would be possible to
build a multi-layered model showing vertical flow between the different
aquifer units. However, because of the above unknowns, it was necessary to
40

make the assumptions listed as 8 and 10 in the following section of this
report. Also, the interconnection between flow zones within the main aquifer
that are separated by massive rock layers in the vertical direction are un
known, and assumption 3 necessarily was formulated.
Hydrologic boundaries are an important factor in the analysis of any
system of flow. The delineation and significance of the hydrologic boundaries
of the Snake Plain aquifer are described in some detail by Mundorf£ and others
(1964, p. 193-194), and their mapping of the boundaries is shown in figure 13
of this study. As stated in that report, the real boundaries are approximated
as straight-line segments most suitable for the analysis desired. In this
study, where an electric-analog model was made, adherence to the real shape
of the boundaries adds no hardship to the analyses. Therefore, the peripheral
boundaries of the aquifer, as shown in figure 12, conform more closely to
the actual extent of the aquifer than do those boundaries shown on figure 13.
Where the aquifer terminates at its contact with rocks in the surrounding
uplands, the boundaries are mapped as negative or impermeable as defined by
Mundorf£. That is, when pumping or recharging the main aquifer, no addition
al drawdown or build-up of water levels will occur beyond those boundaries;
and any responses within the main aquifer will be reflected, hence, intensi
fied, at those boundaries. Where the water flows out of springs in the
Blackfoot-American Falls and Milner-King Hill areas, the boundaries are map
ped as positive or discharge boundaries. That is, when pumping or recharging
the main aquifer, the flow at the positive boundaries will be altered such
that no additional drawdown or build up of water levels will occur within the
main aquifer at those boundaries. For the purpose of this study, the Snake
River conveniently was taken as the southern boundary of the aquifer. The ex
tent of the aquifer on the south side of the river is somewhat nebulous and
41
its inclusion would add little, if any, to the final results of this study.
The stretch of the river between the center of American Falls Reservoir and
Milner Dam, that is shown as a positive boundary on figure 13, was mapped as
an impermeable boundary for this study. Flow from the springs along parts of
that stretch is minor (p. 20) and the interrelation between spring flow, the
perched-water bodies, and the Snake Plain aquifer is not known in that area.
Also, the boundaries shown on figure 13 to lie within the limits of the
aquifer in the northeast part of the Plain are excluded from the analog model
made for this work, largely because the hydraulic connection between the
perched-water bodies and the main aquifer is not known.
It is virtually impossible to describe in detail the complexities of
the hydrologic system underlying the Snake River Plain. Enough data were
available, however, to build a workable analog model of the Snake Plain
aquifer. This model can predict water-level responses to artificial recharge
or ground-water withdrawal which are generalized in areal extent and are
within a reasonable range of accuracy. However, for lack of better defini
tion of the hydrology of the aquifer, deviations from the model predictions
must be expected.
Analog Model Construction and Use
The analysis of the hydrologic system of the Snake Plain aquifer and
the construction and use of the electric-analog model are based on the follow
ing assumptions and conditions:
1. The aquifer is essentially a water-table (unconfined) aquifer.
2. The aquifer reacts regionally as a nonhomogeneous and isotropic
system.
3. Ground-water flow within the aquifer is laminar (as opposed to
turbulent) and two dimensional.
42
4. The aquifer is of uniform thickness.
5. Coefficients of transmissibility (fig. 12) derived from the flow
net analysis represent the entire thickness of the aquifer and do not change
with time.
6. The storage coefficient of the aquifer averages 0.15 and 0.22 with
in the areas shown in figure 12.
7. The only significant natural discharge from the aquifer occurs as
springflow between the mouth of the Blackfoot River and American Falls Res
ervoir and between Twin Falls and Bliss.
8. The Snake River recharges the aquifer in those stretches along which
springs do not occur, but the percolation to the regional water table occurs
as unsaturated flow.
9. The volume difference between gross pumpage and consumptively used
pumpage in the ground-water irrigated areas returns as recharge to the aquifer
at the same time as pumping occurs.
10. Recharge to the perched-water bodies as a result of surface-water
irrigation is transmitted to the main aquifer as an equal volume of recharge
during a single irrigation season.
11. The regional water table in the main aquifer is below a perched wa
ter table in the Mud Lake area and the two gradually merge north of Mud Lake.
12. Artificial recharge has zero transit time while moving from the re
charge point, through the unsaturated zone, to the water table. Thus any
simulation of artificial recharge in the model represents a direct addition
of water into the main aquifer.
13. Natural recharge to and discharge from the aquifer remain constant
tin time and thus can be eliminated from the analysis of the system. (See
Skibitzke, 1960.)
43
The
e
al
springs were modeled
out of
of a
are
flow
network of res tors that are inverse
and of
are
mode ed as
out f the mode 1
upon
whose values
at those places
this
Ori
le)
The
and current
fore in order to mat
, too much
the actual
the eastern
flowed
flow more
reason ab additional resistors were added between the network and the
Current
to an upper
The current
from the eastern
the use of the res
flow at the
in model was restricted
, the ial leve
w thin the mode and the addition or reduction of current (water)
th
ated
Ii
Snak
of an
the
was made t
such as
irri
was in
caused the or withdrawal of current
are measured lectrical and recorded
then can be trans-cillos The lloscope
values
Validation of Model
f the analog mode would
fer to pro
mode
art
Thi
al
done
ground-water levels and
to and dis
and water levels) in the
the
us
the same manner
activities, an at
historical data
flow to known events
fer resulting from
ion 13 no natural recharge or dis
1dat
44
Prior to irrigation, the hydrologic system of the Snake River Plain was
in a state of equilibrium. That is, long-term average recharge to the aquifer
equalled discharge and ground-water levels everywhere in the aquifer were
effectively constant. However, with the advent of irrigation by surface
water in the late 1800's and early 1900's, recharge to the aquifer increased.
As a result, ground-water levels rose, and discharge from the springs between
Milner and King Hill increased (fig. 8), indicating that the aquifer was in a
state of nonequilibrium. From about the late 1940's until the mid-1950's,
discharge from the springs was again stable, indicating that new equilibrium
conditions were attained. However, beginning in about 1954, the increasing
use of ground water for irrigation lowered water levels in the aquifer. (See
fig 4,) As a result, spring discharge began to decline and nonequilibrium
conditions again prevailed. Historical data describing the changes in recharge
due to surface-water irrigation, and in discharge resulting from increased
ground-water use, were programmed into the analog model.
Comparison of the water-level changes produced in the model with the
water-level changes actually observed in the aquifer provided a basis for de
termining the validity of the model. Although complete verification of the
model was not obtained, reasonable comparisons between actual and model-pro
duced water-level changes were derived for that part of the aquifer westward
from Lake Walcott. Eastward from Lake Walcott, where historical water-level
data and data descriptive of the hydrology of the aquifer are grossly lacking,
verification has not yet been attained.
Using the Model
The following hypothetical-recharge program was set up to test the
versatility of the model and its practical use. Four areas on the Plain were
selected as places for recharge (fig. 14). The sites are located up gradient
45
from areas of present or future development of ground-water and
distant from areas of natural discharge from the aquifer. Also, they are
places where it may be possible to convey water by gravity flow. It is postu
lated in the program below that artificial recharge can be applied to the
aquifer at these places. No inference is intended here as to the most practi
cal rate or means of artificial recharge used at each particular place Such
determinations will require further field studies.
Recharge was simulated simultaneously in each of the four areas at a
rate of about 62,000 acre-feet of water per month for 3 consecutive
then, no water was added for 21 months. This cycle was repeated for four more
like periods. This amounted to a total recharge of about 740,000 acre-feet
for each biennium or a grand total of 3.7 million acre-feet in the
test period. Water-level rises were recorded at the end of the fi
Rises in water levels resulting from the hypothetical recharge
contoured in figure 14. Also shown on figure 14 are water-level
at different places in the aquifer, throughout the entire 10-year
-year
biennium.
are
program, and the cumulative increases in spring flows resulting the
artificial recharge.
As a result of the above conditions of hypothetical recharge,
level rises ranging from less than 1 to more than 5 feet are indi
aquifer,, The rise of more than 5 feet occurs close to the area of
combined recharge northeast of Blackfoot near an impermeable b
for the
t
and in
a zone of low transmissibility. The water-level rises at the end of the 10
years, as shown by the contours, do not center around the recharge areas be
cause the contours are drawn on readings taken 21 months after comp on of
the last recharge cycle; and, therefore, the recharged water has had time to
migrate. The expected periodic peaks and declines of the ground-wa"rer mounds
46

..
GEOLOGICAL SURVEY
) -<DC>nih recharge period
//
21-month inact1.ve period
Ropeat cycleo .I
Sprin£;- di3cha.rge i;raph, analog simulation; :'o r e:xanpl e (+) , t he increased !Jprin flow r, r:.ul. t 1.ni; :'r or.: t he hypothetical rechar :c ro ra.:: c. t t !'.e end of B y ears would t,e
J , t 150 , 0:x> o.c:-c-feet
- 2-Ll..nc o! <JqWll ...:.:. t er-level r i se,
i.n ! eet , af ter 10 yeo.r pro~~ Jcli c r e c' lB.rc;e
Em Arcu o; lJPO t:ieti cc.l rcc!'•.ari;e i circles
rcur e :ic!!t poi.>1"t ( r well ' c ~ 1-'1put
0 ioc~'tlon po i ut of !:i in:.tla.teci i,ydrocraph
,,,. 3prll!o- O- .Jc:ur e poi11t , n?; :-,odcll od
_;;-;pcr::ic!!.blc Ut!...e - er b1u."ld.ary I a s r.mciellecl
01.e : ,a:!. ured1ct_ve U.at.:i. 0 '1ovm hcrei!J o.:-c "'O:.t L ::,;c:11: 0:1 ~·1e y t.l rolo.:::;: i c ar:.su. · ption::i ~.nd <no l ir..i t o tiom, of l!l.Odel va lidc. tion I .1. ~cu::;•~c·d in tc:-: t ..
•• ..
47
OF IOAHO DEPAR TMEN T OF RE CLAMA ION
" .. 101~ [
EASTERN SPR I NGS, CUMULATIVE I NCREA SE
t N S I MUL A TE O FLO W
14 - - GENERA LI ZED WATER-LEVEL RISES AND RELATED EFFECTS RESULTING FROM
HYPOTHET I CAL ARTIFICIAL RECHARGE OF THE SNAKE PLAIN AQUIFER,
IOAHO, AS DETERMINED BY ANALOG MODEL ANALYSIS.
0 10 20 ..:ilea
are evident on the water-level hydrographs. The rate of rise, magnitude, and
dissipation of the mounds, at selected places, can be obtained from the hydro
graphs, For example, at the hydrograph site 1~ miles southeast of Shelley
(fig 14), the simulated water-level rise was about 4.4 feet during the ini
tial 3-month recharge period, or the wateT level rose at a rate of about
1 1 feet per month. At the end of 5 months, 2 months after cessation of re
charge, the water-level rise peaked at about 5.8 feet. At the end of 1 year,
the water level receded 2,3 feet to a residual rise of 3.5 feet. At the end
of 2 years, the water level dropped an additional 1.5 feet to a residual rise
of 2 feet, The same calculations can be made for the remaining four periods
of hypothetical recharge. Thus, the model can be used to evaluate the ef
fects of recharge in any direction or at any distance from an area of recharge,
through use of the hydrographs. Magnitudes of water-level rise taken from
the hydrographs were measured to the nearest tenth of a foot for this example
only, It must be remembered that the analog readouts are approximations and
cannot simulate water-level rises that may occur in the aquifer to that de
gree of accuracy.
The analog-model readouts indicated that if 3.7 million acre-feet of
water were artificially recharged in the manner described, about 3.3 million
acre-feet (88 percent) would go into storage in the aquifer and about 0.4
million acre-feet (12 percent) would be added to the flow out of the springs.
The model has no built-in water-table gradient and the resultant rises
in water levels and the increases in spring flow presented are wholly due to
the effects of the artificial recharge as programmed. However, in actual
practice, there will be a water-table gradient that would have some unknown
effect upon the shape and the dispersion of the recharge responses. Also, in
actual practice, the water-level changes due to artificial recharge would be
49
superimposed on existing man made and natural hydrologic stresses. Because
the annual increments of the artificially induced rise are small, they prob
ably would not be noticeable among the seasonal fluctuations of water levels,
except, perhaps, in areas close to recharge sites.
Deficiencies of Data and Need for Future Studies
The greatest determinant of accuracy in the responses obtained using
the analog model is the reliability of the data used to describe the hydro
logic system. At the very outset of this work it was recognized that only
approximate descriptions of the pertinent elements in the system were obtain
able. The following are some of the weaknesses and deficiencies in data that
suggest needs for further study:
1. The hydraulic relations between the regional water table and the
perched-table bodies (p. 40) are unknown, and their areal and vertical ex
tents have not been mapped.
2. A true distribution of values for the coefficient of storage
throughout the aquifer is not available and may be unobtainable. Consider
ing that the coefficient of storage for a cavernous lava tube may be 100
percent, very high in vesicular cindery interbeds, and practically nil in mas
sive basalt, it is difficult to estimate actual storage coefficients for the
entire aquifer.
3. The thickness of the aquifer is unknown.
4. The flow net used to estimate coefficients of transmissibility
lacks control for definition of water-table contours around the outer edges
and in the west-north-central and extreme northeastern parts of the aquifer.
Therefore the transmissibility values are difficult to estimate in those
places. Also the spatial distribution and number of flow lines in the net
necessarily were based largely on gross estimates of recharge.
so

5. The actual diffusion of pressure responses through the aquifer is
unknown. It has been suggested that massive recharge creates pressure waves
that cause water-level rises throughout the aquifer faster than would be ex
pected under water-table conditions. (Barraclough and others, 1965, p. 67.)
Only responses that are governed by water-table conditions will occur in the
model made for this study.
6. A comprehensive pre-irrigation water-table map for use in validating
the model is unavailable.
7. Pre-irrigation spring-flow records are unavailable.
8. More firm values for recharge to the aquifer from ground- and sur
face-water irrigation are needed to replace the estimates made in this study.
9. Data are not available to estimate and distribute total recharge
to the aquifer from natural sources on an annual basis.
10. The electric-analog response is based on the assumption of an iso
tropic aquifer. But field data indicate that for conditions where recharge or
discharge are applied to the upper boundary (water table), the aquifer will be
anisotropic. Transmissibilities obtained from flow-net analysis (p. 39) may
not be realized in the vicinity of recharge owing to the relatively low verti
cal permeability of stratified flows. Therefore, the model shows water-level
changes that are the minimum that actually would occur in the field in the
vicinity of points of artificial recharge, unless the recharge was applied
in a well that penetrated the entire saturated thickness of the aquifer.
Considering the great extent and the complex nature of the Snake Plain
aquifer, the responses obtained from the analog model are believed to be
reasonable despite the assumptions and the deficiencies in data.
Items 6 and 7 above emphasize the lack of historical data which are
needed for full validation of any model, but which are unobtainable. Items 1
51
and 4 above indicate elements needed for refinement of the model but which
probably are obtainable. The usefulness of the model would be enhanced con
siderably if the elements of items 1 and 4 were described in greater detail.
These descriptions will require test drilling in areas of perched-water bodies
in order to delineate their areal and vertical extents and to test their hy
draulic properties. The test holes also would enable differentiation of the
perched-water tables and the regional water table in the model. Additional
test holes are needed in remote parts of the Plain where the altitude of the
regional water table is unknown. Acquisition of those water-table data would
enable the drawing of a more detailed water-table map of the Snake Plain
aquifer. Re-evaluation of the areal distribution of recharge to the aquifer
coupled with a more detailed water-table map would enable the of
a more refined flow net. The refined flow net, in turn, would enable the
derivation of more accurate coefficients of transmissibility to be
buted throughout the aquifer and to be used to refine the
model.
Items 2 and 5 above are prime elements for study that can b
additional research. These two elements might best be studied s
fit from
from the overall appraisal of artificial recharge to the Snake Plain fer
so that research aspects can be stressed. The results obtained then can be
used in the overall appraisal.
It should be recognized that a precise model of the Snake Plain aquifer
can never be built. Predictions of future water-level changes obtained from
any model always will be subject to some range of probability and wi 1 require
some degree of interpretation. This is because of the complexities of the
hydrologic system, including the huge size and the great variabil of the
aquifer, and the variations in recharge, storage, movement, and discharge of
52
ground water through the aquifer. However, in its present state of develop
ment, the Snake Plain analog model is a useful hydrologic tool. Without a
model, water managers would be required to use largely qualitative methods
to estimate the effect of artificial recharge on water levels. Although it
was not possible to fully validate the present model, the model is the best
scientific tool available at this time.
What may be considered the first phase of study, this and Mundorff's
(1962) studies, has shown that artificial recharge of the Snake Plain aquifer
is probably feasible. This study, in particular, gives the frequency of
occurrence and volumes of surplus water that may be available. It also points
out the general magnitude of water-level rises that may be expected if a given
amount of water is recharged. Mundorff's study (1962) discussed a number of
places on the Plain where water might be recharged either by water spreading
or through recharge wells.
The analog model, in its present stage of development, is a valuable
aid for use in what could be called a second phase of study preparatory to
actual artificial recharge of the Snake Plain aquifer. As a part of the
second phase of study, proposed recharge sites could be selected and examined
in some detail, geologically and hydrologically, before they are used. Also
the means of conveyance of surplus water to the selected recharge sites must
be studied, The model can be used to approximate the effects upon the water
table caused by deep percolation losses along the conveyance system and by
recharge at each individual site, under any pattern of suggested operation.
If water spreading is to be the means of artificial recharge, it will
be necessary to work out the subsurface geology at each recharge site, Un
doubtedly, there are places on the Plain where the surfacial lava has a great
enough infiltration capacity to accept the large volumes of water that may be
53
lable for However, if an impermeable bed or 1 of low per-
meabili ty occurs in the subsurface above the regional water table there is
a tinct possibility that the recharge water could move lateral towards
low-altitude farm lands around the edges of, and within, the elevated lava
fields. If this condition was not recognized, water logging or even flood
of farm lands could occur. An injection well is probably the only posi
tive means of assurance that the recharge water will go directly into the
main fer. At al ential recharge sites, drilling of test holes to
the regional water table is the best means by which to s
subsurface geology and determine the local hydrology. These holes
converted to recharge wells.
additional logic data gained during as e of s
could be used to refine the ent analog model. Also, any
the
be
in
future individual areas studied on the Plain be used in the model; and
converse , the model may be used as a guide to select areas for future
studies.
A
ceive a
e in the artificial
it into actual
studies then would be to can
on, and monitor the
effects.
SUMMARY AND CONCLUSIONS
the end of the 1965 irrigation season, an estimated
acres was irrigated within the area of this study--910,000 acres
510 000
surface-
water diversions and 600,000 acres by ground-water pumping. An estimated
6 percent (52,000 acres) of the area irrigated by surface-water diversions
is supplementally irrigated with ground water pumped from wells.
2. During the decade 1956-65, an estimated average total annual diver
sion of 6.6 million acre-feet of surface water was distributed to the heads
54

of the main irrigation canals. Of this total, about 4 million acre-feet of
water or 60 percent seeped into the ground and recharged the Snake Plain
aquifer.
3. In 1965, an estimated 2.1 million acre-feet of water was pumped from
wells for irrigation. Of this total, about 1.1 million acre-feet or 52 per
cent of the pumped water seeped back into the ground to recharge the Snake
Plain aquifer.
4, The major sources of water for artificial recharge to the Snake
Plain aquifer are the Snake River upstream from Milner Dam, and Henrys Fork.
The key point in the system is Milner Dam; any excess streamflow past this
point might have been diverted upstream for artificial recharge. On the basis
of a recurrence interval determination of annual mean discharge of Snake River
at Milner, an annual mean discharge of about 1.3 million acre-feet or more
occurs, on the average, once every 2 years. This indicates a 50 percent sta
tistical probability that the same discharge may be equalled or exceeded in
any 1 year. Actual flow patterns are controlled largely by reservoir storages
and releases and do not closely follow the statistical patterns.
5. Natural ground-water discharge from the Snake Plain aquifer occurs
almost wholly from two groups of springs along the Snake River. The eastern
most group of springs accounts for about 1.8 million acre-feet per year
(1954-65 average). The westernmost group accounts for about 4.7 million acre
feet per year.
6. The chemical quality of surface and ground water in the Snake River
Plain is suitable for most uses. There probably will be no chemical-quality
problems involved in large-scale artificial recharge. Artificial recharge
could improve the chemical quality of water in some areas by lowering the dis
solved-solids concentration of the ground water.
55
be
a the
enn
0 4
t
of
REFERENCES
Barraclough, J. T., Teasdale, W. E., and Jensen, R. G., 1967, Hydrology
of the National Reactor Testing Station, Idaho, annual progress
report, 1965: U. S. Geol. Survey open-file rept., 107 p.
Bennett, R. R., and Meyer, R. R., 1952, Geology and ground-water resources
of the Baltimore area: Maryland Dept. Geology, Mines and Water
Resources Bull. 4, 573 p.
Ferris, J. G., Knowles, D. B., Brown, R.H., and Stallman, R. W., 1962, Theory
of aquifer tests: U. S. Geol. Survey Water-Supply Paper 1536-E, 174 p.
Fishel, V. C., 1942, Discharging apparatus in Wenzel, L. K., Methods for
determining permeability of water-bearing materials: U. S. Geol.
Survey Water-Supply Paper 887, p. 56-65.
Hem, J. D., 1959, Study and interpretation of the chemical characteristics
of natural water: U. S. Geol. Survey Water-Supply Paper 1473, 269 p.
Hoyt, W, G., 1935, Water utilization in the Snake River Basin: U.S. Geol.
Survey Water-Supply Paper 657, 379 p.
Jensen, M. C., and Criddle, W.D., 1952, Estimated irrigation requirements
for Idaho: Idaho Univ. Agr. Expt. Sta. Bull. 291, 23 p.
Laird, L. B., 1964, Chemical quality of the surface waters of the Snake
River Basin: U. S. Geol. Survey Prof. Paper 417-D, 47 p.
McConnell, J. B., 1967, Chemical quality investigations of surface water in
Idaho, 1965-66: U. S. Geol. Survey open-file report, 25 p.
Mundorf£, M. J., 1962, Feasibility of artificial recharge in the Snake River
Basin, Idaho: U.S. Geol. Survey open-file rept., 49 p.
Mundorf£, M. J., Crosthwaite, E. G., and Kilburn, Chabot, 1964, Ground water
for irrigation in the Snake River Basin in Idaho: U. S. Geol. Survey
Water-Supply Paper 1654, 224. p.
57
Patten, E. P , Jr, 965 Des gn,
s in Wood L
water in the Houston di
p, 4 -,60,
e of
model of
Texas: , Bull, 6508,
Price, C, E, 1961 Artifi re a we alt
Walla Walla
1594 3,3 p
Price, Don, Hart, D. H
Oregon and
L594-C, 65 p.
and . ,
1962: U S
Rainwater, F H,
U. S, Geo
, Stream compos of the
Inv. Atlas HA-6
Russell, L C. • 1902 Geo and water re:;,ources
of Idaho: u. S, Geol Bull 199, 19
Simons, w D 1953, on and s reamfl
Basin u. s Geo
12 0 p
Skibitzke H, E. 1 1960, E
lems · 12th Gen emb
Skibtizke, H E
the Snake
and
vey
Sniegocki, R. T , 1
Grand Prairi
1615-E, 4 p,
Finland, 25 -
a J 196 , The
Idaho--an
1536-D 6 p
Geochemical of
Arkansas: U S, Geo
58
65, Arti ci re in
-Water
United States:
of the Snake River Plains
p,
let ion in lumbia
aid to
Union of
fl tern in
sis: U S. Geo . Sur-
ficial in the

~~-
REFERENCES (Cont'd.)
1963b, Problems in artificial recharge through wells in the Grand Prairie
Region, Arkansas: U. S. Geol. Survey Water-Supply Paper 1615-F, 25 p.
1964, Hydrogeology of a part of the Grand Prairie Region, Arkansas: U. S.
Geol. Survey Water-Supply Paper 1615-B, 72 p.
Sniegocki, R. T., Bayley 3d, F. H., and Engler, Kyle, 1963, Equipment and
controls used in studies of artificial recharge in the Grand Prairie
Region, Arkansas: U. S. Geol. Survey Water-Supply Paper 1615-C, 39 p.
Sniegocki, R. T., Bayley 3d, F. H., Engler, Kyle, and Stephens, J. W., 1965,
Testing procedures and results of studies of artificial recharge in the
Grand Prairie Region, Arkansas: U. S. Geol. Survey Water-Supply Paper
1615-G, 56 p.
Sniegocki, R. T., and Reed, J. E., 1963, Principles of siphons with respect
to the artificial-recharge studies in the Grand Prairie Region, Arkansas:
U. S. Geol. Survey Water-Supply Paper 1615-D, 19 p.
Stearns, H. T., Crandall, Lynn, and Steward, W. G., 1938, Geology and ground
water resources of the Snake River Plain in southeastern Idaho: U. S.
Geol. Survey Water-Supply Paper 774, 268 p.
59
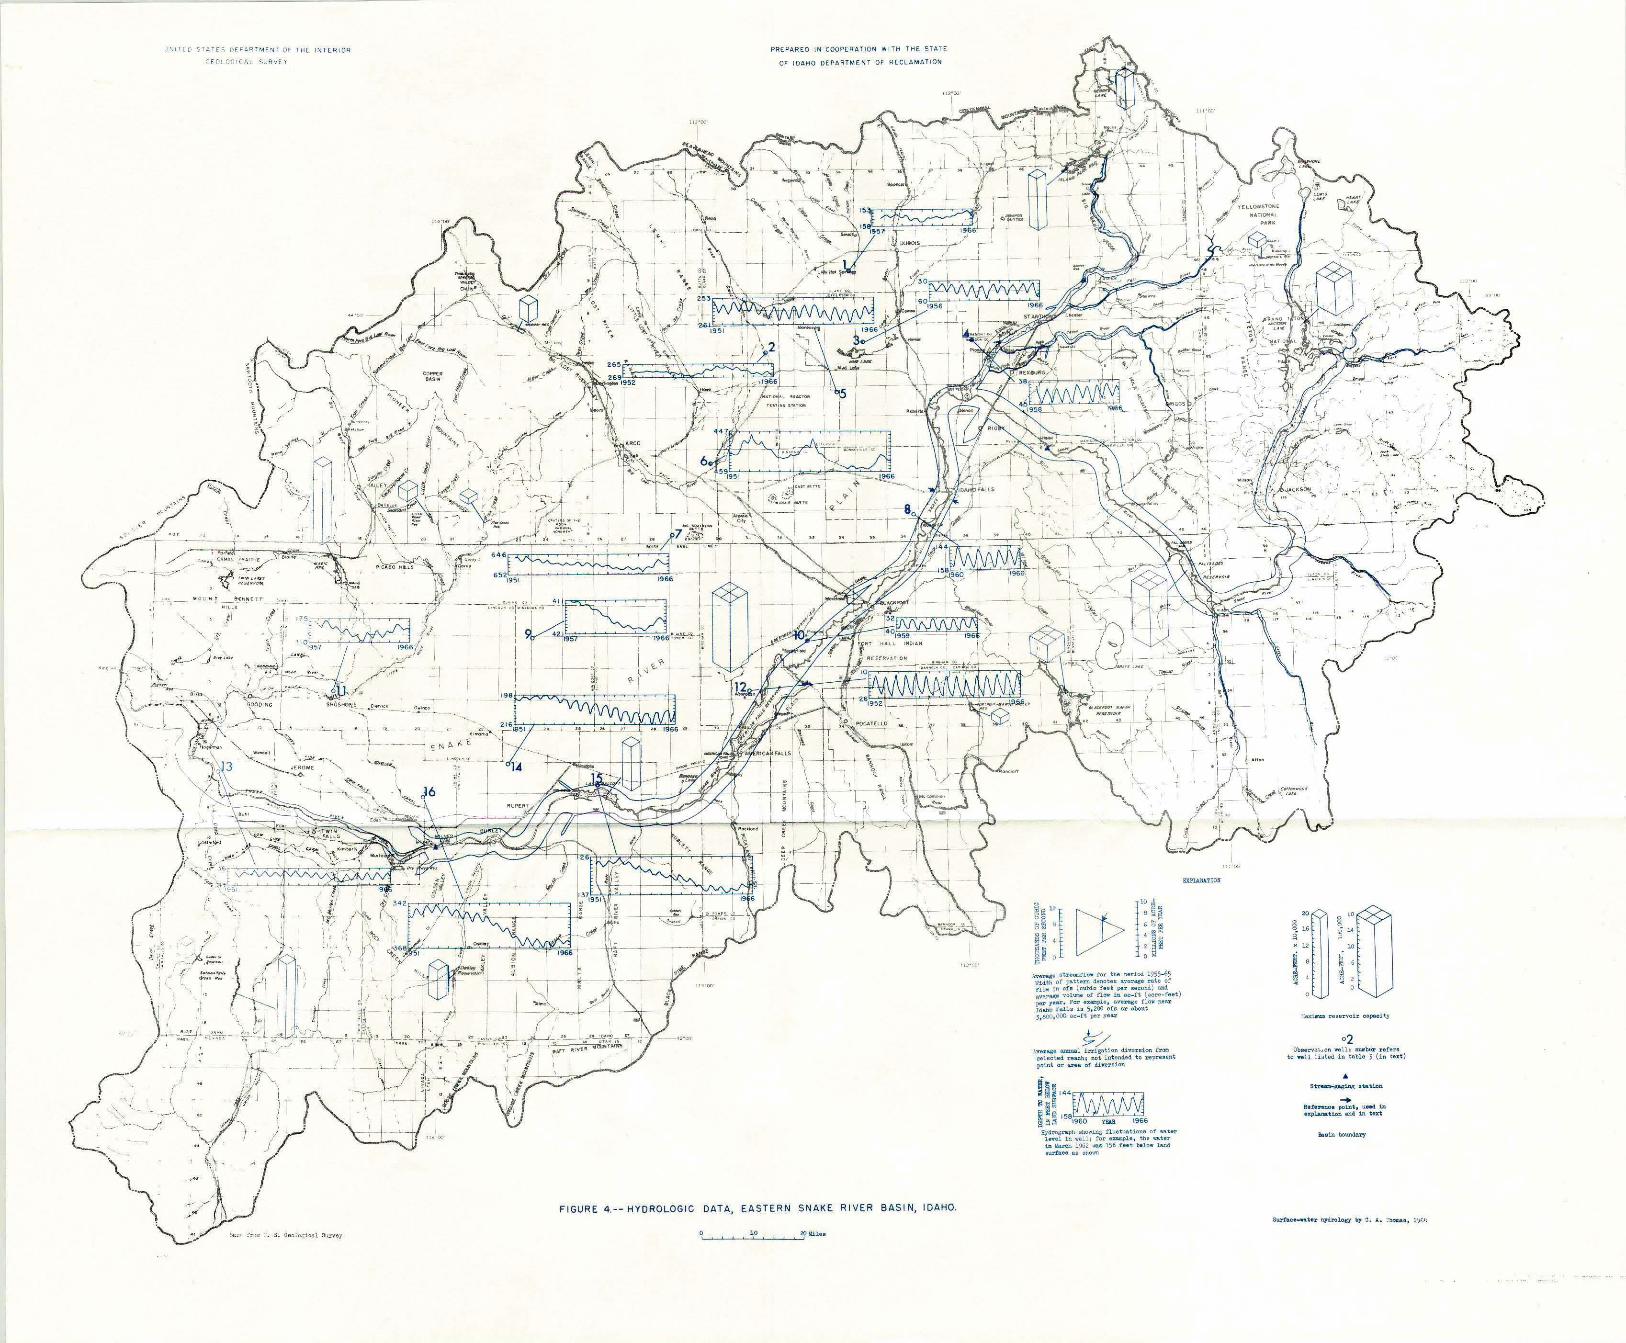
U~tf f D 'STA ,. TE c; Of PA~TME.N T OF o EOLCGI CAL SUR VEY THE PH E.R !OR
PREPARED l N COOPERAT ION OF IDAHO OEPARTM E WITH THE STATE
NT OF REC LAMATI ON
11.' "1'1'!
FIGUR E 4.- - HYOROLOGIC DATA, EASTERN SNAKE RIVER BASIN, IDAHO.
· , S. (}eo::..odcel • , Survey
!! :1 [J> 11
: !: gj !: 4 !:! ,.
i ~ 0 : ~~ A-ver-,:e s treamf'l o Wi dth of pat t • for the -oe r i no, Jn cfa (°:;;: d,no toa .~. od 1955-65
avertld"' vol \U!I~ /o feet pel:' : : : r a1t o of per 1•""• For • r now i n "" f t od Md I doho , a11s i xaoplo, av~ ( acr, -faet )
; ,aoo, POO .,,_;,5~~Y~: or . ~~
0
• n,ar
Avara,l0 """"8 ¥/ £el ected 1 irri gation div point or ::•h; not intcnde/~sion hoe a of dinreion ° repruent
@il tl !IS ij 14 4
i!~l58~ Hydrograph h 'l?.Ul 1966 in.i i n .:-~~11.1\5 rluctuatio ::-" 1902·.!:\;~l•, ~~,°;.,;:;•r
ee e.e s hown e et be low land
: _-·iJ
EXPLAlll'l'lON
t:&XillrwD re9ervoi r capacity
& • in boW\dary

.... p • • • ~
:,· ·,,,
h' , I 1
;"'N.!I! : · • s. G-eo:.og i c&l S urv,y
FIGU-E 9 -- CH EM CAL DATA OF SURFACE -AND GROUND-WATEq RESOURCES,
•. T ~J :, H
/\•-' ,.,
:ha.sl..ll bow1.dar:,•
EASTERN SNAKE
Cnwn.c&.1 co:npile.tion c.y ;i . . ~-'•dl . . :. , ,, , '
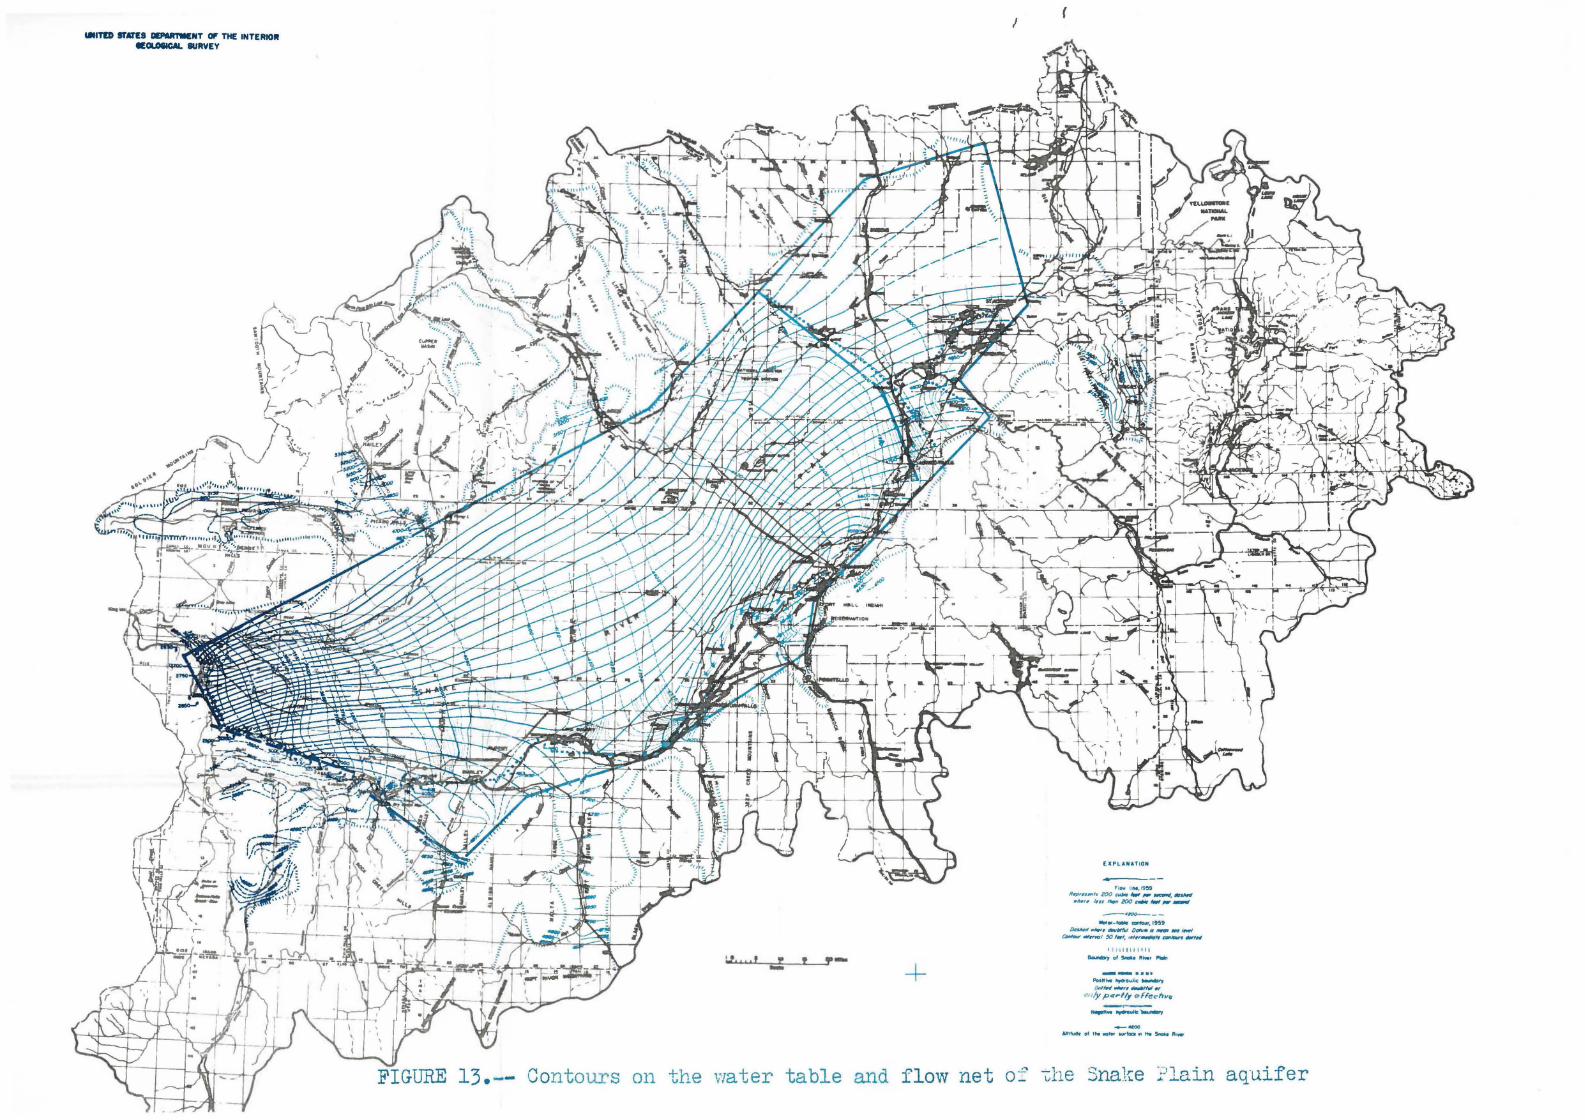
lalTID sran:s lm'lllt'l'NNT OF THE INTEAIOII .OI.OIICAL SURVEY
I
:...·~·~·~,u·u'~~ ... :,,!'r'--~ 'L..~.3·-- +
(
[lCf'LANATIOH
Fl- l M ,!9~ /lr,prn1n ,s zoo CWlif' -, ,,., l«fJllttt, tldu,,,,/ •kr, IHI ,..,, /00 ~ Wf,,. ....
-•JiOO.---..,.,_..,. ClllfflCMH', 1959
DltfMd ..,,,, dt:Nllr.'ul Datu• t1 """' #It~ c.,,,o,,, llflrn,o l ,0 ,.,. ,,,,,,.,..,.co, ..... .,,_
If 111 1 ll I I l
ec..r.mr, or Sim.• '"""' l'llllrl
---···· Po11tlwe ,.,.-ouOc .._,., ONW-,,,,, ._,,,,,_,
011/y p«,..1/.y efFec-hve
---ANlfu4k of tN -ct..- wrfOCt ,n tN 5rol,.a R1...-
Contours on the 1Nater table and flow net of ~he SnaJ.(e :?lain aquifer