artigo aula
TRANSCRIPT
Ae
RD
a
ARRAA
KMMSEA
1
mim[aimocidmc
etGm
0h
Electrochimica Acta 85 (2012) 283– 294
Contents lists available at SciVerse ScienceDirect
Electrochimica Acta
jou rn al hom epa ge: www.elsev ier .com/ locate /e lec tac ta
novel observation of the interaction between the macroelastic stress andlectrochemical corrosion of low carbon steel in 3.5 wt% NaCl solution
.K. Ren, S. Zhang, X.L. Pang, K.W. Gao ∗
epartment of Materials Physics and Chemistry, University of Science and Technology, Beijing 100083, China
r t i c l e i n f o
rticle history:eceived 25 June 2012eceived in revised form 20 August 2012ccepted 20 August 2012vailable online 28 August 2012
eywords:echanochemical effecticroplastic deformation
a b s t r a c t
This paper focuses on the interaction of macroelastic stress and electrochemical corrosion of low carbonsteel in 3.5 wt% NaCl solution. The electrochemical impedance spectra (EIS), corrosion current densityand open circuit potential (OCP) tests were used to represent the electrochemical behavior of low carbonsteel. The microplastic deformation was studied through acoustic emission (AE) techniques and sur-face morphology observation. The results indicated that there was non-linear relationship between theapplied stress and electrochemical corrosion of low carbon steel in 3.5 wt% NaCl solution. At the begin-ning of macroelastic deformation, the applied mechanical energy would activate the metal surface, sothe corrosive solution would more easily to cover the metal surface and become thin liquid film, then
urface energylectrochemical testscoustic emission
accelerate the electrochemical corrosion process. When the gradually increased stress came to a criticalvalue, the extra mechanical energy would not only affect the surface corrosion behavior of samples, butalso enhance the microplastic deformation at some local regions of metal surface even the applied stresswas far below the yield strength. Usually these two processes competed with each other. The dominatedprocess at the beginning of elastic deformation is stress accelerating corrosion, and when exceeding thecritical stress, the applied energy would induce microplastic deformation.
© 2012 Elsevier Ltd. All rights reserved.
. Introduction
Structural materials used in marine atmosphere usually endureechanical and electrochemical attacks. Interaction of mechan-
cal and electrochemical effects enhances surface reactions onetal, resulting in accelerated failure of structural components
1]. In most cases, mechanical and electrochemical effects inter-ct and accelerate each other concurrently, leading to a dramaticncrease in corrosion rate. This synergistic effect can be defined as
echanochemical effect (MCE) [2]. Many previous studies focusn failure of structural components [3–5], such as stress corrosionracking (SCC), corrosion fatigue and hydrogen induced crack-ng (HIC). On the other hand, most investigation limits to plasticeformed metal [6,7]. Up to now, less information concerning theechanism of the elastic stress interacting with electrochemical
orrosion is available in the literature.Some researchers [3,8–10] reported that the mechano-
lectrochemical dissolution occurred only in the plastic region;
he stress did not affect the dissolution in elastic deformation.uo et al. [11] found that in 0.1 M Na2SO4 solution, the impinge-ent erosion of the sand did not alter the corrosion behavior∗ Corresponding author. Tel.: +86 10 62334909; fax: +86 10 62334909.E-mail address: [email protected] (K.W. Gao).
013-4686/$ – see front matter © 2012 Elsevier Ltd. All rights reserved.ttp://dx.doi.org/10.1016/j.electacta.2012.08.079
of carbon steel significantly because the mass transfer step wasnot the rate-determined step and the corrosion product was notprotective. But more workers held the opposite points. Du et al.[12] employed electrochemical noise (EN) and acoustic emission(AE) techniques and found the corrosion behavior of 304 stain-less steel would be changed in 1.5 mol/L H2SO4 + 0.5 mol/L NaClunder slow strain rate test (SSRT) condition, pitting corrosion,crack propagation and general corrosion would appeared succes-sively. Li and Chen [13] reported that an elastic stress of 308 MPawhich was close to the yield strength, performed on 1420 Al–Lialloy caused denser and smaller pits in 3.5% NaCl. Some peopleresearched on the mechanochemical effect (MCE) through electro-chemical techniques. Despic et al. [14] found the elastic stress onlyaffected cathodic hydrogen evolution reaction and led to a rise ofcorrosion potential with 0.8 mV in H2SO4 solution per 1000 MPaexternal stress. H.H. Huang [15] showed the polarization resis-tance Rp of EIS measurements of titanium in NaF solution, whichwas inversely proportional to the corrosion rate, decreased onincreasing the NaF concentration and the elastic strain. Gutman’stheory [2] concerning mechanochemical effect (MCE) and chemo-mechanical effect (CME) was proven by many workers [16–18].
They insisted there was linear relationship between external stressand corrosion potential.Although the problem caused by the interaction of stress andelectrochemical corrosion is very serious, the mechanism is still not
284 R.K. Ren et al. / Electrochimica Acta 85 (2012) 283– 294
Table 1Nominal composition of the tested steels (mass fraction, wt%).
Steel no. C Si Mn S Cu Cr Ni Nb P RE Fe
83
to[atddtpihe
ilm
2
2
ms
v3sftbq
slfit
tamassTm
2
N
TMs
Through the critical surface tension theory, the contact angle canqualitatively characterize the surface energy of metals. Ordinarily,the higher the surface energy of a metal is, the easier it can bewetted by liquid, so the contact angle between the metal surface
Low carbon bainitic steel 0.081 0.35 1.12 0.00Low carbon ferritic steel 0.0055 0.16 0.79 –
horoughly understood. Some researchers worked on the influencef stress on surface and bulk structure of metal. Kiejna and Pogosov19] modified the jellium model and derived surface energy, stressnd work function of elastically deformed metal. Ciuplys [20]hought during the deformation process, the arrangement and theensity of dislocations varied at moving away from the surface intoepth of the metal. Gutman [21] pointed out that an extra disloca-ion flux would appear in the surface layer while anodic dissolutionresented at the surface and resulted in a degradation of resistance
n the surface layer to the plastic deformation. All of these couldelp us to study the interaction and synergism between stress andlectrochemical corrosion in an active dissolution system.
The primary aim of the present investigation is to study thenfluence of tensile stress on electrochemical effect during macroe-astic deformation process of low carbon steel. The mechanism of
echano-chemical interaction is discussed.
. Experimental procedures
.1. Material
In this research, two kinds of low carbon steels with differenticrostructure were tested. The chemical compositions of these
teels are listed in Table 1.Samples for metallographic observations were prepared by con-
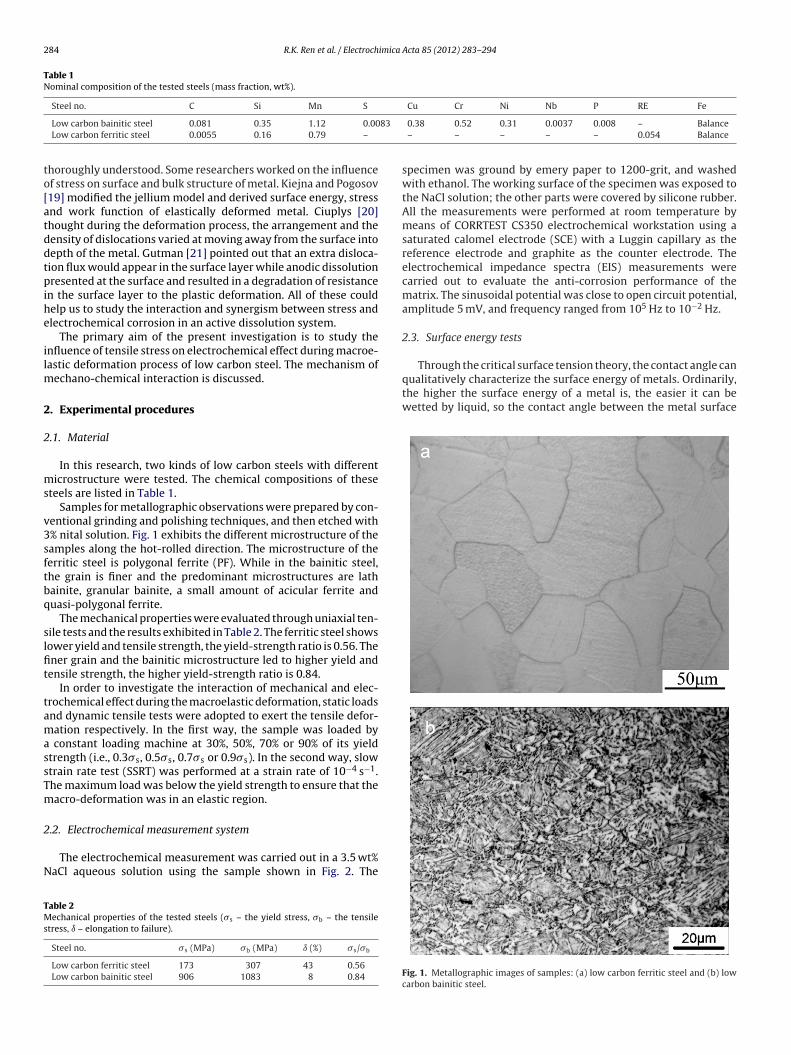
entional grinding and polishing techniques, and then etched with% nital solution. Fig. 1 exhibits the different microstructure of theamples along the hot-rolled direction. The microstructure of theerritic steel is polygonal ferrite (PF). While in the bainitic steel,he grain is finer and the predominant microstructures are lathainite, granular bainite, a small amount of acicular ferrite anduasi-polygonal ferrite.
The mechanical properties were evaluated through uniaxial ten-ile tests and the results exhibited in Table 2. The ferritic steel showsower yield and tensile strength, the yield-strength ratio is 0.56. Thener grain and the bainitic microstructure led to higher yield andensile strength, the higher yield-strength ratio is 0.84.
In order to investigate the interaction of mechanical and elec-rochemical effect during the macroelastic deformation, static loadsnd dynamic tensile tests were adopted to exert the tensile defor-ation respectively. In the first way, the sample was loaded by
constant loading machine at 30%, 50%, 70% or 90% of its yieldtrength (i.e., 0.3�s, 0.5�s, 0.7�s or 0.9�s). In the second way, slowtrain rate test (SSRT) was performed at a strain rate of 10−4 s−1.he maximum load was below the yield strength to ensure that theacro-deformation was in an elastic region.
.2. Electrochemical measurement system
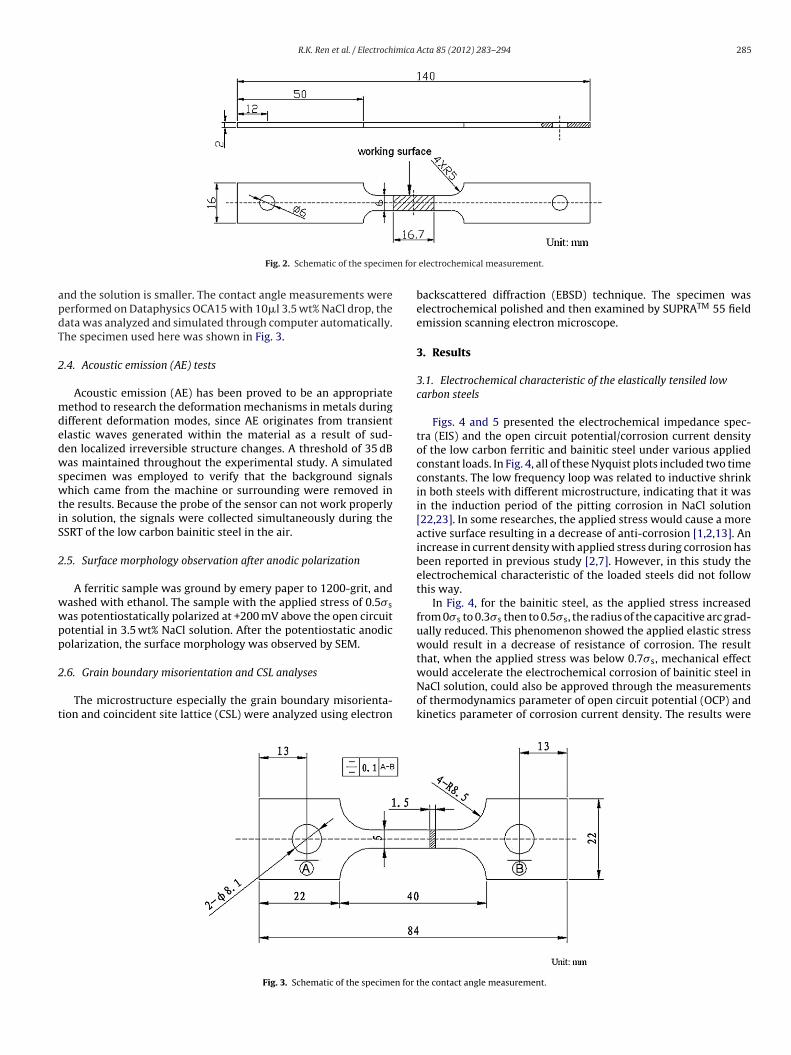
The electrochemical measurement was carried out in a 3.5 wt%aCl aqueous solution using the sample shown in Fig. 2. The
able 2echanical properties of the tested steels (�s – the yield stress, �b – the tensile
tress, ı – elongation to failure).
Steel no. �s (MPa) �b (MPa) ı (%) �s/�b
Low carbon ferritic steel 173 307 43 0.56Low carbon bainitic steel 906 1083 8 0.84
0.38 0.52 0.31 0.0037 0.008 – Balance– – – – – 0.054 Balance
specimen was ground by emery paper to 1200-grit, and washedwith ethanol. The working surface of the specimen was exposed tothe NaCl solution; the other parts were covered by silicone rubber.All the measurements were performed at room temperature bymeans of CORRTEST CS350 electrochemical workstation using asaturated calomel electrode (SCE) with a Luggin capillary as thereference electrode and graphite as the counter electrode. Theelectrochemical impedance spectra (EIS) measurements werecarried out to evaluate the anti-corrosion performance of thematrix. The sinusoidal potential was close to open circuit potential,amplitude 5 mV, and frequency ranged from 105 Hz to 10−2 Hz.
2.3. Surface energy tests
Fig. 1. Metallographic images of samples: (a) low carbon ferritic steel and (b) lowcarbon bainitic steel.
R.K. Ren et al. / Electrochimica Acta 85 (2012) 283– 294 285
en for
apdT
2
mdedwswtiS
2
wwpp
2
t
Fig. 2. Schematic of the specim
nd the solution is smaller. The contact angle measurements wereerformed on Dataphysics OCA15 with 10�l 3.5 wt% NaCl drop, theata was analyzed and simulated through computer automatically.he specimen used here was shown in Fig. 3.
.4. Acoustic emission (AE) tests
Acoustic emission (AE) has been proved to be an appropriateethod to research the deformation mechanisms in metals during
ifferent deformation modes, since AE originates from transientlastic waves generated within the material as a result of sud-en localized irreversible structure changes. A threshold of 35 dBas maintained throughout the experimental study. A simulated
pecimen was employed to verify that the background signalshich came from the machine or surrounding were removed in
he results. Because the probe of the sensor can not work properlyn solution, the signals were collected simultaneously during theSRT of the low carbon bainitic steel in the air.
.5. Surface morphology observation after anodic polarization
A ferritic sample was ground by emery paper to 1200-grit, andashed with ethanol. The sample with the applied stress of 0.5�s
as potentiostatically polarized at +200 mV above the open circuitotential in 3.5 wt% NaCl solution. After the potentiostatic anodicolarization, the surface morphology was observed by SEM.
.6. Grain boundary misorientation and CSL analyses
The microstructure especially the grain boundary misorienta-ion and coincident site lattice (CSL) were analyzed using electron
Fig. 3. Schematic of the specimen for t
electrochemical measurement.
backscattered diffraction (EBSD) technique. The specimen waselectrochemical polished and then examined by SUPRATM 55 fieldemission scanning electron microscope.
3. Results
3.1. Electrochemical characteristic of the elastically tensiled lowcarbon steels
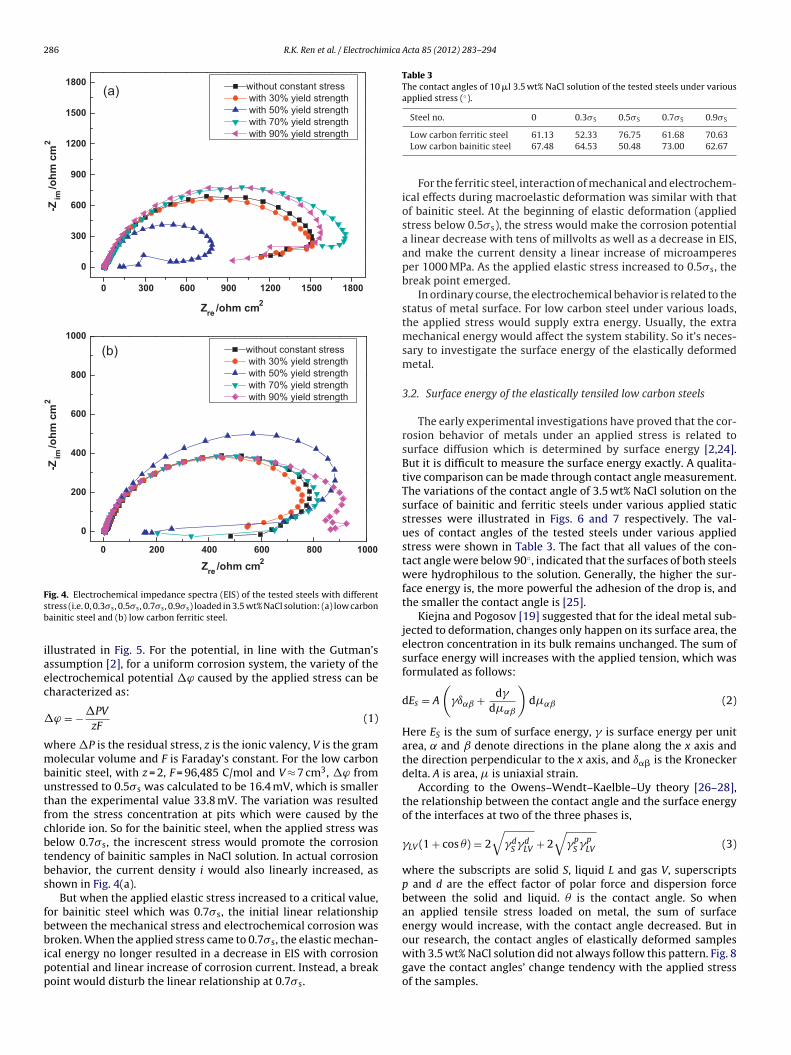
Figs. 4 and 5 presented the electrochemical impedance spec-tra (EIS) and the open circuit potential/corrosion current densityof the low carbon ferritic and bainitic steel under various appliedconstant loads. In Fig. 4, all of these Nyquist plots included two timeconstants. The low frequency loop was related to inductive shrinkin both steels with different microstructure, indicating that it wasin the induction period of the pitting corrosion in NaCl solution[22,23]. In some researches, the applied stress would cause a moreactive surface resulting in a decrease of anti-corrosion [1,2,13]. Anincrease in current density with applied stress during corrosion hasbeen reported in previous study [2,7]. However, in this study theelectrochemical characteristic of the loaded steels did not followthis way.
In Fig. 4, for the bainitic steel, as the applied stress increasedfrom 0�s to 0.3�s then to 0.5�s, the radius of the capacitive arc grad-ually reduced. This phenomenon showed the applied elastic stresswould result in a decrease of resistance of corrosion. The resultthat, when the applied stress was below 0.7�s, mechanical effect
would accelerate the electrochemical corrosion of bainitic steel inNaCl solution, could also be approved through the measurementsof thermodynamics parameter of open circuit potential (OCP) andkinetics parameter of corrosion current density. The results werehe contact angle measurement.
286 R.K. Ren et al. / Electrochimica Acta 85 (2012) 283– 294
10008006004002000
0
200
400
600
800
1000
without constant stress
with 30% yield strength
with 50% yield strength
with 70% yield strength
with 90% yield strength
(b)
-Zim
/oh
m c
m2
-Zim
/oh
m c
m2
1800150012009006003000
0
300
600
900
1200
1500
1800(a)
Zre
/ohm cm2
Zre
/ohm cm2
without constant stress
with 30% yield strength
with 50% yield strength
with 70% yield strength
with 90% yield strength
Fsb
iaec
�
wmbutfcbtbs
fbbipp
Table 3The contact angles of 10 �l 3.5 wt% NaCl solution of the tested steels under variousapplied stress (◦).
Steel no. 0 0.3�S 0.5�S 0.7�S 0.9�S
ig. 4. Electrochemical impedance spectra (EIS) of the tested steels with differenttress (i.e. 0, 0.3�s, 0.5�s, 0.7�s, 0.9�s) loaded in 3.5 wt% NaCl solution: (a) low carbonainitic steel and (b) low carbon ferritic steel.
llustrated in Fig. 5. For the potential, in line with the Gutman’sssumption [2], for a uniform corrosion system, the variety of thelectrochemical potential �ϕ caused by the applied stress can beharacterized as:
ϕ = −�PV
zF(1)
here �P is the residual stress, z is the ionic valency, V is the gramolecular volume and F is Faraday’s constant. For the low carbon
ainitic steel, with z = 2, F = 96,485 C/mol and V ≈ 7 cm3, �ϕ fromnstressed to 0.5�s was calculated to be 16.4 mV, which is smallerhan the experimental value 33.8 mV. The variation was resultedrom the stress concentration at pits which were caused by thehloride ion. So for the bainitic steel, when the applied stress waselow 0.7�s, the increscent stress would promote the corrosionendency of bainitic samples in NaCl solution. In actual corrosionehavior, the current density i would also linearly increased, ashown in Fig. 4(a).
But when the applied elastic stress increased to a critical value,or bainitic steel which was 0.7�s, the initial linear relationshipetween the mechanical stress and electrochemical corrosion was
roken. When the applied stress came to 0.7�s, the elastic mechan-cal energy no longer resulted in a decrease in EIS with corrosionotential and linear increase of corrosion current. Instead, a breakoint would disturb the linear relationship at 0.7�s.
Low carbon ferritic steel 61.13 52.33 76.75 61.68 70.63Low carbon bainitic steel 67.48 64.53 50.48 73.00 62.67
For the ferritic steel, interaction of mechanical and electrochem-ical effects during macroelastic deformation was similar with thatof bainitic steel. At the beginning of elastic deformation (appliedstress below 0.5�s), the stress would make the corrosion potentiala linear decrease with tens of millvolts as well as a decrease in EIS,and make the current density a linear increase of microamperesper 1000 MPa. As the applied elastic stress increased to 0.5�s, thebreak point emerged.
In ordinary course, the electrochemical behavior is related to thestatus of metal surface. For low carbon steel under various loads,the applied stress would supply extra energy. Usually, the extramechanical energy would affect the system stability. So it’s neces-sary to investigate the surface energy of the elastically deformedmetal.
3.2. Surface energy of the elastically tensiled low carbon steels
The early experimental investigations have proved that the cor-rosion behavior of metals under an applied stress is related tosurface diffusion which is determined by surface energy [2,24].But it is difficult to measure the surface energy exactly. A qualita-tive comparison can be made through contact angle measurement.The variations of the contact angle of 3.5 wt% NaCl solution on thesurface of bainitic and ferritic steels under various applied staticstresses were illustrated in Figs. 6 and 7 respectively. The val-ues of contact angles of the tested steels under various appliedstress were shown in Table 3. The fact that all values of the con-tact angle were below 90◦, indicated that the surfaces of both steelswere hydrophilous to the solution. Generally, the higher the sur-face energy is, the more powerful the adhesion of the drop is, andthe smaller the contact angle is [25].
Kiejna and Pogosov [19] suggested that for the ideal metal sub-jected to deformation, changes only happen on its surface area, theelectron concentration in its bulk remains unchanged. The sum ofsurface energy will increases with the applied tension, which wasformulated as follows:
dEs = A
(�ı˛ˇ + d�
d�˛ˇ
)d�˛ˇ (2)
Here ES is the sum of surface energy, � is surface energy per unitarea, ̨ and ̌ denote directions in the plane along the x axis andthe direction perpendicular to the x axis, and ı�� is the Kroneckerdelta. A is area, � is uniaxial strain.
According to the Owens–Wendt–Kaelble–Uy theory [26–28],the relationship between the contact angle and the surface energyof the interfaces at two of the three phases is,
�LV (1 + cos �) = 2√
�dS �d
LV + 2√
�pS �p
LV (3)
where the subscripts are solid S, liquid L and gas V, superscriptsp and d are the effect factor of polar force and dispersion forcebetween the solid and liquid. � is the contact angle. So whenan applied tensile stress loaded on metal, the sum of surfaceenergy would increase, with the contact angle decreased. But in
our research, the contact angles of elastically deformed sampleswith 3.5 wt% NaCl solution did not always follow this pattern. Fig. 8gave the contact angles’ change tendency with the applied stressof the samples.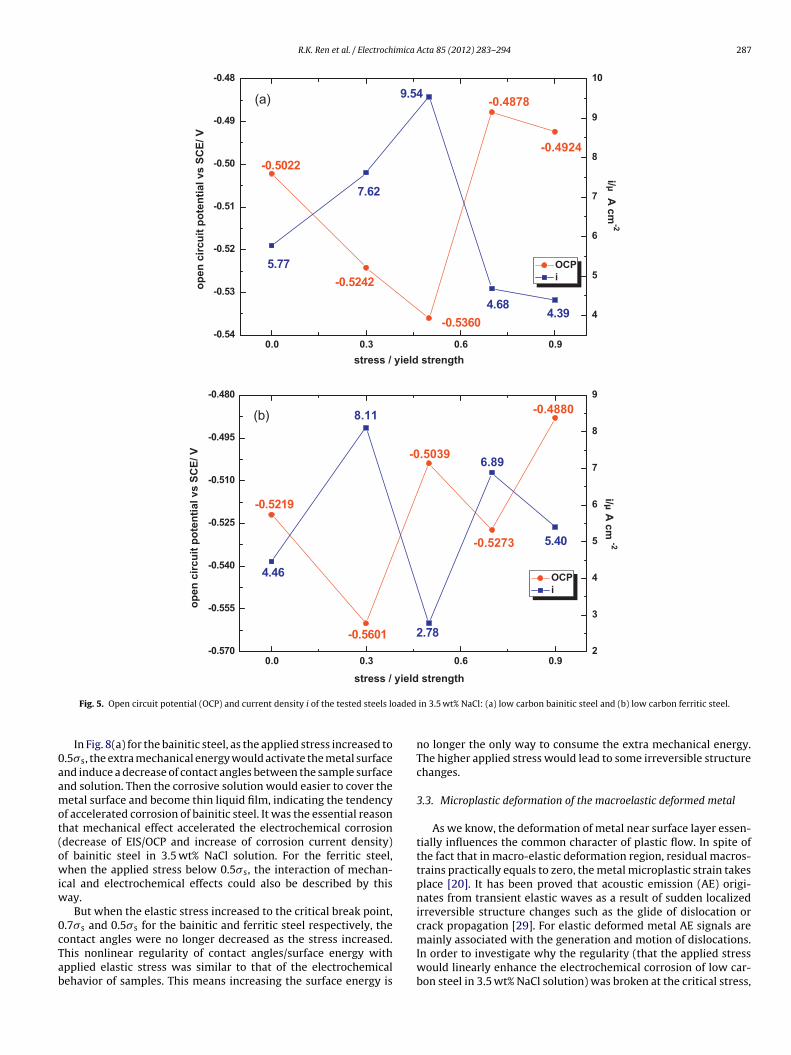
R.K. Ren et al. / Electrochimica Acta 85 (2012) 283– 294 287
0.90.60.30.0-0.54
-0.53
-0.52
-0.51
-0.50
-0.49
-0.48
op
en
cir
cu
it p
ote
nti
al vs S
CE
/ V
stress / yield strength
4
5
6
7
8
9
10
4.394.68
9.54
i/μA
cm
-2
(a)
OCP
i
-0.50 22
-0.5242
-0.5360
-0.4878
-0.4924
5.77
7.62
0.90.60.30.0-0.57 0
-0.55 5
-0.54 0
-0.52 5
-0.51 0
-0.49 5
-0.48 0
op
en
cir
cu
it p
ote
nti
al vs S
CE
/ V
stress / yield strength
OCP
i
2
3
4
5
6
7
8
9
i/μA
cm
-25.40
6.89
2.78
8.11-0.4880
-0.5273
-0.5039
-0.5601
(b)
-0.521 9
4.46
aded
0aamot(owiw
0cTab
Fig. 5. Open circuit potential (OCP) and current density i of the tested steels lo
In Fig. 8(a) for the bainitic steel, as the applied stress increased to.5�s, the extra mechanical energy would activate the metal surfacend induce a decrease of contact angles between the sample surfacend solution. Then the corrosive solution would easier to cover theetal surface and become thin liquid film, indicating the tendency
f accelerated corrosion of bainitic steel. It was the essential reasonhat mechanical effect accelerated the electrochemical corrosiondecrease of EIS/OCP and increase of corrosion current density)f bainitic steel in 3.5 wt% NaCl solution. For the ferritic steel,hen the applied stress below 0.5�s, the interaction of mechan-
cal and electrochemical effects could also be described by thisay.
But when the elastic stress increased to the critical break point,.7�s and 0.5�s for the bainitic and ferritic steel respectively, the
ontact angles were no longer decreased as the stress increased.his nonlinear regularity of contact angles/surface energy withpplied elastic stress was similar to that of the electrochemicalehavior of samples. This means increasing the surface energy isin 3.5 wt% NaCl: (a) low carbon bainitic steel and (b) low carbon ferritic steel.
no longer the only way to consume the extra mechanical energy.The higher applied stress would lead to some irreversible structurechanges.
3.3. Microplastic deformation of the macroelastic deformed metal
As we know, the deformation of metal near surface layer essen-tially influences the common character of plastic flow. In spite ofthe fact that in macro-elastic deformation region, residual macros-trains practically equals to zero, the metal microplastic strain takesplace [20]. It has been proved that acoustic emission (AE) origi-nates from transient elastic waves as a result of sudden localizedirreversible structure changes such as the glide of dislocation orcrack propagation [29]. For elastic deformed metal AE signals are
mainly associated with the generation and motion of dislocations.In order to investigate why the regularity (that the applied stresswould linearly enhance the electrochemical corrosion of low car-bon steel in 3.5 wt% NaCl solution) was broken at the critical stress,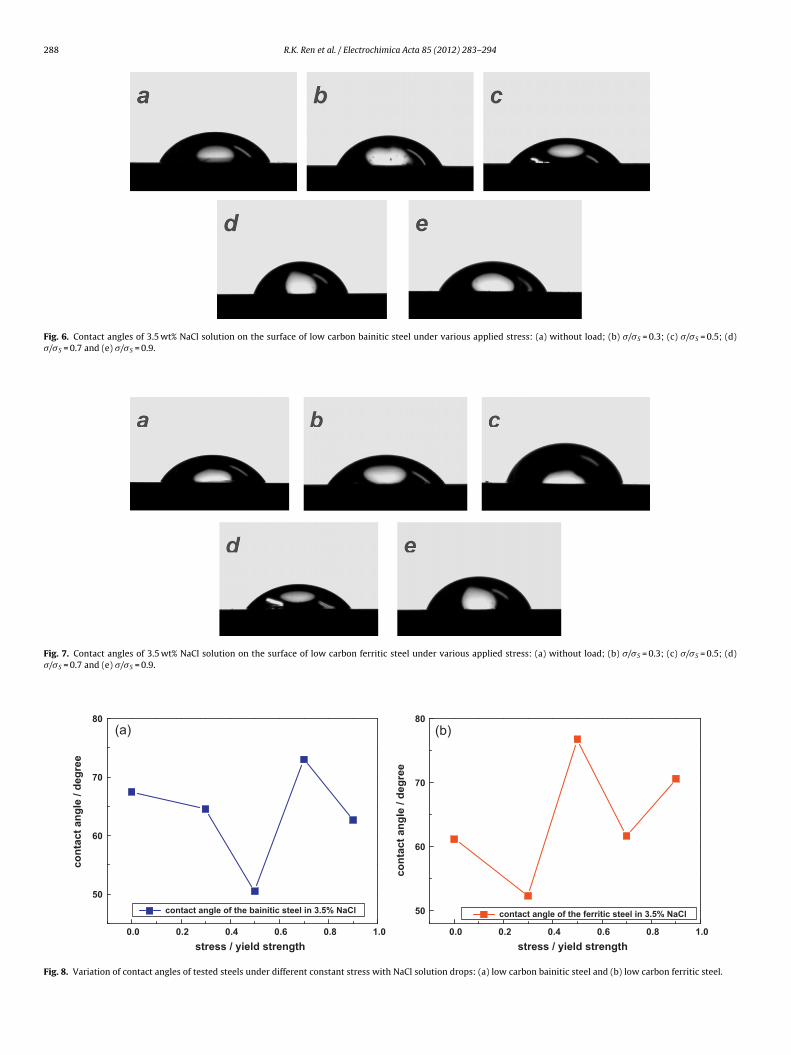
288 R.K. Ren et al. / Electrochimica Acta 85 (2012) 283– 294
Fig. 6. Contact angles of 3.5 wt% NaCl solution on the surface of low carbon bainitic steel under various applied stress: (a) without load; (b) �/�S = 0.3; (c) �/�S = 0.5; (d)�/�S = 0.7 and (e) �/�S = 0.9.
Fig. 7. Contact angles of 3.5 wt% NaCl solution on the surface of low carbon ferritic steel under various applied stress: (a) without load; (b) �/�S = 0.3; (c) �/�S = 0.5; (d)�/�S = 0.7 and (e) �/�S = 0.9.
1.00.80.60.40.20.0
50
60
70
80
(a)
co
nta
ct
an
gle
/ d
eg
ree
stress / yield strength
contact angle of the bainitic steel in 3.5% NaCl
1.00.80.60.40.20.0
50
60
70
80
(b)
co
nta
ct
an
gle
/ d
eg
ree
stress / yield strength
contact angle of the ferritic steel in 3.5% NaCl
Fig. 8. Variation of contact angles of tested steels under different constant stress with NaCl solution drops: (a) low carbon bainitic steel and (b) low carbon ferritic steel.
R.K. Ren et al. / Electrochimica Acta 85 (2012) 283– 294 289
1400120010008006004002000
0
200
400
600
800
1000
1200
str
es
s / M
Pa
time / s
Ft
Ag
slsftTAtiahwbm
lambdgtcps5o
sive solution would easily cover the metal surface and become thin
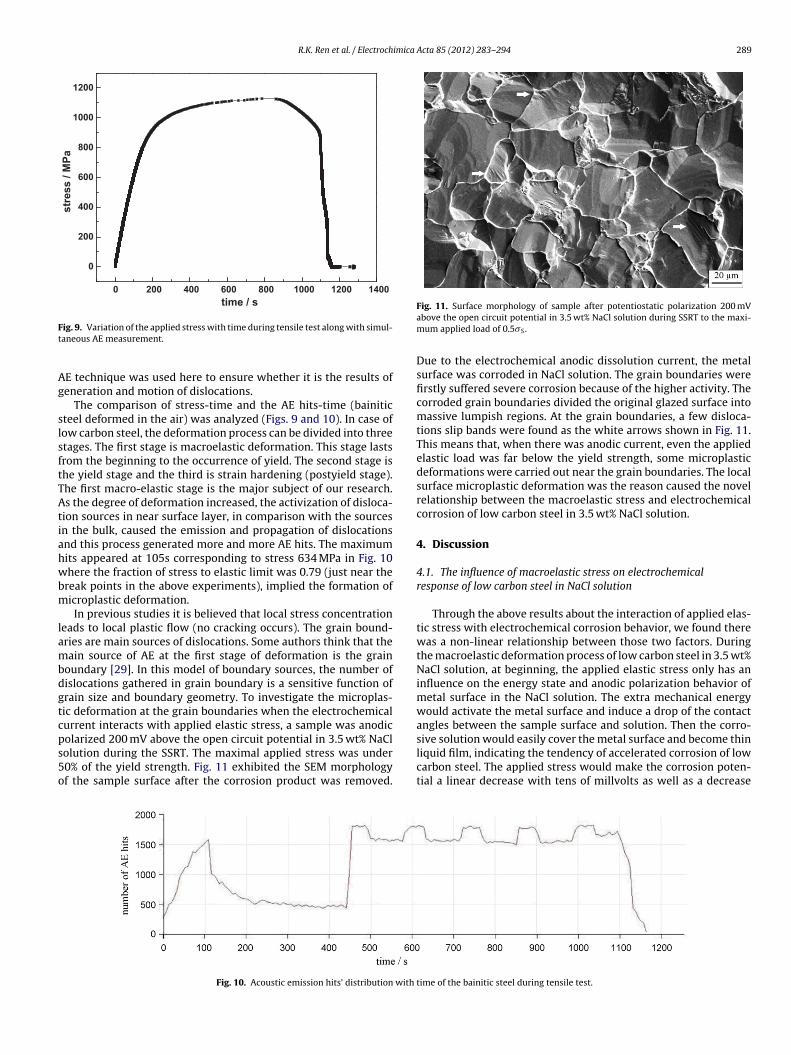
ig. 9. Variation of the applied stress with time during tensile test along with simul-aneous AE measurement.
E technique was used here to ensure whether it is the results ofeneration and motion of dislocations.
The comparison of stress-time and the AE hits-time (bainiticteel deformed in the air) was analyzed (Figs. 9 and 10). In case ofow carbon steel, the deformation process can be divided into threetages. The first stage is macroelastic deformation. This stage lastsrom the beginning to the occurrence of yield. The second stage ishe yield stage and the third is strain hardening (postyield stage).he first macro-elastic stage is the major subject of our research.s the degree of deformation increased, the activization of disloca-
ion sources in near surface layer, in comparison with the sourcesn the bulk, caused the emission and propagation of dislocationsnd this process generated more and more AE hits. The maximumits appeared at 105s corresponding to stress 634 MPa in Fig. 10here the fraction of stress to elastic limit was 0.79 (just near the
reak points in the above experiments), implied the formation oficroplastic deformation.In previous studies it is believed that local stress concentration
eads to local plastic flow (no cracking occurs). The grain bound-ries are main sources of dislocations. Some authors think that theain source of AE at the first stage of deformation is the grain
oundary [29]. In this model of boundary sources, the number ofislocations gathered in grain boundary is a sensitive function ofrain size and boundary geometry. To investigate the microplas-ic deformation at the grain boundaries when the electrochemicalurrent interacts with applied elastic stress, a sample was anodicolarized 200 mV above the open circuit potential in 3.5 wt% NaCl
olution during the SSRT. The maximal applied stress was under0% of the yield strength. Fig. 11 exhibited the SEM morphologyf the sample surface after the corrosion product was removed.Fig. 10. Acoustic emission hits’ distribution with
Fig. 11. Surface morphology of sample after potentiostatic polarization 200 mVabove the open circuit potential in 3.5 wt% NaCl solution during SSRT to the maxi-mum applied load of 0.5�S.
Due to the electrochemical anodic dissolution current, the metalsurface was corroded in NaCl solution. The grain boundaries werefirstly suffered severe corrosion because of the higher activity. Thecorroded grain boundaries divided the original glazed surface intomassive lumpish regions. At the grain boundaries, a few disloca-tions slip bands were found as the white arrows shown in Fig. 11.This means that, when there was anodic current, even the appliedelastic load was far below the yield strength, some microplasticdeformations were carried out near the grain boundaries. The localsurface microplastic deformation was the reason caused the novelrelationship between the macroelastic stress and electrochemicalcorrosion of low carbon steel in 3.5 wt% NaCl solution.
4. Discussion
4.1. The influence of macroelastic stress on electrochemicalresponse of low carbon steel in NaCl solution
Through the above results about the interaction of applied elas-tic stress with electrochemical corrosion behavior, we found therewas a non-linear relationship between those two factors. Duringthe macroelastic deformation process of low carbon steel in 3.5 wt%NaCl solution, at beginning, the applied elastic stress only has aninfluence on the energy state and anodic polarization behavior ofmetal surface in the NaCl solution. The extra mechanical energywould activate the metal surface and induce a drop of the contactangles between the sample surface and solution. Then the corro-
liquid film, indicating the tendency of accelerated corrosion of lowcarbon steel. The applied stress would make the corrosion poten-tial a linear decrease with tens of millvolts as well as a decrease
time of the bainitic steel during tensile test.
290 R.K. Ren et al. / Electrochimica Acta 85 (2012) 283– 294
120010008006004002000-0.63
-0.60
-0.57
-0.54
-0.51
-0.48
-0.45
time / s
op
en
cir
cu
it p
ote
nti
al / V
-0.1
0.0
0.1
0.2
0.3
0.4
0.5
OCP
i
i /μA
cm
-2
(a)
120010008006004002000
-0.62
-0.60
-0.58
-0.56
-0.54
-0.52
op
en
cir
cu
it p
ote
nti
al / V
(b)
time / s
-0.1
0.0
0.1
0.2
0.3
0.4
0.5
OCP
i
i/μA
cm
-2
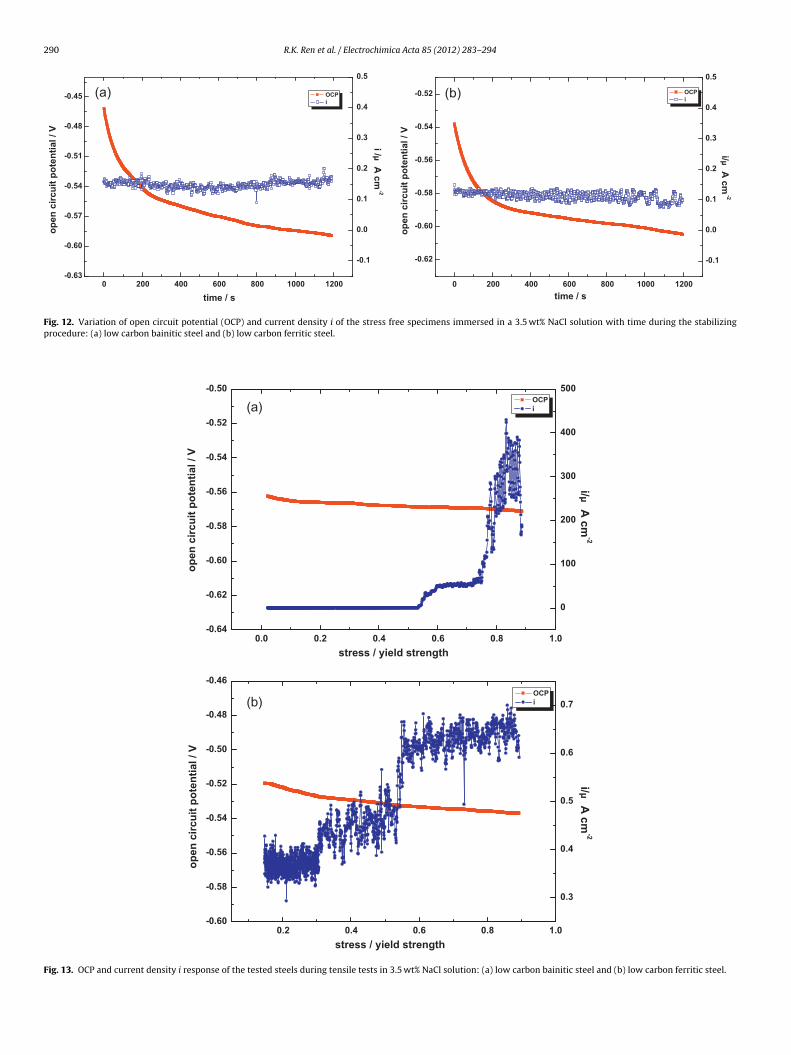
Fig. 12. Variation of open circuit potential (OCP) and current density i of the stress free specimens immersed in a 3.5 wt% NaCl solution with time during the stabilizingprocedure: (a) low carbon bainitic steel and (b) low carbon ferritic steel.
1.00.80.60.40.20.0-0.64
-0.62
-0.60
-0.58
-0.56
-0.54
-0.52
-0.50
(a)OCP
i
op
en
cir
cu
it p
ote
nti
al / V
stress / yield strength
0
100
200
300
400
500
i/μA
cm
-2
1.00.80.60.40.2-0.60
-0.58
-0.56
-0.54
-0.52
-0.50
-0.48
-0.46
(b)
op
en
cir
cu
it p
ote
nti
al / V
stress / yield strength
OCP
i
0.3
0.4
0.5
0.6
0.7
i/μA
cm
-2
Fig. 13. OCP and current density i response of the tested steels during tensile tests in 3.5 wt% NaCl solution: (a) low carbon bainitic steel and (b) low carbon ferritic steel.
R.K. Ren et al. / Electrochimica Acta 85 (2012) 283– 294 291
0.0 0.2 0.4 0.6 0.8 1.0
-0.76
-0.74
-0.72
-0.70
-0.68
-0.66
-0.64 (a)OCP
i
op
en
cir
cu
it p
ote
nti
al / V
stress / yield strength
50
100
150
200
250
300
350
400
0.0 0.2 0.4 0.6 0.8 1.0-0.66
-0.64
-0.62
-0.60
-0.58
-0.56
-0.54
-0.52OCP
i(b)
op
en
cir
cu
it p
ote
nti
al / V
stress / yield strength
0.5
0.6
0.7
0.8
0.9
1.0
1.1
1.2
1.3
i/μA
cm
-2i/μ
A c
m-2
i/μA
cm
-2i/μ
A c
m-2
0.0 0.2 0.4 0.6 0.8 1.0-0.70
-0.68
-0.66
-0.64
-0.62
-0.60
-0.58
-0.56 OCP
i(c)
op
en
cir
cu
it p
ote
nti
al / V
stress / yield strength
0
40
80
120
160
200
240
0.0 0.2 0.4 0.6 0.8 1.0-0.76
-0.74
-0.72
-0.70
-0.68
-0.66
-0.64
-0.62
op
en
cir
cu
it p
ote
nti
al / V
stress / yield strength
0.4
0.5
0.6
0.7
0.8
0.9
1.0
1.1
1.2OCP
i(d)
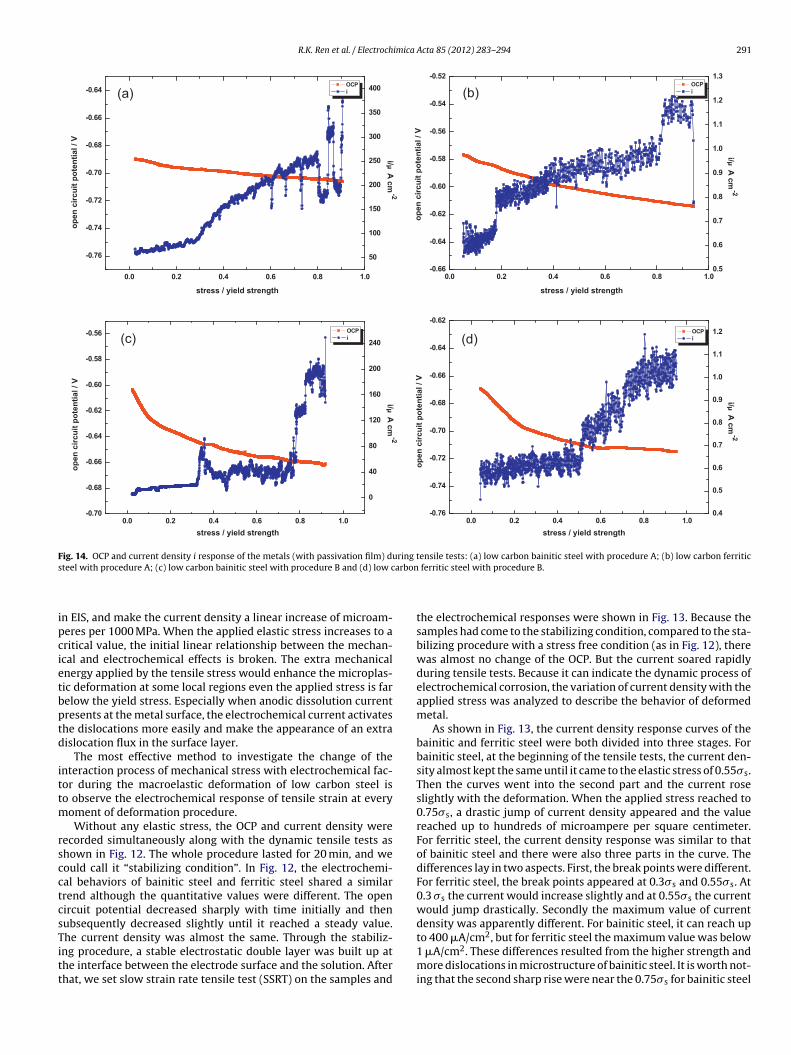
Fig. 14. OCP and current density i response of the metals (with passivation film) during tensile tests: (a) low carbon bainitic steel with procedure A; (b) low carbon ferritics arbon
ipcietbptd
ittm
rscctcsTitt
teel with procedure A; (c) low carbon bainitic steel with procedure B and (d) low c
n EIS, and make the current density a linear increase of microam-eres per 1000 MPa. When the applied elastic stress increases to aritical value, the initial linear relationship between the mechan-cal and electrochemical effects is broken. The extra mechanicalnergy applied by the tensile stress would enhance the microplas-ic deformation at some local regions even the applied stress is farelow the yield stress. Especially when anodic dissolution currentresents at the metal surface, the electrochemical current activateshe dislocations more easily and make the appearance of an extraislocation flux in the surface layer.
The most effective method to investigate the change of thenteraction process of mechanical stress with electrochemical fac-or during the macroelastic deformation of low carbon steel iso observe the electrochemical response of tensile strain at every
oment of deformation procedure.Without any elastic stress, the OCP and current density were
ecorded simultaneously along with the dynamic tensile tests ashown in Fig. 12. The whole procedure lasted for 20 min, and weould call it “stabilizing condition”. In Fig. 12, the electrochemi-al behaviors of bainitic steel and ferritic steel shared a similarrend although the quantitative values were different. The openircuit potential decreased sharply with time initially and thenubsequently decreased slightly until it reached a steady value.
he current density was almost the same. Through the stabiliz-ng procedure, a stable electrostatic double layer was built up athe interface between the electrode surface and the solution. Afterhat, we set slow strain rate tensile test (SSRT) on the samples andferritic steel with procedure B.
the electrochemical responses were shown in Fig. 13. Because thesamples had come to the stabilizing condition, compared to the sta-bilizing procedure with a stress free condition (as in Fig. 12), therewas almost no change of the OCP. But the current soared rapidlyduring tensile tests. Because it can indicate the dynamic process ofelectrochemical corrosion, the variation of current density with theapplied stress was analyzed to describe the behavior of deformedmetal.
As shown in Fig. 13, the current density response curves of thebainitic and ferritic steel were both divided into three stages. Forbainitic steel, at the beginning of the tensile tests, the current den-sity almost kept the same until it came to the elastic stress of 0.55�s.Then the curves went into the second part and the current roseslightly with the deformation. When the applied stress reached to0.75�s, a drastic jump of current density appeared and the valuereached up to hundreds of microampere per square centimeter.For ferritic steel, the current density response was similar to thatof bainitic steel and there were also three parts in the curve. Thedifferences lay in two aspects. First, the break points were different.For ferritic steel, the break points appeared at 0.3�s and 0.55�s. At0.3 �s the current would increase slightly and at 0.55�s the currentwould jump drastically. Secondly the maximum value of currentdensity was apparently different. For bainitic steel, it can reach up
to 400 �A/cm2, but for ferritic steel the maximum value was below1 �A/cm2. These differences resulted from the higher strength andmore dislocations in microstructure of bainitic steel. It is worth not-ing that the second sharp rise were near the 0.75�s for bainitic steel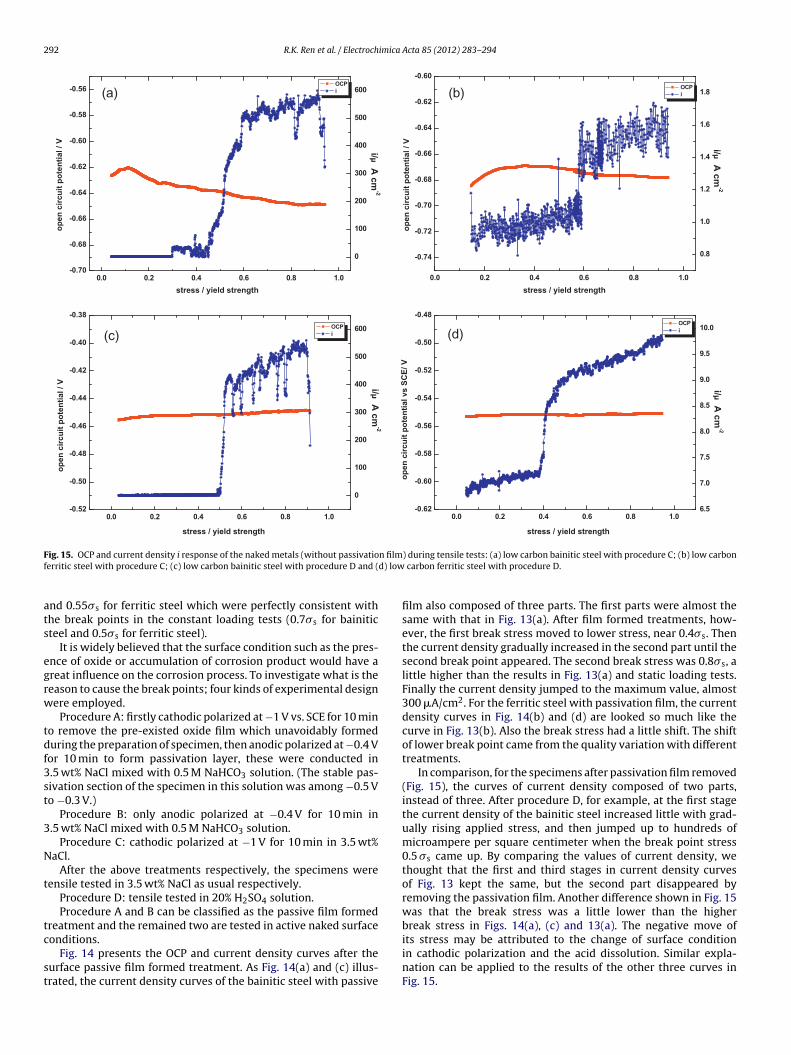
292 R.K. Ren et al. / Electrochimica Acta 85 (2012) 283– 294
0.0 0.2 0.4 0.6 0.8 1.0-0.70
-0.68
-0.66
-0.64
-0.62
-0.60
-0.58
-0.56
op
en
cir
cu
it p
ote
nti
al / V
stress / yield strength
0
100
200
300
400
500
600OCP
i
i/μA
cm
-2
(a)
0.0 0.2 0. 4 0.6 0.8 1.0-0.52
-0.50
-0.48
-0.46
-0.44
-0.42
-0.40
-0.38
op
en
cir
cu
it p
ote
nti
al / V
stress / yield strength
0
100
200
300
400
500
600
i/μA
cm
-2
OCP
i(c)
0.0 0.2 0.4 0.6 0.8 1.0
-0.74
-0.72
-0.70
-0.68
-0.66
-0.64
-0.62
-0.60
(b)
op
en
cir
cu
it p
ote
nti
al / V
stress / yield strength
0.8
1.0
1.2
1.4
1.6
1.8OCP
i
i/μA
cm
-2
0.0 0.2 0.4 0.6 0.8 1.0-0.62
-0.60
-0.58
-0.56
-0.54
-0.52
-0.50
-0.48
(d)
op
en
cir
cu
it p
ote
nti
al vs S
CE
/ V
stress / yield strength
6.5
7.0
7.5
8.0
8.5
9.0
9.5
10.0
i/μA
cm
-2
OCP
i
F n filmf d) low
ats
egrw
tdf3st
3
N
t
tc
st
ig. 15. OCP and current density i response of the naked metals (without passivatioerritic steel with procedure C; (c) low carbon bainitic steel with procedure D and (
nd 0.55�s for ferritic steel which were perfectly consistent withhe break points in the constant loading tests (0.7�s for bainiticteel and 0.5�s for ferritic steel).
It is widely believed that the surface condition such as the pres-nce of oxide or accumulation of corrosion product would have areat influence on the corrosion process. To investigate what is theeason to cause the break points; four kinds of experimental designere employed.
Procedure A: firstly cathodic polarized at −1 V vs. SCE for 10 mino remove the pre-existed oxide film which unavoidably formeduring the preparation of specimen, then anodic polarized at −0.4 Vor 10 min to form passivation layer, these were conducted in.5 wt% NaCl mixed with 0.5 M NaHCO3 solution. (The stable pas-ivation section of the specimen in this solution was among −0.5 Vo −0.3 V.)
Procedure B: only anodic polarized at −0.4 V for 10 min in.5 wt% NaCl mixed with 0.5 M NaHCO3 solution.
Procedure C: cathodic polarized at −1 V for 10 min in 3.5 wt%aCl.
After the above treatments respectively, the specimens wereensile tested in 3.5 wt% NaCl as usual respectively.
Procedure D: tensile tested in 20% H2SO4 solution.Procedure A and B can be classified as the passive film formed
reatment and the remained two are tested in active naked surface
onditions.Fig. 14 presents the OCP and current density curves after theurface passive film formed treatment. As Fig. 14(a) and (c) illus-rated, the current density curves of the bainitic steel with passive
) during tensile tests: (a) low carbon bainitic steel with procedure C; (b) low carbon carbon ferritic steel with procedure D.
film also composed of three parts. The first parts were almost thesame with that in Fig. 13(a). After film formed treatments, how-ever, the first break stress moved to lower stress, near 0.4�s. Thenthe current density gradually increased in the second part until thesecond break point appeared. The second break stress was 0.8�s, alittle higher than the results in Fig. 13(a) and static loading tests.Finally the current density jumped to the maximum value, almost300 �A/cm2. For the ferritic steel with passivation film, the currentdensity curves in Fig. 14(b) and (d) are looked so much like thecurve in Fig. 13(b). Also the break stress had a little shift. The shiftof lower break point came from the quality variation with differenttreatments.
In comparison, for the specimens after passivation film removed(Fig. 15), the curves of current density composed of two parts,instead of three. After procedure D, for example, at the first stagethe current density of the bainitic steel increased little with grad-ually rising applied stress, and then jumped up to hundreds ofmicroampere per square centimeter when the break point stress0.5 �s came up. By comparing the values of current density, wethought that the first and third stages in current density curvesof Fig. 13 kept the same, but the second part disappeared byremoving the passivation film. Another difference shown in Fig. 15was that the break stress was a little lower than the higherbreak stress in Figs. 14(a), (c) and 13(a). The negative move of
its stress may be attributed to the change of surface conditionin cathodic polarization and the acid dissolution. Similar expla-nation can be applied to the results of the other three curves inFig. 15.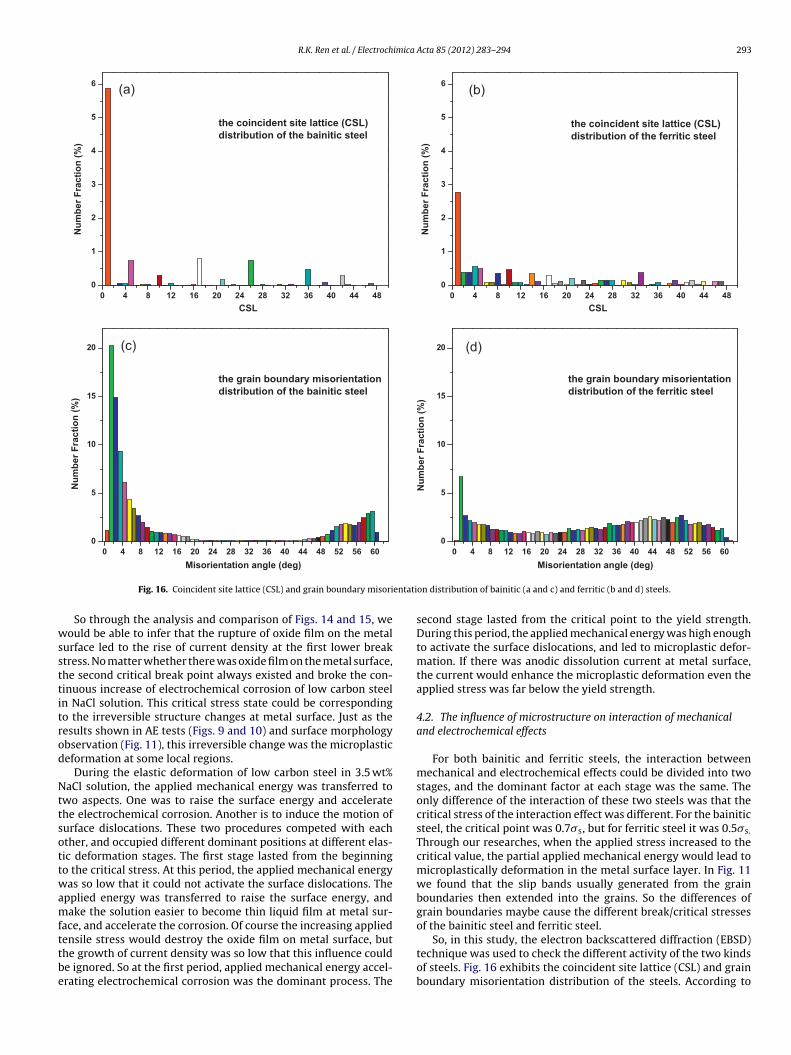
R.K. Ren et al. / Electrochimica Acta 85 (2012) 283– 294 293
48444036322824201612840
0
1
2
3
4
5
6(a)
Nu
mb
er
Fra
cti
on
(%
)
CSL
the coincident site lattice (CSL)
distribution of the bainitic steel
48444036322824201612840
0
1
2
3
4
5
6(b)
Nu
mb
er
Fra
cti
on
(%
)
CSL
the coincident site lattice (CSL)
distribution of the ferritic steel
60565248444036322824201612840
0
5
10
15
20 (c)
Nu
mb
er
Fra
cti
on
(%
)
the grain boundary misorientation
distribution of the bainitic steel
60565248444036322824201612840
0
5
10
15
20 (d)
Nu
mb
er
Fra
cti
on
(%
)
the grain boundary misorientation
distribution of the ferritic steel
entati
wssttitrod
Nttsottwamfttbe
Misorientation angle (deg)
Fig. 16. Coincident site lattice (CSL) and grain boundary misori
So through the analysis and comparison of Figs. 14 and 15, weould be able to infer that the rupture of oxide film on the metal
urface led to the rise of current density at the first lower breaktress. No matter whether there was oxide film on the metal surface,he second critical break point always existed and broke the con-inuous increase of electrochemical corrosion of low carbon steeln NaCl solution. This critical stress state could be correspondingo the irreversible structure changes at metal surface. Just as theesults shown in AE tests (Figs. 9 and 10) and surface morphologybservation (Fig. 11), this irreversible change was the microplasticeformation at some local regions.
During the elastic deformation of low carbon steel in 3.5 wt%aCl solution, the applied mechanical energy was transferred to
wo aspects. One was to raise the surface energy and acceleratehe electrochemical corrosion. Another is to induce the motion ofurface dislocations. These two procedures competed with eachther, and occupied different dominant positions at different elas-ic deformation stages. The first stage lasted from the beginningo the critical stress. At this period, the applied mechanical energyas so low that it could not activate the surface dislocations. The
pplied energy was transferred to raise the surface energy, andake the solution easier to become thin liquid film at metal sur-
ace, and accelerate the corrosion. Of course the increasing applied
ensile stress would destroy the oxide film on metal surface, buthe growth of current density was so low that this influence coulde ignored. So at the first period, applied mechanical energy accel-rating electrochemical corrosion was the dominant process. TheMisorientation angle (deg)
on distribution of bainitic (a and c) and ferritic (b and d) steels.
second stage lasted from the critical point to the yield strength.During this period, the applied mechanical energy was high enoughto activate the surface dislocations, and led to microplastic defor-mation. If there was anodic dissolution current at metal surface,the current would enhance the microplastic deformation even theapplied stress was far below the yield strength.
4.2. The influence of microstructure on interaction of mechanicaland electrochemical effects
For both bainitic and ferritic steels, the interaction betweenmechanical and electrochemical effects could be divided into twostages, and the dominant factor at each stage was the same. Theonly difference of the interaction of these two steels was that thecritical stress of the interaction effect was different. For the bainiticsteel, the critical point was 0.7�s, but for ferritic steel it was 0.5�s.
Through our researches, when the applied stress increased to thecritical value, the partial applied mechanical energy would lead tomicroplastically deformation in the metal surface layer. In Fig. 11we found that the slip bands usually generated from the grainboundaries then extended into the grains. So the differences ofgrain boundaries maybe cause the different break/critical stressesof the bainitic steel and ferritic steel.
So, in this study, the electron backscattered diffraction (EBSD)technique was used to check the different activity of the two kindsof steels. Fig. 16 exhibits the coincident site lattice (CSL) and grainboundary misorientation distribution of the steels. According to
2 imica
toaeltsdaoobwtb
agrsobcelm
5
(
(
(
[
[[[
[
[[
[
[
[[[
[
[
[
[
[[27] D. Owens, R. Wendt, Journal of Applied Polymer Science 13 (1969) 1741.[28] D. Kaelbe, K. Uy, Journal of Adhesion 2 (1970) 50.
94 R.K. Ren et al. / Electroch
he coincident site lattice theory, the reciprocal number densityf lattice sites that are common to both crystals could be defineds∑
CSL and generally the CSL boundaries are regarded as low-nergy boundaries, and the energy of low-
∑CSL boundaries is
ower than that of high-∑
CSL boundaries [30]. It can be seen thathe CSL boundaries were very little in both bainitic and ferriticteel. This indicated that the boundaries in the specimens were ran-om boundaries with high-energy. The boundaries became highlyctive to generate defects. From the grain boundary misorientationf bainitic steel, large amount of boundaries falls into the rangef below 20◦, which should be related to a large number of sub-oundary between bainitic ferritic laths in a packet. Comparingith the bainitic steel, the grain boundaries in the ferritic steel dis-
ributed more averagely, and the proportion of high angle grainoundaries increased apparently.
So owing to high energy and more defects at the grain bound-ries, a large number of local plastic flows would generate atrain boundaries and lead the deformed metal into microplasticegion even in macroelastic deformation region. This was the rea-on which causes the break point in the electrochemical behaviorf mechanochemical effect. Due to the different microstructure ofainitic and ferritic steel, the differences of grain boundaries maybeause the different break stress. Sub-boundaries with low misori-ntation of bainitic steel concentrated the stress at 70% of the elasticimit stress while that fraction was 50% of ferritic steel with much
ore high angle grain boundaries.
. Conclusions
1) For low carbon steel in 3.5 wt% NaCl solution, the appliedmechanical stress and the electrochemical corrosion of thesamples would interact and accelerate each other concurrently.
2) The relationship between the mechanical and electrochemicaleffects is non-linear. The interaction process can be divided intotwo stages. At the beginning of the macroelastic deformation,the applied elastic stress only has an influence on acceleratingthe electrochemical corrosion of low carbon steel in NaCl solu-tion. The applied mechanical energy would activate the metalsurface and make the corrosive solution easily cover the surface.When the applied elastic stress increases to the critical value,the partial applied mechanical energy is used to enhance tomicroplastic deformation at some local regions of metal surfaceeven the tensile stress is far below the yield strength.
3) The microplastic deformation of the macroelastic deformedmetal in NaCl solution usually generates at grain boundariesand then extends into the grains. The microstructure especiallythe activity of grain boundaries may have an influence on the
[
[
Acta 85 (2012) 283– 294
critical stress beyond which the sample would microplasticallydeformed.
Acknowledgement
This study was supported by National Natural Science Founda-tion of China (No. 51071029).
References
[1] K. Gao, D. Li, X. Pang, S. Yang, Corrosion Science 52 (2010) 3428.[2] E.M. Gutman, Mechanochemistry and Corrosion Protection of Metal, Science
Press, Beijing, 1989 (in Chinese).[3] T.P. Hoar, J.G. Hines, in: W.D. Robertson (Ed.), Stress Corrosion and Embrittle-
ment, John Wiley, New York, 1956.[4] T. Magnin, Advances in Corrosion—Deformation Interactions, Transtech Publi-
cation, Switzerland, Germany, UK/USA, 1996.[5] T. Magnin, L. Coudreuse, Materials Science and Engineering 72 (1985) 125.[6] A. Windfeldt, Electrochimica Acta 9 (1964) 1139.[7] A.R. Despic, R.G. Raicheff, J.O’M. Bockris, Journal of Chemical Physics 49 (1968)
926.[8] S. Haruyama, S. Asawa, Corrosion Science 13 (1973) 395.[9] T.P. Hoar, Corrosion 19 (1963) 311.10] H.L. Logan, Journal of Research of the National Bureau of Standards 48 (1955)
99.11] H.X. Guo, B.T. Lu, J.L. Luo, Electrochimica Acta 51 (2005) 315.12] G. Du, J. Li, W.K. Wang, C. Jiang, S.Z. Song, Corrosion Science 53 (2011) 2918.13] J.F. Li, W.J. Chen, X.S. Zhao, W.D. Ren, Z.Q. Zheng, Transactions of Nonferrous
Metal Society of China 16 (2006) 1171.14] A.R. Despic, R.G. Raicheff, J.O’M. Bockris, Journal of Chemical Physics 49 (1968)
926.15] H.H. Huang, Biomaterials 23 (2002) 59.16] J.R. Wang, L.Q. Zhu, Journal of Chinese Society for Corrosion and Protection 25
(2005) 226 (in Chinese).17] L. Niu, C.Q. Zhang, H.C. Lin, Corrosion Science and Protection Technology 15
(2003) 187 (in Chinese).18] S.X. Rao, L.Q. Zhu, D. Li, Z. Zhang, Q.P. Zhong, Journal of Chinese Society for
Corrosion and Protection 27 (2007) 228 (in Chinese).19] A. Kiejna, V.V. Pogosov, Physical Review B: Condensed Matter 62 (2000) 10445.20] A. Ciuplys, J. Vilys, V. Ciuplys, V. Kvedaras, Mechanika 60 (2006) 59.21] E.M. Gutman, Mechanochemistry of Materials Cambridge, International Sci-
ence Publishing, Great Abington, Cambridge, UK, 1998.22] Q.X. Zha, The Introduction of Electrode Kinetics, Science Press, Beijing, 2002 (in
Chinese).23] C.N. Cao, J. Wang, H.C. Lin, Journal of Chinese Society for Corrosion and Protec-
tion 9 (1989) 261 (in Chinese).24] J. Wang, C.N. Cao, H.C. Lin, Journal of Chinese Society for Corrosion and Protec-
tion 9 (1989) 271 (in Chinese).25] C. Herring, The use of classical macroscopic concepts in surface energy prob-
lems, in: Structure and Properties of Solid Surface, University of Chicago Press,Chicago, 1953.
26] A.W. Adamson, Physical Chemistry of Surface, Science Press, Beijing, 1985.
29] M. Kotoul, Z. Bilek, International Journal of Pressure Vessels and Piping 44(1990) 291.
30] C.A. Schuh, M. Kumar, W.E. King, Acta Materialia 51 (2003) 687.