arun chockalingam, ms, phd, facc - turkhipertansiyon · deaths from stomach cancer (per 100,000 per...
TRANSCRIPT

IMPORTANCE OF DIETARY SALT RESTRICTION IN THE CONTROL OF HYPERTENSION AND ASSOCIATED
VASCULAR DISEASES
Arun Chockalingam, MS, PhD, FACCSecretary General, World Hypertension League &
Professor of Health Sci., Simon Fraser Univ., Vancouver, Canada
11th Natıonal Conference of Hypertensıon and Renal DıseasesMay 14, 2009 ANTALYA, Turkey
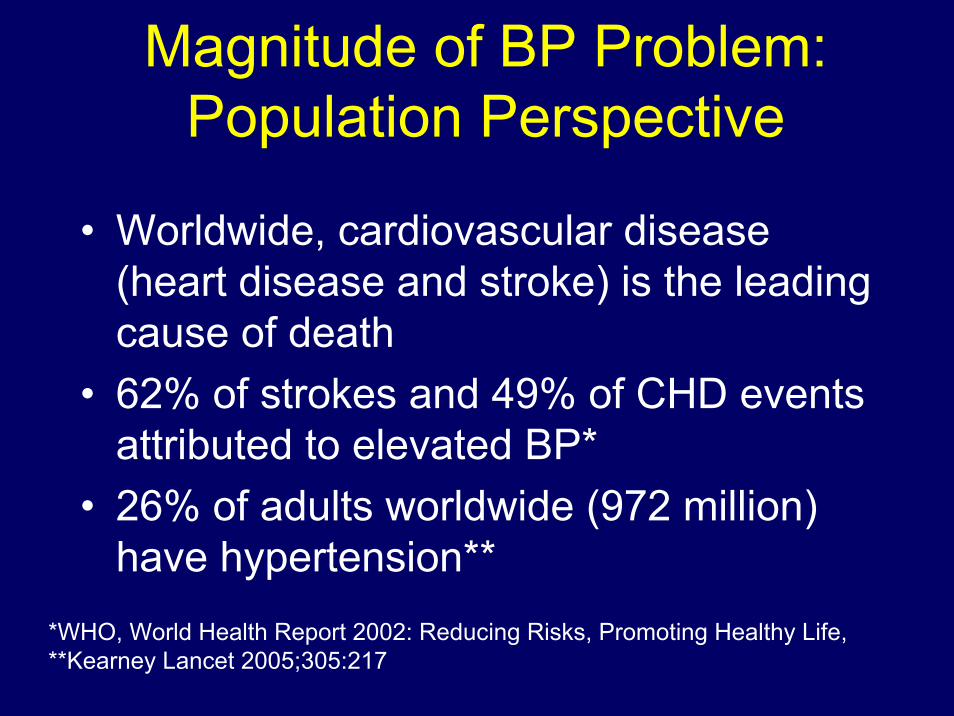
Magnitude of BP Problem:Population Perspective
• Worldwide, cardiovascular disease (heart disease and stroke) is the leading cause of death
• 62% of strokes and 49% of CHD events attributed to elevated BP*
• 26% of adults worldwide (972 million) have hypertension**
*WHO, World Health Report 2002: Reducing Risks, Promoting Healthy Life, **Kearney Lancet 2005;305:217

Systolic Blood Pressure (mmHg)
Heart Deaths16
8
4
2
1
120 125 135 148 168
Risk
120 125 135 148 168
2
4
8
16
32Stroke Deaths
The risk starts at systolic 115 mmHg(83% adults)
Risk
MacMahon et al. Lancet 1990;335:765-74
Systolic BP and Risk of Death

• The lower your blood pressure, the lower your risk of cardiovascular disease (even if you do not have hypertension)
• Your lifetime risk of developing hypertension is 90%*
Magnitude of BP Problem:Individual Perspective
*Vasan, JAMA 2002;287:1003

Ezzati et al. Lancet 2002:360:1347-60.
Underweight
Unsafe sex
High cholesterol
Tobacco
Raised Blood Pressure
0 1 2 3 4 5 6 7
Millions of Deaths
7 million
Developing region
Developed region
Raised BP is responsible for 62% of all Strokes & 49% of all Heart Disease
Major Underlying Factors Causing Death - Worldwide

31.827.5
36.1
0
10
20
30
40
50
Whole group Male Female
Perc
ent (
%)
Hypertension in Turkey-2003
Slide Courtesy of: Dr. Mustafa Arici

What puts up population BP?
• Salt intake
• Lack of fruit and vegetables
• Weight
• Lack of exercise
• (Alcohol excess)
He & MacGregor. JHH 2008 on-line first. doi:10.1038/jhh.2008.144.

Up to 5000 yrs ago 0.1 g/d, now 10 to 12 g/d
Why? Preserves foodCleans up bad food
(a) Refrigeration(b) Better chemicals
Now no need
But eating 10 to 12 g/d - courtesy of the food industry
80% of salt hidden in food
(a)(b)
ProcessedFast Restaurant Canteen
Salt, diet & health. 1998, Camb Uni Press
Salt

Adverse Effects ofAdverse Effects ofExcess Salt IntakeExcess Salt Intake
• Established relationship– Increased blood pressure
• Probable relationship– Gastric cancer
• Suggestive relationship– Increased risk of osteoporosis– Increased left ventricular mass
• Hypothesized relationship– Overweight/obesity
→ Stroke, CVD and CKD

Hypertensive Normotensive
Fall in Systolic BP
(mmHg)
Usual salt intake
Reduced salt intake
Urinary Sodium(mmol/24h)
***
***
P<0.001 reduced salt vs. usual salt intake.
Meta-analysis of Modest Salt Reduction Trials of one month or Longer
He & MacGregor. JHH 2002;16:761-770***
-2
0
-4
-6
100
50
150
0

SBP Slope with Age (mmHg/yr) by Median Na Excretion in 52 Communities Worldwide
INTERSALT BMJ 1988;297:319
0 1,150 2,300 3,450 4,600 5,750-0.4
-0.2
0.0
0.2
0.4
0.6
0.8
1.0
1.2
1.4
Sys
tolic
blo
od
pre
ssu
re s
lop
e w
ith
ag
e(m
m H
g/y
ear)
Median sodium excretion (mg/24h)
Populations with No Rise in SBP with Age

Sodium Dose Response Trials: DASH-Sodium Trial*
120
125
130
135Control Diet
DASH Diet
1.5 (65) 2.4 (106) 3.3 (143)Sodium Level: gm/d (mmol) per day
SystolicBlood
Pressure
+2.1
+1.3+1.7
+4.6+6.7
p<.0001
+3.0P<.0001
*Sacks, 2001 (412 prehypertensive and hypertensive adults)
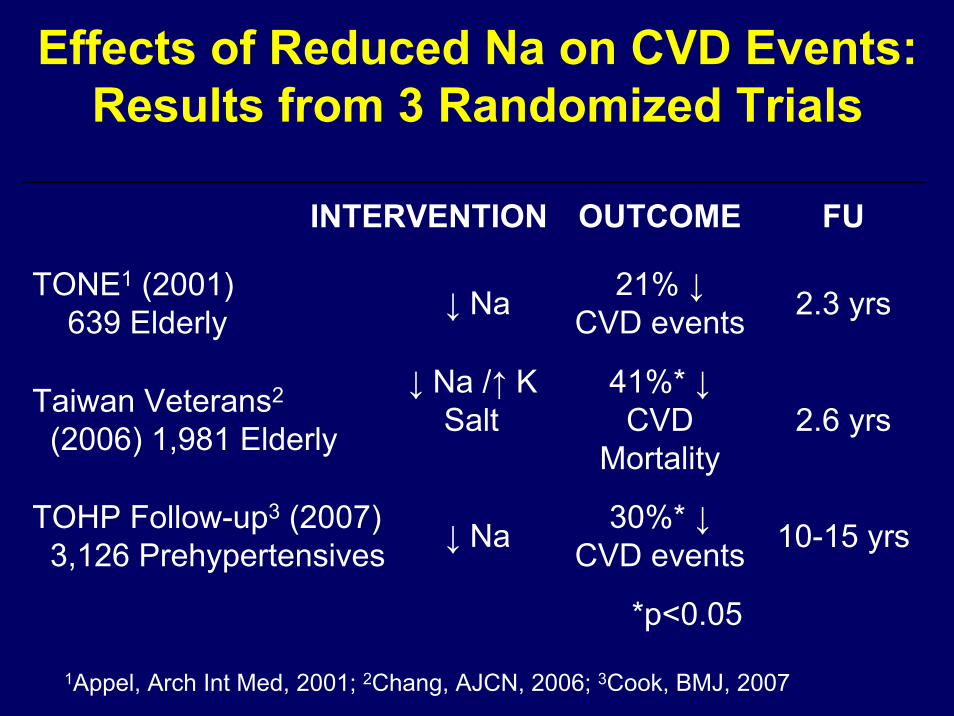
Effects of Reduced Na on CVD Events: Results from 3 Randomized Trials
INTERVENTION OUTCOME FU
TONE1 (2001)639 Elderly ↓ Na 21% ↓
CVD events 2.3 yrs
Taiwan Veterans2
(2006) 1,981 Elderly
↓ Na /↑ K Salt
41%* ↓CVD
Mortality2.6 yrs
TOHP Follow-up3 (2007)3,126 Prehypertensives ↓ Na 30%* ↓
CVD events 10-15 yrs
*p<0.05
1Appel, Arch Int Med, 2001; 2Chang, AJCN, 2006; 3Cook, BMJ, 2007

Deaths fromStomach Cancer
(per 100,000Per year)
Adapted from Joossens, Int J Epi 1996;25:494-504
KOR
r=0.702P<0.001
JAPAN
CHI
POLCOL
HUNPOR
GDR ITASPA
FRG
CAN
FINNET
MALE.W
ARGDENBEL
USA
N.I
MEXTOB
190
170
150
130
110
90
70
50
30
10
06 7 8 9 10 11 12 13 14
Salt Intake (grams/day)
ICE
Salt and Stomach Cancer: Ecological Analysis

Correlation between salt intake and LV mass in pop with SBP >121 mm Hg
Adapted from Kupari P et al J. Circulation, 1994; 89:1041 – 1050

Effects of Sodium Reduction in Children: Results of a Meta-Analysis
He and MacGregor, HTN 2006
• 10 Trials• 966 Children• Mean age=14• Median duration = 20wk• 42% Reduction in Na

Blood Pressure Measured in Adolescence and Young Adults is Associated with Subsequent Cardiovascular Disease
Blood Pressure Associated with:Autopsy Studies - Fatty Streaks1
Observational Studies
- Coronary Artery Calcification2
- Cardiovascular Events3
1Pathologic Determinants of Atherosclerosis in Youth (PDAY)2Coronary Artery Risk Development in Young Adults (CARDIA), Muscatine Study3Harvard, U.Penn, and U.Glasgow Alumni Studies
1Pathologic Determinants of Atherosclerosis in Youth (PDAY)2Coronary Artery Risk Development in Young Adults (CARDIA), Muscatine Study3Harvard, U.Penn, and U.GlasgowAlumni Studies

Turkey: Education level & NaCI (g/d)
p=0.002
Courtesy: Mustafa Arici, SAL Turk Study, 2008

Turkey: Regions & NaCIIntake (g/day)
Mean NaClIntake in Turkey
Courtesy: Mustafa Arici, SAL Turk Study, 2008

Turkey: Obesity & Urinary Na+
(mEq/d)
Mean differences=22.24P=0.003
Courtesy: Mustafa Arici, SAL Turk Study, 2008

Issues Related to Salt Intake
• How much salt do we need?
• How much salt do we consume?
• Where does it come from?
• Does salt intake vary by weight status?

Obligatory Losses of Sodium Obligatory Losses of Sodium (How much salt do we need?)(How much salt do we need?)
Source of Loss mg/dUrine 5 to 35Skin (nonsweating) 25Feces
Cell functioning10 to 125
50
Total 90 to 235Source: Dahl (1958)

Sodium Current consumption & Sodium Current consumption & IOM, WHO Recommendations IOM, WHO Recommendations
• Current Consumption: 4-5 g (average worldwide)
• Upper Limit (UL):2.3 g (100 mmol)/day for adults
Adequate Intake (AI):1.5 g (65 mmol)/day for most adults and at risk population (67%)
For Children:Even less

Table / Cooking (15%)
Natural (5%)
Food industry (80%)
Current salt intake & sources of salt in UK (Similar in USA)
Total 9.5 g/d (3.8 g sodium)
1.4 g/d
0.5 g/d
7.6 g/d
Consumers have little or no choice over their salt consumption
∴
Why is there so much salt in processed food?James et al. Lancet. 1987;1:426-429.

SALT
Producers (40% by value)
Food IndustryHighly Salted Processed Food
Thirst ↑
Soft DrinksMineral Water ↑
Profit
Profit
Dependence on salty taste
(Salt Addiction)
Demand for very salty
foods ↑
Profit
Salt ↑
Salt ↑
Meat products ↑
+ Salt
Salt ↑
Weight ↑No Cost
WaterBinding ↑
Profit
Hidden Salt – Its Commercial Value
He & MacGregor. JHH 2008 on-line first. doi:10.1038/jhh.2008.144.
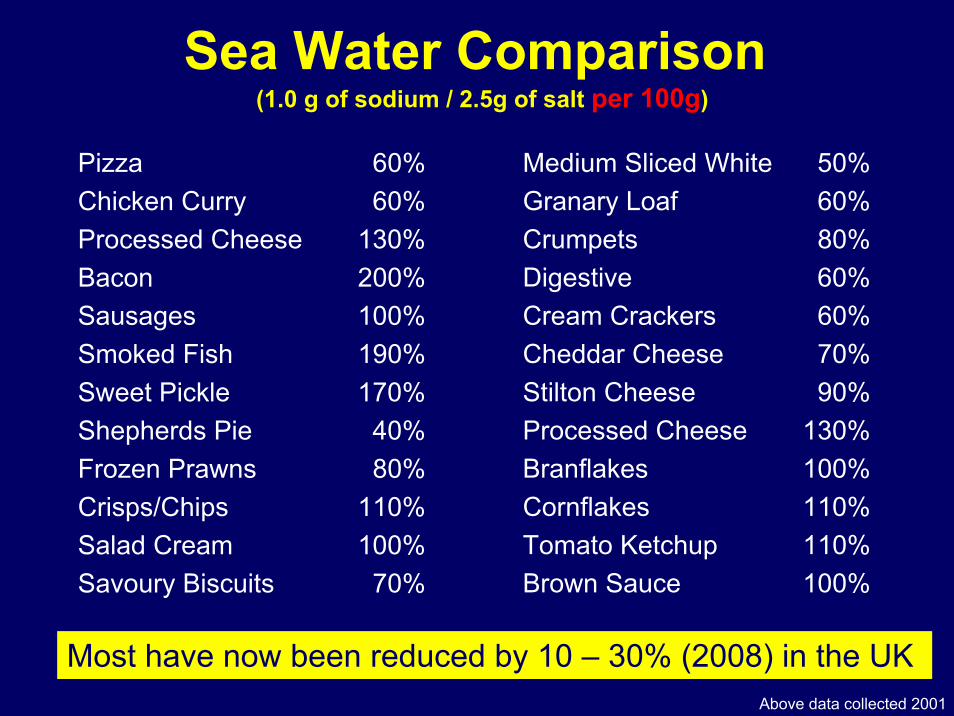
Sea Water Comparison (1.0 g of sodium / 2.5g of salt per 100g)
Pizza 60%Chicken Curry 60%Processed Cheese 130%Bacon 200%Sausages 100%Smoked Fish 190%Sweet Pickle 170%Shepherds Pie 40%Frozen Prawns 80%Crisps/Chips 110%Salad Cream 100%Savoury Biscuits 70%
Medium Sliced White 50%Granary Loaf 60%Crumpets 80%Digestive 60%Cream Crackers 60%Cheddar Cheese 70%Stilton Cheese 90%Processed Cheese 130%Branflakes 100%Cornflakes 110%Tomato Ketchup 110%Brown Sauce 100%
Most have now been reduced by 10 – 30% (2008) in the UK Above data collected 2001

Japan
At this time Japan rapidly Westernisede.g.↑ saturated fat,↑ smoking, ↑ weight, ↓ exercise
1960 Government campaign to reduce salt intake
Akita (North): 18 → 14 g/day (4 g/day ↓ )
Overall: 13.5 → 12.1 g/day (1.4 g/day ↓ )
BP ↓80% ↓ in stroke mortality
Sasaki N. The salt factor in apoplexy and hypertension: epidemiological studies in Japan. In: YamoriY, editor. Prophylactic Approach to Hypertensive Diseases. New York: Raven Press; 1979. p. 467-74.

Year
Salt intake(g/day)
Finland
Diastolic BP(mmHg)
Stroke mortality(1/100000)
Year
Men
Women
Year
Men
Women
Karppanen & Mervaala. Prog Cardiovasc Dis 2006;49:59-75.

National Policy Intervention
““The experience of Finland, which has had a salt The experience of Finland, which has had a salt reduction program running since the late 1970s, reduction program running since the late 1970s, shows that populationshows that population--wide reduction of dietary salt wide reduction of dietary salt leads to populationleads to population--wide reductions in blood wide reductions in blood pressure and parallel reductions in deaths from pressure and parallel reductions in deaths from stroke and heart disease.stroke and heart disease.””
--- Professor Graham MacGregor, Chairman of WASH, 1996
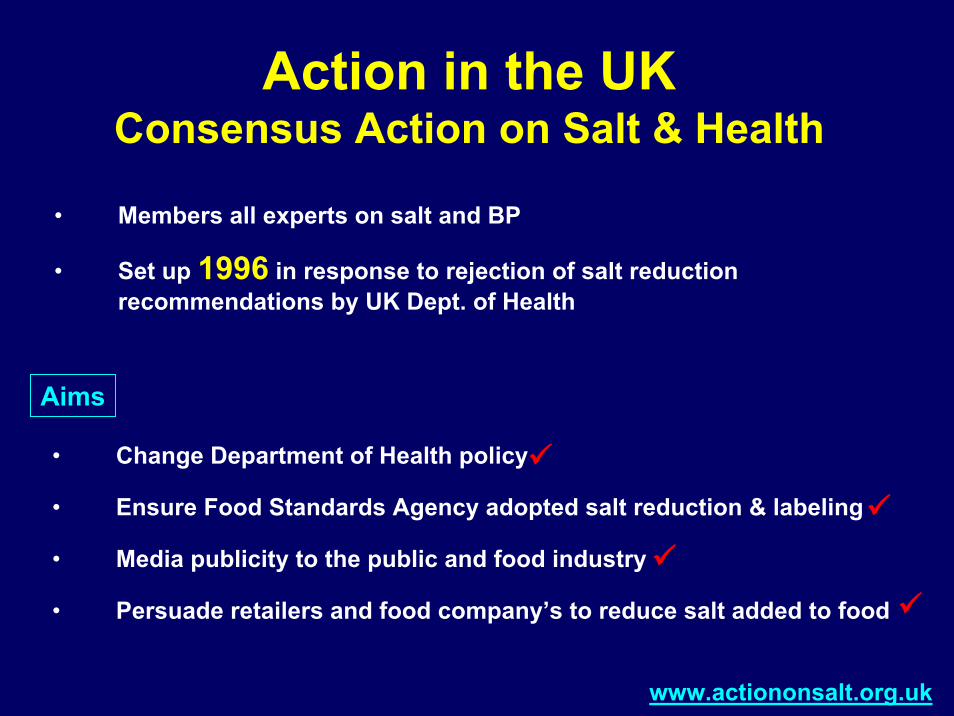
Action in the UKConsensus Action on Salt & Health
• Change Department of Health policy
• Ensure Food Standards Agency adopted salt reduction & labeling
• Media publicity to the public and food industry
• Persuade retailers and food company’s to reduce salt added to food
Aims
www.actiononsalt.org.uk
• Members all experts on salt and BP
• Set up 1996 in response to rejection of salt reduction recommendations by UK Dept. of Health

CASH Strategy for Reducing Salt in UK
Table/Cooking (15%)
Natural (5%)
Food industry (80%)
Salt intake
Total 9.5 g
1.4 g
0.5 g
7.6 g
0.9 g
0.5 g
4.6 g
40% reduction
No reduction
40% reduction
Target 6.0 g
Reduction needed
∴ the food industry needs to reduce salt content of all foods by 40% over the next 5 years
Source g/dayTarget intake
g/day
He & MacGregor. JHH 2008 on-line first. doi:10.1038/jhh.2008.144.

Food Standards Agency (UK)
• Gradual repeated reductions in salt added to foods by 15%-25%
• Processed foods divided into 80 categories with targets set to be reached by the food industry in 2010 and 2012.
• Aim: To reduce salt intake to less than 6 g/d(adults) by 2012
www.food.gov.uk

www.salt.gov.uk
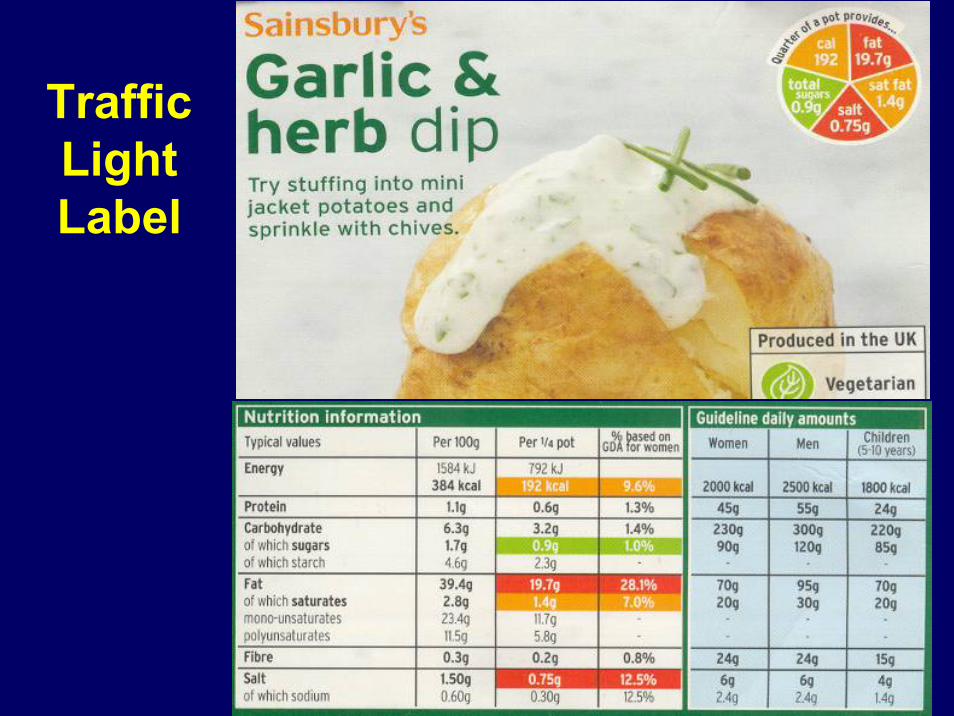
Traffic Light Label

GDA Label

Actions so far: UK
• Most processed foods have or will be reduced by 20-30% by 2010
• More challenging targets have been set to be achieved by 2012
• Foods eaten outside the home are now being addressed (e.g. canteens, restaurants, fast foods, takeaways, etc.)
• Aim: To reduce salt intake to less than 6 g/d (adults) by 2012 [sodium: 2.3 g/d]
He & MacGregor. JHH 2008 on-line first. doi:10.1038/jhh.2008.144.


Success so far UK
24h urinary sodium in a random sample of adult population has been reduced
from the start of the program in 2003 to 2008
from 9.5 to 8.6 g/d of salt (10% ↓)(NB: on the background of an increasing salt intake)
www.food.gov.uk
Approx. 6000 deaths - strokes, CHD prevented / yrHe & MacGregor. Hypertension 2003;42:1093-99

World Action on Salt & Health366 members from 80 countries worldwide
• Worldwide– Highlight foods high in salt– Implement salt reduction – Clear labeling system (traffic light)
• Individual countries– Facilitate expert groups similar to CASH– Convince government and health dept. & ensure action by food industry– Public health campaign to ↓ salt consumption
www.worldactiononsalt.com
Target: ↓ Salt intake worldwide to 5g/d (WHO)

Example sodium content around the world
USA Canada UK Australia
• McDonalds ‘Big Mac’(Sodium (mg) per portion) 1,040 1,020 840 960
• Subway ‘Italian BMT Sub’(Sodium (mg) per portion) 1,770 1,670 1,700 1,470
• KFC ‘Fillet Burger’(Sodium (mg) per portion) 1,230 1,250 1,200 1,265
• Kellogg’s ‘Rice Krispies’(Sodium (mg) /100g) 667 821 650 720
Source: Product websites 2009

WHO and EU Actions
WHO set up a Salt Action Network (SAN)
– To implement the EU framework for National Salt Initiatives
– The goal → ↓ salt intake less than 6 g/day
– Initial activity - 12 food categories, e.g. bread, ready meals, breakfast cereals
24 countries now pledged to make a 16% salt reduction over 4 yrs
WHO Europe. http://test.cp.euro.who.int/eprise/main/WHO/Progs/NUT/ActionPlan/20080516_1

Examples of actions in other countries• Australia AWASH’s Public Health campaign starting to show results
• Bangladesh National reduction supported by the National Heart Foundation
• Bulgaria Monitoring and evaluating programme for salt reduction initiatives
• Canada The Canadian Stroke Network has a full scale public health campaign
• Croatia CRASH: full national awareness campaign
• Kenya Forming a Kenyan arm on WASH following a successful campaign
• Malta Launched a salt reduction initiative • Turkey Initiated SAL Turk Study
• USA Have had strong recommendations since 1980s, with no results» Salt Institute opposed any action (similar to Tobacco Manufactures
Association) » FDA Petition for salt as ‘Generally recognised as safe’ to an
‘additive’ has so far proved ineffective.» NEW YORK CITY: Major Actions – Great Results!!!www.worldactiononsalt.com

1. ↓Salt intake ↓BP
2. ↓ Salt intake biggest improvement in public health since clean water and drains (19th Century)
Achievements in UK↓ Stroke↓ Heart Attacks↓Heart Failure↓ Kidney Diseases
↓ Stomach Cancer & Osteoporosis
He & MacGregor. A comprehensive review on salt and health and current experience of worldwide salt reduction programmes. JHH 2008 on-line first. doi:10.1038/jhh.2008.144.

Useful ConversionsUseful Conversions
Adequate Intake (AI)
Upper Level (UL)
Sodium (mg) 1,500 2,300Sodium (mmol) 65 100
Sodium Chloride (g)[Salt]
3.75 5.75
Convertion: 1000 mg salt = 400 mg Sodium or 40%

Sodium Reduction Stands Apart As An Effective Public Health Intervention
• Principal cause of elevated blood pressure• Amenable to intervention without
substantial:• Behavioral change• Massive educational campaign
• Low cost to implement
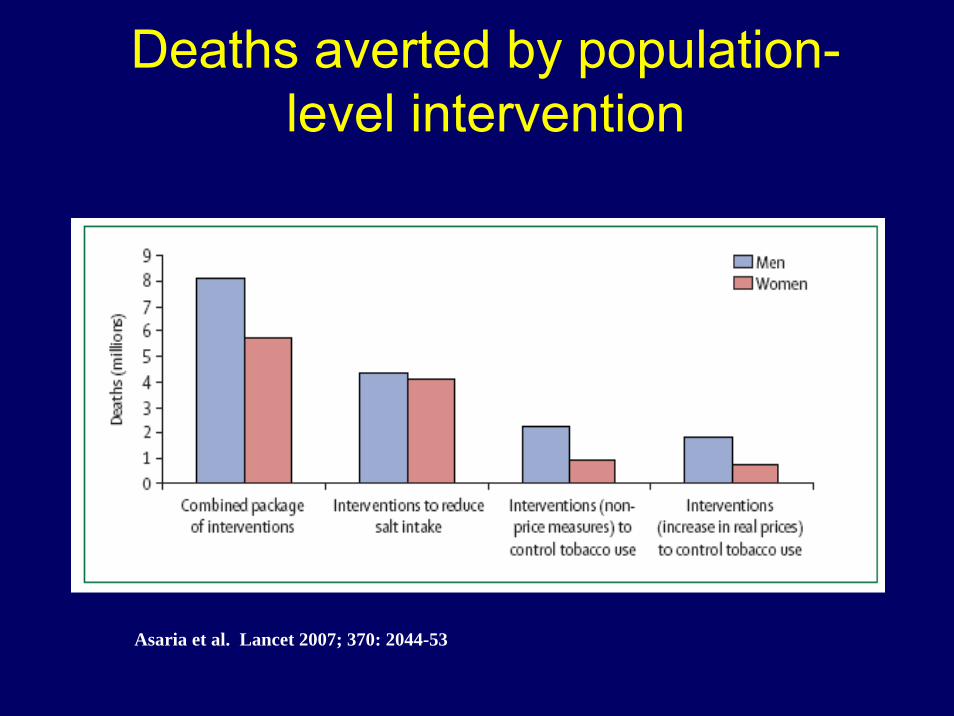
Deaths averted by population-level intervention
Asaria et al. Lancet 2007; 370: 2044-53

Salt & tobacco reduction: Estimated Deaths averted/100K
pop (2006-15)
Asaria et al. Lancet 2007; 370: 2044-53 Population older than 30 yrs of age

Cost to implement the package of intervention
Asaria et al. Lancet 2007; 370: 2044-53

Key messages
• 23 countries have 80% of burden of CNCD in LMI regions of the world.
• In these countries 13.8 m deaths could be averted over 10 yrs (8.5 m by salt reductionand 5.5 by implementing FCTC)
• Most deaths averted would be from CVD (75.6%) followed by Resp dis (15.4%) and cancer (8.7%).
• Cost to implement both strategies would be $ 0.4 in LMIC and $ 0.5-1.0 in UMIC (as of 2005).
Asaria et al. Lancet 2007; 370: 2044-53

Summary
• Worldwide, elevated blood pressure is the leading cause of mortality
• A reduced salt intake lowers blood pressure• The estimated benefits of salt reduction are
substantial and warrant major public health efforts to reduce salt intake


Thank YOUThank YOU