arxiv:astro-ph/0307383v1 22 jul 2003 - arxiv.org e …astro-ph/0307383v1 22 jul 2003 from globular...
TRANSCRIPT
arX
iv:a
stro
-ph/
0307
383v
1 2
2 Ju
l 200
3
From Globular Clusters to Tidal Dwarfs: Structure Formation in
the Tidal Tails of Merging Galaxies1
Karen A. Knierman2, Sarah C. Gallagher3, Jane C. Charlton, Sally D. HunsbergerDepartment of Astronomy and Astrophysics
The Pennsylvania State University
University Park PA 16802
kak, gallsc, charlton, [email protected]
Bradley WhitmoreSpace Telescope Science Institute
3700 San Martin Drive
Baltimore, MD 21218
Arunav KunduPhysics and Astronomy Dept
Michigan State University
East Lansing, MI 48824
J. E. HibbardNational Radio Astronomy Observatory
520 Edgemont Road
Charlottesville, VA 22903
and
Dennis ZaritskySteward Observatory
University of Arizona
Tucson, AZ 85721
ABSTRACT
Using V and I images obtained with the Wide Field Planetary Camera 2 (WFPC2) of theHubble Space Telescope, we investigate compact stellar structures within tidal tails. Six regions oftidal debris in the four classic “Toomre Sequence” mergers: NGC 4038/39 (“Antennae”), NGC3256, NGC 3921, and NGC 7252 (“Atoms for Peace”) have been studied in order to explore howthe star formation depends upon the local and global physical conditions. These mergers samplea range of stages in the evolutionary sequence and tails with and without embedded tidal dwarfgalaxies. The six tails are found to contain a variety of stellar structures, with sizes rangingfrom those of globular clusters up to those of dwarf galaxies. From V and I WFPC2 images,we measure the luminosities and colors of the star clusters. NGC 3256 is found to have a largepopulation of blue clusters (0.2 . V − I . 0.9), particularly in its Western tail, similar to thosefound in the inner region of the merger. In contrast, NGC 4038/39 has no clusters in the observedregion of the tail, only less luminous point sources likely to be individual stars. NGC 3921 andNGC 7252 have small populations of clusters along their tails. A significant cluster populationis clearly associated with the prominent tidal dwarf candidates in the eastern and western tailsof NGC 7252. The cluster–rich Western tail of NGC 3256 is not distinguished from the othersby its dynamical age or by its total H i mass. However, the mergers that have few clusters inthe tail all have tidal dwarf galaxies, while NGC 3256 does not have prominent tidal dwarfs.We speculate that star formation in tidal tails may manifest itself either in small structures likeclusters along the tail or in large structures such as dwarf galaxies, but not in both. Also, NGC3256 has the highest star formation rate of the four mergers studied, which may contribute tothe high number of star clusters in its tidal tails.
Subject headings: galaxies:individual(NGC 4038/39, NGC 3256, NGC 3921, NGC 7252) — galax-ies:interactions — galaxies:star clusters
1
1. Introduction
There is growing evidence that massive youngcompact star clusters form in many different en-vironments. Old globular clusters, like those seenin the Milky Way galaxy, presumably form in theearly stages of galaxy formation. Recently, youngcompact clusters were discovered to be forming inseveral environments: starburst galaxies (Meureret al. 1995), barred galaxies (Barth et al. 1995),some spiral disks (Larsen & Richtler 1999), theinner regions of mergers (Holtzman et al. 1992;Whitmore et al. 1993; Schweizer et al. 1996;Miller et al. 1997; Whitmore et al. 1999; Zepfet al. 1999) and in the space between galaxiesin compact groups (Gallagher et al. 2001). Find-ing common characteristics between these environ-ments may allow us to identify the mechanism thatcauses gas clouds to collapse and efficient star for-mation to begin (e.g., Jog & Solomon 1992). Also,there may be differences from environment to en-vironment that lead to different types of “pack-aging” of new stars, from isolated stars, to smallgroups, to globular clusters, to stellar associations,to dwarf galaxies. To understand the underlyingconditions responsible for the formation of thesestructures, it is important to identify the differentenvironments in which they form.
Star clusters tend to form wherever vigorousstar formation occurs and, especially, in star-bursts triggered by galaxy interactions and merg-ers (Schweizer 1998). Studies with Hubble Space
Telescope (HST) of several mergers and mergerremnants show a large number of young clusters inthe inner regions of the galaxies (Whitmore et al.1993; Whitmore & Schweizer 1995; Schweizer et al.1996; Miller et al. 1997; Whitmore et al. 1999;Zepf et al. 1999). The clusters have effective radiicomparable to, but perhaps slightly larger than,the old globular clusters in the Milky Way. Theirluminosity functions are best described as powerlaws (α ∼ −2) when expressed as the number of
1Based in part on observations obtained with theNASA/ESA Hubble Space Telescope, which is operated bythe STScI for the Association of Universities for Researchin Astronomy, Inc., under NASA contract NAS5–26555.
2Now at Steward Obs., Univ. of Arizona, Tucson, AZ85721; [email protected]
3Now at Center for Space Research, Massachusetts In-stitute of Technology, 77 Massachusetts Avenue, Cam-bridge, MA 02139; [email protected]
clusters per luminosity bin. While this is sim-ilar to the luminosity function of globular clus-ters in the Milky Way for masses greater than∼ 105 M⊙(Harris & Pudritz 1994), merging galax-ies have many more low mass clusters than foundin galaxies with old globular cluster populations.This disparity could indicate a difference in thecluster formation process in primordial galaxies ascompared to modern merger remnants, or it couldsimply indicate that evolution of the luminosityfunction has occurred due to fading and selectivedisruption (Zhang & Fall 1999).
Bridges and tails may also form during strongtidal interactions involving disk galaxies (Toomre& Toomre 1972; Barnes 1988). These tidal fea-tures have blue UBV R colors (e.g., B − V =0.53 ± 0.13 from Schombert, Wallin, & Struck–Marcell 1990; see also Weilbacher et al. 2000), andregions of [O ii] and Hα line emission have beenfound within the tails (Schweizer 1978; Mirabel,Dottori, & Lutz 1992; Duc & Mirabel 1998, 1999;Iglesias-Paramo & Vilchez 2001; Weilbacher, Duc,& Fritze-v.Alvensleben 2003). The inferred agesof the young stars and giant H ii regions are muchless than the dynamical age of the tails, indicatingthat star formation is occurring within the tails.
Several factors may influence star formationwithin tidal tails. First, the stage of the mergermay be important. Secondly, 21–cm neutral hy-drogen (H i) observations indicate that tails are gasrich (Yun, Ho, & Lo 1994; Hibbard et al. 2001b),and the evolution of the H i may play a role inthe star formation history. Many tidal tails haveassociated H i which is falling back toward the cen-ter into the remnant. This infall of gas may en-able star formation to continue for time scales onthe order of 1 Gyr after tail formation (Hibbard& Mihos 1995). Finally, tidal dwarf galaxies arefound in tidal tails in a variety of environments,particularly at the ends of the tails (Mirabel, Dot-tori, & Lutz 1992; Duc & Mirabel 1994; Huns-berger, Charlton, & Zaritsky 1996). These sametails that form tidal dwarfs may or may not formsmaller stellar structures such as star clusters. Re-cent results from the early release observations ofthe Advanced Camera for Surveys (ACS) on HSThave shown young star clusters in the tidal tails ofUGC 10214 (“The Tadpole”) (Tran et al. 2003;de Grijs et al. 2003) and NGC 4676 (“The Mice”)(de Grijs et al. 2003).
2
This paper focuses on the occurrence of starclusters in the tidal tails of merging galaxies. NewV and I–band observations of the tidal tails offour merging pairs obtained with HST/WFPC2are presented. These are compared with previ-ous observations of the inner regions of the samegalaxies, and to each other, in order to considerthe factors that influence the nature of the stellarsystems that form in the tails. The four mergerschosen for this study span a range of dynamicalstates and tails with and without embedded tidaldwarf galaxies.
The four systems in this study were chosenfrom the “Toomre Sequence” (Toomre 1977) ofongoing mergers. This sequence is an opticallyselected ensemble of strongly interacting galax-ies representing a suggested evolutionary sequenceof disk–disk mergers, based on their stellar tidaltail lengths and the separation of the two nu-clei (Toomre 1977). The four systems chosen forthis study span the entire range of the sequence,from strongly disturbed, but separate, disks likelyto merge (NGC 4038/39, “The Antennae”), tonearly fully merged disks (NGC 3256), to fullymerged systems with single nuclei and relaxed stel-lar profiles (NGC 3921 and NGC 7252, “Atoms forPeace”).
In the following, Section 2 describes the HSTobservations, their reduction, and object selectionand photometry. Section 3 presents the four merg-ers, with separate subsections describing the ob-servations, the inner regions, the results, and adiscussion for each. Section 4 then compares theresults for the different mergers and summarizesthe main conclusions.
2. Observations and Reductions
2.1. Observations
Observations of six tidal tails were obtainedwith HST/WFPC2 during the period Nov. 1998to Oct. 1999, as listed in the journal of observa-tions in Table 1. Total integration times rangedfrom 1000–2000 s in V (F555W filter) and in I(F814W filter). The integrations were chosen toobtain images to a depth similar to the observa-tions of the inner regions. A gain of 7e−/DN wasused in all cases. At least two separate exposuresin each filter were obtained to facilitate removal ofcosmic rays. The positions of the WFPC2 field of
view is superimposed on optical images of the fourmergers in Figure 1. The six V –band images arepresented in Figures 2 – 7.
Pairs of exposure were taken of all systems ex-cept NGC 3256. The exposures were offset by0.25′′ (i.e. 2.5 pixels on the Wide Field Camera[hereafter WF] and 5.5 pixels on the PlanetaryCamera [hereafter PC]). Pipeline–reduced imagesfor each filter were averaged and cleaned usingthe IRAF4 tasks GCOMBINE. The tasks COS-MICRAYS was used to remove hot pixels.
2.2. Object Detection
Objects in the images were detected using theDAOFIND task in the DAOPHOT package usinga threshold of 2.0 counts per object, finding ob-jects greater than 2σ above the local sky back-ground. The noise was determined from the skyannulus of 5 to 8 pixels around each object identi-fied by DAOFIND and only objects with a signal–to–noise per object greater than 3 were retained.For images with multiple exposures, the objectswere detected separately in each pointing. Thenthe two source lists were matched using the offsetscalculated from bright stars. Only those sourceswith detections in both the V and I filters wereretained.
Only point–like sources are of interest in thispaper, as extended objects will be addressed in afuture study. In addition to possible star clus-ters, this method detects foreground stars andcompact background galaxies. We use a classifi-cation based upon the V − I color and a struc-tural parameter. To obtain a sample of possi-ble star clusters, we keep only those sources withV − I < 2.0. Old, metal-poor globular clustersin the Milky Way have V − I ∼ 1 (Reed, Hesser,& Shawl 1988), so this cut would not exclude oldclusters. The most metal–rich clusters, from ob-servations of the Milky Way and nearby ellipticalgalaxies, have V − I < 1.5 (Peterson 1993; Ajhar,Blakeslee, & Tonry 1994; Whitmore et al. 1995;Kundu & Whitmore 2001a,b). Stellar populationmodels by Lee, Lee, & Gibson (2002) which takeinto account the effect of the horizontal branchon colors show that even solar metallicity globular
4IRAF is distributed by the National Optical AstronomyObservatories, which are operated by AURA, Inc., undercontract to the NSF.
3
clusters only have V − I ∼ 1.2−−1.3. Also, onlythose sources with Verr < 0.25 were retained.
As in Whitmore et al. (1993) and Miller et al.(1997), we calculated the concentration index, thedifference in V magnitude between an aperture of0.5 pixel radius and an aperture of 3.0 pixel ra-dius, denoted by ∆V (0.5− 3). A sky annulus of 6to 9 pixels was used to subtract the background.For each system, we used a different concentra-tion index. In the NGC 3256 images, we classi-fied objects with ∆V (0.5− 3) > 2.4 as diffuse andremoved them from the sample. The cutoff forthe concentration index was raised to 3.0 for NGC4038/39, the closest system, to avoid eliminatingany possible clusters.
For NGC 3921 and NGC 7252, we modified theabove photometry method to probe deeper appar-ent magnitudes for comparison with the centralregions and larger sized objects, such as the stel-lar associations found close to the central regionsof NGC 3921 (Schweizer et al. 1996). For theseimages we used DAOFIND with the threshold setat 1.5 rather than 2.0 as above. The signal-to-noise was calculated again, this time using a cutoffof 1.5 per object. As above, we retained sourceswith V − I < 2.0 and Verr < 0.25. There was nocutoff for concentration index. By removing thesize criteria for objects in these mergers, we re-tained more diffuse sources which we could com-pare with the stellar associations from Schweizeret al. (1996).
For each tail, a region in the V –band image wasmanually identified as ”in-tail”, corresponding tocontiguous regions with ∼ 1 count (DN) abovethe background (corresponding to a V magnitudesurface brightness of 24.3− 25.7 mag arcsec−2 ac-cording to the specific tail). All other regions weredesignated as ”out-of-tail”. In Figures 2–7, ”in-tail” point sources are indicated by open circles,while ”out-of-tail” point sources are indicated byopen squares.
2.3. Completeness
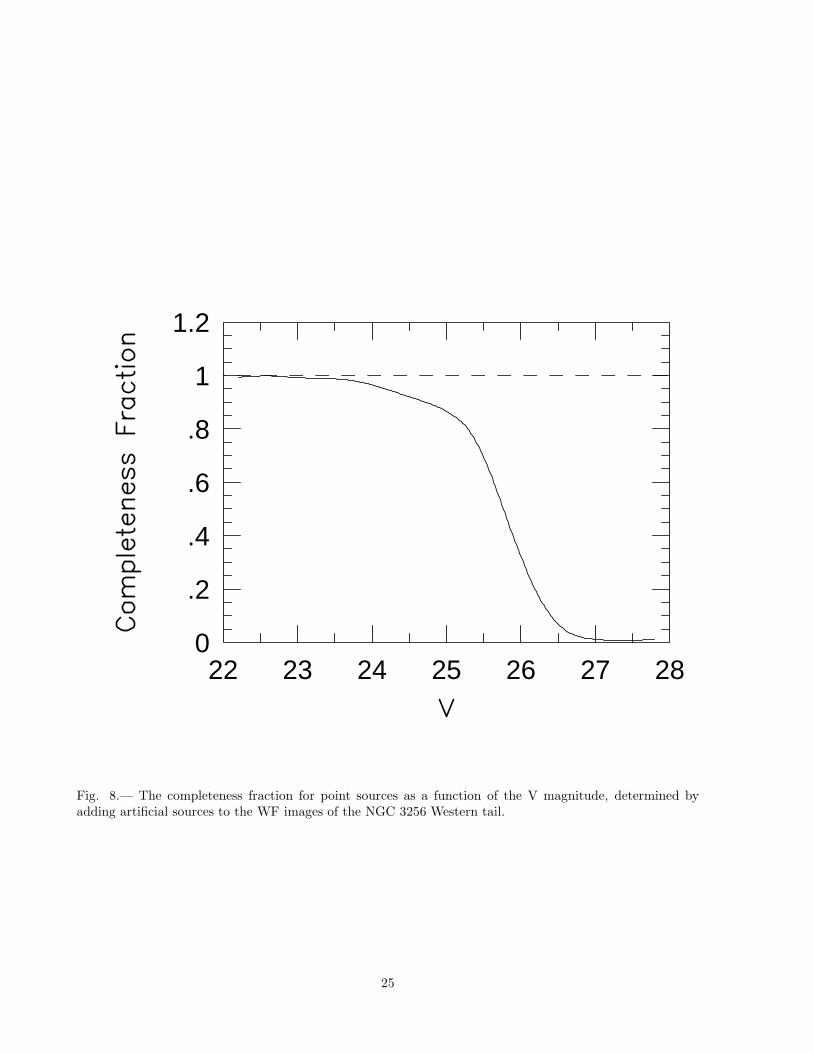
Figure 8 shows the completeness fraction onthe wide–field chips for the observations of NGC3256W. The completeness was determined byadding 10, 000 stars (100 at a time to avoid crowd-ing) using the ADDSTAR program within theDAOPHOT package. The surface brightness of
the tail is so low (∼ 1 DN above the background)that a single background level is sufficient for char-acterizing the completeness fractions, rather thanthe multiple curves used in other studies witha wide variety of backgrounds (Whitmore et al.1999, e.g.,). We find that the completeness frac-tion reaches ∼ 50% at V = 25.8, or 25.4 correctedfor foreground extinction, consistent with our vi-sual estimate of the completeness correction fromthe color magnitude diagram for NGC 3256W (seeFigure 11). Comparison of the color magnitude di-agrams indicates that the completeness limits forNGC 3921 and NGC 4038/39 are similar to thatfor NGC 3256. For NGC 7252, our slightly relaxeddetection criterion (see § 2.2) yields a slightlydeeper completeness limit, by ∼ 0.2 magnitudes.
For several reasons, few sources were detectedon the PC chip in any of the fields (8 in the NGC3256W PC, 2 in the NGC 3256E PC, and none inany others). First, the fields were positioned formaximal total coverage of the tail regions, fromwhich it follows that the tails do not pass throughthe PC chip. Second, the area covered by the PCchip is smaller than a single WF chip. Finally,in the PC chip the light is spread over a largernumber of pixels, but the read noise is the sameper pixel. We are working in a regime where readnoise is important, thus the detection limit is notas faint for the PC as for the WF (see Whitmoreet al. (1999) for a similar comparison). There-fore, only WF observations will be discussed inthis study. PC sources have not been plotted inFigures 2–7.
2.4. Photometry
Photometric zeropoints were adopted from Ta-ble 28.1 of Version 3 of the HST Data Handbook
(Voit 1997). The Holtzman et al. (1995) photo-metric transformation corrections were applied (toconvert from the HST filter system to Johnson–Cousins).
Aperture photometry was performed on allpointlike objects in the cleaned images using thePHOT task in the APPHOT package. The radiiof the object aperture, the inner boundary of thebackground annulus, and the outer boundary were2/5/8 pixels for the WF. For all fields, the aperturecorrections V = 0.28 and I = 0.31 were adopted.These were an average of those derived for stars inthe three WF chips for NGC 1700 and NGC 3610
4
(Whitmore et al. 1997), which were calibratedusing point sources in the NGC 5139 (ωCen) andNGC 6752 fields. Ideally, we would have usedcluster candidates in our own fields to determineaperture corrections, however this procedure wassubject to large uncertainties due to a lack of suf-ficiently bright sources. For the best case, WF2in the NGC 3256W image, nine bright stars wereused to determine corrections of 0.276 ± 0.014 inV and 0.293 ± 0.006 in I. These are consistentwith our adopted values. For the nearest pair,using stellar aperture corrections (instead of clus-ters) introduce a systematic error of only a couplehundredths of a magnitude, insignificant for thepurpose of this study.
The foreground extinction due to the Galaxywas corrected for each pair using the AB valuesfrom Schlegel, Finkbeiner, & Davis (1998) and thereddening curve from Mathis (1990). The AB val-ues for each merger are listed in Table 2. We cor-rected for non–optimal charge–transfer efficiency(CTE) using the formulae of Whitmore, Heyer, &Casertano (1999).
3. The Four Merging Pairs
For each of the mergers we will summarize pastobservations of the inner regions, present new HSTobservations, and discuss our results. Figure 1shows optical images of the four mergers, withH i contours, and with the locations of the sixobserved WFPC2 fields superimposed. Table 2presents a comparison of tail properties includ-ing velocity of merger, distance modulus, extinc-tion in B magnitudes(AB), length from the cen-tral region along the tail to the position where theimage begins (l), physical scale of tail region en-compassed in the image (∆l), absolute magnitudefor 50% completeness limit (MV,50%), H i mass oftail (MHI,tail), and the approximate age of tail(the projected length of the tail divided by therotational or escape velocity). The mergers arediscussed in increasing order of their place in theToomre Sequence.
3.1. NGC 4038/39 (“The Antennae”)
The Antennae is one of the best known and ear-liest modeled merger systems (Toomre & Toomre1972; van der Hulst 1979). It is the nearestof the four mergers in this study (see Table 2).
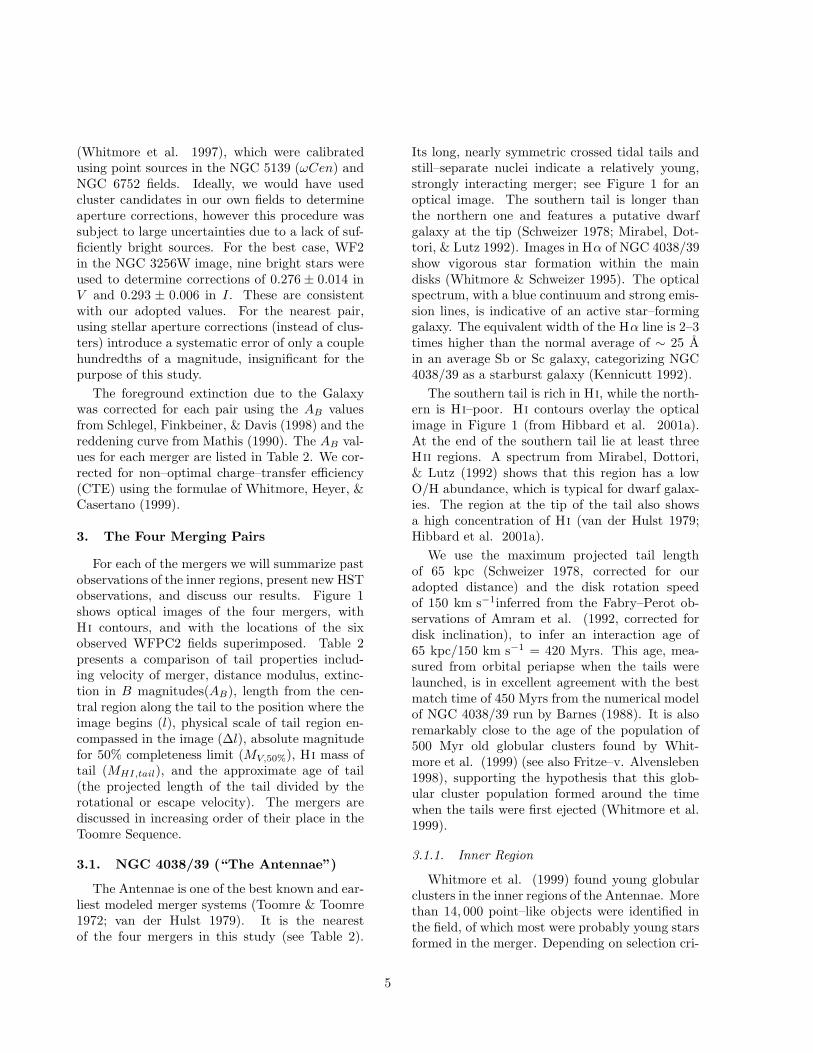
Its long, nearly symmetric crossed tidal tails andstill–separate nuclei indicate a relatively young,strongly interacting merger; see Figure 1 for anoptical image. The southern tail is longer thanthe northern one and features a putative dwarfgalaxy at the tip (Schweizer 1978; Mirabel, Dot-tori, & Lutz 1992). Images in Hα of NGC 4038/39show vigorous star formation within the maindisks (Whitmore & Schweizer 1995). The opticalspectrum, with a blue continuum and strong emis-sion lines, is indicative of an active star–forminggalaxy. The equivalent width of the Hα line is 2–3times higher than the normal average of ∼ 25 Ain an average Sb or Sc galaxy, categorizing NGC4038/39 as a starburst galaxy (Kennicutt 1992).
The southern tail is rich in H i, while the north-ern is H i–poor. H i contours overlay the opticalimage in Figure 1 (from Hibbard et al. 2001a).At the end of the southern tail lie at least threeH ii regions. A spectrum from Mirabel, Dottori,& Lutz (1992) shows that this region has a lowO/H abundance, which is typical for dwarf galax-ies. The region at the tip of the tail also showsa high concentration of H i (van der Hulst 1979;Hibbard et al. 2001a).
We use the maximum projected tail lengthof 65 kpc (Schweizer 1978, corrected for ouradopted distance) and the disk rotation speedof 150 km s−1inferred from the Fabry–Perot ob-servations of Amram et al. (1992, corrected fordisk inclination), to infer an interaction age of65 kpc/150 km s−1 = 420 Myrs. This age, mea-sured from orbital periapse when the tails werelaunched, is in excellent agreement with the bestmatch time of 450 Myrs from the numerical modelof NGC 4038/39 run by Barnes (1988). It is alsoremarkably close to the age of the population of500 Myr old globular clusters found by Whit-more et al. (1999) (see also Fritze–v. Alvensleben1998), supporting the hypothesis that this glob-ular cluster population formed around the timewhen the tails were first ejected (Whitmore et al.1999).
3.1.1. Inner Region
Whitmore et al. (1999) found young globularclusters in the inner regions of the Antennae. Morethan 14, 000 point–like objects were identified inthe field, of which most were probably young starsformed in the merger. Depending on selection cri-
5
teria, the number of young compact star clustersis between 800 and 8000. Remaining sources areindividual supergiant stars, also in the Antennae.The luminosity function is composed of two powerlaw segments with a bend at MV ∼ −10.4. Themedian effective radius of the young clusters is4 ± 1 pc, just slightly larger than the 3 pc radiusfor Milky Way globular clusters (van den Bergh1996). The ages of the young clusters range fromless than 5 Myr up to 100 Myr. There are alsopopulations of intermediate age (500 Myr) and ofold globular clusters (Whitmore et al. 1999).
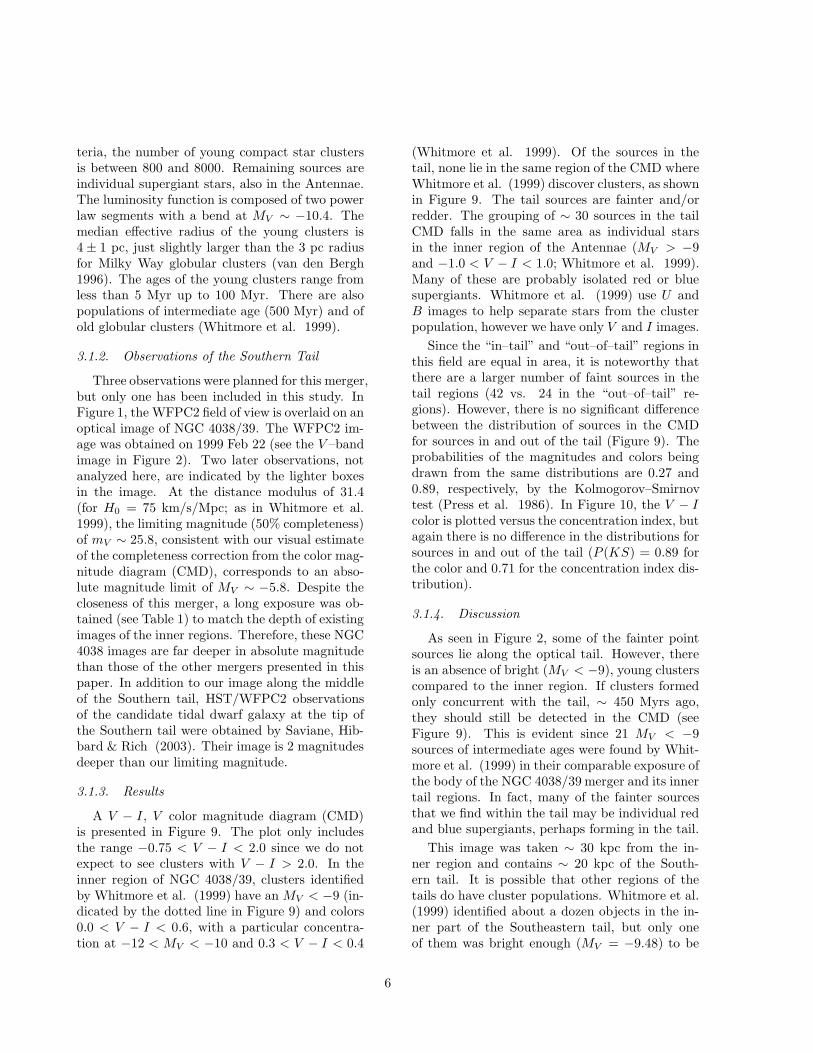
3.1.2. Observations of the Southern Tail
Three observations were planned for this merger,but only one has been included in this study. InFigure 1, the WFPC2 field of view is overlaid on anoptical image of NGC 4038/39. The WFPC2 im-age was obtained on 1999 Feb 22 (see the V –bandimage in Figure 2). Two later observations, notanalyzed here, are indicated by the lighter boxesin the image. At the distance modulus of 31.4(for H0 = 75 km/s/Mpc; as in Whitmore et al.1999), the limiting magnitude (50% completeness)of mV ∼ 25.8, consistent with our visual estimateof the completeness correction from the color mag-nitude diagram (CMD), corresponds to an abso-lute magnitude limit of MV ∼ −5.8. Despite thecloseness of this merger, a long exposure was ob-tained (see Table 1) to match the depth of existingimages of the inner regions. Therefore, these NGC4038 images are far deeper in absolute magnitudethan those of the other mergers presented in thispaper. In addition to our image along the middleof the Southern tail, HST/WFPC2 observationsof the candidate tidal dwarf galaxy at the tip ofthe Southern tail were obtained by Saviane, Hib-bard & Rich (2003). Their image is 2 magnitudesdeeper than our limiting magnitude.
3.1.3. Results
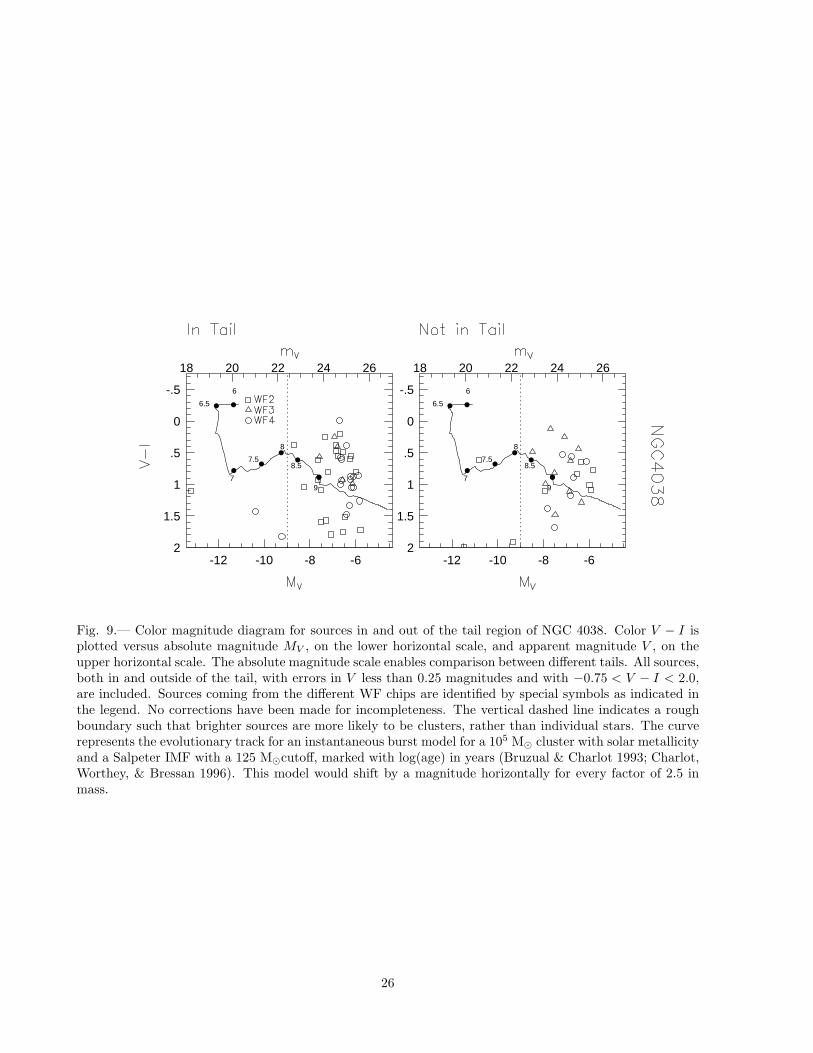
A V − I, V color magnitude diagram (CMD)is presented in Figure 9. The plot only includesthe range −0.75 < V − I < 2.0 since we do notexpect to see clusters with V − I > 2.0. In theinner region of NGC 4038/39, clusters identifiedby Whitmore et al. (1999) have an MV < −9 (in-dicated by the dotted line in Figure 9) and colors0.0 < V − I < 0.6, with a particular concentra-tion at −12 < MV < −10 and 0.3 < V − I < 0.4
(Whitmore et al. 1999). Of the sources in thetail, none lie in the same region of the CMD whereWhitmore et al. (1999) discover clusters, as shownin Figure 9. The tail sources are fainter and/orredder. The grouping of ∼ 30 sources in the tailCMD falls in the same area as individual starsin the inner region of the Antennae (MV > −9and −1.0 < V − I < 1.0; Whitmore et al. 1999).Many of these are probably isolated red or bluesupergiants. Whitmore et al. (1999) use U andB images to help separate stars from the clusterpopulation, however we have only V and I images.
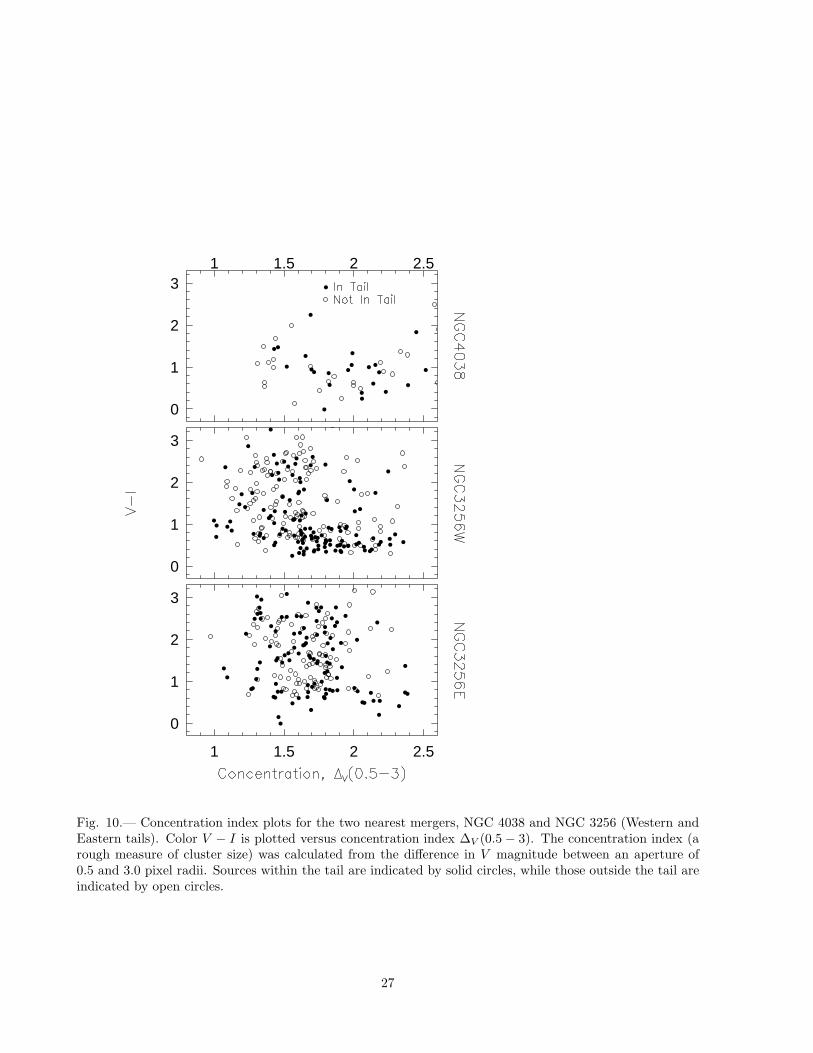
Since the “in–tail” and “out–of–tail” regions inthis field are equal in area, it is noteworthy thatthere are a larger number of faint sources in thetail regions (42 vs. 24 in the “out–of–tail” re-gions). However, there is no significant differencebetween the distribution of sources in the CMDfor sources in and out of the tail (Figure 9). Theprobabilities of the magnitudes and colors beingdrawn from the same distributions are 0.27 and0.89, respectively, by the Kolmogorov–Smirnovtest (Press et al. 1986). In Figure 10, the V − Icolor is plotted versus the concentration index, butagain there is no difference in the distributions forsources in and out of the tail (P (KS) = 0.89 forthe color and 0.71 for the concentration index dis-tribution).
3.1.4. Discussion
As seen in Figure 2, some of the fainter pointsources lie along the optical tail. However, thereis an absence of bright (MV < −9), young clusterscompared to the inner region. If clusters formedonly concurrent with the tail, ∼ 450 Myrs ago,they should still be detected in the CMD (seeFigure 9). This is evident since 21 MV < −9sources of intermediate ages were found by Whit-more et al. (1999) in their comparable exposure ofthe body of the NGC 4038/39 merger and its innertail regions. In fact, many of the fainter sourcesthat we find within the tail may be individual redand blue supergiants, perhaps forming in the tail.
This image was taken ∼ 30 kpc from the in-ner region and contains ∼ 20 kpc of the South-ern tail. It is possible that other regions of thetails do have cluster populations. Whitmore et al.(1999) identified about a dozen objects in the in-ner part of the Southeastern tail, but only oneof them was bright enough (MV = −9.48) to be
6
definitively identified as a cluster. Our additionalobservations include the Northern tail, which hasless H i by a factor of five (van der Hulst 1979;Hibbard et al. 2001a), and another region in theSouthern tail which is closer to the inner region.These images provide the opportunity to study thedistribution of clusters in the tail and the rela-tionship of the H i content to the characteristicsof the cluster population. The candidate tidaldwarf galaxy at the tip of the Southern tail has8 extended young star clusters, 5 of which arebrighter than MV = −8.5 and many young bluestars fainter than MV = −8.5 (Saviane, Hibbard& Rich 2003). At least the tip of the Southerntail of NGC 4038/39 contains star clusters.
3.2. NGC 3256
NGC 3256 is intermediate in the “Toomre Se-quence,” and it is the second nearest merger inthis study. The inner region has structures such asloops, knots, and dust lanes usually seen in merg-ers, as well as sweeping, symmetric tidal tails (seethe optical image in Figure 1). In radio contin-uum observations, two nuclei can be seen, sepa-rated by ∼ 1 kpc (Norris & Forbes 1995). Ofthe “Toomre Sequence” mergers, NGC 3256 hasthe most molecular gas, 1.5 × 10¹⁰M⊙ (Casoliet al. 1991; Aalto et al. 1991; Mirabel et al.1990), and is the brightest in the far–infrared, withLFIR = 3× 10¹¹L⊙ (Sargent, Sanders, & Phillips1989). In addition, NGC 3256 is the most X–ray luminous starburst known, with L0.5−10keV =1.6 × 1042 ergs s−1 (Moran, Lehnert, & Helfand1999). The tails have rich H i content but notidal dwarf candidates have been discovered withinthem (English et al. 2003, see the H i contours inFigure 1).
The approximate dynamical age of NGC 3256 iscalculated in a similar manner as for NGC 4038/39(presented in §3.1). However, for a face–on orien-tation the maximum velocity is best representedby the escape velocity, 150 km s−1 (English &Freeman 2003), and the tail age is estimated tobe 61 kpc/150 km s−1 = 400 Myr.
3.2.1. Inner Region
In WFPC2 images, Zepf et al. (1999) find morethan 1000 compact, bright blue objects in the in-ner regions of NGC 3256. This population has
colors, luminosities, and sizes similar to those ofyoung globular clusters, with ages from a few toseveral hundred Myr. The luminosity function canbe fit with a power law. The young cluster popu-lation is quite extreme in that it comprises ∼ 20%of the total blue luminosity of the galaxy. Thiscould indicate a high global efficiency of clusterformation.
3.2.2. Observations of the Western and Eastern
Tails
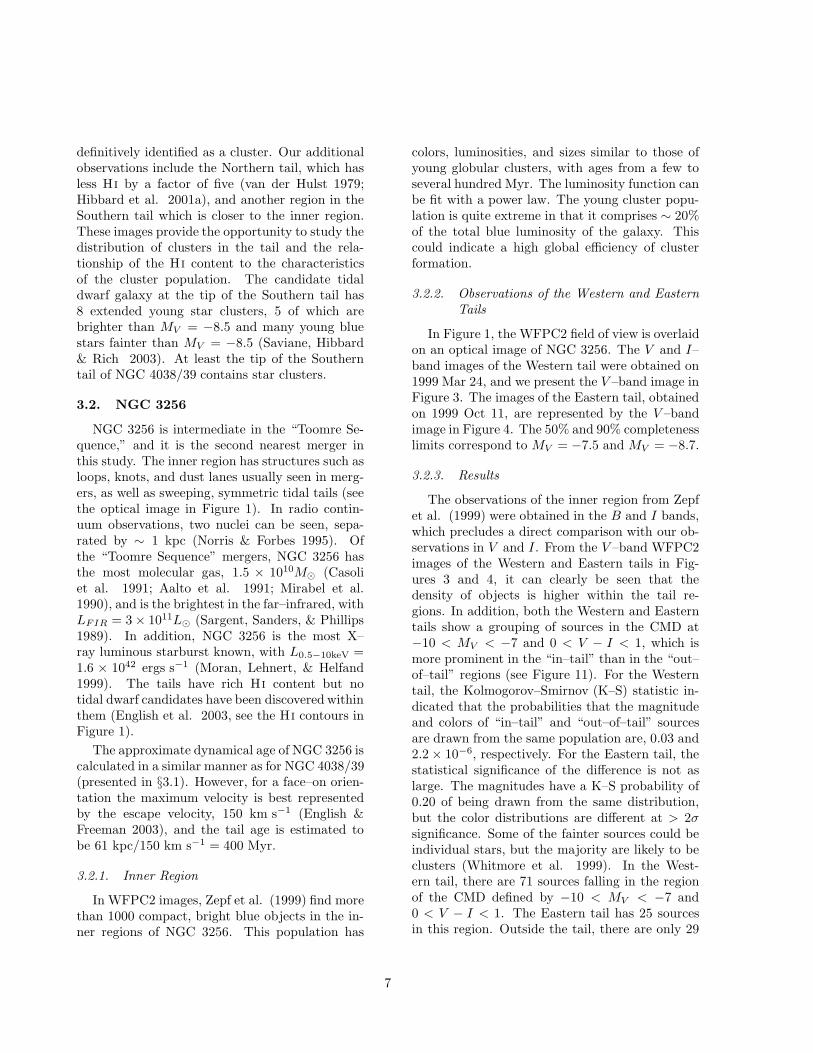
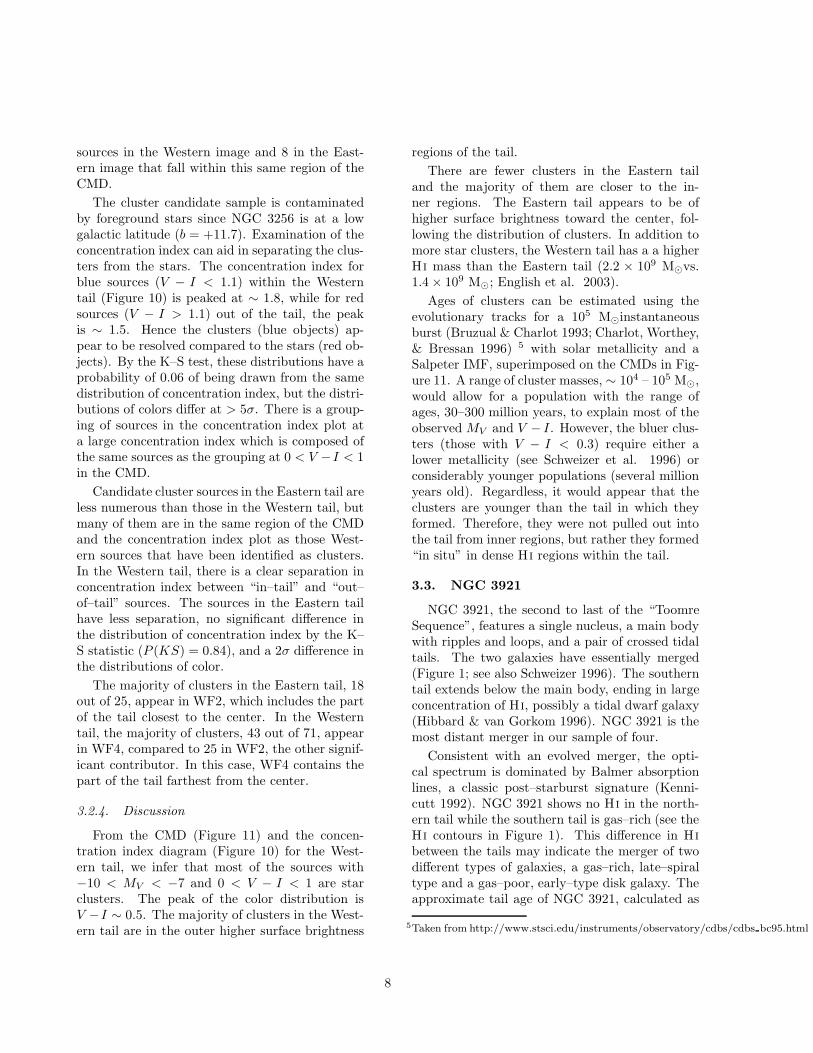
In Figure 1, the WFPC2 field of view is overlaidon an optical image of NGC 3256. The V and I–band images of the Western tail were obtained on1999 Mar 24, and we present the V –band image inFigure 3. The images of the Eastern tail, obtainedon 1999 Oct 11, are represented by the V –bandimage in Figure 4. The 50% and 90% completenesslimits correspond to MV = −7.5 and MV = −8.7.
3.2.3. Results
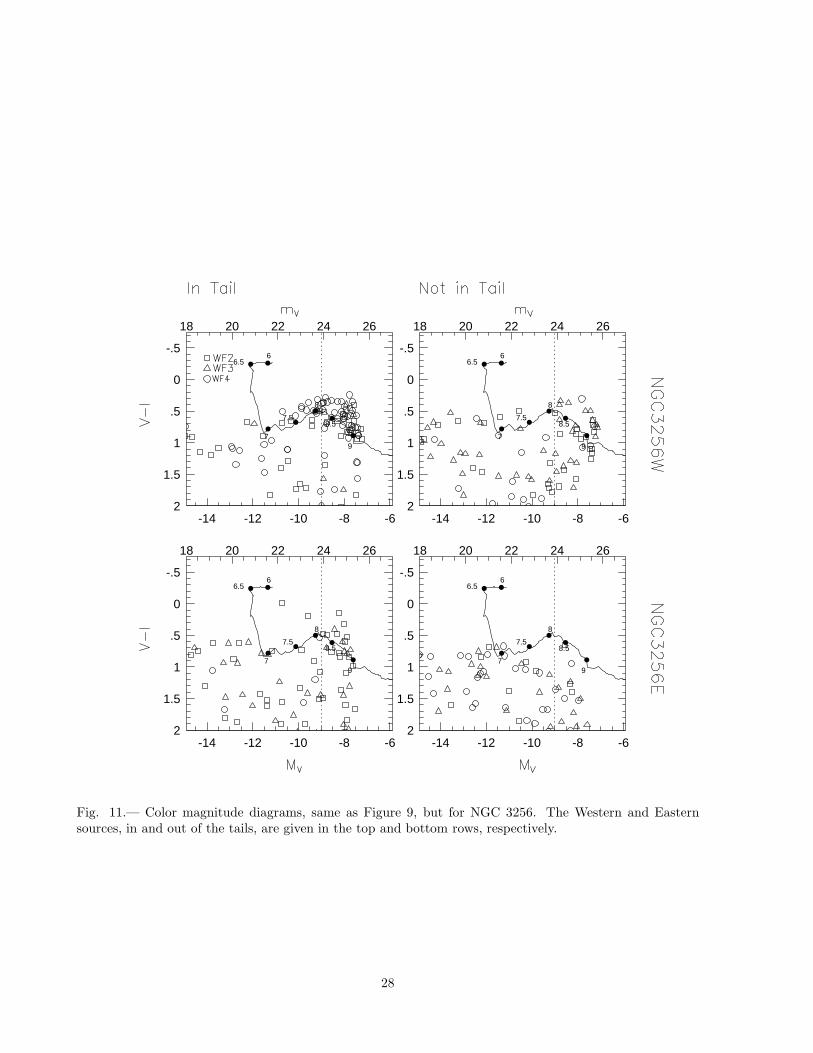
The observations of the inner region from Zepfet al. (1999) were obtained in the B and I bands,which precludes a direct comparison with our ob-servations in V and I. From the V –band WFPC2images of the Western and Eastern tails in Fig-ures 3 and 4, it can clearly be seen that thedensity of objects is higher within the tail re-gions. In addition, both the Western and Easterntails show a grouping of sources in the CMD at−10 < MV < −7 and 0 < V − I < 1, which ismore prominent in the “in–tail” than in the “out–of–tail” regions (see Figure 11). For the Westerntail, the Kolmogorov–Smirnov (K–S) statistic in-dicated that the probabilities that the magnitudeand colors of “in–tail” and “out–of–tail” sourcesare drawn from the same population are, 0.03 and2.2× 10−6, respectively. For the Eastern tail, thestatistical significance of the difference is not aslarge. The magnitudes have a K–S probability of0.20 of being drawn from the same distribution,but the color distributions are different at > 2σsignificance. Some of the fainter sources could beindividual stars, but the majority are likely to beclusters (Whitmore et al. 1999). In the West-ern tail, there are 71 sources falling in the regionof the CMD defined by −10 < MV < −7 and0 < V − I < 1. The Eastern tail has 25 sourcesin this region. Outside the tail, there are only 29
7
sources in the Western image and 8 in the East-ern image that fall within this same region of theCMD.
The cluster candidate sample is contaminatedby foreground stars since NGC 3256 is at a lowgalactic latitude (b = +11.7). Examination of theconcentration index can aid in separating the clus-ters from the stars. The concentration index forblue sources (V − I < 1.1) within the Westerntail (Figure 10) is peaked at ∼ 1.8, while for redsources (V − I > 1.1) out of the tail, the peakis ∼ 1.5. Hence the clusters (blue objects) ap-pear to be resolved compared to the stars (red ob-jects). By the K–S test, these distributions have aprobability of 0.06 of being drawn from the samedistribution of concentration index, but the distri-butions of colors differ at > 5σ. There is a group-ing of sources in the concentration index plot ata large concentration index which is composed ofthe same sources as the grouping at 0 < V −I < 1in the CMD.
Candidate cluster sources in the Eastern tail areless numerous than those in the Western tail, butmany of them are in the same region of the CMDand the concentration index plot as those West-ern sources that have been identified as clusters.In the Western tail, there is a clear separation inconcentration index between “in–tail” and “out–of–tail” sources. The sources in the Eastern tailhave less separation, no significant difference inthe distribution of concentration index by the K–S statistic (P (KS) = 0.84), and a 2σ difference inthe distributions of color.
The majority of clusters in the Eastern tail, 18out of 25, appear in WF2, which includes the partof the tail closest to the center. In the Westerntail, the majority of clusters, 43 out of 71, appearin WF4, compared to 25 in WF2, the other signif-icant contributor. In this case, WF4 contains thepart of the tail farthest from the center.
3.2.4. Discussion
From the CMD (Figure 11) and the concen-tration index diagram (Figure 10) for the West-ern tail, we infer that most of the sources with−10 < MV < −7 and 0 < V − I < 1 are starclusters. The peak of the color distribution isV −I ∼ 0.5. The majority of clusters in the West-ern tail are in the outer higher surface brightness
regions of the tail.
There are fewer clusters in the Eastern tailand the majority of them are closer to the in-ner regions. The Eastern tail appears to be ofhigher surface brightness toward the center, fol-lowing the distribution of clusters. In addition tomore star clusters, the Western tail has a a higherH i mass than the Eastern tail (2.2 × 10⁹ M⊙vs.1.4× 109 M⊙; English et al. 2003).
Ages of clusters can be estimated using theevolutionary tracks for a 105 M⊙instantaneousburst (Bruzual & Charlot 1993; Charlot, Worthey,& Bressan 1996) 5 with solar metallicity and aSalpeter IMF, superimposed on the CMDs in Fig-ure 11. A range of cluster masses, ∼ 104 – 105 M⊙,would allow for a population with the range ofages, 30–300 million years, to explain most of theobserved MV and V − I. However, the bluer clus-ters (those with V − I < 0.3) require either alower metallicity (see Schweizer et al. 1996) orconsiderably younger populations (several millionyears old). Regardless, it would appear that theclusters are younger than the tail in which theyformed. Therefore, they were not pulled out intothe tail from inner regions, but rather they formed“in situ” in dense H i regions within the tail.
3.3. NGC 3921
NGC 3921, the second to last of the “ToomreSequence”, features a single nucleus, a main bodywith ripples and loops, and a pair of crossed tidaltails. The two galaxies have essentially merged(Figure 1; see also Schweizer 1996). The southerntail extends below the main body, ending in largeconcentration of H i, possibly a tidal dwarf galaxy(Hibbard & van Gorkom 1996). NGC 3921 is themost distant merger in our sample of four.
Consistent with an evolved merger, the opti-cal spectrum is dominated by Balmer absorptionlines, a classic post–starburst signature (Kenni-cutt 1992). NGC 3921 shows no H i in the north-ern tail while the southern tail is gas–rich (see theH i contours in Figure 1). This difference in H i
between the tails may indicate the merger of twodifferent types of galaxies, a gas–rich, late–spiraltype and a gas–poor, early–type disk galaxy. Theapproximate tail age of NGC 3921, calculated as
5Taken from http://www.stsci.edu/instruments/observatory/cdbs/cdbs bc95.html
8
in §3.1, is 64 kpc/140 km s−1 = 460 Myr (Hibbard& van Gorkom 1996).
3.3.1. Inner Region
In WFPC2 images obtained by Schweizer et al.(1996, hereafter S96), there are two chains ofpoint-like candidate globular clusters and more ex-tended stellar associations along the inner part ofthe southern tail, as well as several slender, nar-row arcs of these sources. Their HST image reveals∼ 100 candidate globular clusters and ∼ 50 stel-lar associations. The globular clusters tend to bemore centrally located while the associations tracethe southern loop and two tidal tails.
The majority of the inner region’s clusters andassociations are blue and have rather uniform col-ors with a median V − I = 0.65 for globular clus-ters and 0.56 for associations. Depending on themetallicity, the ages of the globular clusters rangefrom 250–750 Myr with an upper limit on theirradii of 5 pc. The luminosity function of the glob-ular clusters and that of the associations are rep-resented by power laws. S96 estimate that thenumber of globular clusters increased by greaterthan 40% during the merger.
3.3.2. Observations of Southern Tail
In Figure 1, the WFPC2 field of view is overlaidon an optical image of NGC 3921 (see Table 1 forexposure information). The images of the South-ern tail, obtained on 1999 Apr 30, are representedby the V –band image in Figure 5. With a dis-tance modulus of 34.5 (for H0 = 75 km/s/Mpc;S96), our source catalog for NGC 3921 is 50%complete to mV ∼ 25.8, consistent with our vi-sual estimate of the completeness correction fromthe CMD, which at this large distance correspondsonly to MV = −8.7.
3.3.3. Results
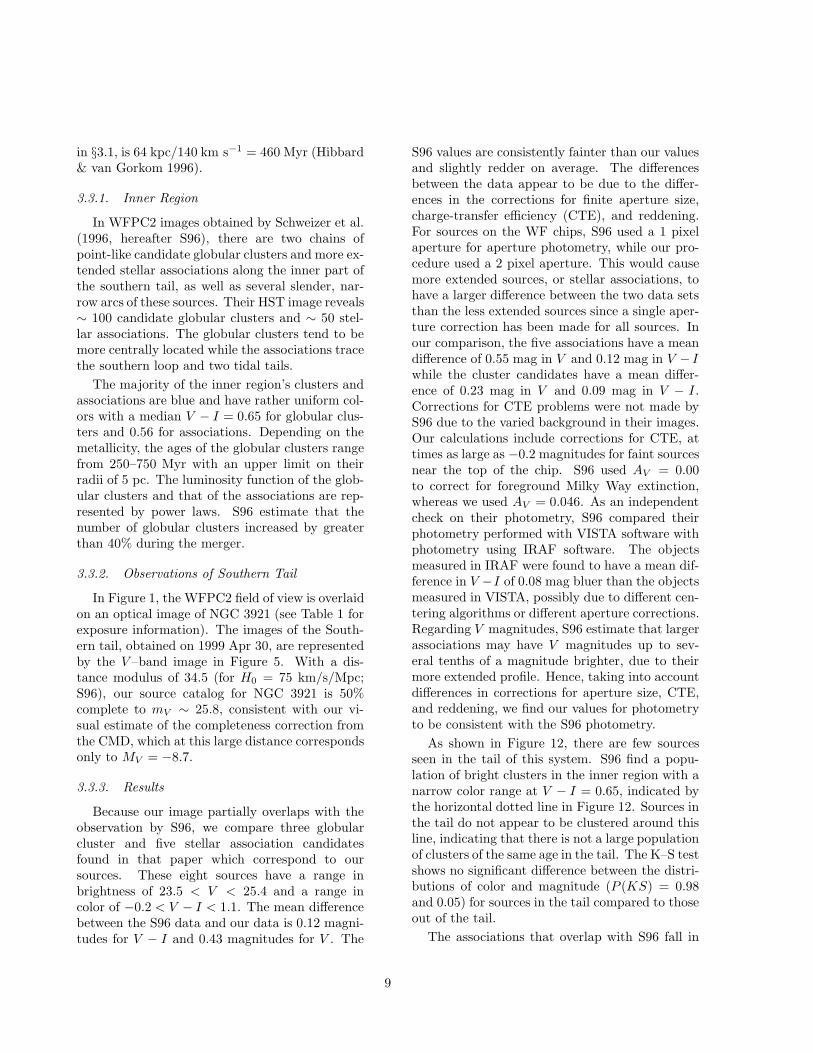
Because our image partially overlaps with theobservation by S96, we compare three globularcluster and five stellar association candidatesfound in that paper which correspond to oursources. These eight sources have a range inbrightness of 23.5 < V < 25.4 and a range incolor of −0.2 < V − I < 1.1. The mean differencebetween the S96 data and our data is 0.12 magni-tudes for V − I and 0.43 magnitudes for V . The
S96 values are consistently fainter than our valuesand slightly redder on average. The differencesbetween the data appear to be due to the differ-ences in the corrections for finite aperture size,charge-transfer efficiency (CTE), and reddening.For sources on the WF chips, S96 used a 1 pixelaperture for aperture photometry, while our pro-cedure used a 2 pixel aperture. This would causemore extended sources, or stellar associations, tohave a larger difference between the two data setsthan the less extended sources since a single aper-ture correction has been made for all sources. Inour comparison, the five associations have a meandifference of 0.55 mag in V and 0.12 mag in V − Iwhile the cluster candidates have a mean differ-ence of 0.23 mag in V and 0.09 mag in V − I.Corrections for CTE problems were not made byS96 due to the varied background in their images.Our calculations include corrections for CTE, attimes as large as −0.2 magnitudes for faint sourcesnear the top of the chip. S96 used AV = 0.00to correct for foreground Milky Way extinction,whereas we used AV = 0.046. As an independentcheck on their photometry, S96 compared theirphotometry performed with VISTA software withphotometry using IRAF software. The objectsmeasured in IRAF were found to have a mean dif-ference in V −I of 0.08 mag bluer than the objectsmeasured in VISTA, possibly due to different cen-tering algorithms or different aperture corrections.Regarding V magnitudes, S96 estimate that largerassociations may have V magnitudes up to sev-eral tenths of a magnitude brighter, due to theirmore extended profile. Hence, taking into accountdifferences in corrections for aperture size, CTE,and reddening, we find our values for photometryto be consistent with the S96 photometry.
As shown in Figure 12, there are few sourcesseen in the tail of this system. S96 find a popu-lation of bright clusters in the inner region with anarrow color range at V − I = 0.65, indicated bythe horizontal dotted line in Figure 12. Sources inthe tail do not appear to be clustered around thisline, indicating that there is not a large populationof clusters of the same age in the tail. The K–S testshows no significant difference between the distri-butions of color and magnitude (P (KS) = 0.98and 0.05) for sources in the tail compared to thoseout of the tail.
The associations that overlap with S96 fall in
9
the same region of the CMD,−11 < MV < −9 and−0.1 < V − I < 0.9. There are a few additionalsources in the tail that also fall in this region ofthe CMD, and most of these lie closer to the innerregion of the merger.
In a first pass through the photometry, onlypoint sources were kept, using the method outlinedin §2.4. This method yielded very few sourcesand missed several of the associations identified inS96. When the criteria were relaxed, as outlinedin §2.2, many more extended objects were found.Most of those found off the tail may be backgroundgalaxies, but those within the tail have propertiesconsistent with the stellar associations found inS96. At this distance one WF pixel correspondsto 39 pc, so it is difficult to distinguish clustersfrom stars using the concentration index.
The putative tidal dwarf galaxy was imaged inthe PC. It appears to be a low surface bright-ness dwarf and no point sources were found withinit. However, there are four knots within themore diffuse emission which extends over about7 kpc. This tidal dwarf galaxy candidate will beaddressed in a future study of the extended sourceswithin these tails.
3.3.4. Discussion
Most of our sources that are in the same regionof the CMD as those from S96 are located in theregion closer to the main body of the merger andare bluer than sources elsewhere in the field. Mostof the bluer sources in the tail have a large con-centration index, indicating the possible presenceof larger, stellar associations. In addition to theselarge associations, there is a putative dwarf galaxycentered in the PC. There is an absence of pointsources in the optical tail at larger distances fromthe main body of the merger.
3.4. NGC 7252 (“Atoms for Peace”)
As the system located at the end of the ToomreSequence, NGC 7252 exemplifies the prototypi-cal merger remnant (see the optical image in Fig-ure 1). It is the second most distant of the fourmergers in our sample. Schweizer (1978, 1998) de-fines some characteristics of a recent merger rem-nant: a pair of long tidal tails, isolated from neigh-bors, a single nucleus, tails moving in opposite di-rections relative to nucleus, and chaotic motions
in the main body of the merger, all of which NGC7252 possesses (Schweizer 1982). The central re-gion of this remnant has a single nucleus with sev-eral loops. Observations with HST have revealeda mini–spiral structure in the inner region whichcoincides with the disk of molecular and ionizedgas (Wang, Schweizer, & Scoville 1992; Whitmoreet al. 1993; Miller et al. 1997). The long, straighttails extend from the body of the remnant to theeast and northwest, each ending in a concentra-tion of H i associated with a candidate tidal dwarfgalaxy. The outer parts of both tails have blueB−R colors, with the bluest parts coincident withthe highest gas density (Hibbard et al. 1994).
The tails of NGC 7252 and the western loopregion are both rich in H i (see the H i contours inFigure 1). The kinematics of the northwestern tailsuggest that the material at the base of the tail isfalling into the main remnant (Hibbard & Mihos1995). This infall could explain some of the pecu-liar ripples and shells associated with the center.The presence of a young, metal poor emission linecluster in the western loop (15 kpc from the cen-ter), is consistent with recent star formation thatis perhaps triggered by infalling metal poor gasfrom the tail (Schweizer & Seitzer 1998). The ap-proximate tail age of NGC 7252, calculated as in§3.1, is 160 kpc/220 km s−1 = 730 Myr (Hibbardet al. 1994) which is in good agreement with theage of 770 Myrs as determined through numericalmodeling (Hibbard & Mihos 1995, correcting toH0 = 75 km/s/Mpc).
3.4.1. Inner Region
WFPC2 observations of the inner regions ofNGC 7252 detected ∼ 500 cluster candidateswhich separate into three populations. Lumi-nous, blue clusters with a narrow color rangeV − I ∼ 0.65, have ages around 650–750 Myr.They were likely to have formed around the timethat the tails were launched. These clusters havean upper size limit of 4.8± 0.4 pc. The inner diskis home to a population of very young (∼ 10 Myr)clusters with U −B colors indicating that O starsdominate and with radii of 8.3 ± 0.6 pc. Thethird population consists of the older, metal–poorglobular clusters from the original galaxies. Thecombined luminosity function of these populationsof clusters is a power law with α ∼ −1.8 (Milleret al. 1997).
10
3.4.2. Observations of Western and Eastern
Tails
In Figure 1, the WFPC2 fields of view are over-laid on an optical image of NGC 7252 (see Ta-ble 1 for exposure information). The images ofthe Western tail, obtained on 1998 Nov 18, arerepresented by the V –band image in Figure 6.The Eastern tail observations, obtained on 1999Aug 29, are represented by the V –band image inFigure 7. With a distance modulus of 34.0 (forH0 = 75 km/s/Mpc; Schweizer 1982), the detec-tion limit of mV ∼ 26.0 (50% completeness), con-sistent with our visual estimate of the complete-ness correction from the CMDs, corresponds toMV = −8.1.
3.4.3. Results
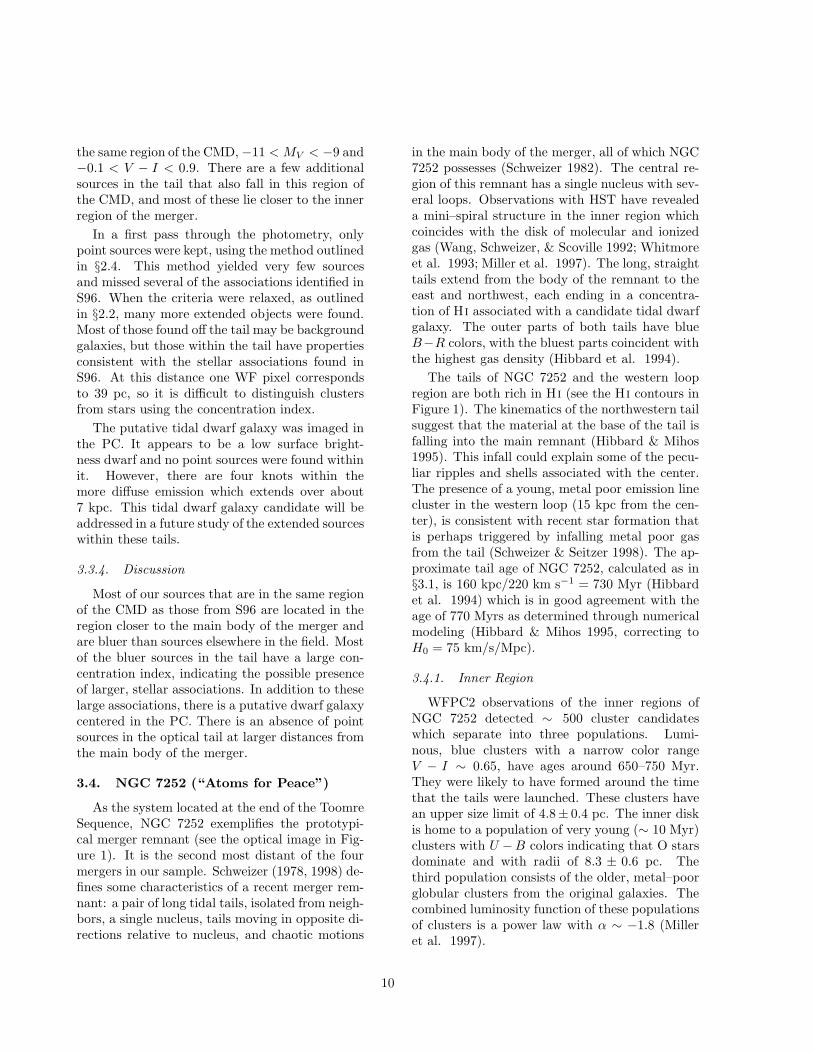
The clusters in the inner region identified byMiller et al. (1997) include populations of inter-mediate and old clusters at V − I = 0.65 and1.0, as indicated by the horizontal dotted lines onthe CMD in Figure 13. The blue clusters have19 < V < 25. There are also some bright, blueclusters with V − I < 0.6 (Miller et al. 1997),found mostly within the inner 6′′ of the galaxy.
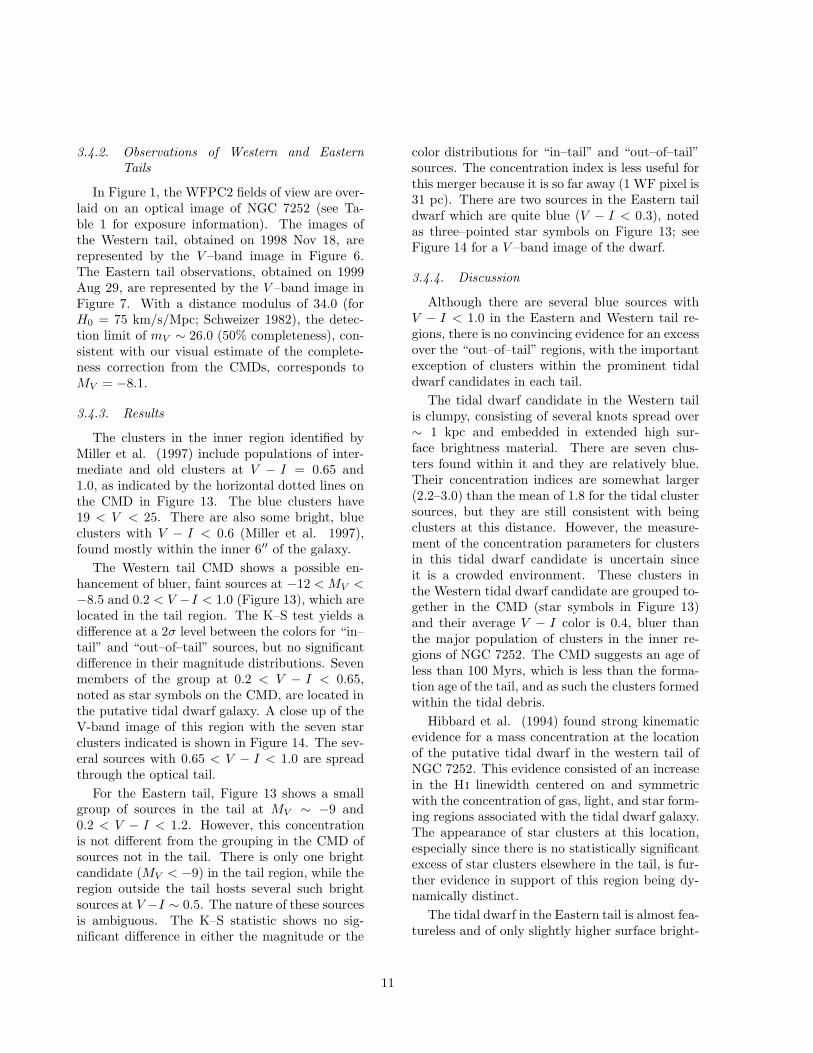
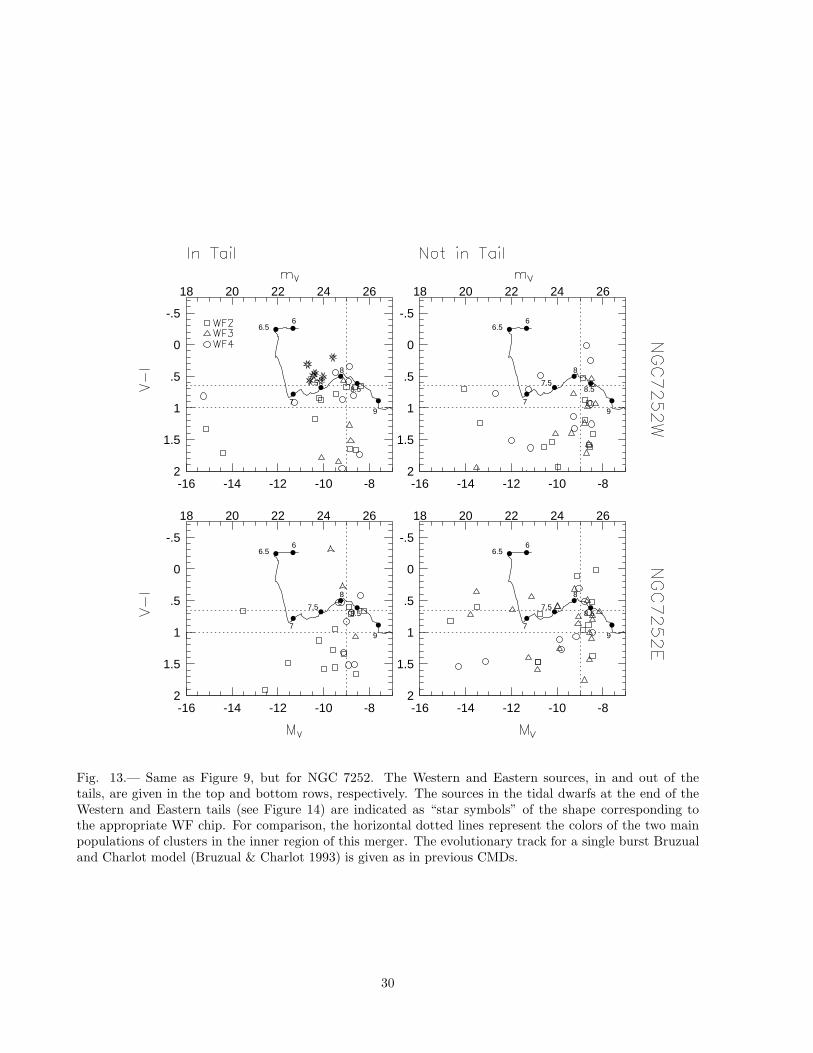
The Western tail CMD shows a possible en-hancement of bluer, faint sources at −12 < MV <−8.5 and 0.2 < V −I < 1.0 (Figure 13), which arelocated in the tail region. The K–S test yields adifference at a 2σ level between the colors for “in–tail” and “out–of–tail” sources, but no significantdifference in their magnitude distributions. Sevenmembers of the group at 0.2 < V − I < 0.65,noted as star symbols on the CMD, are located inthe putative tidal dwarf galaxy. A close up of theV-band image of this region with the seven starclusters indicated is shown in Figure 14. The sev-eral sources with 0.65 < V − I < 1.0 are spreadthrough the optical tail.
For the Eastern tail, Figure 13 shows a smallgroup of sources in the tail at MV ∼ −9 and0.2 < V − I < 1.2. However, this concentrationis not different from the grouping in the CMD ofsources not in the tail. There is only one brightcandidate (MV < −9) in the tail region, while theregion outside the tail hosts several such brightsources at V −I ∼ 0.5. The nature of these sourcesis ambiguous. The K–S statistic shows no sig-nificant difference in either the magnitude or the
color distributions for “in–tail” and “out–of–tail”sources. The concentration index is less useful forthis merger because it is so far away (1 WF pixel is31 pc). There are two sources in the Eastern taildwarf which are quite blue (V − I < 0.3), notedas three–pointed star symbols on Figure 13; seeFigure 14 for a V –band image of the dwarf.
3.4.4. Discussion
Although there are several blue sources withV − I < 1.0 in the Eastern and Western tail re-gions, there is no convincing evidence for an excessover the “out–of–tail” regions, with the importantexception of clusters within the prominent tidaldwarf candidates in each tail.
The tidal dwarf candidate in the Western tailis clumpy, consisting of several knots spread over∼ 1 kpc and embedded in extended high sur-face brightness material. There are seven clus-ters found within it and they are relatively blue.Their concentration indices are somewhat larger(2.2–3.0) than the mean of 1.8 for the tidal clustersources, but they are still consistent with beingclusters at this distance. However, the measure-ment of the concentration parameters for clustersin this tidal dwarf candidate is uncertain sinceit is a crowded environment. These clusters inthe Western tidal dwarf candidate are grouped to-gether in the CMD (star symbols in Figure 13)and their average V − I color is 0.4, bluer thanthe major population of clusters in the inner re-gions of NGC 7252. The CMD suggests an age ofless than 100 Myrs, which is less than the forma-tion age of the tail, and as such the clusters formedwithin the tidal debris.
Hibbard et al. (1994) found strong kinematicevidence for a mass concentration at the locationof the putative tidal dwarf in the western tail ofNGC 7252. This evidence consisted of an increasein the H i linewidth centered on and symmetricwith the concentration of gas, light, and star form-ing regions associated with the tidal dwarf galaxy.The appearance of star clusters at this location,especially since there is no statistically significantexcess of star clusters elsewhere in the tail, is fur-ther evidence in support of this region being dy-namically distinct.
The tidal dwarf in the Eastern tail is almost fea-tureless and of only slightly higher surface bright-
11

ness than the tail. The several clusters within thedwarf are among the bluest in the sample. Theyare consistent with the very blue colors of thoseclusters within the inner 6′′ of NGC 7252. Theseinner region clusters have an age of ∼ 10 Myr.Though the clusters could have formed recently,the dwarf itself may have formed earlier.
The contrast in the distribution of young starsin the two candidate dwarf galaxies is striking.The Western tail dwarf is of higher surface bright-ness and contains several blue clusters in closeproximity, and the Eastern tail dwarf is almostfeatureless, with only two clusters spaced fartherapart. In the Eastern tail dwarf, the extreme bluecolors indicate that the clusters are considerablyyounger than the age of the interaction. A sim-ilar situation is found in the Northern Starburstregion of Stephan’s Quintet, one of Hickson’s com-pact galaxy groups. That region is separated fromthe nearest giant galaxy by more than 25 kpc, yetit hosts a very young stellar population (less than5 Myr; Gallagher et al. 2001). It will be interest-ing to compare the range of properties of these andother tidally formed dwarfs to the varied popula-tion of compact and diffuse dwarf galaxies in theLocal Group.
4. Summary and Discussion
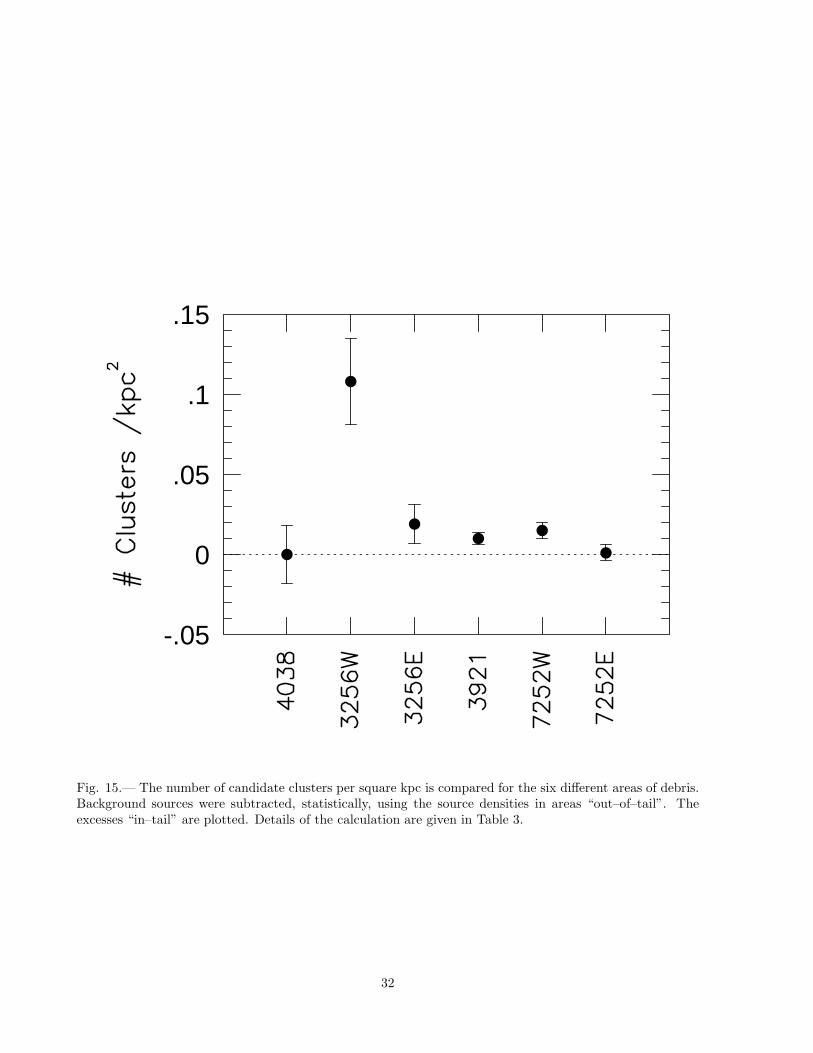
In our study of six HST WFPC2 images of sixtidal tails in four merging pairs, we found evi-dence for extreme differences in cluster formationamong the tidal tails. To compare the debris inthe different mergers on equal footing, we mustconsider contamination by foreground and back-ground objects and the relative areas of “in–tail”and “out–of–tail” regions (fractions fin and fout).We must also consider selection effects due to thedifferent distances of the pairs. Table 3 gives the“in–tail” and “out–of–tail” source densities in eachtidal tail, for sources with V − I < 0.7 and withMV < −8.5. The latter criterion was chosen be-cause sources this bright are likely to be clustersrather than individual stars. Table 3 also lists thespecific frequencies of young clusters, Syoung, foreach tail region, defined as the number of youngclusters per MV = −15 luminosity (in a similarway to how Harris (1991) defined the specific fre-quency for old globular clusters).
Figure 15 gives, for the six regions, the differ-
ences in the source densities in and out of the tails.This is a way of subtracting the background, butit neglects the fact that some “out–of–tail” sourcesmight be real clusters. Errorbars are simply fromPoisson statistics; if some of the objects outsideof the tails are clusters then the background sub-traction is systematically too large and the surplusfound would represent a lower limit.
The Western tail region of NGC 3256 shows asignificant excess of sources likely to be star clus-ters. The five other regions show a much smallernumber, consistent with 0 for NGC 4038 and NGC7252E, but statistically significant for the otherthree tail regions, NGC 3256E, NGC 3921, andNGC 7252W. In the case of NGC 3921, manyof the sources in the Southern tail are stellar as-sociations also reported by S96. By having dif-ferent detection criteria for NGC 3921 and NGC7252, we attempted to find any faint clusters thatmight add to the numbers such that these regionsmight compete with the number of clusters foundin NGC 3256W. Since we did not find a populationof faint sources in the tails of NGC 3921 and NGC7252, the excess of sources in NGC 3256W is evenmore significant. If we just look at the brightestsources in all the tails which have MV < −9.0 andMV < −9.5 (with V − I < 0.7, as above), NGC3256W still has a much larger excess of clusterswithin the tail.
While the the tails of NGC 7252 generally lackclusters, it is remarkable that there is a popula-tion of clusters associated with both tidal dwarfcandidates (seven in the western dwarf, two in theeastern one). The two tidal dwarf candidates showdifferent populations of clusters, however, with theEastern dwarf bluer than the Western dwarf. Forthe Western tidal dwarf, the clusters may haveformed either before or concurrent with the dwarf.The Eastern dwarf probably formed prior to its re-cent burst of star formation. Though differentialreddening could induce the observed color differ-ences between the two dwarfs, we have no evidencewhich suggests this might be the case.
The NGC 4038 tidal debris shows no largeyoung cluster population like that observed in itsinner regions. There are fainter objects, whichcould be individual young stars within the tail, butthere are only 3 objects brighter than MV = −9,the cutoff for clusters used by Whitmore et al.(1999), and all of these have V − I > 1. At least
12

this section of the tail, if not the entire tail, hasfew, if any, clusters. Interestingly, HST/WFPC2images of the region of the tail coincident withthe tidal dwarf candidate (Saviane, Hibbard &Rich 2003) show 8 young stellar associations inthe vicinity of the tidal dwarf. The high concen-tration of blue star clusters in the vicinity of a tidaldwarf candidate, but general lack of such clusterselsewhere in the tail, is very similar to the situa-tion for NGC 7252. It will be very interesting tosee if the other two unreduced pointings on theNGC 4038/39 tails (see Figure 1) show a similarlack of bright clusters.
Clearly, the Western tail of NGC 3256 has thelargest population of tail clusters observed in oursample. Both the colors and concentration of theseobjects are coincident with inner region clusters inthe merger. The Eastern tail has a small excess(∼ 2σ) of clusters as well.
So why might the tails of NGC 3256 be a pre-ferred environment for extensive cluster forma-tion? The tails of NGC 3256 are very similar toother tails that do not show such large numbersof clusters; all show large numbers of inner regionclusters; all are rich in atomic gas; all have dy-namical ages from 400-800 Myr (with NGC 3256and NGC 3921 at the lower range of that scale).However, NGC 3256 is extremely bright in the X–ray and far–IR, and also has the largest numberof clusters in its inner regions.
From the far infrared luminosities of each pair,we calculated the global star formation rates us-ing the relation of Kennicutt (1998b): SFR =4.5 × 10−44LFIR M⊙ yr−1. This conversion as-sumes that the dust re-emits all of the youngstarlight (τ >> 1), and that the dust heatingis dominated by young stars, with ages of order108 years or less. As shown in Table 4, NGC 3256stands out clearly with a star formation rate sev-eral times that of the Antennae and NGC 7252,the next closest pairs. Though these rates are cal-culated from the integrated infrared luminositiesrather than locally for the tidal tails, the overallenhancement of star formation in NGC 3256 maybe a prerequisite for the efficient production of starclusters. Also, the star formation rate is relatedto the current burst of star formation and mightnot indicate the conditions in the merger when thestar clusters in the tails formed, but perhaps thehigher star formation rate of NGC 3256 indicates
a higher global molecular gas content that wouldaid in more efficient star cluster formation.
We should consider whether the specific fre-quency of young clusters is large for NGC 3256,or whether the number of young clusters is whatwould be expected based upon the luminosity ofthe tail region. From Whitmore & Schweizer(1995) and Goudfrooij et al. (2001), we can com-pare the specific frequency of young clusters form-ing in the central regions of mergers with Syoung ofour tidal tails. We calculated the MV of the tidaltails by using the IRAF task IMSTAT at severaltypical locations within the tail, and subtractedthe background, measured at several locationsoutside the tail. The Western tail of NGC 3256 hasa very large specific frequency, Syoung = 2.5, com-parable to Syoung
6 ∼ 2 found in the central regionsof NGC 4038/39 (Whitmore & Schweizer 1995)and Syoung
7 = 1.7 found in NGC 1316 (Goud-frooij et al. 2001). Clearly, calculation of Syoung
is complicated by destruction of clusters, fading,etc. However, it is still quite interesting that oneof these tails hosts clusters, that are as luminous,relative to stars as in central regions of merginggalaxies.
Another difference between NGC 3256 and theother pairs, is that, unlike the other three systems,NGC 3256 does not have a prominent tidal dwarfgalaxy associated with the tip of its tidal tail eitherin the optical image or in H i maps. A hypothe-sis, based on our admittedly small sample of sixtidal tails, is that tails with prominent tidal dwarfsform fewer clusters than tails without such dwarfs.If we also consider the ACS early release observa-tions of UGC 10214 and NGC 4676, they follow asimilar trend. Although no correction was madefor background contamination, UGC 10214 (whichhas a tidal dwarf candidate) has fewer star clustersin its tail than NGC 4676 (which does not host atidal dwarf candidate) (de Grijs et al. 2003; Tranet al. 2003). However, UGC 10214 is thought tobe a disturbed spiral with a single long tidal tail,a different environment from the merging pairs ofspiral galaxies that comprise our sample and NGC4676. UGC 10214 also hosts many young star clus-ters in the bright blue clump at the mid-point of
6This number corresponds to S in Whitmore & Schweizer(1995).
7This number corresponds to SN in Goudfrooij et al. (2001).
13
its tail with ages from ∼ 3 − 10 Myr (Tran et al.2003).
Elmegreen & Efremov (1997) showed that largemass clumps and high specific kinetic energies leadto a higher efficiency for star formation becauseof an increased binding energy and resistance todisruption. Perhaps the details of the interaction(i.e. the mass of the perturber, the orbital prop-erties of the two galaxies as they merge, the gascontent of the parent galaxy, the dark matter dis-tribution, and the velocity of the perturber) influ-ence the process of star formation in the debris.We hypothesize that global characteristics of theencounters affect the local conditions, conspiringso that star clusters form along the tail or withina dwarf galaxy in the tail, but not both.
We thank the referee for a number of helpfulcomments and suggestions. Support for this workwas provided by grant STSI NASA GO-07466.01-96A from the Space Telescope Science Institute,which is operated by AURA, Inc., under NASAcontract NAS5–26555. Additional support wasprovided by the National Science Foundation un-der grant AST-0071223. KAK was also supportedby an NSF REU Supplement.
REFERENCES
Aalto, S., Black, J. H., Booth, R. S., & Johansson,L. E. B. 1991, A&A, 247, 291
Ajhar, E. A., Blakeslee, J. P., & Tonry, J. L. 1994,AJ, 108, 2087
Amram, P., Marcelin, M., Boulesteix, J., & leCoarer, E. 1992, A&A, 266, 106
Arp, H. C. 1966, Atlas of Peculiar Galaxies(Pasadena: CalTech).
Barnes, J. E. 1988, ApJ, 331, 699
Barth, A. J., Ho, L. C., Filippenko, A. V., & Sar-gent, W. L. W. 1995, AJ, 110, 1009
Bruzual, A. G., & Charlot, S. 1993, ApJ, 405, 538
Casoli, F., Dupraz, C., Combes, F., & Kazes, I.1991, A&A, 251, 1
Charlot, S., Worthey, G., & Bressan, A. 1996,ApJ, 457, 625
de Grijs, R., Lee, J. T., Mora Herrera, M. C.,Fritze-v. Alvensleben, U., & Anders, P. 2003,New Astronomy, 8, 155
Duc, P.–A., & Mirabel, I. F. 1994, A&A, 289, 83
Duc, P.–A., & Mirabel, I. F. 1998, A&A, 333, 813
Duc, P.–A., & Mirabel, I. F. 1999, in Galaxy In-teractions at Low and High Redshift, IAU Sym-posium No. 186, eds. D. Sanders & J. Barnes,p. 61
Elmegreen, B. G., & Efremov, Y. N. 1997, ApJ,480, 235
English, J., & Freeman, K. C. 2003, AJ, 125, 1124
English, J., Norris, R. P., Freeman, K. C., &Booth, R. S. 2003, AJ, 125, 1134
Fritze–v. Alvensleben, U. 1998, A&A, 336, 83
Gallagher, S. C., Charlton, J. C., Hunsberger, S.D., Zaritsky, D. & Whitmore, B. C. 2001, AJ,122, 163
Goudfrooij, P., Alonso, M. V., Maraston, C., &Minniti, D. 2001, MNRAS, 328, 237
Harris, W. E. 1991, ARA&A, 29, 543
Harris, W. E., & Pudritz, R. E. 1994, ApJ, 429,177
Hibbard, J. E., Guhathakurta, P., van Gorkom, J.H., & Schweizer, F. 1994, AJ, 107, 67
Hibbard, J. E., & Mihos, J. C. 1995, AJ, 110, 140
Hibbard, J. E., & van Gorkom, J. H., 1996, Astro-nomical Journal, 111, 655
Hibbard, J. E. 2000, private communication
Hibbard, J. E., van der Hulst, T., Barnes, J. E.,& Rich, R. M. 2001a, AJ, 122, 2969
Hibbard, J. E., van Gorkom, J. H., Rupen, M.P., & Schiminovich, D. 2001b, in ASP Conf.Ser. 240, Gas and Galaxy Evolution, eds. J. E.Hibbard, M. P. Rupen and J.H. van Gorkom(ASP, San Francisco), 659
Holtzman et al. 1992, AJ, 102, 691
Holtzman et al. 1995, PASP, 107, 1065
14
Hunsberger, S. D., Charlton, J. C., & Zaritsky, D.1996, ApJ, 462, 50
Iglesias-Paramo, J., & Vilchez, J. M. 2001, ApJ,550, 204
Jog, C. J., & Solomon, P. M. 1992, ApJ, 387, 152
Kennicutt, R. C. 1992, ApJ, 388, 310
Kennicutt, R. C. 1998, in Induced Star Forma-tion, Galaxies: Interactions and Induced StarFormation (Berlin: Springer)
Kennicutt, R.C. 1998, ARA&A, 36, 189
Kennicutt, R. C., Roettiger, K. A., Keel, W. C.,van der Hulst, J. M., & Hummel, E. 1987, AJ,93, 1011
Knapp, G. R., Guhathakurta, P., Kim, D., & Jura,M. A. 1989, ApJS, 70, 329
Kundu, A. 1999, Ph.D. Thesis, University ofMaryland
Kundu, A., Whitmore, B. C., Sparks, W. B., Mac-chetto, F. D., Zepf, S. E., & Ashman, K. M.1999, ApJ, 513, 733
Kundu, A., & Whitmore, B. C. 2001, AJ, 121,2950
Kundu, A., & Whitmore, B. C. 2001, AJ, 122,1251
Larsen, S. S., & Richtler, T. 1999, A&A, 345, 59
Lee, H., Lee, Y. & Gibson, B. K. 2002, AJ, 124,2664
Mathis, J. S. 1990, ARA&A, 28, 37
Meurer, G. R., Heckman, T. M., Lietherer, C.,Kinney, A., Robert, C., & Garnett, D. R. 1995,AJ, 110, 2665
Miller, B., Whitmore, B., Schweizer, F., & Fall,S.M. 1997, AJ, 114, 2381
Mirabel, I. F., Booth, R. S., Johansson, L. E. B.,Garay, G., & Sanders, D. B. 1990, A&A, 236,327
Mirabel, I. F., Dottori, H., & Lutz, D. 1992, A&A,256, L19
Moran, E. C., Lehnert, M. D., & Helfand, D. J.,1999, ApJ, 526, 649
Moshir, M. & et al. 1990, IRAS Faint Source Cat-alogue, version 2.0 (1990)
Norris, R. P., & Forbes, D. A. 1995, ApJ, 446, 594
Peterson, C. J. 1993, in Structure and Dynamics ofGlobular Clusters, edited by S. G. Djorgovskyand G. Meylan (PASP, San Francisco), p. 337
Press, W. H., Flannery, B. P., Teukolsky, S. A.,& Vetterling, W. T. 1986, Numerical Recipes:The Art of Scientific Computing (CambridgeUniversity Press)
Ranalli, P., Comastri, A., & Setti, G. 2003, A&A,399, 39
Reed, B. C., Hesser, J. E., & Shawl, S. J. 1988,PASP, 100, 545
Sargent, A. I., Sanders, D. B., & Phillips, T. G.1989, ApJ, 346, L9
Saviane,I., Hibbard, J. E. & Rich, R. M. 2003, AJ,submitted
Schlegel, D. J., Finkbeiner, D. P., & Davis, M.1998, ApJ, 500, 525
Schombert, J. M., Wallin, J. F., & Struck–Marcell,C. 1990, AJ, 99, 497
Schweizer, F. 1978, in Structure and Properties ofNearby Galaxies, ed. E. M. Berkhuijsen & R.Wielebinski (Reidel, Dordrecht), 279
Schweizer, F. 1982, ApJ, 252, 455
Schweizer, F. 1996, AJ, 111, 109
Schweizer, F., Miller, B., Whitmore, B., & Fall, S.M. 1996, AJ, 112, 1839 (S96)
Schweizer, F. 1998, in Observational Evidencefor Interactions and Mergers, Galaxies: Inter-actions and Induced Star Formation (Berlin:Springer)
Schweizer, F., & Seitzer, P. 1998, AJ, 116, 2206
Tran, H. D., et al. 2003, ApJ, 585, 750
15
Toomre, A. 1977, in The Evolution of Galaxiesand Stellar Populations, edited by B. M. Tins-ley and R. B. Larson (New Haven: Yale Univ.),p. 401
Toomre, A., & Toomre, J. 1972, ApJ, 178, 623
van den Bergh, S. 1996, AJ, 112, 2634
van den Bergh, S. 1995, Nature, 374, 215
van der Hulst, J. M. 1979, A&A, 155, 151
Voit, M. 1997, HST Data Handbook (Space Tele-scope Science Institute, Baltimore)
Wang, Z., Schweizer, F., & Scoville, N. Z. 1992,ApJ, 396, 510
Weilbacher, P. M., Duc, P.-A., Fritze-v.Alvensleben, U., Martin, P., & Fricke,K. J. 2000, A&A, 358, 819
Weilbacher, P. M., Duc, P.-A., & Fritze-v.Alvensleben, U. 2003, A&A, 397, 545
Whitmore, B. C., Miller, B. W., Schweizer, F., &Fall, S. M. 1997, AJ, 114, 1802
Whitmore, B. C., Schweizer, F., Leitherer, C.,Borne, K., & Robert, C. 1993, AJ, 106, 1354
Whitmore, B. C., & Schweizer, F. 1995, AJ, 109,960
Whitmore, B. C., Sparks, W. B., Lucas, R. A.,Macchetto, F. D., & Biretta, J. A. 1995, ApJ,454, L73
Whitmore, B. C., Heyer, I., & Casertano, S. 1999,PASP, 111, 1559
Whitmore, B. C., Zhang, Q., Leitherer, C., Fall, S.M., Schweizer, F., & Miller, B. 1999, AJ, 118,1551
Yun, M. S., Ho, P. T. P., & Lo, K. Y. 1994, Nature,372, 530
Zepf, S., Ashman, K., English, J., Freeman, K., &Sharples, R. 1999, AJ, 118, 752
Zhang, Q., & Fall, S. M. 1999, ApJ, 527, L81
This 2-column preprint was prepared with the AAS LATEXmacros v5.0.
16

Figures
17
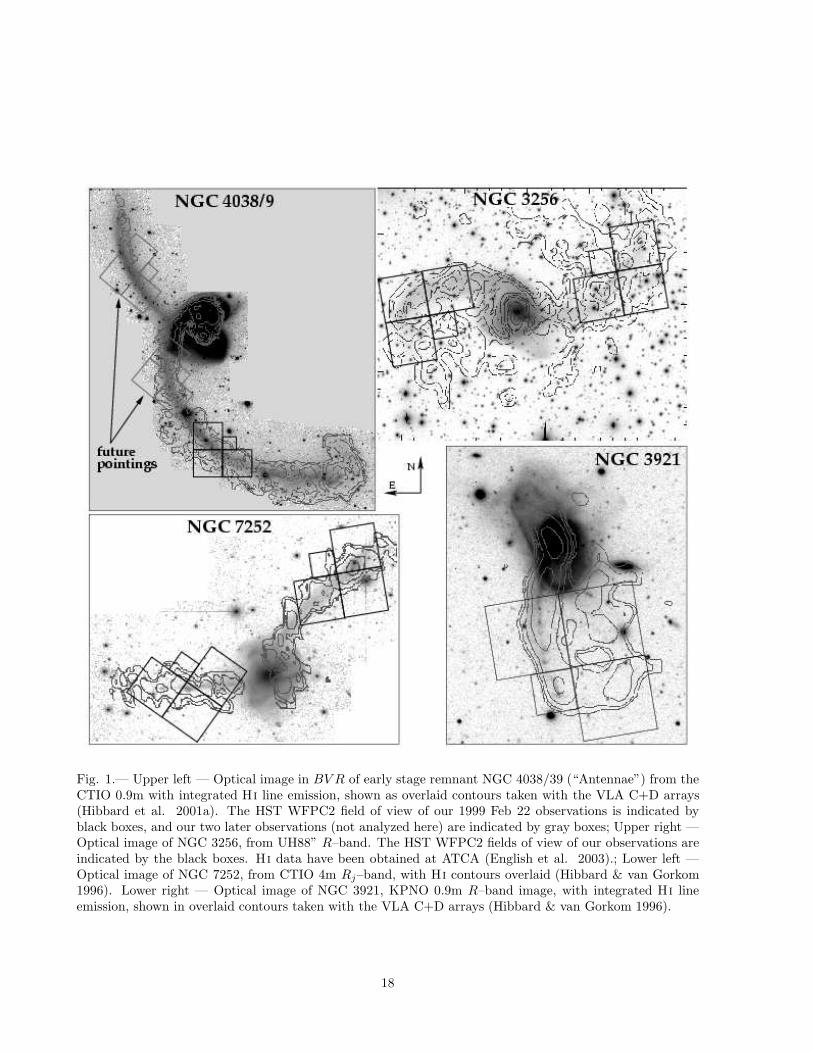
Fig. 1.— Upper left — Optical image in BV R of early stage remnant NGC 4038/39 (“Antennae”) from theCTIO 0.9m with integrated H i line emission, shown as overlaid contours taken with the VLA C+D arrays(Hibbard et al. 2001a). The HST WFPC2 field of view of our 1999 Feb 22 observations is indicated byblack boxes, and our two later observations (not analyzed here) are indicated by gray boxes; Upper right —Optical image of NGC 3256, from UH88” R–band. The HST WFPC2 fields of view of our observations areindicated by the black boxes. H i data have been obtained at ATCA (English et al. 2003).; Lower left —Optical image of NGC 7252, from CTIO 4m Rj–band, with H i contours overlaid (Hibbard & van Gorkom1996). Lower right — Optical image of NGC 3921, KPNO 0.9m R–band image, with integrated H i lineemission, shown in overlaid contours taken with the VLA C+D arrays (Hibbard & van Gorkom 1996).
18

Fig. 2.— HST WFPC2 image of NGC 4038/39 (“Antennae”) Southern tail taken with F555W (V ) filter.Circles indicate sources in the tail and squares indicate those outside of the tail. Sources within the tail arelikely to be individual stars and not clusters.
19
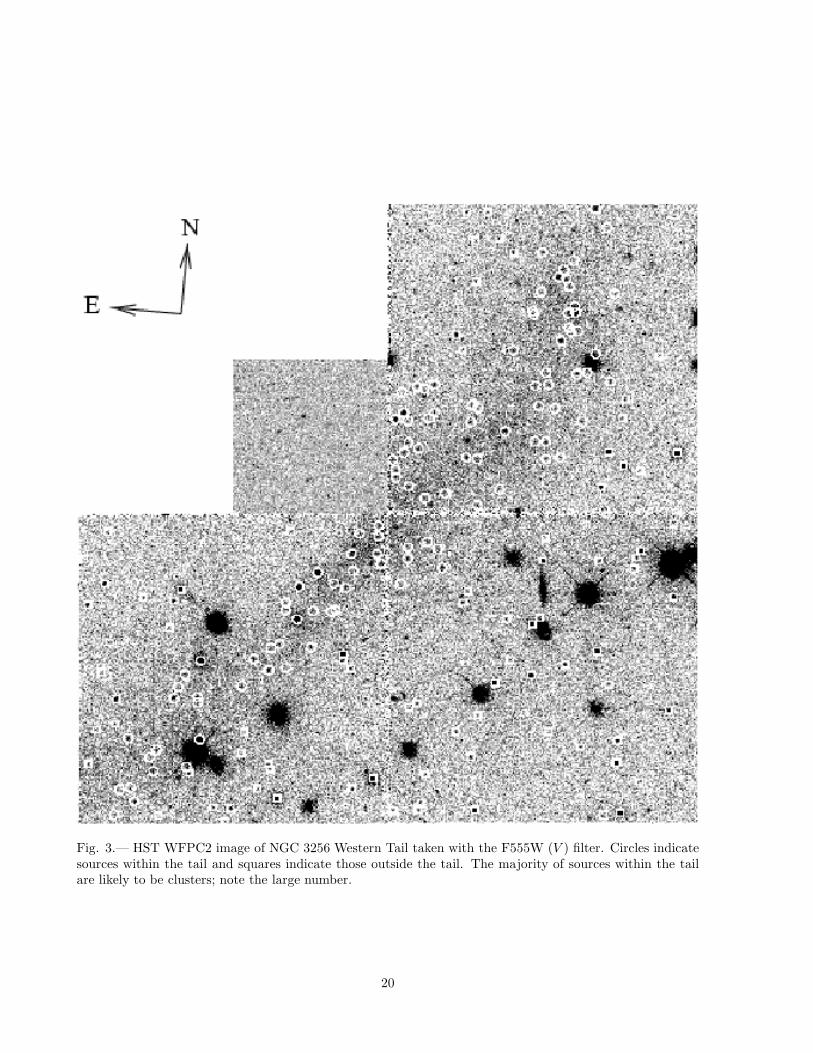
Fig. 3.— HST WFPC2 image of NGC 3256 Western Tail taken with the F555W (V ) filter. Circles indicatesources within the tail and squares indicate those outside the tail. The majority of sources within the tailare likely to be clusters; note the large number.
20
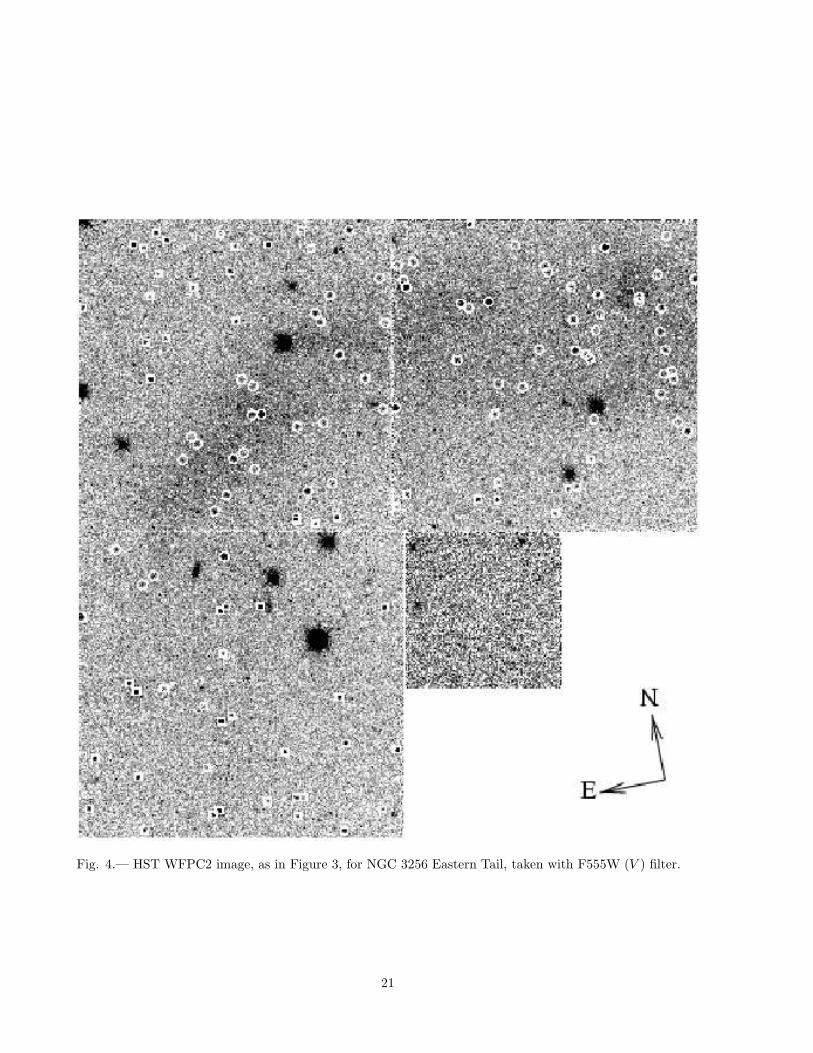
Fig. 4.— HST WFPC2 image, as in Figure 3, for NGC 3256 Eastern Tail, taken with F555W (V ) filter.
21
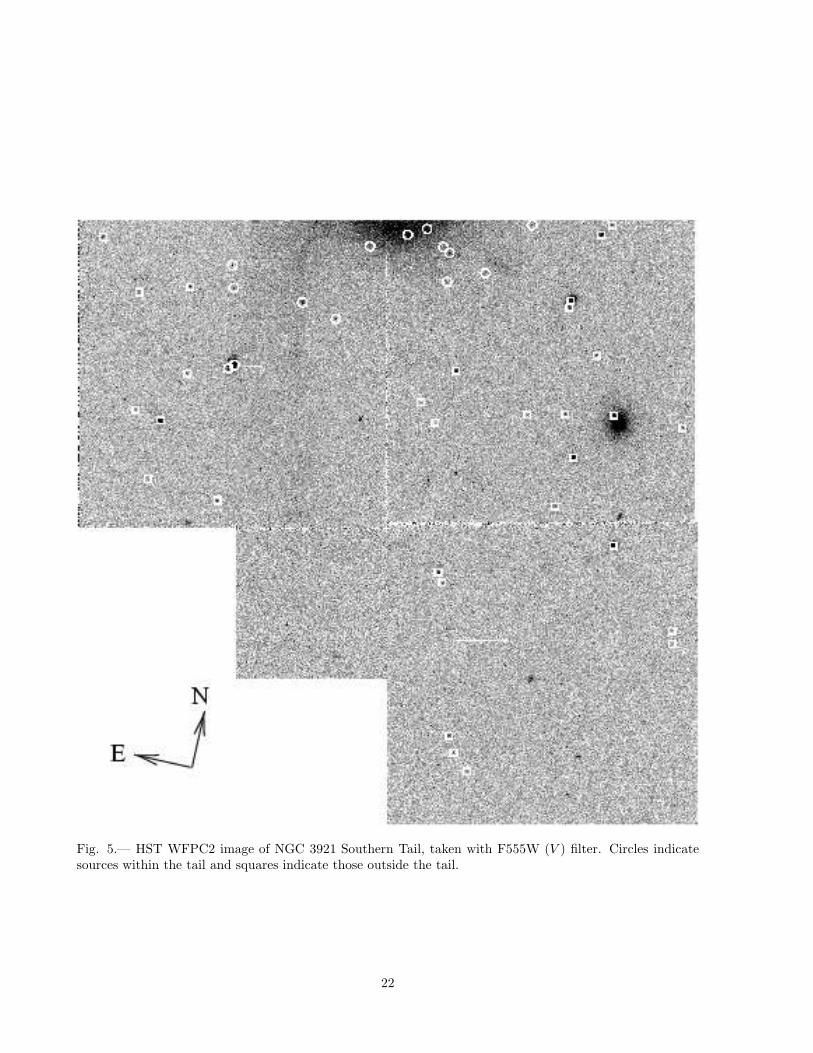
Fig. 5.— HST WFPC2 image of NGC 3921 Southern Tail, taken with F555W (V ) filter. Circles indicatesources within the tail and squares indicate those outside the tail.
22
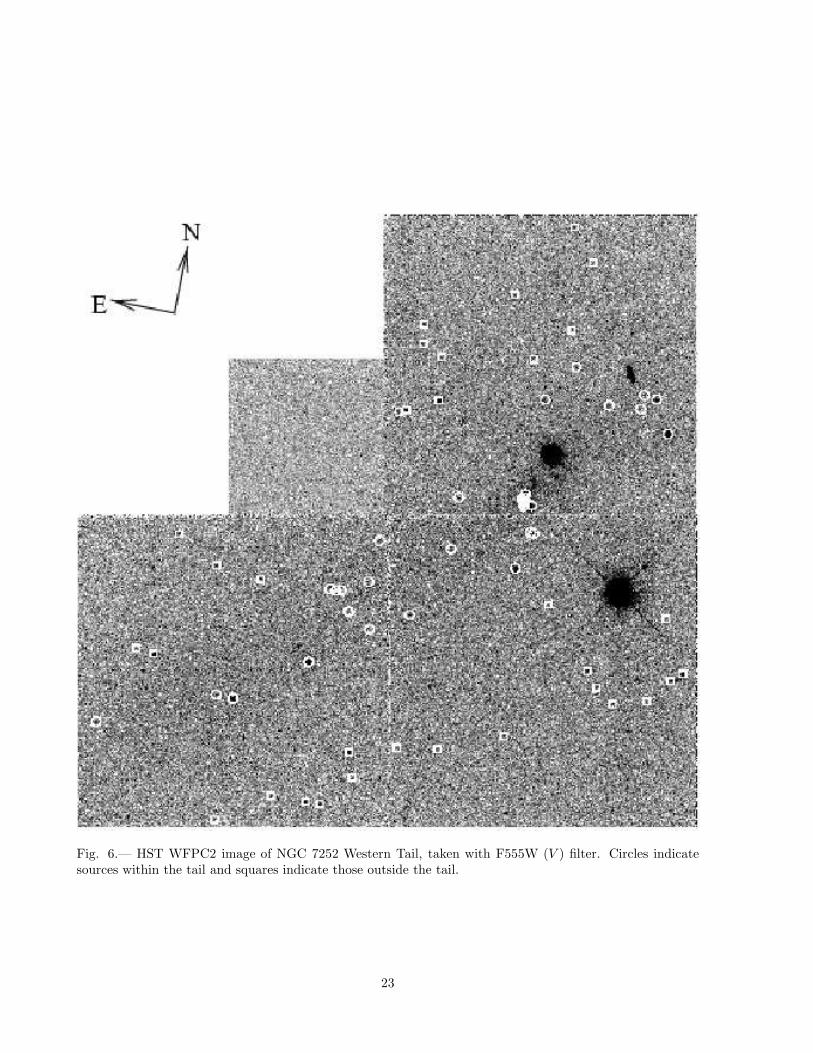
Fig. 6.— HST WFPC2 image of NGC 7252 Western Tail, taken with F555W (V ) filter. Circles indicatesources within the tail and squares indicate those outside the tail.
23

Fig. 7.— HST WFPC2 image, as in Figure 6, for NGC 7252 Eastern Tail, taken with F555W (V ) filter.
24
22 23 24 25 26 27 280
.2
.4
.6
.8
1
1.2
Fig. 8.— The completeness fraction for point sources as a function of the V magnitude, determined byadding artificial sources to the WF images of the NGC 3256 Western tail.
25
18 20 22 24 26
2
1.5
1
.5
0
-.5
-12 -10 -8 -6
6
6.5
7
7.5
8
8.5
9
18 20 22 24 26
2
1.5
1
.5
0
-.5
-12 -10 -8 -6
6
6.5
7
7.5
8
8.5
9
Fig. 9.— Color magnitude diagram for sources in and out of the tail region of NGC 4038. Color V − I isplotted versus absolute magnitude MV , on the lower horizontal scale, and apparent magnitude V , on theupper horizontal scale. The absolute magnitude scale enables comparison between different tails. All sources,both in and outside of the tail, with errors in V less than 0.25 magnitudes and with −0.75 < V − I < 2.0,are included. Sources coming from the different WF chips are identified by special symbols as indicated inthe legend. No corrections have been made for incompleteness. The vertical dashed line indicates a roughboundary such that brighter sources are more likely to be clusters, rather than individual stars. The curverepresents the evolutionary track for an instantaneous burst model for a 105 M⊙ cluster with solar metallicityand a Salpeter IMF with a 125 M⊙cutoff, marked with log(age) in years (Bruzual & Charlot 1993; Charlot,Worthey, & Bressan 1996). This model would shift by a magnitude horizontally for every factor of 2.5 inmass.
26
0
1
2
3
1 1.5 2 2.5
0
1
2
3
1 1.5 2 2.5
0
1
2
3
Fig. 10.— Concentration index plots for the two nearest mergers, NGC 4038 and NGC 3256 (Western andEastern tails). Color V − I is plotted versus concentration index ∆V (0.5 − 3). The concentration index (arough measure of cluster size) was calculated from the difference in V magnitude between an aperture of0.5 and 3.0 pixel radii. Sources within the tail are indicated by solid circles, while those outside the tail areindicated by open circles.
27
18 20 22 24 26
2
1.5
1
.5
0
-.5
-14 -12 -10 -8 -6
66.5
7
7.5
8
8.5
9
18 20 22 24 26
2
1.5
1
.5
0
-.5
-14 -12 -10 -8 -6
66.5
7
7.5
8
8.5
9
18 20 22 24 26
2
1.5
1
.5
0
-.5
-14 -12 -10 -8 -6
66.5
7
7.5
8
8.5
9
18 20 22 24 26
2
1.5
1
.5
0
-.5
-14 -12 -10 -8 -6
66.5
7
7.5
8
8.5
9
Fig. 11.— Color magnitude diagrams, same as Figure 9, but for NGC 3256. The Western and Easternsources, in and out of the tails, are given in the top and bottom rows, respectively.
28

18 20 22 24 26
2
1.5
1
.5
0
-.5
-16 -14 -12 -10 -8
66.5
7
7.5
8
8.5
9
18 20 22 24 26
2
1.5
1
.5
0
-.5
-16 -14 -12 -10 -8
66.5
7
7.5
8
8.5
9
Fig. 12.— Same as Figure 9, but for NGC 3921. The horizontal line represents the median V − I for theclusters in the inner region of the merger.
29
18 20 22 24 26
2
1.5
1
.5
0
-.5
-16 -14 -12 -10 -8
66.5
7
7.5
8
8.5
9
18 20 22 24 26
2
1.5
1
.5
0
-.5
-16 -14 -12 -10 -8
66.5
7
7.5
8
8.5
9
18 20 22 24 26
2
1.5
1
.5
0
-.5
-16 -14 -12 -10 -8
66.5
7
7.5
8
8.5
9
18 20 22 24 26
2
1.5
1
.5
0
-.5
-16 -14 -12 -10 -8
66.5
7
7.5
8
8.5
9
Fig. 13.— Same as Figure 9, but for NGC 7252. The Western and Eastern sources, in and out of thetails, are given in the top and bottom rows, respectively. The sources in the tidal dwarfs at the end of theWestern and Eastern tails (see Figure 14) are indicated as “star symbols” of the shape corresponding tothe appropriate WF chip. For comparison, the horizontal dotted lines represent the colors of the two mainpopulations of clusters in the inner region of this merger. The evolutionary track for a single burst Bruzualand Charlot model (Bruzual & Charlot 1993) is given as in previous CMDs.
30
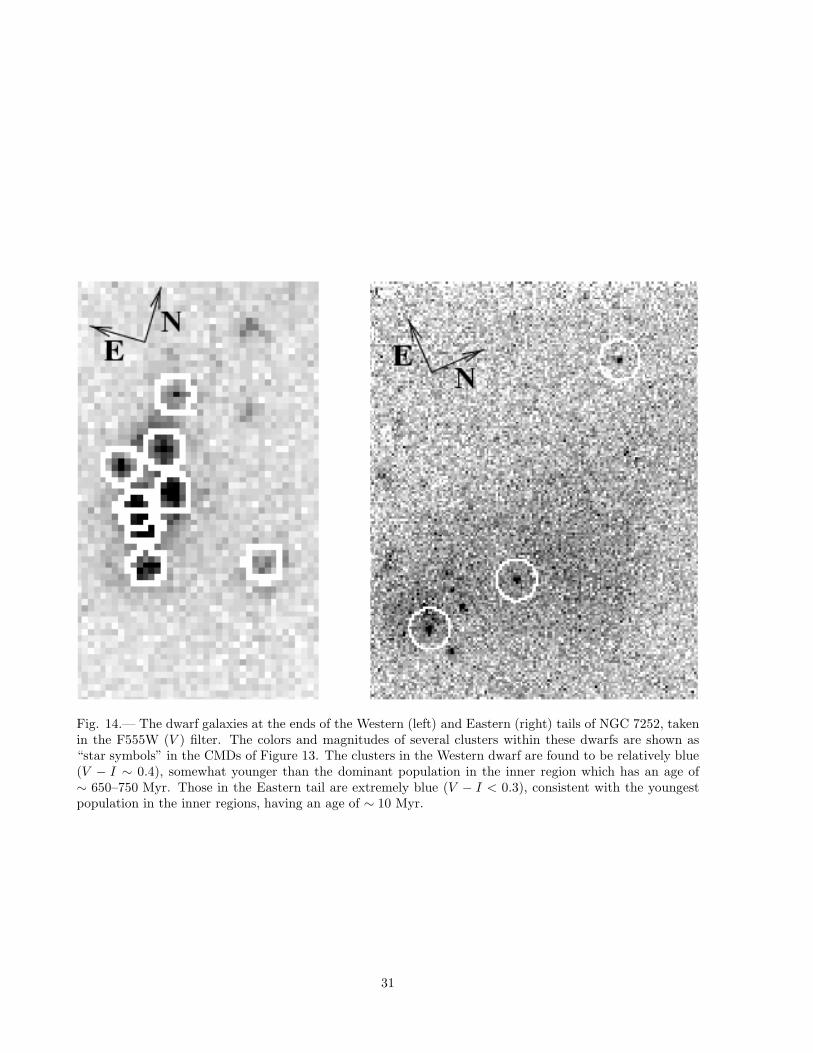
Fig. 14.— The dwarf galaxies at the ends of the Western (left) and Eastern (right) tails of NGC 7252, takenin the F555W (V ) filter. The colors and magnitudes of several clusters within these dwarfs are shown as“star symbols” in the CMDs of Figure 13. The clusters in the Western dwarf are found to be relatively blue(V − I ∼ 0.4), somewhat younger than the dominant population in the inner region which has an age of∼ 650–750 Myr. Those in the Eastern tail are extremely blue (V − I < 0.3), consistent with the youngestpopulation in the inner regions, having an age of ∼ 10 Myr.
31
-.05
0
.05
.1
.15
Fig. 15.— The number of candidate clusters per square kpc is compared for the six different areas of debris.Background sources were subtracted, statistically, using the source densities in areas “out–of–tail”. Theexcesses “in–tail” are plotted. Details of the calculation are given in Table 3.
32
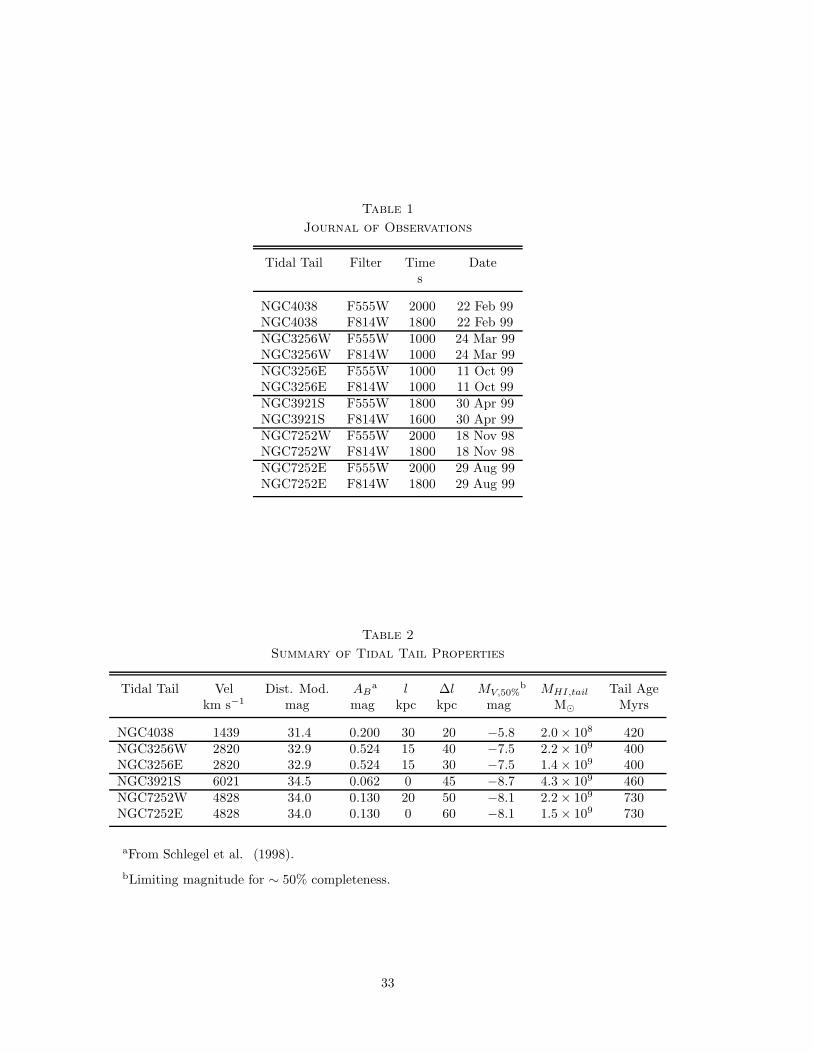
Table 1
Journal of Observations
Tidal Tail Filter Time Dates
NGC4038 F555W 2000 22 Feb 99NGC4038 F814W 1800 22 Feb 99NGC3256W F555W 1000 24 Mar 99NGC3256W F814W 1000 24 Mar 99NGC3256E F555W 1000 11 Oct 99NGC3256E F814W 1000 11 Oct 99NGC3921S F555W 1800 30 Apr 99NGC3921S F814W 1600 30 Apr 99NGC7252W F555W 2000 18 Nov 98NGC7252W F814W 1800 18 Nov 98NGC7252E F555W 2000 29 Aug 99NGC7252E F814W 1800 29 Aug 99
Table 2
Summary of Tidal Tail Properties
Tidal Tail Vel Dist. Mod. ABa l ∆l MV,50%
b MHI,tail Tail Agekm s−1 mag mag kpc kpc mag M⊙ Myrs
NGC4038 1439 31.4 0.200 30 20 −5.8 2.0× 10⁸ 420NGC3256W 2820 32.9 0.524 15 40 −7.5 2.2× 10⁹ 400NGC3256E 2820 32.9 0.524 15 30 −7.5 1.4× 10⁹ 400NGC3921S 6021 34.5 0.062 0 45 −8.7 4.3× 10⁹ 460NGC7252W 4828 34.0 0.130 20 50 −8.1 2.2× 10⁹ 730NGC7252E 4828 34.0 0.130 0 60 −8.1 1.5× 10⁹ 730
aFrom Schlegel et al. (1998).
bLimiting magnitude for ∼ 50% completeness.
33

Table 3
Source Densities In and Out of Debris
Tidal Tail Pixel Size Nout fout Nout/Area Nin fin Nin/Area Surplus Spec. Freq.pc kpc−2 kpc−2
NGC4038 8.92 1 0.501 0.013± 0.013 1 0.499 0.013 ± 0.013 0.000 ± 0.018 0.0NGC3256W 18.2 12 0.677 0.028± 0.008 28 0.323 0.136 ± 0.026 0.108 ± 0.027 2.5NGC3256E 18.2 4 0.538 0.012± 0.006 9 0.462 0.031 ± 0.010 0.019 ± 0.012 0.4NGC3921S 38.8 7 0.751 0.003± 0.001 9 0.249 0.013 ± 0.004 0.010 ± 0.004 0.2NGC7252W 31.1 5 0.623 0.004± 0.002 13 0.377 0.019 ± 0.005 0.015 ± 0.005 1.1NGC7252E 31.1 13 0.618 0.011± 0.003 7 0.382 0.010 ± 0.004 −0.001± 0.005 −0.2
Table 4
Star Formation Rates of Merging Pairs
Pair FFIR SFRerg cm−2 s−1 M⊙ yr−1
NGC4038/9a 2.6× 10⁻⁹ 5.2
NGC3256b 4.32× 10⁻⁹ 33.4
NGC3921b (2.69− 5.25)× 10−11 1.9NGC7252c 2.37× 10⁻¹⁰ 5.4
aFrom Ranalli, Comastri, & Setti (2003).
bFrom Moshir et al. (1990).
cFrom Knapp et al. (1989).
34