arxiv:nucl-ex/0106003v1 1 jun 2001
TRANSCRIPT

arX
iv:n
ucl-
ex/0
1060
03v1
1 J
un 2
001
Response of CsI(Tl) scintillators over a large
range in energy and atomic number of ions
(Part II): calibration and identification in the
INDRA array
M. Parlog a,b, B. Borderie b,1, M.F. Rivet b, G. Tabacaru a,b,A. Chbihi c, M. Elouardi d, N. Le Neindre e, O. Lopez e,
E. Plagnol b, L. Tassan-Got b, G. Auger c, Ch.O. Bacri b,N. Bellaize e, F. Bocage e, R. Bougault e, B. Bouriquet c,
R. Brou e, P. Buchet f, J.L. Charvet f, J. Colin e, D. Cussol e,
R. Dayras f, A. Demeyer g, D. Dore f, D. Durand e,J.D. Frankland c, E. Galichet b,i, E. Genouin-Duhamel e,
E. Gerlic g, S. Hudan c, D. Guinet g, P. Lautesse g, F. Lavaud b,J.L. Laville c, J.F. Lecolley e, C. Leduc g, R. Legrain f,
M. Louvel e, A.M. Maskay g, L. Nalpas f, J. Normand e,J. Peter e, E. Rosato h, F. Saint-Laurent c,2, J.C. Steckmeyer e,
B. Tamain e, O. Tirel c, E. Vient e, C. Volant f, J.P. Wieleczko c
(INDRA collaboration)
aNational Institute for Physics and Nuclear Engineering, RO-76900Bucharest-Magurele, Romania
bInstitut de Physique Nucleaire, IN2P3-CNRS, F-91406 Orsay Cedex, France.cGANIL, CEA et IN2P3-CNRS, B.P. 5027, F-14076 Caen Cedex, France.
dLaboratoire de Physique Nucleaire Appliquee, Kenitra, Maroc.
eLPC, IN2P3-CNRS, ISMRA et Universite, F-14050 Caen Cedex, France.fDAPNIA/SPhN, CEA/Saclay, F-91191 Gif sur Yvette Cedex, France.gInstitut de Physique Nucleaire, IN2P3-CNRS et Universite, F-69622
Villeurbanne Cedex, France.hDipartimento di Scienze Fisiche e Sezione INFN, Universita di Napoli “Federico
II”, I80126 Napoli, Italy.iConservatoire National des Arts et Metiers, F-75141 Paris cedex 03.
Abstract
Preprint submitted to Elsevier Preprint 22 October 2018

The light output of the 324 CsI(Tl) scintillators of INDRA has been measured overa large range both in energy: 1− 80 AMeV and in atomic number of incident ions:Z = 1 − 60. An analytical expression for the nonlinear total light response as afunction of the energy and the identity of the ion is proposed. It depends on fourparameters. For three of them, connected to CsI(Tl) intrinsic characteristics, recom-mended fixed values are proposed. They are issued from the comparative study ofthe forward scintillators of INDRA, based on intermediate mass fragment data. Thefourth one, related to light collection and to the gain of the associated photomulti-plier, is particular and may be accurately obtained afterwards, from light chargedparticle data. Two applications are presented: fragment identification in telescopesusing a CsI(Tl) crystal as residual energy detector and the scintillator energy cal-ibration. The results are successfully confronted to heavy fragment experimentaldata.
Key words: PACS number: 29.40.Mc, 32.50.+d(light response of CsI(Tl) to heavy ions, quenching, delta rays)
1 Introduction
INDRA is a 4π axially symmetrical array for the detection of light and heavycharged nuclear reaction products [1,2] covering huge dynamic ranges, both inenergy (from ≈1 MeV to the maximum available energy ≈6 GeV at GANIL)and in atomic number (from proton to uranium). It has a high granularityand a shell structure, consisting of several detection layers. For the last layer,which should stop all particles and fragments produced using GANIL beams,thallium-activated caesium iodide scintillators (CsI(Tl)) coupled to photomul-tiplier tubes were chosen.
The standard calibration procedure for CsI(Tl) is to find a function L depend-ing on the energy, but also on the identity of the particle, which describesreasonably well the induced scintillation Q0. The parameters of this functionare determined by a global fit procedure which simultaneousely compares thecalculated scintillator response to the experimental one for all particles andfragments of well known energies. Afterwards, the unknown energies of the re-action products detected in physical runs are found by means of the calibrationfunction and the related parameters, starting from the measured associatedlight outputs. Once this is accomplished, one may get a reference map for the
1 Corresponding author. Tel 33 1 69157148; fax 33 1 69154507; e-mail [email protected] present address: DRFC/STEP, CEA/Cadarache, F-13018 Saint-Paul-lez-DuranceCedex, France.
2

identification of the reaction products in a two-dimensional plot showing theenergy deposited in the preceding detection layer, for every fragment punchingthrough, versus the total light from the CsI(Tl) crystal. This is the second aimof our work.
For the forward angles of INDRA (3◦ < θ < 45◦, rings 2 - 9), the detectionlayers which precede the scintillators consists of gas ionisation chambers (ICs)and 300 µm silicon detectors. The Si detectors have allowed an accurate de-termination of the residual energy - as presented in subsection 2.2 - for thewhole range of fragments passing through and stopped in the scintillators.Thus, there is a tremendous set of data which has facilitated a detailed studyof the CsI(Tl) crystal light response, having led to a convenient expressionwhich describes the total scintillation.
Both components of the procedure, measured scintillation and its modellingfunction, have implied special processing. In the case of INDRA, neither theamplitude of the CsI(Tl) associated signals nor the integral of these signals aremeasured. Instead, fractions of the total signal are integrated into two timegates, allowing particle identification. Both integrals have rather complex de-pendences versus the incident particle energy as compared to the whole inte-gral. It is possible to accurately find the latter quantity by software, startingfrom the two measured signal fractions, as shown in sections 2 and 3.
The exact expression of the total light output of a CsI(Tl) crystal, as predictedby the recombination and nuclear quenching model (RNQM) [3], implies a nu-merical integration over the energy and this fact is prohibitive for applicationpurposes. Under suitable approximations, the integration may be however an-alytically performed and a very easily to handle light response expression isdeduced. Starting from intermediate mass fragments of known energies, the3 or 4 involved parameters are determined. Except for the gain parameter,proper to each scintillator crystal and corresponding electronic chain, the val-ues of the other associated fit parameters are fixed, as being connected tointrinsic CsI(Tl) crystal properties. Procedures for fragment identification ina ∆E − Q0 telescope-type map, with the scintillator as residual energy de-tector, as well as for the energy calibration of the latter one - in the wholedynamic range - are developed and critically analyzed in section 4, containingthe RNQM applications.
For the backward angles of INDRA (45◦ < θ < 176◦, rings 10 - 17), thescintillators are preceded only by ionization chambers. The calibration of thescintillators leans on the above mentioned light response expression and theCsI(Tl) characteristic parameter values, found at forward angles; the indi-vidual gain parameter is determined by means of light charged particle andeventually light fragment data. The calibration so found allows to safely ex-trapolate the charge identification in a ∆E−Q0 map to regions where no ridge
3

lines are visible because of very low statistics, improving then both charge andenergy determination for heavy fragments (Z ≥ 15) detected beyond 45◦ withINDRA. Details are given in section 4.
Our findings are summarized in section 5.
Notation and values of physical constants and variables used in this paper.See also those in the preceding paper [3].
4

Symbol∗ Definition Units or Value
Experimental light output and related variables
t time s
i(t) signal at the last dynode of the CsI(Tl)photomultiplier (PMT)
a.u. s−1
Qf integral charge of the fast component ofthe signal
a.u.
τf decay time constant of the fast component s
Qs integral charge of the slow component ofthe signal
a.u.
τs decay time constant of the slowcomponent
s
Qfs integral charge corresponding to the wholesignal
a.u.
imes(t) measured signal at the output of the PMTanodic circuit
a.u. s−1
Q0 approximate total integrated charge ∝ ex-perimental light output
a.u.
τ0 decay time constant s
τ0min lower value of the decay time constant s
τ rise time constant at output of the PMT s
F experimental charge integrated in the“fast” gate
a.u.
S experimental charge integrated in the“slow” gate
a.u.
Calculated light output and related variables
Ce,n constants in the approximative expres-sions of Se,n
a.u.
a1 gain fit parameter in the friendly analyti-cal expression of L
a.u.
a2 quenching fit parameter in the friendly an-alytical expression of L
a.u.
a3 eδ fit parameter in the friendly analyticalexpression of L
MeV
a4 fractional energy loss transferred to a δ -ray, a fit parameter in the friendly analyt-ical expression of L
fgeom light collection factor a.u.
fPMT PMT gain factor a.u.
5

∗Most of the notations of the original references have been kept.
2 The thallium-activated caesium iodide scintillators
2.1 CsI(Tl) crystals of INDRA and associated electronics
There are 324 CsI(Tl) crystals in all, with thicknesses ranging between 138mm and 50 mm from forward to backward angles [1]. All the crystals belong-ing to one ring have identical shape and size. Because the light output of theCsI(Tl) crystals critically depends on the temperature [4,5], a water coolingsystem stabilizes at 20◦C the temperature in the mechanical supports of theCsI(Tl). The CsI(Tl) crystals are coupled to photomultipliers tubes (PMT)[1]. The use of PMTs provides lower energy thresholds for mass identificationas compared to those obtained with photodiodes [6]. The stability control ofthe scintillators is ensured by optically connecting them to a laser system [1],which makes use of a nitrogen laser [7], emitting in the ultraviolet (UV) band,and CsI(Tl) light distributors. The CsI(Tl) PMT signals are fed in 24 inputVXI bus modules containing the processing functions. Each channel comprisesa constant fraction discriminator, two integrators for “fast” and “slow” partswith accompanying delay and gate generators. The analog to digital conversionis performed by two multiplexed 12 bit converters. Exhaustive descriptions ofthe CsI(Tl), PMT and associated electronics, as well as of the data acquisitionand triggering system are given in [1,2]. We are doing here only a short pre-sentation, stressing those details which are necessary to make comprehensiblethe procedures concerning the CsI(Tl) energy calibration and the fragmentidentification in the IC – CsI(Tl) maps of the backward rings. For energy cal-ibration purpose, rings 10 – 17 were each equipped with a single two-elementtelescope (80 µm and 2 mm thick silicon detectors) - which will be referred toas the calibration telescope (CT). The CT covers part of one of the CsI(Tl)crystals in each backward ring.
2.2 Calculation of the deposited energy into the scintillators
For rings 2 - 9, the calculation of the energy deposited into the CsI(Tl) crystalto which a given light output corresponds - E0 - is based on the energy lost inthe preceding layer of a detection cell of INDRA, using the nominal thickness ofeach silicon detector (≈ 300µm). The silicon detectors were carefully calibratedtaking into account the pulse height defect, with an absolute accuracy of2 − 3%. [8]. However, the relative accuracy - between different ions up to Xeand for different energies up to 80 AMeV - is within 1%. For ions as light
6

as Boron, the consequent relative accuracy for the residual energy in CsI(Tl)crystal is 1.3% at 50 AMeV, 1.4% at 25 AMeV and 3% at 5 AMeV. For ionsas heavy as Xenon, the consequent relative accuracy for the residual energyin CsI(Tl) crystal is 1.8% at 50 AMeV, 2.5% at 25 AMeV and 10% at 5AMeV. One has to note that the relative accuracy of the total energy of theion, deposited in both Si and CsI(Tl) detectors never exceeds 2−3%. Startingfrom the energy deposited in the 300µm Si detector, and by using the stoppingpower tables of Hubert et al. [9] above 2.5 AMeV and the renormalized variantof those of Northcliffe and Schilling [10] under 2.5 AMeV, the residual energydeposited in the scintillator placed behind it is calculated. For light chargedparticles and light fragments (Z ≤ 4), the mass is identified, while for heavierfragments, an hypothesis is necessary for the mass.
For rings 10 - 17, the CTs play the essential role in estimation of the energydeposited into the scintillators, as providing reference energy spectra. Insteadof directly looking for the correspondence: total light output - deposited en-ergy into the scintillator, event by event, the incremented spectrum (for eachreaction product) is compared to the associated reference one, to which it isstretched. The calibration procedure for the backward rings is presented insubsection 4.4, followed by a description of a rapid fragment identificationrecipe making use of the same mentioned expression.
All along this paper, the Xe + Sn system at 32 and 50 AMeV incident ener-gies is used and emitting reaction products over a large range, in energy andatomic number, have been selected. The experimental data were taped only formultiplicities higher than or equal to 4 (multiplicity ≥ 4). Thus, the reactionproducts in the present application originate only in exit channels involvinga non negligible transfer of kinetic energy into internal degrees of freedom.As a consequence, the emitted primary fragments have excitation energies(greater than around 1.5 AMeV) leading mainly to neutron evaporation. Thesecondary fragments (after evaporation) populate the “attractor” line in themap of nuclides [11] rather than the “stability” line. The corresponding massformula [11] will be consequently employed when the isotopic mass was notdetermined. In most of the cases, one CsI(Tl) detector will be used (module 2of ring 3) to illustrate the described procedure. The nominal thickness of thepreceding silicon detector is 304µm.
2.3 The shape of the signal
The light emitted by a CsI(Tl) crystal hit by a charged reaction producthas a rise time negligible [12–14] as compared to the decay time which is inthe microsecond range. The rise time is related to the transfer of the energydeposited by the particle to the optical level involved into the scintillation,
7

while the decay time constant concerns the light emission.
Traditionally, the decaying part of a CsI(Tl) scintillation is described by one[15,16] or two [13] exponentials of short decay-constant (≈ 1µs) or, more often,by one short decay-constant exponential (≈ 1µs) and one long decay-constantexponential (7 µs [17]). The short decay-constant depends on the identity ofthe particle, while the long one is considered to be the same for all particles.
Proton induced signals recorded by means of flash ADCs up to 20 µs [18]have shown decaying parts which are curved in a semilogarithmic scale, witha steep descent in the first 3-4 µs, which includes the larger part of the integralof the signal. The lower is the incident energy, the steeper is this part of thesignal and the higher is its weight in the signal integral. For very low energy(a few MeV), the shape of the decaying signal is a straight line in a semiloga-rithmic representation versus time, i.e. it shows an exponential decaying timedependence. At higher energy, several exponentials would be necessary for aperfect description of the shape of the whole decaying curve. As in Ref. [17],the authors of Ref. [18] have kept only two. The first one – the “fast compo-nent” – for the dominant steep descent part, has a short decay-constant (0.5µs – 1 µs), with a strong dependence on the atomic number Z, mass numberA and incident energy E0 of the particle. The second one – the “slow compo-nent” – has a long decay-constant (5 µs [18]) nearly independent of the typeof particle.
Pulse shape analysis allows particle discrimination up to Z=5 for the CsI(Tl)scintillators of INDRA. At the highest energies in Ref. [18], the fast componentcovers at least ≈ 65 % of the integral of the signal for hydrogen isotopes at 20- 40 AMeV, ≈ 75 % for helium ones at 30 AMeV, ≈ 85% for light fragments(Z=3-6) at 15 - 25 AMeV [18] and at least 95 % for heavy fragments, as shownin Fig. 1 for Si at 8 AMeV and Kr at 50 AMeV (present work). The abovementioned weights become even more important when the incident energy E0
decreases, i.e. when the average specific electronic stopping power E0/R(E0)(for which a good estimate, within a mutiplicative factor, is AZ2/E0) is highenough. R(E0) is the corresponding particle range, and the estimate of theaverage specific electronic stopping power is derived from the approximationof Bethe-Bloch formula −(dE/dx)e ∝ AZ2/E. From the above considerations,one may assume in the latter case that only one decay-constant τ0(E0,A,Z) isinvolved for each event. Its value will be close to that of the fast component.
A signal at the crystal PMT output, described as in Ref. [18] by two expo-nential functions associated to the fast and slow component respectively:
i(t) =Qf
τfe−
t
τf +Qs
τse−
t
τs , (1)
8

10-1
1
10V (
mV
)
28Si 8 AMeV
102
103
0 500 1000 1500 2000 2500 3000
t (ns)
V (
mV
)
84Kr 50 AMeV
Fig. 1. The shape of the measured light signals induced by 8 AMeV 28Si and 50AMeV 84Kr ions in two different CsI(Tl) crystals of INDRA - solid symbols - iswell described by one exponential decaying curve provided by Eq. (3).
has the total light response corresponding charge Qfs = Qf + Qs got by inte-grating i(t) over time between 0 and ∞.
In one exponential approximation, the same signal would be:
i(t) =Q0
τ0e−
t
τ0 , (2)
where Q0 approximates the integral of the signal, Qfs.
3 Reconstruction of the total light output
In the case of INDRA, only parts F , S of the signal are integrated in the timegates 0 – 400 ns and 1600 – 3100 ns, respectively. Let us make the followingexercise: consider the expressions of F and S provided by the two exponentialformula of the signal (1) on one hand, and by the one exponential formula(2) of the signal, on the other hand. The values of the expressions of F andS found in both cases have to be equal. From these equalities, one can deriveτ0 and the ratio Q0/Qfs for the data in Ref. [18], but making use of the time
9

0.88
0.9
0.92
0.94
0.96
0.98
1
1.02
0 1 2 3 4
p
AZ2/E0
Q0/Q
fs
d
AZ2/E0
Q0/Q
fs
t
AZ2/E0
Q0/Q
fs
α
AZ2/E0
Q0/Q
fs
Li
AZ2/E0
Q0/Q
fs
Be
AZ2/E0
Q0/Q
fs
B
AZ2/E0
Q0/Q
fs
C
AZ2/E0
Q0/Q
fs
a)
0.4 0.6 0.8 1
p
τ0min/τ0
d
τ0min/τ0
t
τ0min/τ0
α
τ0min/τ0
Li
τ0min/τ0
Be
τ0min/τ0
B
τ0min/τ0
C
τ0min/τ0
b)
Fig. 2. Q0 is the approximate integral of the light signal when one decaying ex-ponential shape, of decay-constant τ0 (Eq. 2), is assumed. Qfs is the true one,corresponding to two decaying exponential shape (Eq. (1)). Their ratio increaseswith: a) the estimate of the average specific electronic stopping power ∝ AZ2/E0
(E0 in MeV), b) the inverse ratio of τ0; τ0min is a normalization constant. Processeddata from Ref. [18].
gates of INDRA. The results of this estimation are plotted in Fig 2a) againstthe estimate AZ2/E0 of the average specific electronic stopping power. Thisplot has a predictive character: the maximum error done in the integral of thesignal estimation would be of about ≈ 10% in the case of the most energeticprotons but much lower for the charged reaction products with Z > 1. Fig.2b) shows the ratio Q0/Qfs versus the reciprocal of the decay-constant valueτ0 of the ion in question; the normalization constant τ0min is in fact the lowermeasured value for ions at the lowest energies (≈ 1 AMeV) and hence thehighest stopping powers. This kind of plot could eventually be used in orderto correct Q0. In any case, as long as AZ2/E0 ≥ 0.4 (e.g. Ar ions with E0/A≤ 810 MeV/nucleon), Q0 estimates Qfs within 2%. This is the case for mostof our data.
In view of the above argument, we shall suppose in the following that the
10

current at the last dynode of the PMT associated to a CsI(Tl) scintillatorvaries exponentially in time as in Eq. (2), where Q0 is the total charge. Thiscurrent, injected in the anodic circuit of the PMT, leads to the measuredcurrent at the output of the PMT base imes(t), which may be expressed [19]by means of the equation:
imes(t) =Q0
τ0 − τ
(
e−t
τ0 − e−t
τ
)
. (3)
The total light output is proportional to the total charge Q0; τ and τ0 arethe rise time and decay time constants respectively. τ has been measured forthe bases of all PMT (60 ns for rings 11 - 16 and 20 ns for other rings). Theshape of the signal given by equation (3) is shown in Fig. 1. By integratingexpression (3) within the gates mentioned above, one obtains:
F =Q0
τ0 − τ
[
τ0(
1− e−t1/τ0)
− τ(
1− e−t1/τ)]
(4)
S≈Q0τ0τ0 − τ
[
e−t2/τ0 − e−t3/τ0]
, (5)
with t1=390 ns, t2=1590 ns and t3=3090 ns (the integration gates have un-dergone a diminution of 10 ns according to the delay of the signal in the VXIcards). The reason why it was necessary to approximate the decaying shapeof the signal by a single exponential function of time - eq. (3) - is that inINDRA experiments, only F and S (the channels of the charge convertorscorresponding to the two gates) are measured and not the integral of the sig-nal. Under this assumption and by means of the two eqs. (4) and (5), it ispossible to find the two unknown quantities τ0 and Q0 and therefore, withina multiplicative constant, the total experimental light output. The measuredresolutions (FWHM) of the CsI(Tl) crystals for Si of 7.86 AMeV and α parti-cles of 21 AMeV are of ≈ 3% for F and ≈ 4% for S. This leads to an accuracyof ≈ 1.3% for Q0 above 10 AMeV. Below a total energy of 10 MeV the ac-curacy progressively goes down to 3 - 4%, which roughly corresponds to themeasured resolution on the total light for α particles of 5 MeV. For protons of21 MeV, the resolutions (FWHM) are: ≈ 4% for F and ≈ 7% for S, leading toan accuracy of ≈ 2% for Q0 above 10 MeV. Below this energy, the accuracyprogressively goes down to 6 - 7%.
4 Approximate formula from RNQM model
11
4.1 Analytical integration
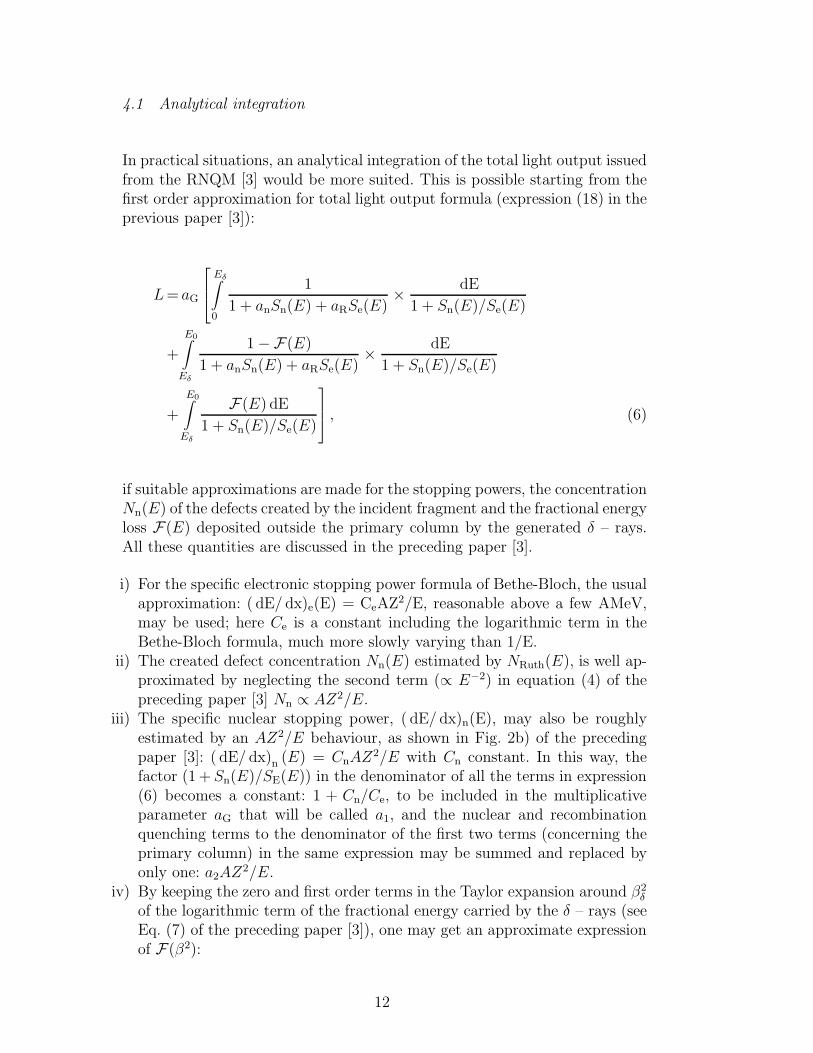
In practical situations, an analytical integration of the total light output issuedfrom the RNQM [3] would be more suited. This is possible starting from thefirst order approximation for total light output formula (expression (18) in theprevious paper [3]):
L= aG
Eδ∫
0
1
1 + anSn(E) + aRSe(E)×
dE
1 + Sn(E)/Se(E)
+
E0∫
Eδ
1− F(E)
1 + anSn(E) + aRSe(E)×
dE
1 + Sn(E)/Se(E)
+
E0∫
Eδ
F(E) dE
1 + Sn(E)/Se(E)
, (6)
if suitable approximations are made for the stopping powers, the concentrationNn(E) of the defects created by the incident fragment and the fractional energyloss F(E) deposited outside the primary column by the generated δ – rays.All these quantities are discussed in the preceding paper [3].
i) For the specific electronic stopping power formula of Bethe-Bloch, the usualapproximation: ( dE/ dx)e(E) = CeAZ
2/E, reasonable above a few AMeV,may be used; here Ce is a constant including the logarithmic term in theBethe-Bloch formula, much more slowly varying than 1/E.
ii) The created defect concentration Nn(E) estimated by NRuth(E), is well ap-proximated by neglecting the second term (∝ E−2) in equation (4) of thepreceding paper [3] Nn ∝ AZ2/E.
iii) The specific nuclear stopping power, ( dE/ dx)n(E), may also be roughlyestimated by an AZ2/E behaviour, as shown in Fig. 2b) of the precedingpaper [3]: ( dE/ dx)n (E) = CnAZ
2/E with Cn constant. In this way, thefactor (1 + Sn(E)/SE(E)) in the denominator of all the terms in expression(6) becomes a constant: 1 + Cn/Ce, to be included in the multiplicativeparameter aG that will be called a1, and the nuclear and recombinationquenching terms to the denominator of the first two terms (concerning theprimary column) in the same expression may be summed and replaced byonly one: a2AZ
2/E.iv) By keeping the zero and first order terms in the Taylor expansion around β2
δ
of the logarithmic term of the fractional energy carried by the δ – rays (seeEq. (7) of the preceding paper [3]), one may get an approximate expressionof F(β2):
12

Table 1Fit parameters a1, a2, a3, a4. The errors on the parameters (one unit on the lastdigit) are only statistical. The analytically integrated expression (9) of the totallight output has been used: a) values obtained by means of data available in thewhole ion range, for a forward module (θ = 4.5◦) of INDRA; b) values averagedover 8 modules placed on the forward rings (θ ≤ 45◦) obtained only by means ofintermediate mass fragments and light charged particles. These recommended valuesof a2, a3, a4 to be used in Eq. (9) are suitable for all INDRA CsI(Tl) crystals.
a) b)
a1 [a.u.] 19.5 variable
a2 [a.u.] 0.71 0.25
a3 [MeV/u] 3.8 3.1 (1.0)∗
a4 0.26 0.27∗ see the text for explanation
F(β2) =1
2
β2
β2
δ
− 1
ln(2mec2
Iβ2δ ) +
β2
β2
δ
− 1. (7)
With the above items i)–iv) assumptions, the first order approximation for-mula (6) of the total light output depends on three parameters only and maybe analytically integrated. The quality of the fragment loci reproduction in a∆ESi −Q0 map will be shown in the next subsection.
4.2 A friendly analytical formula for the total light output
The alternative to the item iv) approximation of the fractional energy carriedby the δ – rays is to consider it as a step function of energy:
13

0
1000
2000
3000
4000
5000
6000
7000
0 200 400 600 800 1000 1200 1400
Z=5
Z=45
E0 (MeV)
Lig
ht
ou
tpu
t (a
.u.)
Fig. 3. Total light output against the energy for different ions (∆Z = 5): the symbolsare experimental data from the system Xe + Sn at 32 and 50 AMeV; the curves arecalculations done with the simple light output formula Eq. (9).
F(E) ={
0, E/A ≤ a3a4, E/A > a3
, (8)
where a3 is the energy per nucleon threshold for the δ – ray production and a4will be a fit parameter too. The advantage is that the first order approximationof total light output expression (6) becomes a simple, easily to handle one:
L = a1
E0
1− a2AZ2
E0
ln
1 +1
a2AZ2
E0
+ a4a2AZ2 ln
(
E0 + a2AZ2
Eδ + a2AZ2
)
(9)
(Eδ = A × a3), very suitable for energy calibration purposes. The fit param-eter values are given in column a) of Table 1, and the quality of the fit isshown in Figs. 3,4 (solid lines) and 5. Even if the total light outputs are nomore as nicely reproduced as by exact calculations [3], especially for high spe-cific electronic stopping power values, the description of the reaction productidentification in the two-dimensional plot (Fig. 4) and the deviations of the
14

0
500
1000
1500
2000
2500
3000
0 2000 4000 6000 8000 10000 12000 14000Z=5
Z=45
Light output (a.u.)
∆ESi (
Me
V)
Fig. 4. A ∆ESi−Q0 map (module 2, ring 3 of INDRA) from the sytem Xe + Sn at32 and 50 AMeV. The symbols are experimental data. For the calculated total lightoutput, the approximations i) - iv) from subsection 4.1 have allowed an analyticalintegration, by making use of two approximate expressions of F : Eq. (7) - dashedlines - and the step function Eq. (8) - solid lines; the dotted lines are obtained ifthe δ – rays are completely neglected (F = 0) (subsection 4.5).
calculated energies relative to the true energies (Fig. 5) remain comparable tothe exact calculation case. More precisely, the heavy fragment identificationin a ∆E − Q0 map is possible with a resolution of one unit charge aroundZ=40. The corresponding energy deviations may locally reach up to 15% -20%, but globally there are inside ≈ 6%. About 3% of accuracy are lost ascompared to the exact calculations. Note in Fig. 4 that the step function ap-proximation for F (solid lines) does not worsen the result as compared to thephysical approximation (7) (dashed lines). In fact, it is approximation i) forthe Bethe-Bloch formula which is distorting - via the fit procedure - the shapeof the light response for the heaviest fragments (Fig. 3).
For the energetic light charged particles, there are discrepancies at high energy,whose origin is the slight underestimation of total light output (see sect 2.3).For energy calibration purpose, the recipe to ameliorate the situation was to
15

-20
0
a)
Z=5
De
via
tio
n (
%)
0
100
200
b)
-20
0Z=14
0
100
200
-20
0Z=23
0
25
50
-20
0Z=32
0
10
20
-20
0Z=41
0
2
4
-20
0
0 20 40 60 80
Z=50
E0/A (MeV/A)
0
1
2
-20 -10 0 10 20
Deviation (%)
Fig. 5. Deviations (in %) of the energy values, determined with the simple lightoutput formula Eq. (9), from the true energy values for several products of thereactions Xe + Sn at 32 and 50 AMeV: a) deviations plotted against the productenergy per nucleon: symbols; the regions between curves show the accuracy of thetrue energy per nucleon (see subsection 2.2 for details); b) deviation histograms.
use a different gain parameter a1 for low average specific electronic stoppingpower ((AZ2/E0 < 0.4), or directly for protons, which constitute most ofthe data for which the experimentally determined Q0 differs from the realexperimental light output by ≈ 2−10% (Fig. 2a)). The alternative could be aprevious correction of Q0 concerning these data, based on the τ0min/τ0 values,as suggested by Fig. 2b).
An interesting point is that the gain parameter values got by using only lightfragments, or even light charged particles are very near the values obtainedby using a large ion data range up to Z=45, if the other parameters, providedby the whole range of ions, are kept constant at the values given in Table1a). Such a conclusion clearly appears in Fig. 6: a1 values are found nearlyindependent of the upper limit in Z (Zmax) considered, when the last threeparameters are fixed . If only a3, a4 are kept constant at the mentioned values,a1, a2 remain practically the same as long as Zmax ≥ 14. Otherwise, as the light
16

16
18
20
22
24
2 3 7 10 14 28 45
Zmax
a1
Fig. 6. Variation of the parameter a1 as a function of the upper limit of Z consideredfor fit; a2, a3, a4 were kept fixed with values from Table 1a). The error bars aresmaller than the symbols because only statistical errors on the parameters havebeen considered.
response induced by intermediate mass fragments or light charged particles isless non-linear than that corresponding to heavy ions, the parameter a2 hasthe tendency to diminish and, consequently, a1 too, for the same quality ofthe description.
A search of the fit parameter values was performed for one module of each ofthe 8 forward rings equipped with preceding silicon detectors, by using as inputdata the light outputs induced by intermediate mass fragments, accessible inthe covered angular domain (θ ≤ 45◦) for the studied system. It has led to verysimilar values of the parameters a3, a4, close to those provided by large Z andE0 scale data. The quenching parameter a2 is related to the average stoppingpower of the reaction product, i.e. to its identity and energy, but also to theactivator concentration of the crystal, as we shall see in the next subsection. Itmay vary from one to another ring, but not dramatically. The correspondingaveraged values of these 3 parameters - presented in column b) of Table 1 - arethe recommended values for the applications when formula (9) is used. a3 wasdecreased at the lower detection threshold (the value in parenthesis) in order toavoid the discontinuity in the energy spectra induced by the “non-derivability”at E = Eδ of the light output expression as a function of the energy. By keepinga2, a3, a4 fixed, the remaining gain parameter may be accurately determinedas a free parameter by using simply light charged particles. The results arevery similar to those shown in Figs. 3,4 with solid lines and in Fig. 5.
17

4.3 Comparative study of the CsI(Tl) crystals of INDRA
The total light output friendly formula (9) was used to perform a compar-ative study of the CsI(Tl) crystals of INDRA. At forward angles (rings 2 -9), the experimental values were obtained from elastically scattered light ionson various targets (C, Al, Au). The light ions were produced by secondarybeams with atomic number Z = 1 - 6 and mass number A precisely identi-fied. The threshold energy per nucleon eδ required to generate δ – rays whichcontribute to the scintillation is an intrinsic characteristic of the CsI crystals.Consequently, after a grid search over all the modules of the 8 forward rings,the parameters a3, and hence a4 too, were fixed. The crystals belonging to onering have the same size, the same shape and similar Tl (as well as eventuallydefect) concentrations. The gains of the associated PMT are the same. Forthis reason, one would expect that the parameters a1 and a2:
a1 ∝ fgeom × fPMT ×ΛAeNA
ΛAeNA + ΛDND
, a2 ∝1
ΛAeNA + ΛDND
,
take nearly the same values for the modules of one ring; the quantities ΛAeNA,ΛDND were defined in the previous paper [3] and fgeom, fPMT are factorsconnected to the light collection (geometry of the crystal) and to the PMTgain, respectively. Actually, this is the situation, as shown in Fig. 7a),b) forthe modules of ring 2.
If ΛDND/ΛAeNA ≪ 1, the parameter a1/fgeom is mainly related to the associ-ated PMT gain. The geometrical light collection factor fgeom is proportionalto the response of the crystal at 137Cs source γ – ray irradiation measuredwith the same PMT for all the crystals of INDRA. Averaged over the mod-ules of the same ring, the parameter < a1 > / < fgeom > plotted versusthe ring number, follows the approximately known values of the PMT gain(provided by the manufacturer) as shown in Fig. 7c). The correlation of thetwo parameters < a1 > and < a2 > may be followed in Fig. 7d), if < a1 >is previously corrected for the geometric and gain factors. Obviously, thereis no mathematical correlation: two groups of detectors are put in evidence.They may correspond to the different concentrations of the Tl activator - from200 ppm to 2000 ppm - (and eventually of the other crystal imperfection)which could appear during the CsI(Tl) crystal growth through the Bridgmanmethod [20]. At backward angles of INDRA (rings 10 - 17), only light chargedparticles, available from secondary beams at GANIL, could be used in the fitprocedure to get the results presented in Fig. 7c),d). For unitarity, in theselast two plots, we have also restricted the forward angle employed data to lightcharged particles only.
18

0
2
4
6
8
10
12
14
0 5 10 15 20
Module
a1
a)
0.2
0.25
0.3
0.35
0.4
0.45
0.5
0 5 10 15 20
Modulea
2
b)
105
5 10 15
<a1>/<fgeom>Gain
Ring
Ga
in
c)
0
0.05
0.1
0.15
0.2
0.25
0.3
0.35
0.4
0.45
0.5
0.04 0.06 0.08 0.1
<a1>/<fgeom>Gain×106
<a> 2
d)
Fig. 7. a), b) The fit parameters a1, a2 used in the simple formula (9) against themodule number for ring 2 of INDRA. c) The parameter < a1 >, averaged overall the modules of each ring and corrected for the light collection, versus the ringnumber; it follows the PMT gains - hatched area. d) The quenching parameter< a2 >, averaged over the modules of each ring, versus the parameter < a1 >corrected for light collection and PMT gain, averaged over the modules of the samering. The error bars are smaller than the symbols because only statistical errors onthe parameters have been considered.
The above statistics performed over more than 300 CsI(Tl) crystals belongingto INDRA array and the related considerations enforce the consistancy of theRNQM and of the exact or approximate light output expressions obtained inits framework. The parameters a3, a4 and, to a certain extent, a2 may be con-sidered as intrinsic characteristics of the CsI(Tl) scintillators used in nuclearphysics applications. Insofar, the rather simple formula (9) of the total lightoutput, together with the recommended values in Table 1b) constitute a pow-erful tool to be used in heavy ion experiments. Starting from easily to obtainlight charged particle experimental data (excluding protons if their total lightsignal is not directly measured), they allow to accomplish useful applicationssuch as heavy fragment identification and their energy determination, in caseof lack of directly related information. An example is given in the following
19

subsection.
4.4 Reaction product identification and energy calibration of the backwardangle modules of INDRA
There are two major difficulties when the CsI(Tl) scintillators of INDRAplaced at polar angle above 45◦ are exploited. Firstly, in a ∆EIC−Q0 map theidentification is perfect for low atomic number Z of the fragments (Z ≤ 15).For higher Z values the identification of the atomic number becomes uncer-tain, because of the poor statistics and the lower IC energy resolution, ascompared to the Si detectors. Secondly, at large angles it is quite difficult toobtain data of elastic scattering for fragments. Insofar, the calibration of themodule belonging to the same ring is performed in two stages.
In the first stage, we consider the CsI(Tl) partially obturated by the cali-bration telescope CT (Si(80 µm) - Si(Li) 2 mm), one per ring. Most of thefragments (Z ≥4) are stopped in the Si(Li) and therefore identified in the Si –Si(Li) telescope. The corresponding energy spectrum is built for each atomicnumber Z. There are energetic light charged particles (> 20 AMeV) passingthrough the silicon telescope and stopped in the CsI(Tl) crystal coupled be-hind. The calculated [9,10] residual energies are the “true” energies depositedin the scintillator. Relied on the analytical expression (9) of the light output,and using the recommended values from Table 1b) for parameters a2,a3 anda4, the parameter a1 is determined by a fit procedure. By means of theseparameters, the energy spectrum in the scintillator is built for each of thelight charged particles punching through the silicon telescope. Put togetherthe silicon telescope and CsI(Tl) scintillator spectra provide the whole energyspectrum for a given particle. These spectra and those of fragments up toZ=15 stopped in the Si – Si(Li) telescope are the reference spectra for the re-spective ring, concerning an energy range: Emin, Emax for each type of reactionproduct. At the same time, the parameters allow to perform Z identificationin a ∆EIC − Q0 map for the whole range of atomic number of light chargedparticles and fragments passing besides the silicon telescope and entering theCsI(Tl) coupled behind. The energy spectra of these reaction products werecompared with the reference spectra; the superposition is quite good.
In the second stage all the other CsI(Tl) scintillators of the ring are calibrated.The energy spectra of a given Z have to be identical to the corresponding refer-ence one (the trigger used in the experiments did not break the axial symmetryof INDRA). An energy spectrum, starting from the light response spectrum,is obtained by stretching it between Emin, Emax in order to reproduce the ref-erence spectrum. A χ2 minimizing procedure based on the MINUIT packagefrom CERN library is used. It provides the parameters a1, for the considered
20

1
10
102
103
pc
ou
nts d t
1
10
102
103
0 100 200
4He
0 100 200
3He
0 100 200
C
E0 (MeV)
Fig. 8. Energy spectra of light charged particles and fragments in one of the CsI(Tl)crystal of ring 10 of INDRA (symbols). They are compared to the same chargedreaction product energy spectra of the reference module (lines) of this ring.
module. The parameters ai (i=1,4) allow afterwards a complete Z identifica-tion in the ∆EIC − Q0 map. The energy spectra of the fragments stopped inthe respective scintillator are determined too [23]. The good quality of theprocedure is illustrated in Fig. 8, where energy spectra of different particlesstopped in one of the scintillators of ring 10 of INDRA are compared to thereference spectra of the same ring.
4.5 And if the δ – rays would be neglected?
We have to stress once again the importance of taking into account the δ –ray effect in the light output, especially for reaction products heavier thanintermediate mass fragments (Z ≥ 15). By neglecting it, only the first termin the right side of Eq. (9) would appear. The results remain reasonable forZ ≤ 15 but with values of the fit parameters which change significantly ascompared to the case where the knock-on electrons were taken into account.
21
The quality of the fit is drastically degraded for fragments heavier than Z=15.So are particle identification (Fig. 4) and energy calibration.
5 Conclusions
The data obtained with the INDRA array (large range in Z and E0) provideda good opportunity to proceed to a more basic study of the light outputof CsI(Tl) scintillators and to derive suitable calibration and identificationprocedures. Starting from the fast and the slow parts of the light output(fractions of the total light response integrated in the corresponding timegates), it was possible to rebuild the integral of the signal.
Under suitable approximations, the expression of the total light output de-rived in the preceding paper [3] may be analytically integrated. Even if up to3% of the accuracy may be lost, the fact presents the huge advantage of ex-tremely short computing time. The derived expressions, easily to handle, weresuccessfully applied for fragment identification in ∆ESi,IC − Q0 maps and forthe energy calibration of the CsI(Tl) scintillators. At forward angles, where aSi detection layer exists, these applications lead to an important reduction ofthe computing time. At backward angles, where two problems exist: fragmentidentification and energy calibration of the CsI(Tl) crystals, the above proce-dure plays an even more important role and corresponds to the optimum waywe have found to solve these two tasks.
A comparative study of the CsI(Tl) scintillators of INDRA has shown thatthe model parameters are meaningful quantities, related to the light collectionand the PMT gain, to the activator and eventually crystal imperfection con-centrations and to the δ – ray production energy threshold. Except the gainparameter, all the others are characteristics of the usual CsI(Tl) scintillators.Their averages, performed over the 324 CsI(Tl) crystals of INDRA, allowed tofind reliable, recommended parameter values. Together with the related totallight expression, they constitute good implements for energy calibration andheavy ion identification applications in heavy ion physics experiments.
References
[1] J. Pouthas et al., Nucl. Instr. and Meth. A 357 (1995) 418.
[2] J. Pouthas et al., Nucl. Instr. and Meth. A 369 (1996) 222.
[3] M. Parlog et al., Nucl. Instr. and Meth. A, preceding paper
22

[4] D. Williams, G. F. Snelling and J. Pickup, Nucl. Instr. and Meth. 39 (1966)141.
[5] D. W. Straecener et al., Nucl. Instr. and Meth. A 294 (1990) 485.
[6] D. Guinet et al.,Nucl. Instr. and Meth. A 278 (1989) 614.
[7] Laser Science Inc., Cambridge, MA, USA.
[8] G. Tabacaru et al., Nucl. Instr. and Meth. A 428 (1999) 379.
[9] F. Hubert, R. Bimbot, H. Gauvin, At. Data and Nucl. Data Tables 46 (1990)1.
[10] L. C. Northcliffe and R. F. Schillling, Nuclear Data Tables A7 (1970) 233.
[11] R. J. Charity, Phys. Rev. C 58 (1998) 1073.
[12] V. K. Liapidevski et al., PTE 2 (1974) 62.
[13] H. Grassmann, E. Lorentz and H. G. Moser, Nucl. Instr. and Meth. A 228(1985) 323.
[14] J. D. Valentine, W. M. Moses, S. E. Derenzo, D. K. Wehe and G. F. Knoll,Nucl. Instr. and Meth. A 325 (1993) 147.
[15] J. C. Robertson, J. G. Lynch and W. Jack, Proc. Phys. Soc. 78 (1961) 1188.
[16] J. C. Robertson and J. G. Lynch, Proc. Phys. Soc. 77 (1961) 751.
[17] R. S. Storey, W. Jack and A. Ward, Proc. Phys. Soc. 72 (1958) 1.
[18] F. Benrachi et al., Nucl. Instr. and Meth. A 281 (1989) 137.
[19] Glenn F. Knoll, Radiation detection and measurements, third edition, JohnWiley and Sons, Inc. (2000) 229.
[20] BDH-Merck Ltd, West Quay Rd, Poole, BH15 1HX, England.
[21] R. Gwin and R. B. Murray, Phys. Rev. 131 (1963) 501.
[22] F. S. Eby and W. K. Jentschke, Phys. Rev. 96 (1954) 911.
[23] N. Le Neindre, These docteur de l’Universite de Caen, (1999) LPCC T 99-02.
23