as and a level physics - pearson qualifications · 2020-01-10 · practical skills in physics at a...
TRANSCRIPT

AS and A Level
Physics
STUDENT GUIDE

© Pearson Education Ltd 2015. Copying permitted for purchasing institution only. This material is not copyright free. 2
Contents
Introduction 3
Developing practical skills in Physics 4
How will practical skills be tested? 5
Developing independent thinking 7
Physics practical skills 8
Designing investigations 8
Planning 8
Presenting data 9
Analysing 10
Use of mathematics 11
Evaluating uncertainties 11
Terminology in practical physics 13
Core practicals 14
List of core practicals 14
Questions on core practicals 15
© Pearson Education Ltd 2015. Copying permitted for purchasing institution only. This material is not copyright free. 3
Introduction
Practical skills in physics at A level
Physics is a practical subject, which means that whatever anybody thinks – hypothesis –
it is only by testing the idea – carrying out an investigation – that we can come to
conclusion about whether the idea might be a reasonable explanation of the world (or
universe) around us. Practical skills are central to the work of a physicist and the A level
course is built around the development of those skills.
At GCSE you might have seen a Geiger counter measuring the emissions from a
radioactive source, by putting different materials between source and detector you were
able to tell whether the radiation was alpha, beta or gamma. All the ideas and principles
in physics have been tested like this and this early investigation of the nucleus led, over
a hundred years, to the investigations at CERN.
It is really important to remember that the term ‘practical skills’ covers a very wide
range of requirements at A level. It does not mean just the ability to handle equipment
in a school laboratory or know how to use some particular piece of apparatus. It ranges
from using mathematics in a practical context to understanding how scientists
investigate ideas, how they analyse their data and how they use that data when drawing
conclusions. This guide will explain each of these in more detail.
By carrying out a programme of practical work you will develop the skills that a student
must have if he or she is to be regarded as a competent practical physicist. You will have
to be able to work safely in the laboratory and to manage your time so as to complete
your work in the time allowed. Normally you will be given written instructions so you
must be able to follow these carefully.
Over the two years of your A level course your teacher will assess your competence as a
practical physicist by letting you carry out sixteen core practicals. At the end of the
course your teacher will list some of the practical work you have carried out and decide if
you have passed as a competent practical physicist. If you pass, then this will be
recorded on your A level certificate.
How is this different from GCSE?
First of all you will be doing most of the practical work, occasionally working with one or
more other people you will develop a wide range of skills. You will need to keep asking
'How do we know that?' You will also realise that, even at A level, you will only have part
of the story and that science is constantly changing. It is not a pile of 'facts' it is just the
best model we have at the present, in as far as we can test it.
By the end of the course you will have a mastery of practical work which means you will
be consistently and routinely competent and therefore happy to have a go at a huge
range of physics in the laboratory.

© Pearson Education Ltd 2015. Copying permitted for purchasing institution only. This material is not copyright free. 4
Developing practical skills in Physics
The specification includes 16 core practicals that you will be expected to complete during
the two-year A level course. These are included in some, but not all, topics. For example
it is not a surprise that Topic 8 Nuclear and Particle Physics does not include a core
practical but most topics do and Topic 4 Materials has two. One of these is Core Practical
4 in which you will use a falling ball to determine the velocity of a liquid – probably
washing-up liquid or glycerol and the ball is probably a steel ball bearing.
You will measure the diameter and mass of the ball so that you can calculate its radius
and its density. You put markers around the tube and time the descent of the ball over a
measured distance. From this you can calculate the viscosity of the liquid.
By carrying out this single Core Practical you will be using five of the practical techniques
listed in Appendix 5c of the specification – on page 81. You will also be using and
applying some scientific methods such as:
● following written instruction
● carrying out techniques methodically and making adjustments when necessary
● obtaining accurate, precise and sufficient data using appropriate units.
You can find out more about the methods used on page 48 of the specification. You can
find the specification on the Pearson website at this URL:
http://qualifications.pearson.com/en/qualifications/edexcel-a-levels/physics-2015.html
You will carry out a wide range of physics work in the laboratory and you will be aiming
to complete satisfactorily the work listed in appendix 5c and become competent at using
the methods detailed in the CPAC on page 48.

© Pearson Education Ltd 2015. Copying permitted for purchasing institution only. This material is not copyright free. 5
How will practical skills be tested? There are two ways in which your practical skills will be assessed as part of your A level
course.
Directly – by your teacher during your A level work
When you carry out a core practical a teacher will observe you working in the laboratory.
For example, if you are determining the speed of sound in air using a two-beam
oscilloscope you will first need to find out how the oscilloscope works and what you can do
with it. Your teacher will give you some written instructions to follow and you will carry
out the work using and improving your skills as well as developing new ones. Your
teacher will look at your results and decide if you have achieved competency in your
measurements and conclusions. You will need to keep a record of this and all your work
which your teacher will want to see from time to time and discuss your progress with you.
At the end of the course your teacher will complete a Practical Competency
Authentication Sheet listing the core practicals you have carried out. You will be
assessed against common A level criteria agreed by all the examining boards and you
will have to demonstrate that you are competent in all of the practical techniques listed
in the specification. The skills which are included in this assessment are:
1. Following written procedures
2. Applying an investigative approach
3. Using a range of apparatus and equipment safely
4. Making and recording accurate observations
5. Researching, referencing and reporting
If you have shown competence in all of the techniques then you will be awarded a Pass
in Physics Practical Endorsement and this will be recorded on your A level certificate.
No marks are awarded for the Practical Endorsement which is based on observations of
the core practicals and other practical work.
Indirectly – by questions in exam papers
There are likely to be questions in any of the three A level papers (and on the two AS
papers, if you are taking AS Physics) that test your knowledge and understanding of
practical work.
There are 3 written papers at A level.
Paper 1: 1h 45mins. This paper tests content of topics 1-3 and 6–8.
Paper 2: 1h 45mins. This paper tests content of topics 1, 4 & 5 and 9–13.
Paper 3: 2h 30mins. This paper tests content from all topics and questions may draw on
material from two or more different topics. 50% of the marks in this paper will test your
knowledge and understanding of experimental methods.
This means the following.
● Paper 3 will have lots of questions testing your practical skills and knowledge of the core practicals.
● This will include mathematical skills, as they are applied to practical work, but Papers
1 and 2 will also test your mathematical skills in other contexts. 40% of the total
marks available on all papers will be allocated to mathematical skills.
● Papers 1 & 2 will contain questions which test your knowledge and understanding of
the topics listed above but they can be presented in many different forms which are
linked to your practical skills e.g. topic questions may well contain data tables or
graphs which you might be asked to interpret and explain - in which case, you will need to use the skills you have developed throughout the whole course.
© Pearson Education Ltd 2015. Copying permitted for purchasing institution only. This material is not copyright free. 6
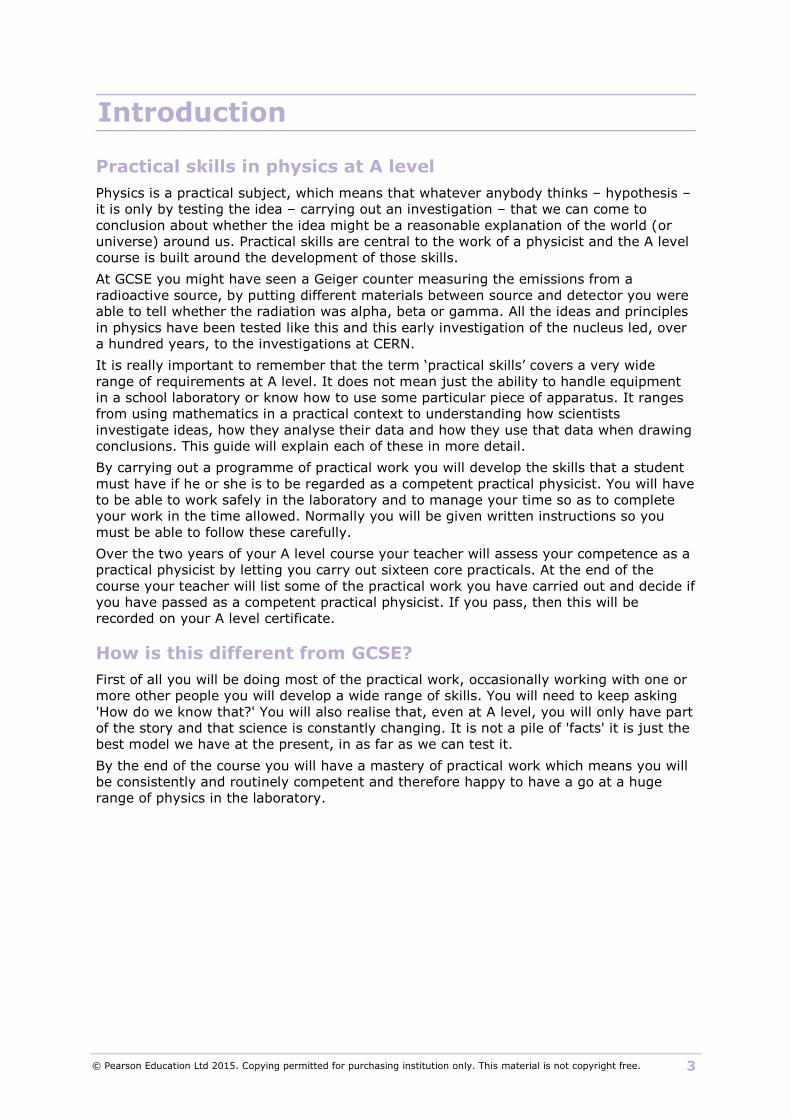
Paper 3 at A level will also include questions that assess your understanding of
experimental methods. These will draw on your experience of experimental methods
and, in particular, will draw on your experience of the core practicals.
An example of the type of question on Paper 3 is shown below.
In this part of the question the candidate performs a reasonably easy calculation but the
data, seen in an earlier part, is to 3 significant figures so the answer is expected to be
the same and the unit must be appropriate.
Using the earlier data the candidate calculates a percentage uncertainty and uses their
answer to decide whether the glass is ‘Crown’ or not.
This is an example of using uncertainties to help support conclusions a key part of
practical work.

© Pearson Education Ltd 2015. Copying permitted for purchasing institution only. This material is not copyright free. 7
Developing independent thinking An investigation is more than simply finding a value for something or verifying the
behaviour of a system. In the same way a practical mastery is more than the sum of the
parts, more than all the practical skills lumped together. The ‘extra ingredient’ is
independent thinking. For example knowing which instruments to use and knowing how
to use them is a key part of planning, using them correctly and being able to get
accurate and precise readings is carrying out your investigation. Completing the work is
to present your data and your conclusions supported by some analysis. Thinking
independently means being able to make the right decisions about what you know and
making them at the right time. Perhaps there is more to an investigation, there is the ‘I
wonder...’, ‘what would happen if I did this?’ and ‘how do we know that?’ – an enquiring
mind.
All of this makes a good physicist but physicists seldom work alone. Modern projects
such as CERN or the Very Large Telescope in Atacama require literally thousands of
highly trained specialists to make them work. So although the spark of an idea starts in
one head – think of Peter Higgs and his boson – the investigation is usually a
collaboration.
Physics is about describing the world around us, perhaps predicting what it might do
next but not really explaining it, that is left for the philosophers. Creating models and
then testing them is the way physicists do this and the models evolve all the time.
Communicating that spreading understanding is then another aspect of the work.
Finally physicists are very careful about claiming to have proved something and they are
more likely to talk of developing the current model.
Thinking independently is about the creativity of the individual working within the
framework of the subject and its other skilled practitioners.

© Pearson Education Ltd 2015. Copying permitted for purchasing institution only. This material is not copyright free. 8
Physics practical skills This section of the Guide will consider a number of key skills and practices that you
develop and use as you progress through your A level.
Designing investigations
Some of the core practicals offer you the opportunity to go beyond simply learning a
technique by applying your knowledge to the design of an investigation. You will have
met some of the requirements at GCSE level but during the two years of your A level
course you will be expected to gain a deeper understanding of the details. You might
start as follows.
● Is the hypothesis clear?
● Exactly what is to be measured? Is this the correct dependent variable, does it
match the hypothesis and how can it be measured as accurately as possible?
● Are there any other variables that I need to control? What can I do about ones I
cannot control?
● How much data will be needed to come to some meaningful conclusions?
For example in core practical 7 you will investigate the effect of length, tension and mass
per unit length on the frequency of vibration of a string or wire. You might think of a
guitar, adjusting the frequency means tuning it or playing it – and each of the six strings
has a different composition. How will you plan your investigation? You must start with
your own hypothesis and run through the questions above. You will need a framework
for you practical investigation. You can probably add questions to the list – but don’t
make it too complicated, you are aiming to test your hypothesis.
Planning
Instruments
You will choose which instruments you are going to use for each of your measurements
and explain why they are appropriate; this is probably due to their resolution – smallest
measuring division – but also their range. If the instruments are electrical then it is the
range that you must specify, for example a voltmeter on its 20 V range. You should also
detail any additional apparatus you will need such as retort stands, beakers or perhaps a
bench pulley.
It is a really good idea to draw a diagram of how you will set up your apparatus. This
should be labelled, large and drawn with a pencil and ruler. This process will help you
think more clearly about what you are about to do. Key dimensions should be indicated
on your diagram, these are lengths you will measure.
Question A
You are given two samples of a metal and told that they might both be
aluminium. One is in the form of a sheet of kitchen foil and one is a
cylindrical block with a mass of approximately 1 kg. In order to test the
suggestion you decide to measure the density of the metal of each.
What instruments would you use? Justify your choices.

© Pearson Education Ltd 2015. Copying permitted for purchasing institution only. This material is not copyright free. 9
Method
This can be bullet points but should include everything you will need to do including a
risk analysis of your activity, this should include the equipment and other people in the
room. You should discuss repeat readings and the range you are expecting to cover.
Techniques
You should also describe any techniques you will employ to improve accuracy. For
example, a timing marker if the experiment concerns oscillations or zero errors on
almost any instrument. This helps you to think more clearly about what you will actually
do. You might think about holding your head perpendicular to the scale to get a more
accurate reading, on a thermometer for instance.
Question B
Describe how you would use the micrometer in Question A to measure the
thickness of the foil with as good a resolution as possible.
Planning should be detailed but concise, in an investigation it is to help you
test the right thing in the right way.
Presenting data
Recording
When recording your data you should always use a table with headings which include the
quantity and its unit, write the unit that you read from the instrument. You might read a
metre rule in centimetres, so head the column of length L say as L/cm, you should also
record the resolution of the instrument as ±0.1 cm in the case of the rule.
Use the number of significant figures (SF) that the instrument gives, so a small length
might be 6.4 cm and a longer one 25.6 cm. Recording to the resolution of the instrument
is more important than having the same number of SF.
Be careful that your recorded figure represents what you think you measured. For
example if you record values for mass in core practical 7 and write down M = 1.00 kg
you are recording the mass to the nearest 10 g, the resolution is much nearer 1 g so you
should write M = 1.000 kg.
When timing oscillations, it is better to time a multiple number of oscillations e.g. 10, so that you are recording a longer time. This reduces the uncertainty due to reaction time. If the time for 10 oscillations is recorded as 10T = 14.58 s, then T = 1.458 s. Make sure you record enough data and not too much. Keep your eye on the dependent
variable and if it is changing slowly increase the increments in the independent variable.
You should be flexible and not stick rigidly to your plan if nothing much is changing.
Write your readings straight into your table and record everything you measure.
Question C
A student records the following values for the diameter of a piece of wire
Calculate a mean value for the diameter and explain your choice.
d/mm 0.27, 0.29, 0.27, 0.77,
0.26
© Pearson Education Ltd 2015. Copying permitted for purchasing institution only. This material is not copyright free. 10
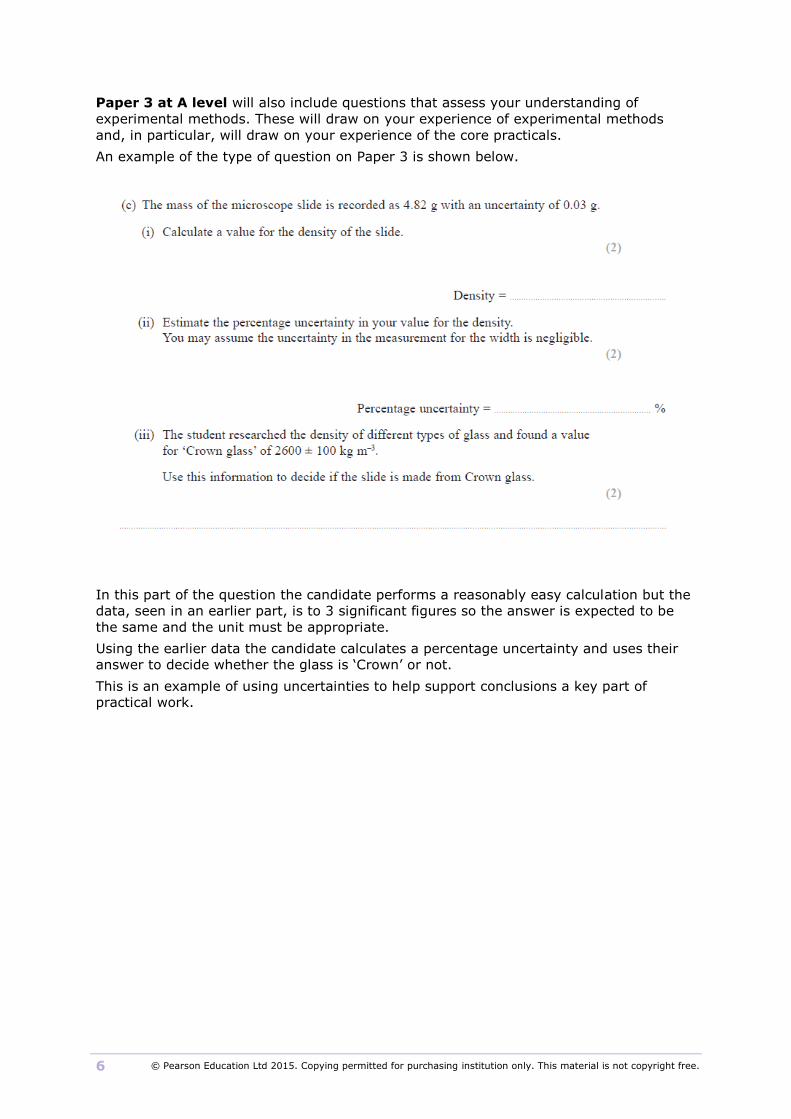
Graphs
Almost every physics experiment will display data in graphical form and physicists
always use a form of their data that produces a straight line – if all goes well with the
data. There is usually a mathematical model for the data and it is this that can be
manipulated to give a straight line on the graph. This will happen when the model has
been manipulated to be similar to y = mx + c.
Some examples are shown in the table.
Mathematical
Model x-axis y-axis gradient intercept
V = IR I V R Zero
v2 = u2 + 2 as s v2 2a u2
)(exp RC
t
II
0t ln I
RC
1ln I0
T = kxp ln x ln T p ln k
)(expT
b
II 0
T = f2λ2 µ
Question D
Complete the bottom two lines in order to determine a value for b in the first
one where the variables are I and T and a value for µ in the bottom line
where the variables are T and f.
The axes should be labelled with a unit such as s/m or ln(T/s) – in this way the plots
have no units. The scale should stretch the plots over at last half the graph paper in
each direction but should not be difficult to read i.e. multiples of 7s or 3s – take care
when plotting time in seconds. The plots should be accurate to 1 mm and the line of best
fit should have plots above it and below. Always tabulate the numbers you are going to
use for your graph alongside your data. A graph in physics is always a scatter graph with
a line of best fit shown.
Sometimes you may expect a graph through the origin, but this does not actually happen. This is often because of a systematic error in the experiment. In this case, do not force the graph through the origin: you should always draw the line of best fit through your plotted points.
Analysing
Investigations might be to verify the behaviour of a system or to calculate a value for
some aspect of it. In the first case you will be commenting on the goodness of fit of your
best fit line. In the second you will be doing further numerical analysis. In both cases
you should record what was easy and what was difficult about your practical work, if
your method was easy to carry out you might expect plots close to a straight line
whereas difficulties might explain a spread of readings. If you were expecting a straight
line but got a curve there might be a reason for that too.

© Pearson Education Ltd 2015. Copying permitted for purchasing institution only. This material is not copyright free. 11
For example if you are measuring the period of a pendulum and varying the length then
plotting T2 against l should give a straight line from
2
1
2 )(g
lT π
but if your oscillations are too large so that this is not the correct mathematical model
then that explains the curve you might get on your graph.
Core practical 1 is to determine a value for g and if your experimental value turns out to
be 9.25 N kg-1 then you can use a percentage difference to gauge the error.
Percentage difference = 100 × (your value – accepted value) ÷ accepted value
Here that gives %D = 100 × (9.81 – 9.25) ÷ 9.81 = 5.7% – not a bad result.
A properly plotted graph can tell you a very great deal about your experiment and
always repays close attention.
Question E
You measure a value for Young modulus of copper and obtain a value of
1.32 × 10¹¹ Pa. The accepted value is 1.17 × 10¹¹ Pa. Calculate the
percentage difference between the two values.
Use of mathematics
40% of the marks on the three written papers will be for applications of mathematics.
Full details of all the maths required is in Appendix 6 of the specification.
These skills come under the five headings: Arithmetic and Numerical Computation,
Handling data, Algebra, Graphs, Geometry and trigonometry.
This does not represent much of a change in quantity from previous specifications but
the range of skills requires is more carefully detailed without being any larger.
Nearly all the mathematical requirements are those of GCSE Maths at Higher Level. But
of course at top marks, the topics are relatively easy but the precision is 100% - in other
words you have to get GCSE Maths right when you use it. Although this might sound
worrying you should find that as you practice over the course and keep ticking over with
the maths you improve, just as you do with everything else. The only difference is the
use of logarithms and exponentials. All this represents very little change from previous
specifications and you will find it very easy to look up what you need to know.
Evaluating uncertainties
There is a great deal of information about uncertainties on pages 106–109 of the
specification, this includes combining uncertainties.
Uncertainties give you a degree of confidence in your results so that if your uncertainties
are large, say 25%, then you might find little confidence in your conclusion but if they
are small, say 2%, then you might think your results are valid i.e. you have measured
what you were supposed to be measuring.
© Pearson Education Ltd 2015. Copying permitted for purchasing institution only. This material is not copyright free. 12
In your investigation you will want to derive an uncertainty in your final value, this will
depend on the difficulty you experienced taking the readings, the spread in your
repeated readings and other factors too.
In some experiments you will be comparing your final value to an accepted value as in
core practical 1 above. Your value for g was 5.7% different from he accepted value, if
your uncertainty was 9% then your result might be valid because the percentage
difference can be explained by the percentage uncertainty. If your percentage
uncertainty was 3% then the difference is not explained by the uncertainty and your
experiment was flawed in some way.
When evaluating the result of your investigation as well as considering percentages, as
above, you should consider your graph and the readings it shows as well as the
difficulties you felt you had in taking accurate readings. As part of this you might
consider whether a different method would produce a better result.
Your report should end with a conclusion supported by numbers and an evaluation based
on the evidence you have assembled.
Question F
A wave crosses a tray, reflects off the far side and returns after a time t. A
student measures the distance d across the tray as 33.4 cm with an
uncertainty of 0.2 cm.
She then measures t = 0.92 s with an uncertainty of 0.03 s.
(i) Use these measurements to calculate v, the velocity of the wave.
(ii) Estimate the percentage uncertainty in your value for v.
Question G
A student records measurements of a metre rule. She repeats these from
several positions along the rule.
Width/mm 28.2, 29.3, 28.9, 29.0, 29.1
Thickness/mm 6.04, 5.94, 5.97, 6.01, 5.99
Mass/g = 106.4
(i) Use these measurements to calculate a value for the density of the rule.
(ii) Calculate the uncertainty in your value for the density.
Question H
A student takes measurements to determine the resistivity of constantan in
the form of a wire. He measures the diameter and the resistance of a length
of wire. He records:
Diameter = 0.559 mm ±0.010 mm
Resistance 1.15 Ω ±0.02 Ω
Length = 0.600 m ±0.003 m
Ii) Calculate the resistivity of the constantan.
(ii) Calculate the percentage uncertainty in your value for the resistivity
(iii) The accepted value for the resistivity of constantan is 4.9 × 10⁻⁷ Ω m.
Comment on the result of using the student’s measurements.

© Pearson Education Ltd 2015. Copying permitted for purchasing institution only. This material is not copyright free. 13
Terminology in practical physics
Appendix 10 of the specification gives some detail about some of the terminology usd in
practical physics. The list below is a slightly simplified version, which you might find
useful as a vocabulary list or glossary.
Term Meaning and notes
Validity A measurement is valid if it measures what it is supposed to be
measuring – this depends both on the method and the instruments.
True value The value that would have been obtained in an ideal measurement.
Accuracy A measurement result is considered accurate if it is judged to be close
to the true value. It is influenced by random and systematic errors.
Precision A quality denoting the closeness of agreement (consistency) between
values obtained by repeated measurement. It is influenced by random
effects and can be expressed numerically by the standard deviation. A
measurement is precise if the values ‘cluster’ closely together.
Resolution The smallest change in the quantity being measured that causes a
perceptible change in the output of the measuring device.
This is usually the smallest measuring interval.
Repeatability A measurement is repeatable when similar results are obtained by
students from the same group using the same method. Students can
use the precision of their measurement results to judge this.
Reproducibility A measurement is reproducible when similar results are obtained by
students from different groups using different methods or apparatus.
Uncertainty Any measurement will have some uncertainty about the result, this
will come from variation in the data obtained and be subject to
systematic or random effects. This can be estimated by considering
the instruments and the method and will usually be expressed as a
range such as 20°C ±2°C.
Error The difference between the measurement result and the true value if
a true value is thought to exist. This is not a mistake in the
measurement. The error can be due to both systematic and random
effects and an error of unknown size is a source of uncertainty.

© Pearson Education Ltd 2015. Copying permitted for purchasing institution only. This material is not copyright free. 14
Core practicals
The core practicals are an integral part of your course. They are not there to get you to
demonstrate some text book 'fact' or recall some simple information. They are there to
help you develop the whole range of practical and mathematical skills which are essential
to physicists and which will be tested in the written assessments.
List of core practicals
1. Determine the acceleration of a freely-falling object
2. Determine the electrical resistivity of a material
3. Determine the e.m.f. and internal resistance of an electrical cell
4. Use a falling-ball method to determine the viscosity of a liquid
5. Determine the Young modulus of a material
6. Determine the speed of sound in air using a 2-beam oscilloscope, signal
generator, speaker and microphone
7. Investigate the effects of length, tension and mass per unit length on the
frequency of a vibrating string or wire
8. Determine the wavelength of light from a laser or other light source using a
diffraction grating
9. Investigate the relationship between the force exerted on an object and its
change of momentum
10. Use ICT to analyse collisions between small spheres, e.g. ball bearings on a
table top
11. Use an oscilloscope or data logger to display and analyse the potential
difference (p.d.) across a capacitor as it charges and discharges through a resistor
12. Calibrate a thermistor in a potential divider circuit as a thermostat
13. Determine the specific latent heat of a phase change
14. Investigate the relationship between pressure and volume of a gas at fixed
temperature
15. Investigate the absorption of gamma radiation by lead
16. Determine the value of an unknown mass using the resonant frequencies of the
oscillation of known masses

© Pearson Education Ltd 2015. Copying permitted for purchasing institution only. This material is not copyright free. 15
Questions on core practicals
1. Determine the acceleration of a freely-falling object
This experiment can be done in two different ways but both involve dropping
an object and measuring its fall.
In one method you can use a trapdoor connected to a timer and you measure
the distance fallen and the time taken. In the other method you can use light
gate to determine the velocity of an object that has fallen through a
measured distance. Although the two methods use different mathematical
models they will both give you the acceleration.
John uses a trapdoor and measures the height and time of fall and produces
the following readings.
h = 1.200 m t = 0.51 s
h = 0.900 m t = 0.43 s
(a) Use these readings to calculate a value for g.
(b) Criticise these readings
2. Determine the electrical resistivity of a material
This practical is a standard one that is relatively straightforward to carry out
and the physics is quite easy too, the more metal the current passes through
the greater the resistance. The resistivity is a property of the material and is
the same everywhere. The ohmmeter applies a potential difference to the
sample and from the current that passes shows the resistance between the
probes.
A slice of silicon is 0.50 mm thick and is square with each side measuring
20 mm and it has a resistance of 1.28 MΩ.
(a) Calculate the resistivity of silicon
(b) Explain why the resistivity of silicon is so much higher than that for a
metal.
(c) Calculate the resistance of a square of silicon that is 0.50 mm thick but
measures 15 mm on each side.
(d) Explain why in practice, it might be difficult to get an accurate reading
using an ohmmeter

© Pearson Education Ltd 2015. Copying permitted for purchasing institution only. This material is not copyright free. 16
3. Determine the e.m.f. and internal resistance of an electrical cell
This practical gives a graph with a negative slope and it should be a straight
line. Designing an electric circuit is an A level skill so this practical is a chance
to practise.
When a car battery, which has an emf of 12 V, starts a car there is a huge
current flowing, probably around 150 A. The battery is connected to the
starter motor which is usually close to it.
(a) Explain the why the battery must have a very, very low internal
resistance
(b) Explain why the connections to the starter motor must also have a very,
very low resistance
(c) Explain how this can be achieved in practice.
4. Use a falling-ball method to determine the viscosity of a liquid
In this practical we are looking a terminal velocity and a graphical aspect is
missing, unless you have a wide variety of ball bearings. The viscosity of a
liquid will fall as its temperature increases.
(a) Research a simple explanation.
(b) This means that as a car engine heats up the oil becomes less viscous.
Describe the effect this has.
5. Determine the Young modulus of a material
A different way of measuring the Young modulus of a wire is to hang two
identical wires side by side. Weights are hung on one of the wires and their
lengths are compared using a cradle at the bottom ends of the wires which
measures the extension directly.
One student carried out such an experiment and plotted a graph of load
against extension; the gradient of this graph was 11.9 kN m-1. The original
length of the wire was 1.300 m and the diameter was 0.315 mm.
(a) Calculate a value for the Young modulus of steel using the student’s
results.
(b) Give a reason why the second wire improves the experiment.
(c) Give two reasons why a graphical method gives better results.

© Pearson Education Ltd 2015. Copying permitted for purchasing institution only. This material is not copyright free. 17
6. Determine the speed of sound in air using a 2-beam oscilloscope,
signal generator, speaker and microphone
The oscilloscope takes some getting used to but when you understand how it
works it can be a very powerful tool for analysis and it shows, in effect, a
voltage time graph. The scale on the horizontal axis is called the timebase
and is calibrated in units of ms/cm or milliseconds per centimetre. The
frequency generator is connected to the loudspeaker.
The signal from the frequency generator is first displayed on its own.
(a) Explain what the distance from one peak to the next represents.
(b) Describe what you would see on the screen if you changed the timebase
from 0.1 ms/cm to 0.5 ms/cm – in the case ms stands for millisecond.
(c) Now the trace from the microphone is displayed as well. Explain why the
traces look different as you move the microphone away from the
loudspeaker.
(d) Give one reason why repeating the experiment at a different frequency
improves the accuracy.
7. Investigate the effects of length, tension and mass per unit length
on the frequency of a vibrating string or wire
If you first carry out this practical with a string with a mass per unit length of
3 g m-1 (grams/metre) and then, keeping the same frequencies, use a
different string with line density of 4 g m-1 would you expect the
corresponding wavelengths to be larger or smaller.
(a) Explain your answer.
(b) In a different resonance experiment the speed of sound in air is being
investigated using a small loudspeaker (or tuning fork) held over a
column of air.
At a given frequency the first resonance occurs when there is a node at the
top of the water and an antinode at the top of the tube. The water is then
lowered and the next resonance occurs when there is again an antinode at
the top of the tube. Explain why the air column is now half a wavelength
longer.
© Pearson Education Ltd 2015. Copying permitted for purchasing institution only. This material is not copyright free. 18
8. Determine the wavelength of light from a laser or other light
source using a diffraction grating
In this experiment laser light is shone through a diffraction grating and on to
wall. The distance between adjacent maxima is measured. Explain why the
uncertainties in this experiment will be reduced if the grating is moved
further away from the wall.
9. Investigate the relationship between the force exerted on an
object and its change of momentum
As the title suggests this is intended as an investigation in which you the
student decide what you are going to look at and come up with a plan to do
that. You will also do some analysis, an important part of which are the
uncertainties and there is some guidance on the student sheet to help you
move your competence with uncertainties forward for Year 13.
In this experiment you will have had masses on the hanger and on the
trolley. In order to change the number of masses on the hanger you move
them from the trolley. Explain why this is an important part of the technique
in the experiment.
10. Use ICT to analyse collisions between small spheres, e.g. ball
bearings on a table top
This investigation is a terrific opportunity to use some digital equipment and
capture some really good physics. Once you have understood and mastered
the software you might try analysing the motion of things other than
marbles. If you can determine the initial velocity and the time of contact from
the image then by finding the mass you can calculate the force on an object –
this might be useful on video clips of other impacts – you might even try the
famous golf ball shot but footballs are just as good.
11. Use an oscilloscope or data logger to display and analyse the
potential difference (p.d.) across a capacitor as it charges and
discharges through a resistor
In this experiment you were using the oscilloscope again to measure voltage.
In the two experiments one changed slowly but the other was changing quite
quickly.
This question is about the use of a datalogger.
(a) Draw the circuit you would use to record the voltage across a capacitor as
it charged – include the ICT equipment in your diagram.
(b) Describe the advantages of using ICT to monitor this circuit – for both
experiments. Suggest any disadvantage.
© Pearson Education Ltd 2015. Copying permitted for purchasing institution only. This material is not copyright free. 19
12. Calibrate a thermistor in a potential divider circuit as a
thermostat
A thermometric property is a property of a material or device that changes
with temperature, in this case it is the resistance of a thermistor. As the
temperature changes the change in the thermometric property can be
recorded and this change over a known temperature range can be used to
calibrate a thermometer.
The expansion of a liquid in a tube is another such property and this forms
the basis for most thermometers used in the laboratory.
Carry out some research to find another thermometric property and describe
how it is used to make a thermometer, include information about its range
and use. Find out also how very high temperatures (>2000°C) are measured.
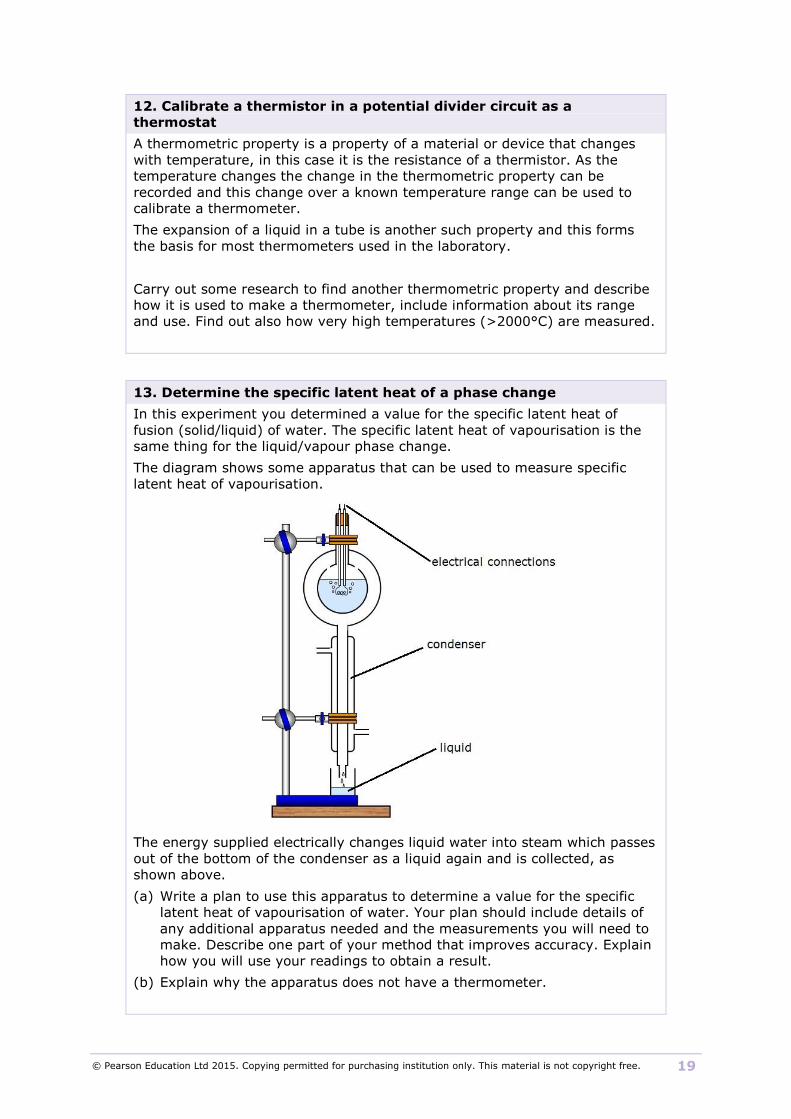
13. Determine the specific latent heat of a phase change
In this experiment you determined a value for the specific latent heat of
fusion (solid/liquid) of water. The specific latent heat of vapourisation is the
same thing for the liquid/vapour phase change.
The diagram shows some apparatus that can be used to measure specific
latent heat of vapourisation.
The energy supplied electrically changes liquid water into steam which passes
out of the bottom of the condenser as a liquid again and is collected, as
shown above.
(a) Write a plan to use this apparatus to determine a value for the specific
latent heat of vapourisation of water. Your plan should include details of
any additional apparatus needed and the measurements you will need to
make. Describe one part of your method that improves accuracy. Explain
how you will use your readings to obtain a result.
(b) Explain why the apparatus does not have a thermometer.

© Pearson Education Ltd 2015. Copying permitted for purchasing institution only. This material is not copyright free. 20
14. Investigate the relationship between pressure and volume of a
gas at fixed temperature
The experiment to investigate Boyle’s law is another standard experiment.
(a) Use the ideal gas equation pV = NkT to explain why the amount of gas in
the apparatus must remain the same throughout the experiment.
(b) Another law, similar to Boyle’s is Charles law relating the volume and
temperature of a gas. Research the apparatus used for Charles’ law, draw
a diagram of it and write a plan for its use. Your plan should include any
additional apparatus needed and the measurements you will need to
make. Describe one part of your method that improves accuracy. Explain
how you will present your readings.
15. Investigate the absorption of gamma radiation by lead
In this experiment the gamma radiation is absorbed by different thickness of
lead. The count rate will decrease exponentially as the thickness of the lead
increases. This is similar to the decay over time of any radioactive source –
some of them decay incredibly slowly. Both models lend themselves to the
idea of a constant in which the count rate halves – a half life in the case of
decay and a half thickness in the case of absorption.
Explain how the frequency of the gamma radiation affects the half thickness
required by lead.
16. Determine the value of an unknown mass using the resonant
frequencies of the oscillation of known masses
Log graphs are useful ways to verify a relationship that has a power. So when
a mass oscillates on a spring the mathematical model we use is
2
1
2 )(k
mT π
The following data was recorded.
(a) Plot a graph of ln T against ln m and measure the gradient.
(Notice that if you ignore the smallest value you are able to draw a much
better line of fit.)
(b) Use your analysis to comment on the results.
m/kg T/s
0.1 0.397
0.2 0.477
0.3 0.551
0.4 0.619
0.5 0.676
0.6 0.729
0.7 0.776