as at march 31, 2018 - continental-corporation.com · benefit pension plans as at march 31, 2018,...
TRANSCRIPT

Financial Reportas at March 31, 2018Q1

2 Continental AG Financial Report as at March 31, 2018 Continental Shares and Bonds
Turbulence on stock markets worldwide At the start of the year, the positive sentiment on the U.S. stock markets held on as a result of good U.S. jobs data. The U.S. bench-mark indexes continued their multi-year uptrend, setting new rec-ords nearly every day in January 2018. This was supported by the continuing weakening of the U.S. dollar against the euro and other currencies. The Dow Jones exceeded the 26,000 point mark for the first time, closing on January 26 at a new high of 26,616.71 points. This equated to a rise of nearly 8% compared with the clos-ing price for 2017.
The rally on the U.S. stock markets led to rising indexes in Europe and Asia as well. On January 23, 2018, the DAX also marked a new all-time high of 13,596.89 points, while at the same time the EURO STOXX 50 reached an annual high of 3,687.22 points. Compared with the Dow Jones, however, the price increase was somewhat more modest at around 5% in each case, as investor sentiment in Europe was less buoyant due to the continued appreciation of the euro against the U.S. dollar.
At the end of January 2018, good U.S. economic data led to rising yields on the U.S. bond markets. This also reflected concerns about the U.S. interest-rate level increasing more quickly than anticipated. The U.S. Federal Reserve's (Fed) indication of three interest-rate hikes both this year and in 2019 exacerbated the interest-rate con-cerns, whereupon prices on the U.S. stock markets tumbled at the beginning of February. Prices on stock markets in Europe and Asia also saw losses as a result. By mid-February, major benchmark in-dexes such as the Dow Jones and the DAX had lost as much as one-tenth of their value compared to their previously achieved highs. In the second half of February, stock markets stabilized around the world. The U.S.A.’s announcement of tariffs on steel and aluminum imports, coupled with China’s and other affected export nation’s examination of appropriate countermeasures led, however, to a further slump in prices at the beginning of March. In addition, fears
of rising interest rates due to increasing inflation in the U.S.A. once again weighed heavily on the stock markets.
From mid-March 2018, there was another short period of stabiliza-tion. This lasted until the end of March when the U.S.A. announced import duties on products from China, arousing new fears of an imminent trade war between the two nations. This caused prices to fall on the stock markets again. At the end of March, the DAX hovered around the 12,000 point mark. It closed the first quarter of 2018 at 12,096.73 points, down 6.4% on the end of 2017. The EURO STOXX 50 declined by 4.1% to 3,361.50 points in the first quarter.
At the start of April 2018, the impending trade war between the U.S.A. and China once again put strain on the stock markets, before rapprochement between the two governments triggered a mild price recovery. The renewed escalation in the Syrian conflict led to uncertainty on the markets only for a brief time in mid-April. On April 24, 2018 – the closing date of this report – the DAX ceased trading at 12,550.82 points.
Automotive stocks make strong start to new fiscal year European automotive and supplier stocks benefited in January 2018 from the generally positive market sentiment and several buy recommendations for the sector from various analysts. The companies’ initial business figures for the fourth quarter of 2017 also provided a boost. In addition to the general market turbulence, prices for the European automotive sector were also dragged down over the rest of the quarter by declining sales and produc-tion figures for the U.S. and European car markets as well as the threat of bans on diesel cars.
EURO STOXX Automobiles & Parts closed at 599.25 points at the end of March, having increased by around 10% to over 650 points in January 2018. This equated to a rise of 1.0% in the first quarter of 2018 compared to the end of the previous year.
90
95
100
105
110
115
ContinentalDAXEURO STOXX 50EURO STOXX Automobiles & Parts
Price performance of Continental shares in the reporting period versus selected stock indexes indexed to January 1, 2018
Continental DAX EURO STOXX 50 EURO STOXX Automobiles & Parts
January February March
Continental Shares and Bonds

Continental AG Financial Report as at March 31, 2018 Continental Shares and Bonds 3
March 31, 2018 in % vs.
December 31, 2017
Continental shares (Xetra price) 224.30 -0.3
DAX 12,096.73 -6.4
EURO STOXX 50 3,361.50 -4.1
EURO STOXX Automobiles & Parts 599.25 1.0
Continental shares reach new high in January 2018 In the first trading days of the year, Continental shares rose from €225.05 at the end of 2017 to more than €230 as a result of sev-eral buy recommendations from analysts. During the course of January 9, 2018, media reports about a major reorganization of the Continental Corporation caused the Continental share price to soar to €257.40, a new all-time high. On the same day, Continental confirmed that it was running through scenarios in an early stage of analysis of how the organization could become more flexible to face the challenges in the automotive industry. At the same time, Continental stressed that it was not possible to say at that point in time if or what changes could result from these analyses and scenarios. In subsequent trading days, Continental shares sank initially to €240, before renewed buy recommendations and price target increases by several analysts nudged the price back up to around €250.
In February and March 2018, Continental shares performed largely in line with the automotive sector, closing the first quarter of 2018 at €224.30, down 0.3% from their price of €225.05 at the end of 2017.
In April 2018, Continental shares – like the European automotive sector – benefited from the Chinese president’s announcement that tariffs on vehicle imports would be reduced considerably and the upper limit for foreign companies’ holdings in joint ventures in China would be raised. On April 18, 2018, the change of the 2018
outlook for the Continental Corporation led to a roughly 4% drop in the price of Continental shares. On the reporting date of April 24, 2018, Continental shares closed trading at €226.00.
Continental bonds at low yield level The prices of Continental bonds were hardly impacted by the slight rise in interest rates on the bond markets in the first quarter of 2018. As in the previous year, Continental bonds persisted at a low yield level during the first three months of 2018.
Over the reporting period, the price of the 3.0% euro bond matur-ing on July 16, 2018, declined by 83.6 basis points to 100.933% due to the reduction in its remaining maturity.
At the end of March 2018, the 0.5% euro bond maturing on Febru-ary 19, 2019, was quoted at 100.571%, down 20.5 basis points compared to the end of 2017.
The price of the 0.0% euro bond maturing on February 5, 2020, moved slightly above the 100% mark over the course of the quar-ter. On March 31, 2018, it was quoted at 100.138%, down 8.9 basis points compared to the end of 2017.
The 3.125% euro bond maturing on September 9, 2020, fell by 87.5 basis points in the reporting period due to the reduction of its remaining maturity, and was quoted at 107.397% at the end of March 2018.
100
102
104
106
108
110
3.0% July 20180.5% February 20190.0% February 20203.125% September 2020
Price performance of Continental bonds in the reporting period
January February March
3.0% July 2018 0.5% February 2019 0.0% February 2020 3.125% September 2020

4 Continental AG Financial Report as at March 31, 2018 Continental Shares and Bonds
Five-year CDS premium at 13-year low in January 2018 The premiums for insuring against credit risks (credit default swap, CDS) remained largely unchanged at a relatively low level in Janu-ary 2018. In parallel to the slight rise in interest rates on the capital markets and the turbulence on the stock markets, the CDS premi-ums for corporate bonds also increased in February and March. The Markit iTraxx Europe rose by around 15 basis points in the report-ing period to 59.867 basis points on March 31, 2018 (44.776 basis points as at December 31, 2017).
The five-year CDS premium for Continental fell from 32.563 basis points at the end of 2017 to below 30 basis points briefly at the end of January 2018, reaching a level last seen 13 years ago in the first quarter of 2005. Over the rest of the quarter, the premium rose again slightly in line with its reference index, the Markit iTraxx Europe. At the end of the first quarter of 2018, it was at 41.779 basis points, around nine basis points up on the end of 2017. The spread in relation to its reference index, the Markit iTraxx Europe, amounted to -18.088 basis points as at March 31, 2018 (-12.213 basis points as at December 31, 2017).
Continental’s credit rating unchanged The three major rating agencies each maintained their credit ratings for Continental AG during the first quarter of 2018.
March 31, 2018 Rating Outlook
Standard & Poor’s1 BBB+ stable
Fitch2 BBB+ stable
Moody’s3 Baa1 stable
December 31, 2017 Rating Outlook
Standard & Poor’s1 BBB+ stable
Fitch2 BBB+ stable
Moody’s3 Baa1 stable
1 Contracted rating since May 19, 2000. 2 Contracted rating since November 7, 2013. 3 Non-contracted rating since February 1, 2014.
Continental Investor Relations online For more information about Continental shares, bonds and credit ratings, as well as our Investor Relations app, please visit
www.continental-ir.com.
In addition, updates about Continental are also available on Twitter at @Continental_IR.

Continental AG Financial Report as at March 31, 2018 Key Figures for the Continental Corporation 5
Due to the application of the modified retrospective approach during the first-time adoption of IFRS 9, Financial Instruments, and IFRS 15, Revenue from Contracts with Customers, as at January 1, 2018, all the following figures from comparative periods are shown unadjusted.
January 1 to March 31
€ millions 2018 2017
Sales 11,012.7 10,999.9
EBITDA 1,555.0 1,638.5
in % of sales 14.1 14.9
EBIT 1,019.2 1,135.1
in % of sales 9.3 10.3
Net income attributable to the shareholders of the parent 737.6 749.6
Basic earnings per share in € 3.69 3.75
Diluted earnings per share in € 3.69 3.75
Adjusted sales1 10,923.4 10,996.7
Adjusted operating result (adjusted EBIT)2 1,058.9 1,163.9
in % of adjusted sales 9.7 10.6
Free cash flow 40.9 133.0
Net indebtedness as at March 31 1,983.8 2,767.6
Gearing ratio in % 11.7 17.6
Number of employees as at March 313 240,074 227,565
1 Before changes in the scope of consolidation. 2 Before amortization of intangible assets from purchase price allocation (PPA), changes in the scope of consolidation, and special effects. 3 Excluding trainees.
Key Figures for the Continental Corporation

6 Continental AG Financial Report as at March 31, 2018 Key Figures for the Core Business Areas
January 1 to March 31
Automotive Group in € millions 2018 2017
Sales 6,813.9 6,754.0
EBITDA 847.5 824.4
in % of sales 12.4 12.2
EBIT 536.8 541.7
in % of sales 7.9 8.0
Depreciation and amortization1 310.7 282.7
thereof impairment2 5.6 1.0
Capital expenditure3 276.3 287.3
in % of sales 4.1 4.3
Operating assets as at March 31 13,521.3 12,549.1
Number of employees as at March 314 137,362 128,030
Adjusted sales5 6,812.8 6,754.0
Adjusted operating result (adjusted EBIT)6 562.7 557.3
in % of adjusted sales 8.3 8.3
January 1 to March 31
Rubber Group in € millions 2018 2017
Sales 4,212.2 4,260.4
EBITDA 741.7 842.6
in % of sales 17.6 19.8
EBIT 517.4 622.2
in % of sales 12.3 14.6
Depreciation and amortization1 224.3 220.4
thereof impairment2 — —
Capital expenditure3 179.5 215.0
in % of sales 4.3 5.0
Operating assets as at March 31 9,444.6 9,440.6
Number of employees as at March 314 102,294 99,110
Adjusted sales5 4,124.0 4,257.2
Adjusted operating result (adjusted EBIT)6 531.2 635.4
in % of adjusted sales 12.9 14.9
1 Excluding impairment on financial investments. 2 Impairment also includes necessary reversal of impairment losses. 3 Capital expenditure on property, plant and equipment, and software. 4 Excluding trainees. 5 Before changes in the scope of consolidation. 6 Before amortization of intangible assets from purchase price allocation (PPA), changes in the scope of consolidation, and special effects.
Key Figures for the Core Business Areas
Continental AG Financial Report as at March 31, 2018 Corporate Management Report 7
Value-sharing bonus for all employees In 2018, all employees worldwide shared once again in a success-ful business year. The total payout for 2017 went up by approxi-mately 15% to over €170 million, roughly €20 million more than the previous year’s figure. Unlike other companies, since 2004 Continental has not restricted employee eligibility just to a certain group or country. The value-sharing program is based on the com-pany’s creation of value. The basis for calculating the amounts dis-tributed varies from country to country, taking into account both legal and contractual regulations in addition to economic perfor-mance. Each employee will receive either €1,141 or €571 depend-ing on the country.
Continental and NVIDIA develop artificial intelligence (AI) for self-driving cars On February 5, 2018, NVIDIA Corp., Santa Clara, California, U.S.A., and Continental announced that they would be partnering to develop systems for autonomous driving. The partnership will enable the development of AI computer systems that scale from automated features through to full level self-driving capabilities, where the vehi-cle has no steering wheel or pedals. With our joint technical port- folio, we will achieve new levels of safety, comfort, convenience and personalization for the vehicles of the future.
Continental and CITC establish joint venture for production of 48-volt battery systems On March 7, 2018, the Chinese automotive supplier and battery manufacturer Sichuan Chengfei Integration Technology Co., Ltd. (CITC) and Continental signed a contract establishing a joint ven-ture to develop and produce 48-volt battery systems for the auto-motive industry. The joint venture, in which Continental holds a 60% stake and CITC 40%, will operate globally and also supply customers in Europe and North America, in addition to China and other Asian markets. The planned location of the company’s head-quarters is Changzhou, near Shanghai. Operating activities are set to start in mid-2018. The aim is to establish the joint venture as one of the leading 48-volt battery-system manufacturers on the global market.
Continental and Osram sign joint-venture contract On April 3, 2018, Osram Licht AG, Munich, and Continental success-fully concluded negotiations on the Osram Continental GmbH joint venture. The joint venture, in which each of the partners has a 50% stake and which will be under the control of Osram, aims to com-bine Continental’s and Osram’s respective expertise in lighting, light control and electronics. The start is scheduled for the second half of 2018 once all the necessary merger control approvals have been granted. The joint venture will help us to establish the necessary prerequisites for the technological transformation of the light mar-ket in the automotive industry.
Expansion of capacity at Hungarian Nyíregyháza location Our activities in Hungary have been expanded with a second rubber mixing line, a production line for hoses destined for heating and
cooling applications in cars, a new production facility for air bellows, and a warehouse for rubber compounds. The new facilities officially went into full operation on January 23, 2018.
New plant for automotive electronics planned in Hungary To expand our production capacity for automotive electronics, we are planning to construct a new plant in Debrecen, Hungary. We currently have six plants and a tire sales and logistic center in Hun-gary. The groundbreaking ceremony is scheduled for the third quarter of 2018. The plan is to invest a total of €100 million, creat-ing 450 new jobs. With this decision for a new production plant in Debrecen, we are expanding our European presence in order to satisfy the customers’ growing demand for automotive electronics even better.
Summer tire range expanded further More than 210 items have been added to our range of summer tires for passenger cars and light trucks. Additions include new tire sizes for sports cars, for mid-size and premium classes, as well as for subcompact cars. We thus feature one of the world’s most ex-tensive ranges of tires for cars, SUVs and vans. In tests carried out by the trade press, Continental’s products received numerous rec-ommendations and often occupied podium positions. They came out top in tests by the ADAC, Germany’s largest automobile club; “auto motor und sport”; and “Auto Zeitung.” The SportContact 6 tire came first in “AUTO BILD Sportscars,” and in its sister publication “AUTO BILD Allrad,” the ContiSportContact 5 SUV tire was the test winner. In the major summer tire test carried out by “AUTO BILD,” the ContiPremiumContact 5 tire garnered the highest ranking of “exemplary.”
Commitment to sustainability in natural-rubber supply chain The German Society for International Cooperation (Deutsche Gesellschaft für Internationale Zusammenarbeit (GIZ) GmbH) and Continental are joining forces in a development partnership to enhance sustainability in the natural-rubber supply chain in Indo-nesia. The country is the world’s second largest producer of natural rubber. The aim is to create a list of criteria for the sustainable pro-duction of natural rubber, to train farmers in sustainable farming practices based upon these criteria, and to ensure the traceability of the rubber from the small farmers to its use in production at Continental. The income of the rubber farmers will increase thanks to a better quality of rubber, higher yields, and optimization of the supply chain. The partnership between Continental and GIZ is sup-ported by the “develoPPP.de program” of the German Federal Minis-try for Economic Cooperation and Development (Bundesministe-rium für wirtschaftliche Zusammenarbeit und Entwicklung, BMZ). Declarations of intent have been signed with two suppliers to inte-grate them as supply-chain partners.
Corporate Management Report

8 Continental AG Financial Report as at March 31, 2018 Corporate Management Report
Macroeconomic development The upturn in the German economy continued in the first quarter of 2018. Industrial production and companies’ incoming orders increased year-on-year. The companies’ good economic situation was also reflected in various sentiment indicators, which continued to pick up in January and February 2018. However, companies’ forecasts declined somewhat in March, as the threat of a trade war between the U.S.A. and China put a damper on general sentiment. In its April 2018 World Economic Outlook, the International Monetary Fund (IMF) raised its estimate for economic growth in Germany by 0.2 percentage points and now projects that gross domestic prod-uct (GDP) will grow by 2.5% in 2018.
According to initial data, the eurozone economy performed similarly to that of Germany in the reporting period. Most countries recorded an increase in industrial production and especially construction ac-tivity. The drop in the unemployment rate from 8.6% in December 2017 to 8.5% in February 2018 had a positive impact on consumer spending. In addition, the economy continued to be boosted by the persistently expansive monetary policy of the European Central Bank (ECB). In April 2018, the IMF likewise increased its estimate for GDP growth in the eurozone by 0.2 percentage points to 2.3% for the current year.
The robust growth of the U.S.A. persisted in the first quarter of 2018 according to initial data. Industrial production and consumer spend-ing continued to rise. Moreover, various sentiment indicators sug-gest the economy will continue to pick up in the next few months. In March 2018, the U.S. Federal Reserve (Fed) increased its key in-terest rate for the sixth time in total since the interest-rate reversal at the end of 2015. The rate still remained at a relatively low level with a target value of 1.5% to 1.75%. However, the Fed hinted for the first time at three interest-rate changes in 2019 in addition to the three in total for this year. In April 2018, the IMF revised its esti-mate for U.S. GDP growth upward by 0.2 percentage points and currently expects GDP to rise by 2.9% in 2018.
The Japanese economy continued to grow in the reporting period. However, the appreciation of the Japanese currency over the first quarter against the currencies of the country’s key trading partners is likely to have reduced the contribution from foreign trade and somewhat slowed the pace of economic growth. This is also indi-cated by the smaller year-on-year increase in industrial production and the data available for consumer spending. In its April forecast, the IMF left its projection for economic growth in Japan unchanged at 1.2% for 2018.
For China, which posted economic growth of 6.8% for the first quar-ter of 2018, the IMF still expects GDP to rise by 6.6% for 2018 as a whole. The IMF also maintained its GDP forecasts of 7.4% and 1.7% for India and Russia, respectively. On the basis of new economic data, the IMF raised its 2018 GDP forecast for Brazil by 0.4 percent-age points to 2.3%. In contrast, it lowered its estimates slightly for countries in the Middle East and Africa. In its April forecast, the IMF continues to expect growth of 4.9% in 2018 for emerging and de-veloping economies overall.
In the same forecast, the IMF also continues to project that the global economy will grow by 3.9% in 2018. This will be driven mostly by the persistently strong expansion in Asian countries, especially China and India, the increased investing activity of com-panies in the U.S.A. and Europe, as well as the economic recovery of various commodity-exporting countries. The IMF points out that the greater growth year-on-year is based mostly on short-term fac-tors. The IMF sees risks including a rise in inflation, which would re-quire many central banks to tighten their expansionary monetary policy. The IMF also continues to see risks in tendencies to put up barriers to trade and in geopolitical tensions between individual countries. At the same time, it points to ongoing structural prob-lems in some economies in Europe, Asia, Africa and South America and urges appropriate reforms.
Development of new passenger-car registrations On the basis of preliminary data from the German Association of the Automotive Industry (Verband der Automobilindustrie, VDA), demand for passenger cars in Europe (EU-28 and EFTA) exceeded the level of the strong first quarter of 2017 by nearly 1% in the first quarter of 2018. The previous year’s values benefited from a greater number of working days. In the reporting period, rising sales figures in most countries compensated for the significant decline in sales in the United Kingdom, which fell by 12% compared to the previous year. Sales volumes were also down slightly year-on-year in Italy, Ireland and several Scandinavian countries. New passenger-car registrations increased by 4% in Germany and by 3% in France. In Spain, sales volumes rose by 11%, which reflects persistently high demand for replacements.
In the U.S.A., the number of new vehicle registrations increased by 2% to 4.1 million units in the first quarter of 2018. This was due to the continued growth in demand for light commercial vehicles, es-pecially pickup trucks, which rose by 10% year-on-year as a result of low fuel prices and persistently favorable lending rates. In con-trast, demand for sedans fell by 11%.
In Japan, sales volumes for passenger cars were stable at the aver-age level of the previous three years at 1.3 million units. However, there was a slight decline of 3% in demand for passenger cars compared with the previous year’s figure.
Demand for passenger cars in China continued to increase in the first quarter of 2018 due to the good economic situation. Accord-ing to the VDA, passenger-car sales volumes increased by nearly 4% to 6.0 million units in the reporting period, marking another new record for a first quarter. The remaining BRIC countries saw very substantial growth in demand during the reporting period. In Russia and Brazil, demand continued to recover, with increases of 22% and 15%, respectively, compared with the weak equivalent quarter of the previous year. In India, new vehicle registrations rose by 7%.
According to preliminary data, global new passenger-car registra-tions increased by 3% year-on-year to around 23.6 million units in the first quarter of 2018.
Economic Report
Continental AG Financial Report as at March 31, 2018 Corporate Management Report 9
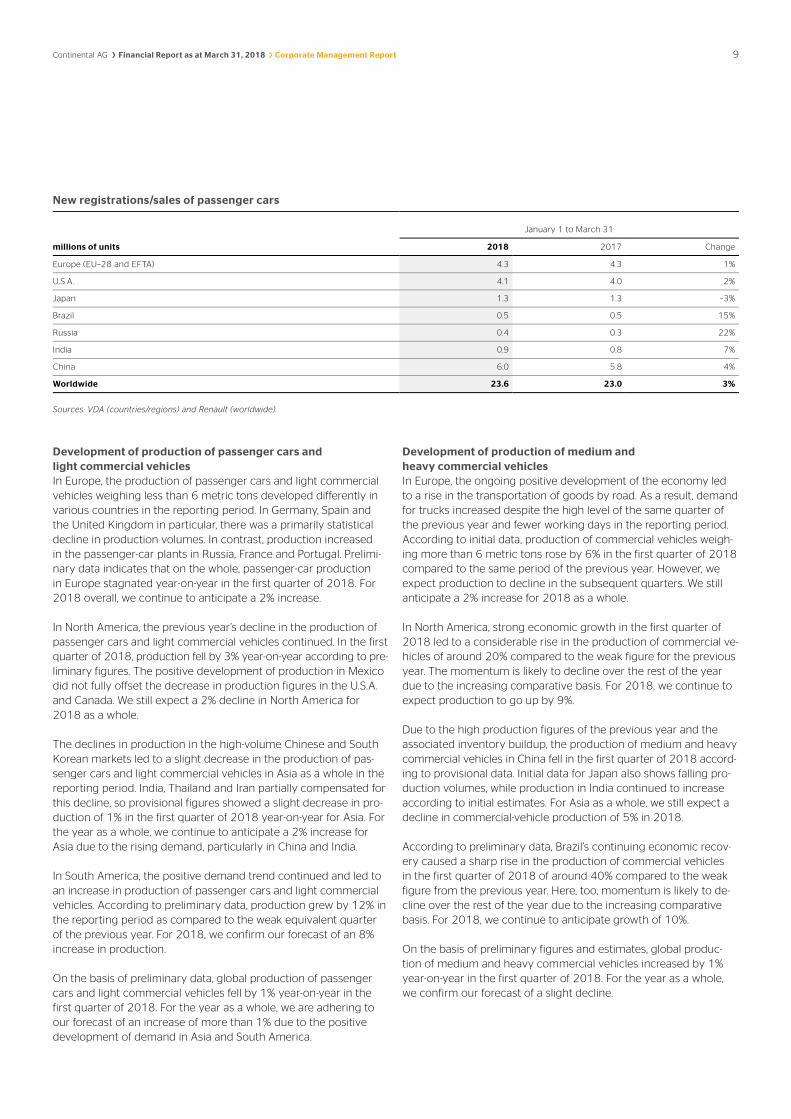
New registrations/sales of passenger cars
January 1 to March 31
millions of units 2018 2017 Change
Europe (EU–28 and EFTA) 4.3 4.3 1%
U.S.A. 4.1 4.0 2%
Japan 1.3 1.3 –3%
Brazil 0.5 0.5 15%
Russia 0.4 0.3 22%
India 0.9 0.8 7%
China 6.0 5.8 4%
Worldwide 23.6 23.0 3%
Sources: VDA (countries/regions) and Renault (worldwide).
Development of production of passenger cars and light commercial vehicles In Europe, the production of passenger cars and light commercial vehicles weighing less than 6 metric tons developed differently in various countries in the reporting period. In Germany, Spain and the United Kingdom in particular, there was a primarily statistical decline in production volumes. In contrast, production increased in the passenger-car plants in Russia, France and Portugal. Prelimi-nary data indicates that on the whole, passenger-car production in Europe stagnated year-on-year in the first quarter of 2018. For 2018 overall, we continue to anticipate a 2% increase.
In North America, the previous year’s decline in the production of passenger cars and light commercial vehicles continued. In the first quarter of 2018, production fell by 3% year-on-year according to pre-liminary figures. The positive development of production in Mexico did not fully offset the decrease in production figures in the U.S.A. and Canada. We still expect a 2% decline in North America for 2018 as a whole.
The declines in production in the high-volume Chinese and South Korean markets led to a slight decrease in the production of pas-senger cars and light commercial vehicles in Asia as a whole in the reporting period. India, Thailand and Iran partially compensated for this decline, so provisional figures showed a slight decrease in pro-duction of 1% in the first quarter of 2018 year-on-year for Asia. For the year as a whole, we continue to anticipate a 2% increase for Asia due to the rising demand, particularly in China and India.
In South America, the positive demand trend continued and led to an increase in production of passenger cars and light commercial vehicles. According to preliminary data, production grew by 12% in the reporting period as compared to the weak equivalent quarter of the previous year. For 2018, we confirm our forecast of an 8% increase in production.
On the basis of preliminary data, global production of passenger cars and light commercial vehicles fell by 1% year-on-year in the first quarter of 2018. For the year as a whole, we are adhering to our forecast of an increase of more than 1% due to the positive development of demand in Asia and South America.
Development of production of medium and heavy commercial vehicles In Europe, the ongoing positive development of the economy led to a rise in the transportation of goods by road. As a result, demand for trucks increased despite the high level of the same quarter of the previous year and fewer working days in the reporting period. According to initial data, production of commercial vehicles weigh-ing more than 6 metric tons rose by 6% in the first quarter of 2018 compared to the same period of the previous year. However, we expect production to decline in the subsequent quarters. We still anticipate a 2% increase for 2018 as a whole.
In North America, strong economic growth in the first quarter of 2018 led to a considerable rise in the production of commercial ve-hicles of around 20% compared to the weak figure for the previous year. The momentum is likely to decline over the rest of the year due to the increasing comparative basis. For 2018, we continue to expect production to go up by 9%.
Due to the high production figures of the previous year and the associated inventory buildup, the production of medium and heavy commercial vehicles in China fell in the first quarter of 2018 accord-ing to provisional data. Initial data for Japan also shows falling pro-duction volumes, while production in India continued to increase according to initial estimates. For Asia as a whole, we still expect a decline in commercial-vehicle production of 5% in 2018.
According to preliminary data, Brazil’s continuing economic recov-ery caused a sharp rise in the production of commercial vehicles in the first quarter of 2018 of around 40% compared to the weak figure from the previous year. Here, too, momentum is likely to de-cline over the rest of the year due to the increasing comparative basis. For 2018, we continue to anticipate growth of 10%.
On the basis of preliminary figures and estimates, global produc-tion of medium and heavy commercial vehicles increased by 1% year-on-year in the first quarter of 2018. For the year as a whole, we confirm our forecast of a slight decline.

10 Continental AG Financial Report as at March 31, 2018 Corporate Management Report
Development of replacement-tire markets for passenger cars and light commercial vehicles In Europe – Continental’s most important market for replacement tires for passenger cars and light commercial vehicles weighing less than 6 metric tons – sales volumes in the first quarter of 2018 fell 1% short of the very strong comparative figure for the previous year. We expect a slight increase in volumes in the following quar-ters and are therefore still forecasting market growth of 2% for the year as a whole.
In North America, demand for replacement tires for passenger cars and light commercial vehicles likewise fell just short of the high figure for the previous year in the reporting period. According to preliminary figures, sales volumes decreased by 2%. However, we expect increasing demand for replacement tires over the rest of the year. For 2018, we are adhering to our forecast of 2% growth.
Asia posted a slight decline in demand for replacement tires for passenger cars and light commercial vehicles in the first quarter of 2018. In China – the most important Asian market – demand declined by 2% in the first quarter of 2018. In Japan, the strong winter-tire business at the start of the year resulted in a slight rise in sales volumes of replacement tires. We expect volumes in the Asian market to grow again over the rest of the year. For the year as a whole, we confirm our forecast of 5% growth in replacement-tire volumes for passenger cars and light commercial vehicles in Asia.
In South America, preliminary figures indicate that demand for replacement tires for passenger cars and light commercial vehicles increased by 9% in the reporting period thanks to the continuing recovery of the economic situation. For 2018 as a whole, we con-tinue to expect a 4% increase in volumes.
Global demand for replacement tires for passenger cars and light commercial vehicles fell by 1% in the first quarter of 2018 accord-ing to preliminary data. For 2018 as a whole, however, we still ex-pect global demand to increase by 3%.
Development of replacement-tire markets for medium and heavy commercial vehicles In the previous year’s quarter, purchases brought forward resulted in a sharp increase in demand for replacement tires for medium and heavy commercial vehicles in Europe. Due to the high basis of comparison, demand for replacement tires for medium and heavy commercial vehicles stagnated in the first quarter of 2018. Demand is likely to go up again in the following quarters. For 2018 as a whole, we still expect sales volumes in Europe to increase by 2%.
In North America, demand for replacement tires for medium and heavy commercial vehicles rose by 4% in the first quarter of 2018 compared to the high figure for the previous year. However, we expect volumes to normalize over the rest of the year. For the year as a whole, we are leaving our forecast unchanged at growth of 3%.
In Asia, demand for replacement tires for medium and heavy com-mercial vehicles this year is expected to follow the economic devel-opment of the individual countries and keep growing. For Asia as a whole, we continue to expect demand to rise by 2% in 2018.
In South America, demand for replacement tires for medium and heavy commercial vehicles grew by 7% in the period under review. As a result of the economic recovery, we also expect demand to rise in the subsequent quarters. For 2018 as a whole, we confirm our forecast of an increase of 5%.
Global demand for replacement tires for medium and heavy com-mercial vehicles rose by 2% in the first quarter of 2018. We are maintaining our growth forecast for the year as a whole at 2%.
Continental AG Financial Report as at March 31, 2018 Corporate Management Report 11
Earnings, Financial and Net Assets Position of the Continental Corporation
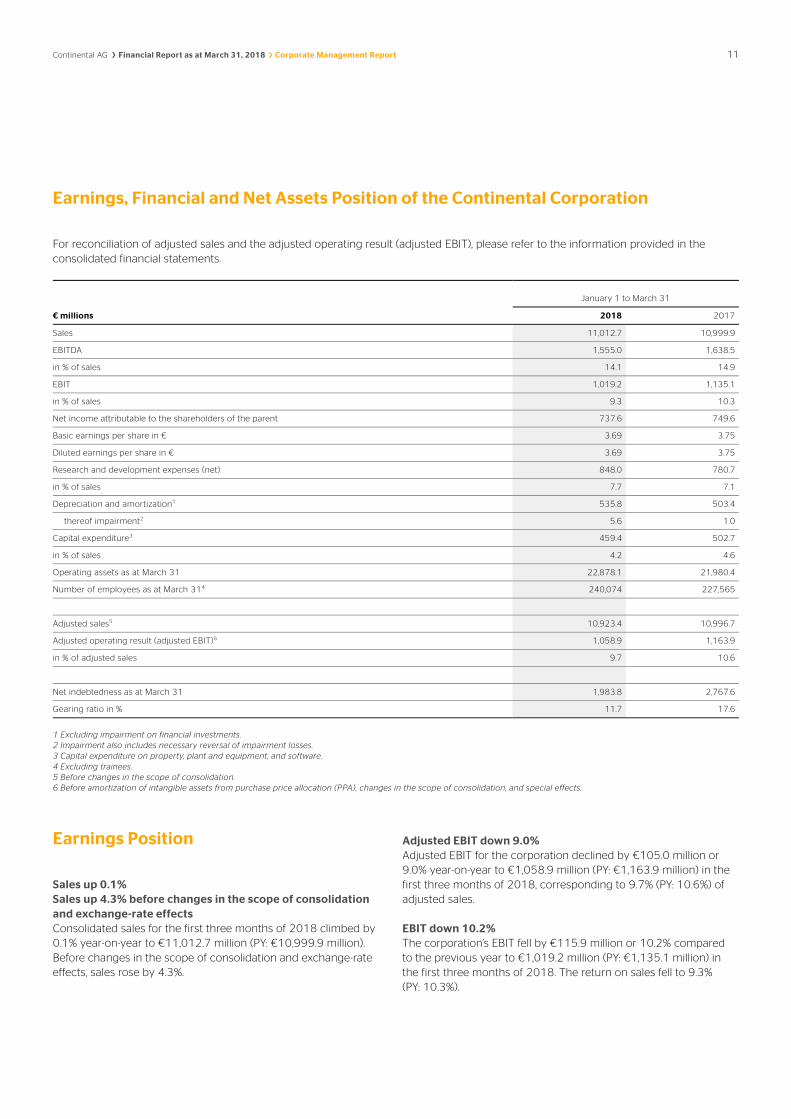
For reconciliation of adjusted sales and the adjusted operating result (adjusted EBIT), please refer to the information provided in the consolidated financial statements.
January 1 to March 31
€ millions 2018 2017
Sales 11,012.7 10,999.9
EBITDA 1,555.0 1,638.5
in % of sales 14.1 14.9
EBIT 1,019.2 1,135.1
in % of sales 9.3 10.3
Net income attributable to the shareholders of the parent 737.6 749.6
Basic earnings per share in € 3.69 3.75
Diluted earnings per share in € 3.69 3.75
Research and development expenses (net) 848.0 780.7
in % of sales 7.7 7.1
Depreciation and amortization1 535.8 503.4
thereof impairment2 5.6 1.0
Capital expenditure3 459.4 502.7
in % of sales 4.2 4.6
Operating assets as at March 31 22,878.1 21,980.4
Number of employees as at March 314 240,074 227,565
Adjusted sales5 10,923.4 10,996.7
Adjusted operating result (adjusted EBIT)6 1,058.9 1,163.9
in % of adjusted sales 9.7 10.6
Net indebtedness as at March 31 1,983.8 2,767.6
Gearing ratio in % 11.7 17.6
1 Excluding impairment on financial investments. 2 Impairment also includes necessary reversal of impairment losses. 3 Capital expenditure on property, plant and equipment, and software. 4 Excluding trainees. 5 Before changes in the scope of consolidation. 6 Before amortization of intangible assets from purchase price allocation (PPA), changes in the scope of consolidation, and special effects.
Earnings Position
Sales up 0.1% Sales up 4.3% before changes in the scope of consolidation and exchange-rate effects Consolidated sales for the first three months of 2018 climbed by 0.1% year-on-year to €11,012.7 million (PY: €10,999.9 million). Before changes in the scope of consolidation and exchange-rate effects, sales rose by 4.3%.
Adjusted EBIT down 9.0% Adjusted EBIT for the corporation declined by €105.0 million or 9.0% year-on-year to €1,058.9 million (PY: €1,163.9 million) in the first three months of 2018, corresponding to 9.7% (PY: 10.6%) of adjusted sales.
EBIT down 10.2% The corporation’s EBIT fell by €115.9 million or 10.2% compared to the previous year to €1,019.2 million (PY: €1,135.1 million) in the first three months of 2018. The return on sales fell to 9.3% (PY: 10.3%).

12 Continental AG Financial Report as at March 31, 2018 Corporate Management Report
Special effects in the first quarter of 2018 Impairment on property, plant and equipment resulted in expense totaling €5.4 million in the Powertrain division.
Moreover, an expense of €0.2 million likewise resulted from impair-ment on property, plant and equipment in the Interior division.
Total consolidated expense from special effects in the first three months of 2018 amounted to €5.6 million.
Special effects in the first quarter of 2017 Impairment on property, plant and equipment resulted in expense of €1.0 million in the Powertrain division.
In the Tire division, the disposal of equity interests held as financial assets resulted in income totaling €13.0 million.
In addition, a first-time consolidation resulted in a gain of €0.5 million in the Tire division.
The ContiTech division incurred restructuring expenses of €0.1 million.
Special effects had a positive impact for the corporation totaling €12.4 million in the first three months of 2017.
Research and development In the first three months of 2018, research and development ex-penses (net) rose by 8.6% compared with the same period of the previous year to €848.0 million (PY: €780.7 million), representing 7.7% (PY: 7.1%) of sales. €736.5 million (PY: €676.1 million) of this related to the Automotive Group, corresponding to 10.8% (PY: 10.0%) of sales, and €111.5 million (PY: €104.6 million) to the Rubber Group, corresponding to 2.6% (PY: 2.5%) of sales.
Financial result The negative financial result decreased by €35.3 million year-on-year to €48.3 million (PY: €83.6 million) in the first quarter of 2018. This is attributable primarily to the sum of the effects from changes in the fair value of derivative instruments and from currency trans-lation.
Interest income in the first three months of 2018 decreased by €1.4 million year-on-year to €22.0 million (PY: €23.4 million). Of this, expected income from long-term employee benefits and from pension funds amounted to €14.1 million (PY: €16.8 million). This does not include the interest income from the plan assets of the pension contribution funds.
Interest expense totaled €64.3 million in the first three months of 2018 (PY: €72.2 million). At €29.2 million, interest expense result-ing from bank borrowings, capital market transactions, and other financing instruments was €5.0 million lower than the prior-year figure of €34.2 million. The major portion related to expense of €16.2 million (PY: €21.1 million) from the bonds issued by Conti-nental AG and Continental Rubber of America, Corp., Wilmington, Delaware, U.S.A. The year-on-year decline in this expense is attribut-able to the repayment of the €750.0 million euro bond from Conti-Gummi Finance B.V., Maastricht, Netherlands, on March 20, 2017. The 3.5-year bond bore interest at a rate of 2.5% p.a. The interest cost on long-term employee benefits resulted in interest expense totaling €35.1 million (PY: €38.0 million) in the first quarter of 2018. This does not include the interest expense from the defined benefit obligations of the pension contribution funds.
The effects from currency translation resulted in a negative contri-bution to earnings of €15.5 million (PY: €70.4 million) in the first quarter of 2018. This was countered by effects from changes in the fair value of derivative instruments, and other valuation effects, which resulted in earnings of €9.5 million (PY: €35.6 million). €0.3 million of this (PY: €0.3 million) is attributable to other valuation effects. Taking into account the sum of the effects from currency translation and changes in the fair value of derivative instruments, earnings were negatively impacted by €6.3 million (PY: €35.1 mil-lion) in the first three months of 2018.
Income tax expense Income tax expense in the first three months of 2018 amounted to €219.4 million (PY: €287.0 million). The tax rate in the reporting period amounted to 22.6% (PY: 27.3%).
Net income attributable to the shareholders of the parent Net income attributable to the shareholders of the parent was down 1.6% at €737.6 million (PY: €749.6 million). After the first three months of 2018, basic earnings per share amounted to €3.69 (PY: €3.75), the same amount as diluted earnings per share.

Continental AG Financial Report as at March 31, 2018 Corporate Management Report 13
Financial Position
Reconciliation of cash flow EBIT for the first quarter of 2018 decreased by €115.9 million compared to the same period of 2017 to €1,019.2 million (PY: €1,135.1 million).
Interest payments resulting largely from bonds decreased by €19.4 million to €28.2 million (PY: €47.6 million).
Income tax payments fell by €70.0 million to €190.3 million (PY: €260.3 million).
At €824.3 million as at March 31, 2018, the net cash outflow arising from the increase in operating working capital was €144.6 million higher than the figure for the previous year of €679.7 million.
At €634.1 million as at March 31, 2018, cash provided by operating activities was €230.2 million lower than the previous year’s figure of €864.3 million.
Cash flow arising from investing activities amounted to an outflow of €593.2 million (PY: €731.3 million) in the first three months of 2018. Capital expenditure on property, plant and equipment, and software was down €43.3 million from €502.7 million to €459.4 million before finance leases and the capitalization of borrowing costs. The acquisition and disposal of interests in companies and business operations resulted in a total cash outflow of €145.0 mil-lion (PY: €211.7 million).
The free cash flow in the first quarter of 2018 resulted in an inflow of €40.9 million (PY: €133.0 million), €92.1 million less than in the same period of the previous year.
Financing and indebtedness At €1,983.8 million as at March 31, 2018, the Continental Corpora-tion’s net indebtedness was lower than the previous year’s level of €2,767.6 million. Compared to the figure of €2,047.6 million as at December 31, 2017, it had decreased by €63.8 million. The gear-ing ratio improved to 11.7% (PY: 17.6%) as at the end of the first quarter of 2018.
The syndicated loan comprises a revolving tranche of €3.0 billion. This credit line is available to Continental until April 2021 and had not been utilized at the end of March 2018 or in the previous year.
As at March 31, 2018, Continental had liquidity reserves totaling €5,887.7 million (PY: €5,758.1 million), consisting of cash and cash equivalents of €2,288.6 million (PY: €1,895.7 million) and commit-ted, unutilized credit lines totaling €3,599.1 million (PY: €3,862.4 million).
The restrictions that may impact the availability of capital are also understood as comprising all existing restrictions on the cash and cash equivalents. In the Continental Corporation, the aforemen-tioned cash and cash equivalents are restricted with regard to pledged amounts and balances in countries with foreign-exchange restrictions or other barriers to accessing liquidity. Taxes to be paid on the transfer of cash assets from one country to another are not usually considered to represent a restriction on cash and cash equivalents. As at March 31, 2018, unrestricted cash and cash equivalents totaled €2,105.6 million (PY: €1,425.7 million).

14 Continental AG Financial Report as at March 31, 2018 Corporate Management Report
Reconciliation of net indebtedness
€ millions March 31, 2018 March 31, 2017
Long-term indebtedness 1,459.7 2,783.2
Short-term indebtedness 2,996.7 1,939.4
Long-term derivative instruments and interest-bearing investments –40.6 –17.3
Short-term derivative instruments and interest-bearing investments –143.4 –42.0
Cash and cash equivalents –2,288.6 –1,895.7
Net indebtedness 1,983.8 2,767.6
Reconciliation of change in net indebtedness
January 1 to March 31
€ millions 2018 2017
Net indebtedness at the beginning of the reporting period 2,047.6 2,797.8
Cash flow arising from operating activities 634.1 864.3
Cash flow arising from investing activities –593.2 –731.3
Cash flow before financing activities (free cash flow) 40.9 133.0
Dividends paid to and cash changes from equity transactions with non-controlling interests –6.4 –0.4
Non-cash changes 12.6 26.7
Other –3.1 –150.1
Exchange-rate effects 19.8 21.0
Change in net indebtedness 63.8 30.2
Net indebtedness at the end of the reporting period 1,983.8 2,767.6
Capital expenditure (additions) In the first quarter of 2018, capital expenditure on property, plant and equipment, and software amounted to €459.4 million (PY: €502.7 million). The capital expenditure ratio after three months was 4.2% (PY: 4.6%).
A total of €276.3 million (PY: €287.3 million) of this capital expendi-ture was attributable to the Automotive Group, representing 4.1% (PY: 4.3%) of sales. The Automotive Group invested primarily in production equipment for the manufacture of new products and implementation of new technologies, with manufacturing capacity being expanded in Germany, in China, in the U.S.A. and at European best-cost locations. In the Chassis & Safety division, there were ma-jor additions relating to the expansion of production facilities for the Vehicle Dynamics and Advanced Driver Assistance Systems business units. Manufacturing capacity for electronic brake systems was expanded in particular. In the Powertrain division, there were major investments in expanding production capacity for the Engine Systems and Sensors & Actuators business units. In the Interior division, production capacity was expanded in particular for the Instrumentation & Driver HMI and Body & Security business units.
The Rubber Group invested €179.5 million (PY: €215.0 million), equivalent to 4.3% (PY: 5.0%) of sales. There were major additions relating to the new plant buildings in Rayong, Thailand, and Clinton, Mississippi, U.S.A. Production capacity was also increased at exist-ing plants in Sumter, South Carolina, U.S.A., and in Hefei, China. Quality assurance and cost-cutting measures were implemented as well. In the ContiTech division, there were major investments relat-ing to the expansion of production capacity for the Mobile Fluid Systems, Benecke-Hornschuch Surface Group, Power Transmission Group, and Conveyor Belt Group business units. Investments were made in all business units to rationalize existing production pro-cesses.
Continental AG Financial Report as at March 31, 2018 Corporate Management Report 15
Net Assets Position
At €38,844.2 million (PY: €37,911.8 million), total assets as at March 31, 2018, were €932.4 million higher than on the same date in the previous year. Goodwill, at €6,967.8 million, was down by €9.3 million compared to the previous year’s figure of €6,977.1 million. Other intangible assets fell by €97.7 million to €1,522.8 million (PY: €1,620.5 million). In contrast, property, plant and equip-ment rose by €385.3 million to €11,152.1 million (PY: €10,766.8 million). Deferred tax assets were down €290.3 million at €1,529.2 million (PY: €1,819.5 million). Inventories rose by €250.5 million to €4,367.0 million (PY: €4,116.5 million). Trade accounts receivable declined by €57.1 million to €8,294.8 million (PY: €8,351.9 million). Short-term derivative instruments and interest-bearing investments were up by €101.4 million at €143.4 million (PY: €42.0 million). At €2,288.6 million, cash and cash equivalents were up €392.9 mil-lion from €1,895.7 million on the same date in the previous year.
Equity including non-controlling interests was up €1,289.0 million at €17,011.4 million as compared to €15,722.4 million as at March 31, 2017. This was due primarily to the increase in retained earnings of €2,153.4 million. Other comprehensive income changed by -€851.4 million to -€2,552.0 million (PY: -€1,700.6 million). The gearing ratio improved from 17.6% to 11.7%. The equity ratio rose to 43.8% (PY: 41.5%).
At €38,844.2 million, total assets were up €1,403.7 million com-pared with December 31, 2017 (PY: €37,440.5 million). In relation to the individual items of the statement of financial position, this is due primarily to the rise in inventories of €238.8 million to €4,367.0 million (PY: €4,128.2 million), the increase in trade accounts receivable of €625.5 million to €8,294.8 million (PY: €7,669.3 million) and the €407.1 million increase in cash and cash equivalents to €2,288.6 million (PY: €1,881.5 million).
Equity including non-controlling interests was up €721.1 million at €17,011.4 million as compared to €16,290.3 million at the end of 2017. The positive net income attributable to the shareholders of the parent resulted in an increase of €737.6 million. Other compre-hensive income changed by -€43.5 million to -€2,552.0 million (PY: -€2,508.5 million). The gearing ratio changed from 12.6% to 11.7%.
Employees As at the end of the first quarter of 2018, the corporation had 240,074 employees, representing a rise of 4,601 in comparison to the end of 2017. The number of employees in the Automotive Group rose by 3,076 as a result of increased production volumes and expansion of research and development. In the Rubber Group, further expansion of production capacity and sales channels led to an increase of 1,545 employees. Compared with the reporting date for the previous year, the number of employees in the corporation was up by a total of 12,509.
16 Continental AG Financial Report as at March 31, 2018 Corporate Management Report
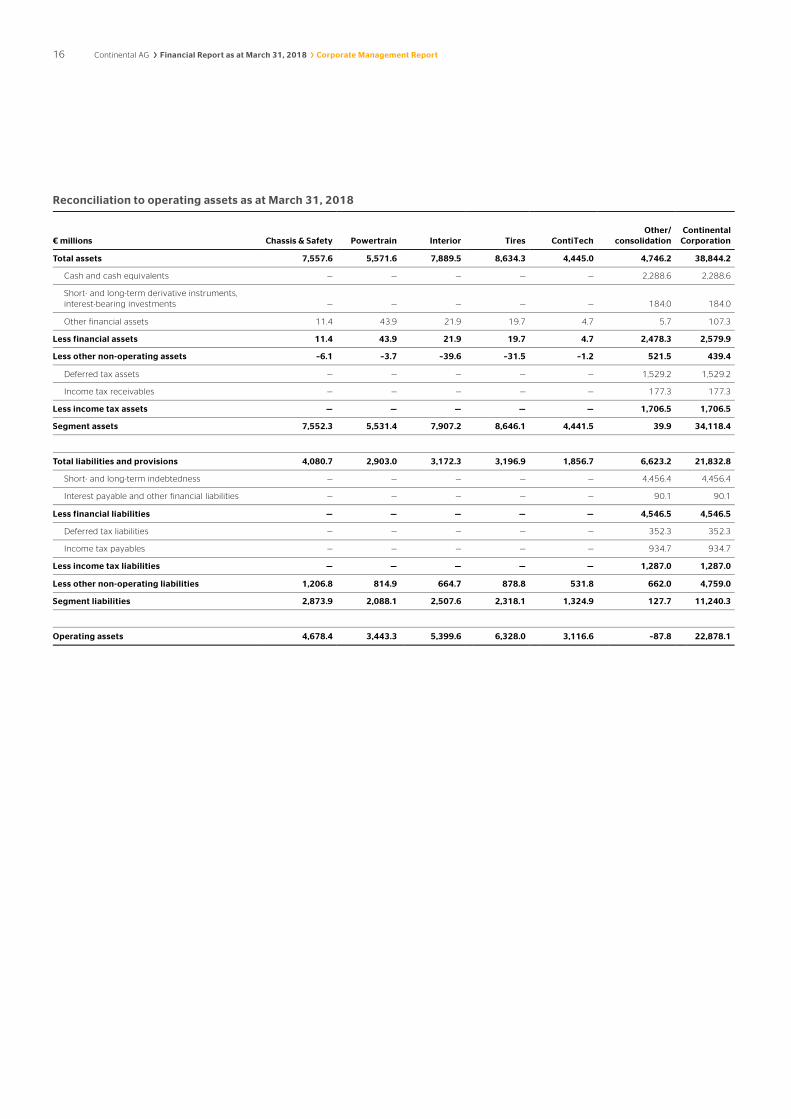
Reconciliation to operating assets as at March 31, 2018
€ millions Chassis & Safety Powertrain Interior Tires ContiTech Other/
consolidation Continental
Corporation
Total assets 7,557.6 5,571.6 7,889.5 8,634.3 4,445.0 4,746.2 38,844.2
Cash and cash equivalents — — — — — 2,288.6 2,288.6
Short- and long-term derivative instruments, interest-bearing investments — — — — — 184.0 184.0
Other financial assets 11.4 43.9 21.9 19.7 4.7 5.7 107.3
Less financial assets 11.4 43.9 21.9 19.7 4.7 2,478.3 2,579.9
Less other non-operating assets –6.1 –3.7 –39.6 –31.5 –1.2 521.5 439.4
Deferred tax assets — — — — — 1,529.2 1,529.2
Income tax receivables — — — — — 177.3 177.3
Less income tax assets — — — — — 1,706.5 1,706.5
Segment assets 7,552.3 5,531.4 7,907.2 8,646.1 4,441.5 39.9 34,118.4
Total liabilities and provisions 4,080.7 2,903.0 3,172.3 3,196.9 1,856.7 6,623.2 21,832.8
Short- and long-term indebtedness — — — — — 4,456.4 4,456.4
Interest payable and other financial liabilities — — — — — 90.1 90.1
Less financial liabilities — — — — — 4,546.5 4,546.5
Deferred tax liabilities — — — — — 352.3 352.3
Income tax payables — — — — — 934.7 934.7
Less income tax liabilities — — — — — 1,287.0 1,287.0
Less other non-operating liabilities 1,206.8 814.9 664.7 878.8 531.8 662.0 4,759.0
Segment liabilities 2,873.9 2,088.1 2,507.6 2,318.1 1,324.9 127.7 11,240.3
Operating assets 4,678.4 3,443.3 5,399.6 6,328.0 3,116.6 –87.8 22,878.1

Continental AG Financial Report as at March 31, 2018 Corporate Management Report 17
Reconciliation to operating assets as at March 31, 2017
€ millions Chassis & Safety Powertrain Interior Tires ContiTech Other/
consolidation Continental
Corporation
Total assets 7,402.4 5,335.0 7,332.0 8,592.2 4,638.6 4,611.6 37,911.8
Cash and cash equivalents — — — — — 1,895.7 1,895.7
Short- and long-term derivative instruments, interest-bearing investments — — — — — 59.3 59.3
Other financial assets 11.9 49.2 17.5 16.2 6.3 17.5 118.6
Less financial assets 11.9 49.2 17.5 16.2 6.3 1,972.5 2,073.6
Less other non-operating assets — 0.5 –45.4 –2.2 –7.7 634.9 580.1
Deferred tax assets — — — — — 1,819.5 1,819.5
Income tax receivables — — — — — 145.8 145.8
Less income tax assets — — — — — 1,965.3 1,965.3
Segment assets 7,390.5 5,285.3 7,359.9 8,578.2 4,640.0 38.9 33,292.8
Total liabilities and provisions 4,152.2 2,916.5 3,137.1 3,401.2 1,854.2 6,728.2 22,189.4
Short- and long-term indebtedness — — — — — 4,722.6 4,722.6
Interest payable and other financial liabilities — — — — — 97.3 97.3
Less financial liabilities — — — — — 4,819.9 4,819.9
Deferred tax liabilities — — — — — 444.7 444.7
Income tax payables — — — — — 829.0 829.0
Less income tax liabilities — — — — — 1,273.7 1,273.7
Less other non-operating liabilities 1,246.2 816.1 656.9 952.7 525.1 586.4 4,783.4
Segment liabilities 2,906.0 2,100.4 2,480.2 2,448.5 1,329.1 48.2 11,312.4
Operating assets 4,484.5 3,184.9 4,879.7 6,129.7 3,310.9 –9.3 21,980.4

18 Continental AG Financial Report as at March 31, 2018 Corporate Management Report
Development of the Divisions
January 1 to March 31
Chassis & Safety in € millions 2018 2017
Sales 2,511.2 2,497.4
EBITDA 356.8 336.9
in % of sales 14.2 13.5
EBIT 252.9 238.9
in % of sales 10.1 9.6
Depreciation and amortization1 103.9 98.0
thereof impairment2 — —
Capital expenditure3 93.9 100.8
in % of sales 3.7 4.0
Operating assets as at March 31 4,678.4 4,484.5
Number of employees as at March 314 48,263 44,952
Adjusted sales5 2,511.2 2,497.4
Adjusted operating result (adjusted EBIT)6 252.9 238.9
in % of adjusted sales 10.1 9.6
1 Excluding impairment on financial investments. 2 Impairment also includes necessary reversal of impairment losses. 3 Capital expenditure on property, plant and equipment, and software. 4 Excluding trainees. 5 Before changes in the scope of consolidation. 6 Before amortization of intangible assets from purchase price allocation (PPA), changes in the scope of consolidation, and special effects.
Chassis & Safety
Sales volumes In the Vehicle Dynamics business unit, the number of electronic brake systems sold in the first three months of 2018 increased by 3% year-on-year. In the Hydraulic Brake Systems business unit, sales figures for brake boosters rose 6% compared to the previous year. Sales of brake calipers with integrated electric parking brakes increased by 25% year-on-year, more than compensating for the decline in sales figures for conventional brake calipers, which de-creased by 8% year-on-year. In the Passive Safety & Sensorics busi-ness unit, the sales volume of air-bag control units rose by 5% year-on-year. Unit sales of advanced driver assistance systems were up 37%.
Sales up 0.6% Sales up 6.0% before changes in the scope of consolidation and exchange-rate effects Sales of the Chassis & Safety division were up 0.6% at €2,511.2 mil-lion (PY: €2,497.4 million) in the first three months of 2018 com-pared with the same period of the previous year. Before changes in the scope of consolidation and exchange-rate effects, sales rose by 6.0%.
Adjusted EBIT up 5.9% Adjusted EBIT for the Chassis & Safety division increased by €14.0 million or 5.9% year-on-year to €252.9 million (PY: €238.9 million) during the first three months of 2018, corresponding to 10.1% (PY: 9.6%) of adjusted sales.
EBIT up 5.9% Compared with the same period of the previous year, the Chassis & Safety division reported an increase in EBIT of €14.0 million or 5.9% to €252.9 million (PY: €238.9 million) in the first three months of 2018. The return on sales rose to 10.1% (PY: 9.6%).
Special effects There were no special effects in the Chassis & Safety division in either the first quarter of 2018 or the same period of the previous year.

Continental AG Financial Report as at March 31, 2018 Corporate Management Report 19
January 1 to March 31
Powertrain in € millions 2018 2017
Sales 1,945.6 2,003.1
EBITDA 207.3 213.9
in % of sales 10.7 10.7
EBIT 99.4 117.1
in % of sales 5.1 5.8
Depreciation and amortization1 107.9 96.8
thereof impairment2 5.4 1.0
Capital expenditure3 101.1 98.8
in % of sales 5.2 4.9
Operating assets as at March 31 3,443.3 3,184.9
Number of employees as at March 314 41,804 38,957
Adjusted sales5 1,945.6 2,003.1
Adjusted operating result (adjusted EBIT)6 107.7 121.1
in % of adjusted sales 5.5 6.0
1 Excluding impairment on financial investments. 2 Impairment also includes necessary reversal of impairment losses. 3 Capital expenditure on property, plant and equipment, and software. 4 Excluding trainees. 5 Before changes in the scope of consolidation. 6 Before amortization of intangible assets from purchase price allocation (PPA), changes in the scope of consolidation, and special effects.
Powertrain
Sales volumes In the Engine Systems business unit, sales volumes of engine con-trol units, injectors, pumps and turbochargers increased in the first three months of 2018. The Sensors & Actuators business unit is continuing to record growth. Emissions legislation has resulted in rising sales of exhaust-gas sensors in particular. In the Hybrid Elec-tric Vehicle business unit, sales volumes for power electronics, on-board power supply and battery systems were up year-on-year. Sales figures of the Transmission business unit were down slightly year-on-year in the first three months of 2018. Sales volumes in the Fuel & Exhaust Management business unit increased in com-parison to the previous year.
Sales down 2.9% Sales up 1.5% before changes in the scope of consolidation and exchange-rate effects Sales of the Powertrain division were down 2.9% at €1,945.6 mil-lion (PY: €2,003.1 million) in the first three months of 2018 com-pared with the same period of the previous year. Before changes in the scope of consolidation and exchange-rate effects, sales rose by 1.5%.
Adjusted EBIT down 11.1% Adjusted EBIT for the Powertrain division fell by €13.4 million or 11.1% year-on-year to €107.7 million (PY: €121.1 million) in the first three months of 2018, corresponding to 5.5% (PY: 6.0%) of adjusted sales.
EBIT down 15.1% Compared with the same period of the previous year, the Power-train division reported a decline in EBIT of €17.7 million or 15.1% to €99.4 million (PY: €117.1 million) in the first three months of 2018. The return on sales fell to 5.1% (PY: 5.8%).
Special effects in the first quarter of 2018 Impairment on property, plant and equipment resulted in expense totaling €5.4 million in the Powertrain division.
Special effects in the first quarter of 2017 Impairment on property, plant and equipment resulted in expense of €1.0 million.

20 Continental AG Financial Report as at March 31, 2018 Corporate Management Report
January 1 to March 31
Interior in € millions 2018 2017
Sales 2,401.7 2,293.9
EBITDA 283.4 273.6
in % of sales 11.8 11.9
EBIT 184.5 185.7
in % of sales 7.7 8.1
Depreciation and amortization1 98.9 87.9
thereof impairment2 0.2 —
Capital expenditure3 81.3 87.7
in % of sales 3.4 3.8
Operating assets as at March 31 5,399.6 4,879.7
Number of employees as at March 314 47,295 44,121
Adjusted sales5 2,400.6 2,293.9
Adjusted operating result (adjusted EBIT)6 202.1 197.3
in % of adjusted sales 8.4 8.6
1 Excluding impairment on financial investments. 2 Impairment also includes necessary reversal of impairment losses. 3 Capital expenditure on property, plant and equipment, and software. 4 Excluding trainees. 5 Before changes in the scope of consolidation. 6 Before amortization of intangible assets from purchase price allocation (PPA), changes in the scope of consolidation, and special effects.
Interior
Sales volumes Sales volumes in the Body & Security business unit were at the pre-vious year’s level in the first quarter of 2018. Sales figures in the Info-tainment & Connectivity business unit considerably exceeded the previous year’s figure. The growth was posted in the multimedia and connectivity areas. Sales volumes in the Commercial Vehicles & Aftermarket business unit were above the previous year’s level overall. Sales in the commercial vehicles business increased in the U.S.A. in particular. Replacement parts and aftermarket business also slightly exceeded the previous year’s sales volumes. In the Instrumentation & Driver HMI business unit, sales volumes in the first quarter of 2018 were higher than in the same period of the previous year.
Sales up 4.7% Sales up 8.5% before changes in the scope of consolidation and exchange-rate effects Sales of the Interior division were up 4.7% at €2,401.7 million (PY: €2,293.9 million) in the first three months of 2018 compared with the same period of the previous year. Before changes in the scope of consolidation and exchange-rate effects, sales rose by 8.5%.
Adjusted EBIT up 2.4% Adjusted EBIT for the Interior division rose by €4.8 million or 2.4% year-on-year to €202.1 million (PY: €197.3 million) in the first three months of 2018, corresponding to 8.4% (PY: 8.6%) of adjusted sales.
EBIT down 0.6% Compared with the same period of the previous year, the Interior division reported a decline in EBIT of €1.2 million or 0.6% to €184.5 million (PY: €185.7 million) in the first three months of 2018. The return on sales fell to 7.7% (PY: 8.1%).
Special effects in the first quarter of 2018 An expense of €0.2 million resulted from impairment on property, plant and equipment in the Interior division.
Special effects in the first quarter of 2017 There were no special effects in the Interior division in the first quarter of 2017.

Continental AG Financial Report as at March 31, 2018 Corporate Management Report 21
January 1 to March 31
Tires in € millions 2018 2017
Sales 2,635.5 2,756.3
EBITDA 545.8 651.3
in % of sales 20.7 23.6
EBIT 395.5 505.1
in % of sales 15.0 18.3
Depreciation and amortization1 150.3 146.2
thereof impairment2 — —
Capital expenditure3 130.1 172.2
in % of sales 4.9 6.2
Operating assets as at March 31 6,328.0 6,129.7
Number of employees as at March 314 54,682 53,322
Adjusted sales5 2,633.9 2,756.3
Adjusted operating result (adjusted EBIT)6 400.2 496.4
in % of adjusted sales 15.2 18.0
1 Excluding impairment on financial investments. 2 Impairment also includes necessary reversal of impairment losses. 3 Capital expenditure on property, plant and equipment, and software. 4 Excluding trainees. 5 Before changes in the scope of consolidation. 6 Before amortization of intangible assets from purchase price allocation (PPA), changes in the scope of consolidation, and special effects.
Tires
Sales volumes In the first three months of 2018, sales figures for passenger and light truck tires in both original equipment business and tire re-placement business were down slightly on the comparative figure for the previous year. Sales figures in commercial-vehicle tire busi-ness were 5% lower than the high level of the previous year.
Sales down 4.4% Sales up 1.0% before changes in the scope of consolidation and exchange-rate effects Sales of the Tire division were down 4.4% at €2,635.5 million (PY: €2,756.3 million) in the first three months of 2018 compared with the same period of the previous year. Before changes in the scope of consolidation and exchange-rate effects, sales rose by 1.0%.
Adjusted EBIT down 19.4% Adjusted EBIT for the Tire division decreased by €96.2 million or 19.4% year-on-year to €400.2 million (PY: €496.4 million) in the first three months of 2018, corresponding to 15.2% (PY: 18.0%) of adjusted sales.
EBIT down 21.7% Compared with the same period of the previous year, the Tire division reported a decline in EBIT of €109.6 million or 21.7% to €395.5 million (PY: €505.1 million) in the first three months of 2018. The return on sales fell to 15.0% (PY: 18.3%).
Special effects in the first quarter of 2018 There were no notable special effects in the Tire division in the first quarter of 2018.
Special effects in the first quarter of 2017 In the Tire division, the disposal of equity interests held as financial assets resulted in income totaling €13.0 million.
In addition, a first-time consolidation resulted in a gain of €0.5 million.
In the Tire division, the total positive impact from special effects in the first three months of 2017 amounted to €13.5 million.

22 Continental AG Financial Report as at March 31, 2018 Corporate Management Report
January 1 to March 31
ContiTech in € millions 2018 2017
Sales 1,601.7 1,521.4
EBITDA 195.9 191.3
in % of sales 12.2 12.6
EBIT 121.9 117.1
in % of sales 7.6 7.7
Depreciation and amortization1 74.0 74.2
thereof impairment2 — —
Capital expenditure3 49.4 42.8
in % of sales 3.1 2.8
Operating assets as at March 31 3,116.6 3,310.9
Number of employees as at March 314 47,612 45,788
Adjusted sales5 1,515.1 1,518.2
Adjusted operating result (adjusted EBIT)6 131.0 139.0
in % of adjusted sales 8.6 9.2
1 Excluding impairment on financial investments. 2 Impairment also includes necessary reversal of impairment losses. 3 Capital expenditure on property, plant and equipment, and software. 4 Excluding trainees. 5 Before changes in the scope of consolidation. 6 Before amortization of intangible assets from purchase price allocation (PPA), changes in the scope of consolidation, and special effects.
ContiTech
Sales up 5.3% Sales up 5.1% before changes in the scope of consolidation and exchange-rate effects Sales of the ContiTech division were up 5.3% at €1,601.7 million (PY: €1,521.4 million) in the first three months of 2018 compared with the same period of the previous year. Before changes in the scope of consolidation and exchange-rate effects, sales rose by 5.1%. The Conveyor Belt Group and Industrial Fluid Systems busi-ness units posted considerable sales growth compared to the low figures for the same period in the previous year. Furthermore, the Air Spring Systems, Benecke-Hornschuch Surface Group and Vibra-tion Control business units generated higher sales than in the com-parative period.
Adjusted EBIT down 5.8% Adjusted EBIT for the ContiTech division decreased by €8.0 million or 5.8% year-on-year to €131.0 million (PY: €139.0 million) during the first three months of 2018, corresponding to 8.6% (PY: 9.2%) of adjusted sales.
EBIT up 4.1% Compared with the same period of the previous year, the Conti-Tech division reported an increase in EBIT of €4.8 million or 4.1% to €121.9 million (PY: €117.1 million) in the first three months of 2018. The return on sales fell to 7.6% (PY: 7.7%).
Special effects in the first quarter of 2018 There were no special effects in the ContiTech division in the first quarter of 2018.
Special effects in the first quarter of 2017 The ContiTech division incurred restructuring expenses of €0.1 million.

Continental AG Financial Report as at March 31, 2018 Corporate Management Report 23
There were no material changes in risks and opportunities during the reporting period. For details of the main risks and opportunities, please refer to our comments in the 2017 Annual Report.
Report on Expected Developments and Outlook In the first half of 2018, exchange-rate and inventory-valuation effects will impact earnings by around €150 million. This relates mainly to the Tire division. Accordingly, the Rubber Group’s adjusted operating result (adjusted EBIT) was already around €100 million lower in the first quarter of 2018 than in the same period of the previous year.
As at April 18, 2018, it was not expected to be possible to compen-sate for these effects in the Rubber Group over the course of the year. We therefore lowered our forecast for the Rubber Group’s ad-justed EBIT margin in 2018 from around 15% to more than 14% on the same date. For the corporation, this also required that the forecast for the adjusted EBIT margin be lowered from around 10.5% to more than 10%.
Based on our market assumptions and provided that exchange rates remain constant in comparison to 2017, we still anticipate an increase in the Rubber Group’s sales to around €18.5 billion. Under the same conditions, for the Automotive Group we still anticipate sales to increase to approximately €28.5 billion with an adjusted EBIT margin of around 8.5%.
This results in sales of around €47 billion for the Continental Cor-poration for 2018, assuming constant exchange rates in compari-son to 2017. In the first quarter of 2018, exchange-rate effects had a negative impact on sales of €546 million. If the current level of exchange rates persists until the end of the year, this could have a negative effect on consolidated sales of more than €1 billion.
For the Rubber Group, every U.S. $10 increase in the average price of crude oil equates to a negative annual gross effect on EBIT of around U.S. $50 million. The average price of North Sea Brent was
around U.S. $54 in 2017 and U.S. $67 in the first quarter of 2018. As a result, we still expect costs for carbon black and other chemi-cals to increase by at least 10% compared to the average prices in 2017. For butadiene, a base material for synthetic rubber, we are lowering our forecast for the average price for the year from U.S. $1.60 per kilogram to U.S. $1.51 per kilogram. The average price for the year for natural rubber is currently expected to be below the previous year’s level (2017: U.S. $1.67 per kilogram for TSR 20). We are lowering our forecast from U.S. $1.84 per kilogram to U.S. $1.60 per kilogram. For 2018 as a whole, we currently expect that the developments in the prices of raw materials in the Rubber Group will almost balance each other out.
In 2018, we still expect the negative financial result before effects from currency translation, effects from changes in the fair value of derivative instruments, and other valuation effects to be less than €180 million. The tax rate should be less than 30% in 2018.
For 2018, we still anticipate negative special effects to total €100 million. Amortization from purchase price allocations, result-ing primarily from the acquisitions of Veyance Technologies (ac-quired in 2015), Elektrobit Automotive (acquired in 2015), and the Hornschuch Group (acquired in 2017), is expected to total approxi-mately €180 million and to affect mainly the ContiTech and Interior divisions.
In fiscal 2018, the capital expenditure ratio before financial invest-ments will increase to around 7% of sales as announced. Approxi-mately 60% of capital expenditure will be attributable to the Auto-motive Group and 40% to the Rubber Group. For 2018, we are still planning on achieving free cash flow of approximately €2 billion before acquisitions.
Report on Risks and Opportunities

24 Continental AG Financial Report as at March 31, 2018 Consolidated Financial Statements
Due to the application of the modified retrospective approach during the first-time adoption of IFRS 9, Financial Instruments, and IFRS 15, Revenue from Contracts with Customers, as at January 1, 2018, all the following figures from comparative periods are shown unadjusted.
Consolidated Statement of Income
January 1 to March 31
€ millions 2018 2017
Sales 11,012.7 10,999.9
Cost of sales –8,221.8 –8,135.2
Gross margin on sales 2,790.9 2,864.7
Research and development expenses1 –1,026.5 –780.7
Selling and logistics expenses –608.2 –600.5
Administrative expenses –287.1 –297.8
Other income1 286.9 52.6
Other expenses –152.0 –117.0
Income from equity-accounted investees 15.1 13.8
Other income from investments 0.1 —
EBIT 1,019.2 1,135.1
Interest income 22.0 23.4
Interest expense –64.3 –72.2
Effects from currency translation –15.5 –70.4
Effects from changes in the fair value of derivative instruments, and other valuation effects 9.5 35.6
Financial result –48.3 –83.6
Earnings before tax 970.9 1,051.5
Income tax expense –219.4 –287.0
Net income 751.5 764.5
Non-controlling interests –13.9 –14.9
Net income attributable to the shareholders of the parent 737.6 749.6
Basic earnings per share in € 3.69 3.75
Diluted earnings per share in € 3.69 3.75
1 Please see the “Revenue from contracts with customers” section regarding the changes in these items resulting from the first-time adoption of new IFRS standards.
Consolidated Financial Statements
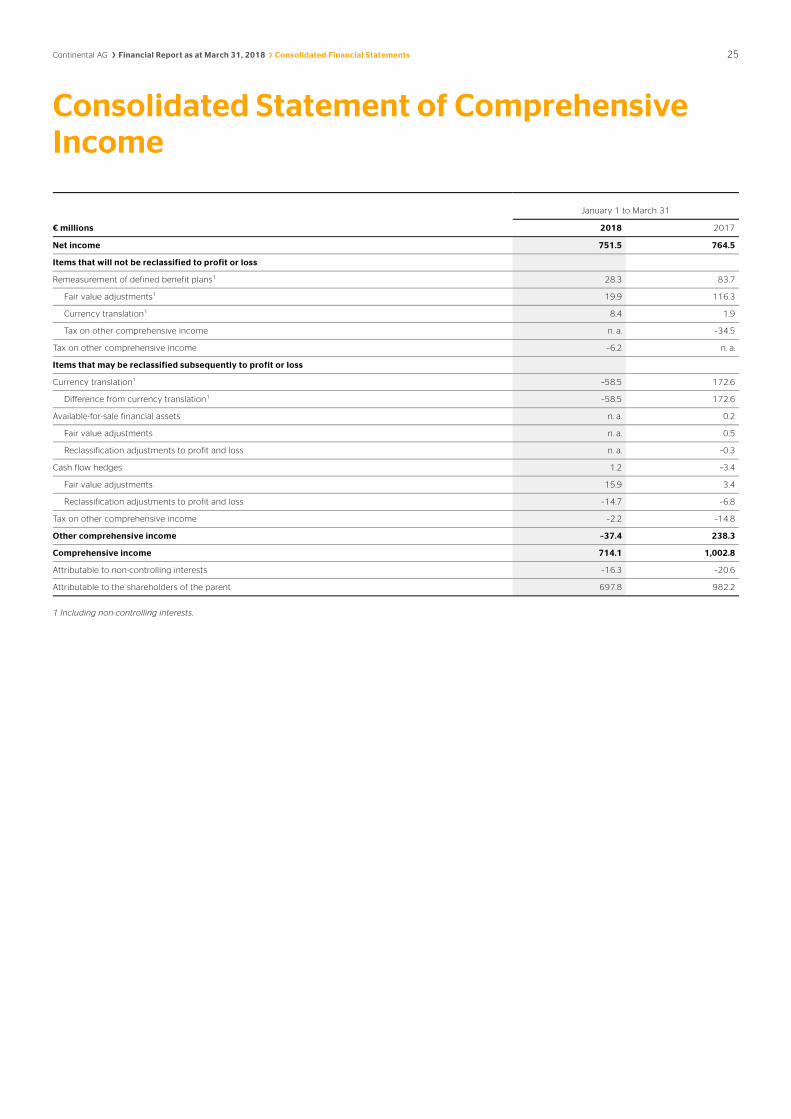
Continental AG Financial Report as at March 31, 2018 Consolidated Financial Statements 25
January 1 to March 31
€ millions 2018 2017
Net income 751.5 764.5
Items that will not be reclassified to profit or loss
Remeasurement of defined benefit plans1 28.3 83.7
Fair value adjustments1 19.9 116.3
Currency translation1 8.4 1.9
Tax on other comprehensive income n. a. –34.5
Tax on other comprehensive income –6.2 n. a.
Items that may be reclassified subsequently to profit or loss
Currency translation1 –58.5 172.6
Difference from currency translation1 –58.5 172.6
Available-for-sale financial assets n. a. 0.2
Fair value adjustments n. a. 0.5
Reclassification adjustments to profit and loss n. a. –0.3
Cash flow hedges 1.2 –3.4
Fair value adjustments 15.9 3.4
Reclassification adjustments to profit and loss –14.7 –6.8
Tax on other comprehensive income –2.2 –14.8
Other comprehensive income –37.4 238.3
Comprehensive income 714.1 1,002.8
Attributable to non-controlling interests –16.3 –20.6
Attributable to the shareholders of the parent 697.8 982.2
1 Including non-controlling interests.
Consolidated Statement of Comprehensive Income

26 Continental AG Financial Report as at March 31, 2018 Consolidated Financial Statements
Assets in € millions March 31, 2018 Dec. 31, 2017 March 31, 2017
Goodwill 6,967.8 7,010.1 6,977.1
Other intangible assets 1,522.8 1,607.3 1,620.5
Property, plant and equipment 11,152.1 11,202.1 10,766.8
Investment property 10.5 10.5 10.3
Investments in equity-accounted investees 428.9 414.8 382.8
Other investments 179.4 51.0 44.0
Deferred tax assets 1,529.2 1,517.2 1,819.5
Defined benefit assets 14.7 16.0 36.8
Long-term contract assets — n. a. n. a.
Long-term derivative instruments and interest-bearing investments 40.6 113.3 17.3
Long-term other financial assets 69.4 68.8 68.0
Long-term other assets 26.9 27.3 27.1
Non-current assets 21,942.3 22,038.4 21,770.2
Inventories 4,367.0 4,128.2 4,116.5
Trade accounts receivable 8,294.8 7,669.3 8,351.9
Short-term contract assets 35.3 n. a. n. a.
Short-term other financial assets1 324.3 297.0 254.4
Short-term other assets1 1,269.2 1,186.8 1,333.3
Income tax receivables 177.3 178.2 145.8
Short-term derivative instruments and interest-bearing investments 143.4 47.6 42.0
Cash and cash equivalents 2,288.6 1,881.5 1,895.7
Assets held for sale 2.0 13.5 2.0
Current assets 16,901.9 15,402.1 16,141.6
Total assets 38,844.2 37,440.5 37,911.8
1 From the 2018 reporting year, the presentation of financial assets is made more transparent by reclassifying deferred costs from the sale of customer tooling from short-term other financial assets to short-term other assets among these items of the statement of financial position. The figures from the comparative periods have been adjusted accordingly.
Consolidated Statement of Financial Position

Continental AG Financial Report as at March 31, 2018 Consolidated Financial Statements 27
Equity and liabilities in € millions March 31, 2018 Dec. 31, 2017 March 31, 2017
Subscribed capital 512.0 512.0 512.0
Capital reserves 4,155.6 4,155.6 4,155.6
Retained earnings 14,437.7 13,669.3 12,284.3
Other comprehensive income –2,552.0 –2,508.5 –1,700.6
Equity attributable to the shareholders of the parent 16,553.3 15,828.4 15,251.3
Non-controlling interests 458.1 461.9 471.1
Total equity 17,011.4 16,290.3 15,722.4
Long-term employee benefits 4,410.4 4,394.1 4,356.1
Deferred tax liabilities 352.3 348.5 444.7
Long-term provisions for other risks and obligations 133.5 139.6 205.5
Long-term indebtedness 1,459.7 2,017.8 2,783.2
Long-term other financial liabilities 35.5 36.1 106.2
Long-term contract liabilities 11.3 n. a. n. a.
Long-term other liabilities 16.6 25.4 16.0
Non-current liabilities 6,419.3 6,961.5 7,911.7
Short-term employee benefits 1,745.0 1,490.6 1,596.1
Trade accounts payable 6,757.0 6,798.5 6,760.1
Short-term contract liabilities 1,002.1 n. a. n. a.
Income tax payables 934.7 889.7 829.0
Short-term provisions for other risks and obligations 919.4 943.0 1,198.2
Short-term indebtedness 2,996.7 2,072.2 1,939.4
Short-term other financial liabilities 345.9 1,276.8 1,111.0
Short-term other liabilities 712.7 717.9 843.9
Current liabilities 15,413.5 14,188.7 14,277.7
Total equity and liabilities 38,844.2 37,440.5 37,911.8
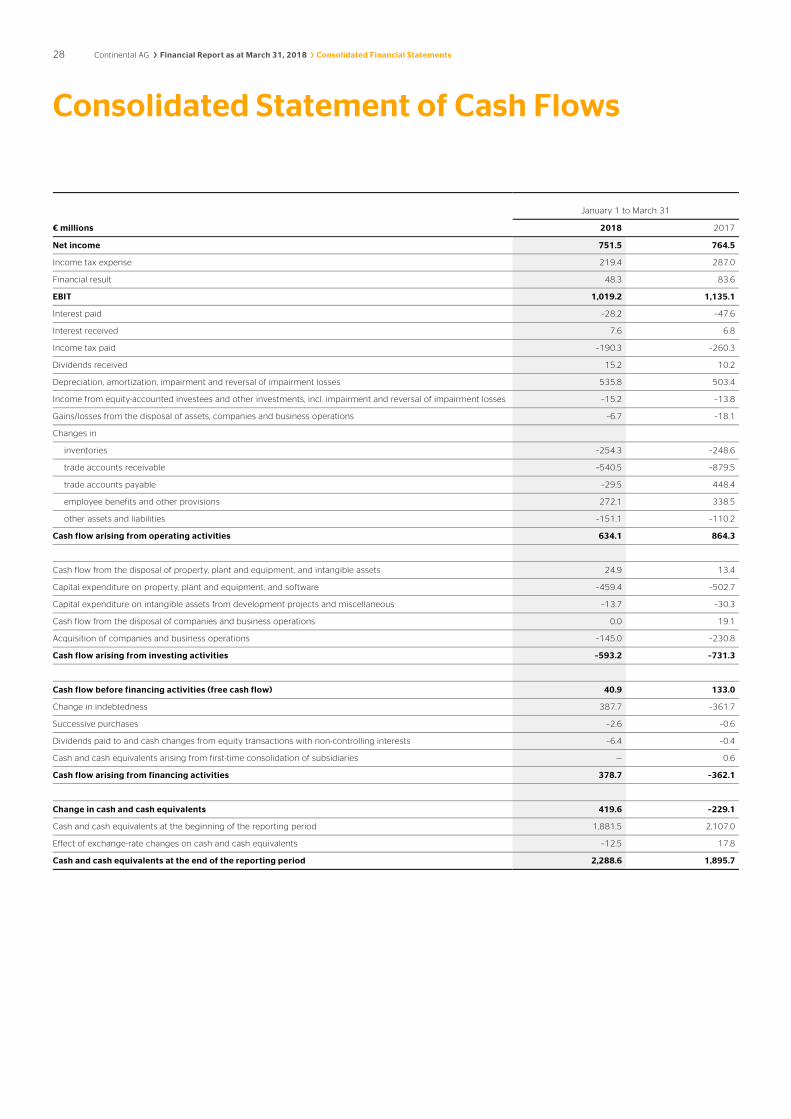
28 Continental AG Financial Report as at March 31, 2018 Consolidated Financial Statements
January 1 to March 31
€ millions 2018 2017
Net income 751.5 764.5
Income tax expense 219.4 287.0
Financial result 48.3 83.6
EBIT 1,019.2 1,135.1
Interest paid –28.2 –47.6
Interest received 7.6 6.8
Income tax paid –190.3 –260.3
Dividends received 15.2 10.2
Depreciation, amortization, impairment and reversal of impairment losses 535.8 503.4
Income from equity-accounted investees and other investments, incl. impairment and reversal of impairment losses –15.2 –13.8
Gains/losses from the disposal of assets, companies and business operations –6.7 –18.1
Changes in
inventories –254.3 –248.6
trade accounts receivable –540.5 –879.5
trade accounts payable –29.5 448.4
employee benefits and other provisions 272.1 338.5
other assets and liabilities –151.1 –110.2
Cash flow arising from operating activities 634.1 864.3
Cash flow from the disposal of property, plant and equipment, and intangible assets 24.9 13.4
Capital expenditure on property, plant and equipment, and software –459.4 –502.7
Capital expenditure on intangible assets from development projects and miscellaneous –13.7 –30.3
Cash flow from the disposal of companies and business operations 0.0 19.1
Acquisition of companies and business operations –145.0 –230.8
Cash flow arising from investing activities –593.2 –731.3
Cash flow before financing activities (free cash flow) 40.9 133.0
Change in indebtedness 387.7 –361.7
Successive purchases –2.6 –0.6
Dividends paid to and cash changes from equity transactions with non-controlling interests –6.4 –0.4
Cash and cash equivalents arising from first-time consolidation of subsidiaries — 0.6
Cash flow arising from financing activities 378.7 –362.1
Change in cash and cash equivalents 419.6 –229.1
Cash and cash equivalents at the beginning of the reporting period 1,881.5 2,107.0
Effect of exchange-rate changes on cash and cash equivalents –12.5 17.8
Cash and cash equivalents at the end of the reporting period 2,288.6 1,895.7
Consolidated Statement of Cash Flows
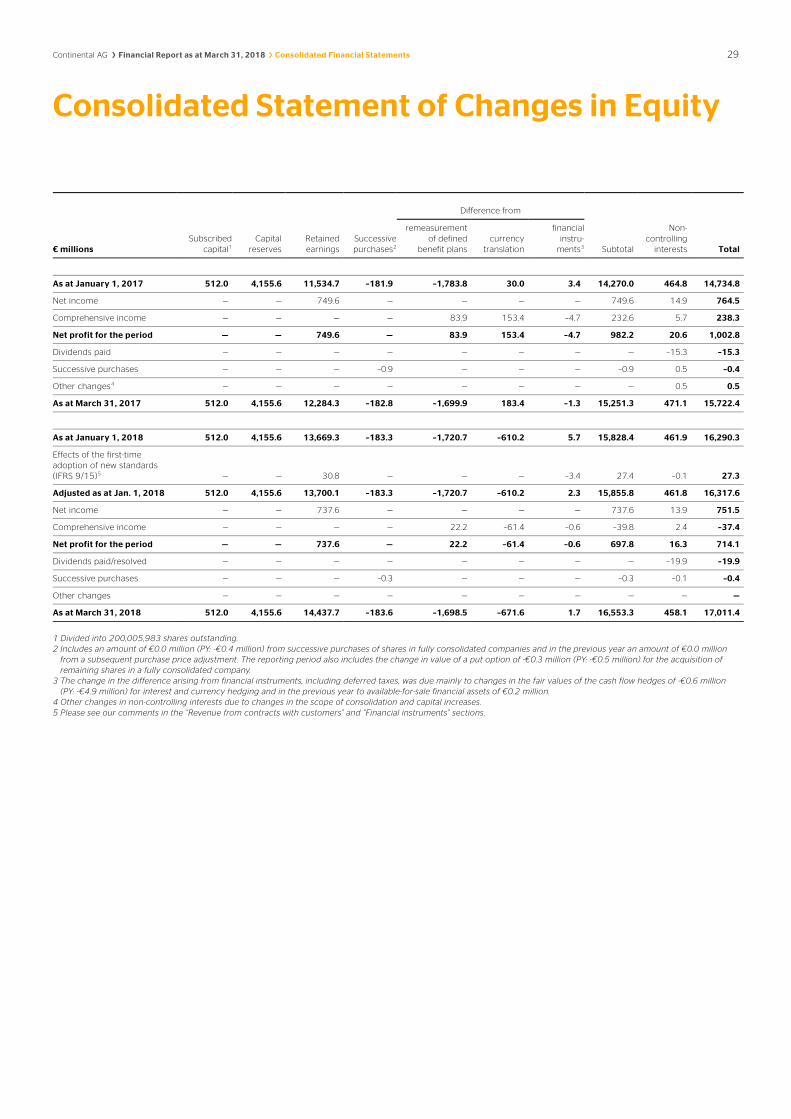
Continental AG Financial Report as at March 31, 2018 Consolidated Financial Statements 29
Difference from
€ millions Subscribed
capital1 Capital
reserves Retained earnings
Successive purchases2
remeasurement of defined
benefit plans currency
translation
financial instru-
ments3 Subtotal
Non-controlling
interests Total
As at January 1, 2017 512.0 4,155.6 11,534.7 –181.9 –1,783.8 30.0 3.4 14,270.0 464.8 14,734.8
Net income — — 749.6 — — — — 749.6 14.9 764.5
Comprehensive income — — — — 83.9 153.4 –4.7 232.6 5.7 238.3
Net profit for the period — — 749.6 — 83.9 153.4 –4.7 982.2 20.6 1,002.8
Dividends paid — — — — — — — — –15.3 –15.3
Successive purchases — — — –0.9 — — — –0.9 0.5 –0.4
Other changes4 — — — — — — — — 0.5 0.5
As at March 31, 2017 512.0 4,155.6 12,284.3 –182.8 –1,699.9 183.4 –1.3 15,251.3 471.1 15,722.4
As at January 1, 2018 512.0 4,155.6 13,669.3 –183.3 –1,720.7 –610.2 5.7 15,828.4 461.9 16,290.3
Effects of the first-time adoption of new standards (IFRS 9/15)5 — — 30.8 — — — –3.4 27.4 –0.1 27.3
Adjusted as at Jan. 1, 2018 512.0 4,155.6 13,700.1 –183.3 –1,720.7 –610.2 2.3 15,855.8 461.8 16,317.6
Net income — — 737.6 — — — — 737.6 13.9 751.5
Comprehensive income — — — — 22.2 –61.4 –0.6 –39.8 2.4 –37.4
Net profit for the period — — 737.6 — 22.2 –61.4 –0.6 697.8 16.3 714.1
Dividends paid/resolved — — — — — — — — –19.9 –19.9
Successive purchases — — — –0.3 — — — –0.3 –0.1 –0.4
Other changes — — — — — — — — — —
As at March 31, 2018 512.0 4,155.6 14,437.7 –183.6 –1,698.5 –671.6 1.7 16,553.3 458.1 17,011.4
1 Divided into 200,005,983 shares outstanding. 2 Includes an amount of €0.0 million (PY: -€0.4 million) from successive purchases of shares in fully consolidated companies and in the previous year an amount of €0.0 million
from a subsequent purchase price adjustment. The reporting period also includes the change in value of a put option of -€0.3 million (PY: -€0.5 million) for the acquisition of remaining shares in a fully consolidated company.
3 The change in the difference arising from financial instruments, including deferred taxes, was due mainly to changes in the fair values of the cash flow hedges of -€0.6 million (PY: -€4.9 million) for interest and currency hedging and in the previous year to available-for-sale financial assets of €0.2 million.
4 Other changes in non-controlling interests due to changes in the scope of consolidation and capital increases. 5 Please see our comments in the “Revenue from contracts with customers” and “Financial instruments” sections.
Consolidated Statement of Changes in Equity

30 Continental AG Financial Report as at March 31, 2018 Consolidated Financial Statements
Segment report for the period from January 1 to March 31, 2018
€ millions Chassis & Safety Powertrain Interior Tires ContiTech Other/
consolidation Continental
Corporation
External sales 2,502.3 1,913.7 2,393.8 2,627.0 1,575.9 — 11,012.7
Intercompany sales 8.9 31.9 7.9 8.5 25.8 –83.0 —
Sales (total) 2,511.2 1,945.6 2,401.7 2,635.5 1,601.7 –83.0 11,012.7
EBIT (segment result) 252.9 99.4 184.5 395.5 121.9 –35.0 1,019.2
in % of sales 10.1 5.1 7.7 15.0 7.6 — 9.3
Depreciation and amortization1 103.9 107.9 98.9 150.3 74.0 0.8 535.8
thereof impairment2 — 5.4 0.2 — — — 5.6
Capital expenditure3 93.9 101.1 81.3 130.1 49.4 3.6 459.4
in % of sales 3.7 5.2 3.4 4.9 3.1 — 4.2
Operating assets as at March 31 4,678.4 3,443.3 5,399.6 6,328.0 3,116.6 –87.8 22,878.1
Number of employees as at March 314 48,263 41,804 47,295 54,682 47,612 418 240,074
Adjusted sales5 2,511.2 1,945.6 2,400.6 2,633.9 1,515.1 –83.0 10,923.4
Adjusted operating result (adjusted EBIT)6 252.9 107.7 202.1 400.2 131.0 –35.0 1,058.9
in % of adjusted sales 10.1 5.5 8.4 15.2 8.6 — 9.7
1 Excluding impairment on financial investments. 2 Impairment also includes necessary reversal of impairment losses. 3 Capital expenditure on property, plant and equipment, and software. 4 Excluding trainees. 5 Before changes in the scope of consolidation. 6 Before amortization of intangible assets from purchase price allocation (PPA), changes in the scope of consolidation, and special effects.
Segment report for the period from January 1 to March 31, 2017
€ millions Chassis & Safety Powertrain Interior Tires ContiTech Other/
consolidation Continental
Corporation
External sales 2,488.8 1,972.2 2,288.1 2,751.2 1,499.6 — 10,999.9
Intercompany sales 8.6 30.9 5.8 5.1 21.8 –72.2 —
Sales (total) 2,497.4 2,003.1 2,293.9 2,756.3 1,521.4 –72.2 10,999.9
EBIT (segment result) 238.9 117.1 185.7 505.1 117.1 –28.8 1,135.1
in % of sales 9.6 5.8 8.1 18.3 7.7 — 10.3
Depreciation and amortization1 98.0 96.8 87.9 146.2 74.2 0.3 503.4
thereof impairment2 — 1.0 — — — — 1.0
Capital expenditure3 100.8 98.8 87.7 172.2 42.8 0.4 502.7
in % of sales 4.0 4.9 3.8 6.2 2.8 — 4.6
Operating assets as at March 31 4,484.5 3,184.9 4,879.7 6,129.7 3,310.9 –9.3 21,980.4
Number of employees as at March 314 44,952 38,957 44,121 53,322 45,788 425 227,565
Adjusted sales5 2,497.4 2,003.1 2,293.9 2,756.3 1,518.2 –72.2 10,996.7
Adjusted operating result (adjusted EBIT)6 238.9 121.1 197.3 496.4 139.0 –28.8 1,163.9
in % of adjusted sales 9.6 6.0 8.6 18.0 9.2 — 10.6
1 Excluding impairment on financial investments. 2 Impairment also includes necessary reversal of impairment losses. 3 Capital expenditure on property, plant and equipment, and software. 4 Excluding trainees. 5 Before changes in the scope of consolidation. 6 Before amortization of intangible assets from purchase price allocation (PPA), changes in the scope of consolidation, and special effects.
Explanatory Notes to the Consolidated Financial Statements

Continental AG Financial Report as at March 31, 2018 Consolidated Financial Statements 31
Reconciliation of sales to adjusted sales and of EBITDA to adjusted operating result (adjusted EBIT) from January 1 to March 31, 2018
€ millions Chassis & Safety Powertrain Interior Tires ContiTech Other/
consolidation Continental
Corporation
Sales 2,511.2 1,945.6 2,401.7 2,635.5 1,601.7 –83.0 11,012.7
Changes in the scope of consolidation1 — — –1.1 –1.6 –86.6 — –89.3
Adjusted sales 2,511.2 1,945.6 2,400.6 2,633.9 1,515.1 –83.0 10,923.4
EBITDA 356.8 207.3 283.4 545.8 195.9 –34.2 1,555.0
Depreciation and amortization2 –103.9 –107.9 –98.9 –150.3 –74.0 –0.8 –535.8
EBIT 252.9 99.4 184.5 395.5 121.9 –35.0 1,019.2
Amortization of intangible assets from purchase price allocation (PPA) 0.0 2.9 12.6 4.5 22.2 — 42.2
Changes in the scope of consolidation1 — — 4.8 0.2 –13.1 — –8.1
Special effects
Impairment3 — 5.4 0.2 — — — 5.6
Restructuring — — 0.0 — — — 0.0
Gains and losses from disposals of companies and business operations — — — 0.0 — — 0.0
Other — — — — — — —
Adjusted operating result (adjusted EBIT) 252.9 107.7 202.1 400.2 131.0 –35.0 1,058.9
1 Changes in the scope of consolidation include additions and disposals as part of share and asset deals. Adjustments were made for additions in the reporting year and for disposals in the comparative period of the prior year.
2 Excluding impairment on financial investments. 3 Impairment also includes necessary reversal of impairment losses. This item does not include impairment that arose in connection with a restructuring and impairment on
financial investments.
Reconciliation of sales to adjusted sales and of EBITDA to adjusted operating result (adjusted EBIT) from January 1 to March 31, 2017
€ millions Chassis & Safety Powertrain Interior Tires ContiTech Other/
consolidation Continental
Corporation
Sales 2,497.4 2,003.1 2,293.9 2,756.3 1,521.4 –72.2 10,999.9
Changes in the scope of consolidation1 — — — — –3.2 — –3.2
Adjusted sales 2,497.4 2,003.1 2,293.9 2,756.3 1,518.2 –72.2 10,996.7
EBITDA 336.9 213.9 273.6 651.3 191.3 –28.5 1,638.5
Depreciation and amortization2 –98.0 –96.8 –87.9 –146.2 –74.2 –0.3 –503.4
EBIT 238.9 117.1 185.7 505.1 117.1 –28.8 1,135.1
Amortization of intangible assets from purchase price allocation (PPA) 0.0 3.0 11.6 4.8 21.8 — 41.2
Changes in the scope of consolidation1 — — — — 0.0 — 0.0
Special effects
Impairment3 — 1.0 — — — — 1.0
Restructuring — — — — 0.1 — 0.1
Gains and losses from disposals of companies and business operations — — — –13.0 — — –13.0
Other — — — –0.5 — — –0.5
Adjusted operating result (adjusted EBIT) 238.9 121.1 197.3 496.4 139.0 –28.8 1,163.9
1 Changes in the scope of consolidation include additions and disposals as part of share and asset deals. Adjustments were made for additions in the reporting year and for disposals in the comparative period of the prior year.
2 Excluding impairment on financial investments. 3 Impairment also includes necessary reversal of impairment losses. This item does not include impairment that arose in connection with a restructuring and impairment on
financial investments.

32 Continental AG Financial Report as at March 31, 2018 Consolidated Financial Statements
Reconciliation of EBIT to net income
January 1 to March 31
€ millions 2018 2017
Chassis & Safety 252.9 238.9
Powertrain 99.4 117.1
Interior 184.5 185.7
Tires 395.5 505.1
ContiTech 121.9 117.1
Other/consolidation –35.0 –28.8
EBIT 1,019.2 1,135.1
Financial result –48.3 –83.6
Earnings before tax 970.9 1,051.5
Income tax expense –219.4 –287.0
Net income 751.5 764.5
Non-controlling interests –13.9 –14.9
Net income attributable to the shareholders of the parent 737.6 749.6
Segment reporting Given the affinity of certain products, these have been combined as segments. This can mainly be seen in product requirements, market trends, customer groups and distribution channels.
Information on the development of the Continental Corporation’s five divisions can be found in the Corporate Management Report as at March 31, 2018.
Accounting principles These interim financial statements were prepared in accordance with the International Financial Reporting Standards (IFRS) applica-ble at the end of the reporting period and endorsed by the Euro-pean Union. These also include the International Accounting Stand-ards (IAS) and the interpretations issued by the International Finan-cial Reporting Standards Interpretations Committee or its predeces-sor the International Financial Reporting Interpretations Committee (IFRIC) and the former Standing Interpretations Committee (SIC). The interim financial statements were prepared in compliance with IAS 34, Interim Financial Reporting. The same accounting policies have been applied in the interim financial statements as in the con-solidated financial statements for 2017. These accounting policies are described in detail in the 2017 Annual Report. In addition, the IFRS amendments and new regulations effective as at March 31, 2018, have also been applied in the interim financial statements. A detailed description of these mandatory IFRS amendments and new regulations can be found in the 2017 Annual Report.
The first-time adoption of IFRS 9, Financial Instruments and IFRS 15, Revenue from Contracts with Customers, affected the reporting period. The new standards effective in the 2018 fiscal year, IFRS 9 and IFRS 15, are described in detail in the 2017 Annual Report. As explained in the 2017 Annual Report, the corresponding account-ing policy choices were made. Expected effects from the interpreta-
tion of the standards on the business models in the corporation materialized accordingly. Please see the “Financial instruments” and the “Revenue from contracts with customers” sections for information on the specific effects in the reporting period.
No other IFRS amendments and new regulations effective as at March 31, 2018, had any material effect on the reporting of the Continental Corporation.
Income tax expense is calculated based on the estimated, weighted average tax rate expected for the year as a whole. Tax effects of specific significant items that can only be allocated to the respec-tive period under review are taken into account.
Although certain elements of the corporation’s business are seasonal, the overall comparability of the interim consolidated financial statements is not compromised. All significant effects in the current period are shown in this report. Changes in the recognition or measurement of assets and liabilities within the scope of company acquisitions are presented retrospectively once the final purchase price allocation has been determined.
The consolidated financial statements have been prepared in euros. Unless otherwise stated, all amounts are shown in millions of euros. Please note that differences may arise as a result of the use of rounded amounts and percentages.
Companies consolidated In addition to the parent company, the consolidated financial state-ments include 527 domestic and foreign companies that Continen-tal Aktiengesellschaft incorporates according to the regulations of IFRS 10 or that are classified as joint arrangements or associated companies. Of these, 409 are fully consolidated and 118 are ac-counted for using the equity method.

Continental AG Financial Report as at March 31, 2018 Consolidated Financial Statements 33
Since December 31, 2017, the total number of consolidated com-panies has not changed. Four companies have been acquired. At the same time, the number of companies consolidated decreased by four as a result of two mergers and two liquidations.
Since March 31, 2017, the total number of consolidated compa-nies has increased by seven. The additions to the scope of consoli-dation essentially resulted from newly founded companies and ac-quisitions by the Automotive Group. Companies no longer included in the scope of consolidation are mostly attributable to mergers.
Acquisition and disposal of companies and business operations One asset deal took place in the Tire segment. €2.0 million of the purchase price totaling €2.2 million was paid in cash. The remain-ing amount is recorded as a purchase price liability of €0.2 million. The purchase price allocation resulted in intangible assets of €1.8 million. Other than this, there was no material effect on the earn-ings, financial and net assets position of the Continental Corpora-tion as at March 31, 2018.
Revenue from contracts with customers The first-time adoption of IFRS 15, Revenue from Contracts with Customers, resulted in the following effects on the earnings, finan-cial and net assets position:
› Due to the application of the modified retrospective approach, the cumulative effect of the first-time adoption of IFRS 15 in the amount of €30.3 million before taxes (€21.9 million after taxes) was recognized as an increase in the opening carrying amount of the retained earnings as of the date of the first-time adoption. The values of comparative periods are based on the accounting principles of IAS 18, Revenue, and IAS 11, Construction Contracts, and are shown unadjusted.
If IFRS 15 had not been applied, the application of the former accounting methods would have had the following effects in the current reporting period:
› Net income would have amounted to €721.7 million (€751.5 mil-lion with IFRS 15 applied).
› Sales would have amounted to €11,001.4 million (€11,012.7 mil-lion with IFRS 15 applied) and the cost of sales would have come to €8,212.9 million (€8,221.8 million with IFRS 15 applied).
› Research and development expenses (net) amounted to €848.0 million. With IFRS 15 applied, research and development expenses amounted to €1,026.5 million. These figures include the capitaliza-tion of development costs in inventories in the amount of €39.6 million. By contrast, other income would have totaled €108.4 mil-lion (€286.9 million with IFRS 15 applied).
› Income tax expense would have amounted to €207.2 million (€219.4 million with IFRS 15 applied).
› Not taking into account contract assets, trade accounts receiva-ble would have been reported in the amount of €8,298.9 million (€8,294.8 million with IFRS 15 applied) and inventories, not in-cluding the capitalization of development costs, would have been reported in the amount of €4,326.2 million (€4,367.0 million with IFRS 15 applied).
› Contract liabilities of €1,013.4 million would have been recog-nized in the amount of €148.2 million under other liabilities and in the amount of €865.2 million under other financial liabilities. Overall, this would therefore have resulted in other liabilities of €877.5 million (€729.3 million with IFRS 15 applied) and other financial liabilities of €1,246.6 million (€381.4 million with IFRS 15 applied).
› Consolidated equity would have amounted to €16,960.0 million if IFRS 15 had not been applied (€17,011.4 million with IFRS 15 applied).
Revenue from contracts with customers from January 1 to March 31, 2018
€ millions Chassis & Safety Powertrain Interior Tires ContiTech Other/
consolidation Continental
Corporation
Germany 531.3 372.4 656.6 397.7 381.6 –46.7 2,292.9
Europe excluding Germany 590.8 562.3 662.2 1,134.6 433.7 –17.1 3,366.5
North America 556.3 427.2 527.6 640.2 413.2 –10.6 2,553.9
Asia 793.1 552.7 472.7 293.7 282.8 –6.7 2,388.3
Other countries 39.7 31.0 82.6 169.3 90.4 –1.9 411.1
Sales by region 2,511.2 1,945.6 2,401.7 2,635.5 1,601.7 –83.0 11,012.7
Automotive original-equipment business 2,510.5 1,925.9 2,181.7 804.2 840.3 –58.1 8,204.5
Industrial/replacement business 0.7 19.7 220.0 1,831.3 761.4 –24.9 2,808.2
Sales by customer type 2,511.2 1,945.6 2,401.7 2,635.5 1,601.7 –83.0 11,012.7

34 Continental AG Financial Report as at March 31, 2018 Consolidated Financial Statements
Impairment The corporation immediately reviews other intangible assets and property, plant and equipment, investment property, financial in-vestments and goodwill as soon as there is an indication of impair-ment (triggering event). No significant impairment resulted from these reviews in the reporting period.
Income tax expense Income tax expense in the first three months of 2018 amounted to €219.4 million (PY: €287.0 million). The tax rate in the reporting period amounted to 22.6% (PY: 27.3%).
Long-term employee benefits Compared to December 31, 2017, the remeasurement of defined benefit pension plans as at March 31, 2018, led to a €17.9 million increase in other comprehensive income, which resulted from a rise in discount rates. The corresponding increase in equity con-trasted with a decrease in long-term employee benefits of €23.7 million.
Cash changes in pension and similar obligations Pension funds exist solely for pension obligations, particularly in Germany, the U.S.A., Canada and the United Kingdom, and not for other benefit obligations. These pension funds qualify as plan as-sets. In the period from January 1 to March 31, 2018, the compa-nies of the Continental Corporation made regular payments total-ing €8.1 million (PY: €20.9 million) into these pension funds.
Payments for retirement benefit obligations totaled €50.9 million (PY: €54.2 million) in the period from January 1 to March 31, 2018. Payments for obligations similar to pensions totaled €3.5 million (PY: €4.1 million).
The net pension cost of the Continental Corporation can be summarized as follows:
January 1 to March 31, 2018 January 1 to March 31, 2017
€ millions Germany U.S.A. CAN U.K. Other Total Germany U.S.A. CAN U.K. Other Total
Current service cost 55.8 1.2 0.4 0.6 5.5 63.5 55.8 1.4 0.4 0.7 5.9 64.2
Interest on defined benefit obligations 19.6 9.3 0.9 2.4 2.4 34.6 19.6 12.7 1.4 2.6 1.8 38.1
Expected return on the plan assets –5.6 –6.5 –0.7 –2.4 –1.2 –16.4 –5.0 –9.1 –1.2 –2.6 –0.7 –18.6
Effect of change of asset ceiling — — — — 0.0 0.0 — — 0.0 — 0.0 0.0
Other pension income and expenses — 0.3 0.1 — 0.0 0.4 — 0.4 0.1 — 0.0 0.5
Net pension cost 69.8 4.3 0.7 0.6 6.7 82.1 70.4 5.4 0.7 0.7 7.0 84.2
Net cost of healthcare and life-insurance benefit obligations of the Continental Corporation in the U.S.A. and Canada consist of the following:
January 1 to March 31
€ millions 2018 2017
Current service cost 0.4 0.4
Interest on healthcare and life-insurance benefit obligations 1.8 2.3
Net cost of obligations similar to pensions 2.2 2.7

Continental AG Financial Report as at March 31, 2018 Consolidated Financial Statements 35
Indebtedness Since April 2016, the syndicated loan has consisted only of a re-volving tranche of €3.0 billion. This credit line is available to Conti-nental until April 2021 and had not been utilized at the end of March 2018 or in the previous year.
For more information on indebtedness and financial result, please refer to the Corporate Management Report as at March 31, 2018.
Financial instruments The first-time adoption of IFRS 9, Financial Instruments, resulted in the following effects on the earnings, financial and net assets posi-tion:
› In this context, Continental uses the modified retrospective ap-proach. The cumulative effect of the first-time adoption of IFRS 9 in the amount of €10.9 million before taxes (€8.9 million after taxes) as of the date of first-time adoption was recognized as an increase in the opening carrying amount of retained earnings. The cumulative effect resulted from the following matters:
› The cumulated gains of €3.4 million (including related deferred tax effects) in other comprehensive income from the previous measurement category “available-for-sale financial assets” were reclassified to retained earnings.
› In cash and cash equivalents, there was an effect of -€0.1 mil-lion from financial instruments which were measured at amor-tized cost in accordance with IAS 39 and are classified as FVPL (fair value through profit and loss) in accordance with IFRS 9.
› Impairment on financial instruments decreased by a total of €7.6 million before taxes. This was firstly due to the increase in impairment as a result of the impairment model implemented in accordance with IFRS 9, which takes account of expected losses. Secondly, impairment that had been recognized as at December 31, 2017, on the basis of portfolio valuation allow-ances using experience-based values in accordance with IAS 39 was derecognized.
The new regulations for hedge accounting in accordance with IFRS 9, which are generally to be applied prospectively, were applied to the cash flow hedges in place as at December 31, 2017, in accord-ance with IAS 39. The fulfilment of hedge effectiveness conditions as required under IFRS 9 was demonstrated prospectively in this context. Effectiveness is calculated by comparing the present value development of the hedged transactions and the fair value devel-opment of the hedging instruments. Ineffectiveness generally re-sults from different recognition of credit risk and of currency basis spreads. There was no accounting effect as at the transition date on January 1, 2018.
The values of comparative periods are based on the accounting principles of IAS 39, Financial Instruments: Recognition and Meas-urement, and are shown unadjusted.

36 Continental AG Financial Report as at March 31, 2018 Consolidated Financial Statements
Classification of financial assets and financial liabilities at the date of transition to IFRS 9 The table below shows the original measurement categories according to IAS 39 and the new measurement categories according to IFRS 9 for each adjusted class of financial assets and liabilities as at January 1, 2018, in € million.
Classification in acc. with IAS 39 Classification in acc. with IFRS 9
Measurement category in acc.
with IAS 39
Carrying amount in acc.
with IAS 39
Measurement category in acc.
with IFRS 9
Carrying amount in acc.
with IFRS 9
Financial assets Financial assets
Other investments Other investments AfS 51.0 FVOCIwoR 51.0
Derivative instruments and interest-bearing investments
Derivative instruments and interest-bearing investments
Derivative instruments accounted for as effective hedging instruments
Derivative instruments accounted for as effective hedging instruments n. a. 51.5 n. a. 51.5
Derivative instruments not accounted for as effective hedging instruments
Derivative instruments not accounted for as effective hedging instruments HfT 18.5 FVPL 18.5
Available-for-sale financial assets Debt instruments measured at fair value through profit and loss AfS 37.8 FVPL 37.8
Other receivables with a financing character Debt instruments measured at amortized cost LaR 53.1 At cost 53.1
Trade accounts receivable Trade accounts receivable
Trade accounts receivable Trade accounts receivable measured at amortized cost LaR 7,469.4 At cost 7,473.3
Trade accounts receivable Bank drafts LaR 193.2 FVOCIwR 193.2
Trade accounts receivable Trade accounts receivable measured at fair value through profit and loss LaR 6.7 FVPL 6.7
Other financial assets1 Other financial assets1 LaR 365.8 At cost 365.7
Cash and cash equivalents Cash and cash equivalents
Cash and cash equivalents Cash and cash equivalents measured at amortized cost LaR 1,682.1 At cost 1,618.0
Available-for-sale financial assets Cash and cash equivalents measured at fair value through profit and loss AfS 199.4 FVPL 263.6
Financial liabilities Financial liabilities
Derivative instruments not accounted for as effective hedging instruments
Derivative instruments not accounted for as effective hedging instruments HfT 16.9 FVPL 16.9
1 Starting from the 2018 reporting year, deferred costs from the sale of customer tooling are no longer included in order to make the presentation of other financial assets more transparent.
Abbreviations › AfS: available for sale
› At cost: measured at amortized cost
› FVOCIwR: fair value through other comprehensive income with reclassification
› FVOCIwoR: fair value through other comprehensive income with-out reclassification
› FVPL: fair value through profit and loss
› HfT: held for trading
› LaR: loans and receivables
› OL: other liability, financial liabilities measured at amortized cost
› n. a.: not applicable, not assigned to any measurement category
Levels of the fair value hierarchy according to IFRS 13: › Level 1: quoted prices on the active market for identical instru-
ments
› Level 2: quoted prices on the active market for a similar instru-ment or a measurement method for which all major input factors are based on observable market data
› Level 3: measurement method for which the major input factors are not based on observable market data
As at January 1, 2018, the Continental Corporation classified other investments as measured at FVOCIwoR and classified accordingly, as these investments are held over a long term for strategic pur-poses. In 2017, other investments were classified as AfS.

Continental AG Financial Report as at March 31, 2018 Consolidated Financial Statements 37
The tables below show the carrying amounts and fair values of financial assets and liabilities, whereby non-current and current items are presented together. In addition, the relevant measurement categories are shown according to IFRS 9 and the levels of the fair value hier-archy relevant for calculating fair value according to IFRS 13. The structure of the table for the previous year was adapted to the new format.
€ millions
Measurement category in acc.
with IFRS 9
Carrying amount as at
March 31, 2018 Fair value as at
March 31, 2018 thereof Level 1
thereof Level 2
thereof Level 3
Other investments FVOCIwoR 179.4 179.4 — — 179.4
Derivative instruments and interest-bearing investments
Derivative instruments accounted for as effective hedging instruments n. a. 65.9 65.9 — 65.9 —
Derivative instruments not accounted for as effective hedging instruments FVPL 12.7 12.7 — 12.7 —
Debt instruments measured at fair value through profit and loss FVPL 36.2 36.2 26.8 9.4 —
Debt instruments measured at amortized cost At cost 69.2 69.2 — — —
Trade accounts receivable
Trade accounts receivable measured at amortized cost At cost 7,915.1 7,915.1 — — —
Bank drafts FVOCIwR 373.7 373.7 — 373.7 —
Trade accounts receivable measured at fair value through profit and loss FVPL 6.0 6.0 — 6.0 —
Other financial assets1 At cost 393.7 393.7 — — —
Cash and cash equivalents
Cash and cash equivalents measured at amortized cost At cost 2,029.7 2,029.7 — — —
Cash and cash equivalents measured at fair value through profit and loss FVPL 258.9 258.9 194.3 64.6 —
Financial assets 11,340.5 11,340.5 221.1 532.3 179.4
Indebtedness
Derivative instruments not accounted for as effective hedging instruments FVPL 2.3 2.3 — 2.3 —
Finance lease liabilities n. a. 15.4 15.6 — 15.6 —
Other indebtedness OL 4,438.7 4,525.3 2,666.2 277.3 —
Trade accounts payable OL 6,757.0 6,757.0 — — —
Other financial liabilities
Liabilities to related parties from finance leases n. a. 7.2 6.9 — 6.9 —
Miscellaneous financial liabilities OL 374.2 374.1 — 4.0 —
Financial liabilities 11,594.8 11,681.2 2,666.2 306.1 —
Aggregated according to measurement categories as defined in IFRS 9:
Financial assets (FVOCIwR) 373.7
Financial assets (FVOCIwoR) 179.4
Financial assets (FVPL) 313.8
Financial assets (At cost) 10,407.7
Financial liabilities (FVPL) 2.3
Financial liabilities (OL) 11,569.9
1 Starting from the 2018 reporting year, deferred costs from the sale of customer tooling are no longer included in order to make the presentation of other financial assets more transparent.

38 Continental AG Financial Report as at March 31, 2018 Consolidated Financial Statements
€ millions
Measurement category in acc.
with IAS 39
Carrying amount as at
Dec. 31, 2017 Fair value as at Dec. 31, 2017
thereof Level 1
thereof Level 2
Other investments AfS 51.0 51.0 — —
Derivative instruments and interest-bearing investments
Derivative instruments accounted for as effective hedging instruments n. a. 51.5 51.5 — 51.5
Derivative instruments not accounted for as effective hedging instruments HfT 18.5 18.5 — 18.5
Available-for-sale financial assets AfS 37.8 37.8 28.3 9.5
Other receivables with a financing character LaR 53.1 53.1 — —
Trade accounts receivable LaR 7,669.3 7,669.3 — —
Other financial assets1 LaR 365.8 365.8 — —
Cash and cash equivalents
Cash and cash equivalents LaR 1,682.1 1,682.1 — —
Available-for-sale financial assets AfS 199.4 199.4 199.4 —
Financial assets 10,128.5 10,128.5 227.7 79.5
Indebtedness
Derivative instruments not accounted for as effective hedging instruments HfT 16.9 16.9 — 16.9
Finance lease liabilities n. a. 16.4 16.6 — 16.6
Other indebtedness OL 4,056.7 4,155.3 2,680.6 298.9
Trade accounts payable OL 6,798.5 6,798.5 — —
Other financial liabilities
Liabilities to related parties from finance leases n. a. 7.3 7.1 — 7.1
Miscellaneous financial liabilities OL 1,305.6 1,305.5 — 4.9
Financial liabilities 12,201.4 12,299.9 2,680.6 344.4
Aggregated according to measurement categories as defined in IAS 39:
Financial assets held for trading (HfT) 18.5
Loans and receivables (LaR) 9,770.3
Available-for-sale financial assets (AfS) 288.2
Financial liabilities held for trading (HfT) 16.9
Financial liabilities measured at amortized cost (OL) 12,160.8
1 Starting from the 2018 reporting year, deferred costs from the sale of customer tooling are no longer included in order to make the presentation of other financial assets more transparent. The figures as at December 31, 2017, have been adjusted accordingly.
For other investments for which there are no quoted prices on the active market for identical instruments (level 1) or for a similar in-strument, or for which there is no applicable measurement method in which all major input factors are based on observable market data (level 2), the fair value is calculated with a measurement method for which the major input factors are not based on observable mar-ket data (level 3). The measurement is performed according to the measurement method that is deemed appropriate in each case.
Litigation and compensation claims There were no significant new developments in the reporting pe-riod with regard to litigation and compensation claims, including those described in the 2017 Annual Report.
Contingent liabilities and other financial obligations As at March 31, 2018, there were no material changes in the con-tingent liabilities and other financial obligations as described in the 2017 Annual Report.
Appropriation of net income As at December 31, 2017, Continental AG reported net retained earnings of €1,470.4 million (PY: €1,103.1 million). The distribution of a dividend of €4.50 per share to the shareholders of Continental AG for the past fiscal year will be proposed to the Annual Share-holders’ Meeting to be held in Hanover on April 27, 2018. With 200,005,983 shares entitled to dividends, the total distribution will thus amount to €900,026,923.50. The remaining amount is to be carried forward to new account.

Continental AG Financial Report as at March 31, 2018 Consolidated Financial Statements 39
Earnings per share After the first three months of 2018, basic earnings per share amounted to €3.69 (PY: €3.75), the same amount as diluted earn-ings per share.
Transactions with related parties In the period under review there were no material changes in transactions with related parties compared to December 31, 2017. For further information, please refer to the comments in the 2017 Annual Report.
German Corporate Governance Code The annual declaration in accordance with Section 161 of the German Stock Corporation Act (Aktiengesetz, AktG) on the German Corporate Governance Code by the Executive Board and Super- visory Board of Continental AG is made permanently available to shareholders on Continental’s website. Earlier declarations in ac-cordance with Section 161 AktG can also be found there.
Review by an independent auditor The interim corporate management report and the interim consoli-dated financial statements have not been audited in accordance with Section 317 of the German Commercial Code (Handelsgesetz-buch, HGB) or reviewed by a qualified auditor.
Significant Events after March 31, 2018
There were no significant events after March 31, 2018.
Hanover, April 24, 2018 Continental Aktiengesellschaft The Executive Board

40 Continental AG Financial Report as at March 31, 2018 Financial Calendar
2018
Preliminary figures for fiscal 2017 January 9
Annual Financial Press Conference March 8
Analyst and Investor Conference Call March 8
Annual Shareholders’ Meeting (including key figures for the first quarter of 2018) April 27
Financial Report as at March 31, 2018 May 8
Half-Year Financial Report as at June 30, 2018 August 2
Financial Report as at September 30, 2018 November 8
2019
Preliminary figures for fiscal 2018 January
Annual Financial Press Conference March
Analyst and Investor Conference Call March
Annual Shareholders’ Meeting (including key figures for the first quarter of 2019) April 26
Financial Report as at March 31, 2019 May
Half-Year Financial Report as at June 30, 2019 August
Financial Report as at September 30, 2019 November
Publication Details
Published by: Continental Aktiengesellschaft, Hanover, Germany
The 2017 Annual Report is available in English and German. If you wish to receive copies, please contact:
Continental AG, Corporate Communications P.O. Box 1 69, 30001 Hanover, Germany Phone: +49 511 938-1146 Fax: +49 511 938-1055 E-mail: [email protected] Annual and interim reports are available on the internet at:
www.continental-ir.com
Financial Calendar

Continental AktiengesellschaftP.O. Box 1 69, 30001 Hanover, Germany Vahrenwalder Strasse 9, 30165 Hanover, GermanyPhone: +49 511 938 - 01, Fax: +49 511 938 - [email protected]