as economics module 1 revision have you bothered yet?
TRANSCRIPT
AS EconomicsAS EconomicsModule 1 revisionModule 1 revision
Have you bothered Have you bothered yet?yet?
List 4 factors that cause a shift in List 4 factors that cause a shift in demand…demand…
Price of substitutesPrice of substitutesConsumer tastes/ changes in fashionConsumer tastes/ changes in fashionConsumer confidence ‘feel good factor’Consumer confidence ‘feel good factor’Consumer incomeConsumer incomeChanges in the populationChanges in the populationChanges in legislationChanges in legislationAdvertising Advertising

Show on a demand curve a Show on a demand curve a contraction in quantity demanded. contraction in quantity demanded.
Draw a demand and supply curve Draw a demand and supply curve for housing, label the equilibrium for housing, label the equilibrium
price as P1 and the quantity as Q1.price as P1 and the quantity as Q1. Now show the effect of a rise in the cost Now show the effect of a rise in the cost
of land of land an increase in disposable income. an increase in disposable income.
Label the new equilibrium price as P2 Label the new equilibrium price as P2 and the quantity as Q2.and the quantity as Q2.
What is meant by the term joint What is meant by the term joint supply – provide an example.supply – provide an example.
Draw a consumer surplus diagram Draw a consumer surplus diagram – shade in the area. – shade in the area.
Explain what the consumer surplus Explain what the consumer surplus concept means to a seller….concept means to a seller….
List 4 factors that cause a shift in List 4 factors that cause a shift in supply…supply…
Changes in production costsChanges in production costs Wages, raw materials and components, energy, rents, interest ratesWages, raw materials and components, energy, rents, interest rates Government taxes and subsidiesGovernment taxes and subsidies Changes in technology – ICT can reduce long term costs but are Changes in technology – ICT can reduce long term costs but are
expensive in SRexpensive in SR
Climatic conditions (important for agricultural supply)Climatic conditions (important for agricultural supply) Changes in the number of producers in the marketChanges in the number of producers in the market Changes in the objectives of suppliers in the marketChanges in the objectives of suppliers in the market Changes in the prices of substitutes in productionChanges in the prices of substitutes in production The profitability of alternative products (substitutes) or those with The profitability of alternative products (substitutes) or those with
joint supply joint supply (crude oil = petrol and paraffin and diesel)(crude oil = petrol and paraffin and diesel) Expectation of future price changesExpectation of future price changes

EquilibriumEquilibrium
Draw a D & S diagram and show on it Draw a D & S diagram and show on it excess demand and excess supply.excess demand and excess supply.
Label market shortage and glut.Label market shortage and glut.
What does elasticity mean to What does elasticity mean to sellers?sellers?
If product is elastic or inelastic?If product is elastic or inelastic?
If the product has more elastic PeD then the seller has to be careful with increasing the price as consumers will substitute the product with a cheaper alternative.
However, if the product has inelastic PeD– then the seller can ‘abuse’ the position and increase prices and gain more profits… if they dare…. As it may signal for more suppliers to enter the market to take advantage of the profit potentials.

Income elasticity - Which goods Income elasticity - Which goods have positive and which have have positive and which have
negative income elasticity?negative income elasticity?
A positive sign denotes a A positive sign denotes a normal normal goodgood
A negative sign denotes an A negative sign denotes an inferior inferior goodgood

Significance of Income Elasticity of Significance of Income Elasticity of DemandDemand
High Income ElasticityHigh Income Elasticity
Demand is sensitive to changes in real incomesDemand is sensitive to changes in real incomes Demand is therefore Demand is therefore cyclicalcyclical – in an economic expansion, – in an economic expansion,
demand will grow strongly. In a recession demand may falldemand will grow strongly. In a recession demand may fall Can be difficult for businesses to accurately Can be difficult for businesses to accurately forecast demandforecast demand
and make and make capital investment decisionscapital investment decisions Low Income ElasticityLow Income Elasticity
Demand is more stableDemand is more stable during fluctuations in the economic cycle during fluctuations in the economic cycle Over time, the Over time, the share of consumer spending on inferior goods share of consumer spending on inferior goods
and normal necessities tends to declineand normal necessities tends to decline Long run – businesses need to invest in / focus on products with Long run – businesses need to invest in / focus on products with
a higher income elasticity of demand if they want to increase a higher income elasticity of demand if they want to increase total profitstotal profits
PeS – what is the significance of an PeS – what is the significance of an elastic or inelastic S?elastic or inelastic S?
Price elasticity of supply (Pes) measures the Price elasticity of supply (Pes) measures the relationship between change in quantity supplied relationship between change in quantity supplied and a change in price.and a change in price.
When supply isWhen supply is elastic elastic, producers can , producers can increase productionincrease production without a rise in cost or without a rise in cost or a time delaya time delay
When supply is When supply is inelasticinelastic, firms find it , firms find it hard to hard to change their production levelschange their production levels in a given in a given time periodtime period
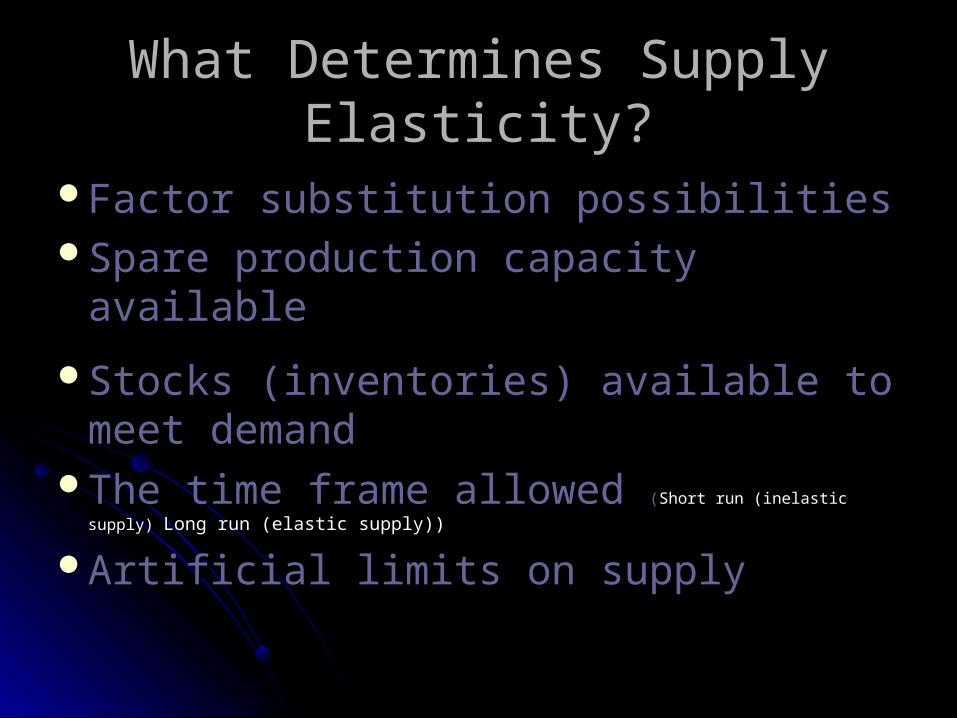
What Determines Supply Elasticity?What Determines Supply Elasticity?
Factor substitution possibilitiesFactor substitution possibilitiesSpare production capacity availableSpare production capacity available
Stocks (inventories) available to meet Stocks (inventories) available to meet demanddemand
The time frame allowed The time frame allowed ((Short run (inelastic supply) Short run (inelastic supply) Long Long
run (elastic supply))run (elastic supply))
Artificial limits on supplyArtificial limits on supply
What does Cross elasticity What does Cross elasticity measure?measure?
Cross price elasticity (CPed) Cross price elasticity (CPed) measures the responsiveness of measures the responsiveness of demand for good X following a demand for good X following a change in the price of good Y (a change in the price of good Y (a related good)related good)

CPeD shows substitutes and CPeD shows substitutes and complements… so which is which? complements… so which is which?
positive or negative?positive or negative?
Substitutes:Substitutes: With substitute goods such as brands of With substitute goods such as brands of cereal an increase in the price of one good will lead to an cereal an increase in the price of one good will lead to an increase in demand for the rival product. increase in demand for the rival product. Cross price Cross price elasticity will be positiveelasticity will be positive
ComplementsComplements: With goods that are in complementary : With goods that are in complementary demand when there is a fall in the price of e.g. DVD demand when there is a fall in the price of e.g. DVD players we expect to see more DVD players bought, players we expect to see more DVD players bought, leading to an expansion in market demand for DVD leading to an expansion in market demand for DVD videos. The cross price elasticity of demand for videos. The cross price elasticity of demand for two two complements is negativecomplements is negative
Cobweb diagramCobweb diagram
Why does the govt intervene for Why does the govt intervene for consumers and for producers in these consumers and for producers in these situations….?situations….?

BUFFER STOCKS - BUFFER STOCKS - what is it?what is it?
Can you draw the diagram???Can you draw the diagram???And label clearly…And label clearly…

Monopoly D diagram – do you Monopoly D diagram – do you know what it means?know what it means?

Monopolies use barriers to entry to Monopolies use barriers to entry to protect their position – what are protect their position – what are
they?they? Patents Patents - Patents are government enforced - Patents are government enforced property rights property rights to prevent the entry of to prevent the entry of
rivals. They are generally valid for 17-20 years and give the owner an rivals. They are generally valid for 17-20 years and give the owner an exclusive right exclusive right to prevent others from using patented products, inventions, or processes.to prevent others from using patented products, inventions, or processes.
Vertical Integration Vertical Integration - Control over supplies and distribution can be important. For - Control over supplies and distribution can be important. For example many major oil companies are fully vertically integrated. They control, oil example many major oil companies are fully vertically integrated. They control, oil extraction refining and retail outlets maintain their market power.extraction refining and retail outlets maintain their market power.
Predatory Pricing Predatory Pricing - Firms may adopt - Firms may adopt predatory pricing predatory pricing policies by lowering prices policies by lowering prices to a level that would force any new entrants to operate at a loss. A high profile case to a level that would force any new entrants to operate at a loss. A high profile case came to a head in 1999 when the Office of Fair Trading found News International came to a head in 1999 when the Office of Fair Trading found News International guilty of adopting predatory pricing policies in a bid to reduce competition in the guilty of adopting predatory pricing policies in a bid to reduce competition in the market for broadsheet newspapers.market for broadsheet newspapers.
Advertising and Marketing Advertising and Marketing - Developing - Developing consumer loyalty consumer loyalty by establishing branded by establishing branded products can make successful entry into the market by new firms much more products can make successful entry into the market by new firms much more expensive. Advertising can cause an outward shift of the demand curve and also expensive. Advertising can cause an outward shift of the demand curve and also make demand less sensitive to changes in pricemake demand less sensitive to changes in price
Brand Proliferation Brand Proliferation - In many industries multi-product firms engaging in - In many industries multi-product firms engaging in brand brand proliferation proliferation can give a false appearance of competition to the consumer and can give a false appearance of competition to the consumer and disguises from consumers the actual degree of concentration within the industry. This disguises from consumers the actual degree of concentration within the industry. This is certainly true in markets such as detergents, confectionery and household goods – is certainly true in markets such as detergents, confectionery and household goods – it is an essential part of non-price competition.it is an essential part of non-price competition.
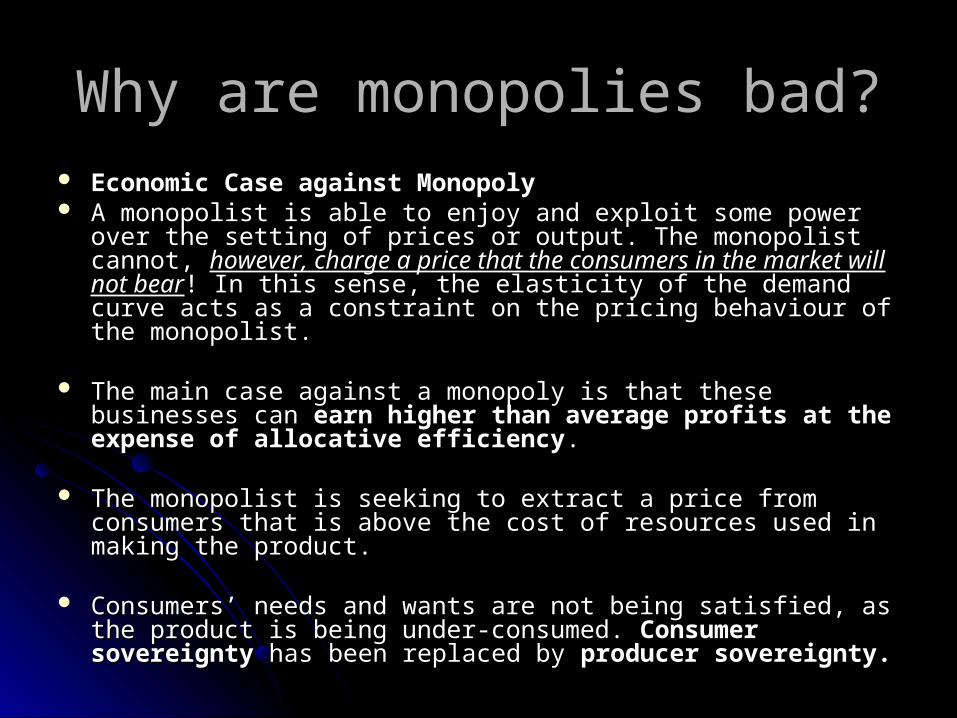
Why are monopolies bad?Why are monopolies bad? Economic Case against MonopolyEconomic Case against Monopoly A monopolist is able to enjoy and exploit some power over the A monopolist is able to enjoy and exploit some power over the
setting of prices or output. The monopolist cannot, setting of prices or output. The monopolist cannot, however, charge however, charge a price that the consumers in the market will not beara price that the consumers in the market will not bear! In this sense, ! In this sense, the elasticity of the demand curve acts as a constraint on the pricing the elasticity of the demand curve acts as a constraint on the pricing behaviour of the monopolist. behaviour of the monopolist.
The main case against a monopoly is that these businesses can The main case against a monopoly is that these businesses can earn higher than average profits at the expense of allocative earn higher than average profits at the expense of allocative efficiencyefficiency. .
The monopolist is seeking to extract a price from consumers that is The monopolist is seeking to extract a price from consumers that is above the cost of resources used in making the product. above the cost of resources used in making the product.
Consumers’ needs and wants are not being satisfied, as the product Consumers’ needs and wants are not being satisfied, as the product is being under-consumed. is being under-consumed. Consumer sovereignty Consumer sovereignty has been has been replaced by replaced by producer sovereignty.producer sovereignty.
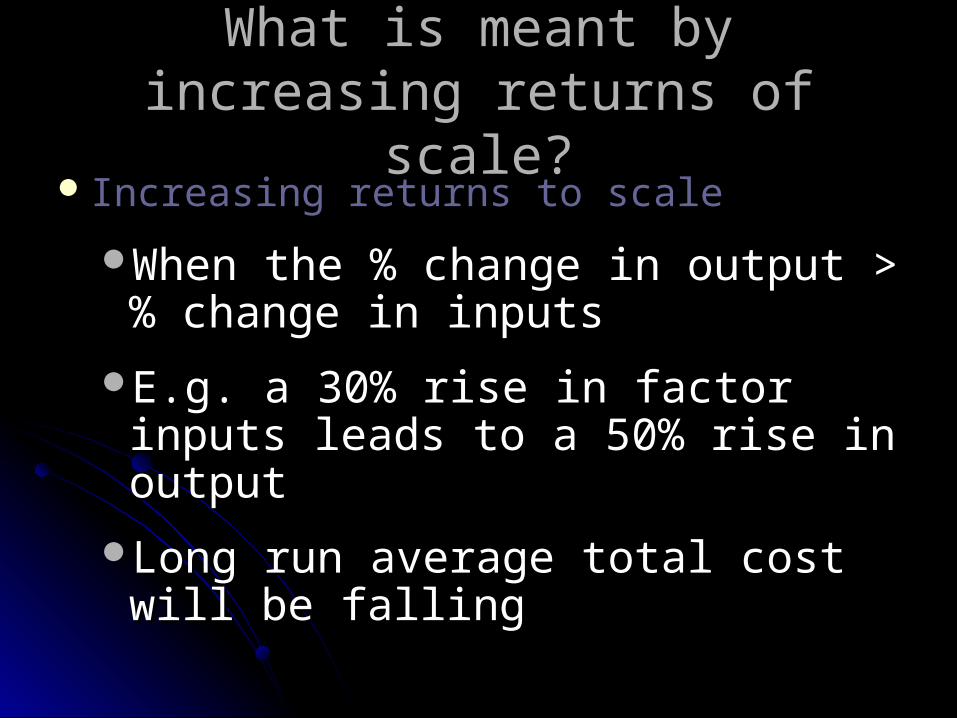
What is meant by increasing What is meant by increasing returns of scale?returns of scale?
Increasing returns to scaleIncreasing returns to scale
When the % change in output > % When the % change in output > % change in inputschange in inputs
E.g. a 30% rise in factor inputs E.g. a 30% rise in factor inputs leads to a 50% rise in outputleads to a 50% rise in output
Long run average total cost will be Long run average total cost will be fallingfalling
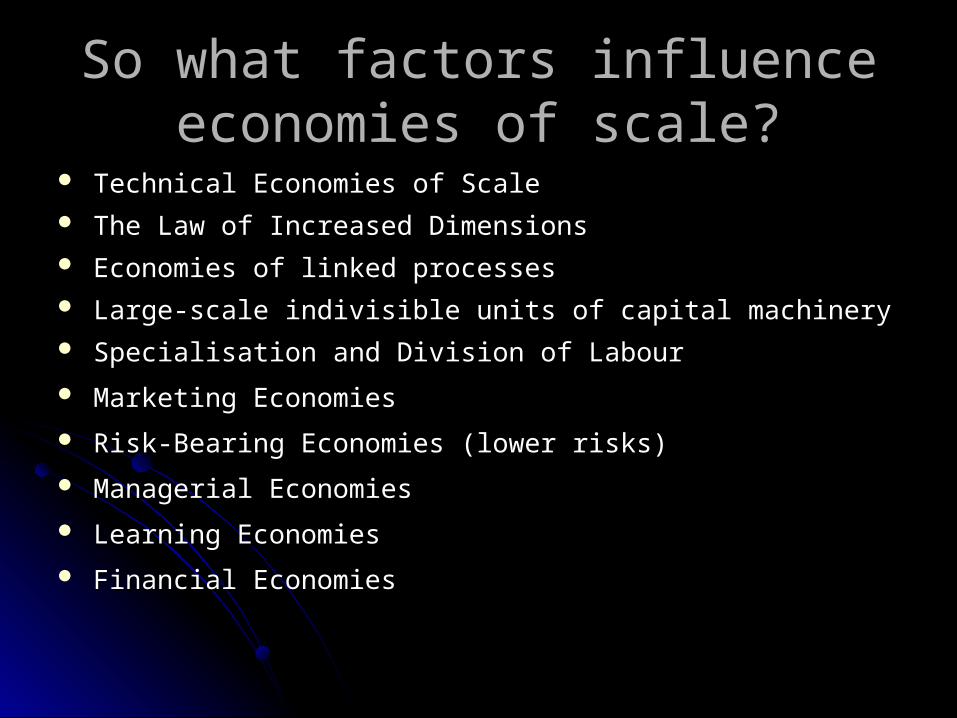
So what factors influence So what factors influence economies of scale?economies of scale?
Technical Economies of ScaleTechnical Economies of Scale The Law of Increased DimensionsThe Law of Increased Dimensions Economies of linked processesEconomies of linked processes Large-scale indivisible units of capital machineryLarge-scale indivisible units of capital machinery Specialisation and Division of Labour Specialisation and Division of Labour
Marketing EconomiesMarketing Economies
Risk-Bearing Economies (lower risks)Risk-Bearing Economies (lower risks)
Managerial EconomiesManagerial Economies
Learning EconomiesLearning Economies
Financial EconomiesFinancial Economies
Draw an economies of scale Draw an economies of scale diagram…diagram…
Show 3 SRAC curves to the optimum Show 3 SRAC curves to the optimum productive efficiency point and another productive efficiency point and another SRAC which illustrates diseconomies of SRAC which illustrates diseconomies of scale.scale.
Clearly label the LRAC curve as well…Clearly label the LRAC curve as well…
Next slide has the answer…Next slide has the answer…
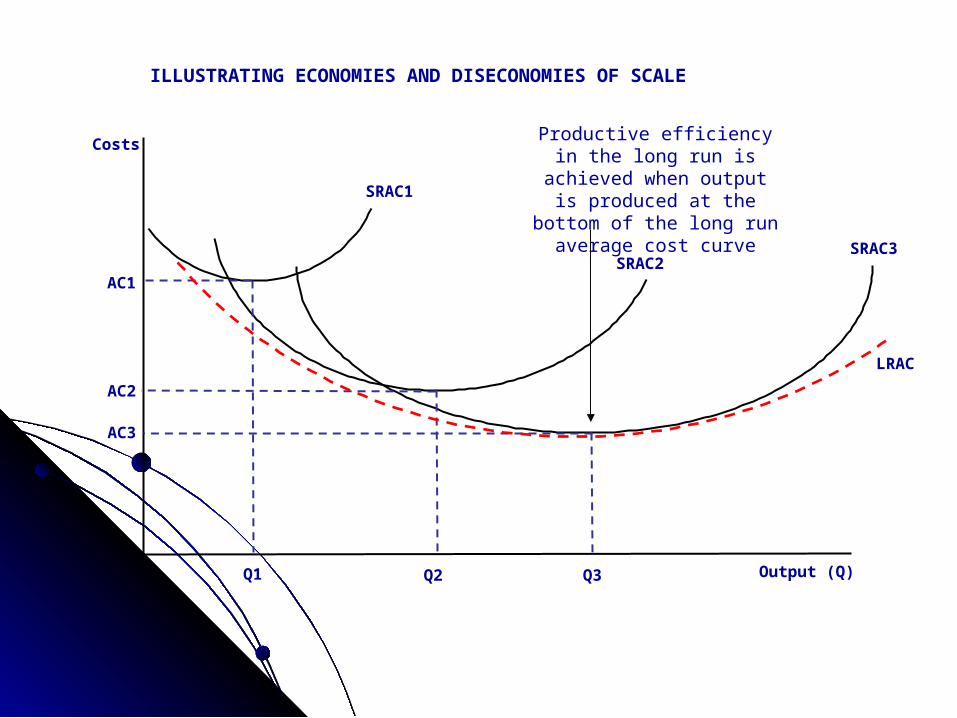
Costs
Output (Q)
SRAC1
SRAC2SRAC3
Q1 Q2 Q3
AC1
AC2
AC3
LRAC
ILLUSTRATING ECONOMIES AND DISECONOMIES OF SCALE
Productive efficiency in the long run is achieved when output is produced at the
bottom of the long run average cost curve