as filed with the securities and exchange commission on
TRANSCRIPT
As filed with the Securities and Exchange Commission on July 10, 2019
UNITED STATESSECURITIES AND EXCHANGE COMMISSION
WASHINGTON, D.C. 20549
FORM 20-F‘ REGISTRATION STATEMENT PURSUANT TO SECTION 12(b) OR (g) OF
THE SECURITIES EXCHANGE ACT OF 1934OR
È ANNUAL REPORT PURSUANT TO SECTION 13 OR 15(d) OFTHE SECURITIES EXCHANGE ACT OF 1934
For the fiscal year ended March 31, 2019OR
‘ TRANSITION REPORT PURSUANT TO SECTION 13 OR 15(d) OFTHE SECURITIES EXCHANGE ACT OF 1934For the transition period from to
OR‘ SHELL COMPANY REPORT PURSUANT TO SECTION 13 OR 15(d) OF
THE SECURITIES EXCHANGE ACT OF 1934Date of event requiring this shell company report
Commission file number 000-54189
KABUSHIKI KAISHA MITSUBISHI UFJ FINANCIAL GROUP(Exact name of Registrant as specified in its charter)
MITSUBISHI UFJ FINANCIAL GROUP, INC.(Translation of Registrant’s name into English)
Japan(Jurisdiction of incorporation or organization)
7-1, Marunouchi 2-chomeChiyoda-ku, Tokyo 100-8330
Japan(Address of principal executive offices)
Masahisa Takahashi, +81-3-3240-8111, +81-3-3240-7073, same address as above(Name, Telephone, Facsimile number and Address of Company Contact Person)
Securities registered or to be registered pursuant to Section 12(b) of the Act:
Title of each classTrading
symbol(s) Name of each exchange on which registered
Common stock, without par value . . . . . . . . . . . . . . . . . . . . . . . . . . . . . . . . . . . . . . . . . . . . . . . . . . . . . . New York Stock Exchange(1)
American depositary shares, each of which represents one share of common stock . . . . . . . . . . . . . . . . MUFG New York Stock Exchange
(1) The listing of the registrant’s common stock on the New York Stock Exchange is for technical purposes only and without trading privileges.Securities registered or to be registered pursuant to Section 12(g) of the Act: NoneSecurities for which there is a reporting obligation pursuant to Section 15(d) of the Act: NoneIndicate the number of outstanding shares of each of the issuer’s classes of capital or common stock as of the close of the period covered by the annual report:As of March 31, 2019,13,667,770,520 shares of common stock (including 745,921,774 shares of common stock held by the registrant and its consolidated
subsidiaries as treasury stock)Indicate by check mark if the registrant is a well-known seasoned issuer, as defined in Rule 405 of the Securities Act.
Yes È No ‘If this report is an annual or transition report, indicate by check mark if the registrant is not required to file reports pursuant to Section 13 or 15(d) of the
Securities Exchange Act of 1934.Yes ‘ No È
Note—Checking the box above will not relieve any registrant required to file reports pursuant to Section 13 or 15(d) of the Securities Exchange Act of 1934from their obligations under those Sections.
Indicate by check mark whether the registrant (1) has filed all reports required to be filed by Section 13 or 15(d) of the Securities Exchange Act of 1934 duringthe preceding 12 months (or for such shorter period that the registrant was required to file such reports), and (2) has been subject to such filing requirements for thepast 90 days.
Yes È No ‘Indicate by check mark whether the registrant has submitted electronically every Interactive Data File required to be submitted pursuant to Rule 405 of
Regulation S-T (§232.405 of this chapter) during the preceding 12 months (or for such shorter period that the registrant was required to submit such files).Yes È No ‘
Indicate by check mark whether the registrant is a large accelerated filer, an accelerated filer, a non-accelerated filer, or an emerging growth company. Seedefinition of “large accelerated filer,” “accelerated filer,” and “emerging growth company” in Rule 12b-2 of the Exchange Act.
Large accelerated filer È Accelerated filer ‘ Non-accelerated filer ‘ Emerging growth company ‘If an emerging growth company that prepares its financial statements in accordance with U.S. GAAP, indicate by check mark if the registrant has elected not to
use the extended transition period for complying with any new or revised financial accounting standards† provided pursuant to Section 13(a) of theExchange Act. ‘
† The term “new or revised financial accounting standard” refers to any update issued by the Financial Accounting Standards Board to its AccountingStandards Codification after April 5, 2012.
Indicate by check mark which basis of accounting the registrant has used to prepare the financial statements included in this filing:U.S. GAAP È International Financial Reporting Standards as issued
by the International Accounting Standards Board ‘Other ‘
If “Other” has been checked in response to the previous question, indicate by check mark which financial statement item the registrant has elected to follow.Item 17 ‘ Item 18 ‘
If this is an annual report, indicate by check mark whether the registrant is a shell company (as defined in Rule 12b-2 of the Exchange Act).Yes ‘ No È
TABLE OF CONTENTS
Page
Forward-Looking Statements . . . . . . . . . . . . . . . . . . . . . . . . . . . . . . . . . . . . . . . . . . . . . . . . . . . . . . . . . . . . . 3Item 1. Identity of Directors, Senior Management and Advisers . . . . . . . . . . . . . . . . . . . . . . . . . . . . . . . 4Item 2. Offer Statistics and Expected Timetable . . . . . . . . . . . . . . . . . . . . . . . . . . . . . . . . . . . . . . . . . . . 4Item 3. Key Information . . . . . . . . . . . . . . . . . . . . . . . . . . . . . . . . . . . . . . . . . . . . . . . . . . . . . . . . . . . . . . 4Item 4. Information on the Company . . . . . . . . . . . . . . . . . . . . . . . . . . . . . . . . . . . . . . . . . . . . . . . . . . . . 28Item 4A. Unresolved Staff Comments . . . . . . . . . . . . . . . . . . . . . . . . . . . . . . . . . . . . . . . . . . . . . . . . . . . . 72Item 5. Operating and Financial Review and Prospects . . . . . . . . . . . . . . . . . . . . . . . . . . . . . . . . . . . . . . 73Item 6. Directors, Senior Management and Employees . . . . . . . . . . . . . . . . . . . . . . . . . . . . . . . . . . . . . . 139Item 7. Major Shareholders and Related Party Transactions . . . . . . . . . . . . . . . . . . . . . . . . . . . . . . . . . . 163Item 8. Financial Information . . . . . . . . . . . . . . . . . . . . . . . . . . . . . . . . . . . . . . . . . . . . . . . . . . . . . . . . . . 165Item 9. The Offer and Listing . . . . . . . . . . . . . . . . . . . . . . . . . . . . . . . . . . . . . . . . . . . . . . . . . . . . . . . . . . 166Item 10. Additional Information . . . . . . . . . . . . . . . . . . . . . . . . . . . . . . . . . . . . . . . . . . . . . . . . . . . . . . . . . 167Item 11. Quantitative and Qualitative Disclosures about Credit, Market and Other Risk . . . . . . . . . . . . . 175Item 12. Description of Securities Other than Equity Securities . . . . . . . . . . . . . . . . . . . . . . . . . . . . . . . . 204Item 13. Defaults, Dividend Arrearages and Delinquencies . . . . . . . . . . . . . . . . . . . . . . . . . . . . . . . . . . . 206Item 14. Material Modifications to the Rights of Security Holders and Use of Proceeds . . . . . . . . . . . . . 206Item 15. Controls and Procedures . . . . . . . . . . . . . . . . . . . . . . . . . . . . . . . . . . . . . . . . . . . . . . . . . . . . . . . . 206Item 16A. Audit Committee Financial Expert . . . . . . . . . . . . . . . . . . . . . . . . . . . . . . . . . . . . . . . . . . . . . . . . 209Item 16B. Code of Ethics . . . . . . . . . . . . . . . . . . . . . . . . . . . . . . . . . . . . . . . . . . . . . . . . . . . . . . . . . . . . . . . 209Item 16C. Principal Accountant Fees and Services . . . . . . . . . . . . . . . . . . . . . . . . . . . . . . . . . . . . . . . . . . . 209Item 16D. Exemptions from the Listing Standards for Audit Committees . . . . . . . . . . . . . . . . . . . . . . . . . . 210Item 16E. Purchases of Equity Securities by the Issuer and Affiliated Purchasers . . . . . . . . . . . . . . . . . . . 210Item 16F. Change in Registrant’s Certifying Accountant . . . . . . . . . . . . . . . . . . . . . . . . . . . . . . . . . . . . . . 211Item 16G. Corporate Governance . . . . . . . . . . . . . . . . . . . . . . . . . . . . . . . . . . . . . . . . . . . . . . . . . . . . . . . . . 211Item 16H. Mine Safety Disclosure . . . . . . . . . . . . . . . . . . . . . . . . . . . . . . . . . . . . . . . . . . . . . . . . . . . . . . . . 213Item 17. Financial Statements . . . . . . . . . . . . . . . . . . . . . . . . . . . . . . . . . . . . . . . . . . . . . . . . . . . . . . . . . . . 214Item 18. Financial Statements . . . . . . . . . . . . . . . . . . . . . . . . . . . . . . . . . . . . . . . . . . . . . . . . . . . . . . . . . . . 214Item 19. Exhibits . . . . . . . . . . . . . . . . . . . . . . . . . . . . . . . . . . . . . . . . . . . . . . . . . . . . . . . . . . . . . . . . . . . . . 214Selected Statistical Data . . . . . . . . . . . . . . . . . . . . . . . . . . . . . . . . . . . . . . . . . . . . . . . . . . . . . . . . . . . . . . . . . . A-1Consolidated Financial Statements . . . . . . . . . . . . . . . . . . . . . . . . . . . . . . . . . . . . . . . . . . . . . . . . . . . . . . . . . . F-1
For purposes of this Annual Report, we have presented our consolidated financial statements in accordancewith accounting principles generally accepted in the United States, or U.S. GAAP, except for risk-adjustedcapital ratios, capital components, risk-weighted assets, business segment financial information and some otherspecifically identified information. Unless otherwise stated or the context otherwise requires, all amounts in ourfinancial statements are expressed in Japanese yen.
In this Annual Report, unless otherwise indicated or the context otherwise requires, all figures are roundedto the figures shown except for the capital ratios, capital components, risk-weighted assets, leverage ratios andliquidity coverage ratios of MUFG and its domestic subsidiaries, which are rounded down and truncated to thefigures shown. In some cases, figures presented in tables are adjusted to match the sum of the figures with thetotal amount, and such figures are also referred to in the related text.
When we refer in this Annual Report to “MUFG,” “we,” “us,” “our” and the “Group,” we generally meanMitsubishi UFJ Financial Group, Inc. and its consolidated subsidiaries, but from time to time as the contextrequires, we mean Mitsubishi UFJ Financial Group, Inc. as an individual legal entity. In addition, our“commercial banking subsidiaries” refers to MUFG Bank, Ltd. (formerly, The Bank of Tokyo-Mitsubishi UFJ,Ltd.), or “BK,” and, as the context requires, its consolidated subsidiaries engaged in the commercial bankingbusiness. Our “trust banking subsidiaries” refers to Mitsubishi UFJ Trust and Banking Corporation, or “TB,” and,as the context requires, its consolidated subsidiaries engaged in the trust banking business. Our “bankingsubsidiaries” refers to MUFG Bank and Mitsubishi UFJ Trust and Banking and, as the context requires, theirrespective consolidated subsidiaries engaged in the banking business. Our “securities subsidiaries” refers toMitsubishi UFJ Securities Holdings Co., Ltd., or “SCHD,” and as the context requires, its consolidatedsubsidiaries engaged in the securities business.
1
References to “MUAH” and “BK(US)” are to MUFG Americas Holdings Corporation and MUFG UnionBank, N.A., as single entities, respectively, as well as to MUFG Americas Holdings and MUFG Union Bank andtheir respective consolidated subsidiaries, as the context requires.
References to “Krungsri” are to Bank of Ayudhya Public Company Limited, as a single entity, as well as toBank of Ayudhya Public Company Limited and its respective consolidated subsidiaries, as the context requires.References to “Bank Danamon” are to PT Bank Danamon Indonesia, Tbk., as a single entity, as well as to PTBank Danamon Indonesia, Tbk. and its respective consolidated subsidiaries, as the context requires.
References to the “FSA” are to the Financial Services Agency, an agency of the Cabinet Office of Japan.
References in this Annual Report to “yen” or “¥” are to Japanese yen, references to “U.S. dollars,”“U.S. dollar,” “dollars,” “U.S.$” or “$” are to United States dollars, references to “euro” or “€” are to thecurrency of the member states of the European Monetary Union, references to “THB” are to Thai baht, referencesto “AU$” are to Australian dollars, references to “HK$” are to Hong Kong dollars, and references to “IDR” areto Indonesian Rupiah.
Our fiscal year ends on March 31 of each year. References to years not specified as being fiscal years are tocalendar years.
We usually hold the annual ordinary general meeting of shareholders of Mitsubishi UFJ Financial Group,Inc. in June of each year in Tokyo.
2
Forward-Looking Statements
We may from time to time make written or oral forward-looking statements. Written forward-lookingstatements may appear in documents filed with, or submitted to, the U.S. Securities and Exchange Commission,or SEC, including this Annual Report, and other reports to shareholders and other communications.
The U.S. Private Securities Litigation Reform Act of 1995 provides a “safe harbor” for forward-lookinginformation to encourage companies to provide prospective information about themselves. We rely on this safeharbor in making these forward-looking statements.
Forward-looking statements appear in a number of places in this Annual Report and include statementsregarding our current intent, business plan, targets, belief or expectations or the current belief or currentexpectations of our management with respect to our results of operations and financial condition, including,among other matters, our problem loans and loan losses. In many, but not all cases, we use words such as“anticipate,” “aim,” “believe,” “estimate,” “expect,” “intend,” “plan,” “probability,” “risk,” “will,” “may” andsimilar expressions, as they relate to us or our management, to identify forward-looking statements. Thesestatements reflect our current views with respect to future events and are subject to risks, uncertainties andassumptions. Should one or more of these risks or uncertainties materialize or should underlying assumptionsprove incorrect, actual results may vary materially from those which are aimed, anticipated, believed, estimated,expected, intended or planned, or otherwise stated.
Our forward-looking statements are not guarantees of future performance and involve risks anduncertainties. Actual results may differ from those in the forward-looking statements as a result of variousfactors. We identify in this Annual Report in “Item 3.D. Key Information—Risk Factors,” “Item 4.B. Informationon the Company—Business Overview,” “Item 5. Operating and Financial Review and Prospects” and elsewhere,some, but not necessarily all, of the important factors that could cause these differences.
We are under no obligation, and disclaim any obligation, to update or alter our forward-looking statements,whether as a result of new information, future events or otherwise unless required by law.
3

PART I
Item 1. Identity of Directors, Senior Management and Advisers.
Not applicable.
Item 2. Offer Statistics and Expected Timetable.
Not applicable.
Item 3. Key Information.
A. Selected Financial Data
The selected statement of income data and selected balance sheet data set forth below has been derived fromour audited consolidated financial statements.
Except for risk-adjusted capital ratios, which are calculated in accordance with Japanese banking regulationsbased on information derived from our consolidated financial statements prepared in accordance with accountingprinciples generally accepted in Japan, or Japanese GAAP, the selected financial data set forth below are derivedfrom our consolidated financial statements prepared in accordance with U.S. GAAP.
You should read the selected financial data set forth below in conjunction with “Item 5. Operating andFinancial Review and Prospects,” “Selected Statistical Data” and our consolidated financial statements and otherfinancial data included elsewhere in this Annual Report. These data are qualified in their entirety by reference toall of that information.
4
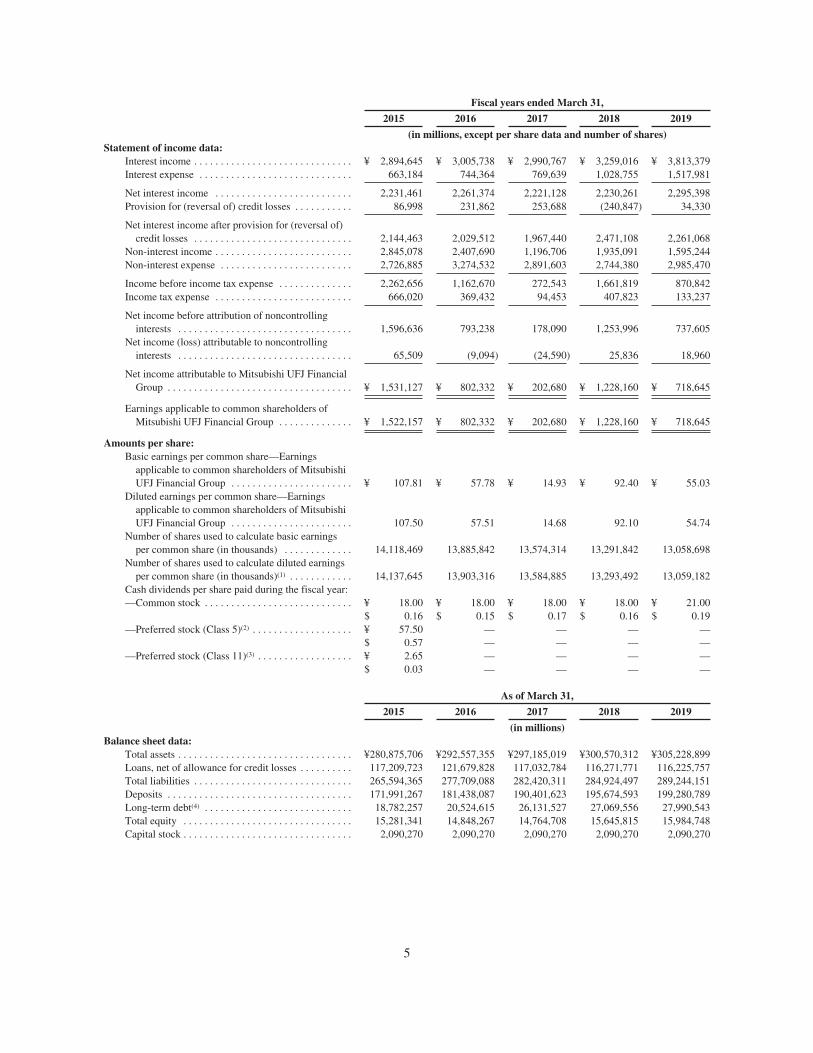
Fiscal years ended March 31,
2015 2016 2017 2018 2019
(in millions, except per share data and number of shares)Statement of income data:
Interest income . . . . . . . . . . . . . . . . . . . . . . . . . . . . . . ¥ 2,894,645 ¥ 3,005,738 ¥ 2,990,767 ¥ 3,259,016 ¥ 3,813,379Interest expense . . . . . . . . . . . . . . . . . . . . . . . . . . . . . 663,184 744,364 769,639 1,028,755 1,517,981
Net interest income . . . . . . . . . . . . . . . . . . . . . . . . . . 2,231,461 2,261,374 2,221,128 2,230,261 2,295,398Provision for (reversal of) credit losses . . . . . . . . . . . 86,998 231,862 253,688 (240,847) 34,330
Net interest income after provision for (reversal of)credit losses . . . . . . . . . . . . . . . . . . . . . . . . . . . . . . 2,144,463 2,029,512 1,967,440 2,471,108 2,261,068
Non-interest income . . . . . . . . . . . . . . . . . . . . . . . . . . 2,845,078 2,407,690 1,196,706 1,935,091 1,595,244Non-interest expense . . . . . . . . . . . . . . . . . . . . . . . . . 2,726,885 3,274,532 2,891,603 2,744,380 2,985,470
Income before income tax expense . . . . . . . . . . . . . . 2,262,656 1,162,670 272,543 1,661,819 870,842Income tax expense . . . . . . . . . . . . . . . . . . . . . . . . . . 666,020 369,432 94,453 407,823 133,237
Net income before attribution of noncontrollinginterests . . . . . . . . . . . . . . . . . . . . . . . . . . . . . . . . . 1,596,636 793,238 178,090 1,253,996 737,605
Net income (loss) attributable to noncontrollinginterests . . . . . . . . . . . . . . . . . . . . . . . . . . . . . . . . . 65,509 (9,094) (24,590) 25,836 18,960
Net income attributable to Mitsubishi UFJ FinancialGroup . . . . . . . . . . . . . . . . . . . . . . . . . . . . . . . . . . . ¥ 1,531,127 ¥ 802,332 ¥ 202,680 ¥ 1,228,160 ¥ 718,645
Earnings applicable to common shareholders ofMitsubishi UFJ Financial Group . . . . . . . . . . . . . . ¥ 1,522,157 ¥ 802,332 ¥ 202,680 ¥ 1,228,160 ¥ 718,645
Amounts per share:Basic earnings per common share—Earnings
applicable to common shareholders of MitsubishiUFJ Financial Group . . . . . . . . . . . . . . . . . . . . . . . ¥ 107.81 ¥ 57.78 ¥ 14.93 ¥ 92.40 ¥ 55.03
Diluted earnings per common share—Earningsapplicable to common shareholders of MitsubishiUFJ Financial Group . . . . . . . . . . . . . . . . . . . . . . . 107.50 57.51 14.68 92.10 54.74
Number of shares used to calculate basic earningsper common share (in thousands) . . . . . . . . . . . . . 14,118,469 13,885,842 13,574,314 13,291,842 13,058,698
Number of shares used to calculate diluted earningsper common share (in thousands)(1) . . . . . . . . . . . . 14,137,645 13,903,316 13,584,885 13,293,492 13,059,182
Cash dividends per share paid during the fiscal year:—Common stock . . . . . . . . . . . . . . . . . . . . . . . . . . . . ¥ 18.00 ¥ 18.00 ¥ 18.00 ¥ 18.00 ¥ 21.00
$ 0.16 $ 0.15 $ 0.17 $ 0.16 $ 0.19—Preferred stock (Class 5)(2) . . . . . . . . . . . . . . . . . . . ¥ 57.50 — — — —
$ 0.57 — — — ——Preferred stock (Class 11)(3) . . . . . . . . . . . . . . . . . . ¥ 2.65 — — — —
$ 0.03 — — — —
As of March 31,
2015 2016 2017 2018 2019
(in millions)Balance sheet data:
Total assets . . . . . . . . . . . . . . . . . . . . . . . . . . . . . . . . . ¥280,875,706 ¥292,557,355 ¥297,185,019 ¥300,570,312 ¥305,228,899Loans, net of allowance for credit losses . . . . . . . . . . 117,209,723 121,679,828 117,032,784 116,271,771 116,225,757Total liabilities . . . . . . . . . . . . . . . . . . . . . . . . . . . . . . 265,594,365 277,709,088 282,420,311 284,924,497 289,244,151Deposits . . . . . . . . . . . . . . . . . . . . . . . . . . . . . . . . . . . 171,991,267 181,438,087 190,401,623 195,674,593 199,280,789Long-term debt(4) . . . . . . . . . . . . . . . . . . . . . . . . . . . . 18,782,257 20,524,615 26,131,527 27,069,556 27,990,543Total equity . . . . . . . . . . . . . . . . . . . . . . . . . . . . . . . . 15,281,341 14,848,267 14,764,708 15,645,815 15,984,748Capital stock . . . . . . . . . . . . . . . . . . . . . . . . . . . . . . . . 2,090,270 2,090,270 2,090,270 2,090,270 2,090,270
5
Fiscal years ended March 31,
2015 2016 2017 2018 2019
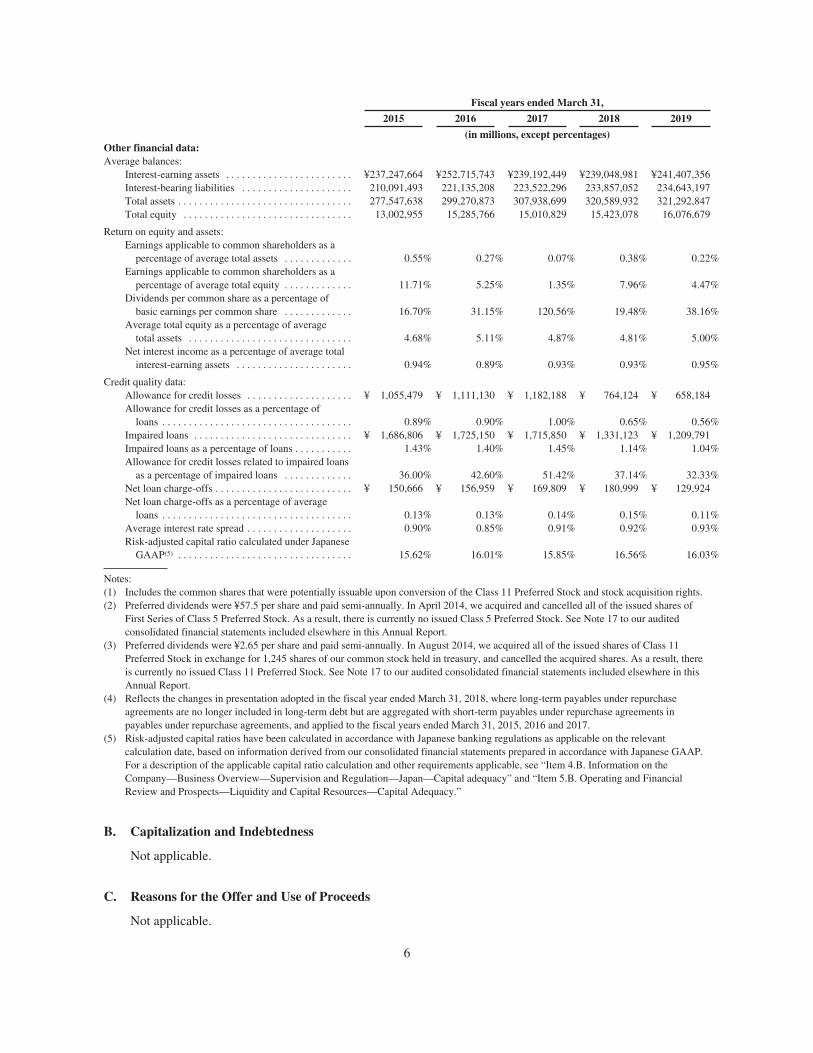
(in millions, except percentages)Other financial data:Average balances:
Interest-earning assets . . . . . . . . . . . . . . . . . . . . . . . . ¥237,247,664 ¥252,715,743 ¥239,192,449 ¥239,048,981 ¥241,407,356Interest-bearing liabilities . . . . . . . . . . . . . . . . . . . . . 210,091,493 221,135,208 223,522,296 233,857,052 234,643,197Total assets . . . . . . . . . . . . . . . . . . . . . . . . . . . . . . . . . 277,547,638 299,270,873 307,938,699 320,589,932 321,292,847Total equity . . . . . . . . . . . . . . . . . . . . . . . . . . . . . . . . 13,002,955 15,285,766 15,010,829 15,423,078 16,076,679
Return on equity and assets:Earnings applicable to common shareholders as a
percentage of average total assets . . . . . . . . . . . . . 0.55% 0.27% 0.07% 0.38% 0.22%Earnings applicable to common shareholders as a
percentage of average total equity . . . . . . . . . . . . . 11.71% 5.25% 1.35% 7.96% 4.47%Dividends per common share as a percentage of
basic earnings per common share . . . . . . . . . . . . . 16.70% 31.15% 120.56% 19.48% 38.16%Average total equity as a percentage of average
total assets . . . . . . . . . . . . . . . . . . . . . . . . . . . . . . . 4.68% 5.11% 4.87% 4.81% 5.00%Net interest income as a percentage of average total
interest-earning assets . . . . . . . . . . . . . . . . . . . . . . 0.94% 0.89% 0.93% 0.93% 0.95%
Credit quality data:Allowance for credit losses . . . . . . . . . . . . . . . . . . . . ¥ 1,055,479 ¥ 1,111,130 ¥ 1,182,188 ¥ 764,124 ¥ 658,184Allowance for credit losses as a percentage of
loans . . . . . . . . . . . . . . . . . . . . . . . . . . . . . . . . . . . . 0.89% 0.90% 1.00% 0.65% 0.56%Impaired loans . . . . . . . . . . . . . . . . . . . . . . . . . . . . . . ¥ 1,686,806 ¥ 1,725,150 ¥ 1,715,850 ¥ 1,331,123 ¥ 1,209,791Impaired loans as a percentage of loans . . . . . . . . . . . 1.43% 1.40% 1.45% 1.14% 1.04%Allowance for credit losses related to impaired loans
as a percentage of impaired loans . . . . . . . . . . . . . 36.00% 42.60% 51.42% 37.14% 32.33%Net loan charge-offs . . . . . . . . . . . . . . . . . . . . . . . . . . ¥ 150,666 ¥ 156,959 ¥ 169,809 ¥ 180,999 ¥ 129,924Net loan charge-offs as a percentage of average
loans . . . . . . . . . . . . . . . . . . . . . . . . . . . . . . . . . . . . 0.13% 0.13% 0.14% 0.15% 0.11%Average interest rate spread . . . . . . . . . . . . . . . . . . . . 0.90% 0.85% 0.91% 0.92% 0.93%Risk-adjusted capital ratio calculated under Japanese
GAAP(5) . . . . . . . . . . . . . . . . . . . . . . . . . . . . . . . . . 15.62% 16.01% 15.85% 16.56% 16.03%
Notes:(1) Includes the common shares that were potentially issuable upon conversion of the Class 11 Preferred Stock and stock acquisition rights.(2) Preferred dividends were ¥57.5 per share and paid semi-annually. In April 2014, we acquired and cancelled all of the issued shares of
First Series of Class 5 Preferred Stock. As a result, there is currently no issued Class 5 Preferred Stock. See Note 17 to our auditedconsolidated financial statements included elsewhere in this Annual Report.
(3) Preferred dividends were ¥2.65 per share and paid semi-annually. In August 2014, we acquired all of the issued shares of Class 11Preferred Stock in exchange for 1,245 shares of our common stock held in treasury, and cancelled the acquired shares. As a result, thereis currently no issued Class 11 Preferred Stock. See Note 17 to our audited consolidated financial statements included elsewhere in thisAnnual Report.
(4) Reflects the changes in presentation adopted in the fiscal year ended March 31, 2018, where long-term payables under repurchaseagreements are no longer included in long-term debt but are aggregated with short-term payables under repurchase agreements inpayables under repurchase agreements, and applied to the fiscal years ended March 31, 2015, 2016 and 2017.
(5) Risk-adjusted capital ratios have been calculated in accordance with Japanese banking regulations as applicable on the relevantcalculation date, based on information derived from our consolidated financial statements prepared in accordance with Japanese GAAP.For a description of the applicable capital ratio calculation and other requirements applicable, see “Item 4.B. Information on theCompany—Business Overview—Supervision and Regulation—Japan—Capital adequacy” and “Item 5.B. Operating and FinancialReview and Prospects—Liquidity and Capital Resources—Capital Adequacy.”
B. Capitalization and Indebtedness
Not applicable.
C. Reasons for the Offer and Use of Proceeds
Not applicable.
6

D. Risk Factors
Investing in our securities involves a high degree of risk. You should carefully consider the risks describedin this section, which is intended to disclose all of the risks that we consider material based on the informationcurrently available to us, as well as all the other information in this Annual Report, including our consolidatedfinancial statements and related notes, “Item 5. Operating and Financial Review and Prospects,”“Item 11. Quantitative and Qualitative Disclosures about Credit, Market and Other Risk” and “SelectedStatistical Data.”
Our business, operating results and financial condition could be materially and adversely affected by any ofthe factors discussed below. The trading price of our securities could decline due to any of these factors. ThisAnnual Report also contains forward-looking statements that involve risks and uncertainties. Our actual resultscould differ materially from those anticipated in these forward-looking statements as a result of various factors,including those described in this section and elsewhere in this Annual Report. See “Forward-LookingStatements.”
Risks Related to Our Business
Because a large portion of our assets as well as our business operations are in Japan, we may incurlosses if economic conditions in Japan worsen.
Our performance is particularly affected by the general economic conditions of Japan where we areheadquartered and conduct a significant amount of our business. As of March 31, 2019, 63.6% of our total assetswere related to Japanese domestic assets, including Japanese national government and Japanese governmentagency bonds, which accounted for 56.0% of our total investment securities portfolio and 8.2% of our totalassets, respectively. Interest and non-interest income in Japan represented 34.9% of our total interest andnon-interest income for the fiscal year ended March 31, 2019. Furthermore, as of March 31, 2019, our loans inJapan accounted for 55.7% of our total loans outstanding.
There is significant uncertainty surrounding Japan’s economy. For example, Japan’s fiscal health andsovereign creditworthiness may deteriorate if the Japanese government’s economic measures and the Bank ofJapan’s monetary policies prove ineffective or result in negative consequences. If the prices of Japanesegovernment bonds decline rapidly, resulting in an unexpectedly sudden increase in interest rates, our investmentsecurities portfolio as well as our lending, borrowing, trading and other operations may be negatively impacted.In addition, interest rates may suddenly increase as a result of a decision made by the Bank of Japan to end ormodify its current interest rate policy, including the negative interest rate of minus 0.1% applied to certaincurrent account amounts that financial institutions hold at the Bank of Japan and the Japanese government bondpurchase program with an aim to keep the yield of 10-year Japanese government bonds around zero percent, ormarket expectations relating to any such decision. See “—Risks Related to Our Business—Fluctuations ininterest rates could adversely affect the value or the yield of our bond portfolio.”
Instability in the Japanese stock market and foreign currency exchange rates may also have a significantadverse impact on our asset and liability management as well as our results of operations. Various other factors,including the decreasing and aging demographics in Japan, stagnation or deterioration of economic and marketconditions in other countries, growing global competition and trade conflicts, may also have a material negativeimpact on the Japanese economy. For a detailed discussion on the business environment in Japan and abroad, see“Item 5. Operating and Financial Review and Prospects—Business Environment.”
Since our domestic loans in Japan accounted for a significant portion of our loan portfolio, deteriorating orstagnant economic conditions in Japan may cause adverse effects on our financial results, such as increases incredit costs, as the credit quality of some borrowers could deteriorate. For example, due to the intensifying globalcompetition and weakening consumer spending in recent periods, some Japanese companies, includingelectronics manufacturers, have experienced significant financial difficulties. For a further discussion,
7
see “—Risks Related to Our Business—We may suffer additional credit-related losses in the future if ourborrowers are unable to repay their loans as expected or if the measures we take in reaction to, or in anticipationof, our borrowers’ deteriorating repayment abilities prove inappropriate or insufficient.”
Our domestic loan portfolio may also be adversely affected by interest rate fluctuations in Japan. Forexample, as a result of the Bank of Japan’s interest rate policy and measures to purchase Japanese governmentbonds in the market, the yield on many financial instruments and other market interest rates in Japan havedeclined to low or negative levels. If the Bank of Japan’s policy and measures are maintained for an extendedperiod, or if the Bank of Japan’s negative interest rate is lowered from the current level, market interest rates maydecline further, and our interest rate spread on our domestic loan portfolio may narrow further, reducing our netinterest income.
If the global economy deteriorates, our credit-related losses may increase, and the value of the financialinstruments we hold may decrease, resulting in losses.
Global economic conditions remain volatile, and it is uncertain how the global economy will evolve overtime. Factors that could negatively impact the global market, both developed and emerging, include concernsover the possible negative impact on global economic activity resulting from changes in the trade policies ofvarious countries, the potentially serious ramifications of the negotiations on the United Kingdom’s withdrawalfrom the European Union, the potential negative effect from the monetary policy changes in the United States,slowing economic growth in China in the midst of a shift in the government’s economic policy, possible adverseeffects on economic conditions in commodity-exporting countries of a decline in oil and other commodity prices,and the political turmoil in various regions around world. As of March 31, 2019, based principally on thedomicile of the obligors, assets related to the United States accounted for approximately 16.4% of our totalassets, assets related to Asia and Oceania excluding Japan accounted for approximately 9.2% of our total assets,and assets related to Europe accounted for approximately 7.1% of our total assets. If the global economydeteriorates or the global economic recovery significantly slows down again, the availability of credit maybecome limited, and some of our borrowers may default on their loan obligations to us, increasing our creditlosses. Some of our credit derivative transactions may also be negatively affected, including the protection wesold through single name credit default swaps, and index and basket credit default swaps. The notional amountsof these protections sold as of March 31, 2019 were ¥2.49 trillion and ¥0.66 trillion, respectively. In addition, ifcredit market conditions worsen, our capital funding structure may need to be adjusted or our funding costs mayincrease, which could have a material adverse impact on our financial condition and results of operations.
Furthermore, we have incurred losses, and may incur further losses, as a result of changes in the fair valueof our financial instruments resulting from weakening market conditions. For example, we recorded¥355.8 billion of net losses from marketable equity securities, which reflected unrealized losses, or holdinglosses, on marketable equity securities, and ¥0.6 billion of impairment losses on available-for-sale debt securitiesand other securities for the fiscal year ended March 31, 2019. As of March 31, 2019, approximately 26.6% of ourtotal assets were financial instruments for which we measure fair value on a recurring basis, and less than 0.5%of our total assets were financial instruments for which we measure fair value on a non-recurring basis.Generally, in order to establish the fair value of these instruments, we rely on quoted prices. If the value of thesefinancial instruments declines, a corresponding loss or write-down may be recognized in our consolidatedstatements of income. In addition, because we hold a large amount of investment securities, short-termfluctuations in the value of our securities may trigger losses or exit costs for us to manage our risk. For moreinformation on our valuation method for financial instruments, see “Item 5. Operating and Financial Review andProspects—Critical Accounting Estimates.”
8

We may suffer additional credit-related losses in the future if our borrowers are unable to repay theirloans as expected or if the measures we take in reaction to, or in anticipation of, our borrowers’ deterioratingrepayment abilities prove inappropriate or insufficient.
When we lend money or commit to lend money, we incur credit risk, which is the risk of losses if ourborrowers do not repay their loans. We may incur significant credit losses or have to provide for a significantamount of additional allowance for credit losses if:
‰ large borrowers become insolvent or must be restructured;
‰ domestic or global economic conditions, either generally or in particular industries in which largeborrowers operate, deteriorate;
‰ the value of the collateral we hold, such as real estate or securities, declines; or
‰ we are adversely affected by corporate credibility issues among our borrowers, to an extent that is worsethan anticipated.
As a percentage of total loans, impaired loans, which primarily include nonaccrual loans and troubled debtrestructurings, or TDRs, ranged from 1.04% to 1.45% as of the five most recent fiscal year-ends. As of March 31,2019, impaired loans were ¥1.21 trillion, representing 1.04% of our total outstanding loans. If the economicconditions in Japan or other parts of the world, or in particular industries, including the energy and real estateindustries, to which we have significant credit risk exposure, worsen, our problem loans and credit-relatedexpenses may increase. An increase in problem loans and credit-related expenses would adversely affect ourresults of operations, weaken our financial condition and erode our capital base.
We may provide additional loans, equity capital or other forms of support to troubled borrowers in order tofacilitate their restructuring and revitalization efforts. We may also forbear from exercising some or all of ourrights as a creditor against them, and we may forgive loans to them in conjunction with their debt restructurings.We may take these steps even when such steps might not be warranted from the perspective of our short-term ornarrow economic interests or a technical analysis of our legal rights against those borrowers, in light of otherfactors such as our longer-term economic interests, and our commitment to supporting the Japanese economy.These practices may substantially increase our exposure to troubled borrowers and increase our losses. Creditlosses may also increase if we elect, or are forced by economic or other considerations, to sell or write off ourproblem loans at a larger discount, in a larger amount or in a different time or manner, than we may otherwisewant.
Although we, from time to time, enter into credit derivative transactions, including credit default swapcontracts, to manage our credit risk exposure, such transactions may not provide the protection against creditdefaults that we intended due to counterparty defaults or similar issues. The credit default swap contracts couldalso result in significant losses. As of March 31, 2019, the total notional amount of the protection we soldthrough single name credit default swaps and index and basket credit default swaps was ¥3.15 trillion. Inaddition, negative changes in financial market conditions may restrict the availability and liquidity of creditdefault swaps. For more information on our credit derivative transactions, see Note 24 to our consolidatedfinancial statements included elsewhere in this Annual Report.
Our loan losses could prove to be materially different from our estimates and could materially exceed ourcurrent allowance for credit losses, in which case we may need to provide for additional allowance for creditlosses and may also record credit losses beyond our allowance. Our allowance for credit losses in our loanportfolio is based on evaluations of customers’ creditworthiness and the value of collateral we hold. We recorded¥34.3 billion of provision for credit losses for the fiscal year ended March 31, 2019. While we closely observeconditions of our individual borrowers and industry trends, our borrowers may incur financial and non-financiallosses that exceed our estimations depending on, for example, domestic and international economic conditions orcommodity price fluctuations. In such case, we may need to provide for additional allowance for credit losses.
9

Also, the regulatory standards or guidance on establishing allowances may also change, causing us to changesome of the evaluations used in determining the allowances. As a result, we may need to provide for additionalallowance for credit losses.
Our efforts to diversify our portfolio to avoid any concentration of credit risk exposures to particularindustries or counterparties may prove insufficient. For example, our credit exposures to the energy and realestate industries are relatively high in comparison to other industries. The credit quality of borrowers in thissector do not necessarily correspond to general economic conditions in Japan or other parts of the world, andadverse fluctuations in oil and other commodity prices or adverse developments in the real estate market maydisproportionately increase our credit costs.
When we believe there is an improvement in asset quality, we may reverse the allowance for credit losses toa level management deems appropriate and record the amount of reversal in our consolidated statements ofincome. For example, for the fiscal year ended March 31, 2019, we recorded ¥43.9 billion and ¥4.5 billion ofreversal of credit losses for the Commercial and Residential segments, respectively, of our loan portfolio.However, we have historically recorded provision for credit losses rather than recording reversal of credit lossesin most periods, and in future periods we may need to recognize provision for credit losses for these and othersegments of our loan portfolio.
For more information on our loan portfolio, see “Item 5.B. Operating and Financial Review and Prospects—Liquidity and Capital Resources—Financial Condition—Loan Portfolio.”
Fluctuations in interest rates could adversely affect the value or the yield of our bond portfolio.
The aggregate carrying amount of the Japanese government and corporate bonds and foreign bonds,including U.S. Treasury bonds, that we held as of March 31, 2019 was 9.5% of our total assets. In particular, theJapanese national government and Japanese government agency bonds accounted for 8.2% of our total assets asof March 31, 2019. For a detailed discussion of our bond portfolio, see “Selected Statistical Data—InvestmentPortfolio.”
The Bank of Japan has maintained a “quantitative and qualitative monetary easing with yield curve control”policy and applied a negative interest rate of minus 0.1% to the “Policy-Rate Balances,” which are a part ofcurrent account amounts held by financial institutions at the Bank of Japan, while purchasing Japanesegovernment bonds to increase its aggregate holding of such bonds by approximately ¥80 trillion each year withan aim to keep the yield of 10-year Japanese government bonds around zero percent. If the policy is maintainedin Japan for an extended period, or if the Bank of Japan’s negative interest rate or target long-term interest rate islowered from the current level, market interest rates may decline further, and the yield on the Japanesegovernment bonds and other financial instruments that we hold may also decline. On the other hand, the value ofour investment portfolio may decrease if interest rates increase rapidly or significantly because of heightenedmarket expectations for tapering or cessation of the current policy in Japan. Separate from the Bank of Japan’smonetary policies, interest rates could also significantly increase in the event that Japanese government bondsdecline in value due to such factors as a decline in confidence in the Japanese government’s fiscal administrationor further issuances of Japanese government bonds in connection with emergency economic measures or in theevent that interest rates on U.S. Treasury securities rise due to such factors as instability in the U.S. governmentbond market, additional issuances of U.S. government bonds, or changes in the monetary policy of the FederalReserve Board, or FRB, including an increase in the U.S. policy interest rate. If relevant interest rates increasefor these or other reasons, particularly if such increase is unexpected or sudden, we may incur significant losseson sales of, and valuation losses on, our bond portfolio. Furthermore, if short-term interest rates rise to a largerextent than long-term interest rates or long-term interest rates decline to a larger extent than short-term interestrates in the United States due to the monetary policy of the FRB, concerns over the U.S. economic outlook orother reason, our interest income may be adversely affected. See “Item 5. Operating and Financial Review andProspects—Business Environment.”
10
Fluctuations in foreign currency exchange rates may result in transaction losses on translation ofmonetary assets and liabilities denominated in foreign currencies as well as foreign currency translationlosses with respect to our foreign subsidiaries and equity method investees.
Fluctuations in foreign currency exchange rates against the Japanese yen create transaction gains or losseson the translation into Japanese yen of monetary assets and liabilities denominated in foreign currencies. To theextent that our foreign currency-denominated assets and liabilities are not matched in the same currency orappropriately hedged, we could incur losses due to future foreign exchange rate fluctuations. During the fiscalyear ended March 31, 2019, the average balance of our foreign interest-earning assets was ¥96,128.3 billion andthe average balance of our foreign interest-bearing liabilities was ¥61,443.6 billion, representing 39.8% of ouraverage total interest-earning assets and 26.2% of our average total interest-bearing liabilities during the sameperiod. Due to foreign currency exchange rate fluctuations, we may incur losses attributable to net transactionlosses on the translation into Japanese yen of monetary assets and liabilities denominated in foreign currencies,net losses on currency derivative instruments entered into for trading purposes, and net losses on translation intoJapanese yen of securities accounted for under the fair value option. In addition, we may incur foreign currencytranslation losses with respect to our foreign subsidiaries and equity method investees due to fluctuations inforeign currency exchange rates. The average exchange rate for the fiscal year ended March 31, 2019 was¥110.91 per U.S.$1.00, compared to ¥110.85 per U.S.$1.00 for the previous fiscal year. The change in theaverage exchange rate of the Japanese yen against the U.S. dollar and other foreign currencies had the effect ofdecreasing total revenue by ¥21.6 billion, net interest income by ¥9.3 billion and income before income taxexpense by ¥5.4 billion, respectively, while increasing the fair value of trading account securities accounted forunder the fair value option by ¥186.6 billion, for the fiscal year ended March 31, 2019. The Japanese yen was¥107.79 to the U.S. dollar on June 28, 2019. For more information on foreign exchange gains and losses andforeign currency translation gains and losses, see “Item 5. Operating and Financial Review and Prospects—Business Environment” and “Item 5.A. Operating and Financial Review and Prospects—Operating Results.”
If the Japanese stock market or other global markets decline in the future, we may incur losses on oursecurities portfolio and our capital ratios will be adversely affected.
A decline in Japanese stock prices could reduce the value of the Japanese domestic marketable equitysecurities that we hold, which accounted for 14.1% of our total investment securities portfolio, and 2.1% of ourtotal assets, as of March 31, 2019. The Nikkei Stock Average, which is the average of 225 blue chip stocks listedon the Tokyo Stock Exchange, fluctuated throughout the fiscal year ended March 31, 2019, rising to an intra-dayhigh of ¥24,448.07 on October 2, 2018, declining to an intra-day low of ¥18,948.58 on December 26, 2018, andrising again to ¥21,205.81 at the end of trading on March 29, 2019. As of June 28, 2019, the closing price of theNikkei Stock Average was ¥21,275.92. The Nikkei Stock Average has increased in recent periods, and mayfluctuate significantly and negatively in future periods, as the global economy remains volatile and investorscontinue to observe the changes in economic, monetary and trade policies mainly in Japan, the United States,China, the Eurozone and Asian countries. In addition, weakening or stagnant economic conditions in these andother regions may have a significant negative impact on Japanese companies, which in turn will cause their stockprices to decline. Concerns over the impact of geopolitical tensions and conflicts in various parts of the world onJapanese companies may also adversely affect stock prices in Japan. In addition, the global trend towards furtherreduction in risk assets could result in lower stock prices, and the recent trend in Japan towards strengtheningcorporate governance may subject public companies to stricter scrutiny. See “Item 5. Operating and FinancialReview and Prospects—Business Environment” and “Item 5.B. Operating and Financial Review and Prospects—Liquidity and Capital Resources—Investment Portfolio.”
We may become subject to regulatory actions or other legal proceedings relating to our transactions orother aspects of our operations, which could result in significant financial losses, restrictions on ouroperations and damage to our reputation.
We conduct our business subject to ongoing regulation and associated regulatory and legal risks. Globalfinancial institutions, including us, currently face heightened regulatory scrutiny as a result of the concerns
11

developing in the global financial sector, and growing public pressure to demand even greater regulatorysurveillance following several high-profile scandals and risk management failures in the financial industry. In thecurrent regulatory environment, we are subject to various regulatory inquiries or investigations from time to timein connection with various aspects of our business and operations. In addition, multiple government authoritieswith overlapping jurisdiction more frequently conduct investigations and take other regulatory actions incoordination with one another or separately on the same or related matters.
In November 2014, MUFG Bank entered into a consent agreement with the New York State Department ofFinancial Services, or DFS, to resolve issues relating to instructions given to PricewaterhouseCoopers LLP, orPwC, and the disclosures made to DFS in connection with MUFG Bank’s 2007 and 2008 voluntary investigationof MUFG Bank’s U.S. dollar clearing activity toward countries under U.S. economic sanctions. MUFG Bank hadhired PwC to conduct a historical transaction review report in connection with that investigation, and voluntarilysubmitted the report to DFS’s predecessor entity in 2008. Under the terms of the agreement with DFS, MUFGBank made a payment of $315 million to DFS, and agreed to take actions on persons involved in the matter atthat time, relocate its U.S. Bank Secrecy Act/Anti-Money Laundering, or BSA/AML, and Office of ForeignAssets Control, or OFAC, sanctions compliance programs to New York, and extend, if regarded as necessary byDFS, the period during which an independent consultant is responsible for assessing MUFG Bank’s internalcontrols regarding compliance with applicable laws and regulations related to U.S. economic sanctions. In June2013, MUFG Bank reached an agreement with DFS regarding inappropriate operational processing of U.S. dollarclearing transactions with countries subject to OFAC sanctions during the period of 2002 to 2007. Under theterms of the June 2013 agreement, MUFG Bank made a payment of $250 million to DFS and retained anindependent consultant to conduct a compliance review of the relevant controls and related matters in MUFGBank’s current operations. In December 2012, MUFG Bank agreed to make a payment of approximately$8.6 million to OFAC to settle potential civil liability for apparent violations of certain U.S. sanctions regulationsfrom 2006 to 2007.
On November 9, 2017, MUFG Bank entered into a Stipulation and Consent to the Issuance of a ConsentOrder with the U.S. Office of the Comptroller of the Currency, or OCC, under which MUFG Bank agreed to theentry by the OCC of a Consent Order that includes remedial terms and conditions that are substantively the sameas those included in the consent agreements that MUFG Bank had reached with DFS in June 2013 and November2014. This Consent Order, which the OCC executed, enables the OCC to supervise MUFG Bank’s plans toenhance its internal controls and compliance program relating to OFAC sanctions requirements. The Stipulationand Consent with the OCC followed MUFG’s conversion of the U.S. Branches and Agencies of MUFG Bank andMitsubishi UFJ Trust and Banking, including MUFG Bank’s New York Branch, from state-licensed branchesand agencies under the supervision of state regulatory agencies, including DFS, to federally licensed branchesand agencies under the supervision of the OCC. Although, MUFG Bank was engaged in litigation with DFS withregard to the conversion of its New York Branch license as well as purported violations of law alleged to haveoccurred prior to the federal license conversion, in June 2019, MUFG Bank entered into a settlement withNYDFS to resolve this litigation and made a settlement payment. In February 2019, MUFG Bank entered into aConsent Order with the OCC relating to deficiencies identified by the OCC in the Bank Secrecy Act/Anti-MoneyLaundering compliance program of MUFG Bank’s U.S. branches in New York, Los Angeles, and Chicago.MUFG Bank is undertaking necessary actions relating to these matters. See “Item 8.A. Financial Information—Consolidated Statements and Other Financial Information—Legal Proceedings.”
We have received requests and subpoenas for information from government agencies in some jurisdictionsthat are conducting investigations into past submissions made by panel members, including us, to the bodies thatset various interbank benchmark rates as well as investigations into foreign exchange related practices of globalfinancial institutions. Some of the investigations into foreign exchange related practices resulted in our paymentof monetary penalties to the relevant government agencies. We are cooperating with the ongoing investigationsand have been conducting an internal investigation, among other things. In connection with these matters, we andother financial institutions are involved as defendants in a number of civil lawsuits, including putative classactions, in the United States.
12
These developments or other similar matters may result in additional regulatory actions against us oragreements to make significant additional settlement payments. These developments or other matters to whichwe are subject from time to time may also expose us to substantial monetary damages, legal defense costs,criminal and civil liability, and restrictions on our business operations as well as damage to our reputation. Theoutcome of such matters, including the extent of the potential impact of any unfavorable outcome on ourfinancial results, however, is inherently uncertain and difficult to predict. The extent of financial, human andother resources required to conduct any investigations or to implement any corrective or preventive measures issimilarly uncertain and could be significant. Such resources may also be difficult for us to secure in a timelymanner.
Legal and regulatory changes could have a negative impact on our business, financial condition andresults of operations.
As a global financial services provider, our business is subject to ongoing changes in laws, regulations,rules, policies, voluntary codes of practice and interpretations in Japan and other markets where we operate.Major global financial institutions currently face an increasingly stricter set of laws, regulations and standards asa result of the concerns enveloping the global financial sector. There is also growing political pressure to demandeven greater internal compliance and risk management systems following several high-profile scandals and riskmanagement failures in the financial industry. We may not be able to enhance our compliance risk managementsystems and programs, which, in some cases, are supported by third-party service providers, in a timely manneror as planned. Our risk management systems and programs may not be fully effective in preventing all violationsof laws, regulations and rules applicable locally or on a global basis to our subsidiaries, offices and branches.
Our failure or inability to comply fully with applicable laws and regulations could lead to fines, publicreprimands, damage to reputation, civil liability, enforced suspension of operations or, in extreme cases,withdrawal of authorization to operate, adversely affecting our business and results of operations. Legal orregulatory compliance failure may also adversely affect our ability to obtain regulatory approvals for futurestrategic initiatives. Furthermore, failure to take necessary corrective action, or the discovery of violations oflaws in the process of further review of any of the matters mentioned above or in the process of implementingany corrective measures, could result in further regulatory action.
We could also be required to incur significant expenses to comply with new or revised regulations. Forexample, benchmark rate reforms may result in significant costs for making necessary adjustments to ourfinancial instruments and related operations and also in significant financial losses relating to instruments usingsuch rates. If we adopt a new information technology system infrastructure in the future, for instance, we may berequired to incur significant additional costs for establishing and implementing effective internal controls, whichmay materially and adversely affect our financial condition and results of operations.
Future developments or changes in laws, regulations, rules, policies, voluntary codes of practice and theireffects are expected to require greater capital, human and technological resources as well as significantmanagement attention, and may require us to modify our business strategies and plans. For example, we aresubject to new bank regulatory standards that were finalized as part of the reforms to “Basel III: A globalregulatory framework for more resilient banks and banking systems,” or Basel III, in December 2017. These newstandards include a minimum leverage ratio requirement, which became applicable to us in March 2019 andwhich is expected to be raised in 2022, as well as revisions to risk measurement approaches, which are expectedto be phased in from 2022. We also became subject to minimum total loss-absorbing capacity, or TLAC,requirements in March 2019, and the minimum requirements are expected to be raised in 2022. For moreinformation, see “—Risks Related to Our Business—We may not be able to maintain our capital ratios aboveminimum required levels, which could result in the suspension of some or all of our operations.” and “Item 4.B.Information on the Company—Business Overview—Supervision and Regulation—Japan.”
Furthermore, regulatory reforms recently implemented, proposed and currently being debated in theUnited States may also significantly affect our business operations. For example, in July 2016, we established
13
MUFG Americas Holdings as a U.S. intermediate holding company, or IHC, and reorganized our U.S. bank andnon-bank subsidiaries under MUFG Americas Holdings pursuant to rules adopted by the FRB in February 2014.Under the FRB rules, MUFG Americas Holdings is also subject to U.S. capital requirements, capital stresstesting, liquidity buffer requirements, and other enhanced prudential standards comparable to those applicable totop-tier U.S. bank holding companies of the same size. In April 2019, the FRB proposed modifications to suchrequirements and standards as applied to foreign banking organizations, which could result in stricterrequirements and standards for MUFG Americas Holdings. We are continuing to devote resources andmanagement attention on establishing an appropriate governance structure with effective internal control systemsfor MUFG Americas Holdings designed to ensure compliance with the rules on an on-going basis. See “Item 4.B.Information on the Company—Business Overview—Supervision and Regulation—United States.”
Any adverse changes in the business of MUFG Americas Holdings Corporation, a wholly ownedsubsidiary in the United States, could significantly affect our results of operations.
MUFG Americas Holdings, which is a wholly owned subsidiary in the United States formerly calledUnionBanCal Corporation, or UNBC, and which is our IHC in the United States, has historically contributed to asignificant portion of net income attributable to the Mitsubishi UFJ Financial Group. MUFG Americas Holdingsreported net income of $990 million, $1,077 million and $1,073 million for the fiscal years ended December 31,2016, 2017 and 2018 respectively. Any adverse developments which could arise at MUFG Americas Holdingsmay have a significant negative impact on our results of operations and financial condition. For moreinformation, see “Item 4.B. Information on the Company—Business Overview—Global Commercial BankingBusiness Group—MUFG Union Bank, N.A.”
Factors that have negatively affected, and could continue to negatively affect, MUFG Americas Holdings’results of operations include difficult economic conditions, such as a downturn in the real estate and housingindustries in the United States, particularly in California, the fiscal challenges being experienced by the U.S.federal and California state governments, substantial competition in the banking markets in the United States anduncertainty over the U.S. economy, as well as negative trends in debt ratings and interest rate uncertainties. Aswas the case in recent periods, declining oil and gas prices could adversely affect the credit conditions ofborrowers in the energy sector and related industries, resulting in an increase in credit costs. In addition, since thefinancial crisis in 2008 and 2009, the U.S. banking industry has operated in an extremely low interest rateenvironment as a result of the highly accommodative monetary policy of the FRB, which has placed downwardpressure on the net interest margins of U.S. banks, including MUFG Americas Holdings. Although the FRBgradually raised its policy interest rate between December 2015 and December 2018, interest rates have remainedat relatively low levels in the United States. Sudden fluctuations in interest rates may also negatively affectMUFG Americas Holdings’ results of operations.
Significant costs may arise from enterprise-wide compliance and risk management requirements under, orfailure to comply with, applicable laws and regulations, such as the U.S. Bank Secrecy Act and relatedamendments under the USA PATRIOT Act, and any adverse impact of the implementation of the Dodd-FrankAct. In addition, the FRB and other U.S. bank regulators have adopted rules to implement the Basel III globalregulatory framework for U.S. banks and bank holding companies which require higher quality of capital, as wellas significantly revise the calculations for risk-weighted assets. The FRB has also adopted rules to implementvarious enhanced prudential standards required by the Dodd-Frank Act for larger U.S. bank holding companies,such as MUFG Americas Holdings. These standards require the larger bank holding companies to meet enhancedcapital, liquidity and leverage standards. Further, the FRB has adopted regulations applicable to foreign bankingorganizations operating in the United States, which require MUFG’s and MUFG Bank’s U.S. operations to berestructured and, subject to certain exceptions, conducted under a single U.S. IHC, with its own capital andliquidity requirements. Actions management may take in response to these regulatory changes may involve theissuance of additional capital or other measures. For more information, see “Item 4.B. Information on theCompany—Business Overview—Supervision and Regulation—United States.”
14

MUFG Union Bank, which is the principal subsidiary of MUFG Americas Holdings, and reportedly otherfinancial institutions have been the targets of various denial-of-service or other cyber-attacks as part of whatappears to be a coordinated effort to disrupt the operations of financial institutions and potentially test theircybersecurity in advance of future and more advanced cyber-attacks. These denial-of-service attacks may requiresubstantial resources to defend against and affect customer satisfaction and behavior. Moreover, MUFG UnionBank’s information security measures may not be sufficient to defend against cyber-attacks and otherinformation security breaches, in which case the consequences could be significant in terms of financial,reputational and other losses. In addition, there have been increasing efforts to breach data security at financialinstitutions as well as other types of companies, such as large retailers, or with respect to financial transactions,including through the use of social engineering schemes such as “phishing.” Even if cyber-attacks and similartactics are not directed specifically at MUFG Union Bank, such attacks on other large institutions could disruptthe overall functioning of the U.S. or global financial system and undermine consumer confidence in banksgenerally to the detriment of other financial institutions, including MUFG Union Bank.
Any adverse changes in the business of Bank of Ayudhya, an indirect subsidiary in Thailand, or BankDanamon, an indirect subsidiary in Indonesia, could significantly affect our results of operations.
Any adverse changes in the business or management of Bank of Ayudhya Public Company Limited, orKrungsri, a strategic subsidiary in Thailand in which we hold a 76.88% ownership interest as of March 31, 2019,or PT Bank Danamon Indonesia, Tbk, or Bank Danamon, a strategic subsidiary in Indonesia in which we hold a94.1% ownership interest as of May 1, 2019, may negatively affect our financial condition and results ofoperations. Factors that may negatively affect the financial condition and results of operations of thesesubsidiaries include:
‰ adverse economic conditions, substantial competition in the banking industry, volatile political andsocial conditions, natural disasters including floods, terrorism and armed conflicts, restrictions underapplicable financial systems and regulations, or significant fluctuations in interest rates, foreigncurrency exchange rates, stock prices or commodity prices, in Southeast Asia, particularly in theirrespective home markets;
‰ the business performance of companies making investments in and entering into markets in theSoutheast Asian region, as well as the condition of economies, financial systems, laws and financialmarkets in the countries where such companies primarily operate;
‰ losses from legal proceedings involving them;
‰ credit rating downgrades and declines in stock prices of their borrowers, and bankruptcies of theirborrowers resulting from such factors;
‰ defaults on their loans to individuals; and
‰ costs incurred due to weaknesses in their internal controls and regulatory compliance systems or any oftheir subsidiaries.
As of March 31, 2019, the balance of goodwill associated with the acquisition of Krungsri, includingKrungsri’s acquisition of Hattha Kaksekar Limited, a microfinance institution in Cambodia, in September 2016,was ¥59.0 billion. In May 2019, we completed a series of transactions to increase our ownership interest in BankDanamon to 94.1%, as a result of which Bank Danamon became our consolidated subsidiary. If the business ofKrungsri or Bank Danamon deteriorates, we may be required to record impairment losses, which could have amaterial adverse effect on our results of operations and financial condition. See “—Risks Related to OurBusiness—If the goodwill recorded in connection with our acquisitions becomes impaired, we may be requiredto record impairment losses, which may adversely affect our financial results.”
15

Our strategy to expand the range of our financial products and services and the geographic scope of ourbusiness globally may fail if we are unable to anticipate or manage new or expanded risks that entail suchexpansion.
We continue to seek opportunities to expand the range of our products and services beyond our traditionalbanking, trust, and securities businesses, through development and introduction of new products and services orthrough acquisitions of or investments in financial institutions with products and services that complement ourbusiness. For example, we continue to seek opportunities to expand our business outside of Japan. In addition,the sophistication of financial products and services and management systems has been growing significantly inrecent years. As a result, we are exposed to new and increasingly complex risks, while market and regulatoryexpectations that we manage these risks properly continue to rise. Some of the activities that our subsidiaries areexpected to engage in, such as credit extension to less conventional assets and operations as well as derivativesand foreign currency trading, present substantial risks. In some cases, we have only limited experience with therisks related to the expanded range of these products and services. In addition, we may not be able to successfullydevelop or operate the necessary information technology systems. As a result, we may not be able to foresee therisks relating to new products and services.
As we expand the geographic scope of our business, we will also be exposed to risks that are unique toparticular jurisdictions or markets. For example, in an effort to further develop our operations in Asia, MUFGBank purchased 72.01% of the outstanding shares of Krungsri in December 2013 and acquired additional sharesin January 2015, increasing MUFG Bank’s ownership interest to 76.88%. MUFG Bank has also held anapproximately 20% equity interest in Vietnam Joint Stock Commercial Bank of Industry and Trade sinceDecember 2012 and a 20.0% equity interest in Security Bank Corporation in the Philippines since April 2016. Inaddition, MUFG Bank acquired 19.9% of the shares of common stock of PT Bank Danamon Indonesia, Tbk inDecember 2017 and increased its shareholding in the bank to 94.1% in May 2019. As we seek to enter newmarkets or jurisdictions, we often seek to collaborate with a local business partner by becoming a shareholder aswell as providing management expertise for the local market. In such circumstances, the local business partnermay have business interests that are inconsistent with our interests and, as a result, we may be unable to achievethe goals initially set out in our strategy for that market. In addition, we may be unable to staff our newlyexpanded operations with qualified individuals familiar with local legal and regulatory requirements and businesspractices, exposing us to legal, regulatory, operational and other risks.
Our risk management systems may prove to be inadequate and may not work in all cases or to the degreerequired locally and globally for all of our subsidiaries, offices and branches. The increasing market, credit,compliance and regulatory risks in relation to the expanding scope of our products, services and trading activitiesor expanding our business beyond our traditional markets, could result in us incurring substantial losses. Inaddition, our efforts to offer new products and services or penetrate new markets may not succeed if product ormarket opportunities develop more slowly than expected, if our new products and services are not well acceptedamong customers, if the profitability of opportunities is undermined by competitive pressures or regulatorylimitations, or if our planned acquisitions, investments or capital alliances are not approved by regulators. Formore information on our recent acquisition and investment transactions, see “Item 5. Operating and FinancialReview and Prospects—Recent Developments.”
Unanticipated economic changes in, and measures taken in response to such changes by, emergingmarket countries could result in additional losses.
We are increasingly active, through a network of branches and subsidiaries, in emerging market countries,particularly countries in Asia, Latin America, Central and Eastern Europe, and the Middle East. For example,based primarily on the domicile of the obligors, our assets in Europe, Asia and Oceania excluding Japan, andother areas excluding Japan and the United States, were ¥21,535.3 billion, ¥27,993.0 billion and¥11,642.7 billion, representing 7.1%, 9.2% and 3.8% of our total assets as of March 31, 2019, respectively. Theeconomies of emerging market countries can be volatile and susceptible to adverse changes and trends in the
16
global financial markets. For example, a decline in the value of local currencies of these countries couldnegatively affect the creditworthiness of some of our borrowers in these countries. The loans we have made toborrowers and banks in these countries are often denominated in U.S. dollars, euro or other foreign currencies.These borrowers often do not hedge the loans to protect against fluctuations in the values of local currencies. Adevaluation of the local currency would make it more difficult for a borrower earning income in that currency topay its debts to us and other foreign lenders. In addition, some countries in which we operate may attempt tosupport the value of their currencies by raising domestic interest rates. If this happens, the borrowers in thesecountries would have to devote more of their resources to repaying their domestic obligations, which mayadversely affect their ability to repay their debts to us and other foreign lenders. The limited credit availabilityresulting from these conditions may adversely affect economic conditions in some countries. This could cause afurther deterioration of the credit quality of borrowers and banks in those countries and cause us to incur furtherlosses. In addition, should there be excessively rapid economic growth and increasing inflationary pressure insome of the emerging market countries, such developments could adversely affect the wider regional and globaleconomies. Some emerging market countries may also change their monetary or other economic policies inresponse to economic and political instabilities or pressures, which are difficult to predict. See“Item 5.B. Operating and Financial Review and Prospects—Liquidity and Capital Resources—FinancialCondition.”
If our strategic alliance with Morgan Stanley fails, we could suffer financial or reputational loss.
We have a global strategic alliance with Morgan Stanley, under which we operate two joint venturesecurities companies in Japan, engage in joint corporate finance operations in the United States and pursue othercooperative opportunities. We hold approximately 24.0% of the voting rights in Morgan Stanley as of March 31,2019 and continue to hold approximately $521.4 million of perpetual non-cumulative non-convertible preferredstock with a 10% dividend. In addition, we currently have two representatives on Morgan Stanley’s board ofdirectors.
We initially entered into this strategic alliance in October 2008 with a view towards long-term cooperationwith Morgan Stanley, and currently plan to deepen the strategic alliance. However, due to any unexpectedchanges in social, economic or financial conditions, changes in the regulatory environment, or any failure tointegrate or share staff, products or services, or to operate, manage or implement the business strategy of thesecurities joint venture companies or other cooperative opportunities as planned, we may be unable to achievethe expected synergies from this alliance.
If our strategic alliance with Morgan Stanley is terminated, it could have a material negative impact on ourbusiness strategy, financial condition, and results of operations. For example, because we conduct our securitiesoperations in Japan through the joint venture companies we have with Morgan Stanley, such termination mayresult in our inability to attain the planned growth in this line of business.
In addition, with our current investment in Morgan Stanley, we have neither a controlling interest in, norcontrol over the business operations of Morgan Stanley. If Morgan Stanley makes any business decisions that areinconsistent with our interests, we may be unable to achieve the goals initially set out for the strategic alliance.Furthermore, although we do not control Morgan Stanley, given the magnitude of our investment, if MorganStanley encounters financial or other business difficulties due to adverse changes in the economy, regulatoryenvironment or other factors, we may suffer a financial loss on our investment or damage to our reputation. Forexample, we recorded an impairment loss of ¥579.5 billion on our investment in Morgan Stanley’s commonstock for the fiscal year ended March 31, 2012.
We apply equity method accounting to our investment in Morgan Stanley in our consolidated financialstatements. As a result, Morgan Stanley’s performance affects our results of operations, and Morgan Stanley hascontributed to a significant portion of our net income in recent periods. Rule 3-09 of Regulation S-X requiresMorgan Stanley’s financial statements to be included in this Annual Report. In addition fluctuations in Morgan
17

Stanley’s stock price or in our equity ownership interest in Morgan Stanley may cause us to recognize additionallosses on our investment in Morgan Stanley.
We may incur further losses as a result of financial difficulties relating to other financial institutions,both directly and through the effect they may have on the overall banking environment and on theirborrowers.
Declining asset quality, capital adequacy and other financial problems of domestic and foreign financialinstitutions, including banks, non-bank lending and credit institutions, securities companies and insurancecompanies, may lead to severe liquidity and solvency problems, which have in the past resulted in theliquidation, government control or restructuring of affected institutions. In addition, allegations or governmentalprosecution of improper trading activities or inappropriate business conduct of a specific financial institutioncould also negatively affect the public perception of other global financial institutions individually and the globalfinancial industry as a whole. These developments may adversely affect our financial results.
Financial difficulties relating to financial institutions could adversely affect us because we have extendedloans, some of which may need to be classified as impaired loans, to banks, securities companies, insurancecompanies and other financial institutions that are not our consolidated subsidiaries. Our loans to banks and otherfinancial institutions have been more than 10% of our total loans as of each year-end in the three fiscal yearsended March 31, 2019, with the percentage being 14.4% as of March 31, 2019. We may also be adverselyaffected because we are a shareholder of some other banks and financial institutions that are not our consolidatedsubsidiaries, including our shareholdings in Japanese regional banks and our 24.0% voting interest in MorganStanley as of March 31, 2019. If some of the financial institutions to which we have exposure experiencefinancial difficulties, we may need to provide financial support to them even when such support might not bewarranted from the perspective of our narrow economic interests because such institutions may be systemicallyimportant to the Japanese or global financial system.
We may also be adversely affected because we enter into transactions, such as derivative transactions, in theordinary course of business, with other banks and financial institutions as counterparties. For example, we enterinto credit derivatives with banks, broker-dealers, insurance companies and other financial institutions formanaging credit risk exposures, for facilitating client transactions, and for proprietary trading purposes. Thenotional amount of the protection we sold through these instruments was ¥3.22 trillion as of March 31, 2019.
In addition, financial difficulties relating to financial institutions could indirectly have an adverse effect onus because:
‰ we may be requested to participate in providing assistance to support distressed financial institutionsthat are not our consolidated subsidiaries;
‰ the government may elect to provide regulatory, tax, funding or other benefits to those financialinstitutions to strengthen their capital, facilitate their sale or otherwise, which in turn may increase theircompetitiveness against us;
‰ deposit insurance premiums could rise if deposit insurance funds prove to be inadequate;
‰ bankruptcies or government support or control of financial institutions could generally undermineconfidence in financial institutions or adversely affect the overall banking environment;
‰ failures or financial difficulties experienced by other financial institutions could result in additionalregulations or requirements that increase the cost of business for us; and
‰ negative media coverage of the financial industry, regardless of its accuracy and applicability to us,could affect customer or investor sentiment, harm our reputation and have a materially adverse effect onour business or the price of our securities.
18

Because of our loans to consumers and our shareholdings in companies engaged in consumer lending,changes in the business or regulatory environment for consumer finance companies in Japan may furtheradversely affect our financial results.
We have a large loan portfolio in the consumer lending industry as well as large shareholdings insubsidiaries and equity method investees in the consumer finance industry. Our domestic loans to consumersamount to approximately one-seventh of our total outstanding loans. Of this amount, the consumer loansprovided by Mitsubishi UFJ NICOS, Co., Ltd., which is our primary consumer financing subsidiary, were¥578.5 billion as of March 31, 2019, compared to ¥589.8 billion as of March 31, 2018.
Mitsubishi UFJ NICOS’s consumer loan portfolio has been adversely affected by a series of regulatoryreforms that were introduced in Japan between 2006 and 2010, which have negatively affected the domesticconsumer lending industry. In December 2006, the Japanese Diet passed legislation to reform the regulationsrelating to the consumer lending business, including amendments to the Act Regulating the Receipt ofContributions, the Receipt of Deposits, and Interest Rates, which, effective June 18, 2010, reduced the maximumpermissible interest rate from 29.2% per annum to 20% per annum. The regulatory reforms also includedamendments to the Money Lending Business Act, which, effective June 18, 2010, abolished the so-called “gray-zone interest.” Gray-zone interest refers to interest rates exceeding the limits stipulated by the Interest RateRestriction Act (between 15% per annum to 20% per annum depending on the amount of principal). Prior toJune 18, 2010, gray-zone interest was permitted under certain conditions set forth in the Money LendingBusiness Act. As a result of the regulatory reforms, all interest rates are now subject to the lower limits imposedby the Interest Rate Restriction Act, compelling lending institutions, including our consumer finance subsidiariesand equity method investees, to lower the interest rates they charge borrowers. The regulations that becameeffective on June 18, 2010 also have had a further negative impact on the business of consumer financecompanies as one of the new regulations requires, among other things, consumer finance companies to limit theirlending to a single customer to a maximum of one third of the customer’s annual income regardless of thecustomer’s repayment capability, significantly affecting consumer financing companies.
The regulations and regulatory reforms affecting the consumer finance business were one of the mainfactors that contributed to the decrease in interest income attributable to our consumer finance business. Ourinterest income attributable to the consumer finance business was approximately ¥190 billion and ¥160 billionfor the fiscal years ended March 31, 2009 and 2010, respectively. However, following the regulatory changes inJune 2010, our interest income attributable to the consumer finance business substantially decreased. For thefiscal year ended March 31, 2019, our interest income attributable to the consumer finance business wasapproximately ¥90 billion.
In addition, as a result of decisions by the Supreme Court of Japan prior to June 18, 2010 imposing stringentrequirements under the Money Lending Business Act for charging gray-zone interest rates, consumer financecompanies have experienced a significant increase in borrowers’ claims for reimbursement of previouslycollected interest payments in excess of the limits stipulated by the Interest Rate Restriction Act.
Following the various legal developments in June 2010 and other industry developments, Mitsubishi UFJNICOS revised its estimate of allowance for repayment of excess interest by updating management’s futureforecast to reflect new reimbursement claims information and other data. As of March 31, 2017, 2018 and 2019,we had ¥39.4 billion, ¥23.7 billion and ¥25.0 billion of allowance for repayment of excess interest, respectively.In recent periods, one of our equity method investees engaged in consumer lending, ACOM CO., LTD., had anegative impact on net equity in losses of equity method investees in our consolidated statements of income. Forexample, ACOM had a negative impact of ¥15.6 billion for the fiscal years ended March 31, 2019. We intend tocarefully monitor future developments and trends.
These developments have adversely affected, and these and any future developments may further adverselyaffect, the operations and financial condition of our subsidiaries, equity method investees and borrowers which
19
are engaged in consumer lending, which in turn may affect the value of our related shareholdings and loanportfolio.
Our business may be adversely affected by competitive pressures, which have partly increased due toregulatory changes and recent market changes in the financial industry domestically and globally.
In recent years, the Japanese financial system has been undergoing significant changes and regulatorybarriers to competition have been reduced. Development of new technologies such as artificial intelligence, orAI, and blockchain has also allowed non-financial institutions to enter the financial services industry withalternative services such as electronic settlement services, and these new entrants could become substantialcompetition to us. We may be at a competitive disadvantage if we are unable to build a business infrastructure fornew services through digitalization or otherwise as planned. In addition, mergers and restructuring in thefinancial sector in Japan may adversely affect our competitive position. Partly to deal with these developments,as part of our strategy to realign the functions of our subsidiaries, we transferred Mitsubishi UFJ Trust andBanking’s corporate and other loan-related business to MUFG Bank in April 2018. Our competitive position inthe corporate loan-related market may weaken if we are unable to realize the expected benefits of this and otherrealignment measures.
In the overseas markets, development of new technologies such as AI and blockchain has also allowednon-financial institutions to enter the financial services industry, and such new entrants could become substantialcompetition to us. Competition may further increase as U.S. and European financial institutions have recentlybeen regaining and enhancing their competitive strength. We also face intensifying competition in areas of ourstrategic expansion. For example, the Japanese mega banks, including us, and other major international bankshave been expanding their operations in the Asian market, where leading local banks have recently been growingand increasing their presence. In addition, there has been significant consolidation and convergence amongfinancial institutions domestically and globally, and this trend may continue in the future and further increasecompetition in the market. A number of large commercial banks and other broad-based financial services firmshave merged or formed strategic alliances with, or have acquired, other financial institutions both in Japan andoverseas. As a result of the strategic alliance and the joint venture companies that we formed with MorganStanley, we may be perceived as a competitor by some of the financial institutions with which we had a morecooperative relationship in the past. If we are unable to compete effectively in this more competitive andderegulated business environment, our business, results of operations and financial condition will be adverselyaffected. For a more detailed discussion of our competition in Japan, see “Item 4.B. Information on theCompany—Business Overview—Competition.”
Future changes in accounting standards or methods could have a negative impact on our business andresults of operations.
Future developments or changes in accounting standards are unpredictable and beyond our control. Forexample, in response to the recent instabilities in global financial markets, several international organizationswhich set accounting standards have released proposals to revise standards on accounting for financialinstruments. Accounting standards applicable to financial instruments remain subject to debate and revision byinternational organizations which set accounting standards. If the current accounting standards change in thefuture, the reported values of some of our financial instruments may need to be modified, and such modificationcould have a significant impact on our financial results or financial condition. In addition, the bodies thatinterpret the accounting standards may change their interpretations, or we may elect to modify our accountingmethods to improve our financial reporting, and such change or modification may also have a significant impacton our financial results or financial condition. For more information, see “Item 5. Operating and FinancialReview and Prospects—Critical Accounting Estimates.”
We could also be required to incur significant expenses to comply with new accounting standards andregulations. For example, if we adopt a new accounting system in the future, we may be required to incur
20

significant additional costs for establishing and implementing effective internal controls, which may materiallyand adversely affect our financial condition and results of operations.
Transactions with counterparties in countries designated by the U.S. Department of State as statesponsors of terrorism may lead some potential customers and investors in the United States and othercountries to avoid doing business with us or investing in our shares.
We, through our subsidiaries, engage in limited business activities with entities in or affiliated with Iran,including transactions with counterparties owned or controlled by the Iranian government, and our commercialbanking subsidiary has a representative office in Iran for information gathering purposes only. The U.S.Department of State has designated Iran and other countries as “state sponsors of terrorism,” and U.S. lawgenerally prohibits U.S. persons from doing business with such countries. We currently have limited businessactivities conducted with entities in or affiliated with such countries. Such business activities are conducted inaccordance with our policies and procedures designed to ensure compliance with regulations applicable in thejurisdictions in which we operate and with exemptions and general licenses available under U.S. law.
We have transactions with counterparties in or affiliated with countries designated as state sponsors ofterrorism which consist of receiving deposits or holding assets on behalf of individuals residing in Japan who arecitizens of countries designated as state sponsors of terrorism, processing payments to or from entities in oraffiliated with these countries on behalf of our customers, and issuing letters of credit and guarantees inconnection with transactions with entities in or affiliated with such countries by our customers. Thesetransactions do not have a material impact on our business or financial condition. For a further discussion oftransactions required to be disclosed under the U.S. Iran Threat Reduction and Syria Human Rights Act of 2012,see “Item 4.B. Information on the Company—Business Overview—Supervision and Regulation—United States—Disclosure pursuant to Section 13(r) of the Securities Exchange Act of 1934.”
We are aware of initiatives by U.S. governmental entities and non-government entities, includinginstitutional investors such as pension funds, to adopt or consider adopting laws, regulations or policiesprohibiting transactions with or investment in, or requiring divestment from, entities doing business with Iran andother countries identified as state sponsors of terrorism. It is possible that such initiatives may result in our beingunable to gain or retain entities subject to such prohibitions as customers, counter-parties or investors in ourshares. In addition, depending on socio-political developments, our reputation may suffer due to our transactionswith counterparties in or affiliated with these countries. The above circumstances could have an adverse effect onour business and financial condition.
Global financial institutions, including us, have become subject to an increasingly complex set of sanctionslaws and regulations in recent years, and this regulatory environment is expected to continue. Moreover, themeasures proposed or adopted vary across the major jurisdictions, increasing the cost and resources necessary todesign and implement an appropriate global compliance program. The U.S. federal government and some stategovernments in the United States have enacted legislation designed to limit economic and financial transactionswith Iran by limiting the ability of financial institutions that may have engaged in any one of a broad range ofactivities related to Iran to conduct various transactions in the relevant jurisdictions. In addition, in May 2018, theUnited States withdrew from participation in the Joint Comprehensive Plan of Action. Under subsequently issuedexecutive orders, the United States may impose secondary sanctions against non-U.S. persons who engage in orfacilitate a broad range of transactions and activities involving Iran. The Japanese government has alsoimplemented a series of measures under the Foreign Exchange and Foreign Trade Act, such as freezing the assetsof persons involved in Iran’s sensitive nuclear activities and development of nuclear weapon delivery systems,and our most recently modified policies and procedures take into account the current Japanese regulatoryrequirements. We continue to implement measures to enhance our policies and procedures to comply with suchlegislative and regulatory requirements. There remains a risk of potential regulatory action against us, however, ifregulators perceive the modified policies and procedures not to be in compliance with applicable legislation andregulations.
21

We may not be able to maintain our capital ratios and other regulatory ratios above minimum requiredlevels, which could result in various regulatory actions, including the suspension of some or all of ouroperations.
We, as a holding company, and our Japanese banking subsidiaries are required to maintain risk-weightedcapital ratios and leverage ratios above the levels specified in the guidelines adopted by the FSA to implementthe Basel III framework. As of March 31, 2019, our total risk-adjusted capital ratio was 16.03% compared to theminimum risk-adjusted capital ratio required of 12.04%, our Tier 1 capital ratio was 13.90% compared to theminimum Tier 1 capital ratio required of 10.04%, and our Common Equity Tier 1 capital ratio was 12.23%compared to the minimum Common Equity Tier 1 capital ratio required of 8.54%, each including a capitalconservation buffer of 2.50%, a G-SIB surcharge of 1.50% and a countercyclical buffer of 0.04%. As of the samedate, our leverage ratio was 4.94% compared to the minimum leverage ratio required of 3.00%. Our capital andleverage ratios are calculated in accordance with Japanese banking regulations based on information derivedfrom our financial statements prepared in accordance with Japanese GAAP.
The Financial Stability Board has identified us as one of G-SIBs. The banks that are included in the list ofG-SIBs are subject to a capital surcharge to varying degrees depending on the bucket to which each bank isallocated. As the list of G-SIBs is expected to be updated annually, we may be required to meet stricter capitalratio requirements.
In December 2017, the Basel Committee on Banking Supervision released the finalized Basel III reforms,which are designed, among other things, to improve various risk measurement approaches and add a leverageratio surcharge for G-SIBs, including us. The finalized risk measurement requirements will be phased in from2022 and the leverage ratio surcharge will become applicable in 2022.
If our or our Japanese banking subsidiaries’ capital ratios or leverage ratios fall below the required levels,including various capital buffers, the FSA may require us to take a variety of corrective actions, includingabstention from making capital distributions and suspension of all or a part of our business operations.
In addition, some of our banking subsidiaries are subject to the local capital adequacy ratio and otherregulatory ratio requirements of various foreign countries, including the United States, and if their ratios fallbelow the required levels, the local regulators will require them to take a variety of corrective actions.
Factors that will affect our and our bank subsidiaries’ capital ratios or leverage ratios include:
‰ fluctuations in our or our banking subsidiaries’ portfolios due to deterioration in the creditworthiness ofborrowers and the issuers of equity and debt securities;
‰ difficulty in refinancing or issuing instruments upon redemption or at maturity of such instruments toraise capital under terms and conditions similar to prior financings or issuances;
‰ declines in the value of our or our banking subsidiaries’ securities portfolios;
‰ adverse changes in foreign currency exchange rates;
‰ adverse revisions to the capital ratio and other regulatory ratio requirements;
‰ reductions in the value of our or our banking subsidiaries’ deferred tax assets; and
‰ other adverse developments.
Under the FSA guidelines discussed above, there is a transitional measure relating to the inclusion as acapital item of capital raising instruments issued in or prior to March 2013, and such instruments qualify, and canbe included, as a capital item when calculating capital ratios to the extent permitted by the transitional measure.Such capital raising instruments may require refinancing upon the expiration of the transition period duringwhich such instruments can qualify, and can be included, as a capital item in the calculation of capital ratios.
22
However, in order for newly issued capital raising instruments, other than common stock, to be included as acapital item in the calculation of capital ratios under the current FSA guidelines, such instruments must, amongother things, have a clause in their terms and conditions that requires them to be written off or converted intocommon stock upon the occurrence of certain events, including when the issuing financial institution is deemednon-viable or when the issuing financial institution’s capital ratios decline below prescribed levels. As a result,under certain market conditions, we may be unable to refinance or issue capital raising instruments under termsand conditions similar to those of capital raising instruments issued in or prior to March 2013. If suchcircumstances arise, our and our banking subsidiaries’ capital could be reduced, and our and our banksubsidiaries’ capital ratios and leverage ratios could decrease.
In March 2019, we became subject to the FSA’s new regulations requiring G-SIBs in Japan to maintaincertain minimum levels of capital and liabilities that are deemed to have loss-absorbing and recapitalizationcapacity, or External TLAC, and allocate a certain minimum level of External TLAC to any material subsidiarywithin their respective groups of companies, or Internal TLAC. As of March 31, 2019, we maintained 18.16% ofExternal TLAC on a risk-weighted assets basis compared to the required minimum ratio of 16.00% and 7.90% ofExternal TLAC on a leverage exposure basis compared to the required minimum ratio of 6.00%. The applicableminimum ratio requirements are expected to be raised to 18.00% on a risk-weighted assets basis and 6.75% on aleverage exposure basis on March 31, 2022. Within the MUFG Group, MUFG Bank, Mitsubishi UFJ Trust andBanking, Mitsubishi UFJ Morgan Stanley Securities Co., Ltd. and MUFG Americas Holdings are designated asour material subsidiaries. We may become subject to various regulatory actions, including restrictions on capitaldistributions, if we are unable to maintain our External TLAC ratios or the amount of Internal TLAC allocated toany of our material subsidiaries in Japan above the minimum levels required by the standards imposed by theFSA. Our External TLAC ratios and the amount of our Internal TLAC are affected by various factors that affectour capital ratios and leverage ratios described above. Although we plan to issue TLAC-qualified debt in aneffort to meet the minimum required levels of External TLAC ratios and Internal TLAC amounts, we may fail todo so if we are unable to issue or refinance TLAC-qualified debt as planned.
For a discussion of the applicable regulatory guidelines and our capital ratios, see “Item 4.B. Information onthe Company—Business Overview—Supervision and Regulation” and “Item 5.B. Operating and FinancialReview and Prospects—Liquidity and Capital Resources—Capital Adequacy.”
If the goodwill recorded in connection with our acquisitions becomes impaired, we may be required torecord impairment losses, which may adversely affect our financial results.
In accordance with U.S. GAAP, we account for our business combinations using the acquisition method ofaccounting. We recorded the excess of the purchase price over the fair value of the assets and liabilities of theacquired companies as goodwill. U.S. GAAP requires us to test goodwill for impairment at least annually, ormore frequently if events or changes in circumstances indicate that goodwill may be impaired. As of March 31,2019, the total balance of goodwill was ¥433.9 billion. As we expand our business through acquisitions andinvestments, we may record additional goodwill in connection with such acquisitions and investments, whichmay subsequently be impaired.
For the fiscal years ended March 31, 2016 and 2017, we recognized ¥4.3 billion and ¥6.6 billion,respectively, in impairment of goodwill relating to a reporting unit within the Trust Assets Business Groupsegment as we readjusted our future cash flow projection of the reporting unit in this segment, considering therelevant subsidiaries’ recent business performance. For the fiscal year ended March 31, 2016, we also recognized¥151.7 billion in impairment of goodwill relating to the reporting unit other than MUFG Americas Holdings andKrungsri within the Global Business Group segment as our stock price decreased from ¥743.7 on March 31, 2015to ¥521.5 on March 31, 2016. Our stock price was adversely impacted by the Bank of Japan’s announcement ofimplementation in January 2016 of the negative interest rate on certain current account amounts that financialinstitutions hold at the Bank of Japan, and the appreciation of the Japanese yen against other major currencies. Inaddition, we recognized ¥177.8 billion in impairment of goodwill relating to the Krungsri reporting unit within
23
the Global Business Group segment as Krungsri’s stock price declined from THB44.75 on December 31, 2014 toTHB29.75 on December 31, 2015. Krungsri’s stock price was adversely impacted by the slowing economicgrowth in Thailand. Accordingly, the fair values of these reporting units were considered to have fallen belowtheir carrying amounts. As a result, the carrying amounts of the reporting units’ goodwill exceeded the impliedfair values of the reporting units’ goodwill, and the impairment losses were recognized on the related goodwill.See “Item 5.B. Operating and Financial Review and Prospects—Operating Results—Impairment of goodwill.”
We may be required to record additional impairment losses relating to goodwill in future periods if the fairvalue of any of our reporting units declines below the fair value of related assets net of liabilities. Any additionalimpairment losses will negatively affect our financial results, and the price of our securities could be adverselyaffected. For a detailed discussion of our periodic testing of goodwill for impairment and the goodwill recorded,see “Item 5. Operating and Financial Review and Prospects—Critical Accounting Estimates—Accounting forGoodwill and Intangible Assets.”
A downgrade of our credit ratings could adversely affect our ability to access and maintain liquidity.
Any downgrade of the credit ratings assigned to us or our debt securities by Moody’s, Fitch, Standard &Poor’s or any other credit rating agency could increase the cost, or decrease the availability, of our funding,particularly in U.S. dollars and other foreign currencies, adversely affect our liquidity position or net interestmargin, trigger additional collateral or funding obligations, and result in losses of depositors, investors andcounterparties willing or permitted to transact with us, thereby reducing our ability to generate income andweakening our financial position.
Rating agencies regularly evaluate us and our major subsidiaries as well as our and their respective debtsecurities. Their ratings are based on a number of factors, including their assessment of the relative financialstrength of MUFG or of the relevant subsidiary, as well as conditions generally affecting the financial servicesindustry in Japan or on a global basis, some of which are not entirely within our control. As a result of changes intheir evaluation of these factors or in their rating methodologies, rating agencies may downgrade our ratings orour subsidiaries’ ratings.
In November 2017, Standard and Poor’s downgraded the long-term credit ratings of MUFG and MitsubishiUFJ Securities Holdings by one-notch from A to A-, the long-term credit ratings of MUFG Bank and MitsubishiUFJ Trust and Banking by one-notch from A+ to A, and the short-term credit rating of Mitsubishi UFJ SecuritiesHoldings by one-notch from A-1 to A-2.
Assuming all of the relevant credit rating agencies downgraded the credit ratings of MUFG, MUFG Bank,Mitsubishi UFJ Trust and Banking and Mitsubishi UFJ Securities Holdings by one-notch on March 31, 2019, weestimate that MUFG and its three main subsidiaries would have been required to provide additional collateralunder their derivative contracts as of the same date of approximately ¥25.5 billion. Assuming a two-notchdowngrade by all of the relevant credit rating agencies occurred on the same date, we estimate that the additionalcollateral requirements for MUFG, MUFG Bank, Mitsubishi UFJ Trust and Banking and Mitsubishi UFJSecurities Holdings under their derivative contracts as of the same date would have been approximately¥51.1 billion. For additional information on the impact of recent downgrades, see “Item 5.B. Operating andFinancial Review and Prospects—Liquidity and Capital Resources—Financial Condition—Sources of Fundingand Liquidity.”
Our business operations are exposed to risks of natural disasters, terrorism and other disruptions causedby external events.
As a major financial institution incorporated in Japan and operating in major international financial markets,our business operations, automatic teller machines, or ATMs, and other information technology systems,personnel, and facilities and other physical assets are subject to the risks of earthquakes, typhoons, floods and
24

other natural disasters, terrorism, and other political and social conflicts, abduction, health epidemics, and otherdisruptions caused by external events, which are beyond our control. As a consequence of such external events,we may be required to incur significant costs and expenses for remedial measures or compensation to customersor transaction counterparties for resulting losses. We may suffer loss of facility, human and other resources. Wemay also suffer loss of business. In addition, such external events may have various other significant adverseeffects, including deterioration in economic conditions, declines in the business performance of our borrowersand decreases in stock prices, which may result in higher credit costs or impairment or valuation losses on thefinancial instruments we hold. These effects could materially and adversely affect our business, operating resultsand financial condition.
As with other Japanese companies, we are exposed to heightened risks of large-scale natural disasters,particularly earthquakes. In particular, a large-scale earthquake occurring in the Tokyo metropolitan area couldresult in market disruptions or significant damage to, or losses of, tangible or human assets relating to ourbusiness and counterparties because many of our important business functions and many of the major Japanesecompanies and financial markets are located in the area. In addition, such an earthquake could cause a longer-term economic slowdown and a downgrade of Japan’s sovereign credit rating due to increases in governmentspending for disaster recovery measures.
Our risk management policies and procedures may be insufficient to address the consequences of theseexternal events, resulting in our inability to continue to operate a part or the whole of our business. In addition,our redundancy and backup measures may not be sufficient to avoid a material disruption in our operations, andour contingency and business continuity plans may not address all eventualities that may occur in the event of amaterial disruption caused by a large-scale natural disaster such as the March 2011 Great East Japan Earthquake,which led to tsunamis, soil liquefaction and fires, as well as electricity power supply shortages and electricitypower conservation measures resulting from the suspension of the operations of the nuclear power plants.
Failure to safeguard personal and other confidential information may result in liability, reputationaldamage or financial losses.
As our operations expand in volume, complexity and geographic scope, we are exposed to increased risk ofconfidential information in our possession being lost, leaked, altered or falsified as a result of human or systemerror, misconduct, unlawful behavior or scheme, unauthorized access or natural or human-caused disasters. Ourinformation systems and information management policies and procedures may not be sufficient to safeguardconfidential information against such risks.
As a financial institution in possession of customer information, we are obligated to treat personal and otherconfidential information as required by the Act on the Protection of Personal Information, the Act on the Use ofPersonal Identification Numbers in the Administration of Government Affairs, the Banking Law and theFinancial Instruments and Exchange Act of Japan, as well as other similar laws and regulations of otherjurisdictions in which we operate. In the event that personal information in our possession about our customers oremployees is leaked or improperly accessed and subsequently misused, we may be subject to liability andregulatory action. We may have to provide compensation for economic loss and emotional distress arising out ofa failure to protect such information. In addition, such incidents could create a negative public perception of ouroperations, systems or brand, which may in turn decrease customer and market confidence and materially andadversely affect our business, operating results and financial condition.
Moreover, any loss, leakage, alteration or falsification of confidential information, or any malfunction orfailure of our information systems, may result in significant disruptions to our business operations or plans ormay require us to incur significant financial, human and other resources to implement corrective measures orenhance our information systems and information management policies and procedures.
25

Our operations are highly dependent on our information, communications and transaction managementsystems and are subject to an increasing risk of cyber-attacks and other information security threats and tochanges in the business and regulatory environment.
Our information, communications and transaction management systems, which include not only our ownproprietary systems but also those third-party systems that are provided for our use or to which our systems areconnected, constitute a core infrastructure for our operations. Given our global operations with an extensivenetwork of branches and offices, the proper functioning of our information, communications and transactionmanagement systems is critical to our ability to efficiently and accurately process a large volume of transactions,ensure adequate internal controls, appropriately manage various risks, and otherwise service our clients andcustomers.
Cyber-attacks, unauthorized access and computer viruses are becoming increasingly more sophisticated andmore difficult to predict, detect and prevent. For instance, bank internal financial transaction systems orautomatic teller machines may become the target of cyber-attacks for monetary gain, and bank internalinformation systems may become the target of confidential information theft. In addition, banks’ websites orcustomer internet banking systems may become the target of cyber-attacks for political and other purposes. Thesecyber threats, as well as our failure to appropriately and timely anticipate and deal with changes associated withtechnological advances and new systems and tools introduced in response to industry, regulatory and otherdevelopments, could cause disruptions to, and malfunctions of, such systems and result in unintended releases ofconfidential and proprietary information stored in or transmitted through the systems, interruptions in theoperations of our clients, customers and counterparties, and deterioration in our ability to service our clients andcustomers. In addition, our banking and other transaction management systems may not meet all applicablebusiness and regulatory requirements in an environment where such requirements are becoming increasinglysophisticated and complicated. Furthermore, our system development or improvement projects, many of whichare critical to our ability to operate in accordance with market and regulatory standards, may not be completed asplanned due to the complexity and other difficulty relating to such projects. These consequences could result infinancial losses, including costs and expenses incurred in connection with countermeasures and improvements aswell as compensation to affected parties, lead to regulatory actions, diminish our clients’ and customers’satisfaction with and confidence in us, and harm our reputation in the market, which could in turn adverselyaffect our business, financial condition and results of operations. Moreover, significant financial, human andother resources may be required to design, implement and enhance measures to manage cyber and informationsecurity risks and comply with regulatory requirements.
Risks Related to Owning Our Shares
It may not be possible for investors to effect service of process within the United States upon us or ourdirectors or management members, or to enforce against us or those persons judgments obtained inU.S. courts predicated upon the civil liability provisions of the U.S. federal or state securities laws.
We are a joint stock company incorporated under the laws of Japan. Almost all of our directors ormanagement members reside outside the United States. Many of our assets and the assets of these persons arelocated in Japan and elsewhere outside the United States. It may not be possible, therefore, for U.S. investors toeffect service of process within the United States upon us or these persons or to enforce, against us or thesepersons, judgments obtained in the U.S. courts predicated upon the civil liability provisions of the U.S. federal orstate securities laws.
We believe there is doubt as to the enforceability in Japan, in original actions or in actions brought inJapanese courts to enforce judgments of U.S. courts, of claims predicated solely upon the U.S. federal or statesecurities laws mainly because the Civil Execution Act of Japan requires Japanese courts to deny requests for theenforcement of judgments of foreign courts if foreign judgments fail to satisfy the requirements prescribed by theCivil Execution Act, including:
‰ the jurisdiction of the foreign court be recognized under laws, regulations, treaties or conventions;
26

‰ proper service of process be made on relevant defendants, or relevant defendants be given appropriateprotection if such service is not received;
‰ the judgment and proceedings of the foreign court not be repugnant to public policy as applied in Japan;and
‰ there exist reciprocity as to the recognition by a court of the relevant foreign jurisdiction of a finaljudgment of a Japanese court.
Judgments obtained in the U.S. courts predicated upon the civil liability provisions of the U.S. federal orstate securities laws may not satisfy these requirements.
Risks Related to Owning Our American Depositary Shares
As a holder of American Depositary Shares, you have fewer rights than a shareholder of record in ourshareholder register since you must act through the depositary to exercise these rights.
The rights of our shareholders under Japanese law to take actions such as voting, receiving dividends anddistributions, bringing derivative actions, examining our accounting books and records and exercising appraisalrights are available only to shareholders of record. Because the depositary, through its custodian, is the recordholder of the shares underlying the American Depositary Shares, or ADSs, only the depositary can exerciseshareholder rights relating to the deposited shares. ADS holders, in their capacity, will not be able to directlybring a derivative action, examine our accounting books and records and exercise appraisal rights. We haveappointed The Bank of New York Mellon as depositary, and we have the authority to replace the depositary.
Pursuant to the deposit agreement among us, the depositary and a holder of ADSs, the depositary will makeefforts to exercise voting or any other rights associated with shares underlying ADSs in accordance with theinstructions given by ADS holders, and to pay to ADS holders dividends and distributions collected from us.However, the depositary can exercise reasonable discretion in carrying out the instructions or makingdistributions, and is not liable for failure to do so as long as it has acted in good faith. Therefore, ADS holdersmay not be able to exercise voting or any other rights in the manner that they had intended, or may lose some orall of the value of the dividends or the distributions. Moreover, the depositary agreement that governs theobligations of the depositary may be amended or terminated by us and the depositary without ADS holders’consent, notice, or any reason. As a result, ADS holders may be prevented from having the rights in connectionwith the deposited shares exercised in the way ADS holders had wished or at all.
ADS holders are dependent on the depositary to receive our communications. We send to the depositary allof our communications to ADS holders, including annual reports, notices and voting materials, in Japanese.ADS holders may not receive all of our communications with shareholders of record in our shareholder registerin the same manner or on an equal basis. In addition, ADS holders may not be able to exercise their rights asADS holders due to delays in the depositary transmitting our shareholder communications to ADS holders. For adetailed discussion of the rights of ADS holders and the terms of the deposit agreement, see Exhibit 2(c) to thisAnnual Report.
27
Item 4. Information on the Company.
A. History and Development of the Company
Mitsubishi UFJ Financial Group, Inc.
MUFG is a bank holding company incorporated as a joint stock company (kabushiki kaisha) under theCompanies Act of Japan. We are the holding company for MUFG Bank, Ltd. (formerly, The Bank of Tokyo-Mitsubishi UFJ, Ltd.), Mitsubishi UFJ Trust and Banking Corporation, Mitsubishi UFJ Securities Holdings Co.,Ltd., Mitsubishi UFJ Morgan Stanley Securities Co., Ltd., Mitsubishi UFJ NICOS Co., Ltd., and other companiesengaged in a wide range of financial businesses.
On April 2, 2001, The Bank of Tokyo-Mitsubishi, Ltd., Mitsubishi Trust and Banking Corporation, orMitsubishi Trust Bank, and Nippon Trust and Banking Co., Ltd. established Mitsubishi Tokyo Financial Group,Inc., or MTFG, to be a holding company for the three entities. Before that, each of the banks had been a publiclytraded company. On April 2, 2001, through a stock-for-stock exchange, they became wholly-owned subsidiariesof MTFG, and the former shareholders of the three banks became shareholders of MTFG. Nippon Trust andBanking was later merged into Mitsubishi Trust Bank.
On June 29, 2005, the merger agreement between MTFG and UFJ Holdings, Inc. was approved at thegeneral shareholders meetings of MTFG and UFJ Holdings. As the surviving entity, MTFG was renamed“Mitsubishi UFJ Financial Group, Inc.” The merger of the two bank holding companies was completed onOctober 1, 2005.
On September 30, 2007, Mitsubishi UFJ Securities Holdings, which was then called “Mitsubishi UFJSecurities Co., Ltd.,” or MUS, became our wholly-owned subsidiary through a share exchange transaction.
On October 13, 2008, we formed a global strategic alliance with Morgan Stanley and, as part of the alliance,made an equity investment in Morgan Stanley in the form of convertible and non-convertible preferred stock, andsubsequently appointed a representative to Morgan Stanley’s board of directors.
On October 21, 2008, we completed a tender offer for outstanding shares of ACOM CO., LTD. commonstock, raising our ownership in ACOM to approximately 40%.
On November 4, 2008, Bank of Tokyo-Mitsubishi UFJ completed the acquisition of all of the shares ofcommon stock of UnionBanCal Corporation, or UNBC, not previously owned by Bank of Tokyo-Mitsubishi UFJand, as a result, UNBC became a wholly-owned indirect subsidiary of MUFG.
On May 1, 2010, we and Morgan Stanley integrated our securities and investment banking businesses inJapan into two joint venture securities companies, one of which is Mitsubishi UFJ Morgan Stanley Securities.Mitsubishi UFJ Morgan Stanley Securities was created by spinning off the wholesale and retail securitiesbusinesses conducted in Japan from Mitsubishi UFJ Securities Holdings and subsequently assuming certainoperations in Japan from a subsidiary of Morgan Stanley.
On June 30, 2011, we converted all of our Morgan Stanley’s convertible preferred stock into MorganStanley’s common stock, resulting in our holding approximately 22.4% of the voting rights in Morgan Stanley.Further, we appointed a second representative to Morgan Stanley’s board of directors on July 20, 2011.Following the conversion on June 30, 2011, Morgan Stanley became our equity-method affiliate. As ofMarch 31, 2019, we held approximately 24.0% of the voting rights in Morgan Stanley and had tworepresentatives appointed to Morgan Stanley’s board of directors. We and Morgan Stanley continue to pursue avariety of business opportunities in Japan and abroad in accordance with the global strategic alliance.
On December 18, 2013, we acquired approximately 72.0% of the total outstanding shares of Krungsrithrough Bank of Tokyo-Mitsubishi UFJ. As a result of the transaction, Krungsri has become a consolidatedsubsidiary of Bank of Tokyo-Mitsubishi UFJ.
28
On July 1, 2014, we integrated Bank of Tokyo-Mitsubishi UFJ’s operations in the Americas region withUNBC’s operations, and changed UNBC’s corporate name to “MUFG Americas Holdings Corporation.” On thesame day, Union Bank, N.A., which is MUFG Americas Holdings’ principal subsidiary and our primaryoperating subsidiary in the United States, was also renamed “MUFG Union Bank, N.A..” On July 1, 2016,MUFG Americas Holdings was designated as our U.S. intermediate holding company to comply with the FRB’senhanced prudential standards.
On January 5, 2015, Bank of Tokyo-Mitsubishi UFJ integrated its Bangkok branch with Krungsri through acontribution in kind of the Bank of Tokyo-Mitsubishi UFJ Bangkok branch business to Krungsri, and Bank ofTokyo-Mitsubishi UFJ received newly issued shares of Krungsri common stock. As a result of this transaction,Bank of Tokyo-Mitsubishi UFJ’s ownership interest in Krungsri increased to 76.9%.
On October 1, 2017, we acquired all of the shares of common stock of Mitsubishi UFJ NICOS which we didnot previously own and, as a result, Mitsubishi UFJ NICOS became a wholly-owned subsidiary of MUFG.
On December 29, 2017, Bank of Tokyo-Mitsubishi UFJ initially acquired 19.9% of the shares of commonstock of PT Bank Danamon Indonesia, Tbk. On May 1, 2019, MUFG Bank, Ltd. completed a series oftransactions to increase its ownership interest in Bank Danamon to 94.1%, as a result of which Bank Danamonbecame MUFG Bank’s consolidated subsidiary.
On April 1, 2018, we changed Bank of Tokyo-Mitsubishi UFJ’s corporate name to “MUFG Bank, Ltd.”
On April 16, 2018, we transferred Mitsubishi UFJ Trust and Banking’s corporate loan-related businesses toMUFG Bank. The corporate loan-related businesses include the corporate loan, project finance and real estatefinance businesses, and any related foreign exchange and remittance services, but do not include pension-relatedservices, the corporate agency business, or the real estate-related businesses.
On October 31, 2018, Mitsubishi UFJ Trust and Banking entered into a Share Sale Deed withCommonwealth Bank of Australia, or CBA, and its wholly-owned subsidiary Colonial First State Group Limited,or CFSGL, to acquire 100% of the shares in each of nine subsidiaries of CFSGL, which collectively representCBA’s global asset management business known as Colonial First State Global Asset Management, orCFSGAM, from CFSGL for an aggregate purchase price of approximately AU$4.0 billion, or ¥328 billion,subject to certain conditions precedent, including required regulatory approvals.
On March 1, 2019, MUFG Bank agreed with DVB Bank SE in Germany to acquire DVB Bank’s aviationfinance business, subject to regulatory approvals other conditions. The transaction is expected to be completedduring the second half of the fiscal year ending March 31, 2020.
Our registered address is 7-1, Marunouchi 2-chome, Chiyoda-ku, Tokyo 100-8330, Japan, and our telephonenumber is 81-3-3240-8111.
For a discussion of recent developments, see “Item 5. Operating and Financial Review and Prospects—Recent Developments.”
MUFG Bank, Ltd.
MUFG Bank is a major commercial banking organization in Japan that provides a broad range of domesticand international banking services from its offices in Japan and around the world. MUFG Bank’s registered headoffice is located at 7-1, Marunouchi 2-chome, Chiyoda-ku, Tokyo 100-8388, Japan, and its telephone number is81-3-3240-1111. MUFG Bank is a joint stock company (kabushiki kaisha) incorporated in Japan under theCompanies Act. The bank changed its name to MUFG Bank, Ltd. from The Bank of Tokyo-Mitsubishi UFJ, Ltd.as of April 1, 2018.
29
MUFG Bank was formed through the merger, on January 1, 2006, of Bank of Tokyo-Mitsubishi and UFJBank Limited after their respective parent companies, MTFG and UFJ Holdings, merged to form MUFG onOctober 1, 2005.
Bank of Tokyo-Mitsubishi was formed through the merger, on April 1, 1996, of The Mitsubishi Bank,Limited and The Bank of Tokyo, Ltd.
The origins of Mitsubishi Bank can be traced to the Mitsubishi Exchange Office, a money exchange houseestablished in 1880 by Yataro Iwasaki, the founder of the Mitsubishi industrial, commercial and financial group.In 1895, the Mitsubishi Exchange Office was succeeded by the Banking Division of the Mitsubishi GoshiKaisha, the holding company of the “Mitsubishi group” of companies. Mitsubishi Bank had been a principalbank to many of the Mitsubishi group companies but broadened its relationships to cover a wide range ofJapanese industries, small and medium-sized companies and individuals.
Bank of Tokyo was established in 1946 as a successor to The Yokohama Specie Bank, Ltd., a specialforeign exchange bank established in 1880. When the government of Japan promulgated the Foreign ExchangeBank Law in 1954, Bank of Tokyo became the only bank licensed under that law. Because of its license, Bank ofTokyo received special consideration from the Ministry of Finance in establishing its offices abroad and in manyother aspects relating to foreign exchange and international finance.
UFJ Bank was formed through the merger, on January 15, 2002, of The Sanwa Bank, Limited and TheTokai Bank, Limited.
Sanwa Bank was established in 1933 when the three Osaka-based banks, the Konoike Bank, the YamaguchiBank, and the Sanjyushi Bank merged. Sanwa Bank was known as a city bank having the longest history inJapan, since the foundation of Konoike Bank can be traced back to the Konoike Exchange Office established in1656. The origin of Yamaguchi Bank was also a money exchange house, established in 1863. Sanjyushi Bankwas founded by influential fiber wholesalers in 1878. The corporate philosophy of Sanwa Bank had been thecreation of premier banking services especially for small and medium-sized companies and individuals.
Tokai Bank was established in 1941 when the three Nagoya-based banks, the Aichi Bank, the Ito Bank, andthe Nagoya Bank merged. In 1896, Aichi Bank took over businesses of the Jyuichi Bank established bywholesalers in 1877 and the Hyakusanjyushi Bank established in 1878. Ito Bank and Nagoya Bank wereestablished in 1881 and 1882, respectively. Tokai Bank had expanded the commercial banking business tocontribute to economic growth mainly of the Chubu area in Japan, which is known for its manufacturingindustries, especially automobiles.
Mitsubishi UFJ Trust and Banking Corporation
Mitsubishi UFJ Trust and Banking is a major trust bank in Japan, providing trust and banking services tomeet the financing and investment needs of clients in Japan and the rest of Asia, as well as in the United Statesand Europe. Mitsubishi UFJ Trust and Banking’s registered head office is located at 4-5, Marunouchi 1-chome,Chiyoda-ku, Tokyo 100-8212, Japan, and its telephone number is 81-3-3212-1211. Mitsubishi UFJ Trust andBanking is a joint stock company (kabushiki kaisha) incorporated in Japan under the Companies Act.
Mitsubishi UFJ Trust and Banking was formed on October 1, 2005 through the merger of Mitsubishi TrustBank and UFJ Trust Bank Limited. As the surviving entity, Mitsubishi Trust Bank was renamed “Mitsubishi UFJTrust and Banking Corporation.”
Mitsubishi Trust Bank traces its history to The Mitsubishi Trust Company, Limited, which was founded bythe leading members of the Mitsubishi group companies in 1927. The Japanese banking and financial industrywas reconstructed after World War II and, in 1948, Mitsubishi Trust Bank was authorized to engage in thecommercial banking business, in addition to its trust business, under the new name Asahi Trust & BankingCorporation. In 1952, the bank changed its name again to “The Mitsubishi Trust and Banking Corporation.”
30

Nippon Trust and Banking and The Tokyo Trust Bank, Ltd., which were previously subsidiaries of Bank ofTokyo-Mitsubishi, was merged into Mitsubishi Trust Bank on October 1, 2001.
UFJ Trust Bank was founded in 1959 as The Toyo Trust & Banking Company, Limited, or Toyo TrustBank. The Sanwa Trust & Banking Company, Limited, which was a subsidiary of Sanwa Bank, was merged intoToyo Trust Bank on October 1, 1999. The Tokai Trust & Banking Company, Limited, which was a subsidiary ofTokai Bank, was merged into Toyo Trust Bank on July 1, 2001. Toyo Trust Bank was renamed “UFJ Trust BankLimited” on January 15, 2002.
Mitsubishi UFJ Securities Holdings Co., Ltd.
Mitsubishi UFJ Securities Holdings is a wholly-owned subsidiary of MUFG. Mitsubishi UFJ SecuritiesHoldings functions as an intermediate holding company of MUFG’s global securities and investment bankingbusinesses. Mitsubishi UFJ Securities Holdings’ registered head office is located at 5-2, Marunouchi 2-chome,Chiyoda-ku, Tokyo 100-0005, Japan, and its telephone number is 81-3-6213-2550. Mitsubishi UFJ SecuritiesHoldings is a joint stock company (kabushiki kaisha) incorporated in Japan under the Companies Act. MitsubishiUFJ Securities Holdings has major overseas operating entities in London, New York, Hong Kong and Singapore.In March 2019, Mitsubishi UFJ Securities Holdings established a new indirect subsidiary, MUFG Securities(Europe) N.V., in Amsterdam and opened a new branch in Paris to provide securities services to its clients acrossEurope.
In April 2010, Mitsubishi UFJ Securities Holdings, which was previously called “Mitsubishi UFJ SecuritiesCo., Ltd.,” or MUS, became an intermediate holding company by spinning off its securities and investmentbanking business operations to a wholly-owned operating subsidiary established in December 2009, currentlyMitsubishi UFJ Morgan Stanley Securities Co., Ltd. Upon the consummation of the corporate spin-offtransaction, the intermediate holding company was renamed “Mitsubishi UFJ Securities Holdings Co., Ltd.” andthe operating subsidiary was renamed “Mitsubishi UFJ Securities Co., Ltd.” The operating subsidiary wassubsequently renamed Mitsubishi UFJ Morgan Stanley Securities in May 2010 upon integration of our securitiesoperations in Japan with those of Morgan Stanley.
MUS was formed through the merger between Mitsubishi Securities Co., Ltd. and UFJ TsubasaSecurities Co., Ltd. on October 1, 2005, with Mitsubishi Securities being the surviving entity. The survivingentity was renamed “Mitsubishi UFJ Securities Co., Ltd.” and, in September 2007, became our wholly-ownedsubsidiary through a share exchange transaction.
Mitsubishi Securities was formed in September 2002 through the merger of Bank of Tokyo-Mitsubishi’ssecurities subsidiaries and affiliate, KOKUSAI Securities Co., Ltd., Tokyo-Mitsubishi Securities Co., Ltd. andTokyo-Mitsubishi Personal Securities Co., Ltd., and Mitsubishi Trust Bank’s securities affiliate, IsseiSecurities Co., Ltd. In July 2005, MTFG made Mitsubishi Securities a directly-held subsidiary by acquiring all ofthe shares of Mitsubishi Securities common stock held by Bank of Tokyo-Mitsubishi and Mitsubishi Trust Bank.
Mitsubishi UFJ Morgan Stanley Securities Co., Ltd.
Mitsubishi UFJ Morgan Stanley Securities is our core securities and investment banking subsidiary.Mitsubishi UFJ Morgan Stanley Securities was created in May 2010 as one of the two Japanese joint venturesecurities companies between Morgan Stanley and us as part of our global strategic alliance. Mitsubishi UFJMorgan Stanley Securities succeeded to the investment banking operations conducted in Japan by a subsidiary ofMorgan Stanley and the wholesale and retail securities businesses conducted in Japan by MUS. MUFG, throughMitsubishi UFJ Securities Holdings, holds 60% voting and economic interests in Mitsubishi UFJ Morgan StanleySecurities. Mitsubishi UFJ Morgan Stanley Securities’ registered head office is located at 5-2 Marunouchi2-chome, Chiyoda-ku, Tokyo, 100-0005 Japan, and its telephone number is 81-3-6213-8500. Mitsubishi UFJMorgan Stanley Securities is a joint stock company (kabushiki kaisha) incorporated in Japan under theCompanies Act.
31
In April 2019, Mitsubishi UFJ Morgan Stanley Securities and Mitsubishi UFJ Morgan Stanley PB SecuritiesCo., Ltd., a subsidiary of Mitsubishi UFJ Morgan Stanley Securities holding 75% of its shares with the remaining25% held by MUFG Bank, agreed on a merger whereby Mitsubishi UFJ Morgan Stanley Securities will be thesurviving company. In connection with the planned merger, MUFG Bank is expected to transfer its 25% equityinterest in Mitsubishi UFJ Morgan Stanley PB Securities to Mitsubishi UFJ Morgan Stanley Securities.
For more information on our joint venture securities companies, see “—B. Business Overview—GlobalStrategic Alliance with Morgan Stanley.”
Mitsubishi UFJ NICOS Co., Ltd.
Mitsubishi UFJ NICOS is a major credit card company in Japan that issues credit cards, including thoseissued under the MUFG, NICOS and DC brands, and provides a broad range of credit card and other relatedservices for its card members in Japan. Mitsubishi UFJ NICOS is a consolidated subsidiary of MUFG. MitsubishiUFJ NICOS’s registered head office is located at 33-5, Hongo 3-chome, Bunkyo-ku, Tokyo 113-8411, Japan, andits telephone number is 81-3-3811-3111. Mitsubishi UFJ NICOS is a joint stock company (kabushiki kaisha)incorporated in Japan under the Companies Act.
On August 1, 2008, Mitsubishi UFJ NICOS became a wholly-owned subsidiary of MUFG through a shareexchange transaction. On the same day, we entered into a share transfer agreement with Norinchukin Bank underwhich we sold some of our shares of Mitsubishi UFJ NICOS common stock to Norinchukin Bank. In March2011, we and Norinchukin Bank made additional equity investments in Mitsubishi UFJ NICOS in proportion toour and Norinchukin Bank’s respective beneficial ownership of approximately 85% and 15%, respectively. OnOctober 1, 2017, MUFG acquired all of Norinchukin Bank’s ownership interest in Mitsubishi UFJ NICOS and,as a result, Mitsubishi UFJ NICOS is currently a wholly-owned subsidiary of MUFG.
Mitsubishi UFJ NICOS was formed through the merger, on April 1, 2007, of UFJ NICOS Co., Ltd. andDC Card Co., Ltd. As the surviving entity, UFJ NICOS Co., Ltd. was renamed “Mitsubishi UFJ NICOS Co.,Ltd.”
UFJ NICOS was formed through the merger, on October 1, 2005, of Nippon Shinpan Co., Ltd. andUFJ Card Co., Ltd. Originally founded in 1951 and listed on the Tokyo Stock Exchange in 1961, Nippon Shinpanwas a leading company in the consumer credit business in Japan. Nippon Shinpan became a subsidiary of MUFGat the time of the merger with UFJ Card.
Prior to the merger between MTFG and UFJ Holdings in October 2005, DC Card was a subsidiary of MTFGwhile UFJ Card was a subsidiary of UFJ Holdings.
32
B. Business Overview
We are one of the world’s largest and most diversified financial groups with total assets of ¥305.23 trillionas of March 31, 2019. The Group is comprised of MUFG Bank, Mitsubishi UFJ Trust and Banking, MitsubishiUFJ Morgan Stanley Securities (through Mitsubishi UFJ Securities Holdings), Mitsubishi UFJ NICOS and othersubsidiaries and affiliates, for which we are the holding company. As a bank holding company, we are regulatedunder the Banking Law of Japan. Our services include commercial banking, trust banking, securities, creditcards, consumer finance, asset management, leasing and many more fields of financial services. In Japan, weoperate through approximately 600 business locations as of March 31, 2019. In addition, as of the same date, theGroup had the largest overseas network among Japanese banks, consisting of approximately 1,200 businesslocations in more than 50 countries.
MUFG’s role as the holding company is to strategically manage and coordinate the activities of our businessgroups. Group-wide strategies are determined by the holding company and executed by our subsidiaries.
In May 2017, we announced “MUFG Re-Imaging Initiative” which was designed to achieve sustainablegrowth and enhance our corporate value through various measures, including an integrated group-basedmanagement approach and digitization and other technological enhancements. The measures also includedrealignment of the functions of our subsidiaries in an effort to increase effectiveness in accumulating andapplying the expertise within the Group and to enhance efficiency in offering and providing a diverse array ofsophisticated financial products and services to customers through collaboration among our subsidiaries. In May2017, Mitsubishi UFJ Trust and Banking acquired MUFG Bank’s equity interest in Mitsubishi UFJ InvestorServices & Banking (Luxembourg) S.A to make the Luxembourg company its wholly owned subsidiary. In April2018, Mitsubishi UFJ Trust and Banking acquired MUFG Bank’s equity interest and Mitsubishi UFJ SecuritiesHoldings’ equity interest in Mitsubishi UFJ Kokusai Asset Management Co., Ltd. to make the asset managementcompany its wholly owned subsidiary. As a result, Mitsubishi UFJ Trust and Banking operates as the Group’sprimary asset management and administration subsidiary. In April 2018, Mitsubishi UFJ Trust and Bankingtransferred its corporate loan-related businesses to MUFG Bank as part of an initiative to focus the corporateloan-related businesses within the Group at MUFG Bank. In addition, in April 2019, Mitsubishi UFJ MorganStanley Securities and Mitsubishi UFJ Morgan Stanley PB Securities Co., Ltd. agreed on a merger, wherebyMitsubishi UFJ Morgan Stanley Securities will be the surviving company, with an aim to strengthen our wealthmanagement business.
In May 2018, we announced our new medium-term business plan for the three-year period endingMarch 31, 2021, which is discussed below in this Item 4.B. As part of our new medium-term business plan, wehave reorganized our business groups in an effort to further integrate the expertise and capabilities of oursubsidiaries to respond to the needs of our customers more effectively and efficiently.
Medium-Term Business Plan
Basic Company Policy
Under the current medium-term business plan for the three-year period ending March 31, 2021, we aim todeliver optimal value to all of our stakeholders through simple, speedy and transparent group-integratedoperations.
We are seeking to improve our group management approach by shifting from our previous groupcollaboration and group-driven management approach to a new integrated group-based management approach.Specifically, in an effort to respond to constantly changing customer needs in an appropriate manner, we havereorganized our business groups into new customer-based business groups as discussed below. At the same time,we are seeking to clarify the roles of group companies through functional realignment, product and servicequality enhancement as well as solutions capability improvement.
33
We intend to deploy management resources necessary for achieving these goals with an enhanced focusduring the three-year period, particularly during the first half of the period. During this three-year period, we willseek to lay a solid foundation for a new future-oriented business platform. We aim to establish a new businessgrowth model which meets our stakeholders’ expectations by the end of the fiscal year ending March 31, 2024.
MUFG’s Vision ~ Our Corporate Vision Beyond “Re-Imagining” Initiative
We aim to deliver the best value to all stakeholders through simple, speedy andtransparent* group-integrated operations. Also, we will contribute to the realizationof sustainable growth and a better society by promoting solution-oriented business.
(1) Engage in the needs and issues of customers and society, and provide optimized solutions.(2) Redefine ideal legal entities and the group, and develop a sustainable business model unique to MUFG.(3) Provide a workplace where each employee can realize his or her talent development.(4) Based on the results achieved above, respond to shareholders’ expectations and enhance a reliable relationship with them.
* Transparent: universal, barrier-free open personnel communications between legal entities, and between company branches and the Head Office, regardless of title and position. It also implies an understanding of MUFG corporate vision.
Group Business Strategy
Under our current medium-term business plan, we are implementing “Eleven TransformationInitiatives”—specific strategic initiatives designed to enable us to cope with adverse changes in the domestic oroverseas business environment and to achieve sustainable growth. Each initiative constitutes a pillar for ourstrategy involving business operations that (1) have large growth potential, (2) allow us to expand on our groupcapabilities to the fullest extent, and, (3) are expected to grow as a core business of the group or a foundation forsuch a business. Our group operating companies, business groups and corporate center functions will collaborateon the implementation of these initiatives with an aim to improve our profitability.
Additionally, we have established a new business group focused on retail and small and medium-sizedenterprise banking businesses outside of Japan with the goal to effectively capture the market growth in theUnited States and Southeast Asia. Under our previous medium-term business plan, we took strategic stepstowards building a business platform in South East Asia through the expansion of Krungsri’s business inThailand and our strategic investments in Security Bank in the Philippines and Bank Danamon in Indonesia. Weseek to enhance the enterprise value of each of MUFG Union Bank in the United States and our strategic partnerbanks, including VietinBank in Vietnam and other banks in South East Asia, as well as our Japanese bankingsubsidiaries through synergies expected to be achieved by sharing and deploying across these banks theirrespective strengths and expertise.
Eleven Transformation Initiatives
(1) Digitalization Strategy
Enhanced use of digital technologies is a critical part of our overall transformation strategy, and we intendto develop and implement a wide range of measures to enhance our digital technology use to improve top-line
34
performance and operational efficiency. We seek to improve our marketing and consulting capabilities throughthe use of big data, to increase the efficiency of the front-office operations at branches through an overhaul of ouronline banking system for corporate customers, and to enhance our productivity through migration to digitalchannels for the housing loan business and expanded use of robotics and artificial intelligence.
(2) Channel Strategy and Business Process Re-engineering (BPR)
We strive to enhance customer user interface, or the usability of our systems for customers, and userexperience, or the experience of service recipients, while improving our productivity. We aim to achieve both ofthese goals through full utilization of digital technologies and business process re-engineering, or an overhaul ofbusiness operations through review and analysis of all existing business activities and work processes. We seekto advance our overall user channels combining Internet-based and physical branch channels by improving theusability of our Internet-based channels for transactions so as to increase customer use while establishingspecialty bank branches called “MUFG NEXT,” streamlining our branch network and converting branches intointegrated branches that offer services of MUFG Bank, Mitsubishi UFJ Trust and Banking, and Mitsubishi UFJMorgan Stanley Securities at a single location.
(3) Wealth Management Strategy
We are pursuing a business structure focused on fee-based businesses to achieve stable profits by servicingthe rising customer needs for asset management and administration services and inheritance services in Japan’saging society with a declining birthrate through a collaboration between the corporate and retail units andthrough a group-based integrated approach. We seek to establish a business model where teams of professionalsfrom MUFG Bank, Mitsubishi UFJ Trust and Banking, and Mitsubishi UFJ Morgan Stanley Securities will takethe lead in providing various solutions at a one-stop location.
(4) Enhancement of Relationship Manager & Product Office (RM-PO) Model for Corporate Marketing
We seek to provide solutions optimized to meet customer needs by integrating the corporate lendingoperations of MUFG Bank and Mitsubishi UFJ Trust and Banking through functional realignment whererelationship managers are expected to work on understanding the business management issues faced bycustomers as “RMs from MUFG” and the product office, a unit that is responsible for planning, developing andproviding products and services, is expected to deepen its expertise.
(5) Real Estate Value Chain Strategy
We aim to provide solutions to meet various customer needs arising in the real estate value chain, or thebusiness cycle for real estate assets including sale, purchase, development, tenant leasing and asset management,on a continuous basis through a group-based integrated approach. We endeavor to provide additional valuethrough efforts made at our branches to gain knowledge on real estate needs and to use it to obtain brokerage andasset management businesses. In the asset management business, we seek to strengthen our real assetmanagement capabilities.
(6) Asset Management Business
We seek to provide group-wide integrated asset management services to our customers. We aim to developcompetitive products, expand our product line-up, and enhance our human resource portfolio necessary for suchdevelopment and expansion. In addition, in an effort to become a globally recognized asset managementinstitution, we endeavor to strengthen our asset management business by enhancing our human resources,products and solutions.
35

(7) Institutional Investors Business
We aim to provide a wide range of services to satisfy diverse professional needs for asset management andadministration services through a group-based integrated approach, while seeking to expand across the group thecustomer relationships maintained with institutional investors by each of MUFG Bank, Mitsubishi UFJ Trust andBanking, Mitsubishi UFJ Morgan Stanley Securities, and our business groups.
(8) Global Corporate & Investment Banking (GCIB) Business Model Reform
We seek to achieve sustainable growth for our global corporate and investment banking business, where weprovide sophisticated financial services combining corporate banking services, including deposits and loans, andinvestment banking services, including capital markets financing and mergers and acquisitions. We aim to meetthe needs of non-Japanese corporate customers conducting business globally and to improve the overall return onour portfolio by constantly adjusting loan and other assets. In addition, we intend to shift the focus of ourmanagement approach from quantity to quality through origination and distribution business operations under theintegrated platform between MUFG Bank and Mitsubishi UFJ Morgan Stanley Securities.
(9) Enhancement of Overseas Operations
We plan to shift our management approach from the previous approach based on geographical regions andoperating entities to a new approach based on customers and businesses and seek to strengthen our business-driven management approach across the group. In addition, in an effort to establish a business structure thatenables us to flexibly adapt to changes in the business environment, we seek to reduce expenses, enhance ouroverseas branch and office network, and centralize and standardize our procedures and systems.
(10) Human Resources Strategy
We seek to manage our human resources globally in a group-based integrated manner through accelerationof personnel allocation and transfers across the group in line with our business strategy and establishment of ahuman resources division responsible for overseeing our domestic and overseas human resource management.
(11) Enhancement of Corporate Center Operations
We plan to shift our management of the corporate center operations from the previous approach ofintegrated management by MUFG and MUFG Bank to a new approach of integrated management by MUFG,MUFG Bank, Mitsubishi UFJ Trust and Banking, and Mitsubishi UFJ Morgan Stanley Securities in an effort tooptimize the use of our management resources on a group-based integrated basis and achieve low cost operations.
Business Groups
Under the current medium-term business plan, our business groups are reorganized as follows in an effort tofurther integrate the expertise and capabilities of our subsidiaries to respond to the needs of our customers moreeffectively and efficiently.
Retail & Commercial Banking Business Group
The Retail & Commercial Banking Business Group integrates the domestic retail and commercial bankingbusinesses of MUFG Bank, Mitsubishi UFJ Trust and Banking, Mitsubishi UFJ Securities Holdings, MitsubishiUFJ NICOS and other group companies of MUFG. This business group offers retail and small and medium–sizedenterprise customers in Japan an extensive array of commercial banking, trust banking and securities productsand services.
36

Business Environment and Strategy
In the domestic market in which we operate, unfavorable conditions remain such as the negative impact ofthe Bank of Japan’s negative interest rate policy on the financial market and intensified competition. In addition,demographic changes, including Japan’s aging population with a declining birthrate, and technologicaldevelopments, including artificial intelligence and digitalization, can change the way banking and other financialservices are used in Japan. With a goal of becoming “the top financial group in the retail and commercial bankingbusiness segment in Japan, achieving sustainable growth along with customers and society,” we seek to enhanceand integrate the capabilities of our group companies to deliver value that exceeds customer expectations andimprove customer satisfaction.
In the wealth management business, which is one of our key strategic focus areas, we are implementingmeasures to improve our group company structure for offering wealth management solutions, including assetmanagement, asset and business succession transfer, and real estate services. For example, with an aim tostrengthen our wealth management business, we plan to merge Mitsubishi UFJ Morgan Stanley Securities andMitsubishi UFJ Morgan Stanley PB Securities.
Responding to the Needs of Retail Customers
For retail customers, we provide a wide range of products and services, such as bank deposits, loans, assetmanagement and administration services, investment products and settlement services. We describe some of ourproducts and services below.
‰ Housing Loans. MUFG Bank offers housing loans with various loan terms and interest rates. MUFGBank also offers “Loans with Supplemental Health Insurance for Seven Major Illnesses” through a thirdparty insurance company to help with loan payments in case of unexpected major illnesses such ascancer or heart attacks. As part of our group-wide collaboration initiative, Mitsubishi UFJ Trust andBanking began to offer “Mitsubishi UFJ Net Home Loan” (a housing loan product of MUFG Bankavailable only online and exclusively to customers of Mitsubishi UFJ Trust and Banking) as an agent ofMUFG Bank in April 2018.
‰ Consumer Loans. MUFG Bank offers “Card Loans” (consumer loans the proceeds of which aredisbursed to approved borrowers with a bank-issued card through an automated machine) and “Purpose-Specific Term Loans,” depending on customers’ needs.
‰ Investment Products. In order to promote a shift in customer preference from savings to asset building,we seek to offer products that effectively serve the asset building and asset management needs ofcustomers at various stages of their life. As part of this effort, MUFG Bank started to offer fund wrapproducts as an agent of Mitsubishi UFJ Trust and Banking in November 2017. In addition, in January2018, MUFG Bank started to offer investment products that qualify for “Tsumitate NISA” taxexemption on capital gains and dividend income for the investment up to 0.4 million yen per year for upto 20 years under Japanese tax law. The original NISA, or Nippon Individual Savings Account, programwas introduced in 2014, providing for tax exemption on capital gains and dividend income for theinvestment up to 1.2 million yen per year for up to 5 years. We offer investment products that qualifyfor tax exemption under the original NISA program as well.
‰ Products and Services for Payments. Mitsubishi UFJ NICOS offers a variety of credit cards. In addition,debit cards are available to MUFG Bank account holders.
‰ Insurance Products. MUFG Bank acts as a sales channel for a variety of insurance products, includingannuity insurance, single premium whole life insurance, flat-rate premium whole life insurance, medicalinsurance, cancer insurance and nursing-care insurance, of insurance companies in Japan.
‰ Services Relating to Inheritance, Gift and Real Estate. Mitsubishi UFJ Trust and Banking offerstestamentary trust, inheritance planning, inheritance procedure support, and other related services.
37

MUFG Bank and Mitsubishi UFJ Morgan Stanley Securities also offer inheritance-related products andservices, serving as sales agents of Mitsubishi UFJ Trust and Banking. Mitsubishi UFJ Trust andBanking and Mitsubishi UFJ Real Estate Services offer real estate brokerage services for bothinvestment and business properties and residential properties.
We provide those services through an extensive network of branches in Japan, mostly in the greater Tokyo,Nagoya and Osaka areas. MUFG Bank and Mitsubishi UFJ Trust and Banking had a total of 733 branches inJapan as of March 31, 2019. MUFG Bank and Mitsubishi UFJ Trust and Banking also have a nationwide ATMnetwork consisting of MUFG Bank’s and Mitsubishi UFJ Trust and Banking’s own ATMs located at theirbranches and third-party ATMs located at convenience stores and other locations.
We also offer direct banking channels. MUFG Bank and Mitsubishi UFJ Trust and Banking provide internetbanking services which enable customers to perform a range of banking activities, such as checking accountbalances, making time deposits, transferring money and purchasing invest products, through the banks’respective websites using personal computers and mobile devices. In addition, Jibun Bank, a direct bank whichwas founded by MUFG Bank in collaboration with KDDI Corporation in June 2008, offers bank deposits,housing loans, settlement services and other products and services through the internet and phone.
Responding to the Needs of Small and Medium-Sized Enterprises
For small and medium-sized enterprises, we provide various financial solutions, such as bank deposits,loans, and fund management, remittance and foreign exchange services. We also help our customers developbusiness strategies, such as overseas expansions, inheritance-related business transfers and stock listings.
In addition, we provide asset and business succession solutions to small and medium-sized enterpriseowners. Based on our view that smooth succession of the businesses of small and medium-sized enterprisesowned by aging owners is critical to the sustainability and development of Japanese industry, we offer solutionsfor successions of businesses to unrelated persons, including through mergers and acquisitions and initial publicofferings, and for successions of businesses to related persons. We also offer solutions designed to assist businessowners with successions of assets using testamentary trusts, real estate transactions and other means. Throughfurther integration of the retail and commercial banking capabilities of MUFG Bank, Mitsubishi UFJ Trust andBanking, MUFG Securities Holdings and other group companies, we strive to provide seamless solutions on agroup-wide basis.
Japanese Corporate & Investment Banking Business Group
The Corporate Banking Business Group covers the large Japanese corporate businesses of MUFG Bank,Mitsubishi UFJ Trust and Banking and Mitsubishi UFJ Securities Holdings, including the transaction banking,investment banking, trust banking and securities businesses. We offer large Japanese corporations advancedfinancial solutions designed to respond to their diversified and globalized needs and to contribute to theirbusiness and financial strategies. We provide those solutions through our global network of MUFG Groupcompanies.
With our goal to “Be the First Call Business Partner for Large Japanese Corporate Clients,” we strive tostrengthen our solutions capabilities through an approach designed to provide effective solutions using ourspecialized industry-specific expertise and knowledge and through further integration and more effectivecollaboration among the MUFG Group companies on a global basis.
Transaction Banking
We provide cash management, payment, trade finance and other commercial banking products and servicesfor corporate business transactions. Through these products and services, we seek to provide sophisticatedfinancial solutions that enable efficient execution of transactions to meet the strategic needs of our customers.
38
Investment Banking
We provide mergers and acquisitions advisory, equity and bond underwriting, and other investment bankingservices to our Japanese corporate customers. A large part of our investment banking business in Japan isconducted by Mitsubishi UFG Morgan Stanley Securities, which was formed in May 2010 through theintegration of the domestic wholesale and retail securities businesses previously conducted by Mitsubishi UFJSecurities and the investment banking business previously conducted by Morgan Stanley Japan. See “—GlobalStrategic Alliance with Morgan Stanley” below.
Trust Banking
We provide real estate brokerage, registrar and transfer agency, and other trust banking services to ourJapanese corporate customers. Our solutions also include securitization of real estate, receivables and otherassets. Mitsubishi UFJ Trust and Banking’s experience and know-how in real estate brokerage and appraisalservices, corporate real estate strategy consulting, shareholder registry management services, shareholder andinvestor relations consulting, and consulting services relating to executive stock compensation programs usingtrust schemes enable us to offer solutions tailored to the financial strategies of each customer.
Asset Management & Investor Services Business Group
The Asset Management & Investor Services Business Group covers the asset management and assetadministration businesses of Mitsubishi UFJ Trust and Banking and MUFG Bank. By integrating the trustbanking expertise of Mitsubishi UFJ Trust and Banking and the global strengths of MUFG Bank. the businessgroup offers a full range of asset management and administration services for corporations and pension funds,including pension fund management and administration, advice on pension structures, and payments tobeneficiaries, and also offers investment trusts for retail customers.
We aim to expand our asset management and asset administration services business by enhancing thequality of our products and services, effectively utilizing the broad customer base of the MUFG Group, andimproving our operational efficiency through IT technology.
Asset Management
Mitsubishi UFJ Trust and Banking, Mitsubishi UFJ Kokusai Asset Management, and MU Investments Co.,Ltd provide institutional investors with a wide range of investment options such as equities, bonds and alternativeproducts. In addition, Mitsubishi UFJ Trust and Banking and Mitsubishi UFJ Kokusai Asset Managementprovide retail investors with investment trust products through our group companies and business partnersoutside of the MUFG Group, such as securities companies and regional banks.
We are adopting an inorganic expansion strategy especially for our non-Japanese investment capability in aneffort to be a global top-level asset manager with competitive products and solutions capabilities. Our existingstrategic alliances through minority investments, including our alliances with AMP Capital Holdings Limited inAustralia and SWS MU FUND MANAGEMENT in China, have contributed to our asset management businessexpansion.
In October 2018, Mitsubishi UFJ Trust and Banking entered into a Share Sale Deed with CommonwealthBank of Australia, or CBA, and its wholly-owned subsidiary Colonial First State Group Limited, or CFSGL, toacquire 100% of the shares in each of nine subsidiaries of CFSGL, which collectively represent CBA’s globalasset management business known as Colonial First State Global Asset Management, or CFSGAM, fromCFSGL, subject to certain conditions precedent, including required regulatory approvals. This transaction is ourfirst majority investment in an asset manager and is expected to close in mid-2019. CFSGAM is a global asset
39

management firm with AU$212 billion, or ¥17.4 trillion in assets under management, or AuM, and is currentlythe third largest asset management firm by AuM in Asian markets excluding Japan. CFSGAM offers productsacross equities, alternatives and fixed income and has specialist capabilities in Asian and emerging markets aswell as in the infrastructure field.
Asset Administration
Under the brand of “MUFG Investor Services,” Mitsubishi UFJ Trust and Banking, MUFG Bank,Mitsubishi UFJ Investor Services & Banking (Luxembourg), MUFG Investor Services Holdings Limited, MUFGCapital Analytics and MUFG Investor Services(US),LLC offer a full suite of global asset administration services,including fund administration, custody, securities lending, financing and foreign exchange services as a one-stopshop.
Global Corporate & Investment Banking Business Group
The Global Corporate & Investment Banking Business Group covers the corporate, investment andtransaction banking businesses of MUFG Bank and Mitsubishi UFJ Securities Holdings. Through a globalnetwork of offices and branches, we provide non-Japanese large corporate and financial institution customerswith a comprehensive set of solutions that meet their increasingly diverse and sophisticated financing needs.
Through the new integrated operations management structure between the Global Corporate & InvestmentBanking Business Group and the Global Markets Business Group, we aim to offer financing and investmentopportunities based on our understanding of institutional investor needs.
The expansion of the global corporate and investment banking business has been an important pillar of theMUFG Group’s growth strategy. Aiming to further enhance our presence in the global financial market, we haveshifted our strategic approach from one where each of our group companies individually promoted its globalbusiness to one where our group companies collaborate through integration of their capabilities. The newapproach is designed to enable us to exercise our comprehensive expertise to provide our customers with value-added solutions and services more effectively.
In March 2019, MUFG Bank agreed to purchase from DVB Bank SE in Germany its aviation finance clientlending portfolio and the related operating infrastructure. In connection with this agreement, BOT Lease Co.,Ltd., a consolidated subsidiary of MUFG Bank, agreed to purchase from DVB Bank its aviation investmentmanagement and asset management business. The closing of these transactions are expected to occur during thesecond half of the fiscal year ending March 31, 2020, subject to regulatory approvals and other conditions.Aviation finance is a key growth pillar for us and, through the acquisition, we aim to enhance our GlobalCorporate & Investment Banking Business platform in terms of higher returns, portfolio diversification andsolution offering to our clients.
Corporate Banking
Through our global network of offices and branches, we provide a full range of corporate banking solutions,such as project finance, export credit agency finance, and financing through asset-backed commercial paper. Ourprimary customers include large corporations, financial institutions, sovereign and multinational organizations,and institutional investors that are headquartered outside of Japan.
Investment Banking
We provide investment banking services such as debt and equity issuance and M&A-related services, tohelp our customers develop their financial strategies and realize their business goals. In order to meet customers’various financing needs, we have established a customer-oriented coverage model through which our product
40
experts coordinate with one another to offer innovative financing services globally. We have further integratedthe management of the operations of our commercial banking and securities subsidiaries to enhancecollaboration. We are one of the world’s top providers of project finance, one of the core businesses of the GlobalCorporate & Investment Banking Business Group. We provide sophisticated professional services in arranginglimited-recourse finance and offering financial advice in various sectors, including natural resources, power, andinfrastructure, backed by our experience, expertise, knowledge, and global network.
Transaction Banking
We provide commercial banking products and services for large corporations and financial institutions inmanaging and processing domestic and cross-border payments, mitigating risks in international trade, andproviding working capital optimization. We have established a Transaction Banking Unit, which oversees theentire transaction banking operations globally, in order to enhance governance, management and quality ofservices in these operations. The Transaction Banking Unit provides customers with support for their domestic,regional and global trade finance and cash management programs through our extensive global network.
Global Commercial Banking Business Group
The Global Commercial Banking Business Group provides a comprehensive array of financial products andservices such as loans, deposits, fund transfers, investments and asset management services for local retail, smalland medium-sized enterprise, and corporate customers across the Asia-Pacific region through our major localcommercial banking subsidiaries and affiliates outside of Japan referred to as “Partner Banks.” Our PartnerBanks include MUFG Union Bank in the United States, Krungsri in Thailand, Bank Danamon in Indonesia,VietinBank in Vietnam and Security Bank in the Philippines.
The network among the Partner Banks covers a vast market, consisting of five countries with populationtotaling approximately 840 million. The market is expected to expand further as the GDP growth rates arerelatively high in these countries and financial needs are expected to increase as average income rise in theASEAN countries.
We believe that our network, which combines the global reach of the MUFG Group companies with strongregional presence of the Partner Banks each carrying an established brand, provides us with unique competitiveadvantages. Through sharing and integration of the expertise and capabilities of the Partner Banks, we seek toachieve synergy effects and capture the business opportunities arising from the economic growth of the region.
MUFG Union Bank, N.A.
MUFG Union Bank is the primary subsidiary of MUFG Americas Holdings, which is our wholly ownedsubsidiary and which is a bank holding company in the United States. MUFG Union Bank is the primaryoperating entity of MUFG Bank in the United States. MUFG Union Bank provides a comprehensive range ofbanking, consumer finance, investment, asset management, and other financial products and services toindividual consumers, small and medium-sized enterprises, and large corporations primarily in California,Oregon, Washington, and Texas as well as nationally and internationally through 370 branches (consisting of343 retail branches and five commercial branches, as well as 22 financial centers of PurePoint, an online bankingdivision of MUFG Union Bank).
In July 2014, MUFG Bank’s operations in the Americas region were integrated with MUFG AmericasHoldings’ operations. As a result, MUFG Americas Holdings oversees MUFG Bank’s operations in the Americasregion.
In July 2016, MUFG Americas Holdings was designated as MUFG’s U.S. intermediate holding company, orIHC, to comply with the FRB’s enhanced prudential standards. As of that date, MUFG Bank, Mitsubishi UFJ
41
Trust and Banking and Mitsubishi UFJ Securities Holdings transferred to MUFG Americas Holdings theirownership interests in their U.S. subsidiaries and affiliates, namely, BTMU Capital Corporation, BTMUSecurities, Inc., MUFG Americas Capital Company, Morgan Stanley MUFG Loan Partners, LLC, MUFG FundServices (USA) LLC, and MUFG Securities Americas Inc.
In July 2017, MUFG Bank and Mitsubishi UFJ Trust and Banking transferred to MUFG Americas Holdingstheir ownership interests in other U.S. subsidiaries and affiliates, namely, BTMU Leasing & Finance, Inc.,BTMU LF Capital LLC, MUFG Capital Analytics, LLC, and MUFG Investors Services(US), LLC.
See “Item 3.D. Key Information—Risk Factors—Risks Related to Our Business—Any adverse changes inthe business of MUFG Americas Holdings Corporation, an indirect wholly-owned subsidiary in the UnitedStates, could significantly affect our results of operations.”
Bank of Ayudhya Public Company Limited (Krungsri)
Krungsri is a strategic subsidiary of MUFG Bank in Thailand. Krungsri provides a comprehensive range ofbanking, consumer finance, investment, asset management, and other financial products and services to retailconsumers, small and medium-sized enterprises, and large corporations mainly in Thailand through 701 branches(consisting 660 banking branches, 39 automobile finance business branches and two overseas branches) andother service outlets nationwide. In addition, Krungsri’s consolidated subsidiaries include the largest credit cardissuer in Thailand with a total of 9.3 million credit card, sales finance and personal loan accounts in its portfolio,a major auto finance provider, a fast growing asset management company, and a leading microfinance serviceprovider in Thailand.
MUFG owns a 76.88% ownership interest in Krungsri through MUFG Bank as of March 31, 2019. Bycombining Krungsri’s local franchise with competitive presence in the retail and small and medium-sizedenterprise banking markets in Thailand with MUFG Bank’s global financial expertise, we seek to offer a widerrange of high-value financial products and services to a more diverse and larger customer base.
In March 2017, Krungsri established a subsidiary, Krungsri Finnovate Company Limited, with a keymission to support and promote FinTech startups in Thailand and Southeast Asian countries in the forms ofaccelerator and academic collaboration, startup project management and corporate venture capital.
In September 2017, Krungsri was designated as a Domestic Systemically Important Bank by the Bank ofThailand based on the central bank’s assessment of Krungsri based on its asset size and its contribution to thecountry’s economy and financial system.
See “Item 3.D. Key Information—Risk Factors—Risks Related to Our Business—Any adverse changes inthe business of Bank of Ayudhya, an indirect subsidiary in Thailand, or Bank Danamon, an indirect subsidiary inIndonesia, could significantly affect our results of operations.”
PT Bank Danamon Indonesia, Tbk. (“Bank Danamon”)
Bank Danamon is a strategic subsidiary of MUFG Bank in Indonesia. Bank Danamon provides acomprehensive range of banking and other financial products and services to retail consumers, small andmedium-sized enterprises, and large corporations in Indonesia. It operates an extensive distribution networkspread out from Aceh to Papua, with more than 1,100 branches and service outlets. In addition, Bank Danamonprovides financing for automotive and consumer goods through PT Adira Dinamika Multi Finance Tbk, asubsidiary of Bank Danamon, as well as general insurance products through PT Asuransi Adira Dinamika,another subsidiary of Bank Danamon.
In December 2017, MUFG Bank acquired 19.9% of the outstanding shares of Bank Danamon.Subsequently, MUFG Bank increased its shareholding in Bank Danamon to 40.0% in August 2018 and further to94.0% in April 2019. In addition, in April 2019, MUFG Bank acquired shares of common stock of PT Bank
42
Nusantara Parahyangan Tbk, or Bank BNP, an Indonesia bank, increasing its shareholding in the bank from 7.9%to 99.9%. In May 2019, Bank BNP was merged into Bank Danamon. As a result of MUFG Bank’s acquisition ofadditional shares in Bank Danamon in April 2019, Bank Danamon became our consolidated subsidiary, effectiveas of April 29, 2019.
Our investment in Bank Danamon represents another milestone for our growth strategy in Southeast Asiawith the goal of realizing our unique and unparalleled business model based on the established local networks ofour Partner Banks, and MUFG’s global network to provide holistic financial services to a wider range ofcustomers. Through this investment, we aim to diversify and expand our local retail and small and medium-sizedenterprise business portfolio by seizing opportunities expected to arise from Indonesia’s current economicgrowth and long-term economic growth prospects.
See “Item 3.D. Key Information—Risk Factors—Risks Related to Our Business— Any adverse changes inthe business of Bank of Ayudhya, an indirect subsidiary in Thailand, or Bank Danamon, an indirect subsidiary inIndonesia, could significantly affect our results of operations.” and “Item 5. Operating and Financial Review andProspects—Recent Developments.”
Other Activities in Southeast Asia
We have been expanding our operations in Southeast Asia with an effort to further develop our businessesabroad. In addition to MUFG Union Bank, Krungsri and Bank Danamon, we have strategic business and capitalalliances with other banks in Southeast Asia, including VietinBank in Vietnam and Security Bank in thePhilippines, as our Partner Banks.
VietinBank provides a wide range of financial services to consumers, small businesses, middle-market andlarge companies through its branch network predominantly in Vietnam. We own a 19.7% equity interest inVietinBank.
Security Bank provides a wide range of financial services to consumers, small businesses, middle-marketand large companies through its branch network in the Philippines. We own a 20% equity interest in SecurityBank.
See “Item 5. Operating and Financial Review and Prospects—Recent Developments” and “Item 3.D. KeyInformation—Risk Factors—Risks Related to Our Business—Our strategy to expand the range of our financialproducts and services and the geographic scope of our business globally may fail if we are unable to anticipate ormanage new or expanded risks that entail such expansion.”
Global Markets Business Group
The Global Markets Business Group covers the customer business and the treasury operations of MUFGBank, Mitsubishi UFJ Trust and Banking and Mitsubishi UFJ Securities Holdings. The customer businessincludes sales and trading in fixed income instruments, currencies and equities as well as other investmentproducts, and origination and distribution of financial products. The treasury operations include asset and liabilitymanagement as well as global investments for the MUFG Group.
Customer Business
‰ Sales and Trading in Fixed Income Instruments, Currencies and Equities. We provide financing,hedging, and investment solutions to our retail, corporate, institutional, and governmental customersthrough sales and trading in financial market products such as fixed income instruments, currencies, andequities. Our innovative financial products and services are designed to respond to increasinglysophisticated requirements of our diverse customers and are provided through our global network ofoffices and branches.
43

‰ Investment Products for Non-Institutional Customers in Japan. We provide investment products such asmutual funds, and structured bonds, notes and deposits to non-institutional customers in Japan. We offersolutions using these investment products to help customers better manage their assets andliabilities. This business is conducted through the new integrated operations management structureamong the Global Markets Business Group, the Asset Management & Investor Service Business Group,the Retail & Commercial Banking Business Group, and the Japanese Corporate and Investment BankingBusiness Group. To enhance our products and sales support capability, in the fiscal year endedMarch 31, 2019, the Global Markets Business Group started to collaborate with the Retail &Commercial Banking Business Group in the retail and small and medium-sized enterprise clientbusinesses.
‰ Origination and Distribution. We provide financing solutions to institutional customers throughorigination and distribution of financial products such as syndicated loans and securities issuances. Thisbusiness is conducted through the new integrated operations management structure between the GlobalMarkets Business Group and the Global Corporate and Investment Banking Business Group.
Treasury Operations
‰ Asset and Liability Management. Through our treasury operations, we seek to manage interest rate andliquidity risks residing in our balance sheets through, among other things, transactions designed tomanage the profit and loss impact attributable to market movements based on our balance sheet analysesand forecasts. Such transactions include investments in high quality liquid securities such as Japanesegovernment bonds and U.S. Treasury bonds and trading in other financial products such as interest rateswaps and cross currency swaps.
‰ Global Investment. Through our treasury operations, we also seek to enhance our profitability bydiversifying our portfolio and strategically investing in financial products including corporate bonds andfunds.
Strategy under the Current Medium-Term Business Plan
Under the current medium-term business plan, for the three-year period ending March 31, 2021, the GlobalMarkets Business Group intends to undertake the following four initiatives designed to promote the MUFGGroup’s structural reforms.
‰ The Global Markets Business Group plans to improve its business portfolio by adjusting its focus togrowth areas and new areas, including the sales and trading business targeting institutional customers aswell as the origination and distribution business under the new integrated operations managementstructure with the Global Corporate and Investment Banking Business Group. In addition, the GlobalMarkets Business Group plans to build a sustainable growth model for the investment products businesstargeting non-institutional investors in Japan under the new integrated operations management structurewith the Asset Management & Investor Service Business Group, the Retail & Commercial BankingBusiness Group and the Japanese Corporate and Investment Banking Business Group.
‰ The Global Markets Business Group aims to reform the sales and trading business targeting corporatecustomers through enhancement of our financial solutions capabilities by more effectively coordinatingcapital markets transactions and global markets transactions and through reduction in transactionsdependent on our balance sheets.
‰ The Global Markets Business Group strives to enhance the framework for collaboration and cooperationbetween MUFG’s treasury operations unit and its counterparts at MUFG’s major subsidiaries to supportthe MUFG Group’s sustainable growth by integrating the expertise in market risk management on agroup-wide basis and applying a unified approach to liquidity risk management.
44
‰ The Global Markets Business Group strives to establish business frameworks and infrastructuredesigned to optimize and enhance integration and flexibility of the booking functions for global marketstransactions among MUFG’s major subsidiaries and to accelerate digitalization.
Global Strategic Alliance with Morgan Stanley
As of March 31, 2019, we held approximately 405 million shares of Morgan Stanley’s common stockrepresenting approximately 24.0 % of the voting rights in Morgan Stanley and Series C Preferred Stock with aface value of approximately $521.4 million and 10% dividend. As of the same date, we had two representativesappointed to Morgan Stanley’s board of directors. We adopted the equity method of accounting for ourinvestment in Morgan Stanley beginning with the fiscal year ended March 31, 2012.
In conjunction with Morgan Stanley, we formed two securities joint venture companies in May 2010 tointegrate our respective Japanese securities companies. We converted the wholesale and retail securitiesbusinesses conducted in Japan by Mitsubishi UFJ Securities into Mitsubishi UFJ Morgan Stanley Securities.Morgan Stanley contributed the investment banking operations conducted in Japan by its former wholly-ownedsubsidiary, Morgan Stanley Japan, to Mitsubishi UFJ Morgan Stanley Securities, and converted the sales andtrading and capital markets businesses conducted in Japan by Morgan Stanley Japan into an entity called MorganStanley MUFG Securities, Co., Ltd. We hold a 60% economic interest in Mitsubishi UFJ Morgan StanleySecurities and Morgan Stanley MUFG Securities, and Morgan Stanley holds a 40% economic interest inMitsubishi UFJ Morgan Stanley Securities and Morgan Stanley MUFG Securities. We hold a 60% voting interestand Morgan Stanley holds a 40% voting interest in Mitsubishi UFJ Morgan Stanley Securities, and we hold a49% voting interest and Morgan Stanley holds a 51% voting interest in Morgan Stanley MUFG Securities.Morgan Stanley’s and our economic and voting interests in the securities joint venture companies are heldthrough intermediate holding companies. We have retained control of Mitsubishi UFJ Morgan Stanley Securitiesand we account for our interest in Morgan Stanley MUFG Securities under the equity method due to oursignificant influence over Morgan Stanley MUFG Securities. The board of directors of Mitsubishi UFJ MorganStanley Securities has fifteen members, nine of whom are designated by us and six of whom are designated byMorgan Stanley. The board of directors of Morgan Stanley MUFG Securities has ten members, six of whom aredesignated by Morgan Stanley and four of whom are designated by us. The CEO of Mitsubishi UFJ MorganStanley Securities is designated by us and the CEO of Morgan Stanley MUFG Securities is designated byMorgan Stanley.
We have also expanded the scope of our global strategic alliance with Morgan Stanley into othergeographies and businesses, including (1) a loan marketing joint venture that provides clients in the United Stateswith access to the world-class lending and capital markets services from both companies, (2) business referralarrangements in Asia, Europe, the Middle East and Africa, covering capital markets, loans, fixed income salesand other businesses, (3) global commodities referral arrangements whereby MUFG Bank and its affiliates referclients in need of commodities-related hedging solutions to certain affiliates of Morgan Stanley, and (4) anemployee secondment program to share best practices and expertise in a wide range of business areas.
Mitsubishi UFJ Morgan Stanley PB Securities Co., Ltd., in which Mitsubishi UFJ Morgan StanleySecurities holds 75%, and MUFG Bank holds the remaining 25%, of the voting rights, has an agreement withMorgan Stanley. Mitsubishi UFJ Morgan Stanley PB Securities leverages MUFG’s broad customer base, utilizesMorgan Stanley’s global and high quality insight, and furthers its collaborations with other group companies bystrengthening its coordination with Mitsubishi UFJ Morgan Stanley Securities. It aims for further development ofits wealth management business, which is one of the largest in Japan. In April 2019, Mitsubishi UFJ MorganStanley Securities and Mitsubishi UFJ Morgan Stanley PB Securities agreed on a merger, whereby MitsubishiUFJ Morgan Stanley Securities will be the surviving company.
See “Item 3.D. Key Information—Risk Factors—Risks Related to Our Business—If our strategic alliancewith Morgan Stanley fails, we could suffer financial or reputational loss.”
45
Competition
We face strong competition in all of our principal areas of operation. The structural reforms in financialindustry regulations and recent developments in financial markets have resulted in some significant changes inthe Japanese financial system and prompted banks to merge or reorganize their operations. In addition,development of new technologies such as artificial intelligence and blockchain has also allowed non-financialinstitutions to enter the financial services industry with alternative services, thus changing the nature ofcompetition from other financial institutions as well as from other types of businesses. See “Item 3.D. KeyInformation—Risk Factors—Risks Related to Our Business—Our business may be adversely affected bycompetitive pressures, which have partly increased due to regulatory changes and recent market changes in thefinancial industry domestically and globally.”
Japan
Since their formation in 2000 and 2001, the so-called Japanese “mega bank” groups, including us, theMizuho Financial Group and the Sumitomo Mitsui Financial Group, have continued to expand their businessesand take measures designed to enhance their financial group capabilities. For example, in July 2013, MizuhoBank, Ltd. and Mizuho Corporate Bank, Ltd. merged, and the merged entity presently operates under thecorporate name of “Mizuho Bank, Ltd.” In November 2015, SMBC Trust Bank, Ltd., a subsidiary of SumitomoMitsui Financial Group, acquired the retail banking business of Citibank Japan, Ltd.
Competition among the mega bank groups are expected to continue in various financial sectors as they haverecently announced plans to expand, or have expanded, their respective businesses. For example, in the securitiessector, in May 2010, in conjunction with Morgan Stanley, we created two securities joint venture companies inJapan, Mitsubishi UFJ Morgan Stanley Securities and Morgan Stanley MUFG Securities, by integrating theoperations of Mitsubishi UFJ Securities and Morgan Stanley Japan. In January 2013, Mizuho Securities andMizuho Investors Securities Co., Ltd. merged. For a discussion of the two securities joint venture companiescreated by us and Morgan Stanley, see “—B. Business Overview—Global Strategic Alliance with MorganStanley.”
In the retail business sector, customers often have needs for a broad range of financial products and services,such as investment trusts and insurance products. Recently, competition has increased due to the development ofnew products and distribution channels. For example, Japanese banks compete with one another by developinginnovative proprietary computer technologies that allow them to deliver basic banking services in a moreefficient manner and to create sophisticated new products in response to customer demand. Competition has alsoincreased since the introduction in January 2014 of the Japanese individual savings account system, generallyreferred to as the NISA program, which currently offers tax exemptions on capital gains and dividend income forinvestments up to ¥1.2 million a year for a maximum of five years. In addition, in December 2015, SumitomoMitsui Trust Bank, Ltd. acquired Citi Cards Japan, Inc., which previously operated the credit card business ofCitigroup Inc. in Japan.
In the private banking sector, competition among the mega bank groups has intensified as a result of recentcorporate actions designed to strengthen their operations. We made Mitsubishi UFJ Merrill Lynch PB SecuritiesCo., Ltd. a wholly owned subsidiary in December 2012 to enhance our private banking services for highnet-worth customers, and changed its name to Mitsubishi UFJ Morgan Stanley PB Securities, Ltd. in March2014. In April 2019, we announced a plan to merge Mitsubishi UFJ Morgan Stanley PB Securities intoMitsubishi UFJ Morgan Stanley Securities. Sumitomo Mitsui Banking Corporation acquired the former SociétéGénérale Private Banking Japan, Ltd. from Société Générale S.A. and changed its name to SMBC Trust Bank,Ltd. in October 2013.
In the consumer finance sector, recent regulatory reforms and legal developments have negatively impactedthe business environment, resulting in failures of several consumer finance companies and intensified
46

competition among consumer finance companies that have remained in business, particularly among thoseaffiliated with the mega banks. In April 2012, Promise Co., Ltd. became a wholly owned subsidiary of theSumitomo Mitsui Financial Group, and changed its name as SMBC Consumer Finance Co., Ltd. in July 2012.See “Item 3.D. Key Information—Risk Factors—Risks Related to Our Business—Because of our loans toconsumers and our shareholdings in companies engaged in consumer lending, changes in the business orregulatory environment for consumer finance companies in Japan may further adversely affect our financialresults.”
The trust assets business is an area that is becoming increasingly competitive because of regulatory changesin the industry that have expanded the products and services that can be offered since the mid-2000s. In addition,there is growing corporate demand for changes in the trust regulatory environment, such as reforms of thepension system and related accounting regulations under Japanese GAAP. Competition may increase in thefuture as changes are made to respond to such corporate demand and regulatory barriers to entry are lowered.Competition is also expected to intensify as a result of recent integrations and entrants in the industry. Forexample, in August 2015, JP Asset Management Co., Ltd. was established as a joint venture with the Japan PostGroup, Sumitomo Mitsui Trust Bank and Nomura Holdings, Inc. holding 50%, 30% and 20% equity interests,respectively, in the joint venture. In October 2016, the Mizuho Financial Group integrated Mizuho AssetManagement Co., Ltd., Shinko Asset Management Co., Ltd. and the asset management business of MizuhoTrust & Banking Co., Ltd., all of which were asset management subsidiaries of the Mizuho Financial Group inJapan, and DIAM Co., Ltd., which was an asset management joint venture between the Mizuho Financial Groupand Dai-ichi Life Insurance Company in Japan. In July 2016, the Sumitomo Mitsui Financial Group madeSumitomo Mitsui Asset Management Co., Ltd. a consolidated subsidiary through the acquisition of additionalequity interest in the asset management company. In March 2017, the Mizuho Financial Group announced plansto integrate Trust and Custody Services Bank, Ltd., its trust bank subsidiary specialized in the assetadministration business, with Japan Trustee Services Bank, Ltd., which is a trust bank joint venture betweenSumitomo Mitsui Trust Holdings and Resona Bank, Ltd. specialized in the asset administration business. In May2018, the Sumitomo Mitsui Financial Group announced a planned merger between Sumitomo Mitsui AssetManagement and Daiwa SB Investments Ltd.
In recent years, the Japanese government has identified several governmental financial institutions ascandidates to privatize. Under the current postal privatization law, Japan Post Bank and Japan Post Insurancemay enter into new business areas upon obtaining government approvals, and if Japan Post Holdings’ equityholdings decrease to 50% or below, the two companies will be allowed to enter into new business areas uponsubmission of a notice to the government. In such case, the Japan Post Group companies may seek to enter intonew financial businesses and increasingly compete with us. Japan Post Holdings currently holds approximately89% of the shares of Japan Post Bank. Japan Post Holdings’ equity holding in Japan Post Insurance decreasedfrom around 89% to around 64% through a public offering of shares in April 2019. In addition, the Japanesegovernment is expected to decrease its shareholding in Japan Post Holdings to just above one-third, which is theminimum shareholding required for the Japanese government under the law, in September 2019. In addition,Japan Post Bank is one of the world’s largest holders of deposits, which provide a cost-effective source offunding for the bank. In April 2019, the cap imposed by law on the amount of deposits that Japan Post Bank mayaccept from each customer was raised from an aggregate of ¥13 million to ¥13 million in ordinary deposits plus¥13 million in time deposits. See “—B. Business Overview—The Japanese Financial System—GovernmentFinancial Institutions.”
The mega bank groups face significant competition with other financial groups as well as companies thathave traditionally not been engaged in banking services. For example, the Nomura Group has been a majorplayer in the securities market in Japan. In addition, various Japanese non-bank financial institutions andnon-financial companies have entered into the Japanese banking sector. For example, Orix Corporation, anon-bank financial institution, as well as the Seven & i Holdings Co., Ltd., Sony Corporation and Aeon Co., Ltd.,which were non-financial companies, offer various banking services, often through non-traditional distributionchannels. Further, development of new technologies such as artificial intelligence, or AI, and blockchain has also
47
allowed non-financial institutions to enter financial services industry with alternative services such as electronicsettlement services, and these new entrants could become substantial competition to us.
Foreign
In the United States, we face substantial competition in all aspects of our business. We face competitionfrom other large U.S. and non-U.S. money-center banks, as well as from similar institutions that providefinancial services. Through MUFG Union Bank, we currently compete principally with U.S. and non-U.S.money-center and regional banks, thrift institutions, asset management companies, investment advisorycompanies, consumer finance companies, credit unions and other financial institutions.
In other international markets, we face competition from commercial banks and similar financialinstitutions, particularly major international banks and the leading domestic banks in the local financial marketsin which we conduct business. For example, Japanese mega banks, including us, and other major internationalbanks have been expanding their operations in the Asian market, where leading local banks also have beengrowing and increasing their presence recently. Furthermore, we are aiming to expand our retail and small andmedium-sized enterprise businesses along with our corporate banking business in Southeast Asia through ouracquisition of Krungsri in Thailand and Bank Danamon in Indonesia as well as our strategic investments inVietinBank in Vietnam and Security Bank in the Philippines, and to compete with leading local banks in suchbusinesses. See “Item 3.D. Key Information—Risk Factors—Risks Related to Our Business—Our strategy toexpand the range of our financial products and services and the geographic scope of our business globally mayfail if we are unable to anticipate or manage new or expanded risks that entail such expansion.” For a discussionof recent developments, see “Item 5. Operating and Financial Review and Prospects—Recent Developments.”
In addition, we may face further competition as a result of recent investments, mergers and other businesstie-ups among global financial institutions, including, for example, our recent acquisitions of, and business andcapital alliances with, asset management, administration and custody services companies.
The Japanese Financial System
Japanese financial institutions may be categorized into three types:
‰ the central bank, namely the Bank of Japan;
‰ private banking institutions; and
‰ government financial institutions.
The Bank of Japan
The Bank of Japan’s role is to maintain price stability and the stability of the financial system to ensure asolid foundation for sound economic development.
Private Banking Institutions
Private banking institutions in Japan are commonly classified into two categories (the following numbersare based on information published by the FSA available as of May 1, 2019):
‰ ordinary banks (123 ordinary banks and 56 foreign commercial banks with ordinary bankingoperations); and
‰ trust banks (14 trust banks, including two Japanese subsidiaries of foreign financial institutions).
Ordinary banks in turn are classified as city banks, of which there are four, including MUFG Bank, andregional banks, of which there are 104 and other banks, of which there are 15. In general, the operations ofordinary banks correspond to commercial banking operations in the United States. City banks and regional banksare distinguished based on head office location as well as the size and scope of their operations.
48

The city banks are generally considered to constitute the largest and most influential group of banks inJapan. Generally, these banks are based in large cities, such as Tokyo and Osaka, and operate nationally throughnetworks of branch offices. The city banks provide a wide variety of banking and other financial products andservices to large corporate customers, including the major industrial companies in Japan, as well as small andmedium-sized companies and retail customers.
With some exceptions, the regional banks tend to be much smaller in terms of total assets than the citybanks. Each of the regional banks is based in one of the Japanese prefectures and extends its operations intoneighboring prefectures. Their customers are mostly regional enterprises and local public utilities. The regionalbanks also lend to large corporations. In line with the recent trend among financial institutions toward mergers orbusiness tie-ups, various regional banks have announced or are currently negotiating or pursuing integrationtransactions.
Trust banks, including Mitsubishi UFJ Trust and Banking, provide various trust services relating to moneytrusts, pension trusts and investment trusts and offer other services relating to real estate, stock transfer agencyand testamentary services, as well as banking services.
In recent years, almost all of the city banks have consolidated with other city banks and, in some cases,integrated with trust banks. Consolidation or integration among these banks was achieved, in most cases, throughthe use of a bank holding company.
In addition to ordinary banks and trust banks, other private financial institutions in Japan, including banksoperated by non-financial companies, shinkin banks, or credit associations, and credit cooperatives, are engagedprimarily in making loans to small businesses and individuals.
Government Financial Institutions
There are a number of government financial institutions in Japan, which are corporations wholly owned ormajority-owned by the government and operate under the government’s supervision. Their funds are providedmainly from government sources. Certain types of operations undertaken by these institutions have been or areplanned to be assumed by, or integrated with the operations of, private corporations through privatizations andother measures.
Among them are the following:
‰ The Development Bank of Japan, which was established for the purpose of contributing to the economicdevelopment of Japan by extending long-term loans, mainly to primary and secondary sector industries,and which was reorganized as a joint stock company in October 2008 as part of its ongoing privatizationprocess, with the government being required by law to continue to hold 50% or more of the shares in thebank until the completion of certain specified investment operations, which the bank is required toendeavor to achieve by March 2026, and more than one-third for an unspecified period thereafter;
‰ Japan Finance Corporation, which was formed in October 2008, through the merger of the internationalfinancial operations of the former Japan Bank for International Cooperation, National Life FinanceCorporation, Agriculture, Forestry and Fisheries Finance Corporation, and Japan Finance Corporationfor Small and Medium Enterprise, for the primary purposes of supplementing and encouraging theprivate financing of exports, imports, overseas investments and overseas economic cooperation, andsupplementing private financing to the general public, small and medium-sized enterprises and thoseengaged in agriculture, forestry and fishery. In April 2012, Japan Finance Corporation spun off itsinternational operations to create Japan Bank for International Cooperation as a separate government-owned entity;
‰ Japan Housing Finance Agency, which was originally established in June 1950 as the GovernmentHousing Loan Corporation for the purpose of providing housing loans to the general public, and which
49

was reorganized as an incorporated administrative agency and started to specialize in securitization ofhousing loans in April 2007; and
‰ The Japan Post Group companies, a group of joint stock companies including Japan Post Bank, whichwere formed in October 2007 as part of the Japanese government’s privatization plan for the formerJapan Post, a government-run public services corporation, which had been the Postal Service Agencyuntil March 2003. In November 2015, approximately 11% of the outstanding shares of each of JapanPost Bank, Japan Post Insurance and Japan Post Holdings were sold to the public, and these companiesare currently listed on the Tokyo Stock Exchange. In September 2017, an additional 22% of theoutstanding shares of Japan Post Holdings were sold to the public. The Japanese government is expectedto further decrease its shareholding in Japan Post Holdings to just above one-third, which is theminimum shareholding required for the Japanese government by law, in September 2019.
Supervision and Regulation
Japan
Supervision. The FSA is responsible for supervising and overseeing financial institutions, making policyfor the overall Japanese financial system and conducting insolvency proceedings with respect to financialinstitutions. The Bank of Japan, as the central bank for financial institutions, also has supervisory authority overbanks in Japan, based primarily on its contractual agreements and transactions with the banks.
The Banking Law. Among the various laws that regulate financial institutions, the Banking Law and itssubordinated orders and ordinances are regarded as the fundamental law for ordinary banks and other privatefinancial institutions. The Banking Law addresses capital adequacy, inspections and reporting to banks and bankholding companies, as well as the scope of business activities, disclosure, accounting, limitation on grantingcredit and standards for arm’s length transactions for them. Bank holding companies, banks and other financialinstitutions are required to establish an appropriate system to better cope with conflicts of interest that may arisefrom their business operations.
Legislation has recently been passed by, or introduced to, the Diet to amend various financial regulationrelated laws, including the Banking Law, which includes certain deregulations on restrictions for shareholdingsby banks. For example, although a bank is generally prohibited from holding more than 5% of the outstandingshares of another company (other than certain financial institutions) under the Banking Law, the bank may beexempt from such requirement and allowed to hold more than 5% of the outstanding shares of such companyunder amendments to the Banking Law that became effective in April 2014, if, among other exempted cases, abank’s shareholding contributes to revitalizing a company’s business or the local economy related to suchcompany. In May 2016, the Diet passed legislation to amend the Banking Law to allow banks and bank holdingcompanies with the FSA’s approval to hold controlling interests in certain financial technology companies. Theamendments became effective as of April 1, 2017. As a result of the amendments, banks and bank holdingcompanies may now acquire and hold more than 5% of the voting rights in certain financial technologycompanies, subject to the approval of the Commissioner of the FSA. In May 2017, a bill to amend the BankingLaw was passed by the Diet, with the aim to promote affiliation and cooperation between financial institutionsand financial technology companies while securing the protection of customers. The amendment becameeffective in June 2018. Further, a bill to amend the Banking Law was passed by the Diet in May 2019 and, underthe amendments, it is expected that banks will be allowed to engage in certain information provision servicesrelating to customer and other information.
Bank holding company regulations. A bank holding company is prohibited from carrying out any businessother than the management of its subsidiaries and other incidental businesses. A bank holding company may haveany of the following as a subsidiary: a bank, a securities company, an insurance company, a foreign subsidiarythat is engaged in the banking, securities or insurance business and any company that is engaged in a finance-related business, such as a credit card company, a leasing company, investment advisory company, or financial
50

technology company as permitted by the April 1, 2017 amendments to the Banking Law. Certain companies thatare designated by a ministerial ordinance as those that cultivate new business fields may also become thesubsidiaries of a bank holding company.
In addition, under the April 1, 2017 amendments to the Banking Law, a bank holding company (i) isrequired to perform certain specified functions as a bank holding company to ensure effective management of itssubsidiaries and (ii) is allowed to engage in certain specified common operations of its subsidiaries so as toimprove the efficiency of the operations of its group companies.
Capital adequacy. The capital adequacy guidelines adopted by the FSA that are applicable to Japanesebank holding companies and banks with international operations closely follow the risk-weighted approachintroduced by the Basel Committee on Banking Supervision of the Bank for International Settlements.
Basel II, as adopted by the FSA, has been applied to Japanese banks since March 31, 2007. Basel III, asadopted by the FSA, has been applied to Japanese banking institutions with international operations conductedthrough their foreign offices since March 31, 2013. Basel III is built on “three pillars”: (1) minimum capitalrequirements, (2) the self-regulation of financial institutions based on supervisory review process, and (3) marketdiscipline through the disclosure of information.
The Group of Central Bank Governors and Heads of Supervision reached an agreement on the new globalregulatory framework, which has been referred to as “Basel III,” in July and September 2010. In December 2010,the Basel Committee agreed on the details of the Basel III rules. The agreement on Basel III includes thefollowing: (1) raising the quality of capital to ensure banks are able to better absorb losses both on a goingconcern basis and on a gone concern basis, (2) increasing the risk coverage of the capital framework, in particularfor trading activities, securitizations, exposures to off-balance sheet vehicles and counterparty credit exposuresarising from derivatives, (3) raising the level of minimum capital requirements, including an increase in theminimum common equity requirement from 2% to 4.5%, which was phased in between January 1, 2013 and theend of the calendar year 2014, and a capital conservation buffer of 2.5%, which was phased in betweenJanuary 1, 2016 and the end of the calendar year 2018, bringing the total common equity requirement to 7%,(4) introducing an internationally harmonized leverage ratio to serve as a backstop to the risk-based capitalmeasure and to contain the build-up of excessive leverage in the system, (5) raising standards for the supervisoryreview process (Pillar 2) and public disclosures (Pillar 3), together with additional guidance in the areas ofvaluation practices, stress testing, liquidity risk management, corporate governance and compensation,(6) introducing minimum global liquidity standards consisting of both a short term liquidity coverage ratio and alonger term structural net stable funding ratio, and (7) promoting the build-up of capital buffers that can be drawndown in periods of stress, including both a capital conservation buffer and a countercyclical buffer to protect thebanking sector from periods of excess credit growth.
Under Basel III, Common Equity Tier 1, Tier 1 and total capital ratios are used to assess capital adequacy,which ratios are determined by dividing applicable capital components by risk-weighted assets. Total capital isdefined as the sum of Tier 1 and Tier 2 capital.
Under Basel III, Tier 1 capital is defined to include Common Equity Tier 1 and Additional Tier 1 capital.Common Equity Tier 1 capital is a new category of capital primarily consisting of:
‰ common stock,
‰ capital surplus,
‰ retained earnings, and
‰ accumulated other comprehensive income.
Regulatory adjustments including certain intangible fixed assets, such as goodwill, and defined benefitpension fund net assets (prepaid pension costs) will be deducted from Common Equity Tier 1 capital.
51
Additional Tier 1 capital generally consists of Basel III compliant preferred securities and, during thetransition period, other capital that meets Tier I requirements under the former Basel II standards, net ofregulatory adjustments.
Tier 2 capital generally consists of:
‰ Basel III compliant subordinated obligations,
‰ during the transition period, capital that meets Tier II requirements under the former Basel II standards,
‰ allowances for credit losses, and
‰ non-controlling interests in subsidiaries’ Tier 2 capital instruments.
In order to qualify as Tier 1 or Tier 2 capital under Basel III, applicable instruments such as preferred sharesand subordinated debt must have a clause in their terms and conditions that requires them to be written-off orforced to be converted into common stock upon the occurrence of certain trigger events.
Risk-weighted assets are the sum of risk-weighted assets compiled for credit risk purposes, quotient ofdividing the amount equivalent to market risk by 8%, and quotient of dividing the amount equivalent tooperational risk by 8%, and also include any amount to be added due to transitional measures as well as flooradjustments, if necessary. Risk-weighted assets include the capital charge of the credit valuation adjustment, orCVA, the credit risk related to asset value correlation multiplier for large financial institutions, the 250% risk-weighted threshold items not deducted from Common Equity Tier 1 capital, and certain Basel II capitaldeductions that were converted to risk-weighted assets under Basel III, such as securitizations and significantinvestments in commercial entities. Certain Basel III provisions were adopted by the FSA with transitionalmeasures and became effective March 31, 2013.
The capital ratio standards applicable to us are as follows:
‰ a minimum total capital ratio of 8.0%,
‰ a minimum Tier 1 capital ratio of 6.0%, and
‰ a minimum Common Equity Tier 1 capital ratio of 4.5%.
These minimum capital ratios are applicable to MUFG on a consolidated basis and to MUFG Bank andMitsubishi UFJ Trust and Banking on a consolidated as well as stand-alone basis.
We have been granted an approval by the FSA to exclude the majority of our investment in Morgan Stanleyfrom being subject to double gearing adjustments. The approval was granted for a 10-year period, but theapproval amount will be phased out by 20% each year starting from March 31, 2019. As of March 31, 2019, afull application of double gearing adjustments with respect to our investment in Morgan Stanley would havereduced our Common Equity Tier 1 capital ratio by approximately 0.9%.
The Financial Stability Board identified us as a global systematically important bank, or G-SIB, in its mostrecent annual report published in November 2018, and is expected to update the list of G-SIB annually. InDecember 2015, the FSA also designated us as a G-SIB as well as a domestic systemically important bankgenerally referred to as a “D-SIB.”
Effective March 31, 2016, the FSA’s capital conservation buffer, countercyclical buffer and G-SIBsurcharge requirements became applicable to Japanese banking institutions with international operationsconducted through foreign offices, including us. The requirements as of March 31, 2019 consist of a capitalconservation buffer of 2.5%, a G-SIB surcharge of 1.5% and a countercyclical buffer of 0.04% in addition to the4.50% minimum Common Equity Tier 1 capital ratio.
52

In December 2017, the Group of Central Bank Governors and Heads of Supervision released final Basel IIIreforms. The reforms are designed, among other things, to help reduce excessive variability in risk-weightedassets among banks and improve the comparability and transparency of banks’ risk-based capital ratios. Thereforms endorsed by the Group of Central Bank Governors and Heads of Supervision include the followingelements:
‰ a revised standardized approach for credit risk, which is designed to improve the robustness and risksensitivity of the existing approach;
‰ revisions to the internal ratings-based approach for credit risk, where the use of the most advancedinternally modelled approaches for low-default portfolios will be limited;
‰ revisions to CVA framework, including the removal of the internally modelled approach and theintroduction of a revised standardized approach;
‰ a revised standardized approach for operational risk, which will replace the existing standardizedapproaches and the advanced measurement approaches;
‰ revisions to the measurement of the leverage ratio and a leverage ratio buffer for G-SIBs, which willtake the form of a Tier 1 capital buffer set at 50% of a G-SIB’s risk-weighted capital buffer; and
‰ an aggregate output floor, which is designed to ensure that banks’ risk-weighted assets generated byinternal models are no lower than 72.5% of risk-weighted assets as calculated by the Basel IIIframework’s standardized approaches. Banks will also be required to disclose their risk-weighted assetsbased on these standardized approaches.
Most of the reforms are expected to become effective on January 1, 2022, subject to implementation throughlegislation and regulation in each of the relevant jurisdictions, including Japan.
In January 2019, the Group of Central Bank Governors and Heads of Supervision approved the BaselCommittee on Banking Supervision’s finalized market risk capital framework. The approved market riskframework is expected to become effective on January 1, 2022, subject to implementation through legislation andregulation in each of the relevant jurisdictions, including Japan.
For a discussion on our capital ratios, see “Item 5.B. Operating and Financial Review and Prospects—Liquidity and Capital Resources—Capital Adequacy.”
Leverage ratio. Japanese banks and bank holding companies with international operations are required todisclose their leverage ratios calculated in accordance with the methodology prescribed in the FSA guidance thathas been adopted to implement the relevant Basel III standard. The leverage ratio is designed for monitoring andpreventing the build-up of excessive leverage in the banking sector and is expressed as the ratio of Tier 1 capitalto total balance sheet assets adjusted in accordance with the FSA guidance. In December 2017, the Group ofCentral Bank Governors and Heads of Supervision announced final Basel III reforms. The announced reformsinclude the revisions to the measurement of the leverage ratio and a 3.00% minimum leverage ratio requirement,plus a G-SIB leverage ratio buffer equal to 50% of the applicable G-SIB capital surcharge. The announcementsets forth implementation dates of January 1, 2018 for the minimum leverage ratio requirement and January 1,2022 for the G-SIB leverage ratio buffer requirement. In Japan, the minimum leverage ratio requirement as ofMarch 31, 2019 is 3.00%.
Total loss-absorbing capacity. In November 2015, the Financial Stability Board issued the final TotalLoss-Absorbing Capacity, or TLAC, standard for G-SIBs, including us. The Financial Stability Board’s TLACstandard is designed to ensure that if a G-SIB fails, it has sufficient loss-absorbing and recapitalization capacityavailable in resolution to implement an orderly resolution that minimizes impacts on financial stability, ensuresthe continuity of critical functions, and avoids exposing public funds to loss. The Financial Stability Board’sTLAC standard defines a minimum requirement for the instruments and liabilities that should be readilyavailable to absorb losses in resolution.
53
The Japanese TLAC Standard, which was published by the FSA in March 2019 and became applicable toG-SIBs in Japan on March 31, 2019, and the FSB’s TLAC standard require entities designated as DomesticResolution Entities for Covered SIBs to meet certain minimum external total loss-absorbing capacity, or ExternalTLAC, requirements and to cause any of their material subsidiaries in Japan deemed systemically important bythe FSA or their foreign subsidiaries subject to TLAC or similar requirements in the relevant jurisdictions tomaintain certain minimum level of capital and debt having internal total loss-absorbing and recapitalizationcapacity, or Internal TLAC.
In the Japanese TLAC Standard, the FSA has designated the relevant ultimate holding companies in Japanas Domestic Resolution Entities for the Covered SIBs and, in our case, MUFG as the Domestic Resolution Entityfor our Group, making MUFG subject to the External TLAC requirements in Japan. The FSA has also designatedMUFG Bank, Mitsubishi UFJ Trust and Banking and Mitsubishi UFJ Morgan Stanley Securities as MUFG’smaterial subsidiaries in Japan, which are subject to the Internal TLAC requirements applicable to MUFG.
External TLAC debt generally consists of Basel III compliant regulatory capital, including, during thetransition period, capital that meets the applicable regulatory capital requirements under the former Basel IIstandards, and the Japanese TLAC Standard compliant obligations, net of regulatory adjustments. Internal TLACdebt generally consists of Basel III compliant regulatory capital, including, during the transition period, capitalthat meets the applicable regulatory capital requirements under the former Basel II standards, and the JapaneseTLAC Standard compliant subordinated obligations, net of regulatory adjustments. The Japanese TLAC Standarddoes not require that, in order for unsecured senior debt issued by the Domestic Resolution Entity of a JapaneseG-SIB to qualify as External TLAC debt, such debt be subject to any contractual write-down, write-off orconversion provisions or to any subordination provisions so long as its creditors are recognized as structurallysubordinated to the creditors of its subsidiaries and affiliates by the FSA on the ground that the amount ofexcluded liabilities of such Domestic Resolution Entity ranking pari passu with, or junior to, its unsecured seniorliabilities does not, in principle, exceed 5% of the aggregate amount of its External TLAC. In contrast, InternalTLAC debt incurred by a material subsidiary of a Japanese G-SIB is required to be subject to contractual lossabsorption provisions and to be subordinated to such subsidiary’s excluded liabilities.
The Financial Stability Board’s TLAC standard requires a G-SIB to hold TLAC in an amount not less than16% of its risk-weighted assets and 6% of the applicable Basel III leverage ratio denominator by January 1, 2019,and not less than 18% of its risk-weighted assets and 6.75% of the applicable Basel III leverage ratiodenominator by January 1, 2022.
The Japanese TLAC Standard requires a Japanese G-SIB, including us, to hold external TLAC debt in an amountnot less than 16% of its risk-weighted assets and 6% of the applicable Basel III leverage ratio denominator on and afterMarch 31, 2019, and not less than 18% of its risk-weighted assets and 6.75% of the applicable Basel III leverage ratiodenominator on and after March 31, 2022. Under the FSA TLAC Standard, Japanese G-SIBs are or will be allowed tocount the Japanese Deposit Insurance Fund Reserves in an amount equivalent to 2.5% of their consolidated risk-weighted assets from 2019 and 3.5% of their consolidated risk-weighted assets from 2022 as external TLAC.
Under the Japanese TLAC Standard, the FSA may order the Domestic Resolution Entity of a JapaneseG-SIB to submit a report outlining an improvement plan if the External TLAC ratio of the Domestic ResolutionEntity or the Internal TLAC of its material subsidiaries in Japan falls below the minimum requirements. If theFSA further deems it necessary to ensure improvement, the FSA may issue a business improvement order to suchDomestic Resolution Entity.
The Domestic Resolution Entity may also be subject to a capital distribution constraints plan if the capitalbuffers are used and reduced below the required level to make up for its required External TLAC on a risk-weighted assets basis.
See “Item 3.D Key Information—Risk Factors—Risks Related to Our Business—may not be able tomaintain our capital ratios and other regulatory ratios above minimum required levels, which could result invarious regulatory actions, including the suspension of some or all of our operations.”
54

Prompt corrective action system. Under the prompt corrective action system, the FSA may take correctiveaction, if a bank or a bank holding company fails to meet the minimum capital adequacy ratio or leverage ratio.These actions include requiring such bank or bank holding company to formulate and implement capitalimprovement measures, requiring it to reduce assets or the bank’s business operations or take other specificactions, and issuing an order to dispose of shares of its subsidiaries or suspend all or part of the bank’s businessoperations.
Capital distribution constraints system. Under the capital distribution constraints system, the FSA mayorder a bank or a bank holding company to submit and carry out a capital distribution constraints plan, if thebank or the bank holding company fails to hold Common Equity Tier 1 capital required as applicable capitalbuffers. A capital distribution plan must be determined to be reasonably designed to restore the required capitalbuffers by restricting capital distributions, such as dividends, share buybacks and bonus payments, up to a certainamount depending on the level of the deficit in the required capital buffers of the bank or the bank holdingcompany.
Prompt warning system. Under the prompt warning system, the FSA may take precautionary measures tomaintain and promote the sound operations of financial institutions, even before those financial institutionsbecome subject to prompt corrective actions. These measures require a financial institution to enhanceprofitability, credit risk management, stability and cash flows.
Deposit insurance system and government measures for troubled financial institutions. The DepositInsurance Act is intended to protect depositors if a financial institution fails to meet its obligations. The DepositInsurance Corporation was established in accordance with the Deposit Insurance Act.
City banks, including MUFG Bank, regional banks, trust banks, including Mitsubishi UFJ Trust andBanking, and various other credit institutions participate in the deposit insurance system on a compulsory basis.
Under the Deposit Insurance Act, the maximum amount of protection is ¥10 million per customer withinone bank. The ¥10 million maximum applies to all deposits except for non-interest bearing deposits, which arenon-interest bearing deposits redeemable on demand and maintained by depositors primarily in settlementaccounts for payment and settlement purposes. Deposits in settlement accounts are fully protected without amaximum amount limitation. Certain types of deposits are not covered by the deposit insurance system, such asforeign currency deposits and negotiable certificates of deposit. As of April 1, 2019, the Deposit InsuranceCorporation charged an insurance premium equal to 0.045% per year on the deposits in the settlement accounts,and a premium equal to 0.032% per year on the deposits in other accounts.
Under the Deposit Insurance Act, a Financial Reorganization Administrator can be appointed by the PrimeMinister if a bank’s liabilities exceed its obligations or has suspended, or is likely to suspend, repayment ofdeposits. The Financial Reorganization Administrator will take control of the assets of the troubled bank, disposeof the assets and search for another institution willing to take over the troubled bank’s business. The troubledbank’s business may also be transferred to a “bridge bank” established by the Deposit Insurance Corporation toenable the troubled bank’s operations to be maintained and continue temporarily, and the bridge bank will seek totransfer the troubled bank’s assets to another financial institution or dissolve the troubled bank. The DepositInsurance Corporation protects deposits, as described above, either by providing financial aid for costs incurredby the financial institution succeeding the insolvent bank or by paying insurance money directly to depositors.The financial aid provided by the Deposit Insurance Corporation may take the form of a monetary grant, loan ordeposit of funds, purchase of assets, guarantee or assumption of debt, subscription for preferred stock, or losssharing.
The Deposit Insurance Act also provides for exceptional measures to cope with systemic risk in the financialindustry. Where the Prime Minister recognizes that the failure of a bank which falls into any of (i) through
55
(iii) below may cause an extremely grave problem to the maintenance of the financial order in Japan or theregion where such bank is operating, or systemic risk, if none of the measures described in (i) through (iii) belowis implemented, the Prime Minister may, following deliberation by the Financial Crisis Response Council,confirm (nintei) the need to take any of the following measures: (i) if the bank does not fall into either of thecategories described in (ii) or (iii) below, the Deposit Insurance Corporation may subscribe for shares orsubordinated bonds of, or extend subordinated loans to the bank, or subscribe for shares of the bank holdingcompany of the bank, in order to enhance the bank’s regulatory capital (“Item 1 measures” (dai ichigo sochi));(ii) if the bank has suspended, or is likely to suspend, repayment of deposits, or its liabilities exceed its assets,financial aid exceeding the pay-off cost may be made available to such bank (“Item 2 measures” (dai nigosochi)); and (iii) if the bank has suspended, or is likely suspend, repayment of deposits, and its liabilities exceedits assets, and the systemic risk cannot be avoided by the measures mentioned in (ii) above, the Deposit InsuranceCorporation may acquire all of the bank’s shares (“Item 3 measures” (dai sango sochi)). The expenses for theimplementation of the above measures will be borne by the banking industry, with an exception under which theJapanese government may provide partial subsidies for such expenses.
Under the new orderly resolution regime established by amendments to the Deposit Insurance Act that werepromulgated in June 2013 and became effective on March 6, 2014, financial institutions, including banks,insurance companies and securities companies and their holding companies, are subject to the regime. Further,where the Prime Minister recognizes that the failure of a financial institution which falls into either of (a) or(b) below may cause a significant disruption to the Japanese financial market or system in Japan if measuresdescribed in (a) or measures described in (b) are not taken, the Prime Minister may, following deliberation by theFinancial Response Crisis Council, confirm (nintei) that any of the following measures need to be applied to thefinancial institution:
(a) if the financial institution is not a financial institution whose liabilities exceed its assets, the financialinstitution shall be placed under the special supervision by the Deposit Insurance Corporation over thefinancial institution’s business operations and management and the disposal of the financialinstitution’s assets, and the Deposit Insurance Corporation may provide the financial institution withloans or guarantees necessary to avoid the risk of significant disruption to the financial system inJapan, or subscribe for shares or subordinated bonds of, or extend subordinated loans to, the financialinstitution, taking into consideration the financial condition of the financial institution (“Specified Item1 measures” (tokutei dai ichigo sochi) under Article 126-2, Paragraph 1, Item 1 of the DepositInsurance Act); or
(b) if the financial institution is a financial institution whose liabilities exceed, or are likely to exceed, itsassets or which has suspended, or is likely to suspend, payments on its obligations, the financialinstitution shall be placed under the special supervision by the Deposit Insurance Corporation over thefinancial institution’s business operations and management and the disposal of the financialinstitution’s assets, and the Deposit Insurance Corporation may provide financial aid necessary to assista merger, business transfer, corporate split or other reorganization in respect of such failed financialinstitution (“Specified Item 2 measures” (tokutei dai nigo sochi) under Article 126-2, Paragraph 1,Item 2 of the Deposit Insurance Act).
If the Prime Minister confirms that any of the measures set out in (b) above needs to be applied to a failedfinancial institution, the Prime Minister may order that the failed financial institution’s business operations andmanagement and the disposal of the failed financial institution’s assets be placed under the special control of theDeposit Insurance Corporation under Article 126-5 of the Deposit Insurance Act. The business or liabilities of thefinancial institution subject to the special supervision or the special control of the Deposit Insurance Corporationas set forth above may also be transferred to a “bridge financial institution” established by the Deposit InsuranceCorporation to enable the financial institution’s operations to be maintained and continue temporarily, or thefinancial institution’s liabilities to be repaid, and the bridge financial institution will seek to transfer the financialinstitution’s business or liabilities to another financial institution or dissolve the financial institution. Thefinancial aid provided by the Deposit Insurance Corporation to assist a merger, business transfer, corporate splitor other reorganization in respect of the failed financial institution set out in (b) above may take the form of a
56

monetary grant, loan or deposit of funds, purchase of assets, guarantee or assumption of debts, subscription forpreferred stock or subordinated bonds, subordinated loan, or loss sharing. If the Deposit Insurance Corporationhas provided such financial assistance, the Prime Minister may designate the movable assets and claims of thefailed financial institution as not subject to attachment under Article 126-16 of the Deposit Insurance Act, andsuch merger, business transfer, corporate split or other reorganization may be conducted outside of the court-administrated insolvency proceedings. If the financial institution subject to the special supervision or the specialcontrol by the Deposit Insurance Corporation as set forth above has liabilities that exceed, or are likely to exceed,its assets, or has suspended, or is likely to suspend, payments on its obligations, the financial institution maytransfer all or a material portion of its business or all or a material portion of shares of its subsidiaries orimplement corporate split or certain other corporate actions with court permission in lieu of any shareholderresolutions under Article 126-13 of the Deposit Insurance Act. In addition, the Deposit Insurance Corporationmust request other financial institution creditors of the failed financial institution to refrain from exercising theirrights against the failed financial institution until measures necessary to avoid the risk of significant disruption tothe financial system in Japan have been taken, if it is recognized that such exercise of their rights is likely tomake the orderly resolution of the failed financial institution difficult.
The expenses for implementation of the measures under this regime will be borne by the financial industry,with an exception under which the Japanese government may provide partial subsidies for such expenses withinthe limit to be specified in the government budget in cases where it is likely to cause extremely serious hindranceto the maintenance of the credit system in Japan or significant turmoil in the Japanese financial market or systemif such expenses are to be borne only by the financial industry.
According to the announcement made by the FSA in March 2014, (i) Additional Tier 1 instruments andTier 2 instruments under Basel III issued by a bank must be written down or converted into common shares whenthe Prime Minister confirms (nintei) that Item 2 measures (dai nigo sochi), Item 3 measures (dai sango sochi), orSpecified Item 2 measures (tokutei dai nigo sochi) need to be applied to the bank and (ii) Additional Tier 1instruments and Tier 2 instruments under Basel III issued by a bank holding company must be written down orconverted into common shares when the Prime Minister confirms (nintei) that Specified Item 2 measures (tokuteidai nigo sochi) need to be applied to the bank holding company.
Further, in an explanatory paper outlining the FSA’s approach for the introduction of the TLAC frameworkin Japan published by the FSA in April 2016 and revisions to the paper published by the FSA in April 2018,collectively the FSA TLAC Approach, and the TLAC standard set forth in the regulatory notices and relatedmaterials for the implementation of the TLAC requirements in Japan published by the FSA in March 2019, or theJapanese TLAC Standard, the FSA expressed its view that single point of entry, or SPE, resolution, in which asingle national resolution authority applies its resolution tools to the ultimate holding company in Japan of afinancial group, would be the preferred strategy for resolution of Japanese G-SIBs and a domestic systemicallyimportant bank, or D-SIBs, deemed to be in particular need for a cross-border resolution arrangement and ofparticular systemic significance to the Japanese financial system if it fails (such G-SIBs and D-SIBs, collectively,“Covered SIBs”). However, it is uncertain which measure is to be taken in a given case, including whether or notthe SPE resolution strategy will actually be elected and implemented in a given case, and the actual measures tobe taken will be determined on a case-by-case basis considering the actual condition of the relevant JapaneseG-SIB in distress. Under a possible model of resolution of a Japanese G-SIB based on the SPE resolution strategyas described in the Japanese TLAC Standard, if the FSA determines that a material subsidiary in Japan of afinancial institution that is a Japanese G-SIB is non-viable due to material deterioration in its financial conditionand issues an order concerning restoration of financial soundness, including recapitalization and restoration ofliquidity of such material subsidiary, to the ultimate holding company in Japan designated by the FSA asDomestic Resolution Entity for the financial institution under Article 52-33, Paragraph 1 of the Banking Act ofJapan (Act No. 59 of 1981), the material subsidiary’s Internal TLAC instruments will be written off or, ifapplicable, converted into equity in accordance with the applicable contractual loss absorption provisions of suchInternal TLAC instruments. Following the write-off or conversion of Internal TLAC instruments, if the PrimeMinister recognizes that the financial institution’s liabilities exceed, or are likely to exceed, its assets, or that ithas suspended, or is likely to suspend, payments on its obligations, as a result of the financial institution’s loans
57

to, or other investment in, the material subsidiary becoming subject to loss absorption or otherwise, and furtherrecognizes that the failure of such financial institution is likely to cause a significant disruption to the Japanesefinancial market or system, the Prime Minister may, following deliberation by the Financial Crisis ResponseCouncil, confirm that measures set forth in Article 126-2, Paragraph 1, Item 2 of the Deposit Insurance Act,generally referred to as Specified Item 2 Measures (tokutei dai nigo sochi), need to be applied to the financialinstitution for its orderly resolution. Any such confirmation by the Prime Minister also triggers the point ofnon-viability clauses of Additional Tier 1 and Tier 2 instruments issued by the financial institution, causing suchinstruments to be written off or, if applicable, converted into equity.
Upon the application of Specified Item 2 Measures (tokutei dai nigo sochi), a financial institution will beplaced under the special supervision by, or if the Prime Minister so orders, under the special control of, theDeposit Insurance Corporation. In an orderly resolution, the Deposit Insurance Corporation would control theoperation and management of a financial institution’s business, assets and liabilities, including the potentialtransfer to a bridge financial institution established by the Deposit Insurance Corporation as its subsidiary, orsuch other financial institution as the Deposit Insurance Corporation may determine, of the financial institution’ssystemically important assets and liabilities, which we expect in the case of MUFG would include the shares ofour material subsidiaries based on the Japanese TLAC Standard. The Prime Minister may prohibit creditors ofthe financial institution from attaching any of our assets and claims which are to be transferred to a bridgefinancial institution or another financial institution pursuant to Article 126-16 of the Deposit Insurance Act.Based on the Japanese TLAC Standard, it is currently expected that the External TLAC eligible senior notesissued by the financial institution will not be transferred to a bridge financial institution or other transferee in theorderly resolution process but will remain as such financial institution’s liabilities subject to court-administeredinsolvency proceedings. On the other hand, in an orderly resolution process, the shares of material subsidiaries ofsuch financial institution may be transferred to a bridge financial institution or other transferee, and suchfinancial institution would only be entitled to receive consideration representing the fair value of such shares,which could be significantly less than the book value of such shares. Following such business transfer, therecoverable value of such financial institution’s residual assets in court-administered insolvency proceedings maynot be sufficient to fully satisfy any payment obligations that such financial institution may have under itsliabilities, including the External TLAC eligible senior notes.
Recovery and resolution plan. In November 2018, the Financial Stability Board published the latest list ofG-SIBs, which includes us. The list is annually updated by the Financial Stability Board. A recovery andresolution plan must be put in place for each G-SIB, and the plans must be regularly reviewed and updated. InJapan, under the Banking Law and the Comprehensive Guidelines for Supervision of Major Banks, etc., financialinstitutions identified as G-SIBs must, as part of their crisis management, prepare and submit a recovery plan,including triggers for the recovery plan and an analysis of recovery options, to the FSA. The ComprehensiveGuidelines also provide that resolution plans for such financial institutions are prepared by the FSA. Wesubmitted our recovery plan to the FSA in December 2018.
Liquidity Coverage Ratio. Japanese banks and bank holding companies with international operations arerequired to disclose their LCRs calculated in accordance with the methodology prescribed in the FSA guidancethat has been adopted to implement the relevant Basel III standard. The LCR is a measure to determine whether abank has a sufficient amount of high-quality liquid assets, which are assets that can be converted easily andimmediately into cash in private markets in order to meet the bank’s liquidity needs, to survive in a 30-dayfinancial stress scenario, including sizable deposit outflows, inability to issue new bonds or access the interbankmarket, stoppage of the collateralized funding market, need for additional collateral in connection with derivativetransactions, and significant outflows of cash under commitment lines to customers. Once a bank or bank holdingcompany fails to meet the minimum LCR of 100%, it is required to immediately report such failure to the FSA. Ifthe FSA deems the financial condition of the bank or bank holding company to be serious, the FSA may issue abusiness improvement order. A minimum LCR of 100% is currently required.
Net Stable Funding Ratio. The NSFR is a measure to determine whether a bank has sustainable and long-term liabilities and capital for its assets and activities. The Basel Committee on Banking Supervision issued the
58

final standard of NSFR in October 2014. In Japan, details of the NSFR requirements are currently underdiscussion.
Inspection and reporting. The FSA has the authority to order reporting from, and inspect, banks andbanking holding companies in Japan. Based on its “Principles and Approaches of Inspection and Supervision,”the FSA seeks to evaluate the effectiveness of the operations and functions of financial institutions, supervisefinancial institutions based on proactive and forward-looking analyses, facilitate best practices among financialinstitutions, focus monitoring on high-priority issues, and integrate on- and off-site monitoring. The FSA isexpected to abolish the Financial Institutions Inspection Manual which has traditionally been understood to setforth the minimum standard for the operations of financial institutions in Japan.
Furthermore, the Securities and Exchange Surveillance Commission of Japan, or SESC, inspects banks inconnection with their securities business as well as financial instruments business operators, such as securitiesfirms. The Bank of Japan also conducts inspections of banks. The Bank of Japan Law provides that the Bank ofJapan and financial institutions may agree as to the form of inspection to be conducted by the Bank of Japan.
Laws limiting shareholdings of banks. The provisions of the Antimonopoly Act that generally prohibit abank from holding more than 5% of another company’s voting rights do not apply to a bank holding company.
However, the Banking Law prohibits a bank holding company and its subsidiaries from holding, on anaggregated basis, more than 15% of the voting rights of companies other than those which can legally becomesubsidiaries of bank holding companies. There have recently been amendments to various financial regulationrelated laws, including the Banking Law, which includes certain deregulations on restrictions for shareholdingsby banks, as described above.
In addition, a bank is prohibited from holding shares in other companies exceeding the aggregate of itsCommon Equity Tier 1 capital amount and Additional Tier 1 capital amount.
Restrictions on exposures to single large counterparties. The Banking Law prohibits banks and bankholding companies (on a consolidated basis with their subsidiaries and affiliates) from having exposuresexceeding 25% of the sum of their Tier 1 and Tier 2 capital to a single counterparty (on a consolidated basis withits subsidiaries and specially related parties as defined in the law). The Enforcement Order and the EnforcementOrdinance of the Banking Law are expected to be amended in light of the Basel Committee on BankingSupervision’s final standard published in April 2014, which, among other things, prohibits a large exposureexceeding 25% of Tier 1 capital and a G-SIB’s exposure to another G-SIB exceeding 15% of Tier 1 capital,requires recognition of exposures to credit risk mitigation providers and introduces a look-through approach forexposures to collective investment undertakings.
Financial Instruments and Exchange Act. The Financial Instruments and Exchange Act providesprotection for investors and also regulates sales of a wide range of financial instruments and services, requiringfinancial institutions to improve their sales rules and strengthen compliance frameworks and procedures. Amongthe instruments that the Japanese banks deal in, derivatives, foreign currency-denominated deposits, and variableinsurance and annuity products are subject to regulations covered by the sales-related rules of conduct under thelaw.
Article 33 of the Financial Instruments and Exchange Act generally prohibits banks from engaging insecurities transactions. However, bank holding companies and banks may, through a domestic or overseassecurities subsidiary, conduct all types of securities businesses, with appropriate approval from the FSA.Similarly, registered banks are permitted to provide securities intermediation services and engage in certain othersimilar types of securities related transactions, including retail sales of investment funds and government andmunicipal bonds.
Subsidiaries of bank holding companies engaging in the securities business are subject to the supervision ofthe FSA as financial instruments business operators. The Prime Minister has the authority to regulate the
59

securities industry and securities companies, which authority is delegated to the Commissioner of the FSA underthe Financial Instruments and Exchange Act. In addition, the SESC, an external agency of the FSA, isindependent from the FSA’s other bureaus and is vested with the authority to conduct day-to-day monitoring ofthe securities markets and to investigate irregular activities that hinder fair trading of securities, includinginspections of securities companies as well as banks in connection with their securities business. Furthermore,the Commissioner of the FSA delegates certain authority to the Director General of the Local Finance Bureau toinspect local securities companies and their branches. A violation of applicable laws and ordinances may result invarious administrative sanctions, including revocation of registration, suspension of business, administrativemonetary penalty or an order to discharge any director or executive officer who has failed to comply withapplicable laws and ordinances. Securities companies are also subject to the rules and regulations of the Japanesestock exchanges and the Japan Securities Dealers Association, a self-regulatory organization of securitiescompanies.
Act on Sales, etc. of Financial Instruments. The Act on Sales, etc. of Financial Instruments was enacted toprotect customers from incurring unexpected losses as a result of purchasing financial instruments. Under thisact, sellers of financial instruments have a duty to their potential customers to explain important matters such asthe nature and magnitude of risks involved regarding the financial instruments that they intend to sell. If a sellerfails to comply with the duty, there is a rebuttable presumption that the loss suffered by the customer due to theseller’s failure to explain is equal to the amount of decrease in the value of the purchased financial instruments.
Anti-money laundering laws. Under the Act on Prevention of Transfer of Criminal Proceeds, specifiedbusiness operators, including financial institutions, are required to verify customer identification data, preservetransaction records, and file Suspicions Transaction Reports with the FSA or other regulatory authorities in caseswhere any asset received through their business operations is suspected of being criminal proceeds.
Most recent amendments to the Act, which became effective on October 1, 2016, included, among others,(1) enhancement of customer due diligence including identification of beneficial owners who are natural personscontrolling corporate customers through voting rights or other means, and (2) stricter requirements for the risk-based approach through assessment of money laundering and terrorist financing risks and application of adequateresources effectively to mitigate such risks.
In February 2018, the FSA issued “Guidelines on Anti-Money Laundering and Terrorist Financing” torequire financial institutions to further strengthen their management of anti-money laundering and terroristfinancing functions and their risk-based approach used in such functions.
Further, recent amendments to the Enforcement Ordinance of the Act introduced requirements relating toonline KYC processes in November 2018 and are expected to strengthen the requirements for KYC processes forcustomers residing in remote areas in April 2020.
Acts concerning trust business conducted by financial institutions. Under the Trust Business Act, jointstock companies that are licensed by the Prime Minister as trust companies, including non-financial companies,are allowed to conduct trust business. In addition, under the Act on Provision, etc. of Trust Business by FinancialInstitutions, banks and other financial institutions, as permitted by the Prime Minister, are able to conduct trustbusiness. The Trust Business Act provides for a separate type of registration for trustees who conduct onlyadministration type trust business. The Trust Business Act also provides for various duties imposed on the trusteein accordance with and in addition to the Trust Act.
Regulatory developments relating to lending to small and medium-sized firms and others. The ActConcerning Temporary Measures to Facilitate Financing for Small and Medium-sized Firms and Others requiredfinancial institutions, among other things, to make an effort to reduce their customers’ burden of loan repaymentby employing methods such as modifying the term of loans at the request of eligible borrowers, including smalland medium-sized firms and individual home loan borrowers. This legislation also required financial institutionsto internally establish a system to implement the requirements of the legislation and periodically make public
60

disclosure of and report to the relevant authority on the status of implementation. Although this legislationexpired on March 31, 2013, the FSA continues to encourage financial institutions to continue to provide supportto small and medium-sized firms by the Supervisory Policy and Ordinance for Enforcement of the Baking Law inorder to encourage financial institutions to modify the terms of loans, provide smooth financing, and take activeroles in supporting operations of such firms.
Act on the Protection of Personal Information. With regard to protection of personal information, the Acton the Protection of Personal Information requires, among other things, Japanese banking institutions to limit theuse of personal information to the stated purposes and to properly manage the personal information in theirpossession, and forbids them from providing personal information to third parties without consent. If a bankviolates certain provisions of the act, the FSA may advise or order the bank to take proper action. In addition, theBanking Law and the Financial Instruments and Exchange Act contain certain provisions with respect toappropriate handling of customer information.
Act on the Use of Personal Identification Numbers in the Administration of Government Affairs. Pursuantto the Act on the Use of Personal Identification Numbers in the Administration of Government Affairs, whichbecame effective in October 2015, the Japanese government has adopted a Social Security and Tax NumberSystem, which is designed to (1) improve social security services, (2) enhance public convenience in obtaininggovernment services, and (3) increase the efficiency of the administration of government affairs. Under thissystem, a 12-digit unique number is assigned to each resident of Japan to identify and manage informationrelating to the resident for government service and tax purposes. Financial institutions are required to implementmeasures to ensure that such customer information will be protected from inappropriate disclosure and otherunauthorized use.
Act Concerning Protection of Depositors from Illegal Withdrawals Made by Counterfeit or StolenCards. The Act on Protection, etc. of Depositors and Postal Saving Holders from Unauthorized AutomatedWithdrawal, etc. Using Counterfeit Cards, etc. and Stolen Cards, etc. requires financial institutions to establishinternal systems to prevent illegal withdrawals of deposits made using counterfeit or stolen bank cards. The actalso requires a financial institution to compensate depositors for any amount illegally withdrawn using stolenbank cards except in certain cases, including those where the financial institution can verify that it acted in goodfaith without negligence and there was gross negligence on the part of the relevant depositor. In addition, the actprovides that illegal withdrawals with counterfeit bank cards are invalid unless the financial institution acted ingood faith without negligence and there was gross negligence on the part of the relevant account holder.
Government reforms to restrict maximum interest rates on consumer lending business. In December 2006,the Diet passed legislation to reform the regulations relating to the consumer lending business, includingamendments to the Act Regulating the Receipt of Contributions, Receipt of Deposits and Interest Rates which,effective June 18, 2010, reduced the maximum permissible interest rate from 29.2% per annum to20% per annum. The regulatory reforms also included amendments to the Law Concerning Lending Businesswhich, effective June 18, 2010, abolished the so-called “gray-zone interest.” Gray-zone interest refers to interestrates exceeding the limits stipulated by the Interest Rate Restriction Act (between 15% per annum to20% per annum depending on the amount of principal). Prior to June 18, 2010, gray-zone interests werepermitted under certain conditions set forth in the Law Concerning Lending Business. As a result of theregulatory reforms, all interest rates are now subject to the lower limits imposed by the Interest Rate RestrictionAct, compelling lending institutions, including our consumer finance subsidiaries and equity method investees, tolower the interest rates they charge borrowers. Furthermore, the new regulations, which became effective onJune 18, 2010, require, among other things, consumer finance companies to limit their lending to a singlecustomer to a maximum of one third of the customer’s annual income regardless of the customer’s repaymentcapability.
In addition, as a result of decisions made by the Supreme Court of Japan prior to June 18, 2010, imposingstringent requirements for charging such gray-zone interest rates, consumer finance companies have beenresponding to borrowers’ claims for reimbursement of previously collected interest payments in excess of the
61

limits stipulated by the Interest Rate Restriction Act. See “Item 3.D. Key Information—Risk Factors—RisksRelated to Our Business—Because of our loans to consumers and our shareholdings in companies engaged inconsumer lending, changes in the business or regulatory environment for consumer finance companies in Japanmay further adversely affect our financial results.”
Act on Special Provisions of the Income Tax Act, the Corporation Tax Act and the Local Tax Act Incidentalto Enforcement of Tax Treaties. Pursuant to the Amendments to the Act on Special Provisions of the IncomeTax Act, the Corporation Tax Act and the Local Tax Act Incidental to Enforcement of Tax Treaties, whichbecame effective in January 2017, financial institutions are required to collect certain information from theiraccountholders, including jurisdictions of tax residence, and report such information to the National Tax Agencyin accordance with the Common Reporting Standard as developed by the Organization for EconomicCo-operation and Development.
Recent Regulatory Actions. In May 2019, we received a decision from the European Commissionrequiring MUFG Bank to pay a fine due to an infringement of European Union competition law in 2010 and2011 by a forex trader formerly employed at MUFG Bank’s London Branch. In June 2019, we also received adecision from a Swiss regulator requiring MUFG Bank to pay a fine due to an infringement of Swiss competitionlaw by the same forex trader. See “Item 3.D. Key Information—Risk Factors—Risks Related to Our Business—We may become subject to regulatory actions or other legal proceedings relating to our transactions or otheraspects of our operations, which could result in significant financial losses, restrictions on our operations anddamage to our reputation.”
United States
As a result of our operations in the United States, we are subject to extensive U.S. federal and statesupervision and regulation.
Overall supervision and regulation. We are subject to supervision, regulation and examination withrespect to our U.S. operations by the FRB pursuant to the U.S. Bank Holding Company Act of 1956, as amended,or the BHCA, and the International Banking Act of 1978, as amended, or the IBA, because we and MUFG Bankare bank holding companies and foreign banking organizations, as defined pursuant to those statutes. The FRBfunctions as our “umbrella” supervisor under amendments to the BHCA effected by the Gramm-Leach-BlileyAct of 1999, which among other things:
‰ prohibited further expansion of the types of activities in which bank holding companies, acting directlyor through non-bank subsidiaries, may engage;
‰ authorized qualifying bank holding companies to opt to become “financial holding companies,” andthereby acquire the authority to engage in an expanded list of activities; and
‰ modified the role of the FRB by specifying new relationships between the FRB and the functionalregulators of non-bank subsidiaries of both bank holding companies and financial holding companies.
The BHCA generally prohibits each of a bank holding company and a foreign banking organization thatmaintains branches or agencies in the United States from, directly or indirectly, acquiring more than 5% of thevoting shares of any company engaged in non-banking activities in the United States unless the bank holdingcompany or foreign banking organization has elected to become a financial holding company, as discussedabove, or the FRB has determined, by order or regulation, that such activities are so closely related to banking asto be a proper incident thereto and has granted its approval to the bank holding company or foreign bankingorganization for such an acquisition. The BHCA also requires a bank holding company or foreign bankingorganization that maintains branches or agencies in the United States to obtain the prior approval of anappropriate federal banking authority before acquiring, directly or indirectly, the ownership of more than 5% ofthe voting shares or control of any U.S. bank or bank holding company. In addition, under the BHCA, aU.S. bank or a U.S. branch or agency of a foreign bank is prohibited from engaging in various tyingarrangements involving it or its affiliates in connection with any extension of credit, sale or lease of any propertyor provision of any services.
62
In October 2008, we, MUFG Bank, Mitsubishi UFJ Trust and Banking and MUFG Americas Holdingsinitially attained financial holding company status. In August 2016, Mitsubishi UFJ Trust and Bankingrelinquished its financial holding company status. Financial holding company status is subject to periodicregulatory review. A financial holding company is authorized to engage in an expanded list of activities deemedto be financial in nature or incidental to such financial activity as well as certain specified non-banking activitiesdeemed to be closely related to banking. In order to maintain the status as a financial holding company, a bankholding company must continue to meet certain standards established by the FRB. Those standards require that afinancial holding company exceed the minimum standards applicable to bank holding companies that have notelected to become financial holding companies. These higher standards include meeting the “well capitalized”and “well managed” standards for financial holding companies as defined in the regulations of the FRB. Failureto meet these standards, due to inadequate capital management or shortcomings in operations, results inrestrictions on the ability to engage in expanded activities as a financial holding company. In addition, a financialholding company must ensure that its U.S. banking subsidiaries meet certain minimum standards under theCommunity Reinvestment Act of 1977.
U.S. branches and agencies of subsidiary Japanese banks. Under the authority of the IBA, our bankingsubsidiaries, MUFG Bank and Mitsubishi UFJ Trust and Banking, operate five branches, two agencies and sevenrepresentative offices in the United States. MUFG Bank operates branches in Los Angeles, California; Chicago,Illinois; and two branches in New York, New York; agencies in Houston and Dallas, Texas; and representativeoffices in Washington, D.C; San Francisco, California; Seattle, Washington; Atlanta, Georgia; Minnetonka,Minnesota; Jersey City, New Jersey; and Florence, Kentucky. Mitsubishi UFJ Trust and Banking operates abranch in New York, New York.
The IBA provides, among other things, that the FRB may examine U.S. branches and agencies of foreignbanks, and each branch and agency shall be subject to on-site examination by the appropriate federal or statebank supervisor as frequently as would a U.S. bank. The IBA also provides that if the FRB determines that aforeign bank is not subject to comprehensive supervision or regulation on a consolidated basis by the appropriateauthorities in its home country, or if there is reasonable cause to believe that the foreign bank or its affiliate hascommitted a violation of law or engaged in an unsafe or unsound banking practice in the United States, the FRBmay order the foreign bank to terminate activities conducted at a branch or agency in the United States.
U.S. branches and agencies of foreign banks must be licensed, and are also supervised and regulated, by astate or by the Office of the Comptroller of the Currency, or the OCC, the federal regulator of U.S. nationalbanks. The OCC is an independent bureau of the U.S. Department of the Treasury. Effective November 7, 2017,all of the branches and agencies of MUFG Bank and Mitsubishi UFJ Trust and Banking in the United Statesconverted from state-licensed branches and agencies to federally-licensed branches and agencies supervised andregulated by the OCC. See “Item 8.A. Financial Information—Legal Proceedings.”
When opening a federal branch or agency, a foreign bank must establish and maintain a deposit accountwith an FRB member bank of at least (1) the amount of capital that would be required of a national bank beingorganized at the same location or (2) five percent of the total liabilities of the federal branch or agency, includingacceptances but excluding (i) accrued expenses and (ii) amounts due and other liabilities to offices, branches, andsubsidiaries of the foreign bank, whichever is greater. Federally-licensed branches and agencies must also submitwritten reports concerning their assets and liabilities and other matters, to the extent required by the OCC or theFRB, and are examined at periodic intervals by the OCC and the FRB.
U.S. banking subsidiaries. We indirectly own and control one U.S. bank, MUFG Union Bank, N.A.(known prior to July 1, 2014 as Union Bank, N.A.), through MUFG Bank and its subsidiary, MUFG AmericasHoldings, a registered bank holding company.
MUFG Union Bank is a national bank subject to the supervision, examination and regulatory authority ofthe OCC pursuant to the National Bank Act.
63
In regulating national banks such as MUFG Union Bank, the OCC has the power to examine those banks;approve or deny applications for new charters, branches, capital, or other changes in corporate or bankingstructure; take supervisory actions against national banks that do not comply with laws and regulations or thatotherwise engage in unsound practices; remove officers and directors, negotiate agreements to change bankingpractices, and issue cease and desist orders as well as civil money penalties; and issue rules and regulations, legalinterpretations, and corporate decisions governing investments, lending, and other practices. The OCC’s staff ofbank examiners conducts on-site reviews and provides sustained supervision of national banks. Examinersanalyze loan and investment portfolios, funds management, capital, earnings, liquidity, and sensitivity to marketrisk for national banks. Examiners also review internal controls, internal and external audit, and compliance withlaw, and evaluate management’s ability to identify and control risk.
In addition, the FDIC insures the deposits of MUFG Union Bank up to legally specified maximum amounts.In the event of a failure of an FDIC-insured bank, the FDIC is virtually certain to be appointed as receiver, andwould resolve the failure under provisions of the Federal Deposit Insurance Act. In the liquidation or otherresolution of a failed FDIC-insured depository institution, deposits in its U.S. offices and other claims foradministrative expenses and employee compensation are afforded priority over other general unsecured claims,including deposits in offices outside the United States, non-deposit claims in all offices and claims of a parentcompany. Moreover, under longstanding FRB policy, a bank holding company is expected to act as a source offinancial strength for its banking subsidiaries and to commit resources to support such banks.
Bank capital requirements and capital distributions. MUFG Union Bank is subject to applicable risk-based and leverage capital guidelines issued by U.S. regulators for banks and bank holding companies. Inaddition, MUFG Bank and Mitsubishi UFJ Trust and Banking, as foreign banking organizations that have U.S.branches and agencies and that are controlled by us, are subject to the FRB’s requirements that they be “well-capitalized” based on Japan’s risk based capital standards. MUFG Union Bank, MUFG Bank, Mitsubishi UFJTrust and Banking, and MUFG Americas Holdings are all “well capitalized” as defined under, and otherwisecomply with, all U.S. regulatory capital requirements applicable to them. The Federal Deposit InsuranceCorporation Improvement Act of 1991, or FDICIA, provides, among other things, for expanded regulation ofinsured depository institutions, including banks, and their parent holding companies. As required by FDICIA, thefederal banking agencies have established five capital tiers ranging from “well capitalized” to “criticallyundercapitalized” for insured depository institutions. As an institution’s capital position deteriorates, the federalbanking regulators may take progressively stronger actions, such as further restricting affiliate transactions,activities, asset growth or interest payments. In addition, FDICIA generally prohibits an insured depositoryinstitution from making capital distributions, including the payment of dividends, or the payment of anymanagement fee to its holding company, if the insured depository institution would be undercapitalized aftermaking such distribution or paying such dividend or fee.
The availability of dividends from insured depository institutions in the United States is limited by variousother statutes and regulations. The National Bank Act and other federal laws prohibit the payment of dividendsby a national bank under various circumstances and limit the amount a national bank can pay without the priorapproval of the OCC. In addition, state-chartered banking institutions are subject to dividend limitations imposedby applicable federal and state laws.
Other regulated U.S. subsidiaries. Our non-bank subsidiaries that engage in securities-related activities inthe United States are regulated by appropriate functional regulators, such as the SEC, any self-regulatoryorganizations of which they are members, and the appropriate state regulatory agencies. These non-banksubsidiaries are required to meet separate minimum capital standards as imposed by those regulatory authorities.
Anti-Money Laundering Initiatives, the Bank Secrecy Act and the USA PATRIOT Act. A major focus ofU.S. governmental policy relating to financial institutions in recent years has been, and continues to be, aimed atpreventing money laundering and terrorist financing. The USA PATRIOT Act of 2001, as incorporated into theBank Secrecy Act, substantially broadened the scope of U.S. anti-money laundering laws and regulations byimposing significant new compliance and due diligence obligations, creating new crimes and penalties and
64

expanding the extra-territorial jurisdiction of the United States. The U.S. Department of the Treasury has issued anumber of regulations that impose obligations on financial institutions to maintain appropriate policies,procedures and controls to detect, prevent and report potential money laundering and terrorist financing,including the collection of beneficial ownership information. The bank regulatory agencies carefully scrutinizethe adequacy of an institution’s compliance with these regulations and, as a result, there have been an increasednumber of regulatory enforcement actions. A financial institution’s failure to maintain and implement adequatepolicies, procedures and controls to prevent and detect money laundering and terrorist financing could haveserious legal and reputational consequences for the institution, including the incurrence of expenses to enhancethe relevant programs, the imposition of limitations on the scope of its operations and the imposition of fines andother monetary penalties. See “Item 3.D. Key Information—Risk Factors—Risks Related to Our Business—Wemay become subject to regulatory actions or other legal proceedings relating to our transactions or other aspectsof our operations, which could result in significant financial losses, restrictions on our operations and damage toour reputation.”
Foreign Corrupt Practices Act. In recent years, U.S. regulatory and enforcement agencies including theSEC and the U.S. Department of Justice have significantly increased their enforcement efforts of the ForeignCorrupt Practices Act, or the FCPA. The FCPA prohibits U.S. securities issuers, U.S. domestic entities, andparties doing substantial business within the United States (including their shareholders, directors, agents,officers, and employees) from giving, offering, or promising anything of value to foreign public officials in orderto obtain or retain any business advantage. The FCPA also requires U.S. securities issuers to maintain adequatebooks and records in such a way that they fairly reflect all transactions and dispositions of assets. Enforcementefforts have targeted a wide range of U.S. and foreign-based entities and have been based on a broad variety ofalleged fact patterns, and in a number of cases have resulted in the imposition of substantial criminal and civilpenalties or in agreed payments in settlement of alleged violations. Failure to maintain adequate anti-briberypolicies, procedures, internal controls, and books and records globally could have serious legal and reputationalconsequences for the institution, including the incurrence of expenses to enhance the relevant programs, as wellas the imposition of civil and criminal penalties.
Regulatory Reform Legislation. In response to the global financial crisis and the perception that laxsupervision of the financial industry in the United States may have been a contributing cause, legislationdesigned to reform the system for supervision and regulation of financial firms doing business in theUnited States, the so-called Dodd-Frank Act, was signed into law on July 21, 2010. The Dodd-Frank Act iscomplex and extensive in its coverage and contains a wide range of provisions that affect financial institutionsoperating in the United States, including our U.S. operations. Included among these provisions are sweepingreforms designed to reduce systemic risk presented by very large financial firms, promote enhanced supervision,regulation, and prudential standards for financial firms, establish comprehensive supervision of financialmarkets, impose new limitations on permissible financial institution activities and investments, expand regulationof the derivatives markets, protect consumers and investors from financial abuse, and provide the governmentwith the tools needed to manage a financial crisis. Key provisions that impact our operations are summarizedbelow. However, certain regulatory rules under the Dodd-Frank Act are not yet finalized, require furtherinterpretive guidance by the relevant supervisory agencies, or do not yet require us to fully implementcompliance procedures. Accordingly, while the legislation has an impact on our operations, including theimposition of significant compliance costs, we are unable to assess with certainty the full degree of impact of theDodd-Frank Act on our operations at this time.
Among the components of the Dodd-Frank Act that have impacted or may impact our operations are theprovisions relating to enhanced prudential standards, including capital, liquidity and structural requirements, the“Volcker Rule,” derivatives regulation, credit reporting, resolution plans, incentive-based compensation, theestablishment of the Consumer Financial Protection Bureau, and debit interchange fees. Although certain of theregulatory rules regarding the foregoing components are still pending, as noted above, based on informationcurrently available to us, other than the Volcker Rule and derivatives regulations as discussed below, the impactof these components is expected to be mainly limited to our U.S. operations and not to be material to us on a
65

consolidated basis. We intend to continue to monitor developments relating to the Dodd-Frank Act and thepotential impact on our activities inside and outside of the United States.
With respect to the Dodd-Frank Act provisions related to enhanced prudential standards, in February 2014the FRB issued final rules that established enhanced prudential standards for the U.S. operations of foreignbanking organizations such as MUFG. These rules required us to organize by July 1, 2016 all of our U.S. bankand non-bank subsidiaries, with certain limited exceptions, under a U.S. IHC that is subject to U.S. capitalrequirements and enhanced prudential standards comparable to those applicable to top-tier U.S. bank holdingcompanies of the same size. Under these rules, we were required to change the structure of our U.S. operations,including the manner in which we oversee and manage those operations, and may be required to inject additionalcapital into our U.S. operations. We have designated MUFG Americas Holdings as our IHC.
MUFG Americas Holdings is subject to various U.S. prudential requirements and has become subject toothers with the designation of MUFG Americas Holdings as our IHC as of July 1, 2016. MUFG AmericasHoldings was previously subject to risk-based and leverage capital requirements, liquidity requirements, andother enhanced prudential standards applicable to large U.S. bank holding companies. MUFG Americas Holdingswas also subject to capital planning and stress testing requirements. MUFG Americas Holdings is now subject tothe capital planning and stress testing requirements and certain enhanced prudential standards applicable to IHCs.On June 22, 2017, the FRB released the results of the 2017 Dodd-Frank Act stress tests. It found that, even in theseverely adverse economic stress test scenario, MUFG Americas Holdings would maintain capital ratios wellabove the required minimum levels. On June 28, 2017, the FRB announced that it had no objections to the capitalplan submitted by MUFG Americas Holdings as part of the 2017 Comprehensive Capital Analysis and Review,or CCAR. The FRB announced early in 2017 that MUFG Americas Holdings would not be subject to thequalitative portion of the CCAR.
The FRB has the authority to examine an IHC and any of its subsidiaries. U.S. leverage requirementsapplicable to the IHC took effect beginning in January 2018. MUFG Americas Holdings is subject to arequirement to maintain an LCR equal to at least 100% based on total projected net cash outflows over a30-calendar day period, effectively using net cash outflow assumptions equal to 70% of the outflow assumptionsprescribed for internationally active banking organizations. Our combined U.S. operations, including MUFGBank’s and Mitsubishi UFJ Trust and Banking’s branches, are also subject to certain requirements related toliquidity and risk management.
The Volcker Rule was issued in final form by the Federal Reserve in December 2013. Under the VolckerRule, we are required to cease conducting certain proprietary trading activities, which means trading in securitiesand financial instruments for our own account, subject to certain exceptions, including market-making, hedging,and underwriting activities if such activities are conducted within a rigorous compliance framework. We are alsorestricted from engaging in certain activities regarding hedge funds and private equity funds, or covered funds.While the Volcker Rule excludes restrictions on such activities conducted solely outside of the United States, theregulatory definition of such exempted activities is narrow and complex and in some cases requires furtherclarification. Our proprietary trading and covered funds activities are generally executed outside of theUnited States, but certain activities within the United States could potentially have fallen within the scope of theRule. We have undertaken steps that we believe are appropriate to bring our activities and investments intocompliance with the Rule. In June 2018, the five Volcker Rule agencies each subsequently approved a notice ofproposed rulemaking seeking comments and proposing certain modifications to certain aspects of the VolckerRule. Although we are continuing to consider the effect of any proposed changes, given the limited amount ofrestricted activities in which we engage within the United States, we do not expect any final changes to theVolcker Rule to be material to our operations.
U.S. regulators continue to issue final regulations and regulatory determinations governing swaps andderivatives markets as contemplated by the Dodd-Frank Act. To date, MUFG Bank and Mitsubishi UFJSecurities International, plc, have registered as swap dealers with the U.S. Commodity Futures TradingCommission, or CFTC. Depending on the finalization of regulations and regulatory determinations governing
66

swaps and derivatives markets under the Dodd-Frank Act, as well as the activities of our other subsidiarieslocated inside and outside of the United States, our other subsidiaries may have to register as swap dealers with,or be subject to the regulations of, the CFTC and/or SEC. Regulation of swap dealers by the CFTC and SECimposes numerous corporate governance, business conduct, capital, margin, reporting, clearing, execution, andother regulatory requirements on our operations, which may adversely impact our derivatives businesses andmake us less competitive than those competitors that are not subject to the same regulations. Although manyregulations applicable to swap dealers are already in effect, it is difficult to assess the full impact of theserequirements because some of the most important regulatory determinations have not yet been implemented orfinalized. For example, U.S. regulators have adopted guidance and rules on the application of U.S. regulations toactivities of registered swap dealers outside of the United States. The extraterritorial application of swap dealerregulatory requirements imposes significant operational and compliance burdens on our swaps activities outsideof the United States.
On June 14, 2018, the FRB approved a final rule regarding single counterparty credit limits, or SCCL, forlarge banking organizations. The SCCL final rule is considered the last major piece of regulatory action neededto implement Section 165(e) of the Dodd-Frank Act. Section 165(e) was a response to the concern that failure orfinancial distress of one large, interconnected financial institution could cascade through the U.S. financialsystem and impair the financial condition of that firm’s counterparties, including other large, interconnectedfirms. Section 165(e) generally, and the SCCL final rule specifically, seek to mitigate this risk by limiting theaggregate exposure among such financial institutions and their counterparties. The deadlines for compliance withthe requirements of the final rule are in 2020. We are currently implementing a risk and compliance program tosatisfy the requirements as they relate to MUFG Americas Holdings, and we are continuing to analyze therequirements of the final rule and its impact on the combined U.S. operations of MUFG.
On April 8, 2019, the FRB issued two proposals that would (1) tailor the framework for application ofenhanced prudential standards to foreign banking organizations and (2) modify the application of capital andliquidity requirements to the U.S. operations of foreign banking organizations. The proposals utilize the sameframework as the October 2018 proposal applicable to U.S. BHCs but with a differing calibration for foreignbanking organizations.
The first proposal, promulgated solely by the FRB, would determine the applicability of certain enhancedprudential standards requirements, including liquidity stress testing and management, capital planning and stresstesting, risk management, single counterparty credit limits requirements, and related regulatory reporting bycategorizing all foreign banking organizations with $100 billion or more in combined U.S. assets into threecategories. The second proposal, to be issued jointly by the FRB, the OCC, and the FDIC, would similarlycategorize foreign banking organizations and tailor the application of the agencies’ regulatory capital andstandardized liquidity requirements on that basis. The comment period for both proposals ended on June 21,2019. The final rule is expected to take effect at the same time as the domestic proposal currently onNovember 20, 2019.
The FRB also approved a third proposal, to be jointly issued with the FDIC, that would revise the jointregulation implementing the resolution planning requirements of Section 165(d) of the Dodd-Frank Act. Thecomment period ended on June 21, 2019, and the final rule is proposed to take effect on November 20, 2019.
Foreign Account Tax Compliance Act. The Hiring Incentives to Restore Employment Act was enacted inMarch 2010 and contains provisions commonly referred to as the Foreign Account Tax Compliance Act, orFATCA. The U.S. Treasury, acting through the Internal Revenue Service, or the IRS, issued final FATCAregulations in January 2013. FATCA created a new reporting and withholding regime for U.S. and foreignfinancial institutions, or FFIs, and certain non-financial foreign entities, or NFFEs.
In addition, the FATCA framework has been expanded with the introduction of IntergovernmentalAgreements between the U.S. Treasury and foreign governments, which pursue a framework for
67
intergovernmental cooperation to facilitate the implementation of FATCA. The United States has entered intovarious Intergovernmental Agreements with non-U.S. jurisdictions including Japan. FATCA and theIntergovernmental Agreements became effective from July 1, 2014.
In connection with FATCA, we have assessed and determined if our group entities are U.S. withholdingagents, FFIs, or NFFEs. Each identified U.S. withholding agent and FFI has also evaluated pre-existing and newentity accounts to the extent required to determine their respective FATCA classifications. We have continuouslydeveloped internal procedures and processes that we believe address the regulatory requirements under FATCA.
However, FATCA compliance has required us to develop extensive systems capabilities and internalprocesses to identify and report U.S. account holders who are subject to FATCA requirements, which has been acomplex and costly process requiring significant internal resources. If our procedures and processes aredetermined not to be adequate to meet the requirements of FATCA, we could potentially be subject to seriouslegal and reputational consequences, including the imposition of withholding taxes on certain amounts payable tous from U.S. sources, and could be required to expend additional resources to enhance our systems, proceduresand processes and take other measures in response to such consequences.
Capital Adequacy. MUFG Americas Holdings and MUFG Union Bank are required to maintain minimumcapital ratios in accordance with rules issued by the U.S. Federal banking agencies. In July 2013, the U.S.Federal banking agencies issued final rules to implement the Basel Committee on Banking Supervision’s capitalguidance for U.S. banking organizations, or U.S. Basel III. These rules establish more restrictive capitaldefinitions, create additional categories and higher risk weightings for certain asset classes and off-balance sheetexposures, higher minimum capital and leverage ratios and capital conservation buffers that will be added to theminimum capital requirements. These rules supersede the U.S. federal banking agencies’ general risk-basedcapital rules generally referred to as Basel I, the advanced approaches rules generally referred to as Basel II,which are applicable to certain large banking organizations, and leverage rules, and are subject to certaintransition provisions. MUFG Americas Holdings became subject to the U.S. Basel III capital rules in January2015, with certain provisions subject to a phase-in period, while MUFG Union Bank continues to be subject tothe U.S. Basel III capital rules which became effective for advanced approaches institutions on January 1, 2014.The U.S. Basel III capital rules were substantially phased in by January 1, 2019.
Both MUFG Americas Holdings and MUFG Union Bank are subject to the following regulatory minimumrisk-based capital ratios: (1) 4.5% Common Equity Tier 1 capital ratio, (2) 6.0% Tier 1 capital ratio and (3) 8.0%total capital ratio. Failure to meet minimum capital requirements can result in certain mandatory, and possiblyadditional discretionary, actions by regulators that, if undertaken, could have a material effect on MUFGAmericas Holdings’ consolidated financial statements.
In addition to these regulatory minimum ratio requirements, MUFG Americas Holdings and MUFG UnionBank are subject to a fully phased-in capital conservation buffer requirement of 2.5%. MUFG Americas Holdingsand MUFG Union Bank are also subject to a Tier 1 leverage ratio regulatory minimum requirement of 4% and awell-capitalized prompt corrective action standard of 5%.
In October 2015, the FRB proposed long-term debt and TLAC requirements for U.S. globally systemicallyimportant bank holding companies and U.S. IHCs of non-U.S. globally systemically important banks, includingMUFG Americas Holdings. In December 2016, the FRB finalized rules imposing such requirements. Under thefinal rules, a covered IHC such as MUFG Americas Holdings is required to maintain a minimum amount ofeligible long-term debt issued to a non-U.S. parent entity that could be cancelled or converted to equity in orderto absorb losses and recapitalize the IHC’s operating subsidiaries at or near the point of resolution. A coveredIHC is also required to maintain a minimum level of eligible TLAC issued to a non-U.S. parent entity consistingof regulatory capital and eligible long-term debt and maintain related buffers consisting of Common EquityTier 1 capital. In addition, an IHC is restricted from issuing short-term debt and certain other types of liabilitiesthat are structurally senior to eligible long-term debt. MUFG Americas Holdings became subject to these rules on
68

January 1, 2019. Pursuant to 12 CFR § 252.164(a), we have certified to the FRB that we plan to follow an SPEresolution strategy, and that MUFG Americas Holdings would therefore be considered a “non-resolution coveredIHC.”
For more information, see “Item 5.B. Operating and Financial Review and Prospects—Liquidity and CapitalResources—Capital Adequacy” and Note 22 to our audited consolidated financial statements included elsewherein this Annual Report.
Disclosure pursuant to Section 13(r) of the US Securities Exchange Act of 1934
Section 13(r) of the U.S. Securities Exchange Act of 1934 (Exchange Act) requires an issuer to disclosewhether it or any of its affiliates knowingly engaged in certain activities, transactions or dealings relating to Iranor with natural persons or entities designated by the U.S. government under specified Executive Orders. Thescope of activities that must be reported includes activities not prohibited by U.S. law and conducted outside theUnited States in compliance with applicable local law.
During the fiscal year ended March 31, 2019, one of our non-U.S. subsidiaries engaged in business activitieswith entities in, or affiliated with, Iran, including counterparties owned or controlled by the Iranian government.Specifically, our non-U.S. banking subsidiary, MUFG Bank, issued letters of credit and guarantees and providedremittance and other settlement services mainly in connection with customer transactions related to the purchaseand exportation of Iranian crude oil to Japan, and in some cases, in connection with other petroleum-relatedtransactions with Iran by its customers. These transactions did not involve U.S. dollars nor clearing services ofU.S. banks for the settlement of payments. For the fiscal year ended March 31, 2019, the aggregate interest andfee income relating to these transactions was less than ¥100 million, representing less than 0.005 percent of ourtotal interest and fee income. Some of these transactions were conducted through the use of non-U.S. dollarcorrespondent accounts and other similar settlement accounts maintained with MUFG Bank outside theUnited States by Iranian financial institutions and other entities in, or affiliated with, Iran. In addition to suchaccounts, MUFG Bank receives deposits in Japan from, and provides settlement services in Japan to, fewer than10 Iranian government-related entities and fewer than 100 Iranian government-related individuals such as Iraniandiplomats in Japan, and maintains settlement accounts outside the United States for certain other financialinstitutions specified in Executive Order 13382, which settlement accounts were frozen in accordance withapplicable laws and regulations. For the fiscal year ended March 31, 2019, the average aggregate balance ofdeposits held in these accounts represented less than 0.1 percent of the average balance of our total deposits. Thefee income from the transactions attributable to these account holders was less than ¥20 million, representing lessthan 0.005 percent of our total fee income. Although there was no outstanding balance as of March 31, 2019,MUFG Bank had, during the fiscal year ended March 31, 2019, loans that were arranged prior to changes inapplicable laws and regulations to borrowers in, or affiliated with, Iran, including entities owned by the Iraniangovernment. For the fiscal year ended March 31, 2019, the agent fee income relating to these loan transactionswas less than ¥20 million, representing less than 0.005 percent of our total interest and fee income.
MUFG Bank recognizes that following the withdrawal in May 2018 by the United States from the JointComprehensive Plan of Action, the United States has imposed secondary sanctions against non-U.S. persons whoengage in or facilitate a broad range of transactions and activities involving Iran. MUFG Bank has taken therecent sanctions related developments into account and monitor any future transactions relating to Iran in order tocomply with applicable U.S. and Japanese regulations as well as U.S., Japanese and other international sanctions.
69

C. Organizational Structure
The following chart presents our corporate structure summary as of March 31, 2019:
DomesticMUFG Bank, Ltd.
OverseasMUFG Americas Holdings CorporationBank of Ayudhya Public Company Limited
DomesticMitsubishi UFJ Trust and Banking Corporation Mitsubishi UFJ Real Estate Services Co., Ltd.The Master Trust Bank of Japan, Ltd.MU Investments Co., Ltd.Mitsubishi UFJ Kokusai Asset Management Co., Ltd.
OverseasMitsubishi UFJ Trust International LimitedMitsubishi UFJ Baillie Gifford Asset Management LimitedMitsubishi UFJ Investor Services & Banking (Luxembourg) S.A.MUFG Lux Management Company S.A.Mitsubishi UFJ Asset Management (UK) Ltd. MUFG Investor Services Holdings Limited
DomesticMitsubishi UFJ Securities Holdings Co., Ltd.Mitsubishi UFJ Morgan Stanley Securities Co., Ltd.Mitsubishi UFJ Morgan Stanley PB Securities Co., Ltd.kabu.com Securities Co., Ltd.
OverseasMUFG Securities EMEA plcMUFG Securities Asia LimitedMUFG Securities Asia (Singapore) LimitedMUFG Securities (Canada), Ltd.
Domestic
Mitsubishi UFJ NICOS Co., Ltd.
Japan Digital Design, Inc.
MUMEC Visionary Design, Ltd.
Global Open Network, Inc.
MUFG Innovation Partners Co., Ltd.
Mits
ubis
hi U
FJ F
inan
cial
Gro
up
Mitsubishi UFJ Financial Group, Inc.
Oth
er su
bsid
iarie
sM
UFG
Ban
k, L
td.
Mits
ubis
hi U
FJ S
ecur
ities
Hol
ding
sC
o., L
td.
Mits
ubis
hi U
FJ T
rust
and
Ban
king
Cor
pora
tion
Note:(1) PT Bank Danamon Indonesia, Tbk. became a consolidated subsidiary through a share purchase transaction by MUFG Bank, on April 29,
2019.
70

Set forth below is a list of our principal consolidated subsidiaries as of March 31, 2019:
NameCountry of
Incorporation
Proportion ofOwnership
Interest(%)
Proportion ofVotingInterest
(%)
MUFG Bank, Ltd. . . . . . . . . . . . . . . . . . . . . . . . . . . . . . . . . . Japan 100.00% 100.00%Mitsubishi UFJ Trust and Banking Corporation . . . . . . . . . . Japan 100.00% 100.00%Mitsubishi UFJ Real Estate Services Co., Ltd. . . . . . . . . . . . Japan 100.00% 100.00%The Master Trust Bank of Japan, Ltd. . . . . . . . . . . . . . . . . . . Japan 46.50% 46.50%MU Investments Co., Ltd. . . . . . . . . . . . . . . . . . . . . . . . . . . . Japan 100.00% 100.00%Mitsubishi UFJ Kokusai Asset Management Co., Ltd. . . . . . Japan 100.00% 100.00%Mitsubishi UFJ Securities Holdings Co., Ltd. . . . . . . . . . . . . Japan 100.00% 100.00%Mitsubishi UFJ Morgan Stanley Securities Co., Ltd. . . . . . . Japan 60.00% 60.00%Mitsubishi UFJ Morgan Stanley PB Securities Co., Ltd. . . . Japan 100.00% 100.00%kabu.com Securities Co., Ltd. . . . . . . . . . . . . . . . . . . . . . . . . Japan 59.28% 59.29%Mitsubishi UFJ NICOS Co., Ltd. . . . . . . . . . . . . . . . . . . . . . Japan 100.00% 100.00%Japan Digital Design, Inc. . . . . . . . . . . . . . . . . . . . . . . . . . . . Japan 86.11% 86.11%MUMEC Visionary Design, Ltd. . . . . . . . . . . . . . . . . . . . . . Japan 60.00% 60.00%Global Open Network, Inc. . . . . . . . . . . . . . . . . . . . . . . . . . . Japan 80.00% 80.00%MUFG Innovation Partners Co., Ltd. . . . . . . . . . . . . . . . . . . Japan 100.00% 100.00%MUFG Americas Holdings Corporation . . . . . . . . . . . . . . . . USA 100.00% 100.00%Bank of Ayudhya Public Company Limited . . . . . . . . . . . . . Thailand 76.88% 76.88%MUFG Bank (China), Ltd. . . . . . . . . . . . . . . . . . . . . . . . . . . China 100.00% 100.00%MUFG Bank (Malaysia) Berhad . . . . . . . . . . . . . . . . . . . . . . Malaysia 100.00% 100.00%MUFG Bank (Europe) N.V. . . . . . . . . . . . . . . . . . . . . . . . . . Netherlands 100.00% 100.00%Mitsubishi UFJ Trust International Limited . . . . . . . . . . . . . UK 100.00% 100.00%Mitsubishi UFJ Baillie Gifford Asset Management
Limited . . . . . . . . . . . . . . . . . . . . . . . . . . . . . . . . . . . . . . . UK 51.00% 51.00%Mitsubishi UFJ Investor Services & Banking (Luxembourg)
S.A. . . . . . . . . . . . . . . . . . . . . . . . . . . . . . . . . . . . . . . . . . . Luxembourg 100.00% 100.00%MUFG Lux Management Company S.A. . . . . . . . . . . . . . . . Luxembourg 100.00% 100.00%Mitsubishi UFJ Asset Management (UK) Ltd. . . . . . . . . . . . UK 100.00% 100.00%MUFG Investor Services Holdings Limited . . . . . . . . . . . . . Bermuda 100.00% 100.00%MUFG Securities EMEA plc . . . . . . . . . . . . . . . . . . . . . . . . . UK 100.00% 100.00%MUFG Securities Asia Limited . . . . . . . . . . . . . . . . . . . . . . . China 100.00% 100.00%MUFG Securities Asia (Singapore) Limited . . . . . . . . . . . . . Singapore 100.00% 100.00%MUFG Securities (Canada), Ltd. . . . . . . . . . . . . . . . . . . . . . . Canada 100.00% 100.00%
D. Property, Plant and Equipment
Premises and equipment as of March 31, 2018 and 2019 consisted of the following:
As of March 31,
2018 2019
(in millions)Land . . . . . . . . . . . . . . . . . . . . . . . . . . . . . . . . . . . . . . . . . . . . . . . . . . . . . . . . . . . . . . . . . ¥ 370,669 ¥ 362,742Buildings . . . . . . . . . . . . . . . . . . . . . . . . . . . . . . . . . . . . . . . . . . . . . . . . . . . . . . . . . . . . . 739,665 829,606Equipment and furniture . . . . . . . . . . . . . . . . . . . . . . . . . . . . . . . . . . . . . . . . . . . . . . . . . 659,699 648,598Leasehold improvements . . . . . . . . . . . . . . . . . . . . . . . . . . . . . . . . . . . . . . . . . . . . . . . . . 311,645 305,281Construction in progress . . . . . . . . . . . . . . . . . . . . . . . . . . . . . . . . . . . . . . . . . . . . . . . . . 119,195 34,002
Total . . . . . . . . . . . . . . . . . . . . . . . . . . . . . . . . . . . . . . . . . . . . . . . . . . . . . . . . . . . . 2,200,873 2,180,229Less accumulated depreciation . . . . . . . . . . . . . . . . . . . . . . . . . . . . . . . . . . . . . . . . . . . . 1,187,285 1,206,629
Premises and equipment—net . . . . . . . . . . . . . . . . . . . . . . . . . . . . . . . . . . . . . . . . . . . . . ¥1,013,588 ¥ 973,600
71

Our registered address is 7-1, Marunouchi 2-chome, Chiyoda-ku, Tokyo 100-8330, Japan. As of March 31,2019, we and our subsidiaries conducted our operations either in premises we owned or in properties we leased.
The following table presents the book values of our material offices and other properties as of March 31,2019:
Book Value
(in millions)
Owned land . . . . . . . . . . . . . . . . . . . . . . . . . . . . . . . . . . . . . . . . . . . . . . . . . . . . . . . . . . . . . . . . . . . . . . . ¥362,742Owned buildings . . . . . . . . . . . . . . . . . . . . . . . . . . . . . . . . . . . . . . . . . . . . . . . . . . . . . . . . . . . . . . . . . . . 258,711
The buildings and land we own are primarily used by us and our subsidiaries as offices and branches. Mostof the buildings and land we own are free from material encumbrances.
During the fiscal year ended March 31, 2019, we invested approximately ¥126,479 million in premises andequipment, primarily for office renovations and relocation.
Item 4A. Unresolved Staff Comments.
None.
72

Item 5. Operating and Financial Review and Prospects.
The following discussion and analysis should be read in conjunction with “Item 3.A. Key Information—Selected Financial Data,” “Selected Statistical Data” and our consolidated financial statements and relatednotes included elsewhere in this Annual Report.
Page
Business Environment . . . . . . . . . . . . . . . . . . . . . . . . . . . . . . . . . . . . . . . . . . . . . . . . . . . . . . . . . . . . . . . . . . . 74Principal Sources of Income and Expenses . . . . . . . . . . . . . . . . . . . . . . . . . . . . . . . . . . . . . . . . . . . . . . . . . . . 76Recent Developments . . . . . . . . . . . . . . . . . . . . . . . . . . . . . . . . . . . . . . . . . . . . . . . . . . . . . . . . . . . . . . . . . . . . 81Critical Accounting Estimates . . . . . . . . . . . . . . . . . . . . . . . . . . . . . . . . . . . . . . . . . . . . . . . . . . . . . . . . . . . . . 84Accounting Changes and Recently Issued Accounting Pronouncements . . . . . . . . . . . . . . . . . . . . . . . . . . . . 86
A. Operating Results . . . . . . . . . . . . . . . . . . . . . . . . . . . . . . . . . . . . . . . . . . . . . . . . . . . . . . . . . . . . . . . . . . 87Results of Operations . . . . . . . . . . . . . . . . . . . . . . . . . . . . . . . . . . . . . . . . . . . . . . . . . . . . . . . . . . . . . . 87Business Segment Analysis . . . . . . . . . . . . . . . . . . . . . . . . . . . . . . . . . . . . . . . . . . . . . . . . . . . . . . . . . 96Geographic Segment Analysis . . . . . . . . . . . . . . . . . . . . . . . . . . . . . . . . . . . . . . . . . . . . . . . . . . . . . . . 103Effect of Change in Exchange Rates on Foreign Currency Translation . . . . . . . . . . . . . . . . . . . . . . . 105
B. Liquidity and Capital Resources . . . . . . . . . . . . . . . . . . . . . . . . . . . . . . . . . . . . . . . . . . . . . . . . . . . . . . 105Financial Condition . . . . . . . . . . . . . . . . . . . . . . . . . . . . . . . . . . . . . . . . . . . . . . . . . . . . . . . . . . . . . . . 105Capital Adequacy . . . . . . . . . . . . . . . . . . . . . . . . . . . . . . . . . . . . . . . . . . . . . . . . . . . . . . . . . . . . . . . . . 131Non-exchange Traded Contracts Accounted for at Fair Value . . . . . . . . . . . . . . . . . . . . . . . . . . . . . . 136
C. Research and Development, Patents and Licenses, etc. . . . . . . . . . . . . . . . . . . . . . . . . . . . . . . . . . . . 137
D. Trend Information . . . . . . . . . . . . . . . . . . . . . . . . . . . . . . . . . . . . . . . . . . . . . . . . . . . . . . . . . . . . . . . . . 137
E. Off-Balance Sheet Arrangements . . . . . . . . . . . . . . . . . . . . . . . . . . . . . . . . . . . . . . . . . . . . . . . . . . . . . 137
F. Tabular Disclosure of Contractual Obligations . . . . . . . . . . . . . . . . . . . . . . . . . . . . . . . . . . . . . . . . . . 138
G. Safe Harbor . . . . . . . . . . . . . . . . . . . . . . . . . . . . . . . . . . . . . . . . . . . . . . . . . . . . . . . . . . . . . . . . . . . . . . . 138
73
Business Environment
Through our subsidiaries and affiliated companies, we engage in a broad range of financial businesses andservices, including commercial banking, investment banking, trust assets and asset management services,securities businesses and credit card businesses, and provide related services to individuals primarily in Japan,the United States and Thailand and to corporate customers around the world. Our results of operations andfinancial condition are exposed to changes in various external economic factors, including:
‰ general economic conditions,
‰ interest rates,
‰ foreign currency exchange rates, and
‰ stock and real estate prices.
General Economic Conditions
During the fiscal year ended March 31, 2019, the global economy stayed on a moderately improving trend.Uncertainties grew, however, concerning future global economic trends in light of recent changes in economic,monetary and trade policies and geopolitical developments in various jurisdictions, which have contributed tohigher volatility in the financial market.
Japan’s economic growth continued at a moderate pace, while showing a mixture of positive and negativetrends, with the quarter-on-quarter real gross domestic product, or GDP, growth rate being 0.6% for the quartersended June 30, 2018, negative 0.6% for the quarters ended September 30, 2018, and 0.5% for the quarter endedDecember 31, 2018, and 0.6% for the quarter ended March 31, 2019. The year-over-year real GDP growth ratewas 1.5% for the quarter ended June 30, 2018, 0.1% for the quarter ended September 30, 2018, 0.3% for thequarter ended December 31, 2018 and 0.9% for the quarter ended March 31, 2019. Japan’s Consumer PriceIndex, or CPI, fluctuated between negative 0.3% and positive 0.5% on a month-on-month basis and between0.2% and 1.4% on a year-over-year basis during the fiscal year ended March 31, 2019. During the same period,the unemployment rate in Japan remained low, fluctuating between 2.3% and 2.5%. According to TeikokuDatabank, a Japanese research institution, the number of companies that filed for legal bankruptcy in Japanduring the fiscal year ended March 31, 2019 was 8,057, a 2.8% decrease from the previous fiscal year. The totalliabilities of companies that filed for legal bankruptcy during the fiscal year ended March 31, 2019 were¥1,554 billion, a 40% decrease from the previous fiscal year. The Japanese economy remains subject tocontinuing deflationary pressure, increasing public debt, intensifying trade conflicts and global competition,declining domestic population, stagnant private consumption which may further decline once the consumptiontax rate is raised from 8.0% to 10.0% in October 2019 as currently expected, and various other factors that couldadversely affect its economic conditions.
The U.S. economy expanded with the quarter-on-quarter annualized real GDP growth rate being 4.2% forthe quarter ended June 30, 2018, 3.4% for the quarter ended September 30, 2018, 2.2% for the quarter endedDecember 31, 2018 and 3.1% for the quarter ended March 31, 2019. The year-over-year real GDP growth ratewas 2.9% for the quarter ended June 30, 2018, 3.0% for the quarter ended September 30, 2018, 3.0% for thequarter ended December 31, 2018 and 3.2% for the quarter ended March 31, 2019. The U.S. economic growthwas supported by the improvement in the labor market, higher wages and increased corporate productionactivities. During the fiscal year ended March 31, 2019, the unemployment rate in the U.S. fluctuated between3.7% and 4.0%. However, the long-term prospects of the U.S. economy remain uncertain in light of the changesin the government’s economic, monetary, trade and foreign relations policies under the Trump administration,and various other factors.
The Eurozone’s economic growth continued at a slow rate with the quarter-on-quarter real GDP growth ratebeing 0.4% for the quarter ended June 30, 2018, 0.1% for the quarter ended September 30, 2018, 0.2% for the
74

quarter ended December 31, 2018 and 0.4% for the quarter ended March 31, 2019. The year-over-year real GDPgrowth rate was 2.2% for the quarter ended June 30, 2018, 1.7% for the quarter ended September 30, 2018, 1.2%for the quarter ended December 31, 2018 and 1.2% for the quarter ended March 31, 2019. During the fiscal yearended March 31, 2019, the unemployment rate in the Eurozone declined to 7.7% for March 2019. There are stilluncertainties in the Eurozone economy, including the process and ramifications of the United Kingdom’swithdrawal from the European Union and the large accumulation of non-performing loans in some Europeanperipheral countries.
In Asia excluding Japan, economic conditions in ASEAN (Association of Southeast Asian Nations) andNIEs (Newly Industrialized Economies) generally improved but the economic growth remained relatively modestduring the fiscal year ended March 31, 2019. In China, economic conditions continued to improve at a moderatepace during the fiscal year, with some downward pressure on economic growth resulting from remainingstructural adjustments. China’s quarter-on-quarter real GDP growth rate was 1.7% for the quarter ended June 30,2018, 1.6% for the quarter ended September 30, 2018, 1.5% for the quarter ended December 31, 2018 and 1.4%for the quarter ended March 31, 2019. China’s year-over-year real GDP growth rate was 6.7% for the quarterended June 30, 2018, 6.5% for the quarter ended September 30, 2018, 6.4% for the quarter ended December 31,2018 and 6.4% for the quarter ended March 31, 2019. The Thai economy was on a gradually stabilizing trendduring the fiscal year ended March 31, 2019, with varying degrees of impact on the financial conditions ofconsumers and small and medium-sized enterprises. Thailand’s quarter-on-quarter real GDP growth rate was1.1% for the quarter ended June 30, 2018, negative 0.4% for the quarter ended September 30, 2018, 0.9% for thequarter ended December 31, 2018 and 1.0% for the quarter ended March 31, 2019. Thailand’s year-over-year realGDP growth rate was 4.7% for the quarter ended June 30, 2018, 3.2% for the quarter ended September 30, 2018,3.6% for the quarter ended December 31, 2018 and 2.8% for the quarter ended March 31, 2019. Although thereare some signs of further economic growth in ASEAN and NIEs, such as growth in exports to developedcountries and larger investments in infrastructure projects in the region, uncertainties still remain in light of,among other things, intensifying trade conflicts and potential geopolitical issues.
Interest Rates
Interest rates remained at historically low levels in Japan under the Bank of Japan’s monetary policy. Theyield on 10-year Japanese government bonds fluctuated between negative 0.090% and positive 0.161% duringthe fiscal year ended March 31, 2019. The Bank of Japan adopted its “quantitative and qualitative monetaryeasing” policy in April 2014 and commenced its “quantitative and qualitative monetary easing with negativeinterest rates” policy in January 2016. Under this policy, aiming to achieve the price stability target of 2.0%, theBank of Japan applied a negative interest rate of minus 0.1% to the “Policy-Rate Balances,” which are a part ofcurrent account amounts held by financial institutions at the Bank of Japan, while increasing the Bank of Japan’saggregate holding of Japanese government bonds by approximately ¥80 trillion each year. In September 2016,the Bank of Japan announced a new “quantitative and qualitative monetary easing with yield curve control”policy, adding to its monetary policy a Japanese government bond purchase program with an aim to keep theyield of 10-year Japanese government bonds around zero percent. In July 2018, the Bank of Japan slightly itsmodified monetary policy by adopting forward guidance on interest rates and adding language in its policystatement that long-term interest rates may fluctuate depending on economic and price developments. The yieldon 10-year Japanese government bonds was 0.049% on March 30, 2018 and negative 0.081% on March 29, 2019.The yield currently fluctuates around negative 0.158%.
In the United States, the FRB raised the target range for the federal funds rate to between1.75% and 2.00%in June 2018, to between2.00% and 2.25% in September 2018, and further to between 2.25% and 2.50% inDecember 2018. However, following the Federal Open Market Committee in June 2019, several FRB membersimplied their willingness to reduce the rate at least by 25 basis points by the end of the calendar year 2019 inlight of increasing uncertainty in the economic outlook. The 10-year U.S. Treasury bond yield decreased from2.74% at the end of March 2018 to 2.406% at the end of March 2019, while fluctuating between 2.368% and3.238% during the period. The yield currently fluctuates around 2.006%.
75
The yield on 10-year German Bunds decreased from positive 0.497% at the end of March 2018 to negative0.07% as of March 29, 2019, while fluctuating between negative 0.081% and positive 0.645% during the period.The yield currently fluctuates around negative 0.327%. The yield on 10-year French Obligations Assimilables duTrésor decreased from 0.721% at the end of March 2018 to 0.318% as of March 29, 2019, while fluctuatingbetween 0.301% and 0.907% during the period. The yield currently fluctuates around negative 0.005%.
Foreign Currency Exchange Rates
The Japanese yen depreciated against the U.S. dollar from ¥106.28 to the U.S. dollar as of March 30, 2018to ¥110.86 to the U.S. dollar as of March 29, 2019, while fluctuating between ¥105.89 to the U.S. dollar and¥114.53 to the U.S. dollar during the period. The Japanese yen has since been fluctuating around ¥107.85 to theU.S. dollar.
The Japanese yen was on a generally appreciating trend against the euro during the fiscal year endedMarch 31, 2019, with the exchange rate being ¥124.35 to the euro as of March 29, 2019 compared to ¥130.97 tothe euro as of March 30, 2018. The Japanese yen has been fluctuating around ¥122.66 to the euro since April 1,2019.
The Japanese yen was on a generally depreciating trend against the Thai baht during the fiscal year endedMarch 31, 2019, with the exchange rate being ¥3.4929 to the Thai baht as of March 29, 2019 compared to¥3.4076 to the Thai baht as of March 30, 2018. The Japanese yen has been fluctuating around ¥3.5162 to the Thaibaht since April 1, 2019.
Stock and Real Estate Prices
The closing price of the Nikkei Stock Average, which is the average of 225 blue chip stocks listed on theTokyo Stock Exchange, decreased from ¥21,454.30 on March 30, 2018 to ¥21,205.81 on March 29, 2019. Theclosing price of the Nikkei Stock Average reached ¥24,270.62, the highest closing price since November 1991,on October 2, 2018, and declined to ¥19,115.74 on December 25, 2018. The closing price of the Nikkei StockAverage has since risen and has been fluctuating around ¥21,275.92.
According to the latest land price survey conducted by the Japanese government, between January 1, 2018and January 1, 2019, the average residential land price in Japan increased 0.6%, and the average commercial landprice in Japan increased 2.8%. In the three major metropolitan areas of Tokyo, Osaka and Nagoya, betweenJanuary 1, 2018 and January 1, 2019, the average residential land price increased 1.0% and the averagecommercial land price increased 5.1%. In the local regions of Japan, which consist of regions other than the threemajor metropolitan areas, between January 1, 2018 and January 1, 2019, the average residential land priceincreased 0.2% and the average commercial land price increased 1.0%.
Principal Sources of Income and Expenses
Net Interest Income
Net interest income is a function of:
‰ the amount of interest-earning assets,
‰ the amount of interest-bearing liabilities,
‰ the general level of interest rates,
‰ the so-called “spread,” or the difference between the rate of interest earned on interest-earning assetsand the rate of interest paid on interest-bearing liabilities, and
‰ the proportion of interest-earning assets financed by non-interest-bearing liabilities and equity.
76

Provision for (Reversal of) Credit Losses
Provision for (reversal of) credit losses is charged to operations to maintain the allowance for credit losses ata level deemed appropriate by management. For more information on our provision for (reversal of) credit lossesand a description of the approach and methodology used to establish the allowance for credit losses,see “—B. Liquidity and Capital Resources—Financial Condition—Loan Portfolio—Allowance policy.”
Non-interest Income
Non-interest income consists of the following:
Fees and commissions income
Fees and commissions income consist of the following:
‰ Fees and commissions on deposits consist of fees and commissions charged for ATM transactions andother deposit and withdrawal services.
‰ Fees and commissions on remittances and transfers consist of fees and commissions charged forsettlement services such as domestic fund remittances, including those made through electronic banking.
‰ Fees and commissions on foreign trading business consist of fees and commissions charged for fundcollection and financing services related to foreign trading business activities.
‰ Fees and commissions on credit card business consist of fees and commissions related to the credit cardbusiness such as interchange income, annual fees, royalty and other service charges from franchisees.
‰ Fees and commissions on security-related services primarily consist of fees and commissions for salesand transfers of securities, including investment funds, underwriting, brokerage and advisory services,securitization arrangement services, and agency services for the calculation and payment of dividends.
‰ Fees and commissions on administration and management services for investment funds primarilyconsist of fees and commissions earned on managing investment funds on behalf of clients.
‰ Trust fees consist primarily of fees earned on fiduciary asset management and administration servicesfor corporate pension plans and investment funds.
‰ Guarantee fees consist of fees related to the guarantee business, including those charged for providingguarantees on residential mortgage loans and other loans.
‰ Insurance commissions consist of commissions earned by acting as an agent for insurance companiesfor the sale of insurance products.
‰ Fees and commissions on real estate business primarily consist of fees from real estate agent services.
‰ Other fees and commissions include various fees and commissions, such as arrangement fees and agentfees, other than the fees mentioned above.
Net foreign exchange gains (losses)
Net foreign exchange gains (losses) consist of the following:
‰ Net foreign exchange gains (losses) on derivative contracts are net gains (losses) primarily on currencyderivative instruments entered into for trading purposes. For more information on our derivativecontracts, see Note 24 to our consolidated financial statements included elsewhere in this AnnualReport.
‰ Net foreign exchange gains (losses) on other than derivative contracts include foreign exchange tradinggains (losses) as well as transaction gains (losses) on the translation into Japanese yen of monetary
77

assets and liabilities denominated in foreign currencies. The transaction gains (losses) on the translationinto Japanese yen fluctuate from period to period depending upon the spot rates at the end of each fiscalyear. In principle, all transaction gains (losses) on translation of monetary assets and liabilitiesdenominated in foreign currencies are included in current earnings.
‰ Net foreign exchange gains (losses) related to the fair value option include transaction gains (losses) onthe translation into Japanese yen of securities under the fair value option. For more information on thefair value option, see Note 32 to our consolidated financial statements included elsewhere in this AnnualReport.
Net trading account profits (losses)
Trading account assets and liabilities are carried at fair value and changes in the value of trading accountassets and liabilities are recorded in net trading account profits (losses). Activities reported in our net tradingaccount profits (losses) can generally be classified into two categories:
‰ trading purpose activities, which are conducted mainly for the purpose of generating profits eitherthrough transaction fees or arbitrage gains and involve frequent and short-term selling and buying ofsecurities, commodities or others; and
‰ trading account assets relating to the application of certain accounting rules, which are generally notrelated to trading purpose activities, but simply classified as trading accounts due to the application ofcertain accounting rules.
Of the two categories, trading account assets relating to the application of certain accounting rules representa larger portion of our trading account profits for the fiscal year ended March 31, 2019.
We generally do not separate, for financial reporting purposes, customer originated trading activities fromnon-customer related, proprietary trading activities. When an order for a financial product is placed by acustomer, a dealer offers a price which includes certain transaction fees, often referred to as the “margin” to themarket price. The margin is determined by considering factors such as administrative costs, transaction amountand liquidity of the applicable financial product. Once the customer agrees to the offered price, the deal iscompleted and the position is recorded in our ledger as a single entry without any separation of components. Tomanage the risk relating to the customer side position, we often enter into an offsetting transaction with themarket. Unrealized gains and losses as of the period-end for both the customer side position and the market sideposition are recorded within the same trading account profits and losses.
Net trading account profits (losses) consist of net profits (losses) on interest rate and other derivativecontracts and net profits (losses) on trading account securities, excluding derivatives.
Net profits (losses) on interest rate and other derivative contracts are reported for net profits (losses) onderivative instruments which primarily relate to trading purpose activities and include:
‰ Interest rate contracts: Interest rate contracts are mainly utilized to manage interest rate risks whichcould arise from mismatches between assets and liabilities resulting from customer originated tradingactivities;
‰ Equity contracts: Equity contracts are mainly utilized to manage the risk that would arise from pricefluctuations of stocks held in connection with customer transactions;
‰ Commodity contracts: Commodity contracts are mainly utilized to meet customers’ demand for hedgingthe risks relating to their transactions, and to diversify our portfolio; and
‰ Credit derivatives: Credit derivatives are mainly utilized as a part of our credit portfolio riskmanagement.
78

Derivative instruments for trading purposes also include those used as hedges of net exposures rather thanfor specifically identified assets or liabilities, which do not meet the specific criteria for hedge accounting.
Net profits (losses) on trading account securities, excluding derivatives, consist of:
‰ Net profits (losses) on trading account securities, which primarily consist of gains and losses on tradingand valuation of trading securities which relate to trading purpose activities. Net profits (losses) oninvestment securities held by certain consolidated variable interest entities, or VIEs, are included inaccordance with the applicable accounting rules.
‰ Net profits (losses) on trading account securities under the fair value option, which are classified intotrading accounts profits (losses) in accordance with certain accounting rules. For more information onthe fair value option, see Note 32 to our consolidated financial statements included elsewhere in thisAnnual Report.
Net investment securities gains (losses)
Net investment securities gains (losses) include net gains (losses) on sales of marketable securities,particularly debt securities and marketable equity securities. Impairment losses are recognized and offset netinvestment securities gains when management concludes that declines in the fair value of investment securitiesare other than temporary. In addition, as a result of our adoption of new guidance on recognition andmeasurement of financial assets and financial liabilities on April 1, 2018, unrealized gains (losses), or holdinggains (losses), on equity investments are reflected in net gains (losses) from marketable equity securities. Thisnew guidance is not applied retrospectively to the fiscal years ended March 31, 2017 and 2018. Prior to adoption,such unrealized gains and losses were reflected in other comprehensive income. For more information, seeNote 1 to our consolidated financial statements included elsewhere in this Annual Report.
Net equity in earnings (losses) of equity method investees
Net equity in earnings (losses) of equity method investees includes our equity interest in the earnings of ourequity method investees and impairment losses on our investments in equity method investees.
Non-Interest Expense
Non-interest expense consists of:
‰ salaries and employee benefits, which include the amount of money paid as salaries and bonuses as wellas the cost of fringe-benefits,
‰ occupancy expenses—net, which include the amount of money paid as rents for offices and otherfacilities,
‰ fees and commissions expenses, which include the amount of money paid as fees and commissions onservices received,
‰ outsourcing expenses, including data processing, which include the amount of money paid for theoutsourcing services, including IT-related services,
‰ depreciation of premises and equipment, which includes the depreciation of the value of buildings,equipment and furniture through the passage of time,
‰ amortization of intangible assets, which includes the amount of deductions of the cost of investments insoftware and other intangible assets over their estimated useful lives,
‰ impairment of intangible assets, which includes the amount of reductions in the carrying amounts ofintangible assets with indefinite useful lives in excess of their fair values,
79
‰ insurance premiums, including deposits insurance, which include the amount of money paid as theinsurance premiums including the deposit insurance premiums paid to the Deposit InsuranceCorporation of Japan
‰ communications, which include the amount of money paid for communications such as postal servicesand telecommunications,
‰ taxes and public charges, which include the amount of tax payments and other public charges,
‰ impairment of goodwill, which includes the amount of reductions in the carrying amount of goodwillrecorded in connection with the acquisition of companies in excess of their fair values,
‰ provision for (reversal of) off-balance sheet credit instruments, which includes the amount of moneyreserved for the estimated amount of losses on off-balance sheet credit instruments or reversal of anyportion of such amount, and
‰ other non-interest expenses.
80
Recent Developments
During the fiscal year ended March 31, 2019, we continued to pursue a strategy to improve our operationalefficiency and financial performance and achieve sustainable growth. We sought to strengthen our managementstructure, while selectively reviewing and considering growth opportunities that would enhance our globalcompetitiveness. We also continued to monitor regulatory developments and pursue prudent transactions thatwould create a strong capital structure to enable us to contribute to the real economy, both domestically andglobally, as a provider of a stable source of funds and high-quality financial services. In addition, in order torespond to the increasingly complex market and legal risks, we continued to endeavor to enhance our complianceand internal control frameworks. Starting in the current fiscal year ending March 31, 2019, we launched our newthree-year medium-term business plan, under which we aim to integrate the expertise and capabilities of oursubsidiaries to build a foundation for future growth.
Implementation of Share Repurchase Programs and Cancellation of Purchased Shares
During November 2018 and December 2018, we repurchased 159,836,800 shares of our common stock for¥99,999,974,078 under a share repurchase program that was adopted in November 2018 and completed inDecember 2018. Under the program, we were authorized by the Board of Directors to repurchase up to the lesserof an aggregate of 200,000,000 shares of our common stock and an aggregate of ¥100.0 billion betweenNovember 14, 2018 and December 31, 2018 and to cancel the repurchased shares. We cancelled all of therepurchased shares on January 22, 2019.
During May 2018 and June 2018, we repurchased 72,420,700 shares of our common stock for¥49,999,969,714 under a share repurchase program that was adopted in May 2018 and completed in June 2018.Under the program, we were authorized by the Board of Directors to repurchase up to the lesser of an aggregateof 100,000,000 shares of our common stock and an aggregate of ¥50.0 billion between May 16, 2018 andJune 30, 2018 and to cancel the repurchased shares. We cancelled all of the repurchased shares on July 20, 2018.
The purposes of the above two share repurchase programs were to enhance shareholder value, to improveour capital efficiency and to allow the implementation of flexible capital policies in response to changes in thebusiness environment.
Issuances of Senior Debt Securities for TLAC Purposes
During and after the fiscal year ended March 31, 2019, we issued $13.2 billion, or ¥1,467.3 billion,€1.0 billion, or ¥124.6 billion, and HK$0.3 billion, or ¥4.3 billion, aggregate principal amount of senior notesthat were intended to qualify as TLAC debt. As of March 31, 2019, our TLAC ratios were 18.16% on a risk-weighted assets basis and 7.90% on a leverage exposure basis. We are required to maintain External TLAC ratiosof 16% on a risk-weighted assets basis and 6% on a leverage exposure basis from March 31, 2019 and 18% on arisk-weighted assets basis and 6.75% on a leverage exposure basis from March 31, 2022. See “—B. Liquidityand Capital Resources—Capital Adequacy” and “Item 4.B. Information on the Company—Business Overview—Supervision and Regulation—Japan—Total loss-absorbing capacity.”
Redemption of Preferred Securities Issued by Special Purpose Company
In May 2019, we decided to redeem in full ¥90.0 billion of Japanese yen-denominated non-cumulativepreferred securities issued by an overseas special purpose company in the Cayman Islands called MUFG CapitalFinance 8 Limited. The effective date of the planned redemption is July 25, 2019. Based on the Japanese GAAPinformation used to calculate our capital ratios as of March 31, 2019, we estimate that the planned redemptionwould result in a decline in each of our Tier 1 capital ratio and our total capital ratio by approximately0.1 percentage point.
81

In January 2019, we redeemed in full ¥222.0 billion of Japanese yen-denominated non-cumulative preferredsecurities issued by an overseas special purpose company in the Cayman Islands called MUFG Capital Finance 7Limited.
Issuances of Basel III-Compliant Domestic Subordinated Bonds
In December 2018, we issued, in a public offering in Japan, ¥155.0 billion aggregate principal amount ofunsecured perpetual subordinated Additional Tier 1 notes. These notes are subject to our discretion to ceaseinterest payments and a write-down of the principal upon the occurrence of certain events, including when ourCommon Equity Tier 1 capital ratio declines below 5.125%, when we are deemed to be at risk of becomingnon-viable or when we become subject to bankruptcy proceedings, but, following any write-down, the principalmay be reinstated to the extent permitted by the Japanese banking regulator. See “Item 4.B. Information on theCompany—Business Overview—Supervision and Regulation—Japan.”
Strategic Investment in Bank Danamon in Indonesia
In December 2017, MUFG Bank acquired an initial 19.9% equity interest in Bank Danamon for anaggregate purchase price of IDR 15.875 trillion, or ¥133.4 billion, based on a price of IDR 8,323, or ¥70, pershare. In August 2018, MUFG Bank acquired an additional 20.1% equity interest for an aggregate purchase priceof IDR 17.187 trillion, or ¥132.3 billion, based on a price of IDR 8,921, or ¥69, per share. As a result, MUFGBank’s equity interest in Bank Danamon increased to 40%, and MUFG Bank started to apply the equity methodof accounting to its investment in Bank Danamon during the six months ended September 30, 2018.
In April 2019, MUFG Bank further increased its shareholding in Bank Danamon from 40.0% to 94.0% byacquiring additional shares for an aggregate purchase price of IDR 49,620 billion, or ¥397.0 billion, based on aprice of IDR 9,590, or ¥77, per share. In addition, in April 2019, MUFG Bank increased its shareholding inPT Bank Nusantara Parahyangan Tbk., or Bank BNP, in Indonesia from 7.9% to 99.9% by acquiring shares fromACOM Co., Ltd., our equity method affiliate, and other shareholders for an aggregate purchase price of IDR3,011 billion, or ¥24.1 billion, based on a price of IDR 4,088, or ¥33, per share. As a result, Bank Danamon andBank BNP became our consolidated subsidiaries. In May 2019, Bank BNP was merged into Bank Danamonthrough a share exchange transaction, resulting in our shareholding in Bank Danamon being 94.1%.
This investment is part of our strategic plan to expand our presence in Asia and Oceania and contribute tothe economic growth in the region. The investment is expected to enable us to leverage our financial strength,relationships with Japan’s leading companies, and global network as well as our product and sectorial expertiseto further enhance our growth strategy. In our capacity as a long-term shareholder, we aim to build on BankDanamon’s established and respected brand franchise to foster synergies and enhance Bank Danamon’s positionas a leading and prominent Indonesian bank that remains committed to delivering high quality services to itscustomers.
Bank Danamon, which was established in 1956, is the fifth most profitable Indonesian commercial bank interms of net income. Bank Danamon provides banking and financial products and services to consumer, micro-finance, small and medium enterprise, and corporate customers, with a network of approximately 1,800 offices inIndonesia.
Acquisition of Aviation Finance Business from DVB Bank
In March 2019, MUFG Bank agreed to purchase from DVB Bank SE in Germany its aviation finance clientlending portfolio, which was valued at approximately €5.6 billion, or approximately ¥716.3 billion, as of June 30,2018, and the related operating infrastructure. In connection with this agreement, BOT Lease Co., Ltd., aconsolidated subsidiary of MUFG Bank, agreed to purchase from DVB Bank its aviation investmentmanagement and asset management business. The closing of these transactions are expected to occur during thesecond half of the fiscal year ending March 31, 2020, subject to regulatory approvals and other conditions. We
82
consider aviation finance to be a key growth pillar for us and, through the acquisition, we aim to enhance ourGlobal Corporate & Investment Banking Business platform in terms of higher returns, portfolio diversificationand solution offering to our clients.
Sale of Shares in Standard Life Aberdeen
In February 2019, Mitsubishi UFJ Trust and Banking sold all of the ordinary shares it held in Standard LifeAberdeen plc, a U.K.-based asset manager, for approximately £349.3 million, or approximately ¥49.4 billion.The sale was part of our strategy to optimize our capital management in light of tightened international financialregulations and changes in the business environment. Standard Life Aberdeen plc remains one of our mostimportant partners.
Agreement to Acquire Shares in Colonial First State Group Limited Subsidiaries
In October 2018, Mitsubishi UFJ Trust and Banking entered into a Share Sale Deed with CommonwealthBank of Australia, or CBA, and its wholly-owned subsidiary Colonial First State Group Limited, or CFSGL, toacquire 100% of the shares in each of nine subsidiaries of CFSGL, which collectively represent CBA’s globalasset management business known as Colonial First State Global Asset Management, or CFSGAM, from CFSGLfor an aggregate purchase price of approximately AU$4.0 billion, or ¥328 billion, subject to certain conditionsprecedent, including required regulatory approvals. The purpose of this transaction is to enhance Mitsubishi UFJTrust and Banking’s asset management capabilities and product competitiveness in the global asset managementmarket. The transaction is currently expected to be completed in mid-2019.
Sale of Shares in Banco Bradesco
In April 2018, MUFG Bank sold a portion of its equity interest in Banco Bradesco SA, a Brazil-baseduniversal banking group in Latin America, for approximately 1,411 million Brazilian Real, or approximately¥45.3 billion. Although MUFG Bank’s shareholding ratio decreased to 1.25% as a result of the transaction,Bradesco remains our important alliance partner in the Latin American region and continues to collaborate withMUFG Bank in a broad range of business areas.
Agreement concerning Capital Transfer and Merger between Mitsubishi UFJ Morgan Stanley Securities andMitsubishi UFJ Morgan Stanley PB Securities
In April 2019, Mitsubishi UFJ Morgan Stanley Securities and Mitsubishi UFJ Morgan Stanley PB SecuritiesCo., Ltd., a subsidiary of Mitsubishi UFJ Morgan Stanley Securities holding 75% of its shares with the remaining25% held by MUFG Bank, agreed on a merger whereby Mitsubishi UFJ Morgan Stanley Securities will be thesurviving company. In connection with the planned merger, MUFG Bank is expected to transfer its 25% equityinterest in Mitsubishi UFJ Morgan Stanley PB Securities to Mitsubishi UFJ Morgan Stanley Securities. Throughthis transaction, Mitsubishi UFJ Morgan Stanley Securities aims to enhance its wealth management business.
Functional Realignment of Subsidiaries
In April 2018, Mitsubishi UFJ Trust and Banking’s corporate loan-related businesses were transferred toMUFG Bank. As a result, the corporate loan-related businesses within the Group are currently concentrated atMUFG Bank.
Also in April 2018, Mitsubishi UFJ Trust and Banking acquired MUFG Bank’s 15% equity interest andMitsubishi UFJ Securities Holding’s 34% equity interest in Mitsubishi UFJ Kokusai Asset Management Co., Ltd.to make the asset management company a wholly owned subsidiary of Mitsubishi UFJ Trust and Banking. Theacquisition followed the transfer to Mitsubishi UFJ Trust and Banking of the shares of Mitsubishi UFJ Investor
83

Services & Banking (Luxembourg) S.A. held by MUFG Bank in May 2017 to make the Luxembourg company awholly owned subsidiary of Mitsubishi UFJ Trust and Banking. As a result, Mitsubishi UFJ Trust and Bankingcurrently operates as the Group’s primary asset management and administration subsidiary, and seeks to furtherstrengthen its real estate, pension and estate administration services.
The realignment of these functions of our subsidiaries was executed as part of our strategy to increase theeffectiveness in accumulating and applying the expertise of our subsidiaries and to enhance efficiency in offeringand providing a diverse array of sophisticated financial products and services to customers through collaborationamong our subsidiaries. See “Item 4.B—Information on the Company—Business Overview.”
Critical Accounting Estimates
Our consolidated financial statements included elsewhere in this Annual Report are prepared in accordancewith U.S. GAAP. Certain accounting policies require management to make difficult, complex or subjectivejudgments regarding the valuation of assets and liabilities. The accounting policies are fundamental tounderstanding our operating and financial review and prospects. The notes to our consolidated financialstatements included elsewhere in this Annual Report provide a summary of our significant accounting policies.The following is a summary of the critical accounting estimates:
Allowance for Credit Losses
The allowance for credit losses represents management’s best estimate of probable losses in our loanportfolio. The evaluation process, including credit-ratings and self-assessments, involves a number of estimatesand judgments. The allowance is based on two principles of accounting guidance: (1) the guidance oncontingencies requires that losses be accrued when they are probable of occurring and can be estimated, and(2) the guidance on accounting by creditors for impairment of a loan requires that losses be accrued based on thedifference between the loan balance, on the one hand, and the present value of expected future cash flowsdiscounted at the loan’s original effective interest rate, the fair value of collateral or the loan’s observable marketvalue, on the other hand.
We divide our loan portfolio into the following segments—Commercial, Residential, Card, MUFG AmericasHoldings and Krungsri—based on the segments used to determine the allowance for credit losses. We further dividethe Commercial segment into classes based on initial measurement attributes, risk characteristics, and our approachto monitoring and assessing credit risk. We determine the appropriate level of the allowance for credit losses foreach of our loan portfolios by evaluating various factors and assumptions, such as the borrower’s credit rating,collateral value and historical loss experience as well as existing economic conditions. We update these factors andassumptions on a regular basis and upon the occurrence of unexpected changes in the economic environment.
For all portfolio segments, key elements relating to the policies and discipline used in determining theallowance for credit losses are our credit classification and the related borrower categorization process. Each ofthese components is determined based on estimates subject to change when actual events occur. Thecategorization is based on conditions that may affect the ability of borrowers to service their debt, taking intoconsideration current financial information, historical payment experience, credit documentation, publicinformation, analyses of relevant industry segments and current trends. In determining the appropriate level ofallowance, we evaluate the probable loss by category of the loan based on its type and characteristics.
In addition to the allowance for credit losses on our loan portfolio, we maintain an allowance for creditlosses on off-balance sheet credit instruments, including commitments to extend credit, a variety of guaranteesand standby letters of credit and other financial instruments. This allowance is included in other liabilities.
Determining the adequacy of the allowance for credit losses requires the exercise of considerable judgmentand the use of estimates, such as those discussed above. Our actual losses could be more or less than the
84
estimates. To the extent that actual losses differ from management’s estimates, additional provisions for creditlosses may be required that would adversely impact our operating results and financial condition in futureperiods. For further information regarding our methodologies used in establishing the allowance for credit lossesby portfolio segments and allowance for credit losses policies, see Note 1 to our consolidated financialstatements included elsewhere in this Annual Report and “—B. Liquidity and Capital Resources—FinancialCondition—Loan Portfolio.”
For more information on our credit and borrower ratings, see “Item 11. Quantitative and QualitativeDisclosures about Credit, Market and Other Risk—Credit Risk Management.”
Allowance for Repayment of Excess Interest
We maintain an allowance for repayment of excess interest based on our estimate of the potential liabilityexposure. Our estimate of the potential liability exposure represents the estimated amount of claims for repaymentof excess interest to be received in the future. We expect that any such claim will be made on the basis of a 2006ruling of the Japanese Supreme Court, or the Ruling. Under the Ruling, lenders are generally required to reimburseborrowers for interest payments made in excess of the limits stipulated by the Interest Rate Restriction Act uponreceiving claims for reimbursement, despite the then-effective provisions of the Law Concerning Lending Businessthat exempted a lender from this requirement if the lender provided required notices to the borrower and met otherspecified requirements, and the borrower voluntarily made the interest payment.
While we have not entered into any consumer loan agreement after April 2007 that imposes an interest rateexceeding the limits stipulated by the Interest Rate Restriction Act, we need to estimate the number of possibleclaims for reimbursement of excess interest payments. To determine the allowance for repayment of excessinterest, we analyze the historical number of repayment claims we have received, the amount of such claims,borrowers’ profiles, the actual amount of reimbursements we have made, management’s future forecasts, andother events that are expected to possibly affect the repayment claim trends in order to arrive at our best estimateof the potential liability. We believe that the provision for repayment of excess interest is adequate and theallowance is at the appropriate amount to absorb probable losses, so that the impact of future claims forreimbursement of excess interest will not have a material adverse effect on our financial position and results ofoperations. The allowance is recorded as a liability in Other liabilities.
For further information, see Note 27 to our consolidated financial statements included elsewhere in this AnnualReport and “Item 3.D. Key Information—Risk Factors—Risks Related to Our Business—Because of our loans toconsumers and our shareholdings in companies engaged in consumer lending, changes in the business or regulatoryenvironment for consumer finance companies in Japan may further adversely affect our financial results.”
Accounting for Goodwill and Intangible Assets
Accounting for Goodwill. U.S. GAAP requires us to test goodwill for impairment at least annually, ormore frequently if events or changes in circumstances indicate that goodwill may be impaired, using a two-stepprocess that begins with an estimation of the fair value of a reporting unit of our business, which is to becompared with the carrying amount of the unit, to identify potential impairment of goodwill. A reporting unit isan operating segment or component of an operating segment that constitutes a business for which discretefinancial information is available and is regularly reviewed by management. The fair value of a reporting unit isdefined as the amount at which the unit as a whole could be bought or sold in a current transaction betweenwilling parties. For a reporting unit for which an observable quoted price is not available, the fair value isdetermined using an income approach. In the income approach, the present value of expected future cash flows iscalculated by taking the net present value based on each reporting unit’s internal forecasts. A control premiumfactor is also considered in relation to market capitalization.
If the carrying amount of a reporting unit exceeds its estimated fair value, the second step of the goodwillimpairment test is performed to measure the amount of impairment loss recorded in our consolidated statements of
85
income. This test requires a comparison of the implied fair value of the unit’s goodwill with the carrying amount ofthat goodwill. The estimate of the implied fair value of the reporting unit’s goodwill requires us to allocate the fairvalue of a reporting unit to all of the assets and liabilities of that reporting unit, including unrecognized intangibleassets, if any, since the implied fair value is determined as the excess of the fair value of a reporting unit over the netamounts assigned to its assets and liabilities in the allocation. Accordingly, the second step of the impairment testalso requires an estimate of the fair value of individual assets and liabilities, including any unrecognized intangibleassets that belong to that unit. A change in the estimation could have an impact on impairment recognition since it isdriven by hypothetical assumptions, such as customer behavior and interest rate forecasts. The estimation is basedon information available to management at the time the estimation is made.
Accounting for Intangible Assets. Intangible assets having indefinite useful lives are subject to annualimpairment tests. An impairment exists if the carrying value of an indefinite lived asset exceeds its fair value. Forother intangible assets subject to amortization, an impairment is recognized if the carrying amount is notrecoverable and the carrying amount exceeds the fair value of the intangible asset. Management judgment isrequired to evaluate whether indications of potential impairment have occurred, and to test intangible assets forimpairment if required.
Valuation of Financial Instruments
We measure certain financial assets and liabilities at fair value. The majority of such assets and liabilitiesare measured at fair value on a recurring basis, including trading securities, trading derivatives and investmentsecurities. In addition, certain other assets and liabilities are measured at fair value on a non-recurring basis,including held for sale loans which are carried at the lower of cost or fair value, collateral dependent loans andnonmarketable equity securities subject to impairment.
We have elected the fair value option for certain foreign securities classified as available-for-sale debtsecurities, whose unrealized gains and losses are reported in income, and marketable equity securities.
The guidance on the measurement of fair value defines fair value as the price that would be received to sellan asset or paid to transfer a liability in an orderly transaction between market participants at the measurementdate. We have an established and documented process for determining fair value in accordance with theguidance. To determine the fair value, we use quoted prices which include those provided from pricing vendors,where available. We generally obtain one price or quote per instrument and do not adjust it to determine the fairvalue of the instrument. We perform internal price verification procedures to ensure that the prices and quotesprovided from the independent pricing vendors are reasonable. Such verification procedures include acomparison of pricing sources and analysis of variances among pricing sources. These verification proceduresare periodically performed by independent risk management departments. For collateralized loan obligations, orCLOs, backed by general corporate loans, the fair value is determined by weighting the internal model valuationand the non-binding broker-dealer quotes. If quoted prices are not available to determine the fair value ofderivatives, the fair value is based upon valuation techniques that use, where possible, current market-based orindependently sourced parameters, such as interest rates, yield curves, foreign exchange rates, volatilities andcredit curves. The fair values of trading liabilities are determined by discounting future cash flows at a rate whichincorporates our own creditworthiness. In addition, valuation adjustments may be made to ensure that thefinancial instruments are recorded at fair value. These adjustments include, but are not limited to, amounts thatreflect counterparty credit quality, funding cost, liquidity risk, and model risk. Our financial models are validatedand periodically reviewed by risk management departments independent of divisions that created the models.
For a further discussion of the valuation techniques applied to the material assets or liabilities, see Note 32to our consolidated financial statements included elsewhere in this Annual Report.
Accounting Changes and Recently Issued Accounting Pronouncements
See “Accounting Changes” and “Recently Issued Accounting Pronouncements” in Note 1 to ourconsolidated financial statements included elsewhere in this Annual Report.
86

A. Operating Results
The following discussion relates to our operating results for the fiscal years ended March 31, 2018 and2019. For the discussion on our operating results for the fiscal year ended March 31, 2017, including certaincomparative discussion on our operating results for the fiscal years ended March 31, 2017 and 2018, pleaserefer to “Item 5. Operating and Financial Review and Prospectus—5.A. Operating Results” in our annual reporton Form 20-F for the fiscal year ended March 31, 2018, filed with the SEC on July 12, 2018.
Results of Operations
The following table sets forth a summary of our results of operations for the fiscal years ended March 31,2018 and 2019:
Fiscal years ended March 31,
2018 2019
(in billions)
Interest income . . . . . . . . . . . . . . . . . . . . . . . . . . . . . . . . . . . . . . . . . . . . . . . . . . . . . . . . ¥3,259.0 ¥3,813.4Interest expense . . . . . . . . . . . . . . . . . . . . . . . . . . . . . . . . . . . . . . . . . . . . . . . . . . . . . . . . 1,028.7 1,518.0
Net interest income . . . . . . . . . . . . . . . . . . . . . . . . . . . . . . . . . . . . . . . . . . . . . . . . . . . . . 2,230.3 2,295.4
Provision for (reversal of) credit losses . . . . . . . . . . . . . . . . . . . . . . . . . . . . . . . . . . . . . (240.8) 34.3Non-interest income . . . . . . . . . . . . . . . . . . . . . . . . . . . . . . . . . . . . . . . . . . . . . . . . . . . . 1,935.1 1,595.2Non-interest expense . . . . . . . . . . . . . . . . . . . . . . . . . . . . . . . . . . . . . . . . . . . . . . . . . . . . 2,744.4 2,985.5
Income before income tax expense . . . . . . . . . . . . . . . . . . . . . . . . . . . . . . . . . . . . . . . . . 1,661.8 870.8Income tax expense . . . . . . . . . . . . . . . . . . . . . . . . . . . . . . . . . . . . . . . . . . . . . . . . . . . . . 407.8 133.2
Net income before attribution of noncontrolling interests . . . . . . . . . . . . . . . . . . . . . . . ¥1,254.0 ¥ 737.6Net income (loss) attributable to noncontrolling interests . . . . . . . . . . . . . . . . . . . . . . . 25.8 19.0
Net income attributable to Mitsubishi UFJ Financial Group . . . . . . . . . . . . . . . . . . . . . ¥1,228.2 ¥ 718.6
Major components of our net income attributable to Mitsubishi UFJ Financial Group for the fiscal yearsended March 31, 2018 and 2019 are discussed in further detail below.
87

Net Interest Income
The following table is a summary of the interest rate spread for the fiscal years ended March 31, 2018 and2019:
Fiscal years ended March 31,
2018 2019
Averagebalance
Interestincome
(expense)Average
rateAveragebalance
Interestincome
(expense)Average
rate
(in billions, except percentages)Interest-earning assets:
Domestic . . . . . . . . . . . . . . . . . . . . . . . . . . . . . . . . . . . . . ¥144,602.0 ¥ 1,002.0 0.69% ¥145,279.1 ¥ 1,048.6 0.72%Foreign . . . . . . . . . . . . . . . . . . . . . . . . . . . . . . . . . . . . . . 94,447.0 2,257.0 2.39 96,128.3 2,764.8 2.88
Total . . . . . . . . . . . . . . . . . . . . . . . . . . . . . . . . . . . . ¥239,049.0 ¥ 3,259.0 1.36% ¥241,407.4 ¥ 3,813.4 1.58%
Financed by:Interest-bearing liabilities:
Domestic . . . . . . . . . . . . . . . . . . . . . . . . . . . . . . . . . . . . . ¥173,166.0 ¥ (367.6) 0.21% ¥173,199.6 ¥ (504.2) 0.29%Foreign . . . . . . . . . . . . . . . . . . . . . . . . . . . . . . . . . . . . . . 60,691.1 (661.1) 1.09 61,443.6 (1,013.8) 1.65
Total . . . . . . . . . . . . . . . . . . . . . . . . . . . . . . . . . . . . 233,857.1 (1,028.7) 0.44 234,643.2 (1,518.0) 0.65Non-interest-bearing liabilities . . . . . . . . . . . . . . . . . . . . . . . . 5,191.9 — 6,764.2 —
Total . . . . . . . . . . . . . . . . . . . . . . . . . . . . . . . . . . . . . . . . ¥239,049.0 0.43% ¥241,407.4 0.63%
Net interest income and interest rate spread . . . . . . . . . . . . . . ¥ 2,230.3 0.92% ¥ 2,295.4 0.93%Net interest income as a percentage of total interest-earning
assets . . . . . . . . . . . . . . . . . . . . . . . . . . . . . . . . . . . . . . . . . . 0.93% 0.95%
The following table shows changes in our net interest income by changes in volume and by changes in ratesfor the fiscal year ended March 31, 2019 compared to the fiscal year ended March 31, 2018:
Fiscal Year Ended March 31, 2018versus
Fiscal Year Ended March 31, 2019
Increase (decrease)due to changes in
Volume(1) Rate(1) Net change(in millions)
Domestic . . . . . . . . . . . . . . . . . . . . . . . . . . . . . . . . . . . . . . . . . . . . . . . . . . . . . . ¥ 8,801 ¥ (98,744) ¥ (89,943)Foreign . . . . . . . . . . . . . . . . . . . . . . . . . . . . . . . . . . . . . . . . . . . . . . . . . . . . . . . . 16,791 138,289 155,080
Total . . . . . . . . . . . . . . . . . . . . . . . . . . . . . . . . . . . . . . . . . . . . . . . . . . . . . . ¥25,592 ¥ 39,545 ¥ 65,137
Note:(1) Volume/rate variance is allocated based on the percentage relationship of changes in volume and changes in rate to the total “net
change.”
Our net interest income for each of the fiscal years ended March 31, 2018 and 2019 was not materiallyaffected by gains or losses resulting from interest rate and other derivative contracts. We use such derivativeinstruments to manage the risks affecting the values of our financial assets and liabilities. Although thesecontracts are generally entered into for risk management purposes, a majority of them do not meet the specificconditions to qualify for hedge accounting under U.S. GAAP and thus are accounted for as trading assets orliabilities. Any gains or losses resulting from such derivative instruments are recorded as part of Trading accountprofits—net. For a detailed discussion of our risk management activities, see “—A. Operating Results—Resultsof Operations—Non-Interest Income” and “Item 11. Quantitative and Qualitative Disclosures about Credit,Market and Other Risk.”
88

Fiscal Year Ended March 31, 2019 Compared to Fiscal Year Ended March 31, 2018
Net interest income increased ¥65.1 billion to ¥2,295.4 billion for the fiscal year ended March 31, 2019from ¥2,230.3 billion for the fiscal year ended March 31, 2018. This increase was due to higher foreign interestincome, mainly reflecting higher average interest rates on, and higher average balance of, interest-earning assets,particularly in the United States. This increase was partially offset by an increase in interest expense, primarilyreflecting higher interest rates on deposits in the United States and higher U.S. dollar funding rates in Japan.
Interest income increased ¥554.4 billion to ¥3,813.4 billion for the fiscal year ended March 31, 2019 from¥3,259.0 billion for the previous fiscal year. Domestic interest income increased ¥46.6 billion mainly due tohigher interest rates on domestic loans, reflecting higher long-term interest rates in Japan during the first half ofthe fiscal year ended March 31, 2019. Foreign interest income increased ¥507.8 billion primarily due to higherinterest rates on, and higher volumes of, foreign loans.
Interest expense increased ¥489.3 billion to ¥1,518.0 billion for the fiscal year ended March 31, 2019 from¥1,028.7 billion for the previous fiscal year. Domestic interest expense increased ¥136.5 billion, and foreigninterest expense increased ¥352.7 billion. The higher domestic interest expense was primarily attributable tohigher short-term U.S. dollar funding rates in Japan. The higher foreign interest expense was mainly due tohigher interest rates on deposits and higher money market interest rates in the United States.
Our average interest rate spread (which is the average interest rate on interest-earning assets less the averageinterest rate on interest-bearing liabilities) increased one basis point to 0.93% for the fiscal year ended March 31,2019 from 0.92% for the previous fiscal year. The portion of our foreign interest-earning assets funded bydomestic interest-bearing liabilities, which have lower interest rates than foreign interest-bearing liabilities,increased during the fiscal year ended March 31, 2019, compared to the previous fiscal year, resulting in theslight improvement in our overall interest spread. Between the same periods, the average interest rate spread ondomestic activities decreased five basis points to 0.43% from 0.48%, and the average interest rate spread onforeign activities decreased seven basis points to 1.23% from 1.30%. The decrease in the average interest ratespread on domestic activities mainly reflected lower interest rates on our Japanese government bond portfolioand higher U.S. dollar funding rates in Japan. The decrease in the average interest rate spread on foreignactivities mainly reflected higher money market interest rates in the United States and higher interest rates onforeign deposits.
The yield on 10-year Japanese government bonds fluctuated between 0% and positive 0.15% during the sixmonths ended September 30, 2018, but subsequently declined to negative 0.1% towards March 31, 2019. Duringthe previous fiscal year, the yield on such bonds fluctuated between negative 0.02% to positive 0.1%. In July2018, the Bank of Japan slightly modified its monetary policy, which included negative 0.1 percent interest onthe Policy-Rate Balances and a Japanese government bond purchase program with an aim to keep the yield of10-year Japanese government bonds around zero percent, by adopting forward guidance on interest rates andadding language in its policy statement that long-term interest rates may fluctuate depending on economic andprice developments. Long-term interest rates may fluctuate to a larger extent, causing additional uncertainty inthe interest rates in Japan. In the United States, the FRB raised the target range for the federal funds rate tobetween 1.75% to 2.00% in June 2018, then to between 2.00% to 2.25% in September 2018, and further tobetween 2.25% to 2.50% in December 2018. The FRB is currently expected to maintain the federal funds rate atthe current level or lower it during the calendar year 2019. See “—Business Environment.”
The average balance of interest-earning assets increased ¥2,358.4 billion to ¥241,407.4 billion for the fiscalyear ended March 31, 2019 from ¥239,049.0 billion for the fiscal year ended March 31, 2018. The averagebalance of domestic interest-earning assets increased ¥677.1 billion to ¥145,279.1 billion mainly due to anincrease in the average balance of our interest-earning deposits in other banks particularly because we depositedwith the Bank of Japan a larger amount of cash received on sales and redemption of Japanese government bondsas we reduced our holdings of such bonds. The higher average balance of domestic interest-earning assets wasalso due to an increase in trading account assets. The average balance of foreign interest-earning assets increased
89

¥1,681.3 billion primarily due to increases in foreign currency-denominated loans, deposits in other banks andinvestment securities, partially offset by a decrease in the average balance of trading account assets, particularlyU.S. Treasury bonds as interest rates rose for the first nine months ended December 31, 2018, in the UnitedStates.
The average balance of interest-bearing liabilities increased ¥786.1 billion to ¥234,643.2 billion for thefiscal year ended March 31, 2019 from ¥233,857.1 billion for the fiscal year ended March 31, 2018. The averagebalance of domestic interest-bearing liabilities increased ¥33.6 billion mainly due to an increase in domesticdeposits. The average balance of foreign interest-bearing liabilities increased ¥752.5 billion mainly due to anincrease in other short-term borrowings, including such borrowings through commercial paper.
Provision for (reversal of) credit losses
Fiscal Year Ended March 31, 2019 Compared to Fiscal Year Ended March 31, 2018
We recorded ¥34.3 billion of provision for credit losses for the fiscal year ended March 31, 2019, comparedto ¥240.8 billion of reversal of credit losses for the previous fiscal year. By segment, for the fiscal year endedMarch 31, 2019, ¥43.9 billion and ¥4.5 billion of reversal of credit losses were recorded in the Commercial andResidential segments respectively, while ¥23.9 billion, ¥9.3 billion and ¥49.5 billion of provision for credit losseswere recorded in the Card, MUFG Americas Holdings and Krungsri segments respectively. For the previousfiscal year, ¥297.4 billion, ¥22.3 billion and ¥9.3 billion of reversal of credit losses were recorded in theCommercial, Residential and MUFG Americas Holdings segments respectively, while ¥23.4 billion and¥64.8 billion of provision for credit losses were recorded in the Card and Krungsri segments, respectively.
The reversal of credit losses recorded in the Commercial segment for the fiscal year ended March 31, 2019mainly reflected the improvements in the financial performance of a large borrower in the domestic electronicsmanufacturing industry. The reversal of credit losses in the Residential segment for the fiscal year endedMarch 31, 2019 primarily reflected, though to a lesser extent compared to the previous fiscal year, the improvedcredit quality of borrowers who were positively affected by the stable domestic corporate environment in recentperiods.
The larger provision for credit losses in the Card segment for the fiscal year ended March 31, 2019 wasprimarily attributable to an increase in default borrowers who filed for bankruptcy as part of their debt workoutefforts. Although the stable corporate environment in recent periods positively affected some individualborrowers, the positive trends did not meaningfully affect our consumer loan borrowers and, in some cases, thecorporate efficiencies negatively affected some of our consumer loan borrowers. The provision for credit lossesin the MUFG Americas Holdings segment for the fiscal year ended March 31, 2019 mainly reflected thebankruptcy filing of a large borrower in the electric power industry. The smaller provision for credit losses in theKrungsri segment mainly reflected the improved credit quality of the small and medium-sized enterprise loanportfolio where gradually stabilizing economic conditions in Thailand resulted in fewer borrowers experiencingdeterioration in their financial performance.
We recorded ¥40.2 billion of reversal of credit losses for our domestic loan portfolio for the fiscal yearended March 31, 2019, compared to reversal of credit losses of ¥266.1 billion for the previous fiscal year. Thisreflected the improvement in the credit quality of a large borrower in the domestic manufacturing industry in theCommercial segment and the credit quality of borrowers in the Residential segment, partially offset by theweaker credit quality among consumer loan borrowers. We recorded ¥74.5 billion of provision for credit lossesfor our foreign portfolio for the fiscal year ended March 31, 2019, compared to ¥25.3 billion of provision forcredit losses for the previous fiscal year. The larger provision primarily reflected the deteriorated financialcondition of some large foreign borrowers who belong to the electric power industry and the constructionindustry in the Commercial and MUFG Americas Holdings segments.
For more information, see “—B. Liquidity and Capital Resources—Financial Condition—Loan Portfolio.”
90
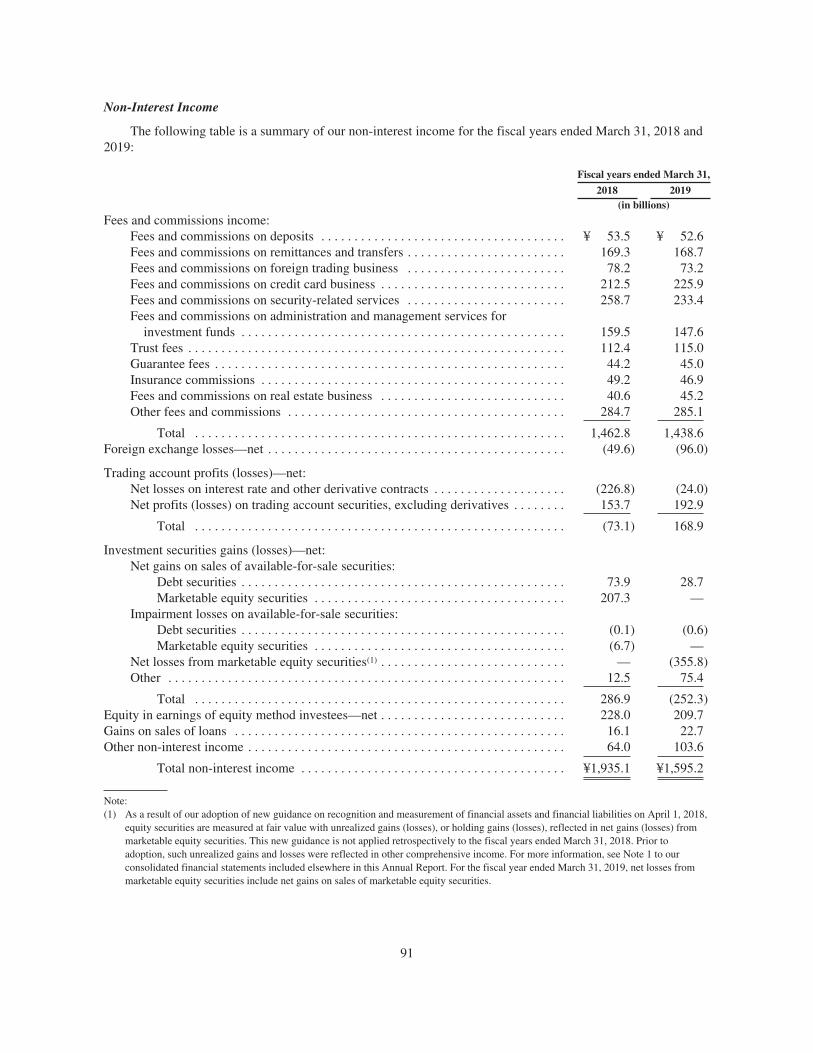
Non-Interest Income
The following table is a summary of our non-interest income for the fiscal years ended March 31, 2018 and2019:
Fiscal years ended March 31,
2018 2019(in billions)
Fees and commissions income:Fees and commissions on deposits . . . . . . . . . . . . . . . . . . . . . . . . . . . . . . . . . . . . . ¥ 53.5 ¥ 52.6Fees and commissions on remittances and transfers . . . . . . . . . . . . . . . . . . . . . . . . 169.3 168.7Fees and commissions on foreign trading business . . . . . . . . . . . . . . . . . . . . . . . . 78.2 73.2Fees and commissions on credit card business . . . . . . . . . . . . . . . . . . . . . . . . . . . . 212.5 225.9Fees and commissions on security-related services . . . . . . . . . . . . . . . . . . . . . . . . 258.7 233.4Fees and commissions on administration and management services for
investment funds . . . . . . . . . . . . . . . . . . . . . . . . . . . . . . . . . . . . . . . . . . . . . . . . . 159.5 147.6Trust fees . . . . . . . . . . . . . . . . . . . . . . . . . . . . . . . . . . . . . . . . . . . . . . . . . . . . . . . . . 112.4 115.0Guarantee fees . . . . . . . . . . . . . . . . . . . . . . . . . . . . . . . . . . . . . . . . . . . . . . . . . . . . . 44.2 45.0Insurance commissions . . . . . . . . . . . . . . . . . . . . . . . . . . . . . . . . . . . . . . . . . . . . . . 49.2 46.9Fees and commissions on real estate business . . . . . . . . . . . . . . . . . . . . . . . . . . . . 40.6 45.2Other fees and commissions . . . . . . . . . . . . . . . . . . . . . . . . . . . . . . . . . . . . . . . . . . 284.7 285.1
Total . . . . . . . . . . . . . . . . . . . . . . . . . . . . . . . . . . . . . . . . . . . . . . . . . . . . . . . . 1,462.8 1,438.6Foreign exchange losses—net . . . . . . . . . . . . . . . . . . . . . . . . . . . . . . . . . . . . . . . . . . . . . (49.6) (96.0)
Trading account profits (losses)—net:Net losses on interest rate and other derivative contracts . . . . . . . . . . . . . . . . . . . . (226.8) (24.0)Net profits (losses) on trading account securities, excluding derivatives . . . . . . . . 153.7 192.9
Total . . . . . . . . . . . . . . . . . . . . . . . . . . . . . . . . . . . . . . . . . . . . . . . . . . . . . . . . (73.1) 168.9
Investment securities gains (losses)—net:Net gains on sales of available-for-sale securities:
Debt securities . . . . . . . . . . . . . . . . . . . . . . . . . . . . . . . . . . . . . . . . . . . . . . . . . 73.9 28.7Marketable equity securities . . . . . . . . . . . . . . . . . . . . . . . . . . . . . . . . . . . . . . 207.3 —
Impairment losses on available-for-sale securities:Debt securities . . . . . . . . . . . . . . . . . . . . . . . . . . . . . . . . . . . . . . . . . . . . . . . . . (0.1) (0.6)Marketable equity securities . . . . . . . . . . . . . . . . . . . . . . . . . . . . . . . . . . . . . . (6.7) —
Net losses from marketable equity securities(1) . . . . . . . . . . . . . . . . . . . . . . . . . . . . — (355.8)Other . . . . . . . . . . . . . . . . . . . . . . . . . . . . . . . . . . . . . . . . . . . . . . . . . . . . . . . . . . . . 12.5 75.4
Total . . . . . . . . . . . . . . . . . . . . . . . . . . . . . . . . . . . . . . . . . . . . . . . . . . . . . . . . 286.9 (252.3)Equity in earnings of equity method investees—net . . . . . . . . . . . . . . . . . . . . . . . . . . . . 228.0 209.7Gains on sales of loans . . . . . . . . . . . . . . . . . . . . . . . . . . . . . . . . . . . . . . . . . . . . . . . . . . 16.1 22.7Other non-interest income . . . . . . . . . . . . . . . . . . . . . . . . . . . . . . . . . . . . . . . . . . . . . . . . 64.0 103.6
Total non-interest income . . . . . . . . . . . . . . . . . . . . . . . . . . . . . . . . . . . . . . . . ¥1,935.1 ¥1,595.2
Note:(1) As a result of our adoption of new guidance on recognition and measurement of financial assets and financial liabilities on April 1, 2018,
equity securities are measured at fair value with unrealized gains (losses), or holding gains (losses), reflected in net gains (losses) frommarketable equity securities. This new guidance is not applied retrospectively to the fiscal years ended March 31, 2018. Prior toadoption, such unrealized gains and losses were reflected in other comprehensive income. For more information, see Note 1 to ourconsolidated financial statements included elsewhere in this Annual Report. For the fiscal year ended March 31, 2019, net losses frommarketable equity securities include net gains on sales of marketable equity securities.
91

Fiscal Year Ended March 31, 2019 Compared to Fiscal Year Ended March 31, 2018
Non-interest income decreased ¥339.9 billion to ¥1,595.2 billion for the fiscal year ended March 31, 2019from ¥1,935.1 billion for the fiscal year ended March 31, 2018. This decrease was mainly attributable to¥252.3 billion of investment securities losses, primarily due to net losses from marketable equity securitiesrecorded as a result of our adoption of new guidance on recognition and measurement of financial assets andfinancial liabilities on April 1, 2018.
Fees and commissions income
Fees and commissions income decreased ¥24.2 billion to ¥1,438.6 billion for the fiscal year endedMarch 31, 2019 from ¥1,462.8 billion for the fiscal year ended March 31, 2018. This decrease was primarily dueto a decrease in fees and commissions on securities-related services mainly due to lower volumes of selling andbuying transactions by retail customers. This decrease was partially offset by an increase in fees andcommissions on credit card business, reflecting an increase in payment processing fees and an increase in creditcard issuance fees as credit card use grew in Japan.
Net foreign exchange gains (losses)
The following table sets forth the details of our foreign exchange gains and losses for the fiscal years endedMarch 31, 2018 and 2019:
Fiscal years ended March 31,
2018 2019
(in billions)
Foreign exchange losses—net:Net foreign exchange losses on derivative contracts . . . . . . . . . . . . . . . . . . . . . . . ¥(160.0) ¥(354.4)Net foreign exchange gains on other than derivative contracts . . . . . . . . . . . . . . . 377.9 71.8Net foreign exchange gains (losses) related to the fair value option . . . . . . . . . . . (267.5) 186.6
Total . . . . . . . . . . . . . . . . . . . . . . . . . . . . . . . . . . . . . . . . . . . . . . . . . . . . . . . . ¥ (49.6) ¥ (96.0)
Net foreign exchange losses for the fiscal year ended March 31, 2019 were ¥96.0 billion, compared to netlosses of ¥49.6 billion for the fiscal year ended March 31, 2018. This was mainly due to smaller net foreignexchange gains on other than derivative contracts, reflecting the negative impact of fluctuations in the foreigncurrency exchange rates on the Japanese yen translated amounts of monetary liabilities of our commercialbanking subsidiaries as the Japanese yen depreciated against other major currencies on a spot rate basis betweenMarch 31, 2018 and March 31, 2019. The larger total net foreign exchange losses also resulted from larger netforeign exchange losses on derivative contracts mainly due to the lower mark to market valuation on currencyswaps entered in connection with our U.S. dollar funding, reflecting the wider gap between Japanese yen interestrates and U.S. dollar interest rates. These were substantially offset by an increase in net foreign exchange gainson foreign-denominated trading account securities, such as U.S. Treasury bonds, under the fair value option asthe Japanese yen depreciated against the U.S. dollar from ¥106.24 to the U.S. dollar as of March 31, 2018 to¥110.99 to the U.S. dollar as of March 31, 2019, while the Japanese yen appreciated against the U.S. dollarduring the previous fiscal year resulting in net foreign exchange losses on U.S. dollar-denominated tradingaccount securities under the fair value option.
92

Net trading account profits (losses)
The following table sets forth details of our trading account profits and losses for the fiscal years endedMarch 31, 2018 and 2019:
Fiscal years ended March 31,
2018 2019
(in billions)
Trading account profits (losses)—net:Net profits (losses) on interest rate and other derivative contracts
Interest rate contracts . . . . . . . . . . . . . . . . . . . . . . . . . . . . . . . . . . . . . . . . . . . ¥ 51.0 ¥ 5.6Equity contracts . . . . . . . . . . . . . . . . . . . . . . . . . . . . . . . . . . . . . . . . . . . . . . . . (260.4) 80.1Commodity contracts . . . . . . . . . . . . . . . . . . . . . . . . . . . . . . . . . . . . . . . . . . . 6.3 0.3Credit derivatives . . . . . . . . . . . . . . . . . . . . . . . . . . . . . . . . . . . . . . . . . . . . . . (1.8) (39.8)Other . . . . . . . . . . . . . . . . . . . . . . . . . . . . . . . . . . . . . . . . . . . . . . . . . . . . . . . . (21.9) (70.2)
Total . . . . . . . . . . . . . . . . . . . . . . . . . . . . . . . . . . . . . . . . . . . . . . . . . . . . ¥(226.8) ¥ (24.0)
Net profits (losses) on trading account securities, excluding derivativesTrading account securities . . . . . . . . . . . . . . . . . . . . . . . . . . . . . . . . . . . . . . . . ¥ 301.9 ¥ (16.0)Trading account securities under the fair value option . . . . . . . . . . . . . . . . . . (148.2) 208.9
Total . . . . . . . . . . . . . . . . . . . . . . . . . . . . . . . . . . . . . . . . . . . . . . . . . . . . ¥ 153.7 ¥192.9
Total . . . . . . . . . . . . . . . . . . . . . . . . . . . . . . . . . . . . . . . . . . . . . . . . . . . . . . . . . . . . ¥ (73.1) ¥168.9
Net trading account profits were ¥168.9 billion for the fiscal year ended March 31, 2019, compared to nettrading account losses of ¥73.1 billion for the fiscal year ended March 31, 2018. This improvement was mainlydue to smaller net losses on interest rate and other derivative contracts, which primarily reflected ¥80.1 billion ofnet profits on equity contracts for the fiscal year ended March 31, 2019, compared to ¥260.4 billion of net losseson such contracts for the fiscal year ended March 31, 2018, due to an increase in the market value of equitycontracts designed to hedge against downside price fluctuations, as equity prices were on a declining trend inJapan particularly towards the end of the fiscal year ended March 31, 2019.
The ¥39.2 billion increase in net profits on trading account securities, excluding derivatives, resulted mainlyfrom an improvement in net profits on trading account securities under the fair value option, particularly U.S.Treasury bonds, as long-term interest rates declined in the United States during the fiscal year ended March 31,2019. The yield on 10-year U.S. Treasury bonds declined to around 2.4% as of March 31, 2019 from around2.7% as of March 31, 2018, whereas the yield on such bonds rose to around 2.7% as of March 31, 2018 fromaround 2.4% as of March 31, 2017. This improvement was substantially offset by net losses on trading accountsecurities as equity prices declined in Japan towards the end of the fiscal year ended March 31, 2019.
Net investment securities gains (losses)
Net investment securities losses were ¥252.3 billion for the fiscal year ended March 31, 2019, compared tonet investment securities gains of ¥286.9 billion for the fiscal year ended March 31, 2018. This was mainly dueto ¥355.8 billion of net losses from marketable equity securities recorded as a result of our adoption of newguidance on recognition and measurement of financial assets and financial liabilities on April 1, 2018. Under thisguidance, equity securities are measured at fair value, and the unrealized gains (losses), or holding gains (losses),on such securities are reported as net investment securities gains (losses) in our consolidated statements ofincome. This new guidance is not applied retrospectively to the fiscal year ended March 31, 2018. Prior toadoption, such unrealized gains (losses) were reflected in other comprehensive income. For more information,see Note 1 to our consolidated financial statements included elsewhere in this Annual Report.
93

The net losses from marketable equity securities for the fiscal year ended March 31, 2019 reflected lowerequity prices in Japan. The net losses from marketable equity securities also included smaller net gains on salesof marketable equity securities.
Net equity in earnings of equity method investees
Net equity in earnings of equity method investees for the fiscal year ended March 31, 2019 was¥209.7 billion, compared to ¥228.0 billion for the previous fiscal year, reflecting lower earnings of our equitymethod investees, including Morgan Stanley.
Non-Interest Expense
The following table shows a summary of our non-interest expense for the fiscal years ended March 31, 2018and 2019:
Fiscal years ended March 31,
2018 2019
(in billions)
Salaries and employee benefits(1) . . . . . . . . . . . . . . . . . . . . . . . . . . . . . . . . . . . . . . . . ¥1,165.4 ¥1,175.4Occupancy expenses—net . . . . . . . . . . . . . . . . . . . . . . . . . . . . . . . . . . . . . . . . . . . . . . 179.1 179.8Fees and commissions expenses . . . . . . . . . . . . . . . . . . . . . . . . . . . . . . . . . . . . . . . . . 297.8 313.7Outsourcing expenses, including data processing . . . . . . . . . . . . . . . . . . . . . . . . . . . . 276.2 275.1Depreciation of premises and equipment . . . . . . . . . . . . . . . . . . . . . . . . . . . . . . . . . . 96.2 98.9Amortization of intangible assets . . . . . . . . . . . . . . . . . . . . . . . . . . . . . . . . . . . . . . . . 234.4 235.1Impairment of intangible assets . . . . . . . . . . . . . . . . . . . . . . . . . . . . . . . . . . . . . . . . . 21.9 118.1Insurance premiums, including deposit insurance . . . . . . . . . . . . . . . . . . . . . . . . . . . 91.8 93.8Communications . . . . . . . . . . . . . . . . . . . . . . . . . . . . . . . . . . . . . . . . . . . . . . . . . . . . . 58.1 59.2Taxes and public charges . . . . . . . . . . . . . . . . . . . . . . . . . . . . . . . . . . . . . . . . . . . . . . 90.2 95.4Impairment of goodwill . . . . . . . . . . . . . . . . . . . . . . . . . . . . . . . . . . . . . . . . . . . . . . . . — —Provision for (reversal of) off-balance sheet credit instruments . . . . . . . . . . . . . . . . . (96.1) 38.5Other non-interest expenses(1) . . . . . . . . . . . . . . . . . . . . . . . . . . . . . . . . . . . . . . . . . . . 329.4 302.5
Total non-interest expense . . . . . . . . . . . . . . . . . . . . . . . . . . . . . . . . . . . . . . . . . ¥2,744.4 ¥2,985.5
Note:(1) As a result of our adoption of new guidance on the presentation of net periodic pension cost and net periodic postretirement benefit cost
on April 1, 2018 on a retrospective basis, the service cost component continues to be presented in Salaries and employee benefits whileother components of net pension benefit or cost (e.g., interest cost on projected benefit obligation, actual return on plan assets,amortization of prior service cost) are now presented in Other non-interest expenses. For more information, see Notes 1 and 13 to ourconsolidated financial statements included elsewhere in this Annual Report.
Fiscal Year Ended March 31, 2019 Compared to Fiscal Year Ended March 31, 2018
Non-interest expense increased ¥241.1 billion to ¥2,985.5 billion for the fiscal year ended March 31, 2019from ¥2,744.4 billion for the previous fiscal year. Major factors affecting this increase are discussed below.
Impairment of intangible assets
Impairment of intangible assets increased ¥96.2 billion to ¥118.1 billion. This was primarily attributable to¥116.1 billion of impairment losses on system integration-related assets of Mitsubishi UFJ NICOS as wefundamentally revised our system integration plan, comprehensively taking into account the scale of, thecomplexity of, and the degree of difficulty in, developing the system and responding to rapid changes inpayments market in an appropriate manner. For further discussion of impairment on intangible assets, see Note 6to our audited consolidated financial statements included elsewhere in this Annual Report. See also “Item 3.D.Key Information-Risk Factors-Risks Related to Our Business-Our operations are highly dependent on ourinformation, communications and transaction management systems and are subject to an increasing risk of cyber-attacks and other information security threats and to changes in the business and regulatory environment.”
94
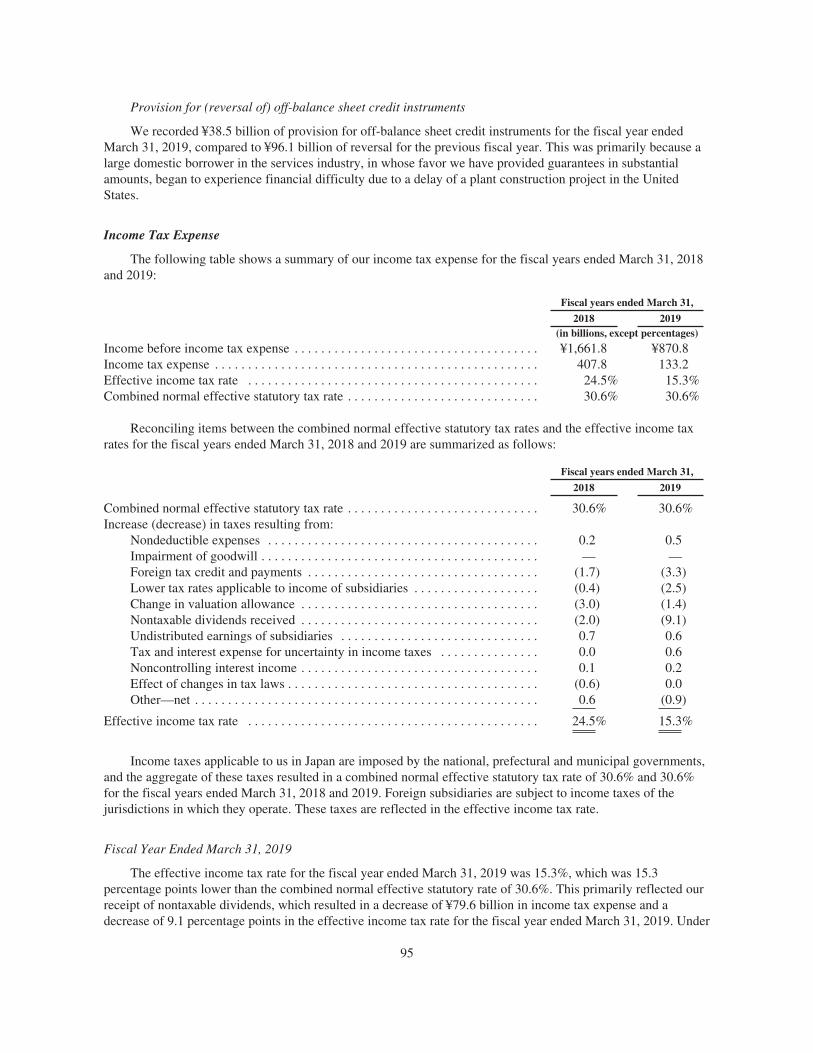
Provision for (reversal of) off-balance sheet credit instruments
We recorded ¥38.5 billion of provision for off-balance sheet credit instruments for the fiscal year endedMarch 31, 2019, compared to ¥96.1 billion of reversal for the previous fiscal year. This was primarily because alarge domestic borrower in the services industry, in whose favor we have provided guarantees in substantialamounts, began to experience financial difficulty due to a delay of a plant construction project in the UnitedStates.
Income Tax Expense
The following table shows a summary of our income tax expense for the fiscal years ended March 31, 2018and 2019:
Fiscal years ended March 31,
2018 2019(in billions, except percentages)
Income before income tax expense . . . . . . . . . . . . . . . . . . . . . . . . . . . . . . . . . . . . . ¥1,661.8 ¥870.8Income tax expense . . . . . . . . . . . . . . . . . . . . . . . . . . . . . . . . . . . . . . . . . . . . . . . . . 407.8 133.2Effective income tax rate . . . . . . . . . . . . . . . . . . . . . . . . . . . . . . . . . . . . . . . . . . . . 24.5% 15.3%Combined normal effective statutory tax rate . . . . . . . . . . . . . . . . . . . . . . . . . . . . . 30.6% 30.6%
Reconciling items between the combined normal effective statutory tax rates and the effective income taxrates for the fiscal years ended March 31, 2018 and 2019 are summarized as follows:
Fiscal years ended March 31,
2018 2019
Combined normal effective statutory tax rate . . . . . . . . . . . . . . . . . . . . . . . . . . . . . 30.6% 30.6%Increase (decrease) in taxes resulting from:
Nondeductible expenses . . . . . . . . . . . . . . . . . . . . . . . . . . . . . . . . . . . . . . . . . 0.2 0.5Impairment of goodwill . . . . . . . . . . . . . . . . . . . . . . . . . . . . . . . . . . . . . . . . . . — —Foreign tax credit and payments . . . . . . . . . . . . . . . . . . . . . . . . . . . . . . . . . . . (1.7) (3.3)Lower tax rates applicable to income of subsidiaries . . . . . . . . . . . . . . . . . . . (0.4) (2.5)Change in valuation allowance . . . . . . . . . . . . . . . . . . . . . . . . . . . . . . . . . . . . (3.0) (1.4)Nontaxable dividends received . . . . . . . . . . . . . . . . . . . . . . . . . . . . . . . . . . . . (2.0) (9.1)Undistributed earnings of subsidiaries . . . . . . . . . . . . . . . . . . . . . . . . . . . . . . 0.7 0.6Tax and interest expense for uncertainty in income taxes . . . . . . . . . . . . . . . 0.0 0.6Noncontrolling interest income . . . . . . . . . . . . . . . . . . . . . . . . . . . . . . . . . . . . 0.1 0.2Effect of changes in tax laws . . . . . . . . . . . . . . . . . . . . . . . . . . . . . . . . . . . . . . (0.6) 0.0Other—net . . . . . . . . . . . . . . . . . . . . . . . . . . . . . . . . . . . . . . . . . . . . . . . . . . . . 0.6 (0.9)
Effective income tax rate . . . . . . . . . . . . . . . . . . . . . . . . . . . . . . . . . . . . . . . . . . . . 24.5% 15.3%
Income taxes applicable to us in Japan are imposed by the national, prefectural and municipal governments,and the aggregate of these taxes resulted in a combined normal effective statutory tax rate of 30.6% and 30.6%for the fiscal years ended March 31, 2018 and 2019. Foreign subsidiaries are subject to income taxes of thejurisdictions in which they operate. These taxes are reflected in the effective income tax rate.
Fiscal Year Ended March 31, 2019
The effective income tax rate for the fiscal year ended March 31, 2019 was 15.3%, which was 15.3percentage points lower than the combined normal effective statutory rate of 30.6%. This primarily reflected ourreceipt of nontaxable dividends, which resulted in a decrease of ¥79.6 billion in income tax expense and adecrease of 9.1 percentage points in the effective income tax rate for the fiscal year ended March 31, 2019. Under
95

Japanese tax law, a certain percentage of dividends received is considered nontaxable and excluded from grossrevenue in computing taxable income. This creates a permanent difference between our taxable income forJapanese tax purposes and our income before income tax expense reported under U.S. GAAP. Another factorcontributing to the lower effective income tax rate was foreign tax credit, which resulted in a decrease of¥28.5 billion in income tax expense and a decrease of 3.3 percentage points in the effective income tax rate forthe fiscal year ended March 31, 2019.
Fiscal Year Ended March 31, 2018
The effective income tax rate for the fiscal year ended March 31, 2018 was 24.5%, which was 6.1percentage points lower than the combined normal effective statutory rate of 30.6%. This primarily reflected areduction in valuation allowance to the extent that it was more likely than not that the deferred tax assets wouldbe realized mainly because a subsidiary was added to our consolidated tax payment system during the fiscal yearended March 31, 2018 after it was fully consolidated into our financial statements. The projected taxable incomeof the subsidiary, for which we had valuation allowance recorded on its deferred tax assets, significantlyincreased due to the application of our consolidated tax payment system to the subsidiary. As a result, therealizability of the subsidiary’s deferred tax assets became more likely than not, and the relevant valuationallowance was reduced to the extent of the improved realizability. The reduction in the relevant valuationallowance resulted in a decrease of ¥33.3 billion in income tax expense and a decrease of 2.0 percentage points inthe effective income tax rate for the fiscal year ended March 31, 2018. Another factor contributing to the lowereffective income tax rate was our receipt of nontaxable dividends, which resulted in a decrease of ¥32.6 billion inincome tax expense and a decrease of 2.0 percentage points in the effective income tax rate for the fiscal yearended March 31, 2018. Under Japanese tax law, a certain percentage of dividends received is considerednontaxable and excluded from gross revenue in computing taxable income. This creates a permanent differencebetween our taxable income for Japanese tax purposes and our income before income tax expense reported underU.S. GAAP.
Net income (loss) attributable to noncontrolling interests
Fiscal Year Ended March 31, 2019 Compared to Fiscal Year Ended March 31, 2018
We recorded ¥19.0 billion of net income attributable to noncontrolling interests for the fiscal year endedMarch 31, 2019, compared to ¥25.8 billion of net income attributable to noncontrolling interests for the previousfiscal year. This mainly reflected decrease in net income of Mitsubishi UFJ Morgan Stanley Securities.
Business Segment Analysis
We measure the performance of each of our business segments primarily in terms of “operating profit.”Operating profit and other segment information in this Annual Report are based on the financial informationprepared in accordance with Japanese GAAP as adjusted in accordance with internal management accountingrules and practices. Accordingly, the format and information are not consistent with our consolidated financialstatements prepared in accordance with U.S. GAAP. For example, operating profit does not reflect items such asa component of the provision for (reversal of) credit losses (primarily equivalent to the formula allowance underU.S. GAAP), foreign exchange gains (losses) and investment securities gains (losses). For a reconciliation ofoperating profit under the internal management reporting system to income before income tax expense shown onthe consolidated statements of income, see Note 30 to our consolidated financial statements included elsewherein this Annual Report. We do not use information on the segments’ total assets to allocate our resources andassess performance. Accordingly, business segment information on total assets is not presented.
Starting this fiscal year ended March 31, 2019, as part of our current medium-term business plan, we havereorganized our business groups in an effort to further integrate the expertise and capabilities of our subsidiariesto respond to the needs of our customers more effectively and efficiently. We make and execute unified group-
96

wide strategies based on customer characteristics and the nature of business and have accordingly integrated theoperations of our group companies into six business groups—Retail & Commercial Banking, JapaneseCorporate & Investment Banking, Global Corporate & Investment Banking, Global Commercial Banking, AssetManagement & Investor Services, and Global Markets. Our reporting segments consist of these six businessgroups, which serve as the core sources of our revenue, as well as “Other,” which represents the operations thatare not covered under the six core business groups and the elimination of duplicated amounts of net revenuesamong business segments, as further described below.
The following is a brief explanation of our business segments for the fiscal year ended March 31, 2019:
Retail & Commercial Banking Business Group—Covers the domestic retail and commercial bankingbusinesses of MUFG Bank, Mitsubishi UFJ Trust and Banking, Mitsubishi UFJ Securities Holdings, MitsubishiUFJ NICOS and other group companies of MUFG. This business group offers retail and small and medium-sizedenterprise customers in Japan an extensive array of commercial banking, trust banking and securities productsand services.
Japanese Corporate & Investment Banking Business Group—Covers the large Japanese corporatebusinesses of MUFG Bank, Mitsubishi UFJ Trust and Banking and Mitsubishi UFJ Securities Holdings,including the transaction banking, investment banking, trust banking and securities businesses. This businessgroup offers large Japanese corporations advanced financial solutions designed to respond to their diversified andglobalized needs and to contribute to their business and financial strategies through the global network of ourgroup companies.
Global Corporate & Investment Banking Business Group—Covers the corporate, investment andtransaction banking businesses of MUFG Bank and Mitsubishi UFJ Securities Holdings. Through a globalnetwork of offices and branches, this business group provides non-Japanese large corporate and financialinstitution customers outside Japan with a comprehensive set of solutions that meet their increasingly diverse andsophisticated financing needs.
Global Commercial Banking Business Group—Covers the retail and commercial banking businesses ofMUFG Union Bank and Krungsri. This business group offers a comprehensive array of financial products andservices such as loans, deposits, fund transfers, investments and asset management services for local retail, smalland medium-sized enterprise, and corporate customers across the Asia-Pacific region.
Asset Management & Investor Services Business Group—Covers the asset management and assetadministration businesses of Mitsubishi UFJ Trust and Banking and MUFG Bank. By integrating the trustbanking expertise of Mitsubishi UFJ Trust and Banking and the global strengths of MUFG Bank, the businessgroup offers a full range of asset management and administration services for corporations and pension funds,including pension fund management and administration, advice on pension structures, and payments tobeneficiaries, and also offer investment trusts for retail customers.
Global Markets Business Group—Covers the customer business and the treasury operations of MUFGBank, Mitsubishi UFJ Trust and Banking and Mitsubishi UFJ Securities Holdings. The customer businessincludes sales and trading in fixed income instruments, currencies, equities and other investment products as wellas origination and distribution of financial products. The treasury operations include asset and liabilitymanagement as well as global investments for the MUFG Group.
Other—Consists mainly of the corporate centers of MUFG, MUFG Bank, Mitsubishi UFJ Trust andBanking and Mitsubishi UFJ Morgan Stanley Securities. The elimination of duplicated amounts of net revenuesamong business segments was also reflected in Other.
Below we have restated our prior business segment information and relevant discussion to reflect thereorganization of our business groups described above and the transfer of corporate loan-related businesses of
97
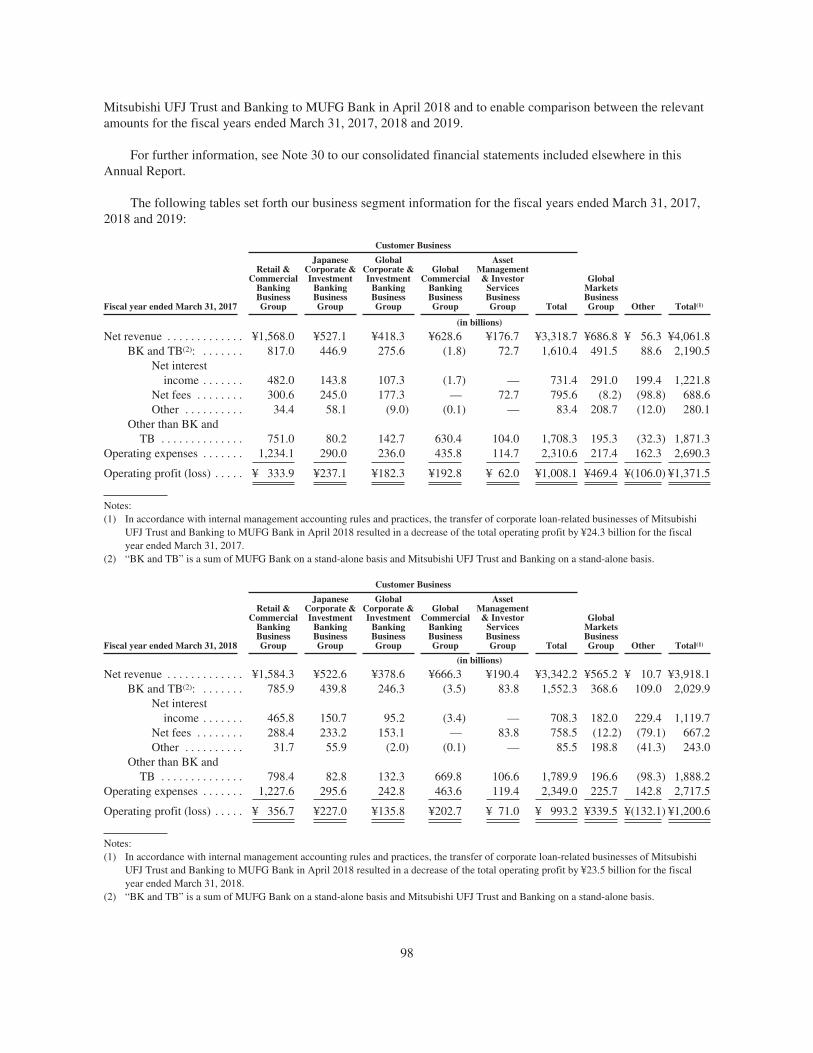
Mitsubishi UFJ Trust and Banking to MUFG Bank in April 2018 and to enable comparison between the relevantamounts for the fiscal years ended March 31, 2017, 2018 and 2019.
For further information, see Note 30 to our consolidated financial statements included elsewhere in thisAnnual Report.
The following tables set forth our business segment information for the fiscal years ended March 31, 2017,2018 and 2019:
Customer Business
Fiscal year ended March 31, 2017
Retail &Commercial
BankingBusinessGroup
JapaneseCorporate &Investment
BankingBusinessGroup
GlobalCorporate &Investment
BankingBusinessGroup
GlobalCommercial
BankingBusinessGroup
AssetManagement& Investor
ServicesBusinessGroup Total
GlobalMarketsBusinessGroup Other Total(1)
(in billions)
Net revenue . . . . . . . . . . . . . ¥1,568.0 ¥527.1 ¥418.3 ¥628.6 ¥176.7 ¥3,318.7 ¥686.8 ¥ 56.3 ¥4,061.8BK and TB(2): . . . . . . . 817.0 446.9 275.6 (1.8) 72.7 1,610.4 491.5 88.6 2,190.5
Net interestincome . . . . . . . 482.0 143.8 107.3 (1.7) — 731.4 291.0 199.4 1,221.8
Net fees . . . . . . . . 300.6 245.0 177.3 — 72.7 795.6 (8.2) (98.8) 688.6Other . . . . . . . . . . 34.4 58.1 (9.0) (0.1) — 83.4 208.7 (12.0) 280.1
Other than BK andTB . . . . . . . . . . . . . . 751.0 80.2 142.7 630.4 104.0 1,708.3 195.3 (32.3) 1,871.3
Operating expenses . . . . . . . 1,234.1 290.0 236.0 435.8 114.7 2,310.6 217.4 162.3 2,690.3
Operating profit (loss) . . . . . ¥ 333.9 ¥237.1 ¥182.3 ¥192.8 ¥ 62.0 ¥1,008.1 ¥469.4 ¥(106.0) ¥1,371.5
Notes:(1) In accordance with internal management accounting rules and practices, the transfer of corporate loan-related businesses of Mitsubishi
UFJ Trust and Banking to MUFG Bank in April 2018 resulted in a decrease of the total operating profit by ¥24.3 billion for the fiscalyear ended March 31, 2017.
(2) “BK and TB” is a sum of MUFG Bank on a stand-alone basis and Mitsubishi UFJ Trust and Banking on a stand-alone basis.
Customer Business
Fiscal year ended March 31, 2018
Retail &Commercial
BankingBusinessGroup
JapaneseCorporate &Investment
BankingBusinessGroup
GlobalCorporate &Investment
BankingBusinessGroup
GlobalCommercial
BankingBusinessGroup
AssetManagement& Investor
ServicesBusinessGroup Total
GlobalMarketsBusinessGroup Other Total(1)
(in billions)
Net revenue . . . . . . . . . . . . . ¥1,584.3 ¥522.6 ¥378.6 ¥666.3 ¥190.4 ¥3,342.2 ¥565.2 ¥ 10.7 ¥3,918.1BK and TB(2): . . . . . . . 785.9 439.8 246.3 (3.5) 83.8 1,552.3 368.6 109.0 2,029.9
Net interestincome . . . . . . . 465.8 150.7 95.2 (3.4) — 708.3 182.0 229.4 1,119.7
Net fees . . . . . . . . 288.4 233.2 153.1 — 83.8 758.5 (12.2) (79.1) 667.2Other . . . . . . . . . . 31.7 55.9 (2.0) (0.1) — 85.5 198.8 (41.3) 243.0
Other than BK andTB . . . . . . . . . . . . . . 798.4 82.8 132.3 669.8 106.6 1,789.9 196.6 (98.3) 1,888.2
Operating expenses . . . . . . . 1,227.6 295.6 242.8 463.6 119.4 2,349.0 225.7 142.8 2,717.5
Operating profit (loss) . . . . . ¥ 356.7 ¥227.0 ¥135.8 ¥202.7 ¥ 71.0 ¥ 993.2 ¥339.5 ¥(132.1) ¥1,200.6
Notes:(1) In accordance with internal management accounting rules and practices, the transfer of corporate loan-related businesses of Mitsubishi
UFJ Trust and Banking to MUFG Bank in April 2018 resulted in a decrease of the total operating profit by ¥23.5 billion for the fiscalyear ended March 31, 2018.
(2) “BK and TB” is a sum of MUFG Bank on a stand-alone basis and Mitsubishi UFJ Trust and Banking on a stand-alone basis.
98

Customer Business
Fiscal year ended March 31, 2019
Retail &Commercial
BankingBusinessGroup
JapaneseCorporate &Investment
BankingBusinessGroup
GlobalCorporate &Investment
BankingBusinessGroup
GlobalCommercial
BankingBusinessGroup
AssetManagement& Investor
ServicesBusinessGroup Total
GlobalMarketsBusinessGroup Other Total
(in billions)
Net revenue . . . . . . . . . . . . . ¥1,521.6 ¥541.5 ¥399.7 ¥706.9 ¥203.0 ¥3,372.7 ¥472.5 ¥ (32.8) ¥3,812.4BK and TB(1): . . . . . . . 738.6 421.6 266.6 (1.4) 93.2 1,518.6 303.9 38.5 1,861.0
Net interestincome . . . . . . . 460.4 152.1 113.6 (1.4) — 724.7 183.1 237.4 1,145.2
Net fees . . . . . . . . 243.9 213.1 152.4 — 93.2 702.6 (14.2) (67.5) 620.9Other . . . . . . . . . . 34.3 56.4 0.6 — — 91.3 135.0 (131.4) 94.9
Other than BK andTB . . . . . . . . . . . . . . 783.0 119.9 133.1 708.3 109.8 1,854.1 168.6 (71.3) 1,951.4
Operating expenses . . . . . . . 1,222.8 291.8 247.0 486.5 124.6 2,372.7 221.3 146.1 2,740.1
Operating profit (loss) . . . . . ¥ 298.8 ¥249.7 ¥152.7 ¥220.4 ¥ 78.4 ¥1,000.0 ¥251.2 ¥(178.9) ¥1,072.3
Note:(1) “BK and TB” is a sum of MUFG Bank on a stand-alone basis and Mitsubishi UFJ Trust and Banking on a stand-alone basis.
Fiscal Year Ended March 31, 2019 Compared to Fiscal Year Ended March 31, 2018
Retail & Commercial Banking Business Group
Net revenue of the Retail & Commercial Banking Business Group decreased ¥62.7 billion to¥1,521.6 billion for the fiscal year ended March 31, 2019 from ¥1,584.3 billion for the fiscal year endedMarch 31, 2018. The Retail & Commercial Banking Business Group’s net revenue mainly consists of interestincome from lending and deposit-taking operations and fees relating to credit card settlement, consumerfinancing, real estate and stock transfer services for Japanese domestic individual and small to medium-sizedcorporate customers. The decrease in net revenue was mainly due to a decrease in investment products salesreflecting weaker retail customer demand for investment products under unfavorable market conditions. Thedecrease was partially offset by higher payment processing fees from the credit card business and higher feesfrom the consumer finance business as credit card use and consumer lending grew in Japan.
Operating expenses of the Retail & Commercial Banking Business Group decreased ¥4.8 billion to¥1,222.8 billion for the fiscal year ended March 31, 2019 from ¥1,227.6 billion for the fiscal year endedMarch 31, 2018. The decrease primarily resulted from our cost reduction measures, partially offset by higherexpenses relating to the “Channel Strategy and Business Process Re-engineering” project pursuant to our currentmedium-term business plan and the system integration for our consumer finance business.
As a result, operating profit of the Retail & Commercial Banking Business Group decreased ¥57.9 billion to¥298.8 billion for the fiscal year ended March 31, 2019 from ¥356.7 billion for the fiscal year ended March 31,2018.
Japanese Corporate & Investment Banking Business Group
Net revenue of the Japanese Corporate & Investment Banking Business Group increased ¥18.9 billion to¥541.5 billion for the fiscal year ended March 31, 2019 from ¥522.6 billion for the fiscal year ended March 31,2018. The Japanese Corporate & Investment Banking Business Group’s net revenue mainly consists of interestincome from lending and deposit-taking operations and fees relating to financing, investment banking, real estateand stock transfer services for large Japanese corporate customers. The increase in net revenue was mainly due tohigher net interest income from foreign currency-denominated loans and deposits reflecting higher interest ratespreads on such loans and deposits and larger balances of such deposits as well as higher fees and commissionsfrom the investment banking business relating to M&A and IPO transactions.
99

Operating expenses of the Japanese Corporate & Investment Banking Business Group decreased ¥3.8 billionto ¥291.8 billion for the fiscal year ended March 31, 2019 from ¥295.6 billion for the fiscal year ended March 31,2018. The decrease mainly reflected the results of our cost reduction measures.
As a result, operating profit of the Japanese Corporate & Investment Banking Business Group increased¥22.7 billion to ¥249.7 billion for the fiscal year ended March 31, 2019 from ¥227.0 billion for the fiscal yearended March 31, 2018.
Global Corporate & Investment Banking Business Group
Net revenue of the Global Corporate & Investment Banking Business Group increased ¥21.1 billion to¥399.7 billion for the fiscal year ended March 31, 2019 from ¥378.6 billion for the fiscal year ended March 31,2018. The Global Corporate & Investment Banking Business Group’s net revenue mainly consists of interestincome from lending and deposit-taking operations and fees and commissions from investment banking servicesand foreign exchange and derivatives transactions for large non-Japanese corporate and institutional customersoutside Japan. The increase in net revenue was mainly attributable to larger balances of loans and a decline inforeign currency-denominated mid- to long term funding costs as well as the closings of several large event-driven financing deals in the Americas and the Asia and Oceania region.
Operating expenses of the Global Corporate & Investment Banking Business Group increased ¥4.2 billion to¥247.0 billion for the fiscal year ended March 31, 2019 from ¥242.8 billion for the fiscal year ended March 31,2018. The increase was mainly attributable to higher expenses for system development and global financialregulatory compliance purposes.
As a result, operating profit of the Global Corporate & Investment Banking Business Group increased¥16.9 billion to ¥152.7 billion for the fiscal year ended March 31, 2019 from ¥135.8 billion for the fiscal yearended March 31, 2018.
Global Commercial Banking Business Group
Net revenue of the Global Commercial Banking Business Group increased ¥40.6 billion to ¥706.9 billion forthe fiscal year ended March 31, 2019 from ¥666.3 billion for the fiscal year ended March 31, 2018. The GlobalCommercial Banking Business Group’s net revenue mainly consists of interest income from lending and deposit-taking operations and fees from remittances and transfers, consumer finance and wealth-related services forindividual and small to medium-sized corporate customers of MUFG Union Bank and Krungsri. The increase innet revenue was mainly due to higher net interest income reflecting an increase in Krungsri’s automobile loanportfolio. The increase in net revenue was also attributable to higher net interest income in MUFG Union Bankmainly reflecting an increase in its retail loan portfolio.
Operating expenses of the Global Commercial Banking Business Group increased ¥22.9 billion to¥486.5 billion for the fiscal year ended March 31, 2019 from ¥463.6 billion for the fiscal year ended March 31,2018. The increase was mainly attributable to an increase in expenses in Krungsri primarily reflecting largervolumes of business. The increase in operating expenses was also attributable to an increase in expenses for ITsystem development projects in the United States.
As a result, operating profit of the Global Commercial Banking Business Group increased ¥17.7 billion to¥220.4 billion for the fiscal year ended March 31, 2019 from ¥202.7 billion for the fiscal year ended March 31,2018.
Asset Management & Investor Services Business Group
Net revenue of the Asset Management & Investor Services Business Group increased ¥12.6 billion to¥203.0 billion for the fiscal year ended March 31, 2019 from ¥190.4 billion for the fiscal year ended March 31,
100

2018. The Asset Management & Investor Services Business Group’s net revenue mainly consists of fees fromasset management and administration services for products, such as pension trusts and mutual funds. Theincrease in net revenue was primarily attributable to higher fees from investor services both in and outside Japan,reflecting a larger balance of assets under management as we expanded our services to global fund customers andstarted to offer services for new domestic investment products. The increase in net revenue was also attributableto an increase in investment products sales to domestic corporate investors.
Operating expenses of the Asset Management & Investor Services Business Group increased ¥5.2 billion to¥124.6 billion for the fiscal year ended March 31, 2019 from ¥119.4 billion for the fiscal year ended March 31,2018. The increase was mainly attributable to larger volumes of business.
As a result, operating profit of the Asset Management & Investor Services Business Group increased¥7.4 billion to ¥78.4 billion for the fiscal year ended March 31, 2019 from ¥71.0 billion for the fiscal year endedMarch 31, 2018.
Global Markets Business Group
Net revenue of the Global Markets Business Group decreased ¥92.7 billion to ¥472.5 billion for the fiscalyear ended March 31, 2019 from ¥565.2 billion for the fiscal year ended March 31, 2018. This was mainly due tolower net revenue from the asset and liability management operations, primarily reflecting tighter spreadsbetween long-term and short-term interest rates in the United States as well as lower realized gains on sales ofJapanese government bonds. In the fiscal year ended March 31, 2018, we recorded relatively higher realizedgains on sales of Japanese government bonds executed in larger volumes in anticipation of greater fluctuations ininterest rates in Japan. The decrease in net revenue was also attributable to a decline in customer businessreflecting lower volatility in the bond and equity markets.
Operating expenses of the Global Markets Business Group decreased ¥4.4 billion to ¥221.3 billion for thefiscal year ended March 31, 2019 from ¥225.7 billion for the fiscal year ended March 31, 2018. This decreaseprimarily reflected the results of our cost reduction measures, partially offset by an increase in expenses forfinancial regulatory compliance purposes.
As a result, operating profit of the Global Markets Business Group decreased ¥88.3 billion to ¥251.2 billionfor the fiscal year ended March 31, 2019 from ¥339.5 billion for the fiscal year ended March 31, 2018.
Fiscal Year Ended March 31, 2018 Compared to Fiscal Year Ended March 31, 2017
Retail & Commercial Banking Business Group
Net revenue of the Retail & Commercial Banking Business Group increased ¥16.3 billion to¥1,584.3 billion for the fiscal year ended March 31, 2018 from ¥1,568.0 billion for the fiscal year endedMarch 31, 2017. The Retail & Commercial Banking Business Group’s net revenue mainly consists of interestincome from lending and deposit-taking operations and fees relating to credit card settlement, consumerfinancing, real estate and stock transfer services for Japanese domestic individual and small to medium-sizedcorporate customers. The increase in net revenue was mainly due to an increase in payment processing fees andan increase in fees from the consumer finance business, reflecting growth in the volume of cashless payments.The increase in net revenue was also attributable to an increase in fees and commissions on sales of securitiesprimarily due to stronger customer demand in response to the rising trend in equity prices. These increases in netrevenues were partially offset by the lower net revenue related to operations funded by deposits due to tighterinterest rate spreads in the near-zero interest rate environment in Japan.
Operating expenses of the Retail & Commercial Banking Business Group decreased ¥6.5 billion to¥1,227.6 billion for the fiscal year ended March 31, 2018 from ¥1,234.1 billion for the fiscal year endedMarch 31, 2017, mainly resulting from our cost reduction measures.
101
As a result, operating profit of the Retail & Commercial Banking Business Group increased ¥22.8 billion to¥356.7 billion for the fiscal year ended March 31, 2018 from ¥333.9 billion for the fiscal year ended March 31,2017.
Japanese Corporate & Investment Banking Business Group
Net revenue of the Japanese Corporate & Investment Banking Business Group decreased ¥4.5 billion to¥522.6 billion for the fiscal year ended March 31, 2018 from ¥527.1 billion for the fiscal year ended March 31,2017. The Japanese Corporate & Investment Banking Business Group’s net revenue mainly consists of interestincome from lending and deposit-taking operations and fees relating to financing, investment banking, real estateand stock transfer services for large Japanese corporate customers. The lower net revenue mainly reflected adecrease in fee income from the sales of derivative instruments and lower net revenues from the M&A andunderwriting businesses, mainly reflecting reduced corporate investment and financing activities due touncertainties surrounding the financial market. The lower net revenue was also attributable to decreases in netinterest income related to domestic operations funded by deposits and net revenue from loans to domesticcorporate clients due to tighter interest rate spreads in the near-zero interest rate environment in Japan, whichmore than offset the increases in net interest income related to overseas operations funded by deposits and netrevenue from loans to overseas corporate clients.
Operating expenses of the Japanese Corporate & Investment Banking Business Group increased ¥5.6 billionto ¥295.6 billion for the fiscal year ended March 31, 2018 from ¥290.0 billion for the fiscal year ended March 31,2017. This increase was primarily due to the increased volume of overseas Japanese corporate business andhigher expenses for global financial regulatory compliance purposes.
As a result, operating profit of the Japanese Corporate & Investment Banking Business Group decreased¥10.1 billion to ¥227.0 billion for the fiscal year ended March 31, 2018 from ¥237.1 billion for the fiscal yearended March 31, 2017.
Global Corporate & Investment Banking Business Group
Net revenue of the Global Corporate & Investment Banking Business Group decreased ¥39.7 billion to¥378.6 billion for the fiscal year ended March 31, 2018 from ¥418.3 billion for the fiscal year ended March 31,2017. The Global Corporate & Investment Banking Business Group’s net revenue mainly consists of interestincome from lending and deposit-taking operations and fees and commissions from investment banking servicesand foreign exchange and derivatives transactions for large non- Japanese corporate and institutional customersoutside Japan. The lower net revenue was mainly due to a decrease in the volume of M&A finance business inthe United States as well as the application of stricter business acceptance criteria as part of our effort to improveprofitability.
Operating expenses of the Global Corporate & Investment Banking Business Group increased ¥6.8 billion to¥242.8 billion for the fiscal year ended March 31, 2018 from ¥236.0 billion for the fiscal year ended March 31,2017, reflecting higher expenses for global financial regulatory compliance purposes.
As a result, operating profit of the Global Corporate & Investment Banking Business Group decreased¥46.5 billion to ¥135.8 billion for the fiscal year ended March 31, 2018 from ¥182.3 billion for the fiscal yearended March 31, 2017.
Global Commercial Banking Business Group
Net revenue of the Global Commercial Banking Business Group increased ¥37.7 billion to ¥666.3 billion forthe fiscal year ended March 31, 2018 from ¥628.6 billion for the fiscal year ended March 31, 2017. The GlobalCommercial Banking Business Group’s net revenue mainly consists of interest income from lending and
102

deposit-taking operations and fees from remittances and transfers, consumer finance and wealth-related servicesfor individual and small to medium-sized corporate customers of MUFG Union Bank and Krungsri. The highernet revenue was mainly due to an increase in net interest income reflecting an increase in Krungsri’s automobileand consumer finance loan portfolio.
Operating expenses of the Global Commercial Banking Business Group increased ¥27.8 billion to¥463.6 billion for the fiscal year ended March 31, 2018 from ¥435.8 billion for the fiscal year ended March 31,2017, reflecting higher expenses in Krungsri primarily due to increased business volume.
As a result, operating profit of the Global Commercial Banking Business Group increased ¥9.9 billion to¥202.7 billion for the fiscal year ended March 31, 2018 from ¥192.8 billion for the fiscal year ended March 31,2017.
Asset Management & Investor Services Business Group
Net revenue of the Asset Management & Investor Services Business Group increased ¥13.7 billion to¥190.4 billion for the fiscal year ended March 31, 2018 from ¥176.7 billion for the fiscal year ended March 31,2017. The Asset Management & Investor Services Business Group’s net revenue mainly consists of fees fromasset management and administration services for products, such as pension trusts and mutual funds. Net revenueof the Trust Assets Business Group increased mainly due to an increase in income from the fund administrationand custody services globally, reflecting the contributions of our recently acquired overseas subsidiaries.
Operating expenses of the Asset Management & Investor Services Business Group increased ¥4.7 billion to¥119.4 billion for the fiscal year ended March 31, 2018 from ¥114.7 billion for the fiscal year ended March 31,2017. This was mainly due to the expansion of our fund administration and custody businesses globally throughacquisitions.
As a result, operating profit of the Asset Management & Investor Services Business Group increased¥9.0 billion to ¥71.0 billion for the fiscal year ended March 31, 2018 from ¥62.0 billion for the fiscal year endedMarch 31, 2017.
Global Markets Business Group
Net revenue of the Global Markets Business Group decreased ¥121.6 billion to ¥565.2 billion for the fiscalyear ended March 31, 2018 from ¥686.8 billion for the fiscal year ended March 31, 2017. This was mainly due toa decrease in net revenue from the asset liability management operations, primarily reflecting a decrease inrealized gains on sales of foreign government bonds as well as a decrease in interest income due to the reductionof our foreign government bond portfolio and the flattening of the yield curve of U.S. Treasury bonds. Thedecrease in net revenue was also attributable to lower net revenue from the sales and trading business in Japan,reflecting the low volatility in interest rates.
Operating expenses of the Global Markets Business Group increased ¥8.3 billion to ¥225.7 billion for thefiscal year ended March 31, 2018 from ¥217.4 billion for the fiscal year ended March 31, 2017, reflecting higherexpenses in our overseas securities subsidiaries primarily with larger volumes of sales and trading business aswell as higher expenses for financial regulatory compliance purposes.
As a result, operating profit of the Global Markets Business Group decreased ¥129.9 billion to¥339.5 billion for the fiscal year ended March 31, 2018 from ¥469.4 billion for the fiscal year ended March 31,2017.
Geographic Segment Analysis
The table below sets forth our total revenue, income (loss) before income tax expense (benefit) and netincome (loss) attributable to Mitsubishi UFJ Financial Group on a geographic basis for the fiscal years ended
103

March 31, 2018 and 2019. Assets, income and expenses attributable to foreign operations are allocated togeographical areas based on the domicile of the debtors and customers. In general, we have allocated all directexpenses and a proportionate share of general and administrative expenses to income derived from foreign loansand other transactions by our foreign operations to the relevant foreign geographical areas. Certain charges, suchas most impairment charges on goodwill, are recognized as domestic expenses. For further information, seeNote 31 to our consolidated financial statements included elsewhere in this Annual Report.
Fiscal years ended March 31,
2018 2019
(in billions)
Total revenue (interest income and non-interest income):Domestic . . . . . . . . . . . . . . . . . . . . . . . . . . . . . . . . . . . . . . . . . . . . . . . . . . . . . . . . . ¥2,127.3 ¥1,886.4
Foreign:United States of America . . . . . . . . . . . . . . . . . . . . . . . . . . . . . . . . . . . . . . . . 1,337.5 1,637.6Europe . . . . . . . . . . . . . . . . . . . . . . . . . . . . . . . . . . . . . . . . . . . . . . . . . . . . . . . 506.2 222.3Asia/Oceania excluding Japan . . . . . . . . . . . . . . . . . . . . . . . . . . . . . . . . . . . . 780.0 1,157.9Other areas(1) . . . . . . . . . . . . . . . . . . . . . . . . . . . . . . . . . . . . . . . . . . . . . . . . . . 443.1 504.4
Total foreign . . . . . . . . . . . . . . . . . . . . . . . . . . . . . . . . . . . . . . . . . . . . . . 3,066.8 3,522.2
Total . . . . . . . . . . . . . . . . . . . . . . . . . . . . . . . . . . . . . . . . . . . . . . . . ¥5,194.1 ¥5,408.6
Income (loss) before income tax expense (benefit):Domestic . . . . . . . . . . . . . . . . . . . . . . . . . . . . . . . . . . . . . . . . . . . . . . . . . . . . . . . . . ¥ 439.9 ¥ (317.7)
Foreign:United States of America . . . . . . . . . . . . . . . . . . . . . . . . . . . . . . . . . . . . . . . . 493.7 624.6Europe . . . . . . . . . . . . . . . . . . . . . . . . . . . . . . . . . . . . . . . . . . . . . . . . . . . . . . . 332.5 48.3Asia/Oceania excluding Japan . . . . . . . . . . . . . . . . . . . . . . . . . . . . . . . . . . . . 128.9 265.2Other areas(1) . . . . . . . . . . . . . . . . . . . . . . . . . . . . . . . . . . . . . . . . . . . . . . . . . . 266.8 250.4
Total foreign . . . . . . . . . . . . . . . . . . . . . . . . . . . . . . . . . . . . . . . . . . . . . . 1,221.9 1,188.5
Total . . . . . . . . . . . . . . . . . . . . . . . . . . . . . . . . . . . . . . . . . . . . . . . . ¥1,661.8 ¥ 870.8
Net income (loss) attributable to Mitsubishi UFJ Financial GroupDomestic . . . . . . . . . . . . . . . . . . . . . . . . . . . . . . . . . . . . . . . . . . . . . . . . . . . . . . . . . ¥ 140.1 ¥ (345.1)
Foreign:United States of America . . . . . . . . . . . . . . . . . . . . . . . . . . . . . . . . . . . . . . . . 447.9 573.7Europe . . . . . . . . . . . . . . . . . . . . . . . . . . . . . . . . . . . . . . . . . . . . . . . . . . . . . . . 322.6 50.9Asia/Oceania excluding Japan . . . . . . . . . . . . . . . . . . . . . . . . . . . . . . . . . . . . 92.0 214.5Other areas(1) . . . . . . . . . . . . . . . . . . . . . . . . . . . . . . . . . . . . . . . . . . . . . . . . . . 225.6 224.6
Total foreign . . . . . . . . . . . . . . . . . . . . . . . . . . . . . . . . . . . . . . . . . . . . . . 1,088.1 1,063.7
Total . . . . . . . . . . . . . . . . . . . . . . . . . . . . . . . . . . . . . . . . . . . . . . . . ¥1,228.2 ¥ 718.6
Note:(1) Other areas primarily include Canada, Latin America, the Caribbean and the Middle East.
Fiscal Year Ended March 31, 2019 Compared to Fiscal Year Ended March 31, 2018
Domestic net loss attributable to Mitsubishi UFJ Financial Group for the fiscal year ended March 31, 2019was ¥345.1 billion, compared to domestic net income attributable to Mitsubishi UFJ Financial Group of¥140.1 billion for the fiscal year ended March 31, 2018. This was mainly attributable to investment securitieslosses recorded as a result of our adoption of new guidance on recognition and measurement of financial assetsand financial liabilities on April 1, 2018, mainly reflecting lower equity prices in Japan.
104
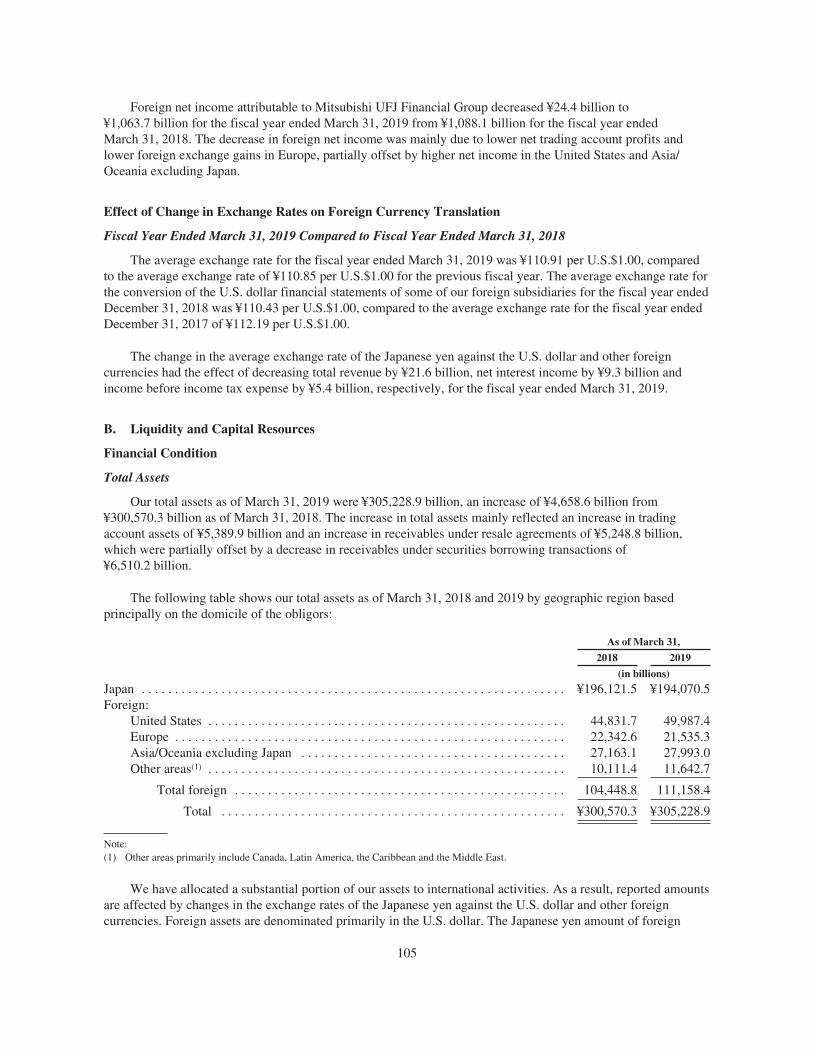
Foreign net income attributable to Mitsubishi UFJ Financial Group decreased ¥24.4 billion to¥1,063.7 billion for the fiscal year ended March 31, 2019 from ¥1,088.1 billion for the fiscal year endedMarch 31, 2018. The decrease in foreign net income was mainly due to lower net trading account profits andlower foreign exchange gains in Europe, partially offset by higher net income in the United States and Asia/Oceania excluding Japan.
Effect of Change in Exchange Rates on Foreign Currency Translation
Fiscal Year Ended March 31, 2019 Compared to Fiscal Year Ended March 31, 2018
The average exchange rate for the fiscal year ended March 31, 2019 was ¥110.91 per U.S.$1.00, comparedto the average exchange rate of ¥110.85 per U.S.$1.00 for the previous fiscal year. The average exchange rate forthe conversion of the U.S. dollar financial statements of some of our foreign subsidiaries for the fiscal year endedDecember 31, 2018 was ¥110.43 per U.S.$1.00, compared to the average exchange rate for the fiscal year endedDecember 31, 2017 of ¥112.19 per U.S.$1.00.
The change in the average exchange rate of the Japanese yen against the U.S. dollar and other foreigncurrencies had the effect of decreasing total revenue by ¥21.6 billion, net interest income by ¥9.3 billion andincome before income tax expense by ¥5.4 billion, respectively, for the fiscal year ended March 31, 2019.
B. Liquidity and Capital Resources
Financial Condition
Total Assets
Our total assets as of March 31, 2019 were ¥305,228.9 billion, an increase of ¥4,658.6 billion from¥300,570.3 billion as of March 31, 2018. The increase in total assets mainly reflected an increase in tradingaccount assets of ¥5,389.9 billion and an increase in receivables under resale agreements of ¥5,248.8 billion,which were partially offset by a decrease in receivables under securities borrowing transactions of¥6,510.2 billion.
The following table shows our total assets as of March 31, 2018 and 2019 by geographic region basedprincipally on the domicile of the obligors:
As of March 31,
2018 2019
(in billions)
Japan . . . . . . . . . . . . . . . . . . . . . . . . . . . . . . . . . . . . . . . . . . . . . . . . . . . . . . . . . . . . . . . . ¥196,121.5 ¥194,070.5Foreign:
United States . . . . . . . . . . . . . . . . . . . . . . . . . . . . . . . . . . . . . . . . . . . . . . . . . . . . . . 44,831.7 49,987.4Europe . . . . . . . . . . . . . . . . . . . . . . . . . . . . . . . . . . . . . . . . . . . . . . . . . . . . . . . . . . . 22,342.6 21,535.3Asia/Oceania excluding Japan . . . . . . . . . . . . . . . . . . . . . . . . . . . . . . . . . . . . . . . . 27,163.1 27,993.0Other areas(1) . . . . . . . . . . . . . . . . . . . . . . . . . . . . . . . . . . . . . . . . . . . . . . . . . . . . . . 10,111.4 11,642.7
Total foreign . . . . . . . . . . . . . . . . . . . . . . . . . . . . . . . . . . . . . . . . . . . . . . . . . . 104,448.8 111,158.4
Total . . . . . . . . . . . . . . . . . . . . . . . . . . . . . . . . . . . . . . . . . . . . . . . . . . . . ¥300,570.3 ¥305,228.9
Note:(1) Other areas primarily include Canada, Latin America, the Caribbean and the Middle East.
We have allocated a substantial portion of our assets to international activities. As a result, reported amountsare affected by changes in the exchange rates of the Japanese yen against the U.S. dollar and other foreigncurrencies. Foreign assets are denominated primarily in the U.S. dollar. The Japanese yen amount of foreign
105

currency-denominated assets increases as major foreign currencies appreciate against the Japanese yen. Forexample, as of March 31, 2019, the exchange rate was ¥110.99 per U.S.$1.00, as compared with ¥106.24 as ofMarch 31, 2018. This depreciation of the Japanese yen against the U.S. dollar and other foreign currenciesbetween March 31, 2018 and March 31, 2019 resulted in a ¥768.6 billion increase in the Japanese yen amount ofour total assets as of March 31, 2019.
106

Loan Portfolio
The following table sets forth our loans outstanding, before deduction of allowance for credit losses, as ofMarch 31, 2018 and 2019, based on the industry segment loan classifications as defined by the Bank of Japan forregulatory reporting purposes, which is not necessarily based on the use of proceeds:
As of March 31,
2018 2019
(in billions)
Domestic:Manufacturing . . . . . . . . . . . . . . . . . . . . . . . . . . . . . . . . . . . . . . . . . . . . . . . . . . . . . ¥ 10,876.6 ¥ 11,154.0Construction . . . . . . . . . . . . . . . . . . . . . . . . . . . . . . . . . . . . . . . . . . . . . . . . . . . . . . 781.3 717.7Real estate . . . . . . . . . . . . . . . . . . . . . . . . . . . . . . . . . . . . . . . . . . . . . . . . . . . . . . . . 11,763.8 11,706.4Services . . . . . . . . . . . . . . . . . . . . . . . . . . . . . . . . . . . . . . . . . . . . . . . . . . . . . . . . . . 2,689.1 2,653.2Wholesale and retail . . . . . . . . . . . . . . . . . . . . . . . . . . . . . . . . . . . . . . . . . . . . . . . . 7,989.1 7,643.4Banks and other financial institutions(1) . . . . . . . . . . . . . . . . . . . . . . . . . . . . . . . . . 4,818.4 5,213.0Communication and information services . . . . . . . . . . . . . . . . . . . . . . . . . . . . . . . 1,551.5 1,510.6Other industries . . . . . . . . . . . . . . . . . . . . . . . . . . . . . . . . . . . . . . . . . . . . . . . . . . . . 8,939.3 8,756.5Consumer . . . . . . . . . . . . . . . . . . . . . . . . . . . . . . . . . . . . . . . . . . . . . . . . . . . . . . . . 16,287.3 15,802.0
Total domestic . . . . . . . . . . . . . . . . . . . . . . . . . . . . . . . . . . . . . . . . . . . . . . . . . 65,696.4 65,156.8
Foreign:Governments and official institutions . . . . . . . . . . . . . . . . . . . . . . . . . . . . . . . . . . . 920.5 841.7Banks and other financial institutions(1) . . . . . . . . . . . . . . . . . . . . . . . . . . . . . . . . . 12,851.6 11,641.4Commercial and industrial . . . . . . . . . . . . . . . . . . . . . . . . . . . . . . . . . . . . . . . . . . . 30,591.2 31,951.1Other . . . . . . . . . . . . . . . . . . . . . . . . . . . . . . . . . . . . . . . . . . . . . . . . . . . . . . . . . . . . 7,270.9 7,597.5
Total foreign . . . . . . . . . . . . . . . . . . . . . . . . . . . . . . . . . . . . . . . . . . . . . . . . . . 51,634.2 52,031.7
Unearned income, unamortized premium—net and deferred loan fees—net . . . . . . . . . (294.7) (304.6)
Total(2) . . . . . . . . . . . . . . . . . . . . . . . . . . . . . . . . . . . . . . . . . . . . . . . . . . . . . . . ¥117,035.9 ¥116,883.9
Notes:(1) Loans to so-called “non-bank finance companies” are generally included in the “Banks and other financial institutions” category.
Non-bank finance companies are primarily engaged in consumer lending, factoring and credit card businesses.(2) The above table includes loans held for sale of ¥226.9 billion and ¥291.8 billion as of March 31, 2018 and 2019, respectively, which are
carried at the lower of cost or fair value.
Loans are one of our main uses of funds. For the fiscal year ended March 31, 2019, the average balance ofloans was ¥118,102.2 billion, accounting for 48.9% of the average total interest-earning assets, compared to¥117,765.1 billion, representing 49.3% of the average total interest-earning assets, for the previous fiscal year.As of March 31, 2019, our total loans were ¥116,883.9 billion, accounting for 38.3% of total assets, compared to¥117,035.9 billion, accounting for 38.9% of total assets as of March 31, 2018. As a percentage of total loansbefore unearned income, net unamortized premiums and net deferred loan fees, between March 31, 2018 andMarch 31, 2019, domestic loans decreased from 56.0% to 55.6%, while foreign loans increased from 44.0% to44.4%.
Our domestic loan balance decreased ¥539.6 billion, or 0.8%, between March 31, 2018 and March 31, 2019.This was mainly due to a decrease in residential loans, which are included in the consumer category in the abovetable, as repayments exceeded newly extended loans.
Our foreign loan balance increased ¥397.5 billion, or 0.8%, between March 31, 2018 and March 31, 2019.This was primarily due to increased lending activity in the United States and Asia excluding Japan whereeconomic conditions continued to improve at a moderate pace. In particular, larger volumes of retail, consumerand residential loans in MUFG Union Bank and automobile loans in Krungsri contributed to the increase in theforeign loan balance.
107
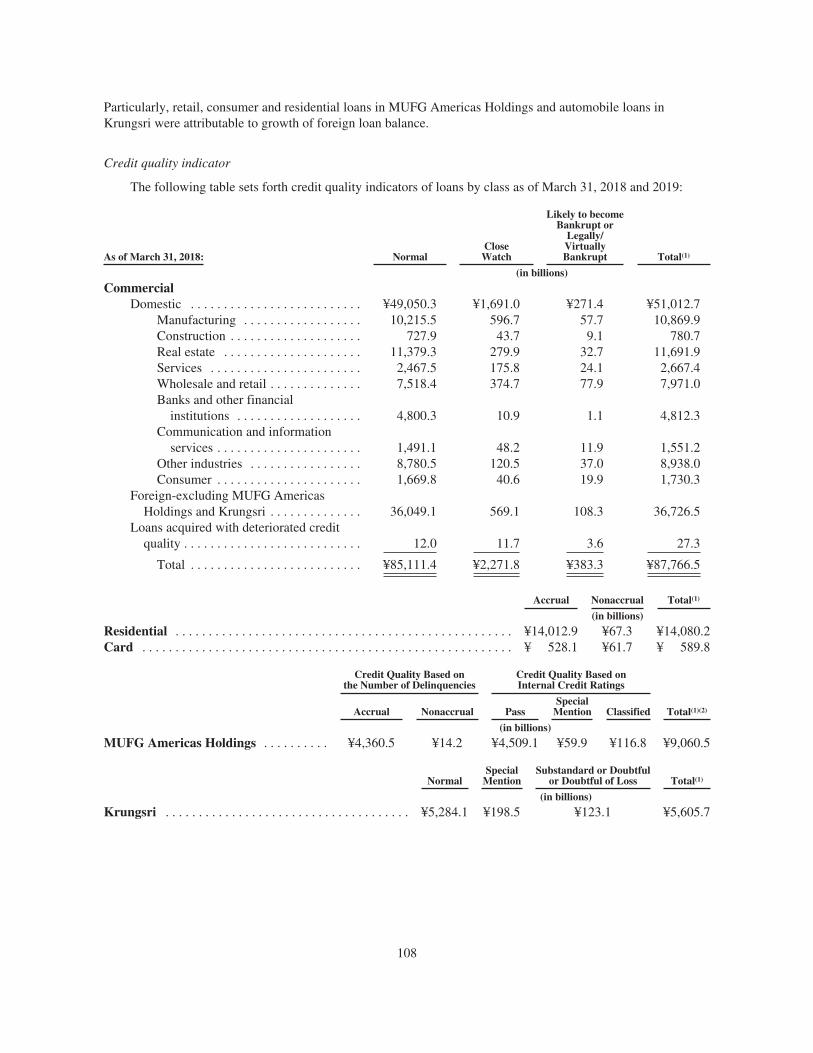
Particularly, retail, consumer and residential loans in MUFG Americas Holdings and automobile loans inKrungsri were attributable to growth of foreign loan balance.
Credit quality indicator
The following table sets forth credit quality indicators of loans by class as of March 31, 2018 and 2019:
As of March 31, 2018: NormalCloseWatch
Likely to becomeBankrupt or
Legally/VirtuallyBankrupt Total(1)
(in billions)
CommercialDomestic . . . . . . . . . . . . . . . . . . . . . . . . . . ¥49,050.3 ¥1,691.0 ¥271.4 ¥51,012.7
Manufacturing . . . . . . . . . . . . . . . . . . 10,215.5 596.7 57.7 10,869.9Construction . . . . . . . . . . . . . . . . . . . . 727.9 43.7 9.1 780.7Real estate . . . . . . . . . . . . . . . . . . . . . 11,379.3 279.9 32.7 11,691.9Services . . . . . . . . . . . . . . . . . . . . . . . 2,467.5 175.8 24.1 2,667.4Wholesale and retail . . . . . . . . . . . . . . 7,518.4 374.7 77.9 7,971.0Banks and other financial
institutions . . . . . . . . . . . . . . . . . . . 4,800.3 10.9 1.1 4,812.3Communication and information
services . . . . . . . . . . . . . . . . . . . . . . 1,491.1 48.2 11.9 1,551.2Other industries . . . . . . . . . . . . . . . . . 8,780.5 120.5 37.0 8,938.0Consumer . . . . . . . . . . . . . . . . . . . . . . 1,669.8 40.6 19.9 1,730.3
Foreign-excluding MUFG AmericasHoldings and Krungsri . . . . . . . . . . . . . . 36,049.1 569.1 108.3 36,726.5
Loans acquired with deteriorated creditquality . . . . . . . . . . . . . . . . . . . . . . . . . . . 12.0 11.7 3.6 27.3
Total . . . . . . . . . . . . . . . . . . . . . . . . . . ¥85,111.4 ¥2,271.8 ¥383.3 ¥87,766.5
Accrual Nonaccrual Total(1)
(in billions)
Residential . . . . . . . . . . . . . . . . . . . . . . . . . . . . . . . . . . . . . . . . . . . . . . . . . . . ¥14,012.9 ¥67.3 ¥14,080.2Card . . . . . . . . . . . . . . . . . . . . . . . . . . . . . . . . . . . . . . . . . . . . . . . . . . . . . . . . ¥ 528.1 ¥61.7 ¥ 589.8
Credit Quality Based onthe Number of Delinquencies
Credit Quality Based onInternal Credit Ratings
Total(1)(2)Accrual Nonaccrual PassSpecial
Mention Classified
(in billions)
MUFG Americas Holdings . . . . . . . . . . ¥4,360.5 ¥14.2 ¥4,509.1 ¥59.9 ¥116.8 ¥9,060.5
NormalSpecial
MentionSubstandard or Doubtful
or Doubtful of Loss Total(1)
(in billions)
Krungsri . . . . . . . . . . . . . . . . . . . . . . . . . . . . . . . . . . . . . ¥5,284.1 ¥198.5 ¥123.1 ¥5,605.7
108

As of March 31, 2019: NormalCloseWatch
Likely to becomeBankrupt or
Legally/VirtuallyBankrupt Total(1)
(in billions)
CommercialDomestic . . . . . . . . . . . . . . . . . . . . . . . . . . ¥49,392.0 ¥1,242.1 ¥217.7 ¥50,851.8
Manufacturing . . . . . . . . . . . . . . . . . . 10,819.6 279.9 47.9 11,147.4Construction . . . . . . . . . . . . . . . . . . . . 672.1 37.2 7.9 717.2Real estate . . . . . . . . . . . . . . . . . . . . . 11,403.6 222.8 22.5 11,648.9Services . . . . . . . . . . . . . . . . . . . . . . . 2,436.4 174.8 20.0 2,631.2Wholesale and retail . . . . . . . . . . . . . . 7,240.8 329.3 68.7 7,638.8Banks and other financial
institutions . . . . . . . . . . . . . . . . . . . 5,199.9 7.6 0.9 5,208.4Communication and information
services . . . . . . . . . . . . . . . . . . . . . . 1,465.7 34.5 10.2 1,510.4Other industries . . . . . . . . . . . . . . . . . 8,610.5 119.6 24.9 8,755.0Consumer . . . . . . . . . . . . . . . . . . . . . . 1,543.4 36.4 14.7 1,594.5
Foreign-excluding MUFG AmericasHoldings and Krungsri . . . . . . . . . . . . . . 35,418.2 562.9 112.1 36,093.2
Loans acquired with deteriorated creditquality . . . . . . . . . . . . . . . . . . . . . . . . . . . 11.7 10.8 3.8 26.3
Total . . . . . . . . . . . . . . . . . . . . . . . . . . ¥84,821.9 ¥1,815.8 ¥333.6 ¥86,971.3
Accrual Nonaccrual Total(1)
(in billions)
Residential . . . . . . . . . . . . . . . . . . . . . . . . . . . . . . . . . . . . . . . . . . . . . . . . . . . ¥13,661.8 ¥66.3 ¥13,728.1Card . . . . . . . . . . . . . . . . . . . . . . . . . . . . . . . . . . . . . . . . . . . . . . . . . . . . . . . . ¥ 516.9 ¥61.6 ¥ 578.5
Credit Quality Based onthe Number of Delinquencies
Credit Quality Based onInternal Credit Ratings
Total(1)(2)Accrual Nonaccrual PassSpecial
Mention Classified
(in billions)
MUFG Americas Holdings . . . . . . . . . . ¥4,752.1 ¥15.5 ¥4,699.7 ¥51.9 ¥88.4 ¥9,607.6
NormalSpecial
MentionSubstandard or Doubtful
or Doubtful of Loss Total(1)
(in billions)
Krungsri . . . . . . . . . . . . . . . . . . . . . . . . . . . . . . . . . . . . . ¥5,682.2 ¥199.1 ¥129.2 ¥6,010.5
Notes:(1) Total loans in the above table do not include loans held for sale, and represent balances without adjustments in relation to unearned
income, unamortized premiums and deferred loan fees.(2) Total loans of MUFG Americas Holdings do not include FDIC covered loans and small business loans which are not individually rated
totaling ¥0.9 billion and ¥0.7 billion as of March 31, 2018 and 2019, respectively. We will be reimbursed for a substantial portion of anyfuture losses on FDIC covered loans under the terms of the FDIC loss share agreements.
We classify loans into risk categories based on relevant information about the ability of borrowers to servicetheir debt, including, but not limited to, historical and current financial information, historical and currentpayment experience, credit documentation, public and non-public information about borrowers and currenteconomic trends as deemed appropriate to each segment.
The primary credit quality indicator for loans within all classes of the Commercial segment is the internalcredit rating assigned to each borrower based on our internal borrower ratings of 1 through 15 with the rating of
109

1 assigned to a borrower with the highest quality of credit. When assigning a credit rating to a borrower, weevaluate the borrower’s expected debt-service capability based on various information, including financial andoperating information of the borrower as well as information on the industry in which the borrower operates, andthe borrower’s business profile, management and compliance system. In evaluating a borrower’s debt-servicecapability, we also conduct an assessment of the level of earnings and an analysis of the borrower’s net worth.Based on the internal borrower rating, loans within the Commercial segment are categorized as Normal (internalborrower ratings of 1 through 9), Close Watch (internal borrower ratings of 10 through 12), and Likely tobecome Bankrupt or Legally/Virtually Bankrupt (internal borrower ratings of 13 through 15).
Loans to borrowers categorized as Normal represent those that are not deemed to have collectability issues.Loans to borrowers categorized as Close Watch represent those that require close monitoring as the borrower hasbegun to exhibit elements of potential concern with respect to its business performance and financial condition,the borrower has begun to exhibit elements of serious concern with respect to its business performance andfinancial condition, including business problems requiring long-term solutions, or the borrower’s loans are TDRsor loans contractually past due 90 days or more for special reasons. Loans to borrowers categorized as Likely tobecome Bankrupt or Legally/Virtually Bankrupt represent those that have a higher probability of default thanthose categorized as Close Watch due to serious debt repayment problems with poor progress in achievingrestructuring plans, the borrower being considered virtually bankrupt with no prospects for an improvement inbusiness operations, or the borrower being legally bankrupt with no prospects for continued business operationsbecause of non-payment, suspension of business, voluntary liquidation or filing for legal liquidation.
For more information on our credit and borrower ratings, see “Item 11. Quantitative and QualitativeDisclosures about Credit, Market and Other Risk—Credit Risk Management.”
The accrual status is a primary credit quality indicator for loans within the Residential segment and the Cardsegment as well as consumer loans within the MUFG Americas Holdings segment. The accrual status of theseloans is determined based on the number of delinquent payments.
Commercial loans within the MUFG Americas Holdings segment are categorized as either pass or criticizedbased on the internal credit rating assigned to each borrower. Criticized credits are those that are internally riskgraded as Special Mention, Substandard or Doubtful. Special Mention credits are potentially weak, as theborrower has begun to exhibit deteriorating trends, which, if not corrected, may jeopardize repayment of the loanand result in a further downgrade. Classified credits are those that are internally risk graded as Substandard orDoubtful. Substandard credits have well-defined weaknesses, which, if not corrected, could jeopardize the fullsatisfaction of the debt. A credit classified as Doubtful has critical weaknesses that make full collectionimprobable on the basis of currently existing facts and conditions.
Loans within the Krungsri segment are categorized as Normal, Special Mention, and Substandard, which isfurther divided into Substandard, Doubtful and Doubtful of Loss, primarily based on their delinquency status.Loans categorized as Special Mention generally represent those that have overdue principal repayments orinterest payments for a cumulative period exceeding one month commencing from the contractual due date.Loans categorized as Substandard, Doubtful or Doubtful of Loss generally represent those that have overdueprincipal repayments or interest payments for a cumulative period exceeding three months, commencing from thecontractual due date.
For the Commercial, Residential and Card segments, credit quality indicators are based on information as ofMarch 31. For the MUFG Americas Holdings and Krungsri segments, credit quality indicators are generallybased on information as of December 31.
110

Allowance for credit losses
The following table shows a summary of the changes in the allowance for credit losses by portfolio segmentfor the fiscal years ended March 31, 2018 and 2019:
Fiscal year ended March 31, 2018: Commercial Residential Card
MUFGAmericasHoldings Krungsri Total
(in billions)
Allowance for credit losses:Balance at beginning of fiscal year . . . . . . . . . . ¥ 900.7 ¥ 67.3 ¥30.2 ¥73.7 ¥110.3 ¥1,182.2Provision for (reversal of) credit losses . . . . . . . (297.4) (22.3) 23.4 (9.3) 64.8 (240.8)Charge-offs . . . . . . . . . . . . . . . . . . . . . . . . . . . . 134.8 3.8 22.7 14.7 56.1 232.1Recoveries . . . . . . . . . . . . . . . . . . . . . . . . . . . . . 25.0 1.3 1.2 6.1 17.5 51.1
Net charge-offs . . . . . . . . . . . . . . . . . . . . . . . . . 109.8 2.5 21.5 8.6 38.6 181.0Others(1) . . . . . . . . . . . . . . . . . . . . . . . . . . . . . . . (2.4) — — (2.0) 8.1 3.7
Balance at end of fiscal year . . . . . . . . . . . . . . . ¥ 491.1 ¥ 42.5 ¥32.1 ¥53.8 ¥144.6 ¥ 764.1
Fiscal year ended March 31, 2019: Commercial Residential Card
MUFGAmericasHoldings Krungsri Total
(in billions)
Allowance for credit losses:Balance at beginning of fiscal year . . . . . . . . . . ¥ 491.1 ¥ 42.5 ¥32.1 ¥53.8 ¥144.6 ¥ 764.1Provision for (reversal of) credit losses . . . . . . . (43.9) (4.5) 23.9 9.3 49.5 34.3Charge-offs . . . . . . . . . . . . . . . . . . . . . . . . . . . . 76.6 0.3 24.3 13.2 59.6 174.0Recoveries . . . . . . . . . . . . . . . . . . . . . . . . . . . . . 17.5 0.9 0.9 3.7 21.1 44.1
Net charge-offs . . . . . . . . . . . . . . . . . . . . . . . . . 59.1 (0.6) 23.4 9.5 38.5 129.9Others(1) . . . . . . . . . . . . . . . . . . . . . . . . . . . . . . . 1.5 — — (1.0) (10.8) (10.3)
Balance at end of fiscal year . . . . . . . . . . . . . . . ¥ 389.6 ¥ 38.6 ¥32.6 ¥52.6 ¥144.8 ¥ 658.2
Note:(1) Others are principally comprised of gains or losses from foreign exchange translation.
111
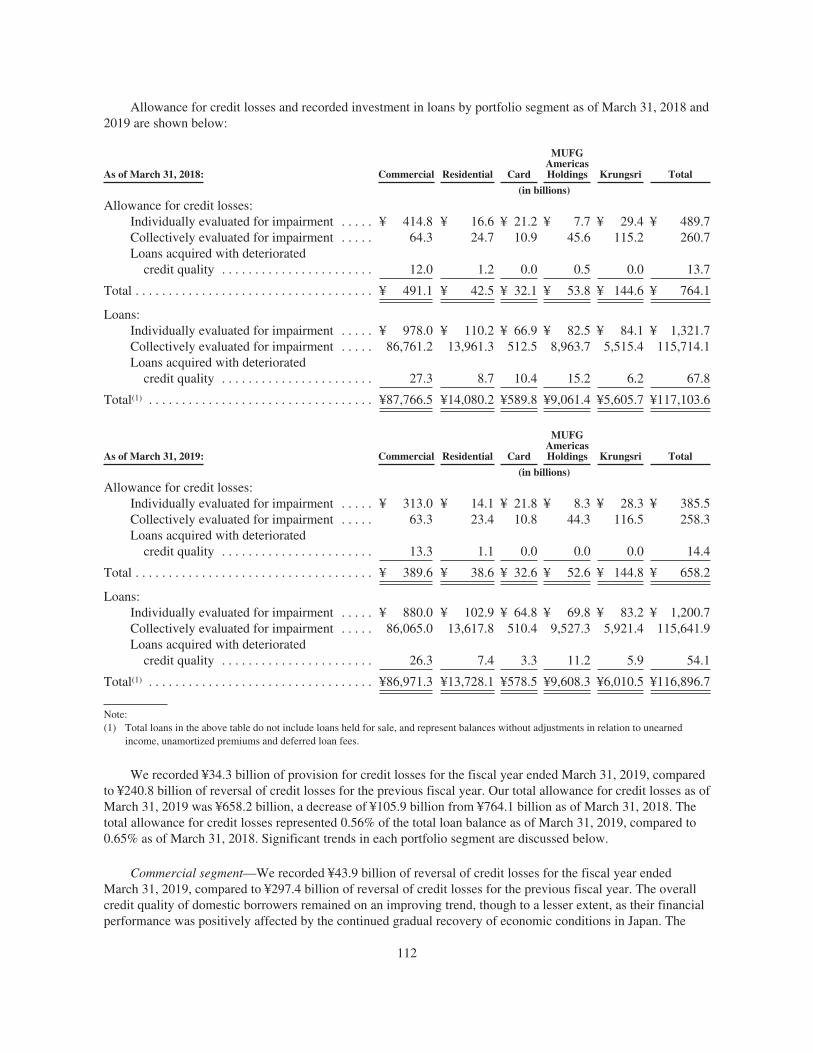
Allowance for credit losses and recorded investment in loans by portfolio segment as of March 31, 2018 and2019 are shown below:
As of March 31, 2018: Commercial Residential Card
MUFGAmericasHoldings Krungsri Total
(in billions)
Allowance for credit losses:Individually evaluated for impairment . . . . . ¥ 414.8 ¥ 16.6 ¥ 21.2 ¥ 7.7 ¥ 29.4 ¥ 489.7Collectively evaluated for impairment . . . . . 64.3 24.7 10.9 45.6 115.2 260.7Loans acquired with deteriorated
credit quality . . . . . . . . . . . . . . . . . . . . . . . 12.0 1.2 0.0 0.5 0.0 13.7
Total . . . . . . . . . . . . . . . . . . . . . . . . . . . . . . . . . . . . ¥ 491.1 ¥ 42.5 ¥ 32.1 ¥ 53.8 ¥ 144.6 ¥ 764.1
Loans:Individually evaluated for impairment . . . . . ¥ 978.0 ¥ 110.2 ¥ 66.9 ¥ 82.5 ¥ 84.1 ¥ 1,321.7Collectively evaluated for impairment . . . . . 86,761.2 13,961.3 512.5 8,963.7 5,515.4 115,714.1Loans acquired with deteriorated
credit quality . . . . . . . . . . . . . . . . . . . . . . . 27.3 8.7 10.4 15.2 6.2 67.8
Total(1) . . . . . . . . . . . . . . . . . . . . . . . . . . . . . . . . . . ¥87,766.5 ¥14,080.2 ¥589.8 ¥9,061.4 ¥5,605.7 ¥117,103.6
As of March 31, 2019: Commercial Residential Card
MUFGAmericasHoldings Krungsri Total
(in billions)
Allowance for credit losses:Individually evaluated for impairment . . . . . ¥ 313.0 ¥ 14.1 ¥ 21.8 ¥ 8.3 ¥ 28.3 ¥ 385.5Collectively evaluated for impairment . . . . . 63.3 23.4 10.8 44.3 116.5 258.3Loans acquired with deteriorated
credit quality . . . . . . . . . . . . . . . . . . . . . . . 13.3 1.1 0.0 0.0 0.0 14.4
Total . . . . . . . . . . . . . . . . . . . . . . . . . . . . . . . . . . . . ¥ 389.6 ¥ 38.6 ¥ 32.6 ¥ 52.6 ¥ 144.8 ¥ 658.2
Loans:Individually evaluated for impairment . . . . . ¥ 880.0 ¥ 102.9 ¥ 64.8 ¥ 69.8 ¥ 83.2 ¥ 1,200.7Collectively evaluated for impairment . . . . . 86,065.0 13,617.8 510.4 9,527.3 5,921.4 115,641.9Loans acquired with deteriorated
credit quality . . . . . . . . . . . . . . . . . . . . . . . 26.3 7.4 3.3 11.2 5.9 54.1
Total(1) . . . . . . . . . . . . . . . . . . . . . . . . . . . . . . . . . . ¥86,971.3 ¥13,728.1 ¥578.5 ¥9,608.3 ¥6,010.5 ¥116,896.7
Note:(1) Total loans in the above table do not include loans held for sale, and represent balances without adjustments in relation to unearned
income, unamortized premiums and deferred loan fees.
We recorded ¥34.3 billion of provision for credit losses for the fiscal year ended March 31, 2019, comparedto ¥240.8 billion of reversal of credit losses for the previous fiscal year. Our total allowance for credit losses as ofMarch 31, 2019 was ¥658.2 billion, a decrease of ¥105.9 billion from ¥764.1 billion as of March 31, 2018. Thetotal allowance for credit losses represented 0.56% of the total loan balance as of March 31, 2019, compared to0.65% as of March 31, 2018. Significant trends in each portfolio segment are discussed below.
Commercial segment—We recorded ¥43.9 billion of reversal of credit losses for the fiscal year endedMarch 31, 2019, compared to ¥297.4 billion of reversal of credit losses for the previous fiscal year. The overallcredit quality of domestic borrowers remained on an improving trend, though to a lesser extent, as their financialperformance was positively affected by the continued gradual recovery of economic conditions in Japan. The
112
reversal for the fiscal year ended March 31, 2019 reflected an improvement in the financial condition and theprojected cash flows of a large borrower in the domestic electronics manufacturing industry. In addition, thefinancial performance of foreign borrowers particularly in the oil and gas sector that previously experienceddeteriorated repayment ability improved as oil and other commodities prices were stabilizing. The financialperformance of a broader number of small and medium-sized borrowers in the domestic manufacturing industryalso improved due to the continued gradual recovery of economic conditions in Japan. As a result, the ratio ofloans classified as Close Watch to total loans decreased to 2.09% as of March 31, 2019 from 2.59% as ofMarch 31, 2018, and the ratio of loans classified as Likely to become Bankrupt and Legally/Virtually Bankrupt tototal loans decreased to 0.38% as of March 31, 2019 from 0.44% as of March 31, 2018. The total allowance forcredit losses for this segment represented 0.45% of the segment’s total loan balance as of Mach 31, 2019,compared to 0.56% as of March 31, 2018.
Residential segment—We recorded ¥4.5 billion of reversal of credit losses for the fiscal year endedMarch 31, 2019, compared to ¥22.3 billion of reversal of credit losses for the previous fiscal year. The stabledomestic corporate environment in recent periods has generally contributed to higher income for residentialborrowers, resulting in an overall improvement, though to a lesser extent compared to the previous fiscal year, inthe credit quality of this segment. The ratio of loans classified as Nonaccrual to total loans in the segment was0.48% as of March 31, 2019, unchanged from March 31, 2018. The ratio of total allowance for credit losses tothe total loan balance in this segment decreased to 0.28% as of March 31, 2019 from 0.30% as of March 31,2018.
Card segment—We recorded ¥23.9 billion of provision for credit losses for the fiscal year ended March 31,2019, compared to ¥23.4 billion of the provision for credit losses for the previous fiscal year. The increase inprovision for credit losses primarily reflected an increase in default borrowers who filed for bankruptcy as part oftheir debt workout efforts. Although the stable corporate environment in recent periods positively affected someindividual borrowers, the positive trends did not meaningfully affect our consumer loan borrowers and, in somecases, the corporate efficiencies negatively affected some of our consumer loan borrowers. As a result, the ratioof loans classified as Nonaccrual to the total loans in the segment increased to 10.65% as of March 31, 2019,from 10.46% as of March 31, 2018. The ratio of total allowance for credit losses to the total loan balance in thissegment increased to 5.63% as of March 31, 2019 from 5.45% as of March 31, 2018.
MUFG Americas Holdings segment—We recorded ¥9.3 billion of provision for credit losses for the fiscalyear ended March 31, 2019, compared to ¥9.3 billion of reversal of credit losses for the previous fiscal year. Theprovision for credit losses mainly reflected the bankruptcy filing of a large borrower in the electric powerindustry whose financial condition deteriorated as a result of becoming liable for damages caused by wild fires.The reversal of credit losses for the previous fiscal year reflected the improved credit quality of the oil and gasloan portfolio. As the total loan balance increased, the ratio of loans classified as Special Mention or below andNonaccrual to total loans in the segment decreased to 1.62% as of March 31, 2019 from 2.11% as of March 31,2018. The ratio of total allowance for credit losses to the total loan balance in this segment decreased to 0.55% asof March 31, 2019 from 0.59% as of March 31, 2018.
Krungsri segment—We recorded ¥49.5 billion of provision for credit losses for the fiscal year endedMarch 31, 2019, compared to ¥64.8 billion of provision for credit losses for the previous fiscal year. The smallerprovision for credit losses mainly reflected the improved credit quality of the small and medium-sized enterpriseloan portfolio where gradually stabilizing economic conditions in Thailand resulted in fewer borrowersexperiencing deterioration in their financial performance. The ratio of loans classified as Special Mention orbelow to total loans in the segment decreased to 5.46% as of March 31, 2019 from 5.74% as of March 31, 2018.The ratio of total allowance for credit losses to the total loan balance in this segment decreased to 2.41% as ofMarch 31, 2019 from 2.58% as of March 31, 2018.
When there is an improvement in asset quality, reversal of credit losses is recorded in our consolidatedstatements of income to maintain the allowance for credit losses at a level management deems appropriate.
113

Although we reversed allowance for credit losses in recent periods, we have historically provided for creditlosses, and in future periods we may need to recognize a provision for credit losses. See “Item 3.D. KeyInformation—Risk Factors—Risks Related to Our Business—We may suffer additional credit-related losses inthe future if our borrowers are unable to repay their loans as expected or if the measures we take in reaction to, orin anticipation of, our borrowers’ deteriorating repayment abilities prove inappropriate or insufficient.”
Allowance policy
We maintain an allowance for credit losses to absorb probable losses inherent in the loan portfolio. We havedivided our allowance for credit losses into five portfolio segments—Commercial, Residential, Card, MUFGAmericas Holdings and Krungsri.
For all portfolio segments, key elements relating to the policies and discipline used in determining theallowance for credit losses are our credit classification and related borrower categorization process, which areclosely linked to the risk grading standards set by the Japanese regulatory authorities for asset evaluation andassessment, and are used as a basis for establishing the allowance for credit losses and charge-offs. Thecategorization is based on conditions that may affect the ability of borrowers to service their debt, such as currentfinancial condition and results of operations, historical payment experience, credit documentation, other publicinformation and current trends.
For more information on our credit and borrower ratings, see “Item 11. Quantitative and QualitativeDisclosures about Credit, Market and Other Risk—Credit Risk Management.”
For the Commercial, MUFG Americas Holdings and Krungsri segments, our allowance for credit lossesprimarily consists of allocated allowances. The allocated allowances consist of (1) an allowance for loansindividually evaluated for impairment, (2) an allowance for large groups of smaller-balance homogeneous loans,and (3) a formula allowance. The allocated allowance within the Commercial segment also includes an allowancefor country risk exposure. The allowance for credit losses within the MUFG Americas Holdings segment alsoincludes an unallocated allowance which captures losses that are attributable to economic events in variousindustry or geographic sectors whose impact on our loan portfolios in these segments have occurred but have yetto be recognized in the allocated allowance. For the Residential and Card segments, the loans are smaller-balancehomogeneous loans that are pooled by the risk ratings based on the number of delinquencies.
For more information on our methodologies used to estimate the allowance for each portfolio segment, see“Summary of Significant Accounting Policies” in Note 1 to our consolidated financial statements includedelsewhere in this Annual Report and “—Critical Accounting Estimates—Allowance for Credit Losses” above.
During the fiscal year ended March 31, 2019, we did not make any significant changes to the methodologiesand policies used to determine our allowance for credit losses.
Allowance for off-balance sheet credit instruments
We maintain an allowance for credit losses on off-balance sheet credit instruments, including commitmentsto extend credit, guarantees, standby letters of credit and other financial instruments. The allowance is includedin other liabilities. We have adopted for such instruments the same methodology as that which is used indetermining the allowance for credit losses on loans.
The allowance for credit losses on off-balance sheet credit instruments was ¥119.3 billion as of March 31,2019, an increase of ¥37.6 billion from ¥81.7 billion as of March 31, 2018. This increase was primarily because alarge domestic borrower in the services industry, in whose favor we have provided guarantees in substantialamounts, began to experience financial difficulty due to a delay of a plant construction project in the UnitedStates.
114

Nonaccrual loans and troubled debt restructurings
We consider a loan to be a nonaccrual loan when substantial doubt exists as to the full and timely paymentof interest on, or repayment of, the principal of the loan, which is a borrower condition that generallycorresponds to borrowers in categories 13 and below in our internal rating system (which corresponds to “Likelyto become Bankrupt,” “Virtually Bankrupt” and “Bankrupt or de facto Bankrupt” status under Japanese bankingregulations). Substantially all nonaccrual loans are also impaired loans. Loans are also placed in nonaccrualstatus when principal or interest is contractually past due one month or more with respect to loans within allclasses of the Commercial segment, three months or more with respect to loans within the Card, MUFGAmericas Holdings and Krungsri segments, and six months or more with respect to loans within the Residentialsegment.
We modify certain loans in conjunction with our loss-mitigation activities. Through these modifications,concessions are granted to a borrower who is experiencing financial difficulty, generally in order to minimizeeconomic loss, to avoid foreclosure or repossession of collateral, and to ultimately maximize payments receivedfrom the borrower. The concessions granted vary by portfolio segment, by program, and by borrower-specificcharacteristics, and may include interest rate reductions, term extensions, payment deferrals, and partial principalforgiveness. Loan modifications that represent concessions made to borrowers who are experiencing financialdifficulties are identified as troubled debt restructurings, or TDRs. TDRs are also considered impaired loans, andan allowance for credit losses is separately established for each loan.
Generally, accruing loans that are modified in a TDR remain as accruing loans subsequent to themodification, and nonaccrual loans remain as nonaccrual. However, if a nonaccrual loan has been modified as aTDR and the borrower is not delinquent under the modified terms, and demonstrates that its financial conditionhas improved, we may reclassify the loan to accrual status. This determination is generally performed at leastonce a year through a detailed internal credit rating review process. Although we have not defined any minimumperiod to qualify for an upgrade, it is not common for a borrower to be able to demonstrate that its businessproblems have been resolved or can soon be resolved within a short period of time following a restructuring. Ifthe borrower is upgraded to category 12 or higher in our internal rating system (which corresponds to “Normal”and “Close Watch” status under the Japanese banking regulations), a TDR would be reclassified to accrual status.Once a nonaccrual loan is deemed to be a TDR, we will continue to designate the loan as a TDR even if the loanis reclassified to accrual status.
A loan that has been modified into a TDR is considered to be impaired until it matures, is repaid, or isotherwise liquidated, regardless of whether the borrower performs under the modified terms.
For more information on our credit and borrower ratings, see “Item 11. Quantitative and QualitativeDisclosures about Credit, Market and Other Risk—Credit Risk Management.”
For more information on our TDRs, see Note 4 to our consolidated financial statements included elsewherein this Annual Report.
115
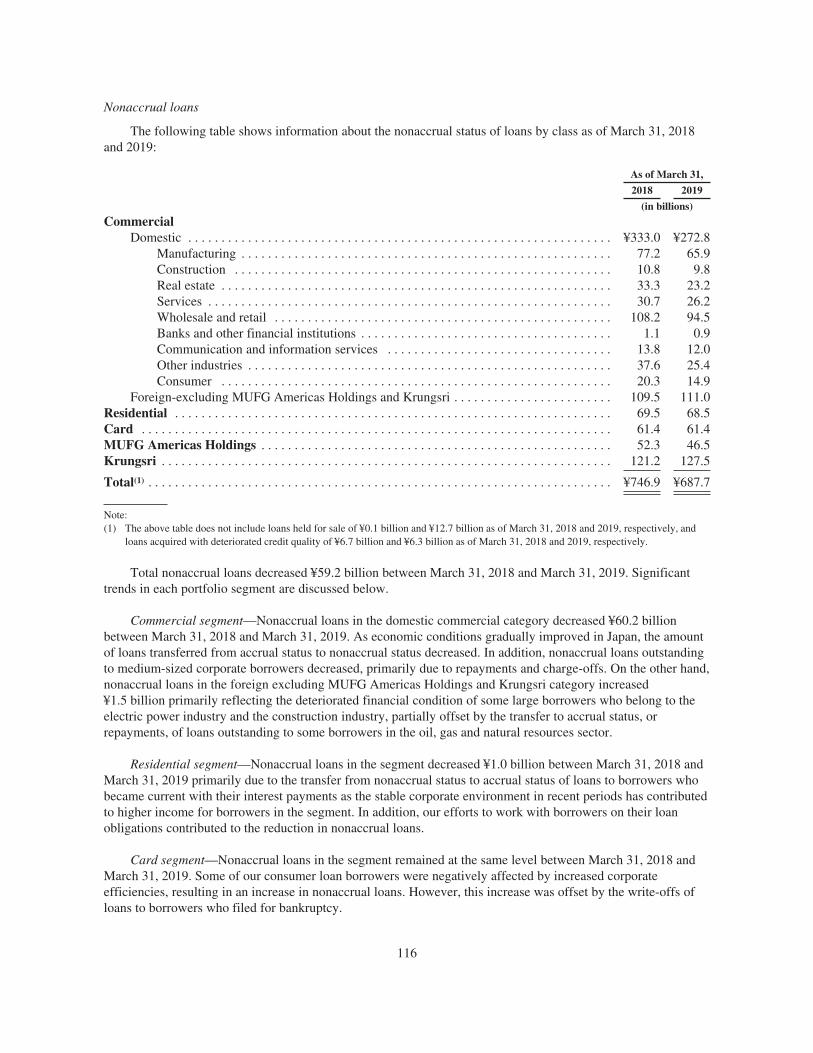
Nonaccrual loans
The following table shows information about the nonaccrual status of loans by class as of March 31, 2018and 2019:
As of March 31,
2018 2019
(in billions)
CommercialDomestic . . . . . . . . . . . . . . . . . . . . . . . . . . . . . . . . . . . . . . . . . . . . . . . . . . . . . . . . . . . . . . . . ¥333.0 ¥272.8
Manufacturing . . . . . . . . . . . . . . . . . . . . . . . . . . . . . . . . . . . . . . . . . . . . . . . . . . . . . . . . 77.2 65.9Construction . . . . . . . . . . . . . . . . . . . . . . . . . . . . . . . . . . . . . . . . . . . . . . . . . . . . . . . . . 10.8 9.8Real estate . . . . . . . . . . . . . . . . . . . . . . . . . . . . . . . . . . . . . . . . . . . . . . . . . . . . . . . . . . . 33.3 23.2Services . . . . . . . . . . . . . . . . . . . . . . . . . . . . . . . . . . . . . . . . . . . . . . . . . . . . . . . . . . . . . 30.7 26.2Wholesale and retail . . . . . . . . . . . . . . . . . . . . . . . . . . . . . . . . . . . . . . . . . . . . . . . . . . . 108.2 94.5Banks and other financial institutions . . . . . . . . . . . . . . . . . . . . . . . . . . . . . . . . . . . . . . 1.1 0.9Communication and information services . . . . . . . . . . . . . . . . . . . . . . . . . . . . . . . . . . 13.8 12.0Other industries . . . . . . . . . . . . . . . . . . . . . . . . . . . . . . . . . . . . . . . . . . . . . . . . . . . . . . . 37.6 25.4Consumer . . . . . . . . . . . . . . . . . . . . . . . . . . . . . . . . . . . . . . . . . . . . . . . . . . . . . . . . . . . 20.3 14.9
Foreign-excluding MUFG Americas Holdings and Krungsri . . . . . . . . . . . . . . . . . . . . . . . . 109.5 111.0Residential . . . . . . . . . . . . . . . . . . . . . . . . . . . . . . . . . . . . . . . . . . . . . . . . . . . . . . . . . . . . . . . . . . 69.5 68.5Card . . . . . . . . . . . . . . . . . . . . . . . . . . . . . . . . . . . . . . . . . . . . . . . . . . . . . . . . . . . . . . . . . . . . . . . 61.4 61.4MUFG Americas Holdings . . . . . . . . . . . . . . . . . . . . . . . . . . . . . . . . . . . . . . . . . . . . . . . . . . . . . 52.3 46.5Krungsri . . . . . . . . . . . . . . . . . . . . . . . . . . . . . . . . . . . . . . . . . . . . . . . . . . . . . . . . . . . . . . . . . . . . 121.2 127.5
Total(1) . . . . . . . . . . . . . . . . . . . . . . . . . . . . . . . . . . . . . . . . . . . . . . . . . . . . . . . . . . . . . . . . . . . . . . ¥746.9 ¥687.7
Note:(1) The above table does not include loans held for sale of ¥0.1 billion and ¥12.7 billion as of March 31, 2018 and 2019, respectively, and
loans acquired with deteriorated credit quality of ¥6.7 billion and ¥6.3 billion as of March 31, 2018 and 2019, respectively.
Total nonaccrual loans decreased ¥59.2 billion between March 31, 2018 and March 31, 2019. Significanttrends in each portfolio segment are discussed below.
Commercial segment—Nonaccrual loans in the domestic commercial category decreased ¥60.2 billionbetween March 31, 2018 and March 31, 2019. As economic conditions gradually improved in Japan, the amountof loans transferred from accrual status to nonaccrual status decreased. In addition, nonaccrual loans outstandingto medium-sized corporate borrowers decreased, primarily due to repayments and charge-offs. On the other hand,nonaccrual loans in the foreign excluding MUFG Americas Holdings and Krungsri category increased¥1.5 billion primarily reflecting the deteriorated financial condition of some large borrowers who belong to theelectric power industry and the construction industry, partially offset by the transfer to accrual status, orrepayments, of loans outstanding to some borrowers in the oil, gas and natural resources sector.
Residential segment—Nonaccrual loans in the segment decreased ¥1.0 billion between March 31, 2018 andMarch 31, 2019 primarily due to the transfer from nonaccrual status to accrual status of loans to borrowers whobecame current with their interest payments as the stable corporate environment in recent periods has contributedto higher income for borrowers in the segment. In addition, our efforts to work with borrowers on their loanobligations contributed to the reduction in nonaccrual loans.
Card segment—Nonaccrual loans in the segment remained at the same level between March 31, 2018 andMarch 31, 2019. Some of our consumer loan borrowers were negatively affected by increased corporateefficiencies, resulting in an increase in nonaccrual loans. However, this increase was offset by the write-offs ofloans to borrowers who filed for bankruptcy.
116

MUFG Americas Holdings segment—Nonaccrual loans in the segment decreased ¥5.8 billion betweenMarch 31, 2018 and March 31, 2019. This was mainly due to repayments of loans outstanding to, and theimproved repayment ability of, some borrowers in the oil and gas sector that were positively affected by stableoil and gas prices.
Krungsri segment—Nonaccrual loans in the segment increased ¥6.3 billion between March 31, 2018 andMarch 31, 2019. The increase mainly reflected the expansion of the automobile loan portfolio despite theimproved credit quality of the small and medium-sized enterprise loan portfolio where gradually stabilizingeconomic conditions in Thailand resulted in fewer borrowers experiencing deterioration in their financialperformance.
Troubled debt restructurings
The following table shows information about outstanding recorded investment balances of TDRs by class asof March 31, 2018 and 2019:
As of March 31,
2018 2019
(in billions)
Commercial(1)
Domestic . . . . . . . . . . . . . . . . . . . . . . . . . . . . . . . . . . . . . . . . . . . . . . . . . . . . . . . . . . . . . . . . ¥482.6 ¥445.4Manufacturing . . . . . . . . . . . . . . . . . . . . . . . . . . . . . . . . . . . . . . . . . . . . . . . . . . . . . . . . 320.7 311.9Construction . . . . . . . . . . . . . . . . . . . . . . . . . . . . . . . . . . . . . . . . . . . . . . . . . . . . . . . . . 7.4 4.6Real estate . . . . . . . . . . . . . . . . . . . . . . . . . . . . . . . . . . . . . . . . . . . . . . . . . . . . . . . . . . . 33.3 27.7Services . . . . . . . . . . . . . . . . . . . . . . . . . . . . . . . . . . . . . . . . . . . . . . . . . . . . . . . . . . . . . 24.0 17.1Wholesale and retail . . . . . . . . . . . . . . . . . . . . . . . . . . . . . . . . . . . . . . . . . . . . . . . . . . . 70.1 69.4Banks and other financial institutions . . . . . . . . . . . . . . . . . . . . . . . . . . . . . . . . . . . . . . 0.0 0.1Communication and information services . . . . . . . . . . . . . . . . . . . . . . . . . . . . . . . . . . 12.8 3.8Other industries . . . . . . . . . . . . . . . . . . . . . . . . . . . . . . . . . . . . . . . . . . . . . . . . . . . . . . . 9.7 6.4Consumer . . . . . . . . . . . . . . . . . . . . . . . . . . . . . . . . . . . . . . . . . . . . . . . . . . . . . . . . . . . 4.6 4.4
Foreign-excluding MUFG Americas Holdings and Krungsri . . . . . . . . . . . . . . . . . . . . . . . . 54.2 51.7Residential(1) . . . . . . . . . . . . . . . . . . . . . . . . . . . . . . . . . . . . . . . . . . . . . . . . . . . . . . . . . . . . . . . . . 40.7 34.4Card(2) . . . . . . . . . . . . . . . . . . . . . . . . . . . . . . . . . . . . . . . . . . . . . . . . . . . . . . . . . . . . . . . . . . . . . . 67.3 65.0MUFG Americas Holdings(2) . . . . . . . . . . . . . . . . . . . . . . . . . . . . . . . . . . . . . . . . . . . . . . . . . . . 65.4 48.1Krungsri(2) . . . . . . . . . . . . . . . . . . . . . . . . . . . . . . . . . . . . . . . . . . . . . . . . . . . . . . . . . . . . . . . . . . 54.0 63.0
Total . . . . . . . . . . . . . . . . . . . . . . . . . . . . . . . . . . . . . . . . . . . . . . . . . . . . . . . . . . . . . . . . . . . . . . . ¥764.2 ¥707.6
Notes:(1) TDRs for the Commercial and Residential segments include accruing loans with concessions granted, and do not include nonaccrual
loans with concessions granted.(2) TDRs for the Card, MUFG Americas Holdings and Krungsri segments include accrual and nonaccrual loans. Included in the outstanding
recorded investment balances as of March 31, 2018 and 2019 are nonaccrual TDRs as follows: ¥38.8 billion and ¥38.8 billion—Card;¥26.0 billion and ¥15.0 billion—MUFG Americas Holdings; and ¥24.9 billion and ¥31.1 billion—Krungsri, respectively.
Total TDRs decreased ¥56.6 billion between March 31, 2018 and March 31, 2019. Significant trends in eachportfolio segment are discussed below.
Commercial segment—TDRs in the domestic commercial category decreased ¥37.2 billion betweenMarch 31, 2018 and March 31, 2019. This was mainly due to a ¥9.0 billion decrease in the domesticcommunication and information services industry resulting from a charge-off of loans to a large borrower whosefinancial condition deteriorated. In addition, the decrease in TDRs was attributable to a ¥8.8 billion decrease inthe domestic manufacturing industry, mainly reflecting repayments pursuant to restructured loan terms by somemedium-sized corporate borrowers.
117
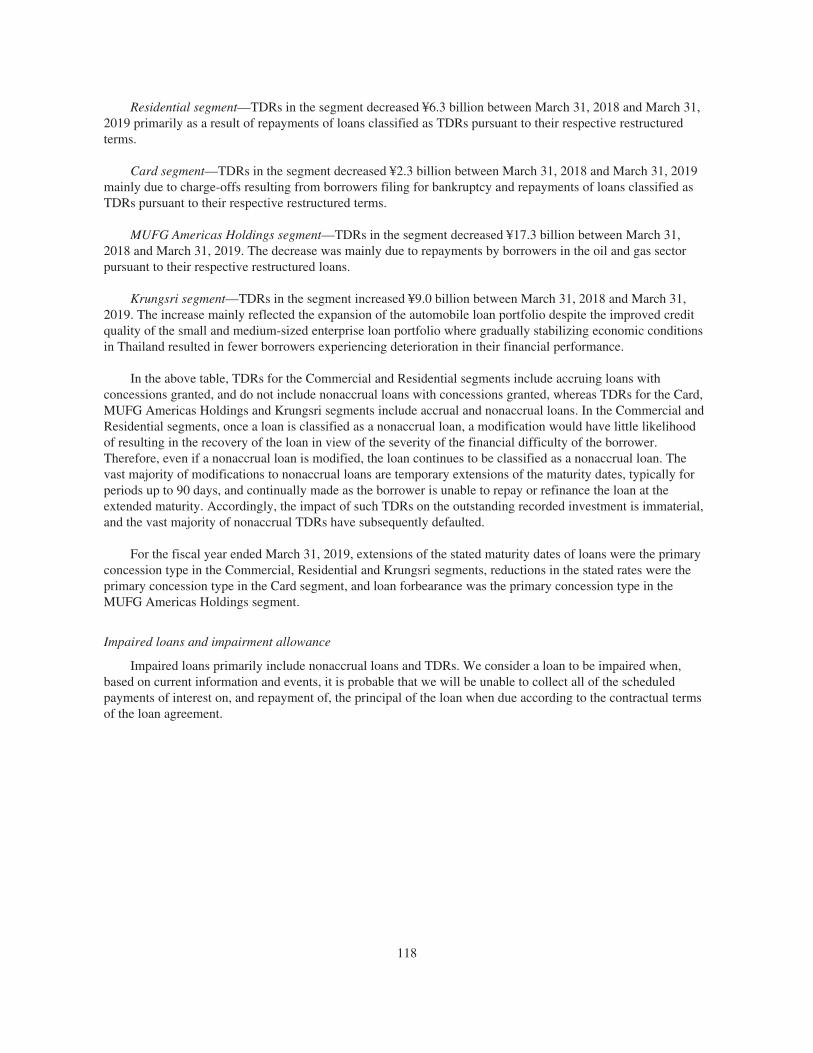
Residential segment—TDRs in the segment decreased ¥6.3 billion between March 31, 2018 and March 31,2019 primarily as a result of repayments of loans classified as TDRs pursuant to their respective restructuredterms.
Card segment—TDRs in the segment decreased ¥2.3 billion between March 31, 2018 and March 31, 2019mainly due to charge-offs resulting from borrowers filing for bankruptcy and repayments of loans classified asTDRs pursuant to their respective restructured terms.
MUFG Americas Holdings segment—TDRs in the segment decreased ¥17.3 billion between March 31,2018 and March 31, 2019. The decrease was mainly due to repayments by borrowers in the oil and gas sectorpursuant to their respective restructured loans.
Krungsri segment—TDRs in the segment increased ¥9.0 billion between March 31, 2018 and March 31,2019. The increase mainly reflected the expansion of the automobile loan portfolio despite the improved creditquality of the small and medium-sized enterprise loan portfolio where gradually stabilizing economic conditionsin Thailand resulted in fewer borrowers experiencing deterioration in their financial performance.
In the above table, TDRs for the Commercial and Residential segments include accruing loans withconcessions granted, and do not include nonaccrual loans with concessions granted, whereas TDRs for the Card,MUFG Americas Holdings and Krungsri segments include accrual and nonaccrual loans. In the Commercial andResidential segments, once a loan is classified as a nonaccrual loan, a modification would have little likelihoodof resulting in the recovery of the loan in view of the severity of the financial difficulty of the borrower.Therefore, even if a nonaccrual loan is modified, the loan continues to be classified as a nonaccrual loan. Thevast majority of modifications to nonaccrual loans are temporary extensions of the maturity dates, typically forperiods up to 90 days, and continually made as the borrower is unable to repay or refinance the loan at theextended maturity. Accordingly, the impact of such TDRs on the outstanding recorded investment is immaterial,and the vast majority of nonaccrual TDRs have subsequently defaulted.
For the fiscal year ended March 31, 2019, extensions of the stated maturity dates of loans were the primaryconcession type in the Commercial, Residential and Krungsri segments, reductions in the stated rates were theprimary concession type in the Card segment, and loan forbearance was the primary concession type in theMUFG Americas Holdings segment.
Impaired loans and impairment allowance
Impaired loans primarily include nonaccrual loans and TDRs. We consider a loan to be impaired when,based on current information and events, it is probable that we will be unable to collect all of the scheduledpayments of interest on, and repayment of, the principal of the loan when due according to the contractual termsof the loan agreement.
118

The following tables show information about impaired loans by class as of March 31, 2018 and 2019:
As of March 31, 2018
Recorded Loan Balance
UnpaidPrincipalBalance
RelatedAllowance forCredit Losses
Requiringan Allowance for
Credit Losses
Not Requiringan Allowance forCredit Losses(1) Total(2)
(in billions)
CommercialDomestic . . . . . . . . . . . . . . . . . . . . . . ¥ 626.5 ¥189.0 ¥ 815.5 ¥ 875.8 ¥331.9
Manufacturing . . . . . . . . . . . . . . 361.2 36.6 397.8 408.1 166.1Construction . . . . . . . . . . . . . . . . 10.9 7.2 18.1 18.5 7.9Real estate . . . . . . . . . . . . . . . . . 43.6 23.1 66.7 71.8 10.7Services . . . . . . . . . . . . . . . . . . . 38.1 16.6 54.7 59.3 25.9Wholesale and retail . . . . . . . . . 128.7 49.6 178.3 189.4 94.8Banks and other financial
institutions . . . . . . . . . . . . . . . 1.1 0.0 1.1 1.2 1.0Communication and information
services . . . . . . . . . . . . . . . . . 18.8 7.8 26.6 28.1 16.0Other industries . . . . . . . . . . . . . 13.0 34.3 47.3 67.5 5.4Consumer . . . . . . . . . . . . . . . . . . 11.1 13.8 24.9 31.9 4.1
Foreign-excluding MUFG AmericasHoldings and Krungsri . . . . . . . . . . 122.3 40.2 162.5 190.5 82.9
Loans acquired with deterioratedcredit quality . . . . . . . . . . . . . . . . . 7.8 — 7.8 15.5 4.3
Residential . . . . . . . . . . . . . . . . . . . . . . . . 105.1 6.2 111.3 134.7 16.9Card . . . . . . . . . . . . . . . . . . . . . . . . . . . . . 67.0 0.4 67.4 74.8 21.2MUFG Americas Holdings . . . . . . . . . . . 48.8 33.7 82.5 94.6 7.7Krungsri . . . . . . . . . . . . . . . . . . . . . . . . . . 58.5 25.6 84.1 91.0 29.4
Total(3) . . . . . . . . . . . . . . . . . . . . . . . . . . . . ¥1,036.0 ¥295.1 ¥1,331.1 ¥1,476.9 ¥494.3
119

As of March 31, 2019
Recorded Loan Balance
UnpaidPrincipalBalance
RelatedAllowance forCredit Losses
Requiringan Allowance for
Credit Losses
Not Requiringan Allowance forCredit Losses(1) Total(2)
(in billions)
CommercialDomestic . . . . . . . . . . . . . . . . . . . . . . ¥ 560.5 ¥157.5 ¥ 718.0 ¥ 759.4 ¥227.0
Manufacturing . . . . . . . . . . . . . . 349.6 28.2 377.8 384.3 92.9Construction . . . . . . . . . . . . . . . . 8.3 6.0 14.3 14.8 6.6Real estate . . . . . . . . . . . . . . . . . 20.8 30.0 50.8 55.9 5.7Services . . . . . . . . . . . . . . . . . . . 30.3 13.0 43.3 46.8 20.1Wholesale and retail . . . . . . . . . 118.3 45.6 163.9 175.7 84.5Banks and other financial
institutions . . . . . . . . . . . . . . . 1.0 0.0 1.0 1.0 0.8Communication and information
services . . . . . . . . . . . . . . . . . 8.8 6.9 15.7 16.6 6.8Other industries . . . . . . . . . . . . . 13.8 18.0 31.8 38.4 6.9Consumer . . . . . . . . . . . . . . . . . . 9.6 9.8 19.4 25.9 2.7
Foreign-excluding MUFG AmericasHoldings and Krungsri . . . . . . . . . . 127.5 34.5 162.0 183.1 86.0
Loans acquired with deterioratedcredit quality . . . . . . . . . . . . . . . . . 8.1 — 8.1 15.0 5.5
Residential . . . . . . . . . . . . . . . . . . . . . . . . 97.2 6.5 103.7 120.6 14.3Card . . . . . . . . . . . . . . . . . . . . . . . . . . . . . 64.6 0.4 65.0 72.2 21.8MUFG Americas Holdings . . . . . . . . . . . 46.6 23.2 69.8 83.3 8.3Krungsri . . . . . . . . . . . . . . . . . . . . . . . . . . 57.1 26.1 83.2 90.4 28.3
Total(3) . . . . . . . . . . . . . . . . . . . . . . . . . . . . ¥ 961.6 ¥248.2 ¥1,209.8 ¥1,324.0 ¥391.2
Notes:(1) These loans do not require an allowance for credit losses because the recorded loan balance equal, or do not exceed, the present value of
expected future cash flows discounted at the loans’ effective interest rate, loans’ observable market price, or the fair value of thecollateral if the loan is a collateral-dependent loan.
(2) Included in impaired loans as of March 31, 2018 and 2019 are accrual TDRs as follows: ¥536.8 billion and ¥ 497.1 billion—Commercial; ¥40.7 billion and ¥34.4 billion—Residential; ¥28.5 billion and ¥26.2 billion—Card; ¥39.4 billion and ¥33.1 billion—MUFG Americas Holdings; and ¥24.9 billion and ¥26.9 billion—Krungsri, respectively.
(3) In addition to impaired loans presented in the above table, there were loans held for sale that were impaired of ¥0.1 billion and¥12.7 billion as of March 31, 2018 and 2019, respectively.
120
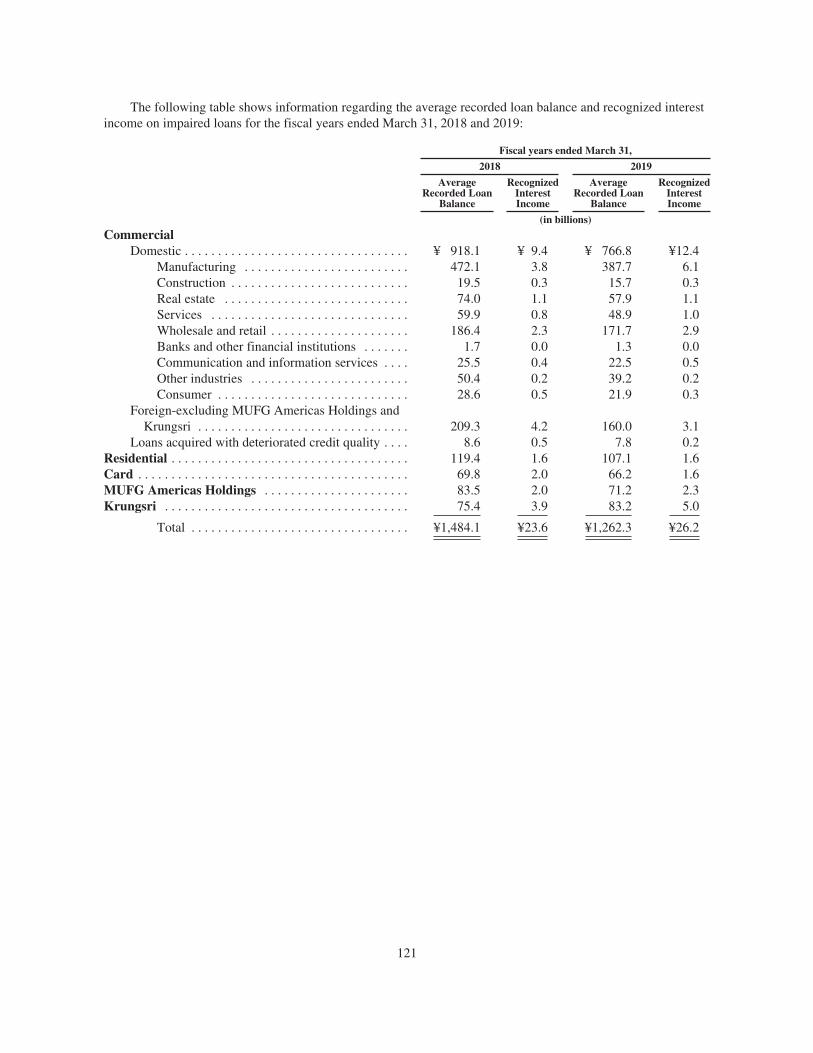
The following table shows information regarding the average recorded loan balance and recognized interestincome on impaired loans for the fiscal years ended March 31, 2018 and 2019:
Fiscal years ended March 31,
2018 2019
AverageRecorded Loan
Balance
RecognizedInterestIncome
AverageRecorded Loan
Balance
RecognizedInterestIncome
(in billions)
CommercialDomestic . . . . . . . . . . . . . . . . . . . . . . . . . . . . . . . . . . ¥ 918.1 ¥ 9.4 ¥ 766.8 ¥12.4
Manufacturing . . . . . . . . . . . . . . . . . . . . . . . . . 472.1 3.8 387.7 6.1Construction . . . . . . . . . . . . . . . . . . . . . . . . . . . 19.5 0.3 15.7 0.3Real estate . . . . . . . . . . . . . . . . . . . . . . . . . . . . 74.0 1.1 57.9 1.1Services . . . . . . . . . . . . . . . . . . . . . . . . . . . . . . 59.9 0.8 48.9 1.0Wholesale and retail . . . . . . . . . . . . . . . . . . . . . 186.4 2.3 171.7 2.9Banks and other financial institutions . . . . . . . 1.7 0.0 1.3 0.0Communication and information services . . . . 25.5 0.4 22.5 0.5Other industries . . . . . . . . . . . . . . . . . . . . . . . . 50.4 0.2 39.2 0.2Consumer . . . . . . . . . . . . . . . . . . . . . . . . . . . . . 28.6 0.5 21.9 0.3
Foreign-excluding MUFG Americas Holdings andKrungsri . . . . . . . . . . . . . . . . . . . . . . . . . . . . . . . . 209.3 4.2 160.0 3.1
Loans acquired with deteriorated credit quality . . . . 8.6 0.5 7.8 0.2Residential . . . . . . . . . . . . . . . . . . . . . . . . . . . . . . . . . . . . 119.4 1.6 107.1 1.6Card . . . . . . . . . . . . . . . . . . . . . . . . . . . . . . . . . . . . . . . . . 69.8 2.0 66.2 1.6MUFG Americas Holdings . . . . . . . . . . . . . . . . . . . . . . 83.5 2.0 71.2 2.3Krungsri . . . . . . . . . . . . . . . . . . . . . . . . . . . . . . . . . . . . . 75.4 3.9 83.2 5.0
Total . . . . . . . . . . . . . . . . . . . . . . . . . . . . . . . . . ¥1,484.1 ¥23.6 ¥1,262.3 ¥26.2
121

Past due analysis
Aging of past due loans by class as of March 31, 2018 and 2019 are shown below:
As of March 31, 2018:1-3 monthsPast Due
GreaterThan
3 monthsTotal
Past Due CurrentTotal
Loans(1)
RecordedInvestment>90 Days and
Accruing
(in billions)
CommercialDomestic . . . . . . . . . . . . . . . . . . . ¥ 13.3 ¥ 43.9 ¥ 57.2 ¥ 50,955.5 ¥ 51,012.7 ¥ 6.4
Manufacturing . . . . . . . . . . . 1.4 1.4 2.8 10,867.1 10,869.9 —Construction . . . . . . . . . . . . . 0.4 0.4 0.8 779.9 780.7 —Real estate . . . . . . . . . . . . . . 2.1 3.2 5.3 11,686.6 11,691.9 1.6Services . . . . . . . . . . . . . . . . 1.0 0.6 1.6 2,665.8 2,667.4 0.0Wholesale and retail . . . . . . . 3.9 4.2 8.1 7,962.9 7,971.0 1.3Banks and other financial
institutions . . . . . . . . . . . . — 0.0 0.0 4,812.3 4,812.3 —Communication and
information services . . . . . 0.7 0.3 1.0 1,550.2 1,551.2 —Other industries . . . . . . . . . . 0.3 28.3 28.6 8,909.4 8,938.0 —Consumer . . . . . . . . . . . . . . . 3.5 5.5 9.0 1,721.3 1,730.3 3.5
Foreign-excluding MUFGAmericas Holdings andKrungsri . . . . . . . . . . . . . . . . . . 12.5 19.7 32.2 36,694.3 36,726.5 1.1
Residential . . . . . . . . . . . . . . . . . . . . . 78.1 19.4 97.5 13,974.1 14,071.6 10.8Card . . . . . . . . . . . . . . . . . . . . . . . . . . . 18.9 32.2 51.1 528.2 579.3 —MUFG Americas Holdings . . . . . . . . 23.1 13.6 36.7 9,009.5 9,046.2 0.8Krungsri . . . . . . . . . . . . . . . . . . . . . . . 116.7 99.3 216.0 5,383.5 5,599.5 —
Total . . . . . . . . . . . . . . . . . . . . . . . . . . . ¥262.6 ¥228.1 ¥490.7 ¥116,545.1 ¥117,035.8 ¥19.1
122
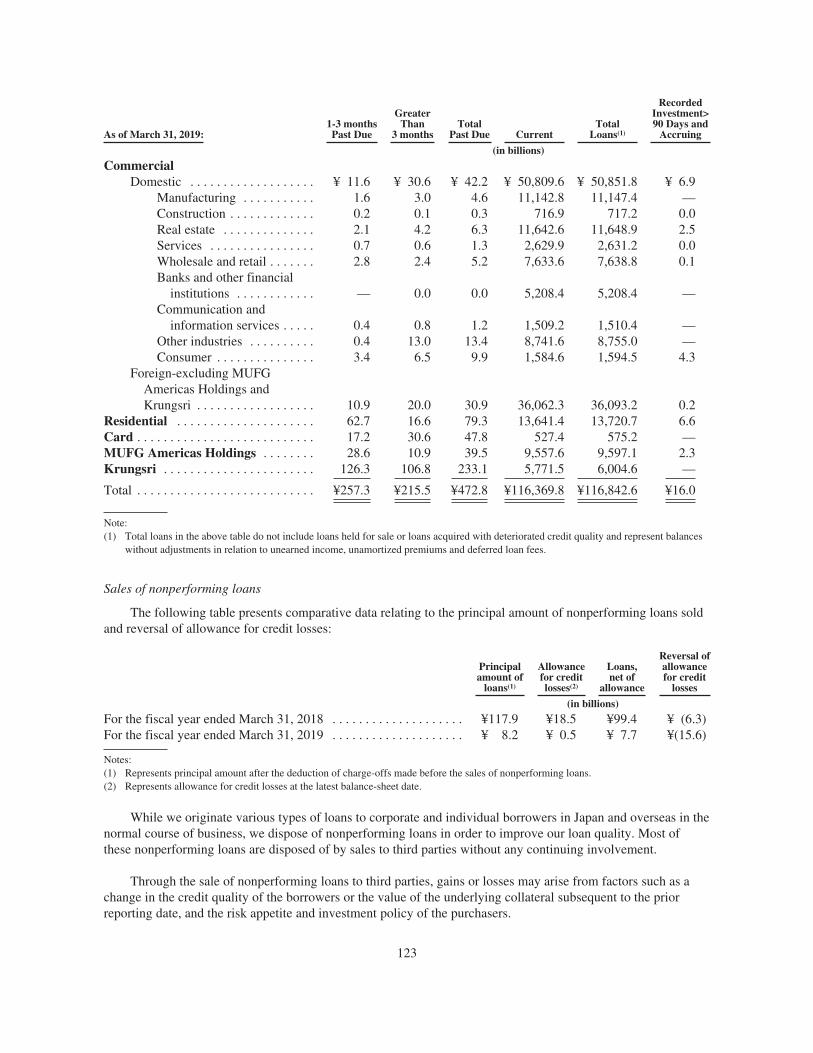
As of March 31, 2019:1-3 monthsPast Due
GreaterThan
3 monthsTotal
Past Due CurrentTotal
Loans(1)
RecordedInvestment>90 Days and
Accruing
(in billions)
CommercialDomestic . . . . . . . . . . . . . . . . . . . ¥ 11.6 ¥ 30.6 ¥ 42.2 ¥ 50,809.6 ¥ 50,851.8 ¥ 6.9
Manufacturing . . . . . . . . . . . 1.6 3.0 4.6 11,142.8 11,147.4 —Construction . . . . . . . . . . . . . 0.2 0.1 0.3 716.9 717.2 0.0Real estate . . . . . . . . . . . . . . 2.1 4.2 6.3 11,642.6 11,648.9 2.5Services . . . . . . . . . . . . . . . . 0.7 0.6 1.3 2,629.9 2,631.2 0.0Wholesale and retail . . . . . . . 2.8 2.4 5.2 7,633.6 7,638.8 0.1Banks and other financial
institutions . . . . . . . . . . . . — 0.0 0.0 5,208.4 5,208.4 —Communication and
information services . . . . . 0.4 0.8 1.2 1,509.2 1,510.4 —Other industries . . . . . . . . . . 0.4 13.0 13.4 8,741.6 8,755.0 —Consumer . . . . . . . . . . . . . . . 3.4 6.5 9.9 1,584.6 1,594.5 4.3
Foreign-excluding MUFGAmericas Holdings andKrungsri . . . . . . . . . . . . . . . . . . 10.9 20.0 30.9 36,062.3 36,093.2 0.2
Residential . . . . . . . . . . . . . . . . . . . . . 62.7 16.6 79.3 13,641.4 13,720.7 6.6Card . . . . . . . . . . . . . . . . . . . . . . . . . . . 17.2 30.6 47.8 527.4 575.2 —MUFG Americas Holdings . . . . . . . . 28.6 10.9 39.5 9,557.6 9,597.1 2.3Krungsri . . . . . . . . . . . . . . . . . . . . . . . 126.3 106.8 233.1 5,771.5 6,004.6 —
Total . . . . . . . . . . . . . . . . . . . . . . . . . . . ¥257.3 ¥215.5 ¥472.8 ¥116,369.8 ¥116,842.6 ¥16.0
Note:(1) Total loans in the above table do not include loans held for sale or loans acquired with deteriorated credit quality and represent balances
without adjustments in relation to unearned income, unamortized premiums and deferred loan fees.
Sales of nonperforming loans
The following table presents comparative data relating to the principal amount of nonperforming loans soldand reversal of allowance for credit losses:
Principalamount of
loans(1)
Allowancefor creditlosses(2)
Loans,net of
allowance
Reversal ofallowancefor credit
losses
(in billions)
For the fiscal year ended March 31, 2018 . . . . . . . . . . . . . . . . . . . . ¥117.9 ¥18.5 ¥99.4 ¥ (6.3)For the fiscal year ended March 31, 2019 . . . . . . . . . . . . . . . . . . . . ¥ 8.2 ¥ 0.5 ¥ 7.7 ¥(15.6)
Notes:(1) Represents principal amount after the deduction of charge-offs made before the sales of nonperforming loans.(2) Represents allowance for credit losses at the latest balance-sheet date.
While we originate various types of loans to corporate and individual borrowers in Japan and overseas in thenormal course of business, we dispose of nonperforming loans in order to improve our loan quality. Most ofthese nonperforming loans are disposed of by sales to third parties without any continuing involvement.
Through the sale of nonperforming loans to third parties, gains or losses may arise from factors such as achange in the credit quality of the borrowers or the value of the underlying collateral subsequent to the priorreporting date, and the risk appetite and investment policy of the purchasers.
123
The principal amount of non-performing loans sold in the fiscal year ended March 31, 2019 decreasedcompared to the previous fiscal year mainly due to decreased sales of nonperforming loans outstanding toborrowers in the Foreign-excluding MUFG Americas Holdings and Krungsri in the Commercial segment.
In connection with the sale of loans, including performing loans, we recorded net gains of ¥2.9 billion and ¥20.7 billion for the fiscal years ended March 31, 2018 and 2019, respectively.
Investment Portfolio
Our investment securities primarily consist of Japanese government bonds and marketable equity securities.Japanese government bonds are mostly classified as available-for-sale debt securities. Our investment inJapanese government bonds is a part of our asset and liability management policy with respect to investing theamount of Japanese yen-denominated funds exceeding our net loans. The percentage of our holding ofavailable-for-sale Japanese government bonds to the total investment securities decreased to 53.6% as ofMarch 31, 2019 from 56.3% as of March 31, 2018. We also hold Japanese government bonds that are classifiedas held-to-maturity debt securities, which accounted for 2.4% of the total investment securities as of March 31,2019.
Historically, we have held equity securities of some of our customers primarily for strategic purposes, inparticular to maintain long-term relationships with these customers. We continue to focus on reducing ourinvestment in equity securities for such purposes in order to reduce the price fluctuation risk in our equityportfolio from a risk management perspective and to respond to applicable regulatory requirements as well asincreasing market expectations for us to reduce our equity portfolio. As of March 31, 2018 and 2019, theaggregate book value of our marketable equity securities under Japanese GAAP satisfied the requirements of thelegislation prohibiting banks from holding equity securities in excess of their Tier 1 capital. In November 2015,we announced that we would aim to reduce the balance of equity securities held for strategic purposes valuedunder Japanese GAAP to approximately 10% of our Tier 1 capital over a five-year period. During the fiscal yearended March 31, 2019, we sold down ¥127 billion of equity securities held in our strategic equity investmentportfolio valued under Japanese GAAP. As of March 31, 2019, the balance of such securities valued underJapanese GAAP represented 13.4% of our Tier 1 capital. However, various factors, including market conditionsand changes in our Tier 1 capital ratio, may affect the amount of equity securities we should sell and our abilityto achieve the target as planned.
Investment securities increased ¥1,283.8 billion to ¥44,938.0 billion as of March 31, 2019 from¥43,654.2 billion as of March 31, 2018, primarily due to an increase in amortized cost of held-to-maturity debtsecurities, particularly asset-backed securities.
Investment securities other than available-for-sale debt securities, held-to-maturity debt securities andmarketable equity securities consist of nonmarketable equity securities, which are included in equity securities onour consolidated balance sheets. Nonmarketable equity securities were primarily carried at cost of ¥619.1 billionas of March 31, 2019 and ¥566.6 billion as of March 31, 2018, respectively, because their fair values were notreadily determinable.
Losses resulting from impairment of investment securities, which reflect the decline in value considered tobe other than temporary, were ¥0.6 billion for the fiscal year ended March 31, 2019. Such losses were recordedsubstantially on available-for-sale debt securities, primarily corporate bonds. Losses resulting from impairmentof investment securities for the fiscal year ended March 31, 2018 were ¥8.2 billion, consisting ¥6.7 billion oflosses on marketable equity securities, ¥0.1 billion of losses on available-for-sale debt securities and ¥1.4 billionof losses on nonmarketable equity securities. Losses resulting from impairment of investment securities for thefiscal year ended March 31, 2019 no longer included impairment of marketable equity securities, which wereinstead reported as part of net gains or losses from marketable equity securities, pursuant to new guidance onrecognition and measurement of financial assets and financial liabilities.
124

On April 1, 2018, we began to report all of our marketable and nonmarketable equity investment securitiesas “equity securities” in a line-item separate from available-for-sale debt securities and held-to-maturity debtsecurities in our consolidated balance sheets. Previously, marketable equity securities were included inavailable-for-sale securities, and nonmarketable equity securities were included in other investment securities.This reclassification has been retrospectively reflected in the presentation of the relevant amounts as ofMarch 31, 2018 in this Annual Report.
For more information on the relevant accounting changes, see Notes 1 and 3 to our consolidated financialstatements included elsewhere in this Annual Report.
The following table shows information regarding the amortized cost, net unrealized gains (losses), and fairvalue of our available-for-sale debt securities and held-to-maturity debt securities as of March 31, 2018 and2019.
As of March 31,
2018 2019
Amortizedcost Fair value
Netunrealized
gains (losses)Amortized
cost Fair value
Netunrealized
gains (losses)(in billions)
Available-for-sale debt securities:Japanese government and
Japanese governmentagency bonds . . . . . . . . . . . ¥24,272.3 ¥24,567.9 ¥295.6 ¥23,748.6 ¥24,077.7 ¥329.1
Japanese prefectural andmunicipal bonds . . . . . . . . . 1,532.1 1,537.4 5.3 2,204.0 2,226.6 22.6
Foreign government andofficial institution bonds . . . 2,207.7 2,171.7 (36.0) 2,648.9 2,641.4 (7.5)
Corporate bonds . . . . . . . . . . . 1,104.8 1,119.4 14.6 1,117.3 1,130.7 13.4Mortgage-backed securities . . 1,727.8 1,712.8 (15.0) 1,768.2 1,746.3 (21.9)Asset-backed securities . . . . . 1,547.0 1,558.3 11.3 1,494.6 1,502.9 8.3Other debt securities . . . . . . . . 165.0 165.6 0.6 192.9 192.9 0.0
Total available-for-sale debtsecurities . . . . . . . . . . . . . . . . . . . ¥32,556.7 ¥32,833.1 ¥276.4 ¥33,174.5 ¥33,518.5 ¥344.0
Held-to-maturity debtsecurities(1) . . . . . . . . . . . . . . . . . ¥ 3,582.9 ¥ 3,620.7 ¥ 37.8 ¥ 4,441.9 ¥ 4,452.9 ¥ 11.0
Note:(1) See Note 3 to our consolidated financial statements included elsewhere in this Annual Report for more details.
Net unrealized gains on available-for-sale debt securities increased ¥67.6 billion to ¥344.0 billion as ofMarch 31, 2019 from ¥276.4 billion as of March 31, 2018. The increase was primarily attributable to a¥33.5 billion increase in net unrealized gains on Japanese government and Japanese government agency bonds,reflecting a decline in the yield on such bonds. The increase was also attributable to an improvement in netunrealized losses on foreign government and official institutions bonds, reflecting generally declining trends inthe yield on such bonds. The increase was offset in part by larger net unrealized losses on mortgage-backedsecurities.
The amortized cost of available-for-sale debt securities increased ¥617.8 billion to ¥33,174.5 billion as ofMarch 31, 2019 from ¥32,556.7 billion as of March 31, 2018. This increase was mainly attributable to a¥671.9 billion increase in Japanese prefectural and municipal bonds and a ¥441.2 billion increase in foreigngovernment and official institution bonds. These increases were partially offset by a ¥523.7 billion decrease inJapanese government and Japanese government agency bonds.
125

The amortized cost of held-to-maturity debt securities increased ¥859.0 billion to ¥4,441.9 billion as ofMarch 31, 2019 from ¥3,582.9 billion as of March 31, 2018. The increase was mainly due to an increase in asset-backed securities.
The following table shows information relating to our equity securities as of March 31, 2018 and 2019:
As of March 31,
2018 2019
(in billions)
Equity securities:Marketable equity securities(1) . . . . . . . . . . . . . . . . . . . . . . . . . . . . . . . . . . . . . . . . . . . . ¥6,671.6 ¥6,358.5Nonmarketable equity securities:
Unlisted preferred securities(2) . . . . . . . . . . . . . . . . . . . . . . . . . . . . . . . . . . . . . . . . 391.1 393.3Others(3) . . . . . . . . . . . . . . . . . . . . . . . . . . . . . . . . . . . . . . . . . . . . . . . . . . . . . . . . . . 147.1 198.0Investment securities held by investment companies and brokers and
dealers(4) . . . . . . . . . . . . . . . . . . . . . . . . . . . . . . . . . . . . . . . . . . . . . . . . . . . . . . . . 28.4 27.8
Total . . . . . . . . . . . . . . . . . . . . . . . . . . . . . . . . . . . . . . . . . . . . . . . . . . . . . . . . ¥7,238.2 ¥6,977.6
Notes:(1) As a result of our adoption of new guidance on recognition and measurement of financial assets and financial liabilities on April 1, 2018,
equity securities are measured at fair value with unrealized gains (losses), or holding gains (losses), reflected in net income. This newguidance is not applied retrospectively to March 31, 2018. Prior to adoption, such unrealized gains (losses) were reflected in othercomprehensive income. For more information, see Note 1 to our consolidated financial statements included elsewhere in this AnnualReport.
(2) These securities are mainly issued by public companies, including preferred stocks issued by Morgan Stanley, preferred securities issuedby our non-consolidated funding vehicles, and other unlisted preferred securities issued by several Japanese public companies. Thosesecurities are primarily carried at cost.
(3) These securities are equity securities issued by unlisted companies other than unlisted preferred securities. Those securities are primarilycarried at cost.
(4) These investment securities are held by certain subsidiaries subject to specialized industry accounting principles for investmentcompanies and brokers and dealers, and are measured at fair value.
Equity securities decreased ¥260.6 billion to ¥6,977.6 billion as of March 31, 2019 from ¥7,238.2 billion asof March 31, 2018. The decrease was primarily attributable to a decrease in the fair value of marketable equitysecurities, as we sold down equity securities for asset and liability management purposes during the fiscal yearended March 31, 2019.
Cash, Due from Banks and Interest-earning Deposits in Other Banks
Cash and due from banks increased ¥1,275.9 billion to ¥33,924.3 billion as of March 31, 2019 from¥32,648.4 billion as of March 31, 2018. This increase was primarily because we deposited with the Bank ofJapan a larger amount of cash received from sales and redemption of Japanese government bonds as we reducedour holdings of such bonds.
Interest-earning deposits in other banks decreased ¥2,562.8 billion to ¥40,646.9 billion as of March 31, 2019from ¥43,209.7 billion as of March 31, 2018. This decrease was mainly because of a decrease in the balance ofour commercial banking subsidiaries’ interest-earning deposits with other banks.
Call Loans, Funds Sold, and Receivables under Resale Agreements
Call loans, funds sold, and receivables under resale agreements increased ¥5,462.4 billion to¥12,084.7 billion as of March 31, 2019 from ¥6,622.3 billion as of March 31, 2018. This was mainly due to anincrease in receivables under resale agreements in reaction to reduced Japanese government bond settlement riskresulting from the shortening of the settlement cycle for Japanese government bonds.
126
Receivables under Securities Borrowing Transactions
Receivables under securities borrowing transactions decreased ¥6,510.2 billion to ¥2,758.6 billion as ofMarch 31, 2019 from ¥9,268.8 billion as of March 31, 2018. This decrease was mainly in reaction to reducedJapanese government bond settlement risk resulting from the shortening of the settlement cycle for Japanesegovernment bonds.
Trading Account Assets
Trading account assets increased ¥5,389.9 billion to ¥40,576.6 billion as of March 31, 2019 from¥35,186.7 billion as of March 31, 2018. Trading account assets consist of trading account securities and tradingderivative assets. Trading account securities increased ¥4,770.6 billion to ¥27,372.1 billion as of March 31, 2019from ¥22,601.5 billion as of March 31, 2018. This increase was mainly due to the higher fair values of ourtrading residential mortgage-backed securities portfolio and foreign government and official institution bondportfolio. Trading derivative assets increased ¥619.3 billion to ¥13,204.5 billion as of March 31, 2019 from¥12,585.2 billion as of March 31, 2018. This increase was mainly attributable to the higher fair values of interestrate derivatives.
Deferred Tax Assets and Deferred Tax Liabilities
Deferred tax assets and deferred tax liabilities as of March 31, 2019 were ¥89.7 billion and ¥624.1 billion,respectively, compared to ¥68.7 billion and ¥654.1 billion, respectively, as of March 31, 2018. Net deferred taxliabilities as of March 31, 2019 were ¥534.4 billion, compared to ¥585.3 billion as of March 31, 2018. The lowernet deferred tax liabilities were primarily due to decreases in net realized gains on trading securities andinvestment securities.
For more information, see “—A. Operating Results—Results of Operations—Income Tax Expense” andNote 7 to our consolidated financial statements included elsewhere in this Annual Report.
Total Liabilities
As of March 31, 2019, total liabilities were ¥289,244.2 billion, an increase of ¥4,319.7 billion from¥284,924.5 billion as of March 31, 2018. This was primarily due to an increase of ¥7,090.0 billion in payablesunder repurchase agreements and an increase of ¥3,606.2 billion in deposits, partially offset by a decrease of¥7,257.1 billion in securities lending transactions.
Deposits
Deposits are our primary source of funds. The balance of deposits increased ¥3,606.2 billion to¥199,280.8 billion as of March 31, 2019 from ¥195,674.6 billion as of March 31, 2018. The increase was mainlyattributable to an increase in foreign interest-bearing deposits, primarily in the United States and Thailand.
The total average balance of interest-bearing deposits increased ¥2,044.7 billion to ¥166,607.5 billion forthe fiscal year ended March 31, 2019 from ¥164,562.8 billion for the fiscal year ended March 31, 2018, mainlydue to an increase in domestic deposits.
Payables under Repurchase Agreements
Payables under repurchase agreements increased ¥7,090.0 billion to ¥25,224.6 billion as of March 31, 2019from ¥18,134.6 billion as of March 31, 2018. This increase was mainly in reaction to reduced Japanesegovernment bond settlement risk resulting from the shortening of the settlement cycle for Japanese governmentbonds.
127

Payables under Securities Lending Transactions
Payables under securities lending transactions decreased ¥7,257.1 billion to ¥913.1 billion as of March 31,2019 from ¥8,170.2 billion as of March 31, 2018. This decrease was mainly in reaction to reduced Japanesegovernment bond settlement risk resulting from the shortening of the settlement cycle for Japanese governmentbonds.
Long-term debt
Long-term debt increased ¥920.9 billion to ¥27,990.5 billion as of March 31, 2019 from ¥27,069.6 billion asof March 31, 2018. This increase was due to additional issuances of bonds by us to meet applicable TLAC andother capital requirements. The average balance of long-term debt for the fiscal year ended March 31, 2019 was¥28,667.5 billion, an increase of ¥735.5 billion from ¥27,932.0 billion for the previous fiscal year.
Sources of Funding and Liquidity
Our primary source of liquidity is from a large balance of deposits, mainly ordinary deposits, certificates ofdeposit and time deposits. Time deposits have historically shown a high rollover rate among our corporatecustomers and individual depositors. The average deposit balance increased to ¥196,393.3 billion for the fiscalyear ended March 31, 2019 from ¥192,741.2 billion for the fiscal year ended March 31, 2018. These depositsprovide us with a sizable source of stable and low-cost funds. Our average deposits, combined with our averagetotal equity of ¥20,465.9 billion, funded 67.5% of our average total assets of ¥321,292.8 billion during the fiscalyear ended March 31, 2019. Our deposits exceeded our loans before allowance for credit losses by¥82,396.9 billion as of March 31, 2019 compared to ¥78,638.7 billion as of March 31, 2018. As part of our assetand liability management policy, a significant portion of the amount of Japanese yen-denominated fundsexceeding our loans has been deposited with the Bank of Japan or invested in Japanese government bonds inrecent periods.
The remaining funding was primarily provided by short-term borrowings and long-term senior andsubordinated debt. Short-term borrowings consist of call money and funds purchased, payables under repurchaseagreements, payables under securities lending transactions, due to trust account, and other short-term borrowings.From time to time, we have issued long-term instruments, including various fixed and floating interest rate seniorand subordinated bonds with and without maturities. The balance of our short-term borrowings as of March 31,2019 was ¥38,055.1 billion, and the average balance of short-term borrowings for the fiscal year endedMarch 31, 2019 was ¥36,281.9 billion. The balance of our long-term debt as of March 31, 2019 was¥27,990.5 billion, and the average balance of long-term debt for the fiscal year ended March 31, 2019 was¥28,667.5 billion. Liquidity may also be provided by the sale of financial assets, including available-for-sale debtsecurities, marketable equity securities, trading account securities and loans. Additional liquidity may beprovided by the maturity of loans.
We manage liquidity separately at certain of our domestic and foreign banking and non-bank subsidiariesbecause they are subject to separate regulatory requirements, pursue different business models and havedistinctive liquidity risk profiles. We manage our group-wide liquidity on a consolidated basis based on the testsand analyses conducted at the subsidiary level. Liquidity risk management measures at the subsidiary levelinclude the following:
‰ Domestic banking subsidiaries—Our major domestic banking subsidiaries, MUFG Bank and MitsubishiUFJ Trust and Banking, set liquidity and funding limits designed to maintain their respectiverequirements for funding from market sources below pre-determined levels for certain periods(e.g., one-day, two-week and one-month). The major domestic banking subsidiaries also monitor thebalance of buffer assets they respectively hold, including Japanese government bonds and U.S. Treasurybonds, which can be used for cash funding even in periods of stress. In addition, the major domesticbanking subsidiaries regularly perform liquidity stress testing designed to evaluate the impact of
128
systemic market stress conditions and institution-specific stress events, including credit ratingdowngrades, on their liquidity positions;
‰ Foreign banking subsidiaries—Our major foreign banking subsidiaries, MUFG Americas Holdings andKrungsri, monitors various liquidity metrics, including total available liquidity, the net non-core fundingdependence ratio, and minimum liquidity assets, as a tool to maintain a sufficient amount of liquidityand diversity of funding sources to allow the major foreign banking subsidiaries to meet expectedobligations in both stable and adverse conditions. In addition, the major foreign banking subsidiariesregularly conduct stress testing, which incorporates both bank-specific and systemic market scenariosthat would adversely affect its liquidity position, to facilitate the identification of appropriate remedialmeasures to help ensure that it maintains adequate liquidity in adverse conditions;
‰ Securities subsidiaries—Our securities subsidiaries implement liquidity and funding limits designed tomaintain their requirements for funding from market sources below pre-determined levels for specifiedperiods. In addition, the securities subsidiaries regularly conduct analyses designed to assess the periodfor which they can continue to meet their respective liquidity requirements by selling or pledging assetsthey respectively hold under scenarios where they are unable to access any additional sources offinancing in the market; and
‰ Non-bank subsidiaries—Our non-bank subsidiaries, including Mitsubishi UFJ NICOS, regularlyconduct cash flow analyses designed to assess their ability to generate sufficient liquidity for specifiedperiods, considering the cash and cash equivalents as well as deposits they respectively hold, and theirrespective operating income and expenses under scenarios where they are no longer able to obtainfunding from markets through issuance of commercial paper, bonds or other instruments. The non-banksubsidiaries also conduct analyses to ensure sufficient liquidity and funding are available from our banksubsidiaries and other financial institutions outside of our group of companies.
We collect and evaluate the results of the stress tests individually performed by our major subsidiaries toensure our ability to meet our liquidity requirements on a consolidated basis in stress scenarios.
We manage our funding sources by setting limits on, or targets for, our holdings of buffer assets, primarilyJapanese government bonds. As of March 31, 2019, we held ¥24,077.7 billion of Japanese government bonds andgovernment agency bonds as available-for-sale debt securities. We also regard deposits with the Bank of Japan asbuffer assets. In addition, our commercial banking subsidiaries manage their funding sources through liquidity-supplying products such as commitment lines and through a liquidity gap, or the excess of cash inflows over cashoutflows.
Any downgrade of the credit ratings assigned to us or our major subsidiaries could increase the cost, ordecrease the availability, of our funding, particularly in U.S. dollars and other foreign currencies, adversely affectour liquidity position or net interest margin, trigger additional collateral or funding obligations, and result inlosses of depositors, investors and counterparties willing or permitted to transact with us, thereby reducing ourability to generate income and weakening our financial position. See “Item 3.D. Key Information—RiskFactors—Risks Related to Our Business—A downgrade of our credit ratings could adversely affect our ability toaccess and maintain liquidity.”
Liquidity Requirements for Banking Institutions in Japan
We are required to calculate and disclose our LCR calculated in accordance with the methodologyprescribed in the FSA guidance that has been adopted to implement the relevant Basel III standard. Starting inthe calendar year 2019, we are required to maintain a minimum LCR of 100%. See “Item 4.B. Information on theCompany—Business Overview—Supervision and Regulation—Japan—Liquidity Coverage Ratio” and“—B. Liquidity and Capital Resources—Capital Adequacy—Liquidity Coverage Ratios of MUFG and MajorBanking Subsidiaries in Japan.”
129

Total Equity
The following table presents a summary of our total equity as of March 31, 2018 and 2019:
March 31, 2018 March 31, 2019
(in billions, except percentages)
Capital stock . . . . . . . . . . . . . . . . . . . . . . . . . . . . . . . . . . . . . . . . . . . . . . . . . . . . . . . ¥ 2,090.3 ¥ 2,090.3Capital surplus . . . . . . . . . . . . . . . . . . . . . . . . . . . . . . . . . . . . . . . . . . . . . . . . . . . . . 5,740.2 5,577.2Retained earnings . . . . . . . . . . . . . . . . . . . . . . . . . . . . . . . . . . . . . . . . . . . . . . . . . . . 5,185.3 8,333.6
Retained earnings appropriated for legal reserve . . . . . . . . . . . . . . . . . . . . . . . 239.6 239.6Unappropriated retained earnings . . . . . . . . . . . . . . . . . . . . . . . . . . . . . . . . . . . 4,945.7 8,094.0
Accumulated net unrealized gains (losses) on investment securities, net oftaxes . . . . . . . . . . . . . . . . . . . . . . . . . . . . . . . . . . . . . . . . . . . . . . . . . . . . . . . . . . . 2,270.3 (369.4)
Accumulated other comprehensive income, net of taxes, other than net unrealizedgains on investment securities . . . . . . . . . . . . . . . . . . . . . . . . . . . . . . . . . . . . . . . 207.0 85.1
Treasury stock, at cost . . . . . . . . . . . . . . . . . . . . . . . . . . . . . . . . . . . . . . . . . . . . . . . (522.9) (517.2)
Total Mitsubishi UFJ Financial Group shareholders’ equity . . . . . . . . . . . . . . ¥14,970.2 ¥15,199.6Noncontrolling interests . . . . . . . . . . . . . . . . . . . . . . . . . . . . . . . . . . . . . . . . . . . . . . 675.6 785.1
Total equity . . . . . . . . . . . . . . . . . . . . . . . . . . . . . . . . . . . . . . . . . . . . . . . . . . . . ¥15,645.8 ¥15,984.7
Ratio of total equity to total assets . . . . . . . . . . . . . . . . . . . . . . . . . . . . . . . . . . . . . . 5.21% 5.24%
Mitsubishi UFJ Financial Group shareholders’ equity as of March 31, 2019 was ¥15,199.6 billion, anincrease of ¥229.4 billion from ¥14,970.2 billion as of March 31, 2018.
Capital surplus decreased ¥163.0 billion to ¥5,577.2 billion as of March 31, 2019 from ¥5,740.2 billion as ofMarch 31, 2018. This decrease was mainly due to repurchases of shares of our common stock and cancellation ofthe repurchased shares.
Retained earnings increased ¥3,148.3 billion to ¥8,333.6 billion as of March 31, 2019 from ¥5,185.3 billionas of March 31, 2018, whereas accumulated net unrealized losses on investment securities, net of taxes as ofMarch 31, 2019 was ¥369.4 billion compared to accumulated net unrealized gains on investment securities, net oftaxes as of March 31, 2018 of ¥2,270.3 billion. These changes primarily resulted from the adoption of the newaccounting guidance described below. We decided to pay our year-end dividend of ¥11 per share of our commonstock for the six months ended March 31, 2019, resulting in an annual dividend of ¥22 per share of our commonstock for the fiscal year ended March 31, 2019.
Effective April 1, 2018, we adopted new guidance on recognition and measurement of financial assets andfinancial liabilities and began to measure equity securities at fair value with unrealized gains (losses), or holdinggains (losses), on such securities being reflected in net investment securities gains or losses in our consolidatedstatements of income. Upon adoption, we also recorded an increase in the beginning balance of retained earningsas of April 1, 2018 of ¥2,702 billion, with a corresponding decrease in accumulated net unrealized gains (losses)on investment securities, net of taxes. For more information, see Note 1 to our consolidated financial statementsincluded elsewhere in this Annual Report.
Accumulated other comprehensive income, net of taxes, other than accumulated net unrealized gains oninvestment securities decreased ¥121.9 billion to ¥85.1 billion as of March 31, 2019 from ¥207.0 billion as ofMarch 31, 2018. The decrease was mainly due to ¥88.7 billion of negative net change in the balance of pensionliability adjustments because the investment returns on our pension plans decreased.
As a result of the foregoing, total equity increased ¥338.9 billion to ¥15,984.7 billion as of March 31, 2019from ¥15,645.8 billion as of March 31, 2018. The ratio of total equity to total assets increased 0.03 percentagepoints to 5.24% as of March 31, 2019 from 5.21% as of March 31, 2018.
130
The following table presents information relating to the accumulated net unrealized gains, net of taxes, inrespect of available-for-sale investment securities as of March 31, 2018 and 2019:
March 31, 2018 March 31, 2019
(in billions, except percentages)
Accumulated net unrealized gains on investment securities, net of taxes(1) . . . . . . . ¥2,270.3 ¥(369.4)Accumulated net unrealized gains on investment securities, net of taxes, to total
equity . . . . . . . . . . . . . . . . . . . . . . . . . . . . . . . . . . . . . . . . . . . . . . . . . . . . . . . . . . 14.51% (2.31)%
Note:(1) As a result of our adoption of new guidance on recognition and measurement of financial assets and financial liabilities on April 1, 2018,
equity securities are measured at fair value with unrealized gains (losses), or holding gains (losses), reflected in net income. This newguidance is not applied retrospectively to March 31, 2018. Prior to adoption, such unrealized gains (losses) were reflected in othercomprehensive income. For more information, see Note 1 to our consolidated financial statements included elsewhere in this AnnualReport.
Capital Adequacy
We are subject to various regulatory capital requirements promulgated by the regulatory authorities of thecountries in which we operate. Failure to meet minimum capital requirements can result in mandatory actionsbeing taken by regulators that could have a direct material effect on our consolidated financial statements.Moreover, if our capital ratios are perceived to be low, our counterparties may avoid entering into transactionswith us, which in turn could negatively affect our business and operations. For further information, see“Item 3.D. Key Information—Risk Factors—Risks Related to Our Business—We may not be able to maintainour capital ratios and other regulatory ratios above minimum required levels, which could result in variousregulatory actions, including the suspension of some or all of our operations.”
We continually monitor our risk-adjusted capital ratios, leverage ratio and TLAC ratios closely, and manageour operations in consideration of the capital requirements. Factors that affect some or all of these ratios includefluctuations in the value of our assets, including our credit risk assets such as loans and equity securities, the riskweights of which depend on the borrowers’ or issuers’ internal ratings, and marketable securities, andfluctuations in the value of the Japanese yen against the U.S. dollar and other foreign currencies, as well asgeneral price levels of Japanese equity securities.
Capital Requirements for Banking Institutions in Japan
Under Japanese regulatory capital requirements, our consolidated capital components, including CommonEquity Tier 1, Tier 1, and Tier 2 capital and risk-weighted assets, are calculated based on our consolidatedfinancial statements prepared under Japanese GAAP. Each of the consolidated and stand-alone capitalcomponents and risk-weighted assets of our banking subsidiaries in Japan is also calculated based onconsolidated and non-consolidated financial statements prepared under Japanese GAAP.
As of March 31, 2019, we were required to maintain a capital conservation buffer of 2.5%, a G-SIBsurcharge of 1.5% and a countercyclical buffer of 0.04% in addition to the 4.5% minimum Common Equity Tier1 capital ratio. See “Item 4.B. Information on the Company—Business Overview—Supervision andRegulation—Japan—Capital adequacy.”
We have been granted approval by the FSA to exclude the majority of our investment in Morgan Stanleyfrom being subject to double gearing adjustments. The approval was granted for a 10-year period, but theapproval amount will be phased out by 20% each year starting from March 31, 2019. As of March 31, 2019, afull application of double gearing adjustments with respect to our investment in Morgan Stanley would havereduced our Common Equity Tier 1 capital ratio by approximately 0.9%.
131
Leverage Requirements for Banking Institutions in Japan
Our consolidated leverage ratio is calculated in accordance with the methodology prescribed in the FSAguidance that has been adopted to implement the relevant Basel III standard. The leverage ratio is designed formonitoring and preventing the build-up of excessive leverage in the banking sector and is expressed as the ratioof Tier 1 capital to total balance sheet assets adjusted in accordance with the FSA guidance. As of March 31,2019, we were required to maintain a minimum leverage ratio of 3.00%. A G-SIB leverage ratio buffer equal to50% of the applicable G-SIB capital surcharge is expected to be applied to us in 2022. See “Item 4.B.Information on the Company—Business Overview—Supervision and Regulation—Japan—Leverage Ratio.”
TLAC Requirements for Banking Institutions in Japan
Our External TLAC ratios are calculated in accordance with the methodology prescribed in the FSAguidance that has been adopted to implement the TLAC Principle published by the FSB in November 2015.External TLAC ratios are expressed as the ratio of External TLAC amount to risk-weighted assets or leverageexposure in accordance with the FSA guidance. We are required to maintain External TLAC ratios of 16% on arisk-weighted assets basis and 6% on a leverage exposure basis from March 31, 2019 and 18% on arisk-weighted assets basis and 6.75% on a leverage exposure basis from March 31, 2022. See “Item 4.B.Information on the Company—Business Overview—Supervision and Regulation—Japan—Total loss-absorbingcapacity.”
Capital Ratios, Leverage Ratio and TLAC Ratios of MUFG
The table below presents our consolidated total capital components, risk-weighted assets, risk-adjustedcapital ratios, leverage ratio and TLAC ratios in accordance with Basel III as of March 31, 2018 and 2019.Underlying figures are calculated in accordance with Japanese banking regulations based on information derivedfrom our consolidated financial statements prepared in accordance with Japanese GAAP, as required by the FSA.The figures in the table below are rounded down. For further information, see Note 22 to our consolidatedfinancial statements included elsewhere in this Annual Report.
As of March 31,2018
Minimumratios required(1)
As of March 31,2019
Minimumratios required(1)
(in billions, except percentages)
Capital components:Common Equity Tier 1 . . . . . . . . . . ¥ 14,284.9 ¥ 14,322.4Additional Tier 1 . . . . . . . . . . . . . . . 1,966.8 1,953.8
Tier 1 capital . . . . . . . . . . . . . . . . . . . . . . 16,251.7 16,276.3Tier 2 capital . . . . . . . . . . . . . . . . . . . . . . 2,543.7 2,493.4Total capital . . . . . . . . . . . . . . . . . . . . . . . ¥ 18,795.4 ¥ 18,769.7
Risk-weighted assets . . . . . . . . . . . . . . . . . . . . ¥113,463.6 ¥117,091.1Capital ratios:
Common Equity Tier 1 capital . . . . . . . . . 12.58% 7.51% 12.23% 8.54%Tier 1 capital . . . . . . . . . . . . . . . . . . . . . . 14.32 9.01 13.90 10.04Total capital . . . . . . . . . . . . . . . . . . . . . . . 16.56 11.01 16.03 12.04
Leverage ratio . . . . . . . . . . . . . . . . . . . . . . . . . 5.01 — 4.94 3.00External TLAC ratios . . . . . . . . . . . . . . . . . . . .
Risk-weighted assets basis(2) . . . . . . . . . . — — 18.16 16.00Leverage exposure basis . . . . . . . . . . . . . — — 7.90 6.00
Note:(1) The minimum capital ratios required as of March 31, 2018 include a capital conservation buffer of 1.875% and a G-SIB surcharge of
1.125% and a countercyclical buffer of 0.01%. The minimum capital ratios required as of March 31, 2019 include a capital conservationbuffer of 2.5%, a G-SIB surcharge of 1.5% and a countercyclical buffer of 0.04%.
(2) The TLAC ratio on a risk-weighted assets basis and the required minimum ratios as of March 31, 2019 do not include the regulatorycapital buffers consisting of a capital conservation buffer of 2.5%, a G-SIB surcharge of 1.5% and a countercyclical buffer of 0.04%.
132
Management believes that, as of March 31, 2019, we were in compliance with all capital adequacyrequirements to which we were subject.
Our Common Equity Tier 1 capital ratio as of March 31, 2019 was lower compared to the ratio as ofMarch 31, 2018 due to an increase in our risk-weighted assets, more than offsetting the impact of larger CommonEquity Tier 1 capital. The increase in risk-weighted assets mainly reflected the increase in credit risks foroverseas subsidiaries. The increase in our Common Equity Tier 1 capital was mainly due to larger retainedearnings, reflecting the net income.
Capital Ratios and Leverage Ratios of Major Banking Subsidiaries in Japan
The table below presents the risk-adjusted capital ratios and leverage ratios of MUFG Bank and MitsubishiUFJ Trust and Banking in accordance with Basel III as of March 31, 2018 and 2019. Underlying figures arecalculated in accordance with Japanese banking regulations based on information derived from each bank’sconsolidated and non-consolidated financial statements prepared in accordance with Japanese GAAP, as requiredby the FSA. The figures in the table below are rounded down. For further information, see Note 22 to ourconsolidated financial statements included elsewhere in this Annual Report.
As ofMarch 31,
2018Minimum capitalratios required
As ofMarch 31,
2019Minimum capitalratios required
Consolidated:MUFG Bank
Common Equity Tier 1 capital ratio . . . . . . . . 11.85% 4.50% 10.83% 4.50%Tier 1 capital ratio . . . . . . . . . . . . . . . . . . . . . 13.59 6.00 12.46 6.00Total capital ratio . . . . . . . . . . . . . . . . . . . . . . 15.90 8.00 14.42 8.00Leverage ratio . . . . . . . . . . . . . . . . . . . . . . . . . 4.81 — 4.63 3.00
Mitsubishi UFJ Trust and BankingCommon Equity Tier 1 capital ratio . . . . . . . . 16.21 4.50 19.57 4.50Tier 1 capital ratio . . . . . . . . . . . . . . . . . . . . . 17.67 6.00 21.26 6.00Total capital ratio . . . . . . . . . . . . . . . . . . . . . . 20.03 8.00 24.40 8.00Leverage ratio . . . . . . . . . . . . . . . . . . . . . . . . . 4.71 — 5.09 3.00
Stand-alone:MUFG Bank
Common Equity Tier 1 capital ratio . . . . . . . . 12.54 4.50 11.69 4.50Tier 1 capital ratio . . . . . . . . . . . . . . . . . . . . . 14.51 6.00 13.53 6.00Total capital ratio . . . . . . . . . . . . . . . . . . . . . . 16.90 8.00 15.58 8.00Leverage ratio . . . . . . . . . . . . . . . . . . . . . . . . . — — 4.84 3.00
Mitsubishi UFJ Trust and BankingCommon Equity Tier 1 capital ratio . . . . . . . . 16.18 4.50 19.42 4.50Tier 1 capital ratio . . . . . . . . . . . . . . . . . . . . . 17.55 6.00 21.12 6.00Total capital ratio . . . . . . . . . . . . . . . . . . . . . . 19.88 8.00 24.25 8.00Leverage ratio . . . . . . . . . . . . . . . . . . . . . . . . . — — 5.55 3.00
Management believes that, as of March 31, 2019, our banking subsidiaries were in compliance with allcapital adequacy requirements to which they were subject.
Liquidity Coverage Ratios of MUFG and Major Banking Subsidiaries in Japan
The following table presents the LCRs of MUFG, MUFG Bank and Mitsubishi UFJ Trust and Banking inaccordance with Basel III as adopted by the FSA for the periods indicated. The figures underlying the ratios werecalculated in accordance with Japanese banking regulations. The percentages in the table below are rounded
133
down. The required minimum LCR was 90% during the calendar year 2018 and is 100% during the calendar year2019.
Three months ended
March 31,2018(1),(6)
June 30,2018(2),(6)
September 30,2018(3),(6)
December 31,2018(4),(6)
March 31,2019(5),(6)
MUFG (consolidated) . . . . . . . . . . . . . . . . . . . . . . . . 144.8% 140.3% 138.4% 136.0% 141.2%MUFG Bank (consolidated) . . . . . . . . . . . . . . . . . . . 160.0 148.4 144.7 143.2 150.7MUFG Bank (stand-alone) . . . . . . . . . . . . . . . . . . . . 170.4 156.2 152.8 151.5 159.0Mitsubishi UFJ Trust and Banking
(consolidated) . . . . . . . . . . . . . . . . . . . . . . . . . . . . 113.8 124.4 125.1 118.7 115.2Mitsubishi UFJ Trust and Banking (stand-alone) . . 127.7 151.3 157.0 143.1 141.5
Notes:(1) Each of the ratios is calculated as the average balance of High-Quality Liquid Assets on the business days between January 4, 2018 and
March 30 2018 divided by the average amount of net cash outflows for the same fifty-nine business days.(2) Each of the ratios is calculated as the average balance of High-Quality Liquid Assets on the business days between April 2, 2018 and
June 29, 2018 divided by the average amount of net cash outflows for the same sixty-two business days.(3) Each of the ratios is calculated as the average balance of High-Quality Liquid Assets on the business days between July 2, 2018 and
September 28, 2018 divided by the average amount of net cash outflows for the same sixty-two business days.(4) Each of the ratios is calculated as the average balance of High-Quality Liquid Assets on the business days between October 1, 2018 and
December 28, 2018 divided by the average amount of net cash outflows for the same sixty-two business days.(5) Each of the ratios is calculated as the average balance of High-Quality Liquid Assets on the business days between January 4, 2019 and
March 29, 2019 divided by the average amount of net cash outflows for the same fifty-eight business days.(6) The LCR is to be calculated as an average based on daily values in accordance with the Japanese banking regulations.
See “—B. Liquidity and Capital Resources—Sources of Funding and Liquidity.”
Capital Requirements for Banking Institutions in the United States
In the United States, MUFG Americas Holdings and MUFG Union Bank are subject to various regulatorycapital requirements administered by the U.S. Federal banking agencies. Failure to meet the applicable minimumcapital requirements can initiate certain mandatory, and possibly additional discretionary, actions by regulatorsthat, if undertaken, could have a material effect on MUFG Americas Holdings’ consolidated financial statements.
For a more detailed discussion of the applicable capital requirements, see “Item 4.B. Information on theCompany—Business Overview—Supervision and Regulation—United States.” See also Note 22 to ourconsolidated financial statements included elsewhere in this Annual Report.
In addition, as foreign banking organizations that have U.S. branches and agencies and also as entities thatare controlled by MUFG, MUFG Bank and Mitsubishi UFJ Trust and Banking are subject to the FRB’srequirements.
134
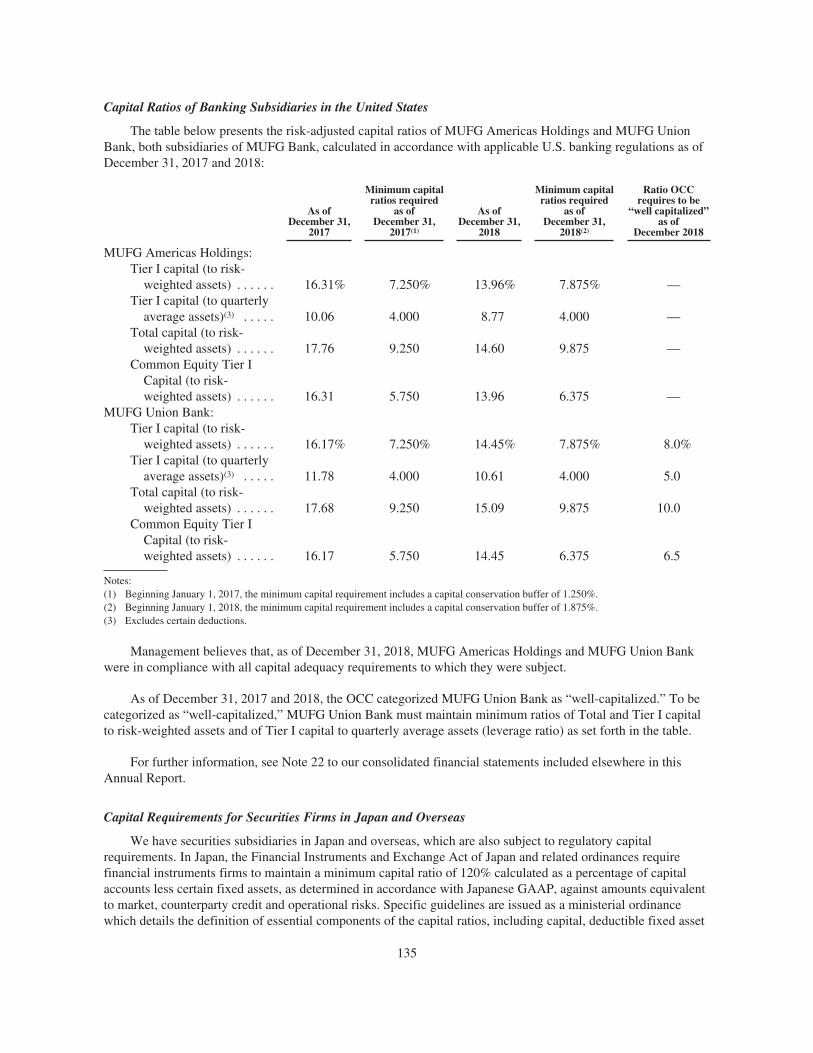
Capital Ratios of Banking Subsidiaries in the United States
The table below presents the risk-adjusted capital ratios of MUFG Americas Holdings and MUFG UnionBank, both subsidiaries of MUFG Bank, calculated in accordance with applicable U.S. banking regulations as ofDecember 31, 2017 and 2018:
As ofDecember 31,
2017
Minimum capitalratios required
as ofDecember 31,
2017(1)
As ofDecember 31,
2018
Minimum capitalratios required
as ofDecember 31,
2018(2)
Ratio OCCrequires to be
“well capitalized”as of
December 2018
MUFG Americas Holdings:Tier I capital (to risk-
weighted assets) . . . . . . 16.31% 7.250% 13.96% 7.875% —Tier I capital (to quarterly
average assets)(3) . . . . . 10.06 4.000 8.77 4.000 —Total capital (to risk-
weighted assets) . . . . . . 17.76 9.250 14.60 9.875 —Common Equity Tier I
Capital (to risk-weighted assets) . . . . . . 16.31 5.750 13.96 6.375 —
MUFG Union Bank:Tier I capital (to risk-
weighted assets) . . . . . . 16.17% 7.250% 14.45% 7.875% 8.0%Tier I capital (to quarterly
average assets)(3) . . . . . 11.78 4.000 10.61 4.000 5.0Total capital (to risk-
weighted assets) . . . . . . 17.68 9.250 15.09 9.875 10.0Common Equity Tier I
Capital (to risk-weighted assets) . . . . . . 16.17 5.750 14.45 6.375 6.5
Notes:(1) Beginning January 1, 2017, the minimum capital requirement includes a capital conservation buffer of 1.250%.(2) Beginning January 1, 2018, the minimum capital requirement includes a capital conservation buffer of 1.875%.(3) Excludes certain deductions.
Management believes that, as of December 31, 2018, MUFG Americas Holdings and MUFG Union Bankwere in compliance with all capital adequacy requirements to which they were subject.
As of December 31, 2017 and 2018, the OCC categorized MUFG Union Bank as “well-capitalized.” To becategorized as “well-capitalized,” MUFG Union Bank must maintain minimum ratios of Total and Tier I capitalto risk-weighted assets and of Tier I capital to quarterly average assets (leverage ratio) as set forth in the table.
For further information, see Note 22 to our consolidated financial statements included elsewhere in thisAnnual Report.
Capital Requirements for Securities Firms in Japan and Overseas
We have securities subsidiaries in Japan and overseas, which are also subject to regulatory capitalrequirements. In Japan, the Financial Instruments and Exchange Act of Japan and related ordinances requirefinancial instruments firms to maintain a minimum capital ratio of 120% calculated as a percentage of capitalaccounts less certain fixed assets, as determined in accordance with Japanese GAAP, against amounts equivalentto market, counterparty credit and operational risks. Specific guidelines are issued as a ministerial ordinancewhich details the definition of essential components of the capital ratios, including capital, deductible fixed asset
135

items and risks, and related measures. Failure to maintain a minimum capital ratio will trigger mandatoryregulatory actions. A capital ratio of less than 140% will call for additional regulatory reporting, a capital ratio ofless than 120% may result in an order to change the method of business, and a capital ratio of less than 100%may lead to a suspension of all or part of the business for a period of time and cancellation of a registration.Overseas securities subsidiaries are subject to the relevant regulatory capital requirements of the countries orjurisdictions in which they operate.
Capital Ratio of Mitsubishi UFJ Morgan Stanley Securities
As of March 31, 2019, Mitsubishi UFJ Morgan Stanley Securities’ capital accounts less certain fixed assetsof ¥446.6 billion on a stand-alone basis represented 331.6% of the total amounts equivalent to market,counterparty credit and operational risks. As of the same date, Mitsubishi UFJ Morgan Stanley Securities’ capitalaccounts less certain fixed assets of ¥469.3 billion on a consolidated basis represented 332.2% of the totalamounts equivalent to market, counterparty credit and operational risks. As of March 31, 2018, Mitsubishi UFJMorgan Stanley Securities’ capital accounts less certain fixed assets of ¥446.5 billion on a stand-alone basisrepresented 291.2% of the total amounts equivalent to market, counterparty credit and operational risks. As of thesame date, Mitsubishi UFJ Morgan Stanley Securities’ capital accounts less certain fixed assets of ¥473.3 billionon a consolidated basis represented 293.2% of the total amounts equivalent to market, counterparty credit andoperational risks. These figures are calculated in accordance with Japanese GAAP, pursuant to the FinancialInstruments and Exchange Act of Japan.
For further information, see Note 22 to our consolidated financial statements included elsewhere in thisAnnual Report.
Non-exchange Traded Contracts Accounted for at Fair Value
The use of non-exchange traded or over-the-counter contracts provides us with the ability to adapt to thevaried requirements of a wide customer base while mitigating market risks. Non-exchange traded contracts areaccounted for at fair value, which is generally based on pricing models or quoted prices for instruments withsimilar characteristics. Gains or losses on non-exchange traded contracts are included in “Trading account profits(losses)—net” in our consolidated statements of income. The following table summarizes the changes in the fairvalue of non-exchange traded contracts for the fiscal years ended March 31, 2018 and 2019:
Fiscal years ended March 31,
2018 2019
(in millions)
Net fair value of contracts outstanding at beginning of fiscal year . . . . . . . . . . . . . . . . ¥ 4,373 ¥ 1,812Changes attributable to contracts realized or otherwise settled during the fiscal
year . . . . . . . . . . . . . . . . . . . . . . . . . . . . . . . . . . . . . . . . . . . . . . . . . . . . . . . . . . . . . . . (2,126) (1,212)Fair value of new contracts entered into during the fiscal year . . . . . . . . . . . . . . . . . . . — 356Other changes in fair value, principally revaluation at end of fiscal year . . . . . . . . . . . (435) 34
Net fair value of contracts outstanding at end of fiscal year . . . . . . . . . . . . . . . . . . . . . . ¥ 1,812 ¥ 990
136
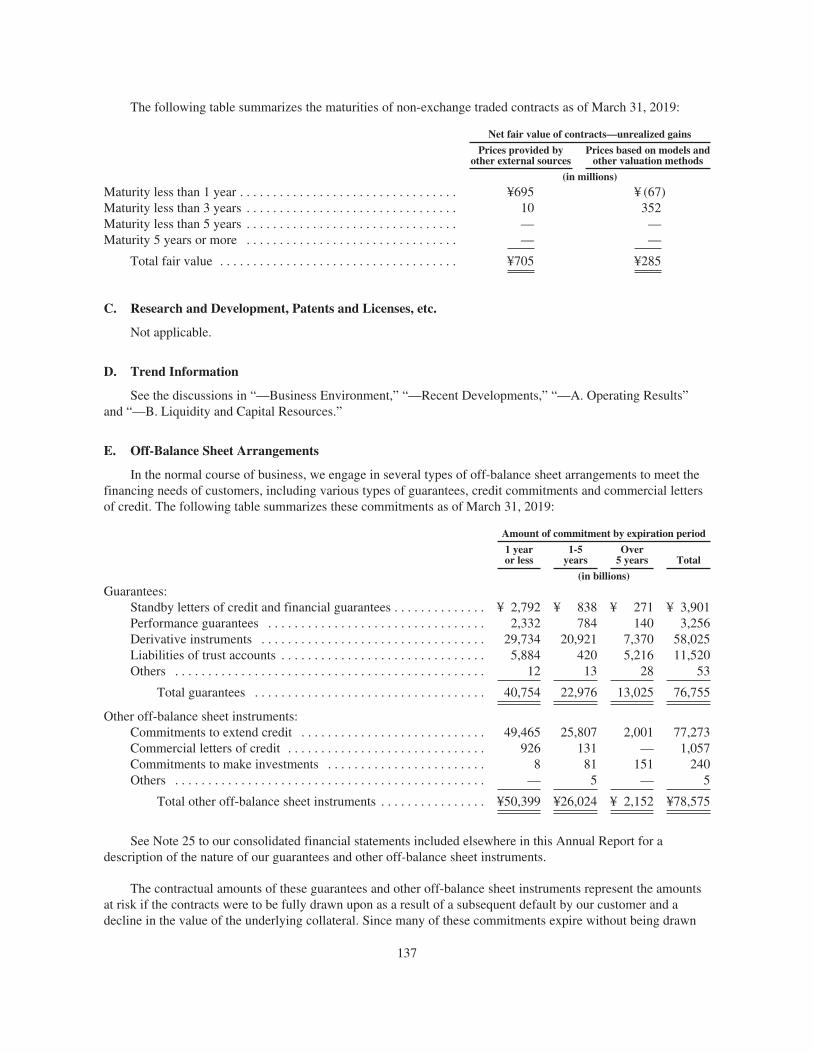
The following table summarizes the maturities of non-exchange traded contracts as of March 31, 2019:
Net fair value of contracts—unrealized gains
Prices provided byother external sources
Prices based on models andother valuation methods
(in millions)
Maturity less than 1 year . . . . . . . . . . . . . . . . . . . . . . . . . . . . . . . . . ¥695 ¥ (67)Maturity less than 3 years . . . . . . . . . . . . . . . . . . . . . . . . . . . . . . . . 10 352Maturity less than 5 years . . . . . . . . . . . . . . . . . . . . . . . . . . . . . . . . — —Maturity 5 years or more . . . . . . . . . . . . . . . . . . . . . . . . . . . . . . . . — —
Total fair value . . . . . . . . . . . . . . . . . . . . . . . . . . . . . . . . . . . . ¥705 ¥285
C. Research and Development, Patents and Licenses, etc.
Not applicable.
D. Trend Information
See the discussions in “—Business Environment,” “—Recent Developments,” “—A. Operating Results”and “—B. Liquidity and Capital Resources.”
E. Off-Balance Sheet Arrangements
In the normal course of business, we engage in several types of off-balance sheet arrangements to meet thefinancing needs of customers, including various types of guarantees, credit commitments and commercial lettersof credit. The following table summarizes these commitments as of March 31, 2019:
Amount of commitment by expiration period
1 yearor less
1-5years
Over5 years Total
(in billions)
Guarantees:Standby letters of credit and financial guarantees . . . . . . . . . . . . . . ¥ 2,792 ¥ 838 ¥ 271 ¥ 3,901Performance guarantees . . . . . . . . . . . . . . . . . . . . . . . . . . . . . . . . . 2,332 784 140 3,256Derivative instruments . . . . . . . . . . . . . . . . . . . . . . . . . . . . . . . . . . 29,734 20,921 7,370 58,025Liabilities of trust accounts . . . . . . . . . . . . . . . . . . . . . . . . . . . . . . . 5,884 420 5,216 11,520Others . . . . . . . . . . . . . . . . . . . . . . . . . . . . . . . . . . . . . . . . . . . . . . . 12 13 28 53
Total guarantees . . . . . . . . . . . . . . . . . . . . . . . . . . . . . . . . . . . 40,754 22,976 13,025 76,755
Other off-balance sheet instruments:Commitments to extend credit . . . . . . . . . . . . . . . . . . . . . . . . . . . . 49,465 25,807 2,001 77,273Commercial letters of credit . . . . . . . . . . . . . . . . . . . . . . . . . . . . . . 926 131 — 1,057Commitments to make investments . . . . . . . . . . . . . . . . . . . . . . . . 8 81 151 240Others . . . . . . . . . . . . . . . . . . . . . . . . . . . . . . . . . . . . . . . . . . . . . . . — 5 — 5
Total other off-balance sheet instruments . . . . . . . . . . . . . . . . ¥50,399 ¥26,024 ¥ 2,152 ¥78,575
See Note 25 to our consolidated financial statements included elsewhere in this Annual Report for adescription of the nature of our guarantees and other off-balance sheet instruments.
The contractual amounts of these guarantees and other off-balance sheet instruments represent the amountsat risk if the contracts were to be fully drawn upon as a result of a subsequent default by our customer and adecline in the value of the underlying collateral. Since many of these commitments expire without being drawn
137

upon, the total contractual or notional amounts of these commitments do not necessarily represent our future cashrequirements. As of March 31, 2019, approximately 58% of these commitments have an expiration date withinone year, 32% have an expiration date from one year to five years, and 10% have an expiration date after fiveyears. Risks relating to off-balance sheet instruments are monitored and managed as a part of our riskmanagement system as set forth in “Item 11. Quantitative and Qualitative Disclosures about Credit, Market andOther Risk.” We evaluate off-balance sheet arrangements in the manner described in Note 1 to our consolidatedfinancial statements included elsewhere in this Annual Report.
The fees generated specifically from off-balance sheet arrangements are not a dominant source of ouroverall fees and commissions.
Some of our off-balance sheet arrangements are related to activities of special purpose entities, most ofwhich are VIEs. For further information, see Note 26 to our consolidated financial statements included elsewherein this Annual Report.
F. Tabular Disclosure of Contractual Obligations
The following table shows a summary of our contractual obligations outstanding as of March 31, 2019:
Payments due by period
Less than1 year
1-3years
3-5years
Over5 years Total
(in billions)
Contractual obligations:Time deposit obligations . . . . . . . . . . . . . . . . . . . . . . . . . . . . . . . ¥56,911 ¥ 9,174 ¥1,283 ¥ 866 ¥68,234Estimated interest expense on time deposit obligations(1) . . . . . . 226 30 4 1 261Long-term debt obligations . . . . . . . . . . . . . . . . . . . . . . . . . . . . . 3,048 14,183 2,981 7,771 27,983Capital lease obligations . . . . . . . . . . . . . . . . . . . . . . . . . . . . . . . 6 10 4 3 23Operating lease obligations . . . . . . . . . . . . . . . . . . . . . . . . . . . . . 94 150 107 271 622Purchase obligations . . . . . . . . . . . . . . . . . . . . . . . . . . . . . . . . . . . 66 93 79 58 296
Total(2)(3) . . . . . . . . . . . . . . . . . . . . . . . . . . . . . . . . . . . . . . . . ¥60,351 ¥23,640 ¥4,458 ¥8,970 ¥97,419
Notes:(1) Contractual obligations related to estimated interest expense on time deposit obligations are calculated by applying the March 31, 2019
weighted-average interest rate on outstanding time deposits.(2) The total amount of expected future pension payments is not included in the above table or the total amount of commitments outstanding
as of March 31, 2019. We expect to contribute approximately ¥33.9 billion for pension and other benefits for our employees for the fiscalyear ending March 31, 2020. For further information, see Note 13 to our consolidated financial statements included elsewhere in thisAnnual Report.
(3) The above table does not include unrecognized tax benefits and interest and penalties related to income tax associated with the guidanceon accounting for uncertainty in income taxes as we cannot estimate reasonably the timing of cash settlement of the liabilities forunrecognized tax benefits. The total amount of the liabilities for unrecognized tax benefits is ¥19.2 billion as of March 31, 2019. Amongthe liabilities for unrecognized tax benefits, it is reasonably possible that the unrecognized tax benefits will decrease by approximately¥2.6 billion during the next twelve months. For further information, see Note 7 to our consolidated financial statements includedelsewhere in this Annual Report.
Purchase obligations include any legally binding contractual obligations that require us to spend more than¥100 million annually under the contract. Purchase obligations in the table primarily include commitments tomake investments into corporate recovery or private equity investment funds.
G. Safe Harbor
See the discussion under “Forward-Looking Statements.”
138

Item 6. Directors, Senior Management and Employees.
A. Directors and Senior Management
Members of the Board of Directors
The following table sets forth the members of our board of directors as of July 1, 2019, together with theirrespective dates of birth, positions and experience:
Name(Date of Birth) Position in MUFG Business Experience
Mariko Fujii(March 9, 1955)
Member of the Boardof Directors
(Outside Director)
April 1977 Joined Ministry of FinanceJuly 1997 Director, International Affairs and Research
Division, Customs and Tariff BureauApril 1999 Associate Professor, Research Center for
Advanced Science and Technology, TheUniversity of Tokyo
March 2001 Professor, Research Center for AdvancedEconomic Engineering, The University ofTokyo
April 2004 Professor, Research Center for AdvancedScience and Technology, National UniversityCorporation, The University of Tokyo
June 2014 Outside director of Electric Power DevelopmentCo., Ltd.
October 2015 Resigned from Professor of The University ofTokyo
Resigned from an Outside director of ElectricPower Development Co., Ltd.
Ambassador Extraordinary and Plenipotentiaryof Japan to Latvia
January 2019 Retired from Ambassador Extraordinary andPlenipotentiary of Japan to Latvia
June 2019 Outside director of NTT DATACORPORATION (incumbent)
Member of the Board of Directors (Outsidedirector) of MUFG (incumbent)
Kaoru Kato(May 20, 1951)
Member of the Boardof Directors
(Outside Director)
April 1977 Joined Nippon Telegraph and Telephone PublicCorporation (NTT)
July 1999 General Manager of Plant Department of NTTKansai Mobile Communications Network,Inc.
April 2000 General Manager of Plant Department of NTTDoCoMo Kansai, Inc.
June 2002 General Manager of Corporate Strategy andPlanning Department, Member of the Boardof Directors of NTT DoCoMo Kansai, Inc
July 2005 Representative Director and Senior CorporateExecutive Officer of Sumitomo Mitsui CardCo., Ltd.
July 2007 Executive Vice President, General Manager ofCorporate Strategy and Planning Department,Member of the Board of Directors of NTTDoCoMo Kansai, Inc.
139
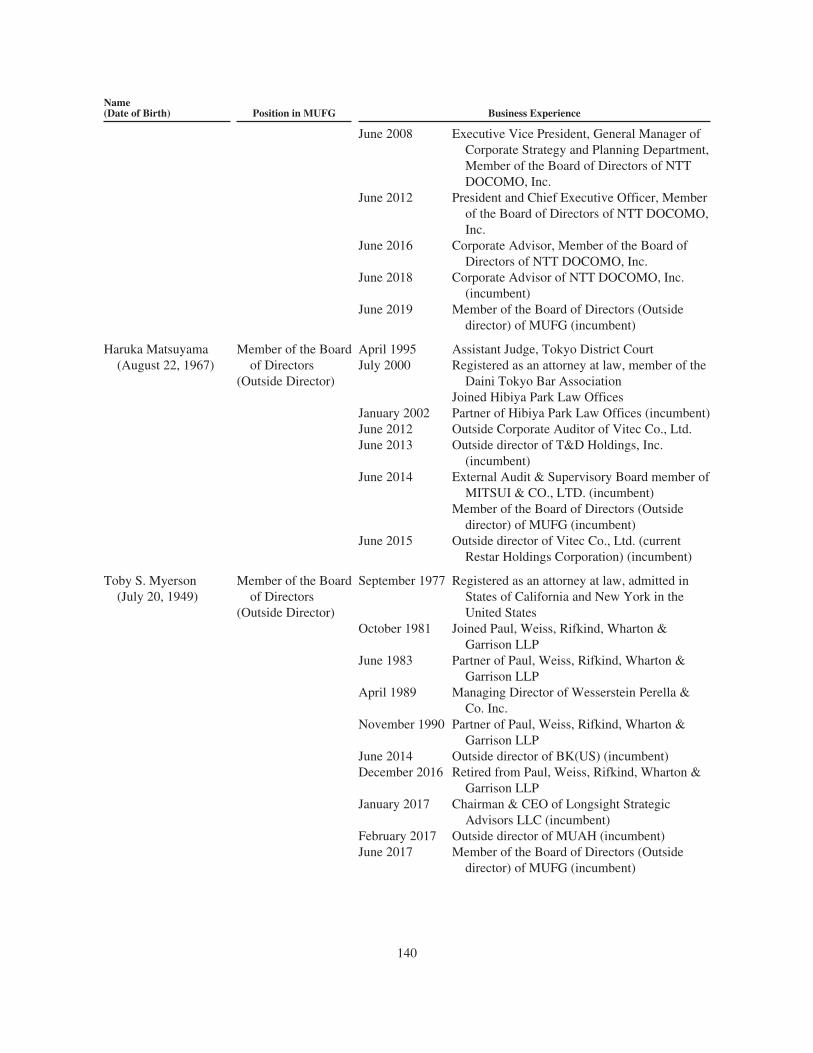
Name(Date of Birth) Position in MUFG Business Experience
June 2008 Executive Vice President, General Manager ofCorporate Strategy and Planning Department,Member of the Board of Directors of NTTDOCOMO, Inc.
June 2012 President and Chief Executive Officer, Memberof the Board of Directors of NTT DOCOMO,Inc.
June 2016 Corporate Advisor, Member of the Board ofDirectors of NTT DOCOMO, Inc.
June 2018 Corporate Advisor of NTT DOCOMO, Inc.(incumbent)
June 2019 Member of the Board of Directors (Outsidedirector) of MUFG (incumbent)
Haruka Matsuyama(August 22, 1967)
Member of the Boardof Directors
(Outside Director)
April 1995 Assistant Judge, Tokyo District CourtJuly 2000 Registered as an attorney at law, member of the
Daini Tokyo Bar AssociationJoined Hibiya Park Law Offices
January 2002 Partner of Hibiya Park Law Offices (incumbent)June 2012 Outside Corporate Auditor of Vitec Co., Ltd.June 2013 Outside director of T&D Holdings, Inc.
(incumbent)June 2014 External Audit & Supervisory Board member of
MITSUI & CO., LTD. (incumbent)Member of the Board of Directors (Outside
director) of MUFG (incumbent)June 2015 Outside director of Vitec Co., Ltd. (current
Restar Holdings Corporation) (incumbent)
Toby S. Myerson(July 20, 1949)
Member of the Boardof Directors
(Outside Director)
September 1977 Registered as an attorney at law, admitted inStates of California and New York in theUnited States
October 1981 Joined Paul, Weiss, Rifkind, Wharton &Garrison LLP
June 1983 Partner of Paul, Weiss, Rifkind, Wharton &Garrison LLP
April 1989 Managing Director of Wesserstein Perella &Co. Inc.
November 1990 Partner of Paul, Weiss, Rifkind, Wharton &Garrison LLP
June 2014 Outside director of BK(US) (incumbent)December 2016 Retired from Paul, Weiss, Rifkind, Wharton &
Garrison LLPJanuary 2017 Chairman & CEO of Longsight Strategic
Advisors LLC (incumbent)February 2017 Outside director of MUAH (incumbent)June 2017 Member of the Board of Directors (Outside
director) of MUFG (incumbent)
140

Name(Date of Birth) Position in MUFG Business Experience
Hirofumi Nomoto(September 27, 1947)
Member of the Boardof Directors
(Outside Director)
April 1971 Joined Tokyu CorporationApril 2003 Executive General Manager of Media Business
Headquarters of Tokyu CorporationApril 2004 President & Representative Director of its
communications Inc.June 2007 Director of Tokyu Corporation
Executive Officer of Real Estate DevelopmentBusiness Unit of Tokyu Corporation
January 2008 Managing Director of Tokyu CorporationJune 2008 Senior Managing Director of Tokyu
CorporationApril 2010 Executive Officer & Senior Executive General
Manager of Urban Life Produce BusinessUnit of Tokyu Corporation
June 2010 Senior Managing Director & RepresentativeDirector of Tokyu Corporation
April 2011 President & Representative Director of TokyuCorporation
April 2018 Chairman & Representative Director of TokyuCorporation (incumbent)
June 2019 Member of the Board of Directors (Outsidedirector) of MUFG (incumbent)
Tsutomu Okuda(October 14, 1939)
Member of the Boardof Directors
(Outside Director)
April 1964 Joined The Daimaru, Inc.September 1991 Managing Director of Daimaru Australia
Pty. Ltd.May 1995 Director of The Daimaru, Inc.May 1996 Managing Director of The Daimaru, Inc.March 1997 President of The Daimaru, Inc.May 2003 Chairman & CEO of The Daimaru, Inc.September 2007 Chairman of The Daimaru, Inc.
President and Chief Executive Officer of J.Front Retailing Co., Ltd.
March 2010 Chairman and Chief Executive Officer of J.Front Retailing Co., Ltd.
April 2013 Director and Senior Advisor of J. FrontRetailing Co., Ltd.
May 2014 Senior Advisor of J. Front Retailing Co., Ltd.June 2014 Member of the Board of Directors (Outside
director) of MUFG (incumbent)May 2018 Special Advisor of J. Front Retailing Co., Ltd.
(incumbent)
Yasushi Shingai(January 11, 1956)
Member of the Boardof Directors
(Outside Director)
April 1980 Joined Japan Tobacco and Salt PublicCorporation (current Japan Tobacco Inc.)
July 2001 Vice President of Financial Planning Divisionof Japan Tobacco Inc.
June 2004 Senior Vice President, Head of Finance Groupof Japan Tobacco Inc.
July 2004 Senior Vice President, Chief Financial Officerof Japan Tobacco Inc.
141

Name(Date of Birth) Position in MUFG Business Experience
June 2005 Member of the Board, Senior Vice President,and Chief Financial Officer of Japan TobaccoInc.
June 2006 Member of the Board of Japan Tobacco Inc.,Executive Vice President and Deputy CEO of
JT International S.A.June 2011 Representative Director and Executive Vice
President of Japan Tobacco Inc.June 2014 External Board Director of Recruit Holdings
Co., Ltd.January 2018 Member of the Board of Japan Tobacco Inc.March 2018 Outside Director of Asahi Group Holdings, Ltd.
(incumbent)June 2018 Member of the Board of Directors (Outside
director) of MUFG (incumbent)June 2019 Outside director of Dai-ichi Life Holdings, Inc.
(incumbent)
Tarisa Watanagase(November 30, 1949)
Member of the Boardof Directors
(Outside Director)
June 1975 Joined the Bank of ThailandJanuary 1988 Economist, International Monetary Fund (On
the Secondment)October 2002 Deputy Governor of the Bank of ThailandNovember 2006 Governor of the Bank of ThailandSeptember 2010 Retired from the Bank of ThailandMarch 2013 Outside director of the Siam Cement Public
Company Limited (incumbent)June 2017 Member of the Board of Directors (Outside
director) of MUFG (incumbent)
Akira Yamate(November 23, 1952)
Member of the Boardof Directors
(Outside Director)
November 1977 Joined Price, Waterhouse & Co. JapanMarch 1983 Registered as Certified Public Accountant in
JapanJuly 1991 Representative Partner of Aoyama Audit
CorporationPartner of Price Waterhouse
April 2000 Representative Partner of Chuo Aoyama AuditCorporation
Partner of PricewaterhouseCoopersSeptember 2006 Representative Partner of
PricewaterhouseCoopers AarataJune 2013 Resigned from PricewaterhouseCoopers Aarata
External Audit & Supervisory Board member ofNomura Real Estate Holdings, Inc.
External Audit & Supervisory Board member ofNomura Real Estate Development, Co., Ltd.
June 2015 Retired from External Audit & SupervisoryBoard member of Nomura Real EstateDevelopment, Co., Ltd.
Member of the Board of Directors (Outsidedirector) of MUFG (incumbent)
142
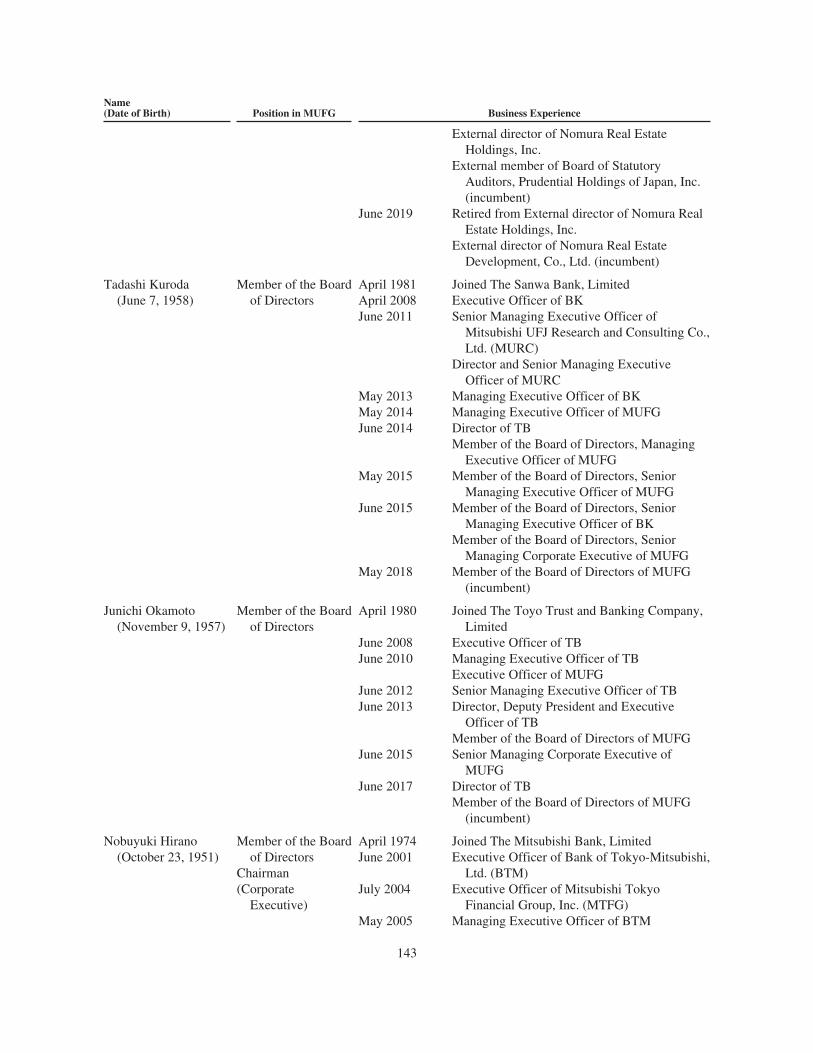
Name(Date of Birth) Position in MUFG Business Experience
External director of Nomura Real EstateHoldings, Inc.
External member of Board of StatutoryAuditors, Prudential Holdings of Japan, Inc.(incumbent)
June 2019 Retired from External director of Nomura RealEstate Holdings, Inc.
External director of Nomura Real EstateDevelopment, Co., Ltd. (incumbent)
Tadashi Kuroda(June 7, 1958)
Member of the Boardof Directors
April 1981 Joined The Sanwa Bank, LimitedApril 2008 Executive Officer of BKJune 2011 Senior Managing Executive Officer of
Mitsubishi UFJ Research and Consulting Co.,Ltd. (MURC)
Director and Senior Managing ExecutiveOfficer of MURC
May 2013 Managing Executive Officer of BKMay 2014 Managing Executive Officer of MUFGJune 2014 Director of TB
Member of the Board of Directors, ManagingExecutive Officer of MUFG
May 2015 Member of the Board of Directors, SeniorManaging Executive Officer of MUFG
June 2015 Member of the Board of Directors, SeniorManaging Executive Officer of BK
Member of the Board of Directors, SeniorManaging Corporate Executive of MUFG
May 2018 Member of the Board of Directors of MUFG(incumbent)
Junichi Okamoto(November 9, 1957)
Member of the Boardof Directors
April 1980 Joined The Toyo Trust and Banking Company,Limited
June 2008 Executive Officer of TBJune 2010 Managing Executive Officer of TB
Executive Officer of MUFGJune 2012 Senior Managing Executive Officer of TBJune 2013 Director, Deputy President and Executive
Officer of TBMember of the Board of Directors of MUFG
June 2015 Senior Managing Corporate Executive ofMUFG
June 2017 Director of TBMember of the Board of Directors of MUFG
(incumbent)
Nobuyuki Hirano(October 23, 1951)
Member of the Boardof Directors
Chairman(Corporate
Executive)
April 1974 Joined The Mitsubishi Bank, LimitedJune 2001 Executive Officer of Bank of Tokyo-Mitsubishi,
Ltd. (BTM)July 2004 Executive Officer of Mitsubishi Tokyo
Financial Group, Inc. (MTFG)May 2005 Managing Executive Officer of BTM
143
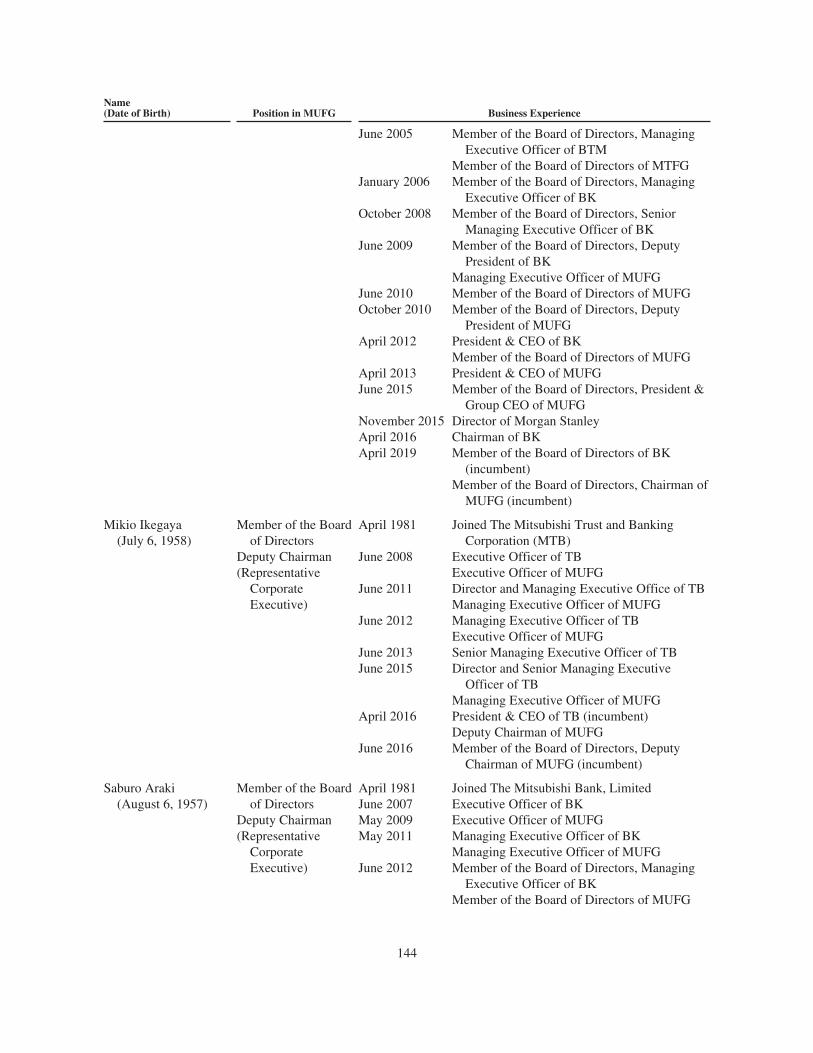
Name(Date of Birth) Position in MUFG Business Experience
June 2005 Member of the Board of Directors, ManagingExecutive Officer of BTM
Member of the Board of Directors of MTFGJanuary 2006 Member of the Board of Directors, Managing
Executive Officer of BKOctober 2008 Member of the Board of Directors, Senior
Managing Executive Officer of BKJune 2009 Member of the Board of Directors, Deputy
President of BKManaging Executive Officer of MUFG
June 2010 Member of the Board of Directors of MUFGOctober 2010 Member of the Board of Directors, Deputy
President of MUFGApril 2012 President & CEO of BK
Member of the Board of Directors of MUFGApril 2013 President & CEO of MUFGJune 2015 Member of the Board of Directors, President &
Group CEO of MUFGNovember 2015 Director of Morgan StanleyApril 2016 Chairman of BKApril 2019 Member of the Board of Directors of BK
(incumbent)Member of the Board of Directors, Chairman of
MUFG (incumbent)
Mikio Ikegaya(July 6, 1958)
Member of the Boardof Directors
Deputy Chairman(Representative
CorporateExecutive)
April 1981 Joined The Mitsubishi Trust and BankingCorporation (MTB)
June 2008 Executive Officer of TBExecutive Officer of MUFG
June 2011 Director and Managing Executive Office of TBManaging Executive Officer of MUFG
June 2012 Managing Executive Officer of TBExecutive Officer of MUFG
June 2013 Senior Managing Executive Officer of TBJune 2015 Director and Senior Managing Executive
Officer of TBManaging Executive Officer of MUFG
April 2016 President & CEO of TB (incumbent)Deputy Chairman of MUFG
June 2016 Member of the Board of Directors, DeputyChairman of MUFG (incumbent)
Saburo Araki(August 6, 1957)
Member of the Boardof Directors
Deputy Chairman(Representative
CorporateExecutive)
April 1981 Joined The Mitsubishi Bank, LimitedJune 2007 Executive Officer of BKMay 2009 Executive Officer of MUFGMay 2011 Managing Executive Officer of BK
Managing Executive Officer of MUFGJune 2012 Member of the Board of Directors, Managing
Executive Officer of BKMember of the Board of Directors of MUFG
144
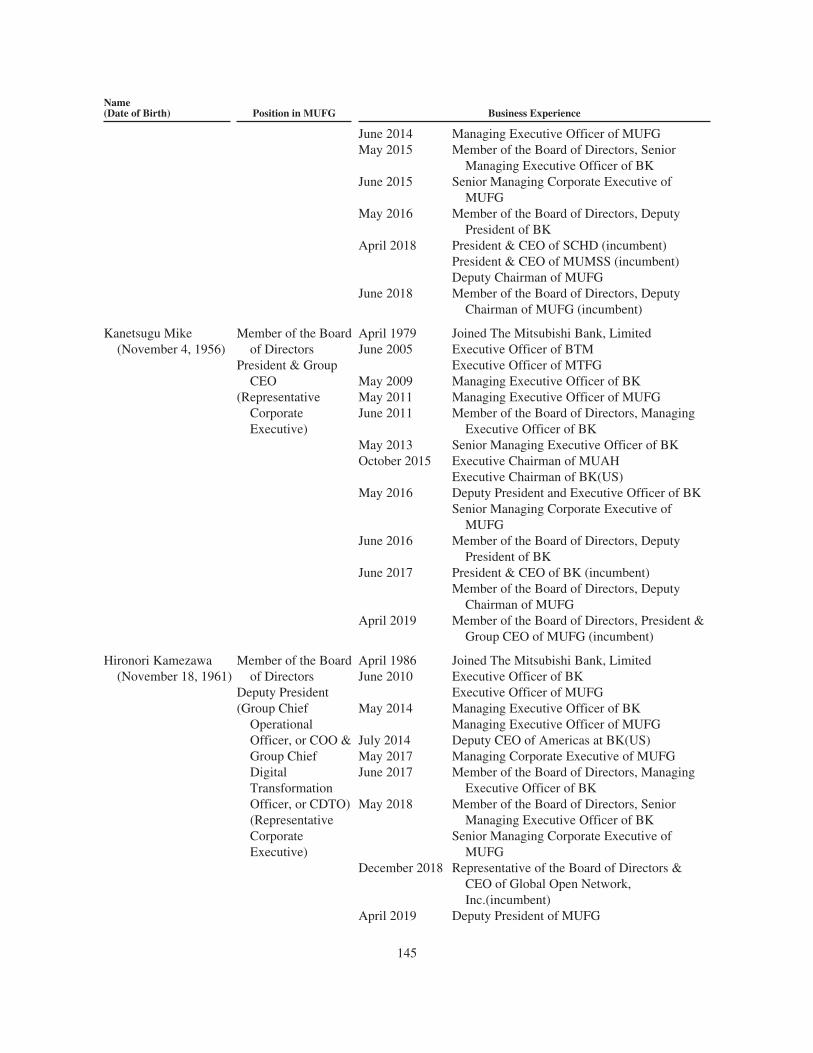
Name(Date of Birth) Position in MUFG Business Experience
June 2014 Managing Executive Officer of MUFGMay 2015 Member of the Board of Directors, Senior
Managing Executive Officer of BKJune 2015 Senior Managing Corporate Executive of
MUFGMay 2016 Member of the Board of Directors, Deputy
President of BKApril 2018 President & CEO of SCHD (incumbent)
President & CEO of MUMSS (incumbent)Deputy Chairman of MUFG
June 2018 Member of the Board of Directors, DeputyChairman of MUFG (incumbent)
Kanetsugu Mike(November 4, 1956)
Member of the Boardof Directors
President & GroupCEO
(RepresentativeCorporateExecutive)
April 1979 Joined The Mitsubishi Bank, LimitedJune 2005 Executive Officer of BTM
Executive Officer of MTFGMay 2009 Managing Executive Officer of BKMay 2011 Managing Executive Officer of MUFGJune 2011 Member of the Board of Directors, Managing
Executive Officer of BKMay 2013 Senior Managing Executive Officer of BKOctober 2015 Executive Chairman of MUAH
Executive Chairman of BK(US)May 2016 Deputy President and Executive Officer of BK
Senior Managing Corporate Executive ofMUFG
June 2016 Member of the Board of Directors, DeputyPresident of BK
June 2017 President & CEO of BK (incumbent)Member of the Board of Directors, Deputy
Chairman of MUFGApril 2019 Member of the Board of Directors, President &
Group CEO of MUFG (incumbent)
Hironori Kamezawa(November 18, 1961)
Member of the Boardof Directors
Deputy President(Group Chief
OperationalOfficer, or COO &Group ChiefDigitalTransformationOfficer, or CDTO)(RepresentativeCorporateExecutive)
April 1986 Joined The Mitsubishi Bank, LimitedJune 2010 Executive Officer of BK
Executive Officer of MUFGMay 2014 Managing Executive Officer of BK
Managing Executive Officer of MUFGJuly 2014 Deputy CEO of Americas at BK(US)May 2017 Managing Corporate Executive of MUFGJune 2017 Member of the Board of Directors, Managing
Executive Officer of BKMay 2018 Member of the Board of Directors, Senior
Managing Executive Officer of BKSenior Managing Corporate Executive of
MUFGDecember 2018 Representative of the Board of Directors &
CEO of Global Open Network,Inc.(incumbent)
April 2019 Deputy President of MUFG
145
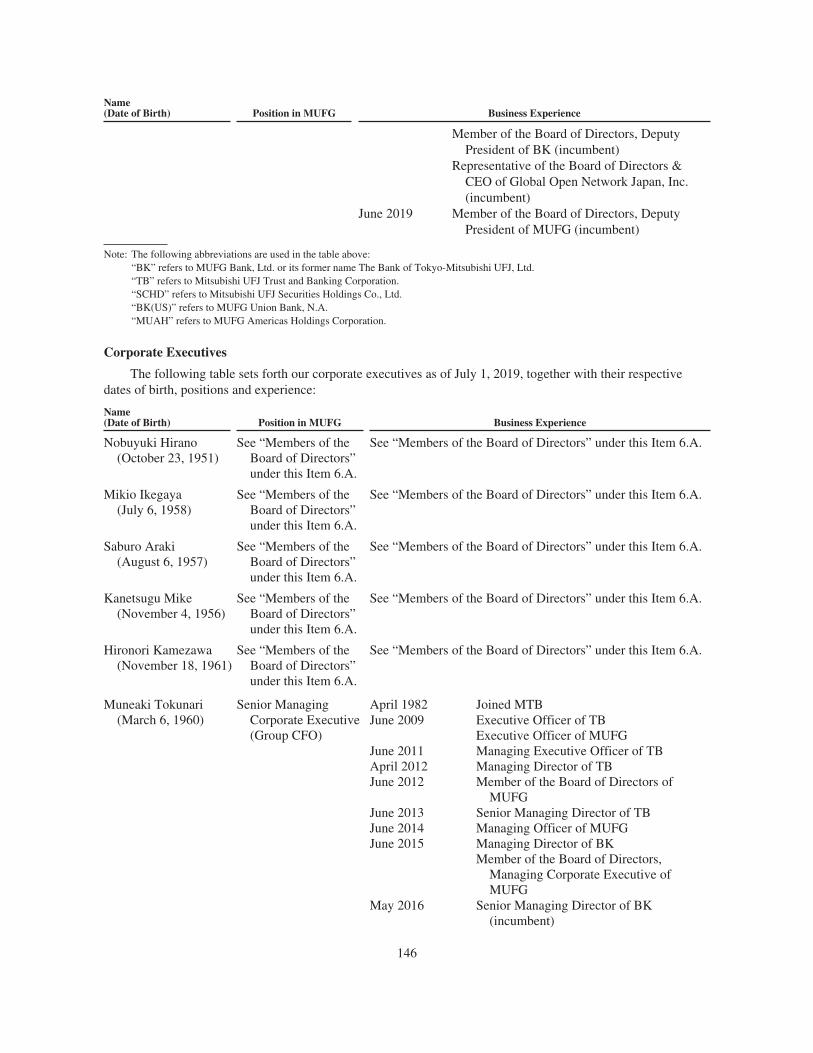
Name(Date of Birth) Position in MUFG Business Experience
Member of the Board of Directors, DeputyPresident of BK (incumbent)
Representative of the Board of Directors &CEO of Global Open Network Japan, Inc.(incumbent)
June 2019 Member of the Board of Directors, DeputyPresident of MUFG (incumbent)
Note: The following abbreviations are used in the table above:“BK” refers to MUFG Bank, Ltd. or its former name The Bank of Tokyo-Mitsubishi UFJ, Ltd.“TB” refers to Mitsubishi UFJ Trust and Banking Corporation.“SCHD” refers to Mitsubishi UFJ Securities Holdings Co., Ltd.“BK(US)” refers to MUFG Union Bank, N.A.“MUAH” refers to MUFG Americas Holdings Corporation.
Corporate Executives
The following table sets forth our corporate executives as of July 1, 2019, together with their respectivedates of birth, positions and experience:
Name(Date of Birth) Position in MUFG Business Experience
Nobuyuki Hirano(October 23, 1951)
See “Members of theBoard of Directors”under this Item 6.A.
See “Members of the Board of Directors” under this Item 6.A.
Mikio Ikegaya(July 6, 1958)
See “Members of theBoard of Directors”under this Item 6.A.
See “Members of the Board of Directors” under this Item 6.A.
Saburo Araki(August 6, 1957)
See “Members of theBoard of Directors”under this Item 6.A.
See “Members of the Board of Directors” under this Item 6.A.
Kanetsugu Mike(November 4, 1956)
See “Members of theBoard of Directors”under this Item 6.A.
See “Members of the Board of Directors” under this Item 6.A.
Hironori Kamezawa(November 18, 1961)
See “Members of theBoard of Directors”under this Item 6.A.
See “Members of the Board of Directors” under this Item 6.A.
Muneaki Tokunari(March 6, 1960)
Senior ManagingCorporate Executive(Group CFO)
April 1982 Joined MTBJune 2009 Executive Officer of TB
Executive Officer of MUFGJune 2011 Managing Executive Officer of TBApril 2012 Managing Director of TBJune 2012 Member of the Board of Directors of
MUFGJune 2013 Senior Managing Director of TBJune 2014 Managing Officer of MUFGJune 2015 Managing Director of BK
Member of the Board of Directors,Managing Corporate Executive ofMUFG
May 2016 Senior Managing Director of BK(incumbent)
146
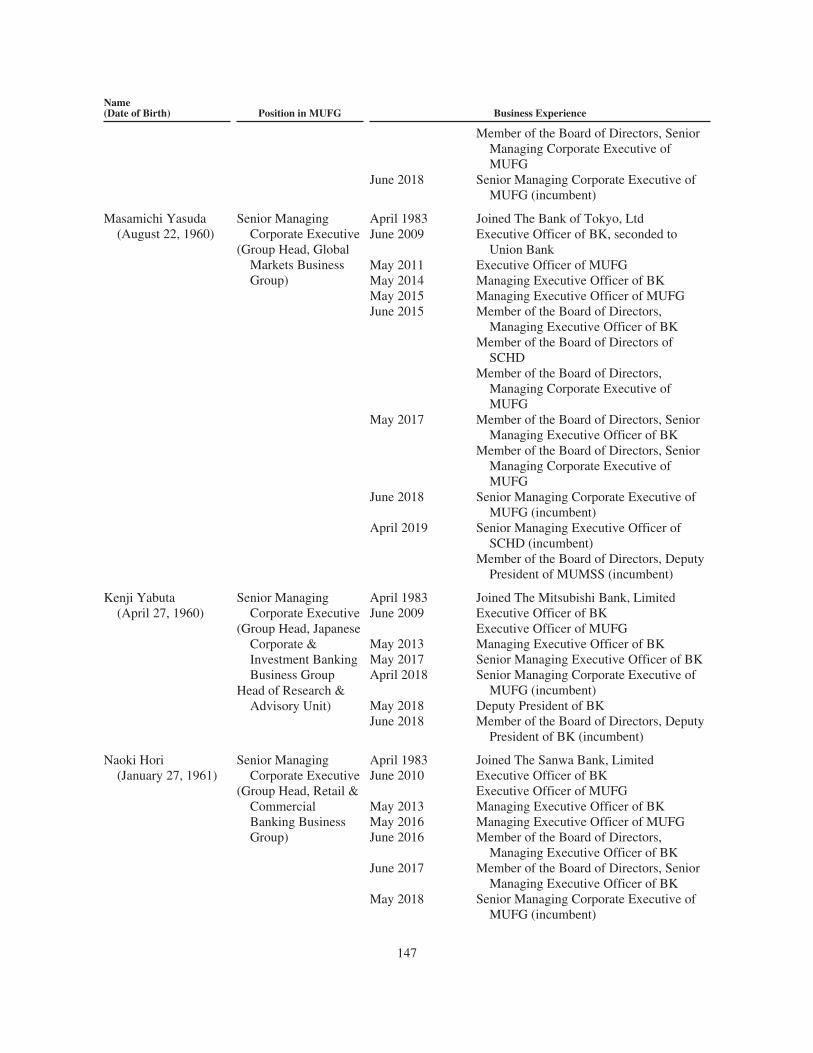
Name(Date of Birth) Position in MUFG Business Experience
Member of the Board of Directors, SeniorManaging Corporate Executive ofMUFG
June 2018 Senior Managing Corporate Executive ofMUFG (incumbent)
Masamichi Yasuda(August 22, 1960)
Senior ManagingCorporate Executive
(Group Head, GlobalMarkets BusinessGroup)
April 1983 Joined The Bank of Tokyo, LtdJune 2009 Executive Officer of BK, seconded to
Union BankMay 2011 Executive Officer of MUFGMay 2014 Managing Executive Officer of BKMay 2015 Managing Executive Officer of MUFGJune 2015 Member of the Board of Directors,
Managing Executive Officer of BKMember of the Board of Directors of
SCHDMember of the Board of Directors,
Managing Corporate Executive ofMUFG
May 2017 Member of the Board of Directors, SeniorManaging Executive Officer of BK
Member of the Board of Directors, SeniorManaging Corporate Executive ofMUFG
June 2018 Senior Managing Corporate Executive ofMUFG (incumbent)
April 2019 Senior Managing Executive Officer ofSCHD (incumbent)
Member of the Board of Directors, DeputyPresident of MUMSS (incumbent)
Kenji Yabuta(April 27, 1960)
Senior ManagingCorporate Executive
(Group Head, JapaneseCorporate &Investment BankingBusiness Group
Head of Research &Advisory Unit)
April 1983 Joined The Mitsubishi Bank, LimitedJune 2009 Executive Officer of BK
Executive Officer of MUFGMay 2013 Managing Executive Officer of BKMay 2017 Senior Managing Executive Officer of BKApril 2018 Senior Managing Corporate Executive of
MUFG (incumbent)May 2018 Deputy President of BKJune 2018 Member of the Board of Directors, Deputy
President of BK (incumbent)
Naoki Hori(January 27, 1961)
Senior ManagingCorporate Executive
(Group Head, Retail &CommercialBanking BusinessGroup)
April 1983 Joined The Sanwa Bank, LimitedJune 2010 Executive Officer of BK
Executive Officer of MUFGMay 2013 Managing Executive Officer of BKMay 2016 Managing Executive Officer of MUFGJune 2016 Member of the Board of Directors,
Managing Executive Officer of BKJune 2017 Member of the Board of Directors, Senior
Managing Executive Officer of BKMay 2018 Senior Managing Corporate Executive of
MUFG (incumbent)
147

Name(Date of Birth) Position in MUFG Business Experience
April 2019 Member of the Board of Directors, DeputyPresident of BK (incumbent)
Masato Miyachi(June 14, 1960)
Senior ManagingCorporate Executive
(Group Head, GlobalCorporate &Investment BankingBusiness Group)
April 1984 Joined The Bank of Tokyo, Ltd.June 2010 Executive Officer of BKMay 2014 Managing Executive Officer of BKOctober 2014 Managing Executive Officer of MUFGMay 2017 Chairman of MUAH (incumbent)
Chairman of BK(US) (incumbent)May 2018 Senior Managing Executive Officer of BKJune 2018 Member of the Board of Directors, Senior
Managing Executive Officer of BKJuly 2018 Senior Managing Corporate Executive of
MUFG (incumbent)April 2019 Member of the Board of Directors, Deputy
President of BK (incumbent)
Sunao Yokokawa(December 10, 1963)
Senior ManagingCorporate Executive
(Group Head, AssetManagement &Investor ServicesBusiness)
April 1986 Joined MTBJune 2012 Executive Officer of TBMay 2014 Executive Officer of MUFGJune 2015 Managing Executive Officer of TBJune 2017 Director and Managing Executive Officer
of TBManaging Corporate Executive of MUFG
April 2019 Director and Senior Managing ExecutiveOfficer of TB (incumbent)
Senior Managing Corporate Executive ofMUFG (incumbent)
Takayoshi Futae(January 16, 1961)
Senior ManagingCorporate Executive
(Group Head, GlobalCommercialBanking BusinessGroup
Group ChiefOperational Officer,or Group COO-I)
April 1983 Joined The Sanwa Bank, LimitedJune 2010 Executive Officer of The Bank of BKMay 2014 Managing Executive Officer of BKMay 2016 Managing Executive Officer of MUFGMay 2017 Senior Managing Executive Officer of BKApril 2019 Senior Managing Corporate Executive of
MUFGSenior Managing Executive Officer of
SCHD (incumbent)June 2019 Member of the Board of Directors, Senior
Managing Executive Officer of BK(incumbent)
Iwao Nagashima(March 15, 1963)
Senior ManagingCorporate Executive
(Group Chief HumanResource Officer, orGroup CHRO
Group Deputy ChiefDigitalTransformationOfficer, or GroupDeputy CDTO)
April 1985 Joined The Mitsubishi Trust and BankingCorporation
June 2011 Executive Officer of TBJune 2013 Managing Executive Officer of TB
Executive Officer of MUFGJune 2015 Director and Managing Executive Officer
of TBManaging Executive Officer of TB
June 2016 Director and Senior Managing ExecutiveOfficer of TB
148

Name(Date of Birth) Position in MUFG Business Experience
April 2019 Director, Deputy President, and ExecutiveOfficer of TB (incumbent)
Senior Managing Corporate Executive ofMUFG (incumbent)
President & CEO of MU Trust ApplePlanning Company, Ltd. (incumbent)
Naomi Hayashi(March 16, 1965)
Managing CorporateExecutive
(Group CSOin charge of Corporate
Planning Division(excluding Budget &ResourcesManagement andGlobal Business),CorporateAdministrationDivision andsub-charge ofDigitalTransformationDivision)
April 1987 Joined The Mitsubishi Bank, LimitedJune 2013 Executive Officer of BK
Executive Officer of MUFGJanuary 2017 Managing Executive Officer of BKMay 2018 Managing Corporate Executive of MUFG
(incumbent)June 2018 Member of the Board of Directors,
Managing Executive Officer of BK(incumbent)
Member of the Board of Directors ofSCHD (incumbent)
Junichi Hanzawa(January 19, 1965)
Managing CorporateExecutive
(Group ChiefCompliance Officer,or Group CCO)
April 1988 Joined The Mitsubishi Bank, LimitedJune 2014 Executive Officer of BK
Executive Officer of MUFGMay 2018 Managing Executive Officer of BKApril 2019 Managing Corporate Executive of MUFG
(incumbent)June 2019 Member of the Board of Directors,
Managing Executive Officer of BK(incumbent)
Hiroki Kameda(May 17, 1965)
Managing CorporateExecutive
(Group ChiefInformation Officer,or CIO
Group ChiefInformation SecurityOfficer, or CISO)
April 1988 Joined The Mitsubishi Bank, LimitedJune 2014 Executive Officer of BK
Executive Officer of MUFGJune 2018 President & CEO of Mitsubishi UFJ
Information Technology, Ltd.(incumbent)
April 2019 Managing Executive Officer of BKManaging Corporate Executive of MUFG
(incumbent)June 2019 Member of the Board of Directors,
Managing Executive Officer of BK(incumbent)
149
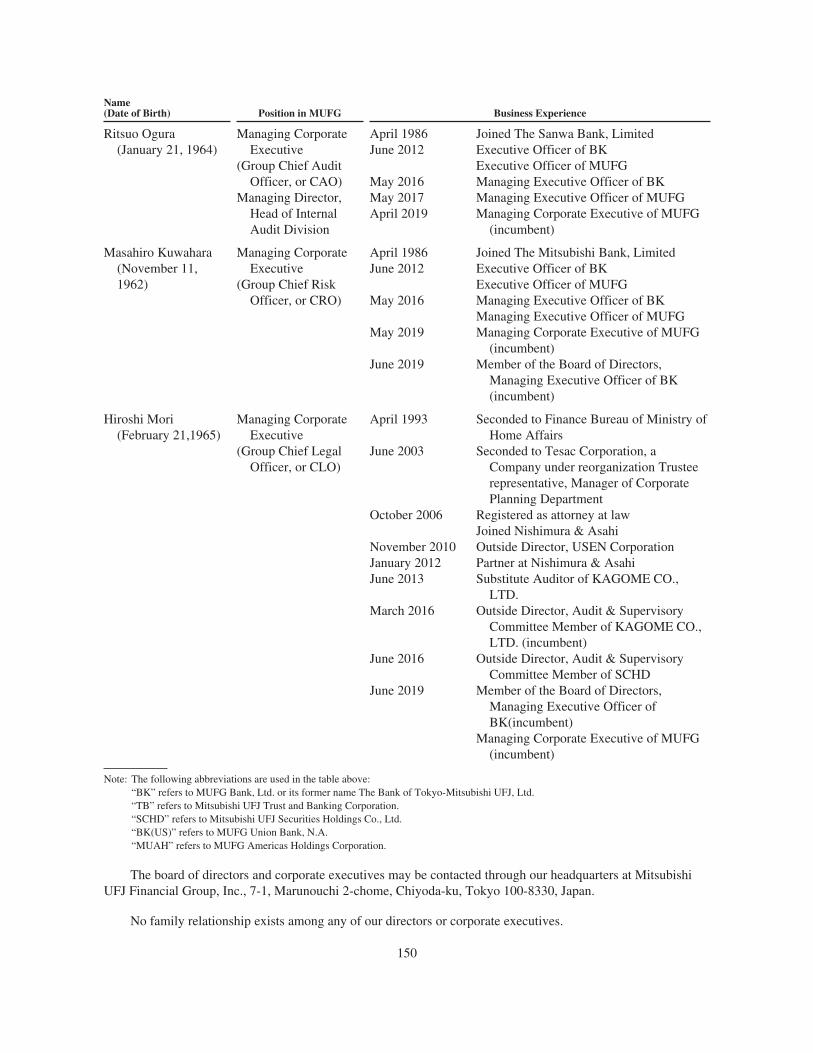
Name(Date of Birth) Position in MUFG Business Experience
Ritsuo Ogura(January 21, 1964)
Managing CorporateExecutive
(Group Chief AuditOfficer, or CAO)
Managing Director,Head of InternalAudit Division
April 1986 Joined The Sanwa Bank, LimitedJune 2012 Executive Officer of BK
Executive Officer of MUFGMay 2016 Managing Executive Officer of BKMay 2017 Managing Executive Officer of MUFGApril 2019 Managing Corporate Executive of MUFG
(incumbent)
Masahiro Kuwahara(November 11,1962)
Managing CorporateExecutive
(Group Chief RiskOfficer, or CRO)
April 1986 Joined The Mitsubishi Bank, LimitedJune 2012 Executive Officer of BK
Executive Officer of MUFGMay 2016 Managing Executive Officer of BK
Managing Executive Officer of MUFGMay 2019 Managing Corporate Executive of MUFG
(incumbent)June 2019 Member of the Board of Directors,
Managing Executive Officer of BK(incumbent)
Hiroshi Mori(February 21,1965)
Managing CorporateExecutive
(Group Chief LegalOfficer, or CLO)
April 1993 Seconded to Finance Bureau of Ministry ofHome Affairs
June 2003 Seconded to Tesac Corporation, aCompany under reorganization Trusteerepresentative, Manager of CorporatePlanning Department
October 2006 Registered as attorney at lawJoined Nishimura & Asahi
November 2010 Outside Director, USEN CorporationJanuary 2012 Partner at Nishimura & AsahiJune 2013 Substitute Auditor of KAGOME CO.,
LTD.March 2016 Outside Director, Audit & Supervisory
Committee Member of KAGOME CO.,LTD. (incumbent)
June 2016 Outside Director, Audit & SupervisoryCommittee Member of SCHD
June 2019 Member of the Board of Directors,Managing Executive Officer ofBK(incumbent)
Managing Corporate Executive of MUFG(incumbent)
Note: The following abbreviations are used in the table above:“BK” refers to MUFG Bank, Ltd. or its former name The Bank of Tokyo-Mitsubishi UFJ, Ltd.“TB” refers to Mitsubishi UFJ Trust and Banking Corporation.“SCHD” refers to Mitsubishi UFJ Securities Holdings Co., Ltd.“BK(US)” refers to MUFG Union Bank, N.A.“MUAH” refers to MUFG Americas Holdings Corporation.
The board of directors and corporate executives may be contacted through our headquarters at MitsubishiUFJ Financial Group, Inc., 7-1, Marunouchi 2-chome, Chiyoda-ku, Tokyo 100-8330, Japan.
No family relationship exists among any of our directors or corporate executives.
150
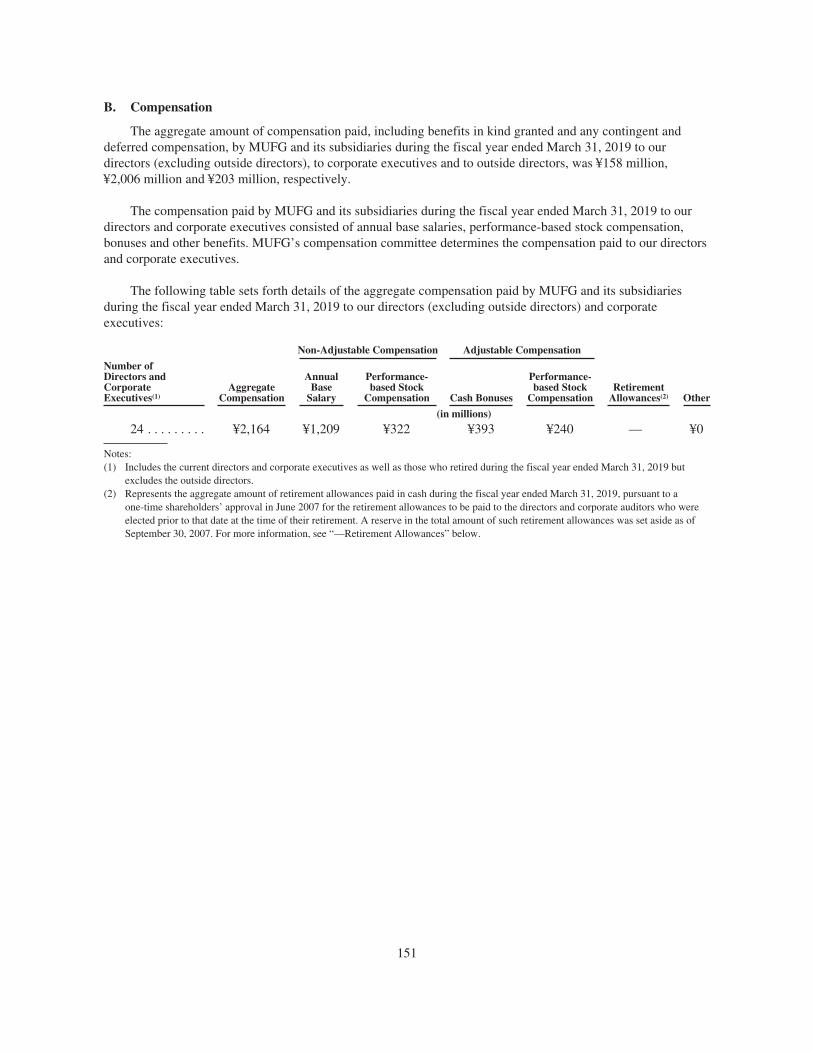
B. Compensation
The aggregate amount of compensation paid, including benefits in kind granted and any contingent anddeferred compensation, by MUFG and its subsidiaries during the fiscal year ended March 31, 2019 to ourdirectors (excluding outside directors), to corporate executives and to outside directors, was ¥158 million,¥2,006 million and ¥203 million, respectively.
The compensation paid by MUFG and its subsidiaries during the fiscal year ended March 31, 2019 to ourdirectors and corporate executives consisted of annual base salaries, performance-based stock compensation,bonuses and other benefits. MUFG’s compensation committee determines the compensation paid to our directorsand corporate executives.
The following table sets forth details of the aggregate compensation paid by MUFG and its subsidiariesduring the fiscal year ended March 31, 2019 to our directors (excluding outside directors) and corporateexecutives:
Non-Adjustable Compensation Adjustable Compensation
Number ofDirectors andCorporateExecutives(1)
AggregateCompensation
AnnualBase
Salary
Performance-based Stock
Compensation Cash Bonuses
Performance-based Stock
CompensationRetirement
Allowances(2) Other
(in millions)
24 . . . . . . . . . ¥2,164 ¥1,209 ¥322 ¥393 ¥240 — ¥0
Notes:(1) Includes the current directors and corporate executives as well as those who retired during the fiscal year ended March 31, 2019 but
excludes the outside directors.(2) Represents the aggregate amount of retirement allowances paid in cash during the fiscal year ended March 31, 2019, pursuant to a
one-time shareholders’ approval in June 2007 for the retirement allowances to be paid to the directors and corporate auditors who wereelected prior to that date at the time of their retirement. A reserve in the total amount of such retirement allowances was set aside as ofSeptember 30, 2007. For more information, see “—Retirement Allowances” below.
151
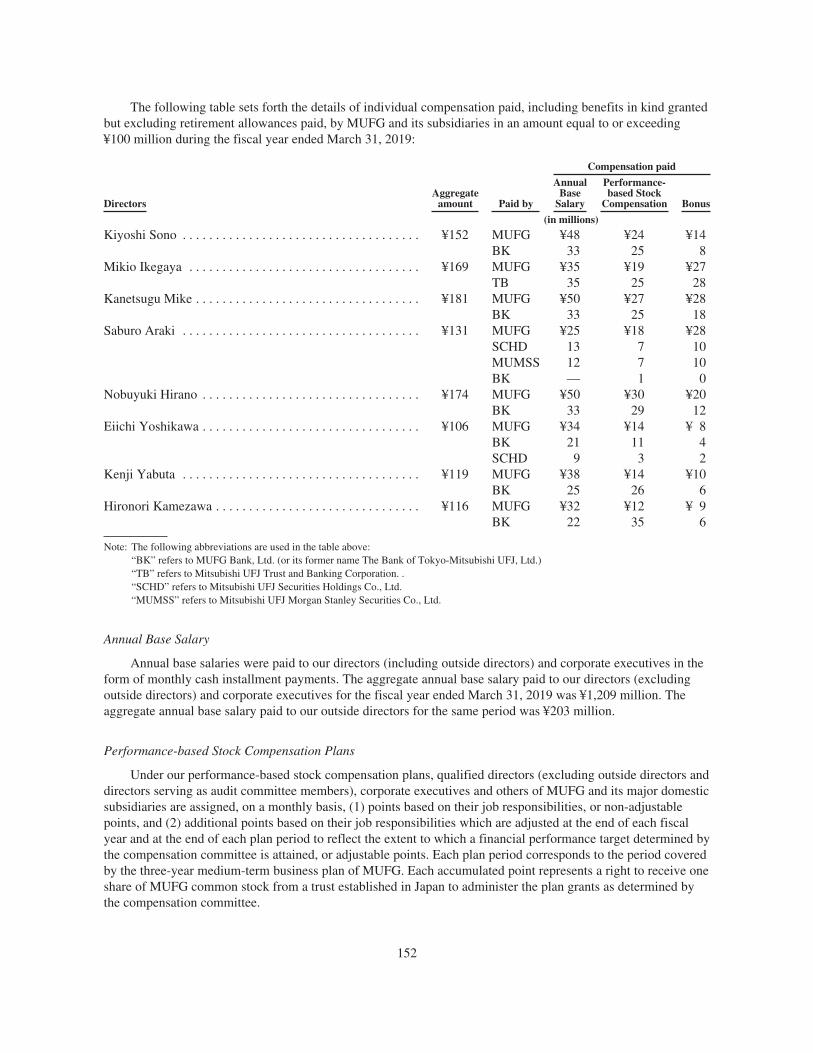
The following table sets forth the details of individual compensation paid, including benefits in kind grantedbut excluding retirement allowances paid, by MUFG and its subsidiaries in an amount equal to or exceeding¥100 million during the fiscal year ended March 31, 2019:
DirectorsAggregate
amount Paid by
Compensation paid
AnnualBase
Salary
Performance-based Stock
Compensation Bonus
(in millions)
Kiyoshi Sono . . . . . . . . . . . . . . . . . . . . . . . . . . . . . . . . . . . . ¥152 MUFG ¥48 ¥24 ¥14BK 33 25 8
Mikio Ikegaya . . . . . . . . . . . . . . . . . . . . . . . . . . . . . . . . . . . ¥169 MUFG ¥35 ¥19 ¥27TB 35 25 28
Kanetsugu Mike . . . . . . . . . . . . . . . . . . . . . . . . . . . . . . . . . . ¥181 MUFG ¥50 ¥27 ¥28BK 33 25 18
Saburo Araki . . . . . . . . . . . . . . . . . . . . . . . . . . . . . . . . . . . . ¥131 MUFG ¥25 ¥18 ¥28SCHD 13 7 10MUMSS 12 7 10BK — 1 0
Nobuyuki Hirano . . . . . . . . . . . . . . . . . . . . . . . . . . . . . . . . . ¥174 MUFG ¥50 ¥30 ¥20BK 33 29 12
Eiichi Yoshikawa . . . . . . . . . . . . . . . . . . . . . . . . . . . . . . . . . ¥106 MUFG ¥34 ¥14 ¥ 8BK 21 11 4SCHD 9 3 2
Kenji Yabuta . . . . . . . . . . . . . . . . . . . . . . . . . . . . . . . . . . . . ¥119 MUFG ¥38 ¥14 ¥10BK 25 26 6
Hironori Kamezawa . . . . . . . . . . . . . . . . . . . . . . . . . . . . . . . ¥116 MUFG ¥32 ¥12 ¥ 9BK 22 35 6
Note: The following abbreviations are used in the table above:“BK” refers to MUFG Bank, Ltd. (or its former name The Bank of Tokyo-Mitsubishi UFJ, Ltd.)“TB” refers to Mitsubishi UFJ Trust and Banking Corporation. .“SCHD” refers to Mitsubishi UFJ Securities Holdings Co., Ltd.“MUMSS” refers to Mitsubishi UFJ Morgan Stanley Securities Co., Ltd.
Annual Base Salary
Annual base salaries were paid to our directors (including outside directors) and corporate executives in theform of monthly cash installment payments. The aggregate annual base salary paid to our directors (excludingoutside directors) and corporate executives for the fiscal year ended March 31, 2019 was ¥1,209 million. Theaggregate annual base salary paid to our outside directors for the same period was ¥203 million.
Performance-based Stock Compensation Plans
Under our performance-based stock compensation plans, qualified directors (excluding outside directors anddirectors serving as audit committee members), corporate executives and others of MUFG and its major domesticsubsidiaries are assigned, on a monthly basis, (1) points based on their job responsibilities, or non-adjustablepoints, and (2) additional points based on their job responsibilities which are adjusted at the end of each fiscalyear and at the end of each plan period to reflect the extent to which a financial performance target determined bythe compensation committee is attained, or adjustable points. Each plan period corresponds to the period coveredby the three-year medium-term business plan of MUFG. Each accumulated point represents a right to receive oneshare of MUFG common stock from a trust established in Japan to administer the plan grants as determined bythe compensation committee.
152
The right to receive shares of MUFG common stock in exchange for non-adjustable points becomes vestedand nonforfeitable, and the shares are delivered, upon the grantee’s departure from his or her job responsibilitiesbased on which the right was granted. The right to receive shares of MUFG common stock in exchange foradjustable points becomes vested and nonforfeitable, and the shares are delivered, at the end of each plan period.The vesting in either case is subject to conditions imposed by the compensation committee, includingnon-engagement in misconduct. A portion of the shares subject to a grantee’s vested right may be delivered incash.
The grantees are entitled to “dividend equivalent credits” on their granted but unvested rights under the planwhen MUFG pays dividends to its shareholders. The credit is equal to the dividends that the grantees would havereceived on the shares had the shares been issued to the grantees in exchange for their granted but unvested rightsunder the plan, less expenses relating to the administration of the plan. Accumulated dividend equivalents arepaid to grantees at the time of the delivery of the shares.
The shares to be delivered to grantees are purchased on the open market by the trustee of the trust pursuantto a trust agreement among MUFG, the trustee and the independent caretaker of the trust. Each plan is funded incash up to a maximum aggregate amount determined by our compensation committee.
The initial performance-based stock compensation plan commenced on July 1, 2016. The grants under theplan were tied to MUFG’s previous medium-term business plan for the three-year period ended March 31, 2018.The trust for the plan was funded with ¥9.8 billion in cash, and 18,785,400 shares of MUFG common stock werepurchased by the trustee of the plan trust in May 2016. The plan was adopted after our compensation committeedecided in May 2016 to cease to provide any additional stock acquisition rights under our previous stock-basedcompensation structure and to introduce the performance-based stock compensation plan.
The second performance-based stock compensation plan commenced on December 1, 2016. The trust forthe plan was funded with 8.8 billion in cash, and an aggregate of 13,004,300 shares of MUFG common stockwere purchased by the trustee of the plan trust in November 2016 and May 2017. The plan was adopted toreplace the outstanding stock acquisition rights under our previous stock-based compensation structure. Upon theadoption of the plan, the stock acquisition rights that had been allotted to grantees but remained unexercisedunder the then-outstanding stock-based compensation plans were exchanged for points under the performance-based stock compensation plan, and the rights to receive shares of MUFG common stock represented by thesepoints were vested.
On May 15, 2018, the compensation committee approved new grants under the initial performance-basedstock compensation plan, which was amended in connection with the launch of MUFG’s current medium-termbusiness plan for the three-year period ending March 31, 2021. The trust period of the plan trust was extendeduntil August 31, 2021, and the maximum amount of funds to be contributed to the plan trust was reset at¥26.3 billion. The formula for determining adjustable points under the plan was also revised. In May 2018, theplan trust was funded with ¥9.6 billion in cash, and 13,049,600 shares of MUFG common stock were purchasedby the trustee of the plan trust.
For more information on the Performance-based Stock Compensation Plans, see Note 33 to our consolidatedfinancial statements included elsewhere in this Annual Report. See also “Item 16E. Purchases of EquitySecurities by the Issuer and Affiliated Purchasers.”
Stock-based Compensation Plans
We previously issued stock acquisition rights to further motivate our directors (excluding outside directors)and certain of our officers to contribute to the improvement of our stock prices and profits. The number of stockacquisition rights granted to each director and officer was determined by comprehensively taking into accounteach grantee’s seniority of the position held at MUFG or its subsidiaries, experience and contribution to our
153

performance throughout the period of the grantee’s service. On June 27, 2013, our shareholders approvedmodifications to the previous shareholder authorization for granting stock acquisition rights to our directors,corporate auditors and certain of our officers so that no outside directors or corporate auditors (including outsidecorporate auditors) would be eligible for any stock-based compensation plan adopted by the board of directors onor after that date.
In June 2015, our previous governance framework with the board of directors and a separate board ofcorporate auditors was replaced with our current governance framework with the board of directors and boardcommittees. Under our previous governance framework, the maximum aggregate amount of each type ofcompensation for our directors and corporate auditors was approved at a general meeting of our shareholders.The amount and allocation of compensation for each director were then proposed to, and voted upon by, theboard of directors. The amount and allocation of compensation for each corporate auditor were determinedthrough discussions and agreement among the corporate auditors. The nomination and compensation committeedeliberated and made proposals to the board of directors regarding matters relating to, among other things, thecompensation of our directors. For information regarding our governance framework, see “—C. BoardPractices.”
As part of our compensation structure, on June 29, 2010, the board of directors adopted another stock-basedcompensation plan entitled “Fourth Series of Stock Acquisition Rights of Mitsubishi UFJ Financial Group, Inc.”for our directors, corporate auditors and certain of our officers. Under the stock-based compensation plan, onJuly 16, 2010, we allotted an aggregate of 8,014 stock acquisition rights to our directors and an aggregate of1,149 stock acquisition rights to our corporate auditors for their respective services to MUFG and its subsidiaries.Each stock acquisition right represents a right to purchase 100 shares of MUFG common stock at ¥1 per share ofcommon stock. The stock acquisition rights are subject to a one-year vesting period. The rights are exercisableuntil July 15, 2040, but only after the date on which a grantee’s service as a director and an officer or as acorporate auditor of each of MUFG and the relevant subsidiaries terminates. The fair value of each stockacquisition right was ¥36,600.
As part of our compensation structure, on June 29, 2011, the board of directors adopted another stock-basedcompensation plan entitled “Fifth Series of Stock Acquisition Rights of Mitsubishi UFJ Financial Group, Inc.”for our directors, corporate auditors and certain of our officers. Under the stock-based compensation plan, onJuly 20, 2011, we allotted an aggregate of 7,740 stock acquisition rights to our directors and an aggregate of1,160 stock acquisition rights to our corporate auditors for their respective services to MUFG and its subsidiaries.Each stock acquisition right represents a right to purchase 100 shares of MUFG common stock at ¥1 per share ofcommon stock. The stock acquisition rights are subject to a one-year vesting period. The rights are exercisableuntil July 19, 2041, but only after the date on which a grantee’s service as a director and an officer or as acorporate auditor of each of MUFG and the relevant subsidiaries terminates. The fair value of each stockacquisition right was ¥33,700.
As part of our compensation structure, on June 28, 2012, the board of directors adopted another stock-basedcompensation plan entitled “Sixth Series of Stock Acquisition Rights of Mitsubishi UFJ Financial Group, Inc.”for our directors, corporate auditors and certain of our officers. Under the stock-based compensation plan, onJuly 18, 2012, we allotted an aggregate of 10,002 stock acquisition rights to our directors and an aggregate of1,161 stock acquisition rights to our corporate auditors for their respective services to MUFG and its subsidiaries.Each stock acquisition right represents a right to purchase 100 shares of MUFG common stock at ¥1 per share ofcommon stock. The stock acquisition rights are subject to a one-year vesting period. The rights are exercisableuntil July 17, 2042, but only after the date on which a grantee’s service as a director and an officer or as acorporate auditor of each of MUFG and the relevant subsidiaries terminates. The fair value of each stockacquisition right was ¥33,100.
As part of our compensation structure, on June 27, 2013, the board of directors adopted a stock-basedcompensation plan entitled “Seventh Series of Stock Acquisition Rights of Mitsubishi UFJ Financial Group,
154
Inc.” for our directors (excluding outside directors) and certain of our officers. Under the stock-basedcompensation plan, on July 17, 2013, we allotted an aggregate of 4,103 stock acquisition rights to our directors(excluding outside directors) for their respective services to MUFG and its subsidiaries. Each stock acquisitionright represents a right to purchase 100 shares of MUFG common stock at ¥1 per share of common stock. Thestock acquisition rights are subject to a one-year vesting period. The rights are exercisable until July 16, 2043,but only after the date on which a grantee’s service as a director and an officer of each of MUFG and the relevantsubsidiaries terminates. The fair value of each stock acquisition right was ¥61,100.
For more information on the Performance-based Stock Compensation Plans, see Note 33 to our consolidatedfinancial statements included elsewhere in this Annual Report.
Bonuses
We from time to time pay cash bonuses to our directors and corporate executives to further motivate them tocontribute to the improvement of our stock prices and profits if such bonuses are deemed appropriate based on abalanced scorecard approach taking into account the results of operations of the MUFG Group and eachdirector’s or corporate executive’s individual performance of his or her duties as a director or corporate executivein light of both quantitative and qualitative criteria, including our medium-term strategy for improving ourcorporate value. None of the outside directors is eligible to receive a cash bonus. The compensation committeedetermines the cash bonus for each director and corporate executive based on our financial results and his or herjob performance for the preceding fiscal year as well as his or her seniority and experience. The aggregate cashbonus paid to our directors and corporate executives for the fiscal year ended March 31, 2019 was ¥393 million.
Retirement Allowances
Prior to June 28, 2007, in accordance with customary Japanese practice, when a director or corporate auditorretired, a proposal to pay a retirement allowance was submitted at the annual ordinary general meeting ofshareholders for approval. The retirement allowance consisted of a one-time payment of a portion of theallowance paid at the time of retirement and periodic payments of the remaining amount for a prescribed numberof years. After the shareholders’ approval was obtained, the retirement allowance for a director or corporateauditor was fixed by the board of directors or by consultation among the corporate auditors in accordance withour internal regulations and practice and generally reflected the position of the director or corporate auditor at thetime of retirement, the length of his service as a director or corporate auditor and his contribution to ourperformance. Historically, MUFG did not set aside reserves for any retirement payments for directors andcorporate auditors made under this practice.
Pursuant to a one-time shareholders’ approval in June 2007, retirement allowances are paid in cash to thedirectors and corporate auditors who were elected prior to that date at the time of their retirement. A reserve inthe total amount of such retirement allowances was set aside as of September 30, 2007. No retirement allowancewas paid by MUFG and its subsidiaries pursuant to the one-time shareholder approval during the fiscal yearended March 31, 2019 to our directors (excluding outside directors), to corporate auditors (excluding outsidecorporate auditors) and to outside directors and corporate auditors, who have retired from their respectivepositions held at MUFG or, if such directors and corporate auditors concurrently held positions at MUFG’ssubsidiaries, who have retired from such positions.
MUFG Americas Holdings Corporation Stock Bonus Plan
Upon the integration of the U.S. branch banking operations of MUFG Bank with MUFG Union Bank’soperations on July 1, 2014, MUFG Americas Holdings assumed the obligations under the Bank of Tokyo-Mitsubishi UFJ, Ltd. Headquarters for the Americas Stock Bonus Plan described below. Effective June 8, 2015,MUFG Americas Holdings amended and restated this plan as the MUFG Americas Holdings Corporation StockBonus Plan.
155

Under the amended plan, qualified key employees of MUFG Americas Holdings are granted RestrictedShare Units, or RSUs, representing a right to receive American Depositary Receipts, or ADRs, evidencing ADSs,each exchangeable for one share of MUFG common stock, from an independent trust established to administerthe plan grants, upon the satisfaction of vesting conditions, to be determined pursuant to the plan as well as aRestricted Share Unit Agreement between MUFG Americas Holdings and the grantees.
Unless otherwise provided in the relevant Restricted Share Unit Agreement, RSUs become vested andnonforfeitable as follows: one-third (33 1/3%) of a grantee’s RSUs vests on each one year anniversary of the dateof the grant such that all of the RSUs become fully vested after three years from the grant date so long as thegrantee satisfies the specified continuous service requirements and any other conditions under the applicable plandocuments, subject to certain clawback and notice period provisions.
Under the plan, the grantees are entitled to “dividend equivalent credits” on their granted but unvested RSUswhen MUFG pays dividends to its shareholders. The credit is equal to the dividends that the grantees would havereceived on the shares had the shares been issued to the grantees in exchange for their granted but unvestedRSUs. Accumulated dividend equivalents are paid to grantees in whole shares on an annual basis. Any fractionalshare will be paid to the participants in cash.
Grants made under the plan are not entitled to any dividend rights, voting rights, or other stockholder rightsunless and until RSUs are vested and ADSs are delivered to grantees.
The ADSs to be delivered to grantees will be purchased on the open market by the trustee of theindependent trust pursuant to a trust agreement between MUFG Americas Holdings and the trustee. As ofJune 30, 2019, 82,804,285 RSUs have been granted under the plan, of which 37,372,404 RSUs were outstandingas of June 30, 2019.
For more information on the plan, see Note 33 to our consolidated financial statements included elsewherein this Annual Report. See also “Item 16E. Purchases of Equity Securities by the Issuer and AffiliatedPurchasers.”
Share Ownership
As of July 1, 2019, our directors and corporate executives held the following numbers of shares of ourcommon stock:
DirectorsNumber of Shares
Registered
Mariko Fujii . . . . . . . . . . . . . . . . . . . . . . . . . . . . . . . . . . . . . . . . . . . . . . . . . . . . . . . . . . . . . . . . . . —Kaoru Kato . . . . . . . . . . . . . . . . . . . . . . . . . . . . . . . . . . . . . . . . . . . . . . . . . . . . . . . . . . . . . . . . . . . —Haruka Matsuyama . . . . . . . . . . . . . . . . . . . . . . . . . . . . . . . . . . . . . . . . . . . . . . . . . . . . . . . . . . . . . 3,300Toby S. Myerson . . . . . . . . . . . . . . . . . . . . . . . . . . . . . . . . . . . . . . . . . . . . . . . . . . . . . . . . . . . . . . 368*Hirofumi Nomoto . . . . . . . . . . . . . . . . . . . . . . . . . . . . . . . . . . . . . . . . . . . . . . . . . . . . . . . . . . . . . . 25,000Tsutomu Okuda . . . . . . . . . . . . . . . . . . . . . . . . . . . . . . . . . . . . . . . . . . . . . . . . . . . . . . . . . . . . . . . 26,100Yasushi Shingai . . . . . . . . . . . . . . . . . . . . . . . . . . . . . . . . . . . . . . . . . . . . . . . . . . . . . . . . . . . . . . . —Tarisa Watanagase . . . . . . . . . . . . . . . . . . . . . . . . . . . . . . . . . . . . . . . . . . . . . . . . . . . . . . . . . . . . . —Akira Yamate . . . . . . . . . . . . . . . . . . . . . . . . . . . . . . . . . . . . . . . . . . . . . . . . . . . . . . . . . . . . . . . . . —Tadashi Kuroda . . . . . . . . . . . . . . . . . . . . . . . . . . . . . . . . . . . . . . . . . . . . . . . . . . . . . . . . . . . . . . . 124,600Junichi Okamoto . . . . . . . . . . . . . . . . . . . . . . . . . . . . . . . . . . . . . . . . . . . . . . . . . . . . . . . . . . . . . . . 182,800
156
Corporate ExecutivesNumber of Shares
Registered
Nobuyuki Hirano . . . . . . . . . . . . . . . . . . . . . . . . . . . . . . . . . . . . . . . . . . . . . . . . . . . . . . . . . . . . . . 80,400Mikio Ikegaya . . . . . . . . . . . . . . . . . . . . . . . . . . . . . . . . . . . . . . . . . . . . . . . . . . . . . . . . . . . . . . . . . 75,630Saburo Araki . . . . . . . . . . . . . . . . . . . . . . . . . . . . . . . . . . . . . . . . . . . . . . . . . . . . . . . . . . . . . . . . . . 210,980Kanetsugu Mike . . . . . . . . . . . . . . . . . . . . . . . . . . . . . . . . . . . . . . . . . . . . . . . . . . . . . . . . . . . . . . . 49,055Hironori Kamezawa . . . . . . . . . . . . . . . . . . . . . . . . . . . . . . . . . . . . . . . . . . . . . . . . . . . . . . . . . . . . 25,500Muneaki Tokunari . . . . . . . . . . . . . . . . . . . . . . . . . . . . . . . . . . . . . . . . . . . . . . . . . . . . . . . . . . . . . 254,900Masamichi Yasuda . . . . . . . . . . . . . . . . . . . . . . . . . . . . . . . . . . . . . . . . . . . . . . . . . . . . . . . . . . . . . 35,800Kenji Yabuta . . . . . . . . . . . . . . . . . . . . . . . . . . . . . . . . . . . . . . . . . . . . . . . . . . . . . . . . . . . . . . . . . . 38,000Naoki Hori . . . . . . . . . . . . . . . . . . . . . . . . . . . . . . . . . . . . . . . . . . . . . . . . . . . . . . . . . . . . . . . . . . . 41,800Masato Miyachi . . . . . . . . . . . . . . . . . . . . . . . . . . . . . . . . . . . . . . . . . . . . . . . . . . . . . . . . . . . . . . . 6,800Sunao Yokokawa . . . . . . . . . . . . . . . . . . . . . . . . . . . . . . . . . . . . . . . . . . . . . . . . . . . . . . . . . . . . . . 21,800Takayoshi Futae . . . . . . . . . . . . . . . . . . . . . . . . . . . . . . . . . . . . . . . . . . . . . . . . . . . . . . . . . . . . . . . 8,730Iwao Nagashima . . . . . . . . . . . . . . . . . . . . . . . . . . . . . . . . . . . . . . . . . . . . . . . . . . . . . . . . . . . . . . . 81,000Naomi Hayashi . . . . . . . . . . . . . . . . . . . . . . . . . . . . . . . . . . . . . . . . . . . . . . . . . . . . . . . . . . . . . . . . 1,210Junichi Hanzawa . . . . . . . . . . . . . . . . . . . . . . . . . . . . . . . . . . . . . . . . . . . . . . . . . . . . . . . . . . . . . . . 39,900Hiroki Kameda . . . . . . . . . . . . . . . . . . . . . . . . . . . . . . . . . . . . . . . . . . . . . . . . . . . . . . . . . . . . . . . . 40,600Ritsuo Ogura . . . . . . . . . . . . . . . . . . . . . . . . . . . . . . . . . . . . . . . . . . . . . . . . . . . . . . . . . . . . . . . . . . 16,400Masahiro Kuwahara . . . . . . . . . . . . . . . . . . . . . . . . . . . . . . . . . . . . . . . . . . . . . . . . . . . . . . . . . . . . 18,700Hiroshi Mori . . . . . . . . . . . . . . . . . . . . . . . . . . . . . . . . . . . . . . . . . . . . . . . . . . . . . . . . . . . . . . . . . . —
* Held in the form of ADRs.
None of the shares of our common stock held by our directors and corporate executives have voting rightsthat are different from shares of our common stock held by any other shareholder.
For information on the performance-based stock compensation and stock-based compensation plans for ourdirectors and corporate executives, see “—Performance-based Stock Compensation Plans” and “—Stock-basedCompensation Plans.”
C. Board Practices
Our articles of incorporation provide for a board of directors with statutorily mandated nominating andgovernance committee, audit committee and compensation committee, each consisting of members of the boardof directors. We have also elected, though not statutorily mandated under the Companies Act of Japan, toestablish a risk committee consisting of directors and outside professionals. In May 2016, we established aU.S. risk committee pursuant to the U.S. enhanced prudential standards for foreign banking organizations. Ourcorporate executives are responsible for executing and managing our business operations based on a delegationof authority by the board of directors, and our directors set our key management policies and oversee theexecution of duties by these corporate executives.
In June 2015, our shareholders approved an amendment to our articles of incorporation to adopt our currentgovernance framework with a board of directors and board committees. We previously had a governanceframework with a board of directors and a board of corporate auditors. The Companies Act permits three types ofgovernance system for large companies such as MUFG: (1) a company with a nominating committee, an auditcommittee and a compensation committee, (2) a company with a board of corporate auditors, and (3) a companywith an audit and supervisory committee. Our previous governance framework was based on the second system,and our newly adopted governance system is based on the first system.
With respect to companies adopting the first system, including MUFG, each of the nominating, audit andcompensation committees must consist of members of the board of directors, and the majority of each committeemust be outside directors as defined by the Companies Act. In addition, the board of directors must appointcorporate executives (shikkoyaku) to execute and manage the business operations of the company under the
157
authority delegated by the board of directors. Based on this system, our current governance framework isdesigned to facilitate more flexible and swifter decision-making and increase transparency in our managementprocesses.
An “outside director” is defined by the Companies Act as a person who meets all of the followingconditions:
‰ the person is not currently, and has not been in the ten years prior to his or her assumption of office asoutside director, an executive director, who is a director concurrently performing an executive role(gyomu shikko torishimariyaku), a corporate executive, a manager (shihainin), or any other type ofemployee of the company or any of its subsidiaries;
‰ if the person has been a non-executive director, a corporate auditor, or an accounting adviser (kaikeisanyo) of the company or any of its subsidiaries within the ten years prior to his or her assumption ofoffice as outside director, the person was not an executive director, a corporate executive, a manager orany other type of employee of the company or any of its subsidiary in the ten years prior to his or herassumption of office as such;
‰ the person is not a director, a corporate executive officer, a manager or any other type of employee ofthe company’s parent company, or a person who controls the company;
‰ the person is not an executive director, a corporate executive officer, a manager or any other type ofemployee of another subsidiary of the company’s parent company; and
‰ the person is not the spouse or a family member within the second degree of kinship of a director, acorporate executive, a manager, or any other type of important employee of the company or a personwho controls the company.
Board of Directors
Our board of directors consists of directors who are elected at a general meeting of shareholders. Under ourarticles of incorporation, the number of directors may not exceed 20. We currently have 16 directors, nine ofwhom are outside directors and two of whom are internal non-executive directors.
The regular term of office of a director is one year from the date of election, and directors may serve theirterms until the close of the annual general meeting of shareholders held for the following year after their election.Directors may serve any number of consecutive terms.
Under the Companies Act, the board of directors has the authority to determine our basic managementpolicy, make decisions on the execution and management of our business operations, and oversee the executionby the corporate executives of their duties. The board of directors may delegate, to the extent permitted by theCompanies Act, the authority to make decisions on the execution and management of our business operations.Our board of directors has delegated most of this authority to the corporate executives.
The board of directors elects the Chairman and the Deputy Chairman from among its members and appointskey management members based on recommendations submitted to it by the nominating committee.
Under the Companies Act, a resolution of the board of directors is required if any director wishes to engagein any business that is in competition with us or any transaction with us. Additionally, no director may vote on aproposal, arrangement or contract in which that director is deemed to be particularly interested.
Neither the Companies Act nor our articles of incorporation contain special provisions as to the borrowingpower exercisable by a director, the retirement age of our directors, or a requirement of our directors to hold anyshares of our capital stock.
158

Under the Companies Act and our articles of incorporation, we may exempt, by resolution of the board ofdirectors, our directors from liabilities to MUFG arising in connection with their failure to execute their duties ingood faith and without gross negligence within the limits stipulated by applicable laws and regulations. Inaddition, we have entered into a liability limitation agreement with each outside director and non-executivedirector which limits the maximum amount of their liability to MUFG arising in connection with a failure toexecute their duties in good faith and without gross negligence to the greater of either ¥10 million or theaggregate sum of the amounts prescribed in Paragraph 1 of Article 425 of the Companies Act and Articles 113and 114 of the Companies Act Enforcement Regulations.
None of our directors is party to a service contract with MUFG or any of its subsidiaries that provides forbenefits upon end of their director term.
Nominating Committee
Our nominating committee, which we call the nominating and governance committee, determines thecontents of proposals regarding the election and removal of director candidates to be submitted to generalmeetings of shareholders. The committee also considers and makes recommendations to the board of directorsregarding the appointment and removal of the Chairman and the Deputy Chairman of the board of directors andthe President & Group CEO of MUFG as well as the chairman and the deputy chairman of the board of directors,the president and others of each of our major subsidiaries. In addition, the committee discusses and makesrecommendations to the board of directors on matters pertaining to our governance policy and framework.
Under the Companies Act, the nominating committee must consist of at least three directors, and themajority of its members must be outside directors. Our nominating and governance committee currently consistsof five directors. The chairman of the committee is Tsutomu Okuda, an outside director. The other members ofthis committee are Mariko Fujii, Haruka Matsuyama and Hirofumi Nomoto, who are outside directors, andKanetsugu Mike, Director, President & Group CEO. Between April 2018 and March 2019, the nominating andgovernance committee met 13 times.
Audit Committee
The audit committee determines the contents of proposals pertaining to the election, termination andnon-appointment of our independent auditor to be submitted to general meetings of shareholders. The committeealso monitors and audits the execution by the directors and the corporate executives of their duties and preparesaudit reports to the board of directors. In order to effectively perform its duties, the committee reviews, inspectsand investigates, as necessary, the management of the operations of MUFG and its subsidiaries, includingfinancial reporting and internal controls. In addition, the committee has the power to consent to decisions on thecompensation to be paid to our independent auditor.
Under the Companies Act, the audit committee must consist of at least three non-executive directors, andthe majority of its members must be outside directors. Our committee currently has five members. The chairmanof the committee is Akira Yamate, an outside director. The other members of the committee are Kaoru Kato andYasushi Shingai, who are outside directors, and Tadashi Kuroda and Junichi Okamoto, who are non-executivedirectors. Between April 2018 and March 2019, the audit committee met 17 times.
On May 24, 2019, we became aware that a member of our audit committee did not meet the independencestandard for audit committee members set forth in Rule 10A-3(b)(1) of the U.S. Securities Exchange Act of 1934as a result of a ¥195,580 payment that such committee member received from Mitsubishi UFJ Research andConsulting Co., Ltd., our consolidated subsidiary, in connection with a one-time speaking engagement held onDecember 6, 2018. We promptly notified the NYSE of this matter. On June 6, 2019, the committee memberreturned the payment to the subsidiary. Based on subsequent discussions between us and the NYSE, in light ofthe fact that the violation was inadvertent and the committee member returned the payment to the subsidiary, the
159
NYSE has indicated that it does not intend to take any further action relating to this matter. Since June 6, 2019,the committee member has satisfied the independence standard for audit committee members set forth inRule 10A-3(b)(1) of the U.S. Securities Exchange Act of 1934.
Compensation Committee
The compensation committee establishes our policy regarding the determination of the compensation ofMUFG’s directors, corporate executives, executive officers (shikko yakuin) and others and also determines thedetails of individual compensation based on the policy. The committee discusses and makes recommendations tothe board of directors regarding the establishment, revision and abolition of compensation systems for thechairman, the deputy chairman, the president and others of each of our major subsidiaries.
Under the Companies Act, the compensation committee must consist of at least three directors, and themajority of its members must be outside directors. Our compensation committee currently consist of fivedirectors. The chairman of the committee is Haruka Matsuyama, an outside director. The other members of thiscommittee are Mariko Fujii, Hirofumi Nomoto and Tsutomu Okuda, who are outside directors, and KanetsuguMike, Director, President & Group CEO. Between April 2018 and March 2019, the compensation committee met7 times.
Risk Committee
In addition to the foregoing three committees, which are mandated by the Companies Act, we have a riskcommittee, which was initially established under our previous governance framework and which we continue tohave under our current governance framework on a voluntary basis. The risk committee deliberates and makesrecommendations to the board of directors on matters regarding group-wide risk management as well as top riskmatters.
MUFG Corporate Governance Policies provide that the committee shall consist of directors and outsideprofessionals. Outside professionals are professionals with no prior employment relationship with any of theMUFG group companies. The committee currently has seven members. The chairperson of the committee isMariko Fujii, an outside director. The other members of this committee are Toby S. Myerson, Yasushi Shingaiand Tarisa Watanagase, who are outside directors, Naomi Hayashi, Managing Corporate Executive and GroupCSO, and Kenzo Yamamoto and Naoko Nemoto, who are external experts. Between April 2018 and March 2019,the risk committee met four times.
U.S. Risk Committee
The U.S. risk committee oversees the risk management function for our combined U.S. operations. Itsoversight role includes, but is not limited to, all roles and responsibilities required under the FRB’s final rules forEnhanced Prudential Standards for foreign banking organizations. The committee monitors liquidity and all othertypes of risk exposures, reviews the risk management policies and procedures, and oversees compliance withsuch policies and procedures for our combined U.S. operations. The committee is a subcommittee of the board ofdirectors of MUFG, and reports and makes recommendations to MUFG’s board of directors and MUFG’s riskcommittee.
The members of the U.S. risk committee are appointed by MUFG’s board of directors after consideration ofmember candidates reviewed and recommended by MUFG’s risk committee and nominating and governancecommittee. The committee shall consist of members of the MUFG Americas Holdings Risk Committee,delegates from MUFG, the Chairman of the MUFG Americas Holdings Board and MUFG Americas Holdings’CEO, with the chairperson of the committee being an outside director of MUFG Americas Holdings. Thecommittee currently has eight members. The chairperson of the committee is Ann F. Jaedicke, an outside directorof MUFG Americas Holdings. The other members of this committee are Dean A. Yoost, Suneel Kamlani, Toby
160
Myerson and Roberta Bienfait, who are outside directors of MUFG Americas Holdings, Masato Miyachi, theChairman of the MUFG Americas Holdings Board, Masahiro Kuwahara, Managing Corporate Executive andGroup CRO of MUFG and Stephen Cummings, MUFG Americas Holdings’ CEO.
Corporate Executives
Our corporate executives are responsible for executing and managing our business operations within thescope of the authority delegated to them by the board of directors.
Under the Companies Act, at least one corporate executive must be appointed by a resolution of the board ofdirectors. We currently have 19 corporate executives. Under our articles of incorporation, the board of directorsshall appoint a president and a deputy president, who, as representative corporate executives, may represent usseverally. The term of office of each corporate executive expires at the conclusion of the first meeting of theboard of directors convened after the ordinary general meeting of shareholders for the last fiscal year that endswithin one year following the corporate executive’s assumption of office.
Under the Companies Act, a resolution of the board of directors is required if any corporate executivewishes to engage in any business that is in competition with us or any transaction with us.
Under the Companies Act and our articles of incorporation, we may exempt, by resolution of the board ofdirectors, our corporate executives from liabilities to MUFG arising in connection with their failure to executetheir duties in good faith and without gross negligence within the limits stipulated by applicable laws andregulations. We, however, currently have no such arrangements with any of our corporate executives.
161

D. Employees
As of March 31, 2019, we had approximately 112,700 employees, an increase of approximately 1,600employees compared with the number of employees as of March 31, 2018. In addition, as of March 31, 2019, wehad approximately 32,000 part-time and temporary employees. The following tables show the percentages of ouremployees across our different business units and in different locations as of March 31, 2019:
Business unit
MUFG Bank:Retail & Commercial Banking Business Unit . . . . . . . . . . . . . . . . . . . . . . . . . . . . . . . . . . . . . . . . . . . . . 20%Japanese Corporate & Investment Banking Business Unit . . . . . . . . . . . . . . . . . . . . . . . . . . . . . . . . . . . . 3Global Corporate & Investment Banking Business Unit . . . . . . . . . . . . . . . . . . . . . . . . . . . . . . . . . . . . . 2Global Commercial Banking Business Unit . . . . . . . . . . . . . . . . . . . . . . . . . . . . . . . . . . . . . . . . . . . . . . . 31Global Markets Business Unit . . . . . . . . . . . . . . . . . . . . . . . . . . . . . . . . . . . . . . . . . . . . . . . . . . . . . . . . . . 1Corporate Center/Corporate Staff . . . . . . . . . . . . . . . . . . . . . . . . . . . . . . . . . . . . . . . . . . . . . . . . . . . . . . . 20
Mitsubishi UFJ Trust and Banking:Trust-Banking . . . . . . . . . . . . . . . . . . . . . . . . . . . . . . . . . . . . . . . . . . . . . . . . . . . . . . . . . . . . . . . . . . . . . . 4Trust Assets . . . . . . . . . . . . . . . . . . . . . . . . . . . . . . . . . . . . . . . . . . . . . . . . . . . . . . . . . . . . . . . . . . . . . . . . 4Real Estate . . . . . . . . . . . . . . . . . . . . . . . . . . . . . . . . . . . . . . . . . . . . . . . . . . . . . . . . . . . . . . . . . . . . . . . . . 1Global Markets . . . . . . . . . . . . . . . . . . . . . . . . . . . . . . . . . . . . . . . . . . . . . . . . . . . . . . . . . . . . . . . . . . . . . 1Administration and subsidiaries . . . . . . . . . . . . . . . . . . . . . . . . . . . . . . . . . . . . . . . . . . . . . . . . . . . . . . . . 2
Mitsubishi UFJ Securities Holdings:Sales Marketing Business Unit . . . . . . . . . . . . . . . . . . . . . . . . . . . . . . . . . . . . . . . . . . . . . . . . . . . . . . . . . 3Global Investment Banking Business Unit . . . . . . . . . . . . . . . . . . . . . . . . . . . . . . . . . . . . . . . . . . . . . . . . 1Global Markets Business Unit . . . . . . . . . . . . . . . . . . . . . . . . . . . . . . . . . . . . . . . . . . . . . . . . . . . . . . . . . . 0International Business Unit . . . . . . . . . . . . . . . . . . . . . . . . . . . . . . . . . . . . . . . . . . . . . . . . . . . . . . . . . . . . 1Corporate Center and Others . . . . . . . . . . . . . . . . . . . . . . . . . . . . . . . . . . . . . . . . . . . . . . . . . . . . . . . . . . . 2
Mitsubishi UFJ NICOS:Business Marketing Division . . . . . . . . . . . . . . . . . . . . . . . . . . . . . . . . . . . . . . . . . . . . . . . . . . . . . . . . . . 1Credit Risk Management & Risk Assets Administration Division . . . . . . . . . . . . . . . . . . . . . . . . . . . . . . 1Operations Division . . . . . . . . . . . . . . . . . . . . . . . . . . . . . . . . . . . . . . . . . . . . . . . . . . . . . . . . . . . . . . . . . . 0Systems Division . . . . . . . . . . . . . . . . . . . . . . . . . . . . . . . . . . . . . . . . . . . . . . . . . . . . . . . . . . . . . . . . . . . . 0Corporate Division . . . . . . . . . . . . . . . . . . . . . . . . . . . . . . . . . . . . . . . . . . . . . . . . . . . . . . . . . . . . . . . . . . 0
Others . . . . . . . . . . . . . . . . . . . . . . . . . . . . . . . . . . . . . . . . . . . . . . . . . . . . . . . . . . . . . . . . . . . . . . . . . . . . . . . . 2
100%
162

Location
MUFG Bank:Japan . . . . . . . . . . . . . . . . . . . . . . . . . . . . . . . . . . . . . . . . . . . . . . . . . . . . . . . . . . . . . . . . . . . . . . . . . . . . . 30%United States . . . . . . . . . . . . . . . . . . . . . . . . . . . . . . . . . . . . . . . . . . . . . . . . . . . . . . . . . . . . . . . . . . . . . . . 12Europe . . . . . . . . . . . . . . . . . . . . . . . . . . . . . . . . . . . . . . . . . . . . . . . . . . . . . . . . . . . . . . . . . . . . . . . . . . . . 2Asia/Oceania excluding Japan . . . . . . . . . . . . . . . . . . . . . . . . . . . . . . . . . . . . . . . . . . . . . . . . . . . . . . . . . 33Other areas . . . . . . . . . . . . . . . . . . . . . . . . . . . . . . . . . . . . . . . . . . . . . . . . . . . . . . . . . . . . . . . . . . . . . . . . . 1
Mitsubishi UFJ Trust and Banking:Japan . . . . . . . . . . . . . . . . . . . . . . . . . . . . . . . . . . . . . . . . . . . . . . . . . . . . . . . . . . . . . . . . . . . . . . . . . . . . . 9United States . . . . . . . . . . . . . . . . . . . . . . . . . . . . . . . . . . . . . . . . . . . . . . . . . . . . . . . . . . . . . . . . . . . . . . . 1Europe . . . . . . . . . . . . . . . . . . . . . . . . . . . . . . . . . . . . . . . . . . . . . . . . . . . . . . . . . . . . . . . . . . . . . . . . . . . . 1Asia/Oceania excluding Japan . . . . . . . . . . . . . . . . . . . . . . . . . . . . . . . . . . . . . . . . . . . . . . . . . . . . . . . . . 0
Mitsubishi UFJ Securities Holdings:Japan . . . . . . . . . . . . . . . . . . . . . . . . . . . . . . . . . . . . . . . . . . . . . . . . . . . . . . . . . . . . . . . . . . . . . . . . . . . . . 5United States . . . . . . . . . . . . . . . . . . . . . . . . . . . . . . . . . . . . . . . . . . . . . . . . . . . . . . . . . . . . . . . . . . . . . . . 0Europe . . . . . . . . . . . . . . . . . . . . . . . . . . . . . . . . . . . . . . . . . . . . . . . . . . . . . . . . . . . . . . . . . . . . . . . . . . . . 1Asia/Oceania excluding Japan . . . . . . . . . . . . . . . . . . . . . . . . . . . . . . . . . . . . . . . . . . . . . . . . . . . . . . . . . 0
Mitsubishi UFJ NICOS:Japan . . . . . . . . . . . . . . . . . . . . . . . . . . . . . . . . . . . . . . . . . . . . . . . . . . . . . . . . . . . . . . . . . . . . . . . . . . . . . 3United States . . . . . . . . . . . . . . . . . . . . . . . . . . . . . . . . . . . . . . . . . . . . . . . . . . . . . . . . . . . . . . . . . . . . . . . 0Europe . . . . . . . . . . . . . . . . . . . . . . . . . . . . . . . . . . . . . . . . . . . . . . . . . . . . . . . . . . . . . . . . . . . . . . . . . . . . 0Asia/Oceania excluding Japan . . . . . . . . . . . . . . . . . . . . . . . . . . . . . . . . . . . . . . . . . . . . . . . . . . . . . . . . . 0
Others . . . . . . . . . . . . . . . . . . . . . . . . . . . . . . . . . . . . . . . . . . . . . . . . . . . . . . . . . . . . . . . . . . . . . . . . . . . . . . . . 2
100%
Most of our employees are members of an employees’ union, which negotiates on behalf of employees inrelation to remuneration and working conditions. We believe our labor relations to be good.
E. Share Ownership
The information required by this item is set forth in “—B. Compensation.”
Item 7. Major Shareholders and Related Party Transactions.
A. Major Shareholders
Common Stock
As of March 31, 2019, we had 695,521 registered shareholders of our common stock. The ten largestholders of our common stock appearing on the register of shareholders as of March 31, 2019, and the number andthe percentage of such shares held by each of them, were as follows:
NameNumber of shares
heldPercentage of
total shares in issue(3)
The Master Trust Bank of Japan, Ltd. (Trust account)(1) . . . . . . . . . . . . . . . . 738,305,200 5.40%Japan Trustee Services Bank, Ltd. (Trust account)(1) . . . . . . . . . . . . . . . . . . 679,609,600 4.97SSBTC CLIENT OMNIBUS ACCOUNT . . . . . . . . . . . . . . . . . . . . . . . . . . . 338,906,515 2.47Japan Trustee Services Bank, Ltd. (Trust account 5)(1) . . . . . . . . . . . . . . . . . 266,418,200 1.94Japan Trustee Services Bank, Ltd. (Trust account 9)(1) . . . . . . . . . . . . . . . . . 205,451,700 1.50Government of Norway . . . . . . . . . . . . . . . . . . . . . . . . . . . . . . . . . . . . . . . . . 194,590,625 1.42JP Morgan Chace Bank 385151 . . . . . . . . . . . . . . . . . . . . . . . . . . . . . . . . . . . 193,449,305 1.41State Street Bank West Client-Treaty 505234 . . . . . . . . . . . . . . . . . . . . . . . . 189,409,851 1.38Japan Trustee Services Bank, Ltd. (Trust account 1)(1) . . . . . . . . . . . . . . . . . 177,577,500 1.29The Bank of New York Mellon as Depositary Bank for DR Holders(2) . . . . 175,825,882 1.28
Total . . . . . . . . . . . . . . . . . . . . . . . . . . . . . . . . . . . . . . . . . . . . . . . . . . . . 3,159,544,378 23.11%
163

Notes:(1) Includes the shares held in trust accounts, which do not disclose the names of beneficiaries.(2) An owner of record for our ADSs.(3) Numbers are truncated after two decimal points.(4) According to a beneficial ownership report on Schedule 13G filed with the SEC by BlackRock Inc. on February 6, 2019, BlackRock and
its consolidated subsidiaries beneficially owned an aggregate of 5.6% of the outstanding shares of our common stock as of December 31,2018. Other than as described in the table above, we have not independently confirmed this beneficial ownership information.
As of March 31, 2019, 1,806,395 shares, representing approximately 0.01% of our outstanding commonstock, were held by our directors and corporate executives.
As of March 31, 2019, 1,893,888,527 shares, representing 13.85% of our outstanding common stock, wereowned by 408 U.S. shareholders of record who are resident in the United States, one of whom is the ADRdepository’s nominee holding 175,825,882 shares, or 1.28%, of our total issued shares of common stock.
Our major shareholders do not have different voting rights.
B. Related Party Transactions
As of March 31, 2019, we held approximately 24.0% of the voting rights in Morgan Stanley and Series CPreferred Stock with a face value of approximately $521.4 million and 10% dividend. We also have tworepresentatives appointed to Morgan Stanley’s board of directors. We adopted the equity method of accountingfor our investment in Morgan Stanley beginning with the fiscal year ended March 31, 2012. In April 2018, weentered into a sales plan with Morgan Stanley and Morgan Stanley & Co. LLC, pursuant to which we will sellportions of the shares of Morgan Stanley common stock that we hold to Morgan Stanley through MorganStanley & Co. LLC acting as agent for Morgan Stanley to the extent necessary to ensure that our beneficialownership will remain below 24. 9%.
We and Morgan Stanley have two securities joint venture companies, namely, Mitsubishi UFJ MorganStanley Securities and Morgan Stanley MUFG Securities, in Japan. We hold a 60% economic interest inMitsubishi UFJ Morgan Stanley Securities and Morgan Stanley MUFG Securities, and Morgan Stanley holds a40% economic interest in Mitsubishi UFJ Morgan Stanley Securities and Morgan Stanley MUFG Securities. Wehold a 60% voting interest and Morgan Stanley holds a 40% voting interest in Mitsubishi UFJ Morgan StanleySecurities, and we hold a 49% voting interest and Morgan Stanley holds a 51% voting interest in Morgan StanleyMUFG Securities.
We and Morgan Stanley continue to pursue a variety of business opportunities in Japan and abroad inaccordance with the global strategic alliance. For a detailed discussion of our global alliance with MorganStanley, see “Item 4.B. Information on the Company—Business Overview—Global Strategic Alliance withMorgan Stanley.”
We and our banking subsidiaries had, and expect to have in the future, banking transactions and othertransactions in the ordinary course of business with our related parties. Although for the fiscal year endedMarch 31, 2019, such transactions included, but were not limited to, call money, loans, electronic dataprocessing, leases and management of properties, those transactions were immaterial and were made atprevailing market rates, terms and conditions and do not involve more than the normal risk of collectability orpresent other unfavorable features.
None of our directors or corporate executives, nor any of the close members of their respective families, hashad any transactions or has any presently proposed transactions that are material or any transactions that areunusual in their nature or conditions, involving goods, services or tangible or intangible assets, to which we were,are or will be a party.
164

No loans have been made to our directors or corporate executives other than in the normal course ofbusiness, on substantially the same terms, including interest rates and collateral, as those prevailing at the timefor comparable transactions with other persons, involving no more than the normal risk of collectability andpresenting no other unfavorable features. In addition, no loans have been made to our directors or corporateexecutives other than as permitted under Section 13(k) of the U.S. Securities Exchange Act and Rule 13k-1promulgated thereunder.
No family relationship exists among any of our directors or corporate executives. No arrangement orunderstanding exists between any of our directors or corporate executives and any other person pursuant to whichany director or corporate executive was elected to their position at MUFG.
As part of our compensation structure, we have granted performance-based stock compensation rights andstock acquisition rights to our directors and corporate executives. For a detailed discussion of the stockacquisition rights, see “Item 6.B. Directors, Senior Management and Employees—Compensation.”
C. Interests of Experts and Counsel
Not applicable.
Item 8. Financial Information.
A. Consolidated Statements and Other Financial Information
The information required by this item is set forth in our consolidated financial statements starting onpage F-1 of this Annual Report and in “Selected Statistical Data” starting on page A-1 of this Annual Report.
Pursuant to Rule 3-09 of Regulation S-X, the financial statements and supplementary data of MorganStanley, our equity method investee, as of and for the fiscal year ended December 31, 2018, are incorporated inthis Annual Report as Exhibit 99(c) by reference to Morgan Stanley’s annual report on Form 10-K filed onFebruary 26, 2019.
Legal Proceedings
From time to time, we are involved in various litigation matters and other legal proceedings, includingregulatory actions. Although the final resolution of any such matters and proceedings could have a material effecton our consolidated operating results for a particular reporting period, based on our current knowledge andconsultation with legal counsel, we believe the current litigation matters and other legal proceedings, whenultimately determined, will not materially affect our results of operations or financial position.
On November 8, 2017, MUFG Bank filed suit against the Superintendent of DFS in the U.S. District Courtfor the Southern District of New York, seeking declaratory and injunctive relief to prevent DFS from exercisingfurther authority over MUFG Bank’s New York Branch and to confirm the validity of the New York Branch’sfederal banking license issued by the OCC, effective November 7, 2017. On January 31, 2018, DFS filed ananswer denying MUFG Bank’s allegations and asserting defenses to MUFG’s requests for relief, together withcounterclaims seeking monetary penalties against MUFG Bank based on purported violations of law alleged tohave occurred prior to the federal license conversion. On March 19, 2018, MUFG Bank moved to dismiss all ofDFS’s counterclaims as preempted by federal law and for failure to state a claim under New York law. OnJune 24, 2019 in New York time, MUFG Bank reached a settlement with DFS to resolve the lawsuit. MUFGBank paid a $33 million settlement payment. This settlement resolves the pending federal civil litigation in itsentirety, and does not constitute a regulatory order or involve a monetary penalty.
For more information, see “Item 3.D. Key Information—Risk Factors—Risks Related to Our Business—Wemay become subject to regulatory actions or other legal proceedings relating to our transactions or other aspectsof our operations, which could result in significant financial losses, restrictions on our operations and damage toour reputation.” and Note 27 to our consolidated financial statements included elsewhere in this Annual Report.
165

Distributions
Our board of directors submits a recommendation for a year-end dividend for our shareholders’ approval atthe ordinary general meeting of shareholders customarily held in June of each year. The year-end dividend isusually distributed immediately following shareholders’ approval to holders of record at the end of the precedingfiscal year. In addition to year-end dividends, we may make cash distributions by way of interim dividends toshareholders of record as of September 30 of each year as distribution of surplus by resolution of our board ofdirectors. Year-end dividends in the amount of ¥11.0 per share of our common stock (in addition to interimdividends of ¥11.0 per share of our common stock) for the fiscal year ended March 31, 2019 were approved byshareholders at the ordinary general meeting of shareholders held on June 27, 2019.
See “Item 10.B. Additional Information—Memorandum and Articles of Association” for additionalinformation on our dividends policy.
Under the Japanese foreign exchange regulations currently in effect, dividends paid on shares held bynon-residents of Japan may be converted into any foreign currency and repatriated abroad. Under the terms of thedeposit agreement pursuant to which ADSs are issued, the depositary is required, to the extent that in itsjudgment it can convert Japanese yen on a reasonable basis into U.S. dollars and transfer the resultingU.S. dollars to the United States, to convert all cash dividends that it receives in respect of deposited shares intoU.S. dollars and to distribute the amount received, after deduction of any applicable withholding taxes, to theholders of ADSs. See “Item 10.D. Additional Information—Exchange Controls” and “Item 12.D. Description ofSecurities Other than Equity Securities—American Depositary Shares.”
B. Significant Changes
Other than as described in this Annual Report, no significant changes have occurred since the date of ourconsolidated financial statements included in this Annual Report.
Item 9. The Offer and Listing.
A. Offer and Listing Details
The principal market for our common stock is the Tokyo Stock Exchange in Japan. Our common stock isalso listed on the Nagoya Stock Exchange in Japan. The listing code assigned to our common stock in Japan is8306.
In the United States, ADSs, each representing one share of common stock, are quoted on the New YorkStock Exchange under the symbol, “MUFG.”
B. Plan of Distribution
Not applicable.
C. Markets
The information required by this item is set forth in “—A. Offer and Listing Details.”
D. Selling Shareholders
Not applicable.
E. Dilution
Not applicable.
166

F. Expenses of the Issue
Not applicable.
Item 10. Additional Information.
A. Share Capital
Not applicable.
B. Memorandum and Articles of Association
Our Corporate Purpose
Article 2 of our Articles of Incorporation provides that our corporate purpose is to carry on the followingbusinesses:
‰ administration of management of banks, trust banks, specialized securities companies, insurancecompanies or other companies which we may own as our subsidiaries under the Banking Law;
‰ any businesses incidental to the foregoing businesses mentioned in the preceding item; and
‰ any other businesses in which bank holding companies are permitted to engage under the Banking Lawin addition to the foregoing businesses mentioned in the preceding two items.
Board of Directors
For discussion of the provisions of our Articles of Incorporation as they apply to our directors, see“Item 6.C. Directors, Senior Management and Employees—Board Practices.”
Common Stock
As of March 31, 2019, a total of 13,667,770,520 shares of common stock (including 745,921,774 shares ofcommon stock held by us and our consolidated subsidiaries as treasury stock) had been issued. Each of the sharesissued and outstanding was fully paid and non-assessable.
For a description of our common stock, see Exhibit 2(c) to this Annual Report.
Preferred Stock
We currently have no shares of preferred stock issued.
For a description of preferred stock we are authorized to issue under our Articles of Incorporation, seeExhibit 2(c) to this Annual Report.
C. Material Contracts
Except as described elsewhere in this Annual Report, all material contracts entered into by us in the past twoyears preceding the filing of this Annual Report were entered into in the ordinary course of business.
D. Exchange Controls
Foreign Exchange and Foreign Trade Law
The Foreign Exchange and Foreign Trade Law of Japan and the cabinet orders and ministerial ordinancesincidental thereto, collectively known as the Foreign Exchange Law, set forth, among other matters, regulations
167

relating to the receipt by non-residents of Japan of payment with respect to shares to be issued by us and theacquisition and holding of shares by non-residents of Japan and foreign investors, both as defined below. It alsoapplies in some cases to the acquisition and holding of ADSs representing such shares acquired and held bynon-residents of Japan and foreign investors. Generally, the Foreign Exchange Law currently in effect does notaffect the right of a non-resident of Japan to purchase or sell an ADS outside Japan for non-Japanese currency.
“Non-residents of Japan” are defined as individuals who are not resident in Japan and corporations whoseprincipal offices are located outside Japan. Generally, the branches and offices of non-resident corporationswhich are located in Japan are regarded as residents of Japan while the branches and offices of Japanesecorporations located outside Japan are regarded as non-residents of Japan.
“Foreign investors” are defined as:
‰ natural persons who are non-resident of Japan;
‰ corporations which are organized under the laws of foreign countries or whose principal offices arelocated outside Japan;
‰ corporations of which 50% or more of the shares are directly or indirectly held by individuals notresident of Japan and corporations which are organized under the laws of foreign countries or whoseprincipal offices are located outside Japan; and
‰ corporations, a majority of officers (or a majority of officers having the power of representation) ofwhich are non-resident individuals.
Dividends and Proceeds of Sales
Under the Foreign Exchange Law, dividends paid on, and the proceeds of sales in Japan of, shares held bynon-residents of Japan may in general be converted into any foreign currency and repatriated abroad. Theacquisition of our shares by non-residents of Japan by way of a stock split is not subject to any notification orreporting requirements.
Acquisition of Shares
In general, a non-resident of Japan who acquires shares from a resident of Japan is not subject to any priorfiling requirement, although the Foreign Exchange Law empowers the Minister of Finance of Japan to require aprior approval for any such acquisition in certain limited circumstances.
If a foreign investor acquires our shares, and, together with parties who have a special relationship with thatforeign investor, holds 10% or more of our issued shares as a result of such acquisition, the foreign investor mustfile a report of such acquisition with the Minister of Finance and any other competent Minister by the fifteenthday of the month immediately following the month to which the date of such acquisition belongs. In certainlimited circumstances, however, a prior notification of such acquisition must be filed with the Minister ofFinance and any other competent Minister, who may modify or prohibit the proposed acquisition.
Deposit and Withdrawal under American Depositary Facility
The deposit of shares with us, in our capacity as custodian and agent for the depositary, in Tokyo, theissuance of ADSs by the depositary to a non-resident of Japan in respect of the deposit and the withdrawal of theunderlying shares upon the surrender of the ADSs are not subject to any of the formalities or restrictions referredto above. However, where as a result of a deposit or withdrawal the aggregate number of shares held by thedepositary, including shares deposited with us as custodian for the depositary, or the holder surrendering ADSs,as the case may be, would be 10% or more of the total outstanding shares, a report will be required, and inspecified circumstances, a prior notification may be required, as noted above.
168
Reporting of Substantial Shareholdings
The Financial Instruments and Exchange Act of Japan requires any person who has become, beneficiallyand solely or jointly, a holder of more than 5% of the total issued shares of capital stock of a company listed onany Japanese financial instruments exchange or whose shares are traded on the over-the-counter market in Japanto file with the director of a competent finance bureau within five business days a report concerning suchshareholdings.
A similar report must also be filed in respect of any subsequent change of 1% or more in any such holdingratio or any change in material matters set out in reports previously filed, with certain exceptions. For thispurpose, shares issuable to such person upon exchange of exchangeable securities, conversion of convertiblesecurities or exercise of share subscription warrants or stock acquisition rights (including those incorporated inbonds with stock acquisition rights) are taken into account in determining both the number of shares held by suchholder and the issuer’s total issued shares of capital stock.
E. Taxation
Japanese Taxation
The following sets forth the material Japanese tax consequences to owners of shares of our common stock orADSs who are non-resident individuals or non-Japanese corporations without a permanent establishment in Japanto which the relevant income is attributable, which we refer to as “non-resident holders” in this section. Thestatements regarding Japanese tax laws below are based on the laws in force and as interpreted by the Japanesetaxation authorities as at the date of this Annual Report and are subject to changes in the applicable Japaneselaws, double taxation treaties, conventions or agreements or interpretations thereof occurring after that date. Thissummary is not exhaustive of all possible tax considerations that may apply to a particular investor, and potentialinvestors are advised to satisfy themselves as to the overall tax consequences of the acquisition, ownership anddisposition of shares of our common stock or ADSs, including specifically the tax consequences under Japaneselaw, the laws of the jurisdiction of which they are resident and any tax treaty between Japan and their country ofresidence, by consulting their own tax advisers.
For the purpose of Japanese tax law and the Convention between the Government of the United States ofAmerica and Japan for the Avoidance of Double Taxation and the Prevention of Fiscal Evasion with Respect toTaxes on Income, or the Tax Convention, a U.S. holder of ADSs will be treated as the owner of the shares of ourcommon stock underlying the ADSs evidenced by the ADRs.
Generally, a non-resident holder of shares of our common stock or ADSs is subject to Japanese withholdingtax on dividends paid by us. In the absence of any applicable tax treaty, convention or agreement reducing therate of withholding tax, the rate of Japanese withholding tax applicable to dividends paid by us to non-residentholders is (i) 15.315% for dividends to be paid on or before December 31, 2037 and (ii) 15% for dividends to bepaid thereafter, except for dividends paid to any individual non-resident holder who holds 3% or more of ourissued shares for which the applicable rate is (a) 20.42% for dividends to be paid on or before December 31,2037 and (b) 20% for dividends to be paid thereafter, pursuant to Japanese tax law.
The Tax Convention establishes the maximum rate of Japanese withholding tax which may be imposed ondividends paid to a U.S. resident not having a permanent establishment in Japan. Under the Tax Convention, themaximum withholding rate for U.S. holders (as defined below) is generally set at 10% of the gross amountdistributed. However, the maximum rate is 5% of the gross amount distributed if the recipient is a corporationand owns directly or indirectly, on the date on which entitlement to the dividends is determined, at least 10% ofthe voting shares of the paying corporation. Furthermore, the amount distributed shall not be taxed if therecipient is (i) a pension fund which is a U.S. resident, provided that such dividends are not derived from thecarrying on of a business, directly or indirectly, by such pension fund or (ii) a parent company with a controllinginterest in the paying company and satisfies certain other requirements. U.S. holders (as defined below) are urgedto consult their own tax advisors with respect to their eligibility for benefits under the Tax Convention.
169

Japanese tax law provides in general that if the Japanese statutory rate is lower than the maximum rateapplicable under tax treaties, conventions or agreements, the Japanese statutory rate as stated above shall beapplicable.
Non-resident holders of shares who are entitled to a reduced rate of Japanese withholding tax on paymentsof dividends on the shares of our common stock or ADSs by us are required to submit an Application Form forthe Income Tax Convention regarding Relief from Japanese Income Tax on Dividends, or an Application Formfor the Income Tax Convention, in advance through a paying handling agent to the relevant tax authority beforethe payment of dividends. A standing proxy for non-resident holders may provide this application service for thenon-resident holders. In this regard, a certain simplified special filing procedure is available for non-residentholders to claim treaty benefits of exemption from or reduction of Japanese withholding tax with respect todividends to be paid on or after January 1, 2014, by submitting a Special Application Form for Income TaxConvention regarding Relief from Japanese Income Tax and Special Income Tax for Reconstruction onDividends of Listed Stocks (together with any other required forms and documents). With respect to ADSs, thisreduced rate or exemption will be applicable to non-resident holders of ADSs if the depositary or its agentsubmits two Application Forms (one before payment of dividends and the other within eight months after therecord date concerning such payment of dividends), together with certain other documents. To claim this reducedrate or exemption, non-resident holders of ADSs will be required to file a proof of taxpayer status, residence andbeneficial ownership, as applicable, and to provide other information or documents as may be required by thedepositary. Non-resident holders who are entitled, under any applicable tax treaty, to a reduced rate of Japanesewithholding tax below the rate otherwise applicable under Japanese tax law, or exemption therefrom, as the casemay be, but fail to submit the required application in advance may nevertheless be entitled to claim a refund fromthe relevant Japanese tax authority of withholding taxes withheld in excess of the rate under an applicable taxtreaty (if such non-resident holders are entitled to a reduced treaty rate under the applicable tax treaty) or the fullamount of tax withheld (if such non-resident holders are entitled to an exemption under the applicable tax treaty),as the case may be, by complying with a certain subsequent filing procedure. We do not assume anyresponsibility to ensure withholding at the reduced rate, or an exemption therefrom, for non-resident holders whowould be so eligible under an applicable tax treaty but where the required procedures as stated above are notfollowed.
Gains derived from the sale or other disposition of shares of our common stock or ADSs by a non-residentholder are not, in general, subject to Japanese income or corporation taxes or other Japanese taxes.
Any deposits or withdrawals of shares of our common stock by a non-resident holder in exchange for ADSsare not subject to Japanese income or corporation tax.
Japanese inheritance and gift taxes, at progressive rates, may be payable by an individual who has acquiredshares of our common stock or ADSs as legatee, heir or donee, even if none of the individual, the decedent or thedonor is a Japanese resident.
U.S. Taxation
The following sets forth the material U.S. federal income tax consequences of the ownership of shares andADSs by a U.S. holder, as defined below. This summary is based on U.S. federal income tax laws, including theU.S. Internal Revenue Code of 1986, or the Code, its legislative history, existing and proposed Treasuryregulations thereunder, published rulings and court decisions, and the Tax Convention (as defined above), all ofwhich are subject to change, possibly with retroactive effect.
The following summary is not a complete analysis or description of all potential U.S. federal income taxconsequences to a particular U.S. holder. It does not address all U.S. federal income tax considerations that maybe relevant to all categories of potential purchasers, certain of which (such as banks or other financialinstitutions, insurance companies, dealers in securities, tax-exempt entities, non-U.S. persons, persons holding a
170

share or an ADS as part of a “straddle,” “hedge,” conversion or integrated transaction, holders whose “functionalcurrency” is not the U.S. dollar, holders liable for alternative minimum tax, holders required to report income nolater than when such income is reported on an “applicable financial statement,” and holders of 10% or more ofour shares by vote or value) are subject to special tax treatment. This summary does not address any foreign,state, local or other tax consequences of investments in our shares or ADSs.
This summary addresses only shares or ADSs that are held as capital assets within the meaning ofSection 1221 of the Code.
As used herein, a “U.S. holder” is a beneficial owner of shares or ADSs, as the case may be, that is:
‰ a citizen or resident of the United States as determined for U.S. federal income tax purposes;
‰ a corporation or other entity taxable as a corporation created or organized under the laws of theUnited States, any state thereof or the District of Columbia;
‰ an estate, the income of which is subject to U.S. federal income tax regardless of its source; or
‰ a trust
‰ the administration of which is subject to (1) the supervision of a court within the United States and(2) the control of one or more U.S. persons as described in Section 7701(a)(30) of the Code; or
‰ that has a valid election in effect under applicable U.S. Treasury regulations to be treated as a U.S.person.
If a partnership holds shares or ADSs, the tax treatment of a partner will generally depend on the status ofthe partner and the activities of the partnership. If you are a partner of a partnership holding shares or ADSs, youshould consult your tax advisor.
We urge U.S. holders to consult their own tax advisors concerning the U.S. federal, state and local andother tax consequences to them of the purchase, ownership and disposition of shares or ADSs.
This summary is based in part on the assumption that each obligation under the deposit agreement and anyrelated agreement will be performed in accordance with its respective terms. Subject to the discussion in the nextparagraph, for U.S. federal income tax purposes, holders of ADSs will be treated as the owners of the sharesrepresented by the ADSs. Accordingly, withdrawals or deposits of shares in exchange for ADSs generally willnot be subject to U.S. federal income tax.
The U.S. Treasury has expressed concerns that intermediaries in the chain of ownership between the holderof an ADS and the issuer of the security underlying the ADS may be taking actions that are inconsistent with thebeneficial ownership of the underlying shares (for example, pre-releasing ADSs to persons who do not havebeneficial ownership of the securities underlying the ADSs). Accordingly, the discussion on the creditability ofJapanese taxes and the availability of the reduced rate of tax for dividends received by certain non-corporateU.S. holders, each as described below, could be affected by actions taken by intermediaries in the chain ofownership between the holder of ADSs and us if, as a result of such actions, the holders of ADSs are not properlytreated as beneficial owners of the underlying shares. We are not aware of any intention to take any such actions,and accordingly, the remainder of this discussion assumes that holders of ADSs will be properly treated asbeneficial owners of the underlying shares.
Special adverse U.S. federal income tax rules apply if a U.S. holder holds shares or ADSs of a company thatis treated as a “passive foreign investment company” (a “PFIC”) for any taxable year during which theU.S. holder held shares or ADSs, as discussed in more detail below. U.S. holders should consult their own taxadvisors as to the potential application of the PFIC rules to their ownership and disposition of shares or ADSs.
171
Taxation of Dividends
Subject to the application of the PFIC rules discussed below, U.S. holders will include the gross amount ofany distribution received with respect to shares or ADSs (before reduction for Japanese withholding taxes), to theextent paid out of our current or accumulated earnings and profits (as determined for U.S. federal income taxpurposes), as ordinary income in their gross income. As discussed below, for certain U.S. holders, dividends maybe eligible for a reduced rate of taxation. The amount of distribution of property other than cash will be the fairmarket value of such property on the date of the distribution. Dividends received by a U.S. holder will not beeligible for the “dividends-received deduction” allowed to U.S. corporations in respect of dividends receivedfrom other U.S. corporations. To the extent that an amount received by a U.S. holder exceeds such holder’sallocable share of our current earnings and profits, such excess will be applied first to reduce such holder’s taxbasis in its shares or ADSs, thereby increasing the amount of gain or decreasing the amount of loss recognized ona subsequent disposition of the shares or ADSs. Then, to the extent such distribution exceeds such U.S. holder’stax basis, such excess will be treated as capital gain. However, we do not maintain calculations of our earningsand profits in accordance with U.S. federal income tax principles, and U.S. holders should therefore assume thatany distribution by us with respect to shares or ADSs will constitute ordinary dividend income. The amount ofthe dividend will be the U.S. dollar value of the Japanese yen payments received. This value will be determinedat the spot Japanese yen/U.S. dollar rate on the date the dividend is received by the depositary in the case ofU.S. holders of ADSs, or by the shareholder in the case of U.S. holders of shares, regardless of whether thedividend payment is in fact converted into U.S. dollars at that time. If the Japanese yen received as a dividend arenot converted into U.S. dollars on the date of receipt, a U.S. holder will have basis in such Japanese yen equal totheir U.S. dollar value on the date of receipt, and any foreign currency gains or losses resulting from theconversion of the Japanese yen will generally be treated as U.S. source ordinary income or loss. If the Japaneseyen received as a dividend are converted into U.S. dollars on the date of receipt, a U.S. holder will generally notbe required to recognize foreign currency gain or loss in respect of the dividend income.
If a U.S. holder is eligible for benefits under the Tax Convention, the holder may be able to claim a reducedrate of Japanese withholding tax. All U.S. holders should consult their tax advisors about their eligibility forreduction of Japanese withholding tax. A U.S. holder may claim a deduction or a foreign tax credit, subject toother applicable limitations, only for tax withheld at the appropriate rate. A U.S. holder would be allowed aforeign tax credit for withholding tax for any portion of the tax that could have been avoided by claiming benefitsunder the Tax Convention. For foreign tax credit limitation purposes, the dividend will be income from sourcesoutside the United States. The limitation on foreign taxes eligible for credit is calculated separately with respectto specific classes of income. For this purpose, dividends we pay will constitute “passive income” or, in the caseof certain U.S. holders, “financial services income.” The rules governing U.S. foreign tax credits are verycomplex and U.S. holders should consult their tax advisors regarding the availability of foreign tax credits undertheir particular circumstances.
Subject to applicable exceptions with respect to short-term and hedged positions, qualified dividendsreceived by non-corporate U.S. holders from a qualified corporation may be eligible for reduced rates of taxation.Qualified corporations include those foreign corporations eligible for the benefits of a comprehensive income taxtreaty with the United States that the U.S. Treasury Department determines to be satisfactory for these purposesand that includes an exchange of information provision. The Tax Convention meets these requirements. Subjectto the PFIC discussion below, we believe that we are a qualified foreign corporation and that dividends receivedby U.S. investors with respect to our shares or ADSs will be qualified dividends. Dividends received by U.S.investors from a foreign corporation that was a PFIC in either the taxable year of the distribution or the precedingtaxable year are not qualified dividends.
Passive Foreign Investment Company Considerations
Special adverse U.S. federal income tax rules apply if a U.S. holder holds shares or ADSs of a company thatis treated as a PFIC, for any taxable year during which the U.S. holder held shares or ADSs. A foreign
172
corporation will be considered a PFIC for any taxable year in which (i) 75% or more of its gross income ispassive income (the “income test”), or (ii) 50% or more of the average fair market value of its assets (determinedquarterly) is attributable to assets that produce or are held for the production of passive income (the “asset test”).For this purpose, passive income generally includes dividends, interest, royalties, rents and certain gains from thesale of stock and securities. If a foreign corporation owns at least 25% (by value) of the stock of anothercorporation, the corporation will be treated, for purposes of the PFIC tests, as owning a proportionate share of theother corporation’s assets and receiving its proportionate share of the other corporation’s income. Thedetermination of whether a foreign corporation is a PFIC is made annually.
Proposed Treasury regulations convert what would otherwise be passive income into non-passive incomewhen such income is banking income earned by an active bank. Based upon these proposed Treasury regulations,and upon certain management estimates and assumptions, we do not believe that we were a PFIC for the yearended March 31, 2019 because we did not meet either the income test or the asset test. The determination ofwhether we are a PFIC must be made annually and involves a fact-intensive analysis based upon, among otherthings, the composition of our income and assets and the value of our assets from time to time. It is possible thatwe may become a PFIC in the fiscal year ending March 31, 2020 or any future taxable year due to changes in ourincome or asset composition and the expiration of the temporary IRS guidance described above. In addition, adecrease in the price of our shares may also result in our becoming a PFIC. Furthermore, there can be noassurance that the above-described proposed Treasury regulations will be finalized in their current form.Moreover, the application of the proposed Treasury regulations is not clear. If we were classified as a PFIC inany year during which a U.S. holder owns shares or ADSs and the U.S. holder does not make a “mark-to-market”election, as discussed below, we generally would continue to be treated as a PFIC as to such U.S. holder in allsucceeding years, regardless of whether we continue to meet the income or asset test discussed above. U.S.Holders are urged to consult their own tax advisors with respect to the tax consequences to them if we were tobecome a PFIC for any taxable year in which they own our shares or ADSs.
If we were classified as a PFIC for any taxable year during which a U.S. holder holds our shares or ADSs,the U.S. holder would generally not receive capital gains treatment upon the sale of the shares or ADSs andwould be subject to increased tax liability (generally including an interest charge) upon the sale or otherdisposition of the shares or ADSs or upon the receipt of certain distributions treated as “excess distributions,”unless the U.S. holder makes the mark-to-market election described below. An excess distribution generallywould be any distribution to a U.S. holder with respect to shares or ADSs during a single taxable year that isgreater than 125% of the average annual distributions received by a U.S. holder with respect to shares or ADSsduring the three preceding taxable years or, if shorter, during the U.S. holder’s holding period for the shares orADSs.
Mark-to-Market Election. If the shares or ADSs are regularly traded on a registered national securitiesexchange or certain other exchanges or markets, then such shares or ADSs would constitute “marketable stock”for purposes of the PFIC rules, and a U.S. holder would not be subject to the foregoing PFIC rules if such holdermade a mark-to-market election. After making such an election, the U.S. holder generally would include asordinary income each year during which the election is in effect and during which we are a PFIC the excess, ifany, of the fair market value of our shares or ADSs at the end of the taxable year over such holder’s adjustedbasis in such shares or ADSs. These amounts of ordinary income would not be eligible for the favorable tax ratesapplicable to qualified dividend income or long-term capital gains. A U.S. holder also would be allowed to takean ordinary loss in respect of the excess, if any, of the holder’s adjusted basis in our shares or ADSs over theirfair market value at the end of the taxable year (but only to the extent of the net amount of income that waspreviously included as a result of the mark-to-market election). A U.S. holder’s tax basis in our shares or ADSswould be adjusted to reflect any income or loss amounts resulting from a mark-to-market election. If made, amark-to-market election would be effective for the taxable year for which the election was made and for allsubsequent taxable years unless the shares or ADSs cease to qualify as “marketable stock” for purposes of thePFIC rules or the IRS consented to the revocation of the election. In the event that we are classified as a PFIC,
173

U.S. holders are urged to consult their tax advisors regarding the availability of the mark-to-market election, andwhether the election would be advisable in the holder’s particular circumstances.
QEF Election. The PFIC rules outlined above also would not apply to a U.S. holder if such holderalternatively elected to treat us as a “qualified electing fund” or “QEF.” An election to treat us as a QEF will notbe available, however, if we do not provide the information necessary to make such an election. We will notprovide U.S. holders with the information necessary to make a QEF election, and thus, the QEF election will notbe available with respect to our shares.
Notwithstanding any election made with respect to our shares, dividends received with respect to our shareswill not constitute “qualified dividend income” if we are a PFIC in either the year of the distribution or thepreceding taxable year. Dividends that do not constitute qualified dividend income are not eligible for taxation atthe reduced tax rate described above in “—Taxation of Dividends.” Instead, such dividends would be subject totax at ordinary income rates.
If a U.S. holder owns shares or ADSs during any year in which we are a PFIC, the U.S. holder must also fileIRS Form 8621 regarding distributions received on the shares or ADSs, any gain realized on the shares or ADSs,and any “reportable election” in accordance with the instructions to such form. In addition, each U.S. holder isrequired to file a separate IRS Form 8621 if such U.S. holder owns shares or ADSs during any year in which weare a PFIC whether or not such U.S. holder received distributions on the shares or ADSs, realized a gain on theshares or ADSs or made a “reportable election” during such year. U.S. holders are urged to consult their own taxadvisors concerning the U.S. federal income tax consequences of holding shares or ADSs if the Company wereconsidered a PFIC in any taxable year.
Taxation of Capital Gains
Subject to the application of the PFIC rules discussed above, upon a sale or other disposition of shares orADSs, a U.S. holder will recognize a gain or loss in an amount equal to the difference between the U.S. dollarvalue of the amount realized and the U.S. holder’s tax basis, determined in U.S. dollars, in such shares or ADSs.Such gains or losses will be capital gains or losses and will be long-term capital gains or losses if the U.S.holder’s holding period for such shares or ADSs exceeds one year. Long-term capital gains of non-corporateU.S. holders (including individuals) are generally eligible for reduced rates of taxation. A U.S. holder’s adjustedtax basis in its shares or ADSs will generally be the cost to the holder of such shares or ADSs. Any such gains orlosses realized by a U.S. holder upon disposal of the shares or ADSs will generally be income or loss fromsources within the United States for foreign tax credit limitation purposes. The deductibility of capital losses issubject to limitations under the Code.
Information Reporting and Backup Withholding
Dividends paid on shares or ADSs to a U.S. holder, or proceeds from a U.S. holder’s sale or otherdisposition of shares or ADSs, may be subject to information reporting requirements. Those dividends orproceeds from sale or disposition may also be subject to backup withholding unless the U.S. holder:
‰ is a corporation or other exempt recipient, and, when required, demonstrates this fact; or
‰ provides a correct taxpayer identification number on a properly completed U.S. IRS Form W-9 or otherappropriate form which certifies that the U.S. holder is not subject to backup withholding and otherwisecomplies with applicable requirements of the backup withholding rules.
Backup withholding is not an additional tax. Any amount withheld under these rules will be creditableagainst the U.S. holder’s U.S. federal income tax liability or refundable to the extent that it exceeds such liabilityif the U.S. holder provides the required information to the IRS. If a U.S. holder is required to and does notprovide a correct taxpayer identification number, the U.S. holder may be subject to penalties imposed by the IRS.All holders should consult their tax advisors as to their qualification for the exemption from backup withholdingand the procedure for obtaining an exemption.
174
In addition, certain U.S. holders who are individuals that hold certain foreign financial assets (which mayinclude our shares or ADSs) are required to report information relating to such assets, subject to certainexceptions. U.S. holders should consult their tax advisors regarding the effect, if any, of this requirement on theirownership and disposition of our shares and ADSs.
Additional Tax on Investment Income
U.S. holders that are individuals, estates or trusts and whose income exceeds certain thresholds will besubject to an additional 3.8% tax on unearned income, including, among other things, dividends on, and capitalgains from the sale or other taxable disposition of, shares or ADSs, subject to certain limitations and exceptions.
F. Dividends and Paying Agents
Not applicable.
G. Statement by Experts
Not applicable.
H. Documents on Display
We file periodic reports and other information with the SEC. You may read and copy any document that wefile with the SEC at the SEC’s public reference room at 100 F Street, NE, Washington, DC 20549. Please call theSEC at 1-800-SEC-0330 for further information on the operation of its public reference room. The SEC alsomaintains a web site that contains reports, proxy and information statements and other information regardingregistrants that file electronically with the SEC (http://www.sec.gov).
I. Subsidiary Information
Please refer to the discussion under “Item 4.C. Information on the Company—Organizational Structure.”
Item 11. Quantitative and Qualitative Disclosures about Credit, Market and Other Risk.
In the current market and regulatory environment, financial groups such as us are expected to ensureincreasingly more sophisticated and comprehensive risk management. Risk management plays an increasinglyimportant role in our operations as a financial group operating globally through various subsidiaries.
We identify various risks arising from businesses based on group-wide uniform criteria and implementintegrated risk management to ensure a stronger financial condition and to maximize shareholder value. Based onthis approach, we identify, measure, control and monitor a wide variety of risks so as to achieve a stable balancebetween earnings and risks. We undertake risk management to create an appropriate capital structure and toachieve optimal allocation of resources.
175

Risk Classification
At the holding company level, we broadly classify and define risk categories faced by the Group, includingthose that are summarized below. Group companies perform more detailed risk management based on theirrespective operations.
Type of Risk Definition
Credit Risk The risk of financial loss in credit assets (including off-balance sheetinstruments) caused by deterioration in the credit conditions of counterparties.This category includes country risk.
Market Risk The risk of financial loss where the value of our assets and liabilities could beadversely affected by changes in market variables such as interest rates,securities prices and foreign exchange rates. Market liquidity risk is the risk offinancial loss caused by the inability to secure market transactions at therequired volume or price levels as a result of market turbulence or lack oftrading liquidity.
Funding Liquidity Risk The risk of incurring loss if a poor financial position at a group companyhampers the ability to meet funding requirements or necessitates fundprocurement at interest rates markedly higher than normal.
Operational Risk The risk of loss resulting from inadequate or failed internal processes, peopleor systems, or from external events.
‰ Operations Risk The risk of incurring losses arising from negligence of correct operationalprocessing, incidents or misconduct involving officers or staff, as well as riskssimilar to this risk.
‰ Information Risk The risk of loss caused by loss, alteration, falsification or leakage of personalor other confidential information, as well as risks similar to these risks.
‰ IT Risk The risk of loss arising from destruction, suspension, malfunction or misuse ofIT, or unauthorized alteration and leakage of electronic data caused byinsufficient IT systems planning, development or operations or byvulnerabilities of or external threats to IT system security, includingcybersecurity, as well as risks similar to these risks.
‰ Tangible Asset Risk The risk of loss due to damage to tangible assets or deterioration in theoperational environment caused by disasters or inadequate asset maintenance,as well as risks similar to this risk. Tangible assets include movable andimmovable property, including owned or leased land and buildings, facilitiesincidental to buildings, and fixtures and fittings.
‰ Personnel Risk The risk of loss due to an outflow or loss of human resources or deteriorationin employee morale, as well as risks similar to this risk.
‰ Incompliance withLaws and RegulationsRisk
The risk of loss due to failure to comply with laws and regulations, as well asrisks similar to these risks.
‰ Legal Risk The risk of a loss due to failure to identify or address legal issues relating tocontracts and other business operations or insufficient handling of lawsuits, aswell as risks similar to these risks.
Reputation Risk The risk of harm to our corporate value arising from perceptions of ourcustomers, shareholders, investors or other stakeholders and in the market orsociety that we deviate from their expectations or confidence.
Model Risk The risk of loss due to decision-making based on information provided by aninaccurate model or the misuse of a model.
176
Risk Management System
We have adopted an integrated risk management system to promote close cooperation among the holdingcompany and group companies. The holding company and the major subsidiaries (which include MUFG Bank,Mitsubishi UFJ Trust and Banking and Mitsubishi UFJ Securities Holdings) each appoint a chief risk officer andestablish an independent risk management division. The board of directors of the holding company determines riskmanagement policies for various types of risks based on the discussions at, and reports and recommendations from,committees established specially for risk management purposes. The holding company has established committeesto oversee management in managing risks relevant to the Group. Following the fundamental risk managementpolicies determined by the board of directors, each group company establishes its own systems and procedures foridentifying, analyzing and managing various types of risks from both quantitative and qualitative perspectives. Theholding company seeks to enhance group-wide risk identification, to integrate and improve the Group’s riskmanagement system and related methods, to maintain asset quality, and to eliminate concentrations of specific risks.
177

The following diagram summarizes our integrated risk management framework:
Risk Management System
MUFG
Risk Committee
U.S. Risk Committee
Board of Directors
Executive CommitteeManagement Planning
Committee(including ALM)
Corporate Risk ManagementDivision
(cordinates risk management)
Credit Policy &Planning Division
Global Compliance Division
Human Resources Division
MUFG BANK
Risk ManagementCommittee
Board of Directors
Executive CommitteeALM Committee
Corporate Planning Meeting
Credit Risk
Settlement Risk
Operations Risk
IT Risk
Information Risk
Information RiskIncompliance with Laws and
Requlations Risk
Information RiskIncompliance with Laws and
Requlations Risk
Customer ProtectionCommittee,
System StrategyCommittee
MUTB
Risk ManagementCommittee
(including crisismanagement)
Capital ManagementCommittee
Credit Committee
Board of Directors
Executive Committee ALM Committee
Corporate Risk ManagementDivision
(cordinates risk management)
Credit Risk, Market Risk,Funding Liquidity Risk,
Operational Risk,Reputation Risk,
Model Risk,Operations Risk,Information Risk
Business Process andIT Planning Division
Tangible Asset Risk
Personnel RiskPersonnel Division
Mitsubishi U
FJ SecuritiesO
ther Com
panies
Personnel Risk
Tangible Asset Risk
Legal Risk
MUFG Group Companies
Market Risk,Funding Liquidity Risk,
Operational Risk,Operations Risk,
Reputation Risk, Model Risk
Market Risk,Funding Liquidity Risk,
Operational Risk,Reputation Risk,
Model Risk
Credit Risk
Information Risk,Incompliance with Laws and
Regulations Risk
Legal Risk
IT Risk
Personnel Risk
Tangible Asset Risk
Risk Management Committee
Operational Risk Working Group
Crisis ManagementWorking Group
Loan and InvestmentCommittee
Group-wideCredit Committee
Credit Committee
CPM Committee
Operational Risk Working Group
Crisis ManagementWorking Group
Loan and InvestmentCommittee
Operations & SystemsPlanning Division
Legal Division
Corporate AdministrationDivision
Setting of basicpolicies/guidance/
advice, etc.Consultation/reporting, etc.
Incompliance with Laws andRegulations Risk
Incompliance with Lawsand Regulations Risk,
Legal Risk
Global ComplianceDivision
CorporateAdministration Division
Legal RiskLegal Division
IT Risk
Corporate Risk ManagementDivision
(cordinates risk management)
Credit Policy & PlanningDivision
Transaction BankingPlanning Office
Operations PlanningDivision
Information SystemsPlanning Division
Global ComplianceDivision
Global FinancialCrimes Division
Corporate AdministrationDivision
Human ResourcesDivision
Legal Division
Crisis Management Framework
In order to have a clear critical response rationale and associated decision-making criteria, we havedeveloped systems designed to ensure that our operations are not interrupted or can be restored to normal quicklyin the event of a natural disaster or system failure so as to minimize any disruption to customers and markets. Acrisis management team within the holding company is the central coordinating body in the event of anyemergency. Based on information collected from crisis management personnel at the major subsidiaries, thiscentral body would assess the overall impact of a crisis on the Group’s business and establish task forces that
178
could implement all countermeasures to restore full operations. We have business continuity plans to maintaincontinuous operational viability in the event of natural disasters, system failures and other types of emergencies.Regular training drills are conducted to upgrade the practical effectiveness of these systems.
Recognizing that our operations, particularly in Japan, are subject to the risk of earthquakes and othernatural disasters as well as accidents resulting from such disasters, including a sudden massive blackout in majormetropolitan areas in Japan, and that our contingency plans may not address all eventualities that may occur inthe event of a material disruption to our operations, we conduct a comprehensive review of our existing businesscontinuity plan to more effectively respond to such extreme scenarios, and contemplate and implement measuresto augment our current business continuity management framework, including enhancing our off-site back-updata storage and other information technology systems.
Implementation of Basel Standards
In determining capital ratios under the FSA guidelines implementing Basel III, we and our bankingsubsidiaries used the Advanced Internal Ratings-Based approach, or the AIRB approach, to calculate capitalrequirements for credit risk as of March 31, 2019. The Standardized Approach is used for some subsidiaries thatare considered to be immaterial to the overall MUFG capital requirements, and MUFG Americas Holdings hasadopted a phased rollout of the Internal Ratings-Based Approach. We reflect market risk in our risk-weightedassets by applying the Internal Models Approach to calculate general market risk and the StandardizedMeasurement Method to calculate specific risk. Under the Internal Models Approach, we principally use ahistorical simulation model to calculate value-at-risk, or VaR, amounts by estimating the profit and loss on ourportfolio by applying actual fluctuations in historical market rates and prices over a fixed period. Under the FSAguidelines implementing Basel III, we reflect operational risk in our risk-weighted assets by using theStandardized Approach and the Advanced Measurement Approach.
Based on the Basel III framework, the Japanese capital ratio framework has been revised to implement themore stringent requirements, which are being implemented in phases beginning on March 31, 2013. Likewise,local banking regulators outside of Japan, such as those in the United States, have begun, or are expected, torevise the capital and liquidity requirements imposed on our subsidiaries and operations in those countries toimplement the more stringent requirements of Basel III as adopted in those countries. We intend to carefullymonitor further developments with an aim to enhance our corporate value and maximize shareholder value byintegrating the various strengths within the Group. For more information on the Basel regulatory framework andrequirements, see “Item 4.B. Information on the Company—Business Overview—Supervision and Regulation.”
Credit Risk Management
Credit risk is the risk of losses due to deterioration in the financial condition of a borrower. We haveestablished risk management systems to maintain asset quality, manage credit risk exposure and achieve earningscommensurate with risk.
MUFG and its major banking subsidiaries apply a uniform credit rating system for asset evaluation andassessment, loan pricing, and quantitative measurement of credit risk. This system also underpins the calculationof capital requirements and the management of credit portfolios. We continually seek to our upgrade creditportfolio management, or CPM, expertise to achieve an improved risk-adjusted return based on the Group’scredit portfolio status and flexible response capability to economic and other external changes.
Credit Risk Management System
The credit portfolios of our major banking subsidiaries are monitored and assessed on a regular basis by theholding company to maintain and improve asset quality. A uniform credit rating and asset evaluation andassessment system is used to ensure timely and proper evaluation of all credit risks.
179

Under our credit risk management system, each of our subsidiaries in the banking, securities, consumerfinance, and leasing businesses, manages its respective credit risk on a consolidated basis based on the attributesof the risk, while the holding company oversees and manages credit risk on an overall group-wide basis. Theholding company also convenes regular committee meetings to monitor credit risk management at bankingsubsidiaries and to issue guidance where necessary.
Each major banking subsidiary has in place a system of checks and balances in which a credit administrationsection that is independent of the business promotion sections screens individual transactions and manages theextension of credit. At the management level, regular meetings of the Credit & Investment ManagementCommittee and related deliberative bodies ensure full discussion of important matters related to credit riskmanagement. Besides such checks and balances and internal oversight systems, credit examination sections alsoundertake credit testing and evaluation to ensure appropriate credit risk management.
The following diagram summarizes the credit risk management framework for our major bankingsubsidiaries:
Internal audit sections
Credit screeningand management Credit testing and evaluation
Quantitative riskmonitoring
•Discussion of important matters•Transaction report
•Decisions regarding important matters•Delegation of authority Regular report
Monitoring by MUFGCredit & Investment
Management CommitteeCredit Committee
Credit risk managementsections
Credit administrationsections
Business promotionsections
Board of Directors/Executive CommitteeCredit & Investment Management Committee/
related deliberative bodies
Credit Rating System
MUFG and its major banking subsidiaries use an integrated credit rating system to evaluate credit risk. Thecredit rating system consists primarily of borrower rating, facility risk rating, structured finance rating and assetsecuritization rating.
Country risk is also rated on a uniform group-wide basis. Our country risk rating is reviewed periodically totake into account relevant political and economic factors, including foreign currency availability.
Risk exposure for small retail loans, such as residential mortgage loans, is managed by grouping loans intovarious pools and assigning ratings at the pool level.
Borrower rating
Our borrower rating classifies borrowers into 15 grades based on evaluations of their expected debt-servicecapability over the next three to five years.
180
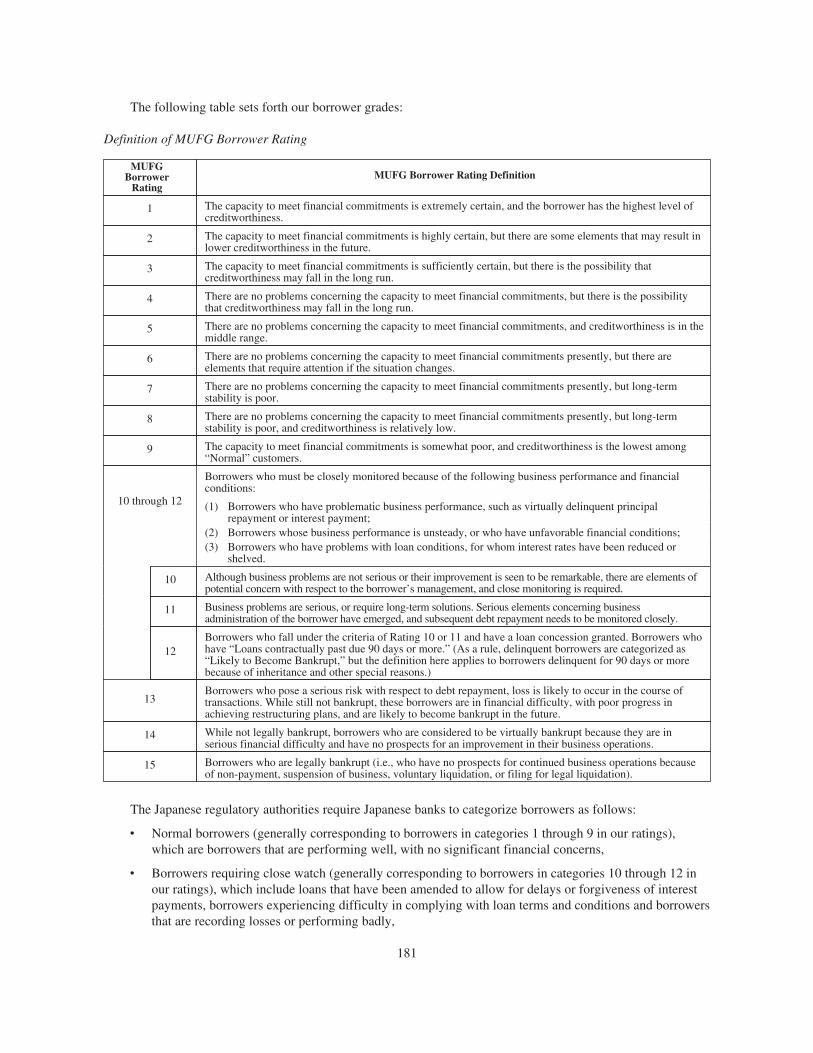
The following table sets forth our borrower grades:
Definition of MUFG Borrower Rating
MUFGBorrower
RatingMUFG Borrower Rating Definition
1 The capacity to meet financial commitments is extremely certain, and the borrower has the highest level ofcreditworthiness.
2 The capacity to meet financial commitments is highly certain, but there are some elements that may result inlower creditworthiness in the future.
3 The capacity to meet financial commitments is sufficiently certain, but there is the possibility thatcreditworthiness may fall in the long run.
4 There are no problems concerning the capacity to meet financial commitments, but there is the possibilitythat creditworthiness may fall in the long run.
5 There are no problems concerning the capacity to meet financial commitments, and creditworthiness is in themiddle range.
6 There are no problems concerning the capacity to meet financial commitments presently, but there areelements that require attention if the situation changes.
7 There are no problems concerning the capacity to meet financial commitments presently, but long-termstability is poor.
8 There are no problems concerning the capacity to meet financial commitments presently, but long-termstability is poor, and creditworthiness is relatively low.
9 The capacity to meet financial commitments is somewhat poor, and creditworthiness is the lowest among“Normal” customers.
10 through 12
Borrowers who must be closely monitored because of the following business performance and financialconditions:
(1) Borrowers who have problematic business performance, such as virtually delinquent principalrepayment or interest payment;
(2) Borrowers whose business performance is unsteady, or who have unfavorable financial conditions;(3) Borrowers who have problems with loan conditions, for whom interest rates have been reduced or
shelved.
10 Although business problems are not serious or their improvement is seen to be remarkable, there are elements ofpotential concern with respect to the borrower’s management, and close monitoring is required.
11 Business problems are serious, or require long-term solutions. Serious elements concerning businessadministration of the borrower have emerged, and subsequent debt repayment needs to be monitored closely.
12Borrowers who fall under the criteria of Rating 10 or 11 and have a loan concession granted. Borrowers whohave “Loans contractually past due 90 days or more.” (As a rule, delinquent borrowers are categorized as“Likely to Become Bankrupt,” but the definition here applies to borrowers delinquent for 90 days or morebecause of inheritance and other special reasons.)
13Borrowers who pose a serious risk with respect to debt repayment, loss is likely to occur in the course oftransactions. While still not bankrupt, these borrowers are in financial difficulty, with poor progress inachieving restructuring plans, and are likely to become bankrupt in the future.
14 While not legally bankrupt, borrowers who are considered to be virtually bankrupt because they are inserious financial difficulty and have no prospects for an improvement in their business operations.
15 Borrowers who are legally bankrupt (i.e., who have no prospects for continued business operations becauseof non-payment, suspension of business, voluntary liquidation, or filing for legal liquidation).
The Japanese regulatory authorities require Japanese banks to categorize borrowers as follows:
‰ Normal borrowers (generally corresponding to borrowers in categories 1 through 9 in our ratings),which are borrowers that are performing well, with no significant financial concerns,
‰ Borrowers requiring close watch (generally corresponding to borrowers in categories 10 through 12 inour ratings), which include loans that have been amended to allow for delays or forgiveness of interestpayments, borrowers experiencing difficulty in complying with loan terms and conditions and borrowersthat are recording losses or performing badly,
181
‰ Borrowers likely to become bankrupt (generally corresponding to borrowers in category 13 in ourratings), which relate to borrowers who pose a serious risk with respect to debt repayment and withwhom loss is likely to occur in the course of transactions. While still not bankrupt, these borrowers arein financial difficulty, with poor progress in achieving restructuring plans, and are likely to becomebankrupt in the future,
‰ Virtually bankrupt borrowers (generally corresponding to borrowers in category 14 in our ratings),which are not legally bankrupt, but borrowers who are considered to be virtually bankrupt because theyare in serious financial difficulty and have no prospects for an improvement in their business operations,and
‰ Bankrupt borrowers or de facto bankrupt borrowers (generally corresponding to borrowers incategory 15 in our ratings), which are borrowers who are legally bankrupt (i.e., who have no prospectsfor continued business operations because of non-payment, suspension of business, voluntaryliquidation, or filing for legal liquidation proceedings).
The primary data utilized in our assessment of borrowers include the borrower’s financial statements andnotes thereto as well as other public disclosure made by the borrower. In addition, when appropriate and possible,we obtain non-public financial and operating information from borrowers, such as the borrower’s business plan,borrower’s self-evaluation of its operating assets and other borrower information about its business and products.
Based on the borrower and industry information, we assign borrower ratings mainly by applying financialscoring models—either developed internally or by third-party vendors, depending on the borrower’s attributes,whether the borrower is domestic or foreign, whether the borrower is a large corporation or a small andmedium-sized corporation, and whether the borrower is a corporate entity or another type of legal entity (such asa school, hospital or fund).
For example, for domestic small and medium-sized corporations, which constitute the largest borrowerattribute in our current loan portfolio in terms of number of borrowers, we have adopted an internally developedfinancial scoring model, exclusively designed and developed for such attribute. We have selected variousfinancial ratios that we believe to be useful and meaningful to quantitatively measure and assess the borrowers’financial standing and repayment capability. Such financial ratios represent, among other things, borrowers’growth, profitability, stability, cash flow, company size and capital efficiency. The model is periodically testedagainst historical results. The following is an illustration of some of the financial ratios we utilize as part of ourfinancial scoring model:
‰ To measure growth: Sales growth, and growth in total assets,
‰ To measure profitability: Current profit to sales, and profit before tax to sales, and
‰ To measure stability: Equity ratio and current ratio.
The financial score obtained through the models is reviewed and, when necessary, adjusted downward toreflect our qualitative assessment of the borrower’s financial strength and other factors that could affect theborrower’s ability to service the debt. For example, we take into account: capability of turning around thebusiness (in case of borrowers with losses) or recovering positive net worth (in case of borrowers with negativenet worth), industry risk, management risk, legal risk, as well as our assessment of the probability of receivingsupport from parent companies (if the borrower is a subsidiary of a large listed company).
When adjusting the results of primary financial scoring assigned to borrowers with losses, we consider theseverity of losses and the possibility of improving operating results. We analyze and assess whether the loss istemporary, the trend in operating results is improving, or the loss is expected to continue for an extended period.When adjusting the results of primary financial scoring assigned to borrowers with losses or borrowers withnegative net worth, we also analyze whether the borrower can return to a positive net worth, and the time periodneeded to achieve such recovery (one to two years, three to five years, or five years or more).
182

In addition, adjustments based on industry risk are based on future prospects, applicable laws andregulations, and other factors surrounding the industry. Adjustments for management risk reflect our assessmentof management’s track record, the composition of the management team including the board of directors, anymanagement succession plan as well as the risk management and compliance framework of the borrower.Adjustments for legal risk are made when the borrower is facing a lawsuit and when there is a possibility of asignificant claim payment related to product liability, intellectual property, environmental problems, buildingstandard law, and other legal issues.
When assessing the probability of receiving support from parent companies, various factors are examined,such as the parent company’s credit standings, whether key management personnel are sent by the parent,whether the borrower is consolidated by the parent, and the proportion of the borrower in consolidated sales andprofits of the parent.
In addition, we consider outside ratings, and our internal borrower ratings may be adjusted when deemedappropriate.
Facility risk rating
Facility risk rating is used to evaluate and classify the quality of individual credit facilities, includingguarantees and collateral. Ratings are assigned by quantitatively measuring the estimated loss rate of a facility inthe event of a default.
Structured finance rating and asset securitization rating
Structured finance rating and asset securitization rating are used to evaluate and classify the quality ofindividual credit facilities, including guarantees and collateral, and focus on the structure, including theapplicable credit period, of each credit facility. In evaluating the debt service potential of a credit facility, wescrutinize its underlying structure to determine the likelihood of the planned future cash flows being achieved.
Pool assignment
Each major banking subsidiary has its own system for pooling and rating small retail loans designed toreflect the risk profile of its loan portfolios.
Asset evaluation and assessment system
The asset evaluation and assessment system is used to classify assets held by us according to the probabilityof collection and the risk of any impairment in value based on borrower classifications consistent with theborrower ratings and the status of collateral, guarantees, and other factors.
The system is used to conduct write-offs and allocate allowances against credit risk in a timely and adequatemanner.
Quantitative Analysis of Credit Risk
MUFG and its major banking subsidiaries manage credit risk by monitoring credit amount and expectedlosses, and run simulations based on internal models to estimate the maximum amount of credit risk. Thesemodels are used for internal management purposes, including loan pricing and measuring economic capital.
When quantifying credit risk amounts using the internal models, MUFG and its major banking subsidiariesconsider various parameters, including the probability of default, loss given default, and exposure at default usedin their borrower ratings, facility risk ratings and pool assignments as well as any credit concentration risk inparticular borrower groups or industry sectors. MUFG and its major banking subsidiaries also share creditportfolio data in appropriate cases.
183
Loan Portfolio Management
We aim to achieve and maintain levels of earnings commensurate with credit risk exposure. Products arepriced to take into account expected losses, based on the internal credit ratings.
We assess and monitor loan amounts and credit exposure by credit rating, industry and region. Portfolios aremanaged to limit concentrations of risk in specific categories in accordance with our Large Credit Guidelines.
To manage country risk, we have established specific credit ceilings by country. These ceilings are reviewedwhen there is a material change in a country’s credit standing, in addition to being subject to a regular periodicreview.
Continuous CPM Improvement
With the prevalence of securitized products and credit derivatives in global markets, we seek to supplementconventional CPM techniques with advanced methods based on the use of such market-based instruments.
Through credit risk quantification and portfolio management, we aim to improve the risk return profile ofthe Group’s credit portfolio, using financial markets to rebalance credit portfolios in a dynamic and activemanner based on an accurate assessment of credit risk.
Risk Management of Strategic Equity Portfolio
Strategic equity investment risk is the risk of loss caused by a decline in the prices of our equityinvestments.
We hold shares of various corporate clients for strategic purposes, in particular to maintain long-termrelationships with these clients. These investments have the potential to increase business revenue and appreciatein value. At the same time, we are exposed to the risk of price fluctuation in the Japanese stock market. For thatreason, in recent years, it has been a high priority for us to reduce our equity portfolio to limit the risks associatedwith holding a large equity portfolio, but also to respond to applicable regulatory requirements as well asincreasing market expectations and demands for us to reduce our equity portfolio. We are required to complywith a regulatory framework that prohibits Japanese banks from holding an amount of shares in excess of theiradjusted Tier 1 capital.
We use quantitative analysis to manage the risks associated with the portfolio of equities held for strategicpurposes. According to internal calculations, the market value of our strategically held (Tokyo Stock Exchange-listed) stocks (excluding foreign stock exchange-listed stocks) as of March 31, 2019 was subject to a variation ofapproximately ¥3.1billion when TOPIX index moves one point in either direction.
We seek to manage and reduce strategic equity portfolio risk based on quantitative analysis such as thesensitivity analysis described above. The aim is to keep this risk at appropriate levels compared with Tier 1capital while generating returns commensurate with the degree of risk exposure.
Market Risk Management
Market risk is the risk that the value of our assets and liabilities could be adversely affected by changes inmarket variables such as interest rates, securities prices, or foreign exchange rates.
Management of market risk at MUFG aims to control related risk exposure across the Group while ensuringthat earnings are commensurate with levels of risk.
184

Market Risk Management System
We have adopted an integrated system to manage market risk from our trading and non-trading activities.The holding company monitors group-wide market risk, while each of the major subsidiaries manages its marketrisks on a consolidated and global basis.
At each of the major subsidiaries, checks and balances are maintained through a system in which back andmiddle offices operate independently from front offices. In addition, separate Asset-Liability Management, orALM, Committee and Risk Management Meetings are held at each of the major subsidiaries every month todeliberate important matters related to market risk and control.
The holding company and the major subsidiaries allocate economic capital commensurate with levels ofmarket risk and determined within the scope of their capital bases. The major subsidiaries have establishedquantitative limits relating to market risk based on their allocated economic capital. In addition, in order to keeplosses within predetermined limits, the major subsidiaries have also set limits for the maximum amount of lossesarising from market activities. The following diagram summarizes the market risk management system of eachmajor subsidiary:
Market Risk Management System of Our Major Subsidiaries
Board of Directors / Executive CommitteeALM Committee / Risk Management Meeting
Middle Office(Market risk management
departments)
Back Office
Front Office
Delegation ofauthority Trading result report
Report
Confirmation of contracts and agreements
Quantitative risk monitoring
Market Risk Management and Control
At the holding company and the major subsidiaries, market risk exposure is reported to the Chief RiskOfficers on a daily basis. At the holding company, the Chief Risk Officer monitors market risk exposure acrossthe Group as well as the major subsidiaries’ control over their quantitative limits for market risk and losses.Meanwhile, the Chief Risk Officers at the major subsidiaries monitor their own market risk exposure and theircontrol over their quantitative limits for market risk and losses. In addition, various analyses on risk profiles,including stress testing, are conducted and reported to the Executive Committees and the Corporate RiskManagement Committees on a regular basis. At the business unit levels in the major subsidiaries, the marketrisks on their marketable assets and liabilities, such as interest rate risk and foreign exchange rate risk, arecontrolled by entering into various hedging transactions using marketable securities and derivatives.
As part of our market risk management activities, we use certain derivative financial instruments to manageour interest rate and currency exposures. We maintain an overall interest rate risk management strategy thatincorporates the use of interest rate contracts to minimize significant unplanned fluctuations in earnings that arecaused by interest rate volatility. We enter into interest rate swaps and other contracts as part of our interest raterisk management strategy primarily to alter the interest rate sensitivity of our loans, investment securities anddeposit liabilities. Our principal objectives in risk management include asset and liability management. Asset andliability management is viewed as one of the methods for us to manage our interest rate exposures on interest-earning assets and interest-bearing liabilities. Interest rate contracts, which are generally non-leveraged generic
185
interest rate and basis swaps, options and futures, allow us to effectively manage our interest rate risk position.Option contracts primarily consist of caps, floors, swaptions and options on index futures. Futures contracts usedfor asset and liability management activities are primarily index futures providing for cash payments based uponthe movement of an underlying rate index. We enter into forward exchange contracts, currency swaps and othercontracts in response to currency exposures resulting from on-balance sheet assets and liabilities denominated inforeign currencies in order to limit the net foreign exchange position by currency to an appropriate level.
These market risk management activities are performed in accordance with the predetermined rules andprocedures. The internal auditors regularly verify the appropriateness of the management controls over theseactivities and the risk evaluation models adopted.
Market Risk Measurement Model
Market risks consist of general risks and specific risks. General market risks result from changes in entiremarkets, while specific risks relate to changes in the prices of individual stocks and bonds which are independentof the overall direction of the market.
To measure market risks, MUFG uses the VaR method which estimates changes in the market value ofportfolios within a certain period by statistically analyzing past market data. Since the daily variation in marketrisk is significantly greater than that in other types of risk, MUFG measures and manages market risk using VaRon a daily basis.
Market risk for trading and non-trading activities is measured using a uniform market risk measurementmodel. The principal model used for these activities is a historical simulation, or HS, model (holding period,10 business days; confidence interval, 99%; and observation period, 701 business days). The HS modelcalculates VaR amounts by estimating the profit and loss on the current portfolio by applying actual fluctuationsin market rates and prices over a fixed period in the past. This method is designed to capture certain statisticallyinfrequent movements, such as a fat tail, and accounts for the characteristics of financial instruments withnon-linear behavior. The holding company and banking subsidiaries also use the HS model as part of thecalculation of their Basel III regulatory capital adequacy ratios.
In calculating VaR using the HS method, we have implemented an integrated market risk measurementsystem throughout the Group. Our major subsidiaries calculate their VaR based on the risk and market dataprepared by the information systems of their front offices and other departments. The major subsidiaries providethis risk data to the holding company, which calculates overall VaR, taking into account the diversification effectamong all portfolios of the major subsidiaries.
For the purpose of internally evaluating capital adequacy on an economic capital basis in terms of marketrisk, we use this market risk measurement model to calculate risk amounts based on a holding period of one yearand a confidence interval of 99.9%.
Monitoring and managing our sensitivity to interest rate fluctuations is the key to managing market risk inMUFG’s non-trading activities. The major banking subsidiaries take the following approach to measuring risksconcerning core deposits, loan prepayments and early deposit withdrawals.
To measure interest rate risk relating to deposits without contract-based fixed maturities, the amount of“core deposits” is calculated through a statistical analysis based on deposit balance trend data and the outlook forinterest rates on deposits, business decisions, and other factors. The amount of “core deposit” is categorized intovarious groups of maturity terms of up to ten years to recognize interest rate risk. The calculation assumptionsand methods to determine the amount of core deposits and maturity term categorization are regularly reviewed.
Meanwhile, deposits and loans with contract-based maturities are sometimes cancelled or repaid before theirmaturity dates. To measure interest rate risk for these deposits and loans, we reflect these early termination
186
events mainly by applying early termination rates calculated based on a statistical analysis of historicalrepayment and cancellation data together with historical market interest rate data.
Summaries of Market Risks (Fiscal Year Ended March 31, 2019)
Trading activities
The aggregate VaR for our total trading activities as of March 31, 2019 was ¥20.84 billion, comprisinginterest rate risk exposure of ¥20.58 billion, foreign exchange risk exposure of ¥4.44 billion, and equity-relatedrisk exposure of ¥1.55 billion. Compared with the VaR as of March 31, 2018, we experienced an increase inmarket risk during the fiscal year ended March 31, 2019, primarily due to an increase in interest rate risk.
Our average daily VaR for the fiscal year ended March 31, 2019 was ¥14.25 billion. Based on a simple sumof figures across market risk categories, interest rate risk accounted for approximately 67%, foreign exchangerisk for approximately 23% and equity-related risk for approximately 10%, of our total trading activity marketrisks.
Due to the nature of trading operations which involves frequent changes in trading positions, market riskvaried substantially during the fiscal year, depending on our trading positions.
The following tables set forth the VaR related to our trading activities by risk category for the periodsindicated:
April 1, 2017—March 31, 2018 Average Maximum(1) Minimum(1) March 31, 2018
(in billions)
MUFG . . . . . . . . . . . . . . . . . . . . . . . . . . . . . . . . . . . . . . . . . ¥13.58 ¥18.46 ¥11.29 ¥13.27Interest rate . . . . . . . . . . . . . . . . . . . . . . . . . . . . . . . . . 13.28 16.93 11.47 12.79
Yen . . . . . . . . . . . . . . . . . . . . . . . . . . . . . . . . . . . 6.59 9.79 4.70 6.72U.S. Dollars . . . . . . . . . . . . . . . . . . . . . . . . . . . . . 5.96 8.46 3.94 4.63
Foreign exchange . . . . . . . . . . . . . . . . . . . . . . . . . . . . . 4.66 7.69 2.62 3.83Equities . . . . . . . . . . . . . . . . . . . . . . . . . . . . . . . . . . . . 1.81 5.72 0.62 1.99Commodities . . . . . . . . . . . . . . . . . . . . . . . . . . . . . . . . 0.01 0.20 0.00 0.00Less diversification effect . . . . . . . . . . . . . . . . . . . . . . (6.18) — — (5.34)
April 1, 2018—March 31, 2019 Average Maximum(1) Minimum(1) March 31, 2019
(in billions)
MUFG . . . . . . . . . . . . . . . . . . . . . . . . . . . . . . . . . . . . . . . . . ¥14.25 ¥35.71 ¥11.42 ¥20.84Interest rate . . . . . . . . . . . . . . . . . . . . . . . . . . . . . . . . . 13.32 20.94 10.78 20.58
Yen . . . . . . . . . . . . . . . . . . . . . . . . . . . . . . . . . . . 5.52 9.45 3.44 4.40U.S. Dollars . . . . . . . . . . . . . . . . . . . . . . . . . . . . . 5.28 11.23 3.27 11.03
Foreign exchange . . . . . . . . . . . . . . . . . . . . . . . . . . . . . 4.52 7.26 3.10 4.44Equities . . . . . . . . . . . . . . . . . . . . . . . . . . . . . . . . . . . . 2.06 26.66 0.98 1.55Commodities . . . . . . . . . . . . . . . . . . . . . . . . . . . . . . . . 0.00 0.05 0.00 0.00Less diversification effect . . . . . . . . . . . . . . . . . . . . . . (5.65) — — (5.73)
Assumptions for VaR calculations:
Historical simulation methodHolding period: 10 business daysConfidence interval: 99%Observation period: 701 business days
Note:(1) The maximum and minimum VaR overall and for various risk categories were taken from different days. A simple summation of VaR by
risk category is not equal to total VaR due to the effect of diversification.
187

The average daily VaR by quarter in the fiscal year ended March 31, 2019 was as follows:
Quarter Daily average VaR
(in billions)
April—June 2018 . . . . . . . . . . . . . . . . . . . . . . . . . . . . . . . . . . . . . . . . . . . . . . . . . . . . . . . . . . . . . ¥13.84July—September 2018 . . . . . . . . . . . . . . . . . . . . . . . . . . . . . . . . . . . . . . . . . . . . . . . . . . . . . . . . . 13.71October—December 2018 . . . . . . . . . . . . . . . . . . . . . . . . . . . . . . . . . . . . . . . . . . . . . . . . . . . . . . . 14.51January—March 2019 . . . . . . . . . . . . . . . . . . . . . . . . . . . . . . . . . . . . . . . . . . . . . . . . . . . . . . . . . . 14.96
The quantitative market risk figures from trading activities tend to fluctuate widely due to the marketsensitive nature of the trading business. During the fiscal year ended March 31, 2019, the revenue from ourtrading activities has been relatively stable, keeping positive numbers in 244 days out of 259 trading days in theperiod. During the same period, there were 62 days with positive revenue exceeding ¥1 billion and 1 day withnegative revenue exceeding minus ¥1 billion.
Non-trading Activities
The aggregate VaR for our total non-trading activities as of March 31, 2019, excluding market risks relatedto our strategic equity portfolio and measured using the same standards as trading activities, was ¥315.5 billion.Market risk related to interest rates equaled ¥283.1 billion and equities-related risk equaled ¥202.5 billion.Compared with the VaR as of March 31, 2018, we experienced a decrease in market risk during the fiscal yearended March 31, 2019, primarily due to a decrease in interest rate risk and equities-related risk. For a descriptionof our strategic equity investment risk management, see “—Risk Management of Strategic Equity Portfolio.”
Based on a simple sum of figures across market risk categories, interest rate risks accounted forapproximately 58% of our total non-trading activity market risks. Looking at a breakdown of interest rate relatedrisk by currency, as of March 31, 2019, the yen accounted for approximately 44% while the U.S. dollaraccounted for approximately 32%, and the euro approximately 24%.
The following tables set forth the VaR related to our non-trading activities by risk category for the periodsindicated:
April 1, 2017—March 31, 2018 Average Maximum(1) Minimum(1) March 31, 2018
(in billions)
Interest rate . . . . . . . . . . . . . . . . . . . . . . . . . . . . . . . . . . . . . . . . ¥ 305.2 ¥330.1 ¥270.1 ¥ 304.9Yen . . . . . . . . . . . . . . . . . . . . . . . . . . . . . . . . . . . . . . . . . . 236.1 253.5 212.6 231.2U.S. Dollars . . . . . . . . . . . . . . . . . . . . . . . . . . . . . . . . . . . . 146.2 174.1 116.5 128.5
Foreign exchange . . . . . . . . . . . . . . . . . . . . . . . . . . . . . . . . . . . 8.0 10.8 3.4 10.0Equities(2) . . . . . . . . . . . . . . . . . . . . . . . . . . . . . . . . . . . . . . . . . 233.1 271.9 171.0 225.9Less diversification effect . . . . . . . . . . . . . . . . . . . . . . . . . . . . . (151.7) — — (154.9)Total . . . . . . . . . . . . . . . . . . . . . . . . . . . . . . . . . . . . . . . . . . . . . 394.6 440.5 348.4 385.9
April 1, 2018—March 31, 2019 Average Maximum(1) Minimum(1) March 31, 2019
(in billions)
Interest rate . . . . . . . . . . . . . . . . . . . . . . . . . . . . . . . . . . . . . . . . ¥ 290.3 ¥309.8 ¥265.2 ¥ 283.1Yen . . . . . . . . . . . . . . . . . . . . . . . . . . . . . . . . . . . . . . . . . . 219.2 240.3 169.6 169.6U.S. Dollars . . . . . . . . . . . . . . . . . . . . . . . . . . . . . . . . . . . . 114.0 140.8 85.9 122.2
Foreign exchange . . . . . . . . . . . . . . . . . . . . . . . . . . . . . . . . . . . 9.5 11.2 2.8 4.0Equities(2) . . . . . . . . . . . . . . . . . . . . . . . . . . . . . . . . . . . . . . . . . 215.6 245.1 147.4 202.5Less diversification effect . . . . . . . . . . . . . . . . . . . . . . . . . . . . . (170.1) — — (174.1)Total . . . . . . . . . . . . . . . . . . . . . . . . . . . . . . . . . . . . . . . . . . . . . 345.3 399.2 308.0 315.5
188
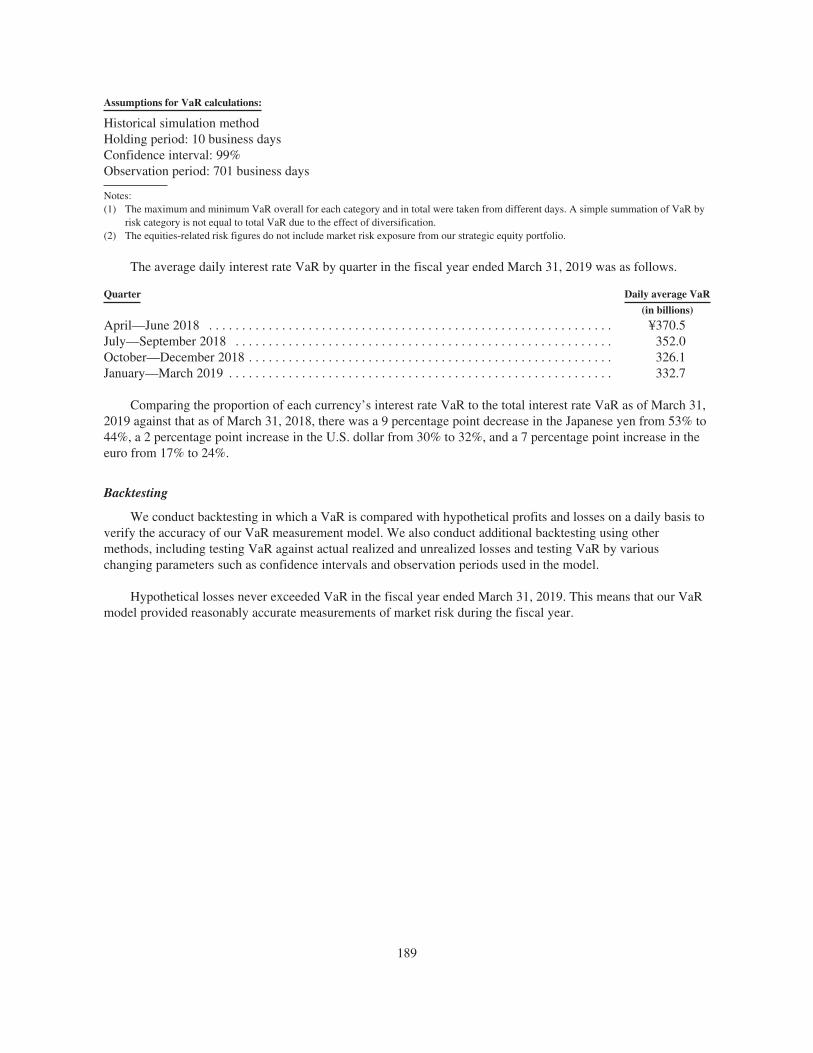
Assumptions for VaR calculations:
Historical simulation methodHolding period: 10 business daysConfidence interval: 99%Observation period: 701 business days
Notes:(1) The maximum and minimum VaR overall for each category and in total were taken from different days. A simple summation of VaR by
risk category is not equal to total VaR due to the effect of diversification.(2) The equities-related risk figures do not include market risk exposure from our strategic equity portfolio.
The average daily interest rate VaR by quarter in the fiscal year ended March 31, 2019 was as follows.
Quarter Daily average VaR
(in billions)
April—June 2018 . . . . . . . . . . . . . . . . . . . . . . . . . . . . . . . . . . . . . . . . . . . . . . . . . . . . . . . . . . . . . ¥370.5July—September 2018 . . . . . . . . . . . . . . . . . . . . . . . . . . . . . . . . . . . . . . . . . . . . . . . . . . . . . . . . . 352.0October—December 2018 . . . . . . . . . . . . . . . . . . . . . . . . . . . . . . . . . . . . . . . . . . . . . . . . . . . . . . . 326.1January—March 2019 . . . . . . . . . . . . . . . . . . . . . . . . . . . . . . . . . . . . . . . . . . . . . . . . . . . . . . . . . . 332.7
Comparing the proportion of each currency’s interest rate VaR to the total interest rate VaR as of March 31,2019 against that as of March 31, 2018, there was a 9 percentage point decrease in the Japanese yen from 53% to44%, a 2 percentage point increase in the U.S. dollar from 30% to 32%, and a 7 percentage point increase in theeuro from 17% to 24%.
Backtesting
We conduct backtesting in which a VaR is compared with hypothetical profits and losses on a daily basis toverify the accuracy of our VaR measurement model. We also conduct additional backtesting using othermethods, including testing VaR against actual realized and unrealized losses and testing VaR by variouschanging parameters such as confidence intervals and observation periods used in the model.
Hypothetical losses never exceeded VaR in the fiscal year ended March 31, 2019. This means that our VaRmodel provided reasonably accurate measurements of market risk during the fiscal year.
189
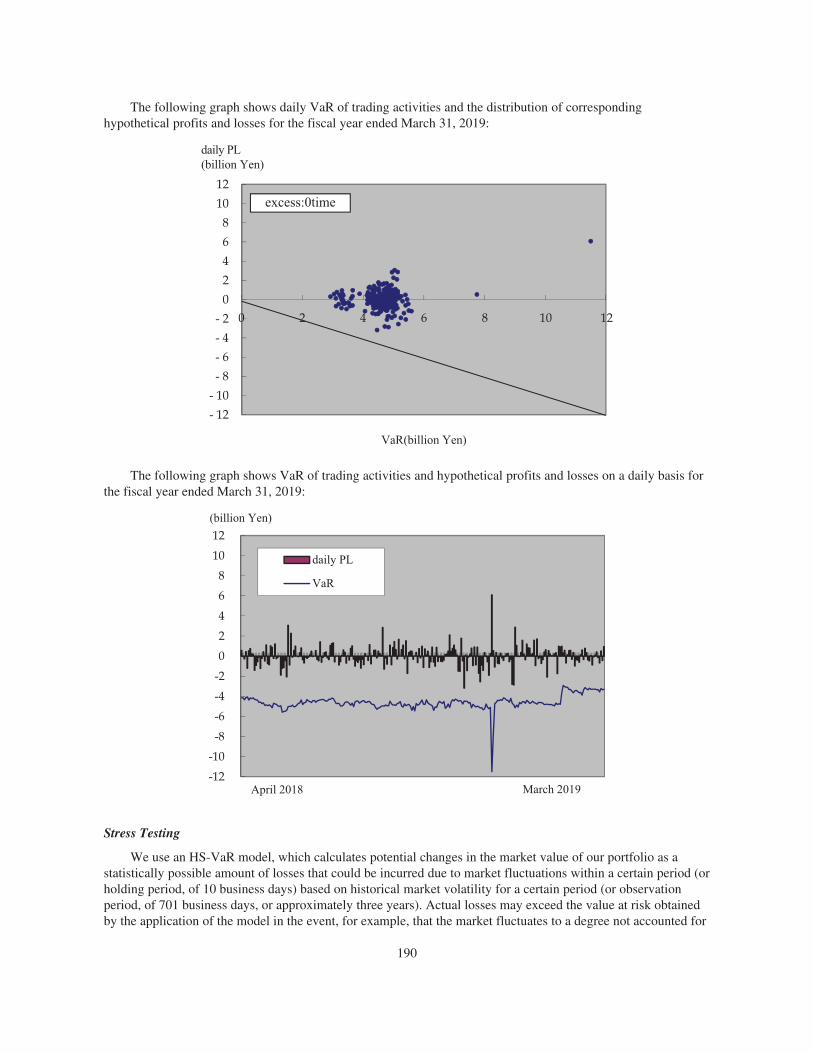
The following graph shows daily VaR of trading activities and the distribution of correspondinghypothetical profits and losses for the fiscal year ended March 31, 2019:
- 12- 10- 8- 6- 4- 2
02468
1012
0
daily PL(billion Yen)
VaR(billion Yen)
excess:0time
12108642
The following graph shows VaR of trading activities and hypothetical profits and losses on a daily basis forthe fiscal year ended March 31, 2019:
-12-10-8-6-4-202468
1012(billion Yen)
daily PL
VaR
April 2018 March 2019
Stress Testing
We use an HS-VaR model, which calculates potential changes in the market value of our portfolio as astatistically possible amount of losses that could be incurred due to market fluctuations within a certain period (orholding period, of 10 business days) based on historical market volatility for a certain period (or observationperiod, of 701 business days, or approximately three years). Actual losses may exceed the value at risk obtainedby the application of the model in the event, for example, that the market fluctuates to a degree not accounted for
190

in the observation period, or that the correlations among various risk factors, including interest rates and foreigncurrency exchange rates, deviate from those assumed in the model.
In order to complement these weaknesses of the HS-VaR model and measure potential losses that the modelis not designed to capture, we conduct stress testing. Through the daily stress testing, we estimate maximumpotential losses in each market on the current trading portfolio based on the worst ten-day historical volatilityrecorded during the VaR observation period of 701 days. As of March 31, 2019, we held a total trading activityposition subject to estimated maximum potential losses of ¥15.4 billion as compared to ¥8.8 billion as ofMarch 31, 2018. In addition, the holding company and major subsidiaries conduct stress testing, as appropriate,by applying various stress scenarios, including those which take into account estimates regarding future marketvolatility, in order to better identify risks and manage our portfolio in a more stable and appropriate manner. Theholding company and major subsidiaries also measure stressed VaR relating to their trading activities based on aone-year observation period with the highest VaR at least in the immediately preceding ten years.
Funding Liquidity Risk Management
Liquidity risk is the risk of incurring losses if a poor financial position hampers the ability to meet fundingrequirements, or necessitates fund procurement at interest rates markedly higher than normal.
Our major subsidiaries maintain appropriate liquidity in both Japanese yen and foreign currencies bymanaging their funding sources and mechanisms, such as liquidity gap, liquidity-supplying products such ascommitment lines, and buffer assets.
We have established a group-wide system for managing liquidity risk by categorizing the risk in thefollowing three stages: normal, concern and crisis. The front offices and risk management offices of the majorsubsidiaries and the holding company exchange information and data on liquidity risk even at the normal stage.At higher alert stages, we centralize information about liquidity risk and discuss issues relating to group-wideliquidity control actions among Group companies, if necessary. We have also established a system for liaison andconsultation on funding in preparation for contingency, such as natural disasters, wars and terrorist attacks. Theholding company and the major subsidiaries conduct group-wide contingency preparedness drills on a regularbasis to ensure smooth implementation in the event of an emergency.
In addition, we have established a group-wide system for ensuring compliance with the minimum regulatoryliquidity coverage ratio requirements by categorizing the risk in the following three stages: sufficient, concernand insufficient. The holding company and the major subsidiaries exchange information and data on LCR even atthe sufficient stage. At higher alert stages, we hold group-wide LCR liaison meetings to discuss issues relating toLCR and, based on the discussion as well as the information and data that have been shared, takecountermeasures to improve LCR as necessary.
For more information, see “Item 5.B. Operating and Financial Review and Prospects—Liquidity and CapitalResources—Financial Condition—Sources of Funding and Liquidity.”
Operational Risk Management
Operational risk refers to the risk of loss caused by either internal control issues such as inadequateoperational processes or misconduct, system failures, or external factors such as serious political instability,major terrorist activity, health epidemics or natural disasters. The term includes a broad range of risks that couldlead to losses, including operations risk, information risk, IT risk, tangible asset risk, personnel risk,incompliance with laws and regulations risk, and legal risk. These risks that comprise operational risk arereferred to as sub-category risks.
The holding company has established, based on its Executive Committee’s determination, the MUFGOperational Risk Management Policy as a group-wide policy for managing operational risk. This policy sets
191

forth the core principles regarding operational risk management, including the definition of operational risk, andthe risk management system and processes. Under the policy, the board of directors and the ExecutiveCommittee formulate fundamental principles of operational risk management and establish and maintain anappropriate risk management system. The Chief Risk Management Officer is responsible for recognizing,evaluating, and appropriately managing operational risk in accordance with the fundamental principlesformulated by the board of directors and the Executive Committee. A division in charge of operational riskmanagement has been established that is independent of business promotion sections to manage overalloperational risk in a comprehensive manner. These fundamental principles have also been approved by theboards of directors of the major subsidiaries, providing a consistent framework for operational risk managementof the Group. The diagram below sets forth the operational risk management system of each major bankingsubsidiary:
Operational Risk Management System of Our Major Banking Subsidiaries
Board of Directors/Execu�ve Commi�eecommi�ees regarding risk management
Audit divisionsOpera�onal risk
managementdivisions
Control oprera�ondivisions of the
sub-category risks
Audit Commi�ee(Repor�ng to
Board of Directors)
Repor�ng on risk profile
Review andChallenge
Instruc�on
Instruc�on
Instruc�onRepor�ng
Repor�ng Repor�ng
AuditHead office/
domes�c andoverseas units etc.
As set forth in the following diagram, we have established a risk management framework for loss datacollection, control self-assessment, and measurement of operational risk in order to appropriately identify,recognize, evaluate, measure, control, monitor and report operational risk.
We have also established group-wide reporting guidelines with respect to loss data collection and itsmonitoring. We focus our efforts on ensuring accurate assessment of the status of operational risk losses and theimplementation of appropriate countermeasures, while maintaining databases of internal and external loss events.
192

The following diagram summarizes our operational risk management framework:
Operational Risk Management Framework
identify and recognize
internal loss
external
create potential lossscenario
allocate economiccapital to
business units/subsidiaries
risk measurement monitoring of
prompt reporting tomanagement andrelevant supervisers
record
risk evaluation and management through Control Self-Assessment
incidentoccured
internal lossdata
external lossdata
create potential lossscenario
allocate economiccapital to
business units/subsidiaries
risk measurementmonitoring of
economic capital
causal analysis implement preventivemeasures
monitoring
prompt reporting tomanagement andrelevant supervisors
record major incidents and misconduct
risk evaluation and management through Control Self-Assessment
evaluate and measure control monitor and report
Operations Risk Management
Operations risk refers to the risk of incurring losses arising from negligence of correct operationalprocessing, incidents or misconduct involving officers or staff, as well as risks similar to this risk. The Groupcompanies offer a wide range of financial services, ranging from commercial banking products such as deposits,exchange services and loans to trust and related services covering pensions, securities, real estate andsecuritization, as well as transfer agent services. Cognizant of the potentially significant impact that operationsrisk-related events could have in terms of both economic losses and damage to our reputation, our bankingsubsidiaries continue to work on improving their management systems to create and apply appropriate operationsrisk-related controls.
Specific ongoing measures to reduce operations risk include the development of databases to manage,analyze and prevent the recurrence of related loss events; efforts to tighten controls over administrativeprocedures and related operating authority, while striving to improve human resources management, investmentsin systems to improve the efficiency of administrative operations, and programs to expand and upgrade internalauditing and operational guidance systems.
Senior management receives regular reports on the status of our businesses from an operations riskmanagement perspective. We work to promote the sharing within the Group of information and expertiseconcerning any operational incidents and the measures implemented to prevent any recurrence.
Efforts to upgrade the management of operations risk continue with the aim of providing our customers witha variety of high-quality services.
Information Risk Management
Information risk refers to the risk of loss caused by loss, alteration, falsification or leakage of personal orother confidential information, as well as risks similar to these risks. We recognize our grave social and legal
193

responsibility to handle customer information properly, and we continue to work on enhancing our framework tomanage such risk.
Complying with laws and regulations requiring proper handling of customer information, we implementinformation security management measures, including the establishment of an information risk managementframework, enhancement of our internal operational procedures, and training courses mandatory for all officersand staff.
We have also formulated our Personal Information Protection Policy as the basis for our ongoing programsdesigned to protect the confidentiality of personal information.
With the aim of preventing any recurrence and minimizing risk or loss, we also work to promote sharing ona group-wide basis of experience, knowledge and expertise related to information risk incidents.
IT Risk Management
IT risk refers to the risk of loss arising from destruction, suspension, malfunction or misuse of IT, orunauthorized alteration and leakage of electronic data caused by insufficient IT systems planning, developmentor operations or by vulnerabilities of or external threats to IT system security, including cybersecurity, as well asrisks similar to these risks.
Systems planning, development and operations include appropriate design and extensive testing phases toensure that systems are designed to help prevent failures while providing sufficient safeguards for the security ofelectronic data including personal information.
System development projects are managed and overseen by a team dedicated to perform such managementand oversight functions, and the development status of any mission-critical IT systems is reported regularly tosenior management.
We have developed disaster countermeasures systems and have also been investing in duplication of theGroup’s IT infrastructure to minimize damage in the event of any system failure. Emergency drills are conductedto help increase staff preparedness.
With the aim of preventing any recurrence and minimizing risk or loss, we also work to promote sharing ona group-wide basis of experience, knowledge and expertise related to system failures.
In addition, the risk of increasingly sophisticated cyber-attacks is a significant focus of the Board ofDirectors, and the Board regularly receives reports on our cybersecurity program. We continue to work tostrengthen measures designed to address and mitigate the risk, including the establishment of MUFG-CERT, ourComputer Security Incident Response Team, implementation of multi-layered defense and detection measures,enhancement of monitoring systems through our Security Operation Centers, and cooperation with globalorganizations with relevant expertise. MUFG-CERT is charged with the responsibility of taking, coordinatingand managing prompt action in response to cyber security incidents to mitigate their impact.
Tangible Asset Risk Management
Tangible asset risk refers to the risk of loss due to damage to tangible assets or deterioration in theoperational environment caused by disasters or inadequate asset maintenance, as well as risks similar to this risk.Tangible assets include movable physical properties and immovable properties, owned or leased, such as land,buildings, equipment attached to buildings, fixtures and furniture. We recognize the potentially significant impacttangible asset risk-related events can have on the management and execution of the Group’s businesses, which inturn can result in economic losses to, or diminished market confidence in, the Group. Accordingly, we continueto improve our risk control framework designed to appropriately manage such risk.
194
Personnel Risk Management
Personnel risk refers to the risk of loss due to an outflow or loss of human resources or deterioration inemployee morale, as well as risks similar to this risk. We recognize the potentially significant impact personnelrisk-related events can have on the management and execution of the Group’s businesses, which in turn canresult in economic losses to, or diminished market confidence in, the Group. Accordingly, we continue to workon improving our risk control framework designed to appropriately manage such risk.
Incompliance with Laws and Regulations Risk Management
Incompliance with laws and regulations risk refers to the risk of loss due to failure to compliance with lawsand regulations, as well as risks similar to these risks. We recognize the potentially significant impact compliancerisk-related events can have on the management and execution of the Group’s businesses, which in turn canresult in economic, reputation and other losses to, or diminished market confidence in, the Group. Accordingly,we continue to work on improving our compliance risk control framework designed to appropriately managesuch risk.
Specifically, we have established our MUFG Group Code of Conduct as the basic guideline for the Group’sdirectors and employees. In addition, a compliance management division has been established at each of theholding company and the major subsidiaries. See “—Compliance” below.
Legal Risk Management
Legal risk refers to the risk of loss due to failure to identify or address legal issues relating to contracts andother business operations or insufficient handling of lawsuits, as well as risks similar to these risks.
The legal division at each of the holding company and the major subsidiaries centrally and uniformlyevaluates legal issues prior to entering into contracts or commencing new business operations, deals with legaldisputes and manages other legal matters. With the aim of effectively managing our legal risk arising from ourglobally expanding business operations, we have established a global and group-wide legal risk managementframework and promote sharing of experience, knowledge and practices relating to legal risk issues on a globaland group-wide basis.
Regulatory Capital Requirements for Operational Risk
(1) Adoption of the Advanced Measurement Approach (AMA)
We have employed the AMA since March 31, 2012, in place of the Standardized Approach that we had beenusing previously, for calculation of the operational risk equivalent amount in connection with measuring capitaladequacy ratios based on the Basel Standards. On the other hand, we use the Basic Indicator Approach, or BIA,for entities that are deemed to be less important in the calculation of the operational risk equivalent amount andfor entities that are still preparing to implement the AMA.
(2) Outline of AMA
We have established a measurement model designed to account for four data elements—internal loss data,external loss data, scenario analysis, and business environment and internal control factors, or BEICFs—andcalculate the operational risk equivalent amount by estimating the maximum loss using a 99.9th percentileone-tailed confidence interval and a one-year holding period.
In calculating the operational risk equivalent amount, we exclude expected losses relating to the amount ofallowance for repayment of excess interest associated with the consumer finance business of a subsidiary. We donot exclude any other expected losses and do not reflect the risk mitigating impact of insurance. In addition, wetake into account credit risk-related events that are not reflected in the measurement of the credit risk equivalentamount.
195

(3) Outline of Measurement Model
Our operational risk equivalent amount measured under the AMA is a simple sum of the amounts calculatedseparately for (1) MUFG Bank on a consolidated basis, (2) Mitsubishi UFJ Trust and Banking on a consolidatedbasis, and (3) the holding company and other principal consolidated subsidiaries, in accordance with applicableFSA rules. For each of MUFG Bank and Mitsubishi UFJ Trust and Banking on a consolidated basis, theoperational risk equivalent amount is a simple sum of the amounts calculated based on the seven loss event typesdefined by the Basel Standards. For other Group companies, the operational risk equivalent amount is a simplesum of the amounts calculated based on eight loss event types consisting of the seven loss event types defined bythe Basel Standards and an additional loss event type representing losses relating to repayment of excess interestassociated with the consumer finance business of a subsidiary. We do not reflect the correlation effects amongthe loss event types in the calculation of our operational risk equivalent amount.
Outline of Measurement Model
Frequency Distribution
Loss Severity Distribution
Mon
te C
arlo
Sim
ulat
ion Loss Distribution
Scenario Analysis
Business Environment andInternal Control FactorsExternal Loss DataLitigation DataInternal Loss Data
Scenario DataInternal Loss Data
Loss Amount
OccurrenceFrequency
OccurrenceFrequency
Loss Amount
Basel Loss Event Types
Internal FraudRisk Equivalent Amount
External FraudRisk Equivalent Amount
Employment Practices and Workplace SafetyRisk Equivalent Amount
Clients, Products, and Business PracticesRisk Equivalent Amount
Damage to Physical AssetsRisk Equivalent Amount
Business Disruption and System FailuresRisk Equivalent Amount
Execution, Delivery, and Process ManagementRisk Equivalent Amount
Repayment of Excess InterestRisk Equivalent Amount
The risk equivalent amount for each loss event type represents the amount of maximum loss estimated witha 99.9th percentile one-tailed confidence interval and a one-year holding period based on the distribution oflosses arising from all relevant risk events for a one-year period (Loss Distribution). A Loss Distributioncombines a Frequency Distribution (through which the frequency of occurrence of risk events is expressed) and aLoss Severity Distribution (through which the amounts of losses resulting from risk events are expressed)through Monte Carlo simulations. The data used for this purpose include internal loss data and scenario data.scenario data are generated through a scenario analysis. External data and BEICFs are taken into account in thescenario analysis and reflected in scenario data. The Frequency Distribution is derived from the occurrencefrequency information in internal loss data and scenario data expressed through a Poisson Distribution. The LossSeverity Distribution is derived from the amount information in internal loss data and scenario data expressed ina non-parametric manner (where no underlying distribution is assumed).
With respect to the risk of losses relating to repayment of excess interest associated with the consumerfinance business of a subsidiary, the risk equivalent amount represents the amount of maximum loss estimatedwith a 99.9th percentile one–tailed confidence interval and a one-year holding period based on a normaldistribution assumed by applying data on losses that arose in a given period, excluding any related expectedlosses.
We confirm the appropriateness of the measurement models by periodic verification and back testing.
(4) Outline of Scenario Analysis
As an initial step of our scenario analysis, we identify potential severe loss events that we have notexperienced but may potentially experience in the future. In this identification process, we seek to ensure
196
exhaustive coverage of potential severe loss events by comprehensively examining our experience relating to lossevents and legal proceedings, external loss data, the control self-assessment results and other relevantinformation.
In the next step, we prepare scenario data for each identified severe loss event by quantifying the valuesdepending on its occurrence frequency and loss severity, taking into account relevant transaction amounts andrestructuring costs as well as BEICFs. In preparing scenario data, we apply an analysis method we deemappropriate for the type and nature of the operational risk involved.
In order to obtain an operational risk equivalent amount that is commensurate with, and appropriate for, ourrisk profile, we assess the need for an additional scenario or modification to our existing scenarios semi-annually.
We then reflect, as necessary, new risks arising as a result of changes in the business environment and theresults of the implementation of measures to enhance our internal controls in response to newly identified risks inour scenario data.
Reputation Risk Management
Reputation risk refers to the risk of harm to our corporate value arising from perceptions of our customers,shareholders, investors or other stakeholders and in the market or society that we deviate from their expectationsor confidence. We recognize that such risk, if materialized, can have a material negative impact on our businessand continue to work on enhancing our framework designed to appropriately manage the risk based on ourCorporate Vision, MUFG Group Code of Conduct, and other rules and codes of the Group.
Specifically, in order to manage our reputation risk effectively on a group-wide basis, we have established arisk management system designed to ensure mutual consultation and reporting if a reputation risk-related eventoccurs or is anticipated and, through this system, share relevant information within the Group.
Through the risk control framework and risk management system, we seek to prevent reputation risk-relatedevents and minimize damage to the corporate value of the Group by promptly obtaining an accurateunderstanding of relevant facts relating to risk events and disclosing information concerning such events and themeasures we take in response to such events in an appropriate and timely manner.
Model Risk Management
Model risk refers to the risk of loss due to decision-making based on information provided by an inaccuratemodel or the misuse of a model. We recognize the potentially significant impact model risk-related events canhave on the management and execution of the Group’s businesses, which in turn can result in economic losses to,or diminished market confidence in, the Group. Models are used for increasingly wider and more importantpurposes, including valuing exposures, instruments and positions, measuring risks, and determining capitaladequacy. Accordingly, we continue to work on improving our risk control framework.
Compliance
Basic Policy
We have clarified our mission, our vision and our values in the Corporate Vision and have expressed ourcommitment to meeting the expectations of customers and society as a whole. Furthermore, we have establishedMUFG Group Code of Conduct as the guidelines for how the Group’s directors and employees act to realize theCorporate Vision, in which we have expressed our commitment to complying with laws and regulations, toacting with honesty and integrity, and to behaving in a manner that supports and strengthens the trust andconfidence of society.
197

In addition, as we expand the geographic scope of our business globally, we are committed to keepingabreast of developments in laws and regulations of the jurisdictions in which we operate including anti-moneylaundering and anti-bribery, as well as paying attention to trends in financial crimes.
See “Item 3.D. Key Information—Risk Factors—Risks Related to Our Business—Legal and regulatorychanges could have a negative impact on our business, financial condition and results of operations.” and“Item 3.D. Key Information—Risk Factors—Risks Related to Our Business—We may become subject toregulatory actions or other legal proceedings relating to our transactions or other aspects of our operations, whichcould result in significant financial losses, restrictions on our operations and damage to our reputation.” See also“Item 4.B. Information on the Company—Business Overview—Supervision and Regulation.”
MUFG Group Code of Conduct
The Code of Conduct encapsulates the standards that guide staff conduct and decision-making in ourday-to-day business activities under the MUFG Corporate Vision. It is designed to provide guidance intimes of doubt, or when we find it difficult to know if we are making the right choice.
Chapter 1 deals with the attitude we should adopt with our customers.
Acting with honesty and integrity and pursuing the best interests of our customers is a core component ofour business practices.
Chapter 2 presents a set of standards designed to help us fulfill our responsibilities as a good corporatecitizen.
MUFG’s reputation depends upon the trust and confidence of our customers and other stakeholders,including local communities, and we are responsible to society on a global level.
Chapter 3 describes the actions and mindset that will create a stimulating and supportive workingenvironment as MUFG continues to grow.
Our success depends on building and maintaining a dynamic workplace where all staff can reach their fullpotential in ways that support our customers and make a valuable contribution to society as a whole.
Chapter 1.Customer Focus
Our customers are at the center of everything we do, and should always be the focus of our thoughts. Ouraim should be to win the trust and confidence of our customers at all times. MUFG exists today because of thetrust and confidence that customers have placed in us over many years. Our role is to increase and strengthen thisbedrock of trust and confidence. Our activities are not driven by the prospect of short-term gains. Instead, welook to build ongoing relationships with our customers to support their long-term growth.
1-1 Honesty and Integrity
Our customers are at the center of everything we do. We carry out fair and transparent corporate activitieswith honesty and integrity. We treat customer assets with care and respect and strive always to ensure thatour actions do not unjustly damage our customers’ interests.
1-2 Ensuring Quality
To build lasting relationships of trust and confidence with our customers, we listen carefully to what ourcustomers are telling us, and maintain thoroughgoing quality control of all our products and services, fromplanning and development to provision and subsequent revisions, with a view to further enhancing quality.
198

1-3 Exceeding Customer Expectations
We aim to meet the diverse needs of our customers worldwide, and to provide services exceeding theirexpectations through the highest standards of professionalism, by leveraging our global network and theconsolidated strengths of the entire Group.
Chapter 2 Responsibility as a Corporate Citizen
As we develop our business globally, we comply with all the domestic and international laws and rules thatmay apply. We do all we can to maintain stability and confidence in the global financial system, and contributeto the sound and healthy growth of society. Aware of the responsibility each of us has as a member of MUFG, wecarry out fair and transparent corporate activities with honesty and integrity, in a manner that supports andstrengthens the trust and confidence MUFG has earned from society over many years.
2-1 Adherence to Laws and Rules
In addition to adhering strictly to all domestic and international laws and rules, we strive to do the rightthing based on our strict code of ethics.
Violations of laws or rules damage the vital social infrastructure of the financial system and lead to a loss oftrust in MUFG. We strictly abide by all laws and rules relating to our business, including the prohibition ofinsider trading, ban on unfair trading practices, anti-bribery and corruption and appropriate disclosure.
2-2 Prevention of Financial Crime
We have zero tolerance for financial crime or any attempt to circumvent the rules and procedures aimed atpreventing financial crime. We take all reasonable steps possible to prevent our products and services beingused by individuals or entities involved in illegal or improper activities such as money laundering andterrorist financing.
2-3 Contributing to Society
We respect the history, cultures, and customs of different countries and regions around the world, and workto contribute to the development of local and global communities and the protection of the environmentthroughout our corporate activities and the social volunteer efforts of our staff.
Chapter 3 Attitudes and Behaviors in the Workplace
We strive to respond and adapt promptly to the diversifying and evolving needs of our customers and therapidly changing environment in which we work. The working environment at MUFG fosters mutual respect,enables individuals to make the most of their abilities as professionals, and maximizes the power of teamworkacross regions and different areas of business, encouraging all staff to embrace new challenges. We work alwaysto protect and maintain the tangible and intangible assets and property that MUFG has accumulated.
3-1 Challenge Ourselves to Grow
We strive to enhance our knowledge, expertise, and potential and maximize the power of teamwork. Webelieve that the changing business environment represents opportunity and are always ready to embrace newchallenges in new fields.
3-2 Collaborative and Professional Working Environment
We respect the human rights and diversity of all MUFG staff. We do not engage in or tolerate any form ofdiscrimination or harassment or any other behavior that infringes these beliefs.
199

3-3 Protecting MUFG’s Assets and Property
We protect the tangible and intangible assets and property of MUFG and individual Group entities, and donot tolerate any behavior that might damage these assets.
3-4 Reporting Problem Situations and Seeking Advice
If you become aware of conduct that contravenes the law, company regulations, or the provisions of thisCode of Conduct, or any other problem situations, you should promptly report the matter and seek advicefrom a supervisor or issue a report via MUFG’s whistleblowing system.
Compliance Framework
Management and coordination of compliance-related matters are the responsibility of separate compliancemanagement divisions established at the holding company and the major subsidiaries. Each compliancemanagement division formulates compliance programs and organizes training courses to promote compliance,and regularly reports to each company’s board of directors and Executive Committee on the status of complianceactivities.
The holding company has established a Group Compliance Committee and each major subsidiary hasestablished a Compliance Committee for deliberating key issues related to compliance. Additionally, the holdingcompany has a Group Chief Compliance Officer, or CCO, Committee, which consists of the CCO of the holdingcompany acting as committee chairman and the CCOs of the major subsidiaries. The Group CCO Committeedeliberates important matters related to compliance and compliance-related issues for which the Group shouldshare a common understanding.
200
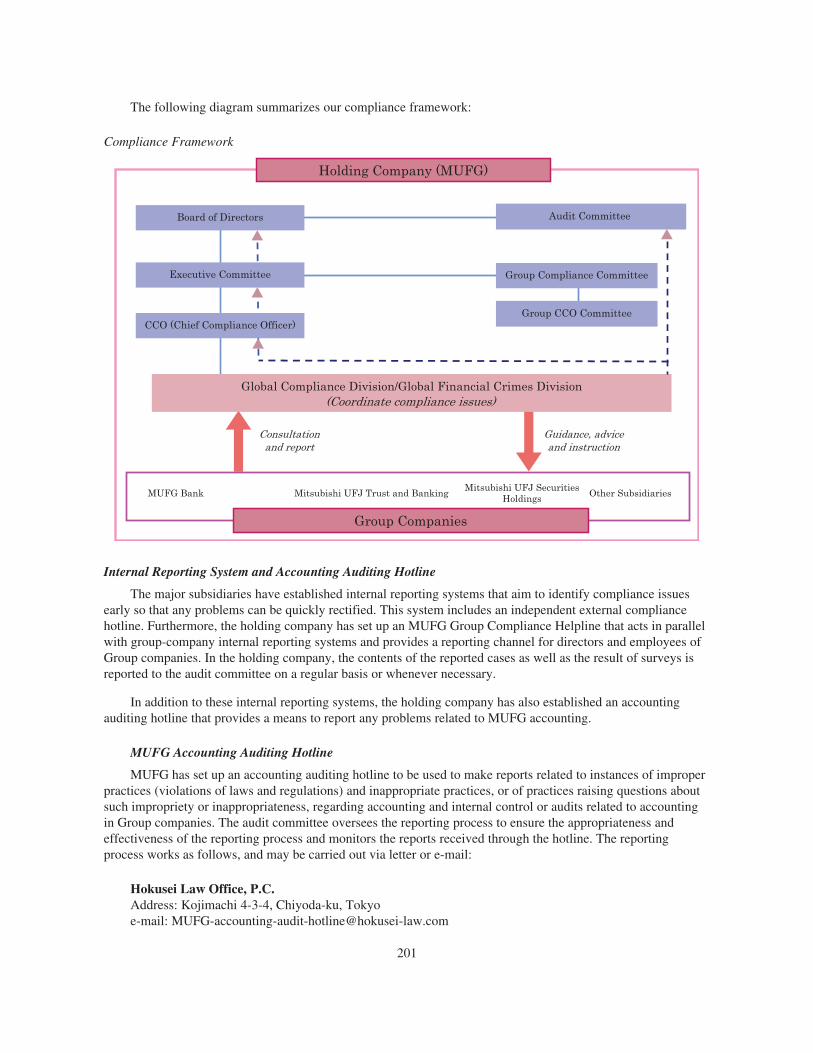
The following diagram summarizes our compliance framework:
Compliance Framework
Holding Company (MUFG)
Global Compliance Division/Global Financial Crimes Division
Board of Directors Audit Committee
Executive Committee Group Compliance Committee
Group CCO CommitteeCCO (Chief Compliance Officer)
MUFG Bank Mitsubishi UFJ Trust and Banking Mitsubishi UFJ SecuritiesHoldings Other Subsidiaries
Group Companies
(Coordinate compliance issues)
Guidance, adviceand instruction
Consultationand report
Internal Reporting System and Accounting Auditing Hotline
The major subsidiaries have established internal reporting systems that aim to identify compliance issuesearly so that any problems can be quickly rectified. This system includes an independent external compliancehotline. Furthermore, the holding company has set up an MUFG Group Compliance Helpline that acts in parallelwith group-company internal reporting systems and provides a reporting channel for directors and employees ofGroup companies. In the holding company, the contents of the reported cases as well as the result of surveys isreported to the audit committee on a regular basis or whenever necessary.
In addition to these internal reporting systems, the holding company has also established an accountingauditing hotline that provides a means to report any problems related to MUFG accounting.
MUFG Accounting Auditing Hotline
MUFG has set up an accounting auditing hotline to be used to make reports related to instances of improperpractices (violations of laws and regulations) and inappropriate practices, or of practices raising questions aboutsuch impropriety or inappropriateness, regarding accounting and internal control or audits related to accountingin Group companies. The audit committee oversees the reporting process to ensure the appropriateness andeffectiveness of the reporting process and monitors the reports received through the hotline. The reportingprocess works as follows, and may be carried out via letter or e-mail:
Hokusei Law Office, P.C.Address: Kojimachi 4-3-4, Chiyoda-ku, Tokyoe-mail: [email protected]
201
When reporting information please pay attention to the following:
‰ Matters subject to reporting are limited to instances regarding the Group companies.
‰ Please provide detailed information with respect to the matter. Without detailed factual informationthere is a limit to how much our investigations can achieve.
‰ Anonymous information will be accepted.
‰ No information regarding the identity of the informant will be passed on to third parties without theapproval of the informant him- or herself. However, this excludes instances where disclosure is legallymandated, or to the extent that the information is necessary for surveys or reports, when data may bepassed on following the removal of the informant’s name.
‰ Please submit reports in either Japanese or English.
‰ If the informant wishes, we will endeavor to report back to the informant on the response taken within areasonable period of time following the receipt of specific information, but cannot promise to do so inall instances.
Internal Audit
Role of Internal Audit
Internal Audit aims to evaluate and assist in the improvement of the effectiveness of governance, riskmanagement and control processes with high proficiency and independence, thereby contributing to theenhancement of the corporate value of the MUFG Group and to the achievement of the Group’s corporate vision.Internal Audit covers all aspects of the Group’s business activities and discusses and evaluates the managementand operational frameworks and the implementation of business operations from legal compliance, rationalityand efficiency perspectives, beyond checking compliance with defined procedures.
In addition, Internal Audit provides instructions and recommendations for operational improvement toaudited divisions and reports to senior management on such instructions and recommendations, therebycontributing to safeguarding and development of the Group’s assets.
Three Lines of Defense Framework
Risk management is conducted at multiple levels within a business organization, including front-officedivisions in charge of managing specific categories of risk, a compliance division, and an internal audit division.
As for financial institutions, including the MUFG Group, based on the experience of past financial crises,the traditional risk management structure that was heavily dependent on front-office divisions has been underclose scrutiny. As a result, there is an increasing expectation for financial institutions to achieve more effectiverisk management through, for example, appropriate allocation of risk management roles and responsibilitiesamong various divisions.
202

Cognizant of the importance of these developments, we have adopted the concept of “Three Lines ofDefense” where the roles and responsibilities of each division in risk management are defined, classifyingdivisions within a financial institution into “the 1st Line of Defense”, “the 2nd Line of Defense” and “the 3rdLine of Defense”.
Line Divisions Roles
The 1st Line of Defense Business divisions andclient-facing divisions
• Undertake risks within the extent of risk exposureassigned
• Responsible and accountable for identifying,evaluating and controlling business risks
The 2nd Line of Defense Risk managementdivision, compliancedivision, etc.
• Ensure that risks are appropriately identified andmanaged by the 1st Line of Defense
The 3rd Line of Defense Internal audit division • Independently evaluate the effectiveness of thegovernance, risk management, and control processesimplemented by the 1st and 2nd Lines of Defense
Internal Audit plays an essential role in the Group’s risk management through ongoing communicationswith the 1st and 2nd Lines of Defense, while maintaining independence.
Group Internal Audit Framework
The MUFG Group has internal audit functions at the holding company level as well as at the subsidiarylevel, which are designed to ensure proficiency and independence through effective collaboration.
The internal audit division of the holding company receives reports from the internal audit divisions ofsubsidiaries on the status and results of their internal audits and provides them with instructions and evaluationsas needed.
Reports to the Audit Committee
The holding company has an audit committee within its board of directors as required by the Companies Actof Japan, and each of the major subsidiaries has established an audit and supervisory committee or an internalaudit and compliance committee. Within each of the holding company and the major subsidiaries, the internalaudit division reports to the committee on important matters, including governing principles for internal auditplans and the status and results of internal audits.
MUFG Internal Audit Activity Charter
In April 2019, we adopted “MUFG Internal Audit Activity Charter”, which defines our basic policies forInternal Audit, including its mission, purposes, responsibilities, and roles.
This charter is designed to encourage Internal Audit staff to conduct internal audits in accordance with theglobal standards set by the Institute of Internal Auditors, an international organization established for, amongother purposes, formulating practical internal audit standards.
203

Item 12. Description of Securities Other than Equity Securities.
A. Debt Securities
Not applicable.
B. Warrants and Rights
Not applicable.
C. Other Securities
Not applicable.
D. American Depositary Shares
For a description of ADSs, each representing one share of our common stock, see Exhibit 2(c) to thisAnnual Report.
Fees, charges and other payments relating to ADSs
As a holder of our ADSs, you will be required to pay to The Bank of New York Mellon, as depositary forthe ADRs, or the Depositary, either directly or indirectly, the following fees or charges. The Depositary collectsits fees for delivery and surrender of ADRs directly from investors depositing shares or surrendering ADRs forthe purpose of withdrawal or from intermediaries acting for them. The Depositary collects fees for makingdistributions to investors by deducting those fees from the amounts distributed or by selling a portion ofdistributable property to pay the fees.
ADS holders must pay: For:
$5.00 (or less) per 100 ADSs (or portion thereof) Each issuance of an ADR, including as a result of adistribution of shares or rights or other property
Each cancellation of an ADR, including if theagreement terminates
$0.02 (or less) per ADS Any cash distribution, to the extent permitted by anysecurities exchange on which the ADSs may be listedfor trading
A fee equivalent to the fee that would be payableif securities distributed to the ADS holder hadbeen shares and the shares had been deposited forissuance of ADRs
Distribution of securities distributed to holders ofdeposited securities which are distributed by theDepositary to registered ADS holders
Registration or transfer fees Transfer and registration of shares on the shareregister from your name to the name of The Bank ofNew York Mellon or its agent and vice versa whenyou deposit or withdraw shares
Expenses of The Bank of New York Mellon Conversion of foreign currency to U.S. dollars, aswell as cable, telex and facsimile transmissionexpenses
Taxes and other governmental charges The Bankof New York Mellon or MUFG Bank, ascustodian, have to pay on any ADS or shareunderlying an ADS, for example, stock transfertaxes, stamp duty or withholding taxes
As necessary
204

Fees Waived or Paid by the Depositary
The Depositary has agreed to waive the standard out-of-pocket administrative, maintenance and otherexpenses for providing services to the registered holders of our ADSs, which include the expenses relating to thedelivery of annual reports, dividend fund remittances, stationery, postage and photocopying. For the fiscal yearended March 31, 2019, the Depositary waived $135,030.16 of standard out-of-pocket expenses.
The Depositary has also agreed to reimburse us for expenses related to the administration and maintenanceof the ADS program, including investor relations expenses, the annual New York Stock Exchange listing feesand other program-related expenses. There is a limit on the amount of expenses for which the Depositary willreimburse us based and conditioned on the number of outstanding ADSs and the amount of dividend feescollected by the Depositary. For the fiscal year ended March 31, 2019, the Depositary reimbursed us $1.0 millionfor such expenses.
205

PART II
Item 13. Defaults, Dividend Arrearages and Delinquencies.
None.
Item 14. Material Modifications to the Rights of Security Holders and Use of Proceeds.
None.
Item 15. Controls and Procedures.
Disclosure Controls and Procedures
An evaluation was carried out under the supervision and with the participation of our management,including the Chief Executive Officer, or CEO, and the Chief Financial Officer, or CFO, of the effectiveness ofour disclosure controls and procedures, as defined in Rule 13a-15(e) under the U.S. Securities Exchange Act of1934, as of the end of the period covered by this Annual Report.
Based on that evaluation, our CEO and CFO concluded that our disclosure controls and procedures wereeffective as of March 31, 2019.
Management’s Annual Report on Internal Control Over Financial Reporting
Our management is responsible for establishing and maintaining adequate internal control over financialreporting, as defined in Rule 13a-15(f) under the U.S. Securities Exchange Act of 1934. Our internal control overfinancial reporting is a process designed by, or under the supervision of, MUFG’s principal executive andprincipal financial officers, and effected by MUFG’s board of directors, management, and other personnel, toprovide reasonable assurance regarding the reliability of financial reporting and the preparation of financialstatements for external purposes in accordance with U.S. GAAP and includes those policies and procedures that:
(i) pertain to the maintenance of records that, in reasonable detail, accurately and fairly reflect thetransactions and dispositions of the assets of MUFG,
(ii) provide reasonable assurance that transactions are recorded as necessary to permit preparation offinancial statements in accordance with generally accepted accounting principles, and that receipts andexpenditures of MUFG are being made only in accordance with authorizations of management anddirectors of MUFG, and
(iii) provide reasonable assurance regarding prevention or timely detection of unauthorized acquisition, useor disposition of MUFG’s assets that could have a material effect on the financial statements.
Because of inherent limitations, internal control over financial reporting, no matter how well designed, maynot prevent or detect misstatements. Also, projections of any evaluation of effectiveness to future periods aresubject to the risk that controls may become inadequate because of changes in conditions, or that the degree ofcompliance with the policies or procedures may deteriorate.
Our management evaluated the effectiveness of our internal control over financial reporting as of March 31,2019 based on the criteria established in “Internal Control—Integrated Framework (2013)” issued by theCommittee of Sponsoring Organizations of the Treadway Commission. Based on the evaluation, managementhas concluded that MUFG maintained effective internal control over financial reporting as of March 31, 2019.
The effectiveness of our internal control over financial reporting as of March 31, 2019 has been audited byDeloitte Touche Tohmatsu LLC, an independent registered public accounting firm, as stated in its report,presented on page 208.
206

Changes in Internal Control Over Financial Reporting
During the period covered by this Annual Report, there has been no change in our internal control overfinancial reporting that has materially affected or is reasonably likely to materially affect our internal controlover financial reporting.
207

REPORT OF INDEPENDENT REGISTERED PUBLIC ACCOUNTING FIRM
To the Board of Directors and the Shareholders ofMitsubishi UFJ Financial Group, Inc.(Kabushiki Kaisha Mitsubishi UFJ Financial Group)
Opinion on Internal Control over Financial Reporting
We have audited the internal control over financial reporting of Mitsubishi UFJ Financial Group, Inc.(Kabushiki Kaisha Mitsubishi UFJ Financial Group) (“MUFG”) and subsidiaries (together, the “MUFG Group”)as of March 31, 2019, based on criteria established in Internal Control—Integrated Framework (2013) issued bythe Committee of Sponsoring Organizations of the Treadway Commission (“COSO”). In our opinion, the MUFGGroup maintained, in all material respects, effective internal control over financial reporting as of March 31,2019, based on criteria established in Internal Control—Integrated Framework (2013) issued by COSO.
We have also audited, in accordance with the standards of the Public Company Accounting Oversight Board(United States) (“PCAOB”), the consolidated financial statements as of and for the year ended March 31, 2019,of the MUFG Group and our report dated July 10, 2019, expressed an unqualified opinion on those financialstatements.
Basis for Opinion
The MUFG Group’s management is responsible for maintaining effective internal control over financialreporting and for its assessment of the effectiveness of internal control over financial reporting, included in theaccompanying Management’s Annual Report on Internal Control Over Financial Reporting. Our responsibility isto express an opinion on the MUFG Group’s internal control over financial reporting based on our audit. We area public accounting firm registered with the PCAOB and are required to be independent with respect to theMUFG Group in accordance with the U.S. federal securities laws and the applicable rules and regulations of theSecurities and Exchange Commission and the PCAOB.
We conducted our audit in accordance with the standards of the PCAOB. Those standards require that weplan and perform the audit to obtain reasonable assurance about whether effective internal control over financialreporting was maintained in all material respects. Our audit included obtaining an understanding of internalcontrol over financial reporting, assessing the risk that a material weakness exists, testing and evaluating thedesign and operating effectiveness of internal control based on the assessed risk, and performing such otherprocedures as we considered necessary in the circumstances. We believe that our audit provides a reasonablebasis for our opinion.
Definition and Limitations of Internal Control over Financial Reporting
A company’s internal control over financial reporting is a process designed to provide reasonable assuranceregarding the reliability of financial reporting and the preparation of financial statements for external purposes inaccordance with generally accepted accounting principles. A company’s internal control over financial reportingincludes those policies and procedures that (1) pertain to the maintenance of records that, in reasonable detail,accurately and fairly reflect the transactions and dispositions of the assets of the company; (2) provide reasonableassurance that transactions are recorded as necessary to permit preparation of financial statements in accordancewith generally accepted accounting principles, and that receipts and expenditures of the company are being madeonly in accordance with authorizations of management and directors of the company; and (3) provide reasonableassurance regarding prevention or timely detection of unauthorized acquisition, use, or disposition of thecompany’s assets that could have a material effect on the financial statements.
Because of its inherent limitations, internal control over financial reporting may not prevent or detectmisstatements. Also, projections of any evaluation of effectiveness to future periods are subject to the risk thatcontrols may become inadequate because of changes in conditions, or that the degree of compliance with thepolicies or procedures may deteriorate.
/s/ Deloitte Touche Tohmatsu LLC
Tokyo, JapanJuly 10, 2019
208
Item 16A. Audit Committee Financial Expert.
Our board of directors has determined that Mr. Akira Yamate, an outside director, is an “audit committeefinancial expert” as defined in Item 16A of Form 20-F and is, and has remained since his assumption of office asa member of our audit committee, “independent” as defined in the listing standards of the NYSE. Mr. Yamatehas spent most of his professional carrier as a certified public accountant in Japan, auditing Japanesecorporations, including those registered with the U.S. Securities and Exchange Commission. Mr. Yamate is alsothe chair of our audit committee.
Item 16B. Code of Ethics.
We have adopted a code of ethics, which consists of internal rules named MUFG Group Code of Conduct(formerly called Principles of Ethics and Conduct), compliance rules, compliance manual and rules ofemployment. Each of these rules applies to our principal executive officer, principal financial officer, principalaccounting officer and persons performing similar functions. Our internal compliance rules were most recentlyamended on August 2, 2018, reflecting the establishment of a new division within MUFG. A copy of the MUFGGroup Code of Conduct and the sections of our compliance rules, compliance manual and rules of employmentrelating to the “code of ethics” (as defined in paragraph (b) of Item 16B of Form 20-F) is attached as Exhibit 11to this Annual Report.
No waivers of the MUFG Group Code of Conduct or the relevant sections of our compliance rules,compliance manual and rules of employment were granted to our principal executive officer, principal financialofficer, principal accounting officer, directors or corporate auditors during the fiscal year ended March 31, 2019.
Item 16C. Principal Accountant Fees and Services.
Fees and Services of Deloitte Touche Tohmatsu LLC
The aggregate fees billed by Deloitte Touche Tohmatsu LLC, our independent registered public accountingfirm and its affiliates, for the fiscal years ended March 31, 2018 and 2019 are presented in the following table:
2018 2019
(in millions)
Audit fees . . . . . . . . . . . . . . . . . . . . . . . . . . . . . . . . . . . . . . . . . . . . . . . . . . . . . . . . . . . . . . . . . . . ¥8,032 ¥8,079Audit-related fees . . . . . . . . . . . . . . . . . . . . . . . . . . . . . . . . . . . . . . . . . . . . . . . . . . . . . . . . . . . . . 199 119Tax fees . . . . . . . . . . . . . . . . . . . . . . . . . . . . . . . . . . . . . . . . . . . . . . . . . . . . . . . . . . . . . . . . . . . . . 307 172All other fees . . . . . . . . . . . . . . . . . . . . . . . . . . . . . . . . . . . . . . . . . . . . . . . . . . . . . . . . . . . . . . . . . 97 119
Total . . . . . . . . . . . . . . . . . . . . . . . . . . . . . . . . . . . . . . . . . . . . . . . . . . . . . . . . . . . . . . . . . . . ¥8,635 ¥8,489
The description of our fees billed for each category described above is as follows:
Audit fees—Audit fees are primarily for an annual audit of our financial statements, review of our semi-annual condensed financial statements, statutory audit of our financial statements and audits of our subsidiaryfinancial statements and attestation services relating to the internal controls over financial reporting underSection 404 of the U.S. Sarbanes-Oxley Act of 2002.
Audit-related fees—Audit-related fees primarily include accounting consultations, agreed upon procedureson internal controls, employee benefit plan audit, and advisory services relating to internal control reviews.
Tax fees—Tax fees relate primarily to tax compliance, including assistance with preparation of tax returnfilings, tax advisory and tax planning services.
All other fees—All other fees primarily include fees for risk management and compliance advisory services.
209
Pre-Approval Policies and Procedures for Services by Deloitte Touche Tohmatsu LLC
Our audit committee performs the pre-approval function required by applicable SEC rules and regulations.Our audit committee has established pre-approval policies and procedures that MUFG and its subsidiaries mustfollow before engaging Deloitte Touche Tohmatsu LLC to perform audit and permitted non-audit services.
When MUFG or a subsidiary intends to engage Deloitte Touche Tohmatsu LLC to perform audit andpermitted non-audit services, it must make an application for pre-approval on either a periodic or case-by-casebasis.
‰ Periodic application is an application for pre-approval made each fiscal year for services that areexpected to be provided by Deloitte Touche Tohmatsu LLC during the next fiscal year.
‰ Case-by-case application is an application for pre-approval made on a case-by-case basis for services tobe provided by Deloitte Touche Tohmatsu LLC that are not covered by the periodic application.
Pre-approval is resolved in principle by our audit committee prior to engagement, although if necessary afull-time member of our audit committee may consider any case-by-case application for pre-approval on behalfof the audit committee prior to the next scheduled audit committee meeting. Such decisions made individually bya full-time member of our audit committee are reported to the audit committee as appropriate at the nextscheduled audit committee meeting.
Fees approved pursuant to the procedures described in paragraph 2-01(c)(7)(i)(C) of Regulation S-X, whichprovides for an exception to the general requirement for pre-approval in certain circumstances, were less than0.1% of the total fees paid to Deloitte Touche Tohmatsu LLC for the fiscal year ended March 31, 2018 andapproximately 0.3% of the total fees paid to Deloitte Touche Tohmatsu LLC for the fiscal year ended March 31,2019.
Item 16D. Exemptions from the Listing Standards for Audit Committees.
Not applicable.
Item 16E. Purchases of Equity Securities by the Issuer and Affiliated Purchasers.
Issuer Purchases of Common Stock
TotalNumber of
SharesPurchased(1)
Average PricePaid per Share
TotalNumber of
SharesPurchasedas Part ofPublicly
AnnouncedPlans or
Programs
MaximumNumber ofShares thatMay Yet BePurchasedUnder thePlans or
Programs(2)
April 1 to April 30, 2018 . . . . . . . . . . . . . . . . . . . . . . . 2,201 ¥701.82 — —May 1 to May 31, 2018 . . . . . . . . . . . . . . . . . . . . . . . . 1,468,484 710.73 37,173,600 62,826,400June 1 to June 30, 2018 . . . . . . . . . . . . . . . . . . . . . . . . 1,880 670.07 35,247,100 27,579,300July 1 to July 31, 2018 . . . . . . . . . . . . . . . . . . . . . . . . . 5,778 647.41 — —August 1 to August 31, 2018 . . . . . . . . . . . . . . . . . . . . 5,168 676.63 — —September 1 to September 30, 2018 . . . . . . . . . . . . . . . 2,458 688.15 — —October 1 to October 31, 2018 . . . . . . . . . . . . . . . . . . . 195,987 713.55 — —November 1 to November 30, 2018 . . . . . . . . . . . . . . . 108,019 639.05 74,549,800 125,450,200December 1 to December 31, 2018 . . . . . . . . . . . . . . . 30,509 613.94 85,287,000 40,163,200January 1 to January 31, 2019 . . . . . . . . . . . . . . . . . . . 31,068 570.64 — —February 1 to February 28, 2019 . . . . . . . . . . . . . . . . . 18,478 580.40 — —March 1 to March 31, 2019 . . . . . . . . . . . . . . . . . . . . . 9,202 572.09 — —
Total . . . . . . . . . . . . . . . . . . . . . . . . . . . . . . . . . . . 1,879,232 ¥646.45 232,257,500 —
210

Notes:(1) The shares purchased were shares constituting less than one unit (100 shares) purchased from registered holders of the shares and shares
purchased pursuant to applicable Japanese law from shareholders who have not responded to communications sent to their registeredaddresses for five consecutive years or more and by whom dividend payments have not been received for five consecutive years, each atthe current market price.
(2) During May and June 2018, we repurchased 72,420,700 shares of our common stock for ¥49,999,969,714 under a share repurchaseprogram that was adopted on May 15, 2018 and completed in June 2018. Under the program, we were authorized by the Board ofDirectors to repurchase up to the lesser of an aggregate of 100,000,000 shares of our common stock and an aggregate of ¥50.0 billionbetween May 16, 2018 and June 30, 2018. All of the repurchased shares were cancelled on July 20, 2018.During November and December 2018, we repurchased 159,836,800 shares of our common stock for ¥99,999,974,078 under a sharerepurchase program that was adopted on November 13, 2018 and completed in December 2018. Under the program, we were authorizedby the Board of Directors to repurchase up to the lesser of an aggregate of 200,000,000 shares of our common stock and an aggregate of¥100.0 billion between November 14, 2018 and December 31, 2018. All of the repurchased shares were cancelled on January 22, 2019.
We did not make any purchases of shares of our common stock other than as shown in the above table forthe fiscal year ended March 31, 2019.
In May 2018, 13,049,600 shares were purchased by the trustee of the trust for the first performance-basedstock compensation plan. In connection with the MUFG Americas Holdings Corporation Stock Bonus Plan,8,149,808 ADSs were purchased by the trustee of the independent trust between April 1, 2018 and March 31,2019. For descriptions of our stock compensation and bonus plans, see “Item 6.B. Directors, Senior Managementand Employees—Compensation.”
Item 16F. Change in Registrant’s Certifying Accountant.
None.
Item 16G. Corporate Governance.
The NYSE allows NYSE-listed companies that are foreign private issuers, such as MUFG, with certainexceptions, to follow home-country practices in lieu of the corporate governance practices followed byU.S. companies pursuant to the NYSE’s Listed Company Manual. The following is a summary of the significantdifferences between MUFG’s corporate governance practices and those followed by U.S. listed companies underthe NYSE’s Listed Company Manual.
1. A NYSE-listed U.S. company must have a majority of directors that meet the independencerequirements under Section 303A of the NYSE’s Listed Company Manual.
As of the date of this Annual Report, we have nine outside directors as members of our board of directors,which consists of a total of sixteen members. Under our governance system, we are required to have outsidedirectors on each of our nominating, audit and compensation committees, constituting a majority of its members.For a description of an outside director, see “Item 6.C. Directors and Senior Management—Board Practices.”
The Tokyo Stock Exchange rules require listed companies, including us, to identify at least one individualwho the company believes is unlikely to have a conflict of interest with general shareholders and have suchindividual serve as an independent director or outside corporate auditor.
Further, a listed company with fewer than two outside directors who are considered independent based onsuch internal standards as the company establishes pursuant to the Tokyo Stock Exchange requirements mustpublicly disclose the reason for not having at least two such directors on its board of directors. In addition, if alisted company determines that at least one-third of the members of its board of directors should be independentoutside directors, the listed company must disclose its policy relating to the determination. We have adopted andmade public our corporate governance policy providing, among other things, that, in general, half of the membersof our board of directors will be independent outside directors.
211

2. A NYSE-listed U.S. company must have an audit committee composed entirely of independentdirectors.
Under the Companies Act, we are required to have an audit committee consisting of at least threenon-executive directors, and the majority of its members must be outside directors. Currently, our auditcommittee consists of three outside directors and two non-executive directors. Our audit committee satisfies therequirements of Rule 10A-3 under the U.S. Securities Exchange Act of 1934, including the independencerequirements thereunder except as disclosed in “Item 6.C. Directors, Senior Management and Employees—BoardPractices—Audit Committee.”
3. A NYSE-listed U.S. company must have a compensation committee composed entirely of independentdirectors.
Under the Companies Act, we are required to have a compensation committee consisting of at least threedirectors, and the majority of its members must be outside directors. Currently, our compensation committeeconsists of five directors, four of whom are outside directors.
4. A NYSE-listed U.S. company must have a nominating or corporate governance committee composedentirely of independent directors.
Under the Companies Act, we are required to have a nominating committee consisting of at least threedirectors, and the majority of its members must be outside directors. Currently, our nominating committee, whichwe call the nominating and governance committee, consists of five directors, four of whom are outside directors.
5. A NYSE-listed U.S. company must obtain shareholder approval with respect to any equitycompensation plan.
Under the Companies Act, an equity compensation plan for directors and corporate executives is deemed tobe compensation for the services performed by the company’s directors and corporate executives. Ourcompensation committee establishes the policy with respect to the determination of the individual compensationof our directors and corporate executives, including equity compensation in the form of performance-based stockcompensation plan, and determines individual compensation in accordance with the policy. Under the CompaniesAct, a public company with board audit, compensation and nominating committees seeking to introduce aperformance-based stock compensation plan must obtain the approval of its compensation committee, not itsshareholders.
6. A NYSE-listed U.S. company must adopt and disclose Corporate Governance Guidelines and a Code ofBusiness Conduct and Ethics, and it must also disclose any exemptions granted to directors or executives.
Our corporate governance policies, which are called the “MUFG Corporate Governance Policies,” are basedon applicable home-country rules, particularly the Tokyo Stock Exchange rules, which require listed companies,such as us, to adopt a corporate governance code setting forth fundamental principles designed to establish aneffective corporate governance system or explain in their corporate governance reports the reasons for notadopting such a code. We disclose these policies on our website.
We have adopted a code of conduct, compliance rules, compliance manual and rules of employment, whichmeet the definition of “code of ethics” in “Item 16B. Code of Ethics.”
7. A NYSE-listed U.S. company must hold regularly scheduled executive sessions where participants arelimited to non-management directors.
Under the Companies Act, Japanese corporations are not obliged to hold executive sessions whereparticipants are limited to non-management directors. Such executive sessions are also not required under ourinternal corporate governance rules.
212

Item 16H. Mine Safety Disclosure.
Not Applicable.
213

PART III
Item 17. Financial Statements.
In lieu of responding to this item, we have responded to Item 18 of this Annual Report.
Item 18. Financial Statements.
Our consolidated financial statements are included in this Annual Report, as required by this item, startingon page F-1.
Pursuant to Rule 3-09 of Regulation S-X, the financial statements and supplementary data of MorganStanley, our equity method investee, as of and for the fiscal year ended December 31, 2018, are incorporated inthis Annual Report as Exhibit 99(c) by reference to Morgan Stanley’s annual report on Form 10-K filed onFebruary 26, 2019.
Item 19. Exhibits.
Exhibit Description
1(a) Articles of Incorporation of Mitsubishi UFJ Financial Group, Inc., as amended on July 6, 2018(English translation)*
1(b) Board of Directors Regulations of Mitsubishi UFJ Financial Group, Inc., as amended onJune 25, 2015 (English translation)*
1(c) Corporation Meetings Regulations of Mitsubishi UFJ Financial Group, Inc., as amended onJuly 1, 2018 (English translation)*
1(d) Share Handling Regulations of Mitsubishi UFJ Financial Group, Inc., as amended on June 25,2015 (English Translation)**
1(e) Charter of the Audit Committee of Mitsubishi UFJ Financial Group, Inc., as amended on July 1,2018 (English translation)*
1(f) Charter of the Compensation Committee of Mitsubishi UFJ Financial Group, Inc., as amendedon July 1, 2018 (English translation)*
1(g) Charter of the Nominating and Governance Committee of Mitsubishi UFJ Financial Group,Inc., as amended on July 1, 2018 (English translation)*
1(h) Charter of the Risk Committee of Mitsubishi UFJ Financial Group, Inc., as amended on July 1,2018 (English translation)*
2(a) Form of American Depositary Receipt*
2(b) Form of Deposit Agreement, amended and restated as of December 22, 2004, among MitsubishiTokyo Financial Group, Inc. (subsequently renamed Mitsubishi UFJ Financial Group, Inc.), TheBank of New York Mellon and the holders from time to time of American Depositary Receiptsissued thereunder*
2(c) Description of Securities
8 Subsidiaries of the Company—see “Item 4.C. Information on the Company—OrganizationalStructure.”
11 MUFG Group Code of Conduct, Compliance Rules, Compliance Manual, and Rules ofEmployment of Mitsubishi UFJ Financial Group, Inc. applicable to its principal executiveofficer, principal financial officer, principal accounting officer and persons performing similarfunctions (English translation of relevant sections)
12 Certifications required by Rule 13a-14(a) (17 CFR 240.13a-14(a)) or Rule 15d-14(a)(17 CFR 240.15d-14(a))
214

Exhibit Description
13 Certifications required by Rule 13a-14(b) (17 CFR 240.13a-14(b)) or Rule 15d-14(b)(17 CFR 240.15d-14(b)) and Section 1350 of Chapter 63 of Title 18 of the United States Code(18 U.S.C. 1350)
15(a) Consent of independent registered public accounting firm (Deloitte Touche Tohmatsu LLC)
15(b) Consent of independent registered public accounting firm (Deloitte & Touche LLP)
99(a) Capitalization and Indebtedness of Mitsubishi UFJ Financial Group, Inc. as of March 31,2019***
99(b) Unaudited Reverse Reconciliation of Selected Financial Information of Mitsubishi UFJFinancial Group, Inc. as of and for the fiscal year ended March 31, 2019****
99(c) Financial Statements and Supplementary Data of Morgan Stanley*****
101.INS XBRL Instance Document
101.SCH XBRL Schema Document
101.CAL XBRL Calculation Linkbase Document
101.DEF XBRL Definition Linkbase Document
101.LAB XBRL Label Linkbase Document
101.PRE XBRL Presentation Linkbase Document
Notes:* Incorporated by reference to our annual report on Form 20-F (File No. 000-54189) filed on July 12, 2018.** Incorporated by reference to our registration statement on Form S-8 (File No. 333-230590) filed on March 29, 2019.*** Deemed to be incorporated by reference into the registration statement on Form F-3 (No. 333-229697) of Mitsubishi UFJ Financial
Group, Inc. and to be a part thereof.**** Deemed to be incorporated as Annex A to the registration statement on Form F-3 (No. 333-229697) of Mitsubishi UFJ Financial
Group, Inc. and to be a part thereof.***** Incorporated by reference to Morgan Stanley’s annual report on Form 10-K (File No. 001-11758) filed on February 26, 2019.
215

SELECTED STATISTICAL DATA
Due to close integration of our foreign and domestic activities, it is difficult to make a precise determinationof the assets, liabilities, income and expenses of our foreign operations. The foreign operations as presentedinclude the business conducted by overseas subsidiaries and branches, and the international business principallyconducted by the international banking-related divisions headquartered in Japan. Our management believes thatthe results appropriately represent our domestic and foreign activities.
A-1
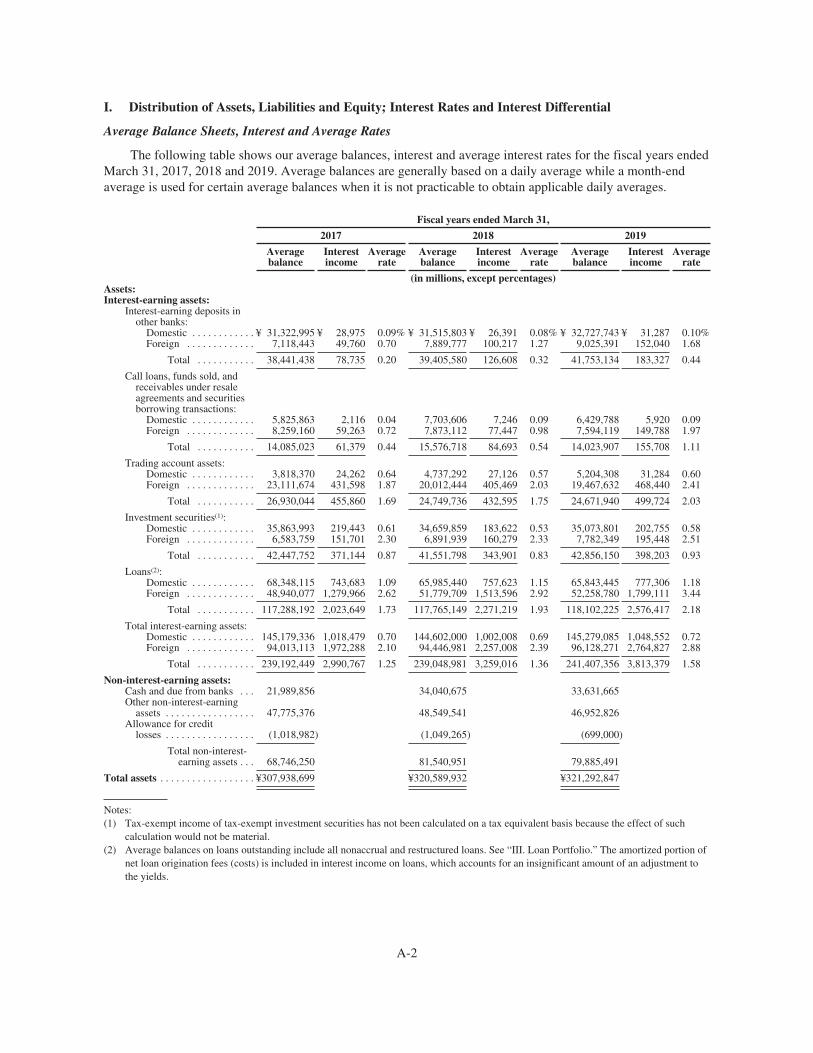
I. Distribution of Assets, Liabilities and Equity; Interest Rates and Interest Differential
Average Balance Sheets, Interest and Average Rates
The following table shows our average balances, interest and average interest rates for the fiscal years endedMarch 31, 2017, 2018 and 2019. Average balances are generally based on a daily average while a month-endaverage is used for certain average balances when it is not practicable to obtain applicable daily averages.
Fiscal years ended March 31,
2017 2018 2019
Averagebalance
Interestincome
Averagerate
Averagebalance
Interestincome
Averagerate
Averagebalance
Interestincome
Averagerate
(in millions, except percentages)Assets:Interest-earning assets:
Interest-earning deposits inother banks:
Domestic . . . . . . . . . . . . ¥ 31,322,995 ¥ 28,975 0.09% ¥ 31,515,803 ¥ 26,391 0.08% ¥ 32,727,743 ¥ 31,287 0.10%Foreign . . . . . . . . . . . . . 7,118,443 49,760 0.70 7,889,777 100,217 1.27 9,025,391 152,040 1.68
Total . . . . . . . . . . . 38,441,438 78,735 0.20 39,405,580 126,608 0.32 41,753,134 183,327 0.44
Call loans, funds sold, andreceivables under resaleagreements and securitiesborrowing transactions:
Domestic . . . . . . . . . . . . 5,825,863 2,116 0.04 7,703,606 7,246 0.09 6,429,788 5,920 0.09Foreign . . . . . . . . . . . . . 8,259,160 59,263 0.72 7,873,112 77,447 0.98 7,594,119 149,788 1.97
Total . . . . . . . . . . . 14,085,023 61,379 0.44 15,576,718 84,693 0.54 14,023,907 155,708 1.11
Trading account assets:Domestic . . . . . . . . . . . . 3,818,370 24,262 0.64 4,737,292 27,126 0.57 5,204,308 31,284 0.60Foreign . . . . . . . . . . . . . 23,111,674 431,598 1.87 20,012,444 405,469 2.03 19,467,632 468,440 2.41
Total . . . . . . . . . . . 26,930,044 455,860 1.69 24,749,736 432,595 1.75 24,671,940 499,724 2.03
Investment securities(1):Domestic . . . . . . . . . . . . 35,863,993 219,443 0.61 34,659,859 183,622 0.53 35,073,801 202,755 0.58Foreign . . . . . . . . . . . . . 6,583,759 151,701 2.30 6,891,939 160,279 2.33 7,782,349 195,448 2.51
Total . . . . . . . . . . . 42,447,752 371,144 0.87 41,551,798 343,901 0.83 42,856,150 398,203 0.93
Loans(2):Domestic . . . . . . . . . . . . 68,348,115 743,683 1.09 65,985,440 757,623 1.15 65,843,445 777,306 1.18Foreign . . . . . . . . . . . . . 48,940,077 1,279,966 2.62 51,779,709 1,513,596 2.92 52,258,780 1,799,111 3.44
Total . . . . . . . . . . . 117,288,192 2,023,649 1.73 117,765,149 2,271,219 1.93 118,102,225 2,576,417 2.18
Total interest-earning assets:Domestic . . . . . . . . . . . . 145,179,336 1,018,479 0.70 144,602,000 1,002,008 0.69 145,279,085 1,048,552 0.72Foreign . . . . . . . . . . . . . 94,013,113 1,972,288 2.10 94,446,981 2,257,008 2.39 96,128,271 2,764,827 2.88
Total . . . . . . . . . . . 239,192,449 2,990,767 1.25 239,048,981 3,259,016 1.36 241,407,356 3,813,379 1.58
Non-interest-earning assets:Cash and due from banks . . . 21,989,856 34,040,675 33,631,665Other non-interest-earning
assets . . . . . . . . . . . . . . . . . 47,775,376 48,549,541 46,952,826Allowance for credit
losses . . . . . . . . . . . . . . . . . (1,018,982) (1,049,265) (699,000)
Total non-interest-earning assets . . . 68,746,250 81,540,951 79,885,491
Total assets . . . . . . . . . . . . . . . . . . ¥307,938,699 ¥320,589,932 ¥321,292,847
Notes:(1) Tax-exempt income of tax-exempt investment securities has not been calculated on a tax equivalent basis because the effect of such
calculation would not be material.(2) Average balances on loans outstanding include all nonaccrual and restructured loans. See “III. Loan Portfolio.” The amortized portion of
net loan origination fees (costs) is included in interest income on loans, which accounts for an insignificant amount of an adjustment tothe yields.
A-2
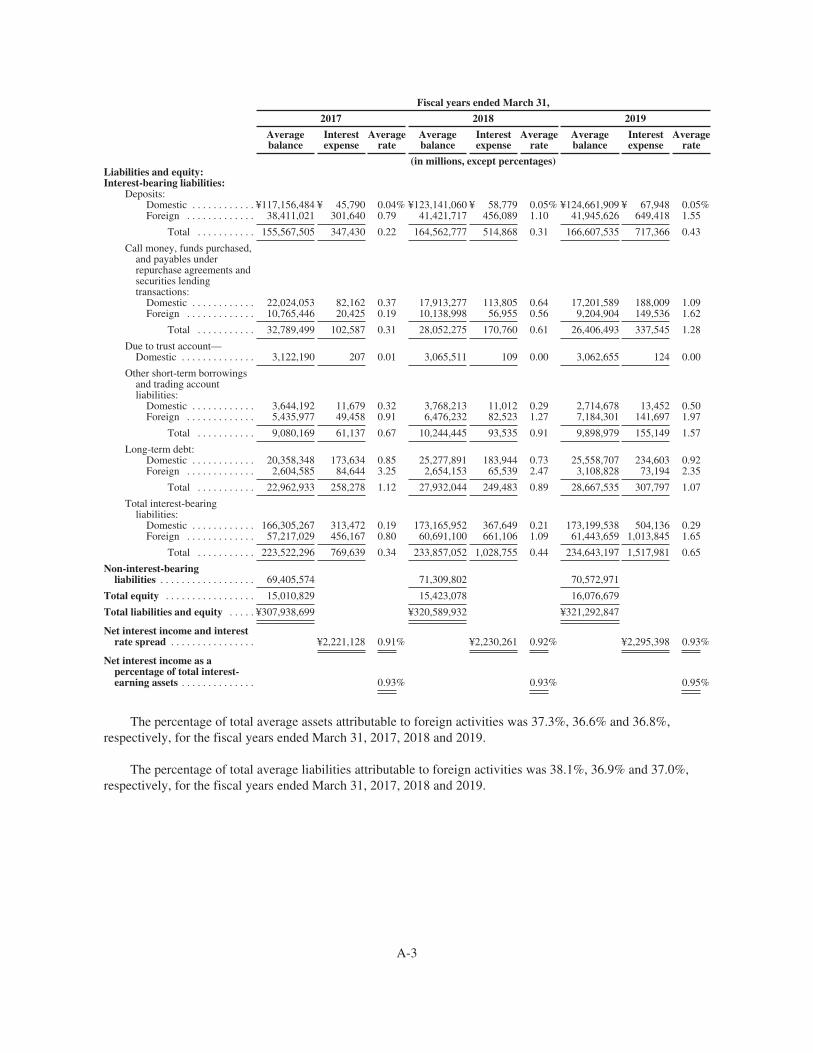
Fiscal years ended March 31,
2017 2018 2019
Averagebalance
Interestexpense
Averagerate
Averagebalance
Interestexpense
Averagerate
Averagebalance
Interestexpense
Averagerate
(in millions, except percentages)Liabilities and equity:Interest-bearing liabilities:
Deposits:Domestic . . . . . . . . . . . . ¥117,156,484 ¥ 45,790 0.04% ¥123,141,060 ¥ 58,779 0.05% ¥124,661,909 ¥ 67,948 0.05%Foreign . . . . . . . . . . . . . 38,411,021 301,640 0.79 41,421,717 456,089 1.10 41,945,626 649,418 1.55
Total . . . . . . . . . . . 155,567,505 347,430 0.22 164,562,777 514,868 0.31 166,607,535 717,366 0.43
Call money, funds purchased,and payables underrepurchase agreements andsecurities lendingtransactions:
Domestic . . . . . . . . . . . . 22,024,053 82,162 0.37 17,913,277 113,805 0.64 17,201,589 188,009 1.09Foreign . . . . . . . . . . . . . 10,765,446 20,425 0.19 10,138,998 56,955 0.56 9,204,904 149,536 1.62
Total . . . . . . . . . . . 32,789,499 102,587 0.31 28,052,275 170,760 0.61 26,406,493 337,545 1.28
Due to trust account—Domestic . . . . . . . . . . . . . . 3,122,190 207 0.01 3,065,511 109 0.00 3,062,655 124 0.00
Other short-term borrowingsand trading accountliabilities:
Domestic . . . . . . . . . . . . 3,644,192 11,679 0.32 3,768,213 11,012 0.29 2,714,678 13,452 0.50Foreign . . . . . . . . . . . . . 5,435,977 49,458 0.91 6,476,232 82,523 1.27 7,184,301 141,697 1.97
Total . . . . . . . . . . . 9,080,169 61,137 0.67 10,244,445 93,535 0.91 9,898,979 155,149 1.57
Long-term debt:Domestic . . . . . . . . . . . . 20,358,348 173,634 0.85 25,277,891 183,944 0.73 25,558,707 234,603 0.92Foreign . . . . . . . . . . . . . 2,604,585 84,644 3.25 2,654,153 65,539 2.47 3,108,828 73,194 2.35
Total . . . . . . . . . . . 22,962,933 258,278 1.12 27,932,044 249,483 0.89 28,667,535 307,797 1.07
Total interest-bearingliabilities:
Domestic . . . . . . . . . . . . 166,305,267 313,472 0.19 173,165,952 367,649 0.21 173,199,538 504,136 0.29Foreign . . . . . . . . . . . . . 57,217,029 456,167 0.80 60,691,100 661,106 1.09 61,443,659 1,013,845 1.65
Total . . . . . . . . . . . 223,522,296 769,639 0.34 233,857,052 1,028,755 0.44 234,643,197 1,517,981 0.65
Non-interest-bearingliabilities . . . . . . . . . . . . . . . . . . 69,405,574 71,309,802 70,572,971
Total equity . . . . . . . . . . . . . . . . . 15,010,829 15,423,078 16,076,679
Total liabilities and equity . . . . . ¥307,938,699 ¥320,589,932 ¥321,292,847
Net interest income and interestrate spread . . . . . . . . . . . . . . . . ¥2,221,128 0.91% ¥2,230,261 0.92% ¥2,295,398 0.93%
Net interest income as apercentage of total interest-earning assets . . . . . . . . . . . . . . 0.93% 0.93% 0.95%
The percentage of total average assets attributable to foreign activities was 37.3%, 36.6% and 36.8%,respectively, for the fiscal years ended March 31, 2017, 2018 and 2019.
The percentage of total average liabilities attributable to foreign activities was 38.1%, 36.9% and 37.0%,respectively, for the fiscal years ended March 31, 2017, 2018 and 2019.
A-3
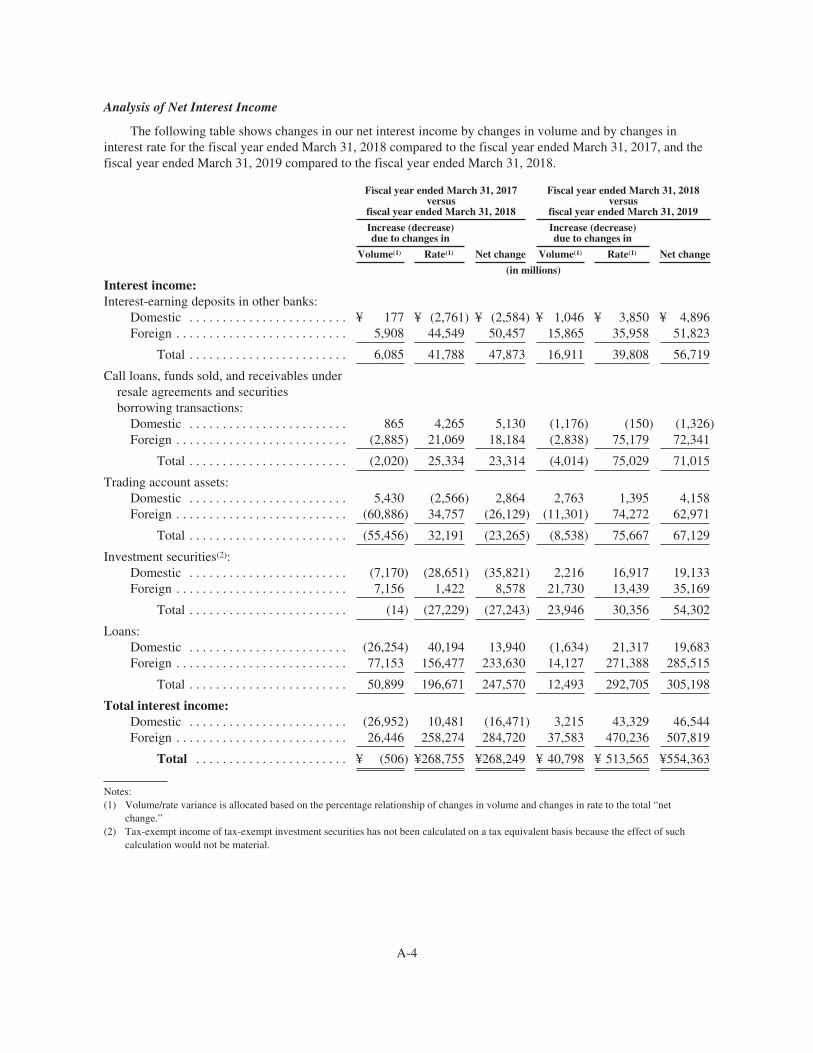
Analysis of Net Interest Income
The following table shows changes in our net interest income by changes in volume and by changes ininterest rate for the fiscal year ended March 31, 2018 compared to the fiscal year ended March 31, 2017, and thefiscal year ended March 31, 2019 compared to the fiscal year ended March 31, 2018.
Fiscal year ended March 31, 2017versus
fiscal year ended March 31, 2018
Fiscal year ended March 31, 2018versus
fiscal year ended March 31, 2019
Increase (decrease)due to changes in
Net change
Increase (decrease)due to changes in
Net changeVolume(1) Rate(1) Volume(1) Rate(1)
(in millions)
Interest income:Interest-earning deposits in other banks:
Domestic . . . . . . . . . . . . . . . . . . . . . . . . ¥ 177 ¥ (2,761) ¥ (2,584) ¥ 1,046 ¥ 3,850 ¥ 4,896Foreign . . . . . . . . . . . . . . . . . . . . . . . . . . 5,908 44,549 50,457 15,865 35,958 51,823
Total . . . . . . . . . . . . . . . . . . . . . . . . 6,085 41,788 47,873 16,911 39,808 56,719
Call loans, funds sold, and receivables underresale agreements and securitiesborrowing transactions:
Domestic . . . . . . . . . . . . . . . . . . . . . . . . 865 4,265 5,130 (1,176) (150) (1,326)Foreign . . . . . . . . . . . . . . . . . . . . . . . . . . (2,885) 21,069 18,184 (2,838) 75,179 72,341
Total . . . . . . . . . . . . . . . . . . . . . . . . (2,020) 25,334 23,314 (4,014) 75,029 71,015
Trading account assets:Domestic . . . . . . . . . . . . . . . . . . . . . . . . 5,430 (2,566) 2,864 2,763 1,395 4,158Foreign . . . . . . . . . . . . . . . . . . . . . . . . . . (60,886) 34,757 (26,129) (11,301) 74,272 62,971
Total . . . . . . . . . . . . . . . . . . . . . . . . (55,456) 32,191 (23,265) (8,538) 75,667 67,129
Investment securities(2):Domestic . . . . . . . . . . . . . . . . . . . . . . . . (7,170) (28,651) (35,821) 2,216 16,917 19,133Foreign . . . . . . . . . . . . . . . . . . . . . . . . . . 7,156 1,422 8,578 21,730 13,439 35,169
Total . . . . . . . . . . . . . . . . . . . . . . . . (14) (27,229) (27,243) 23,946 30,356 54,302
Loans:Domestic . . . . . . . . . . . . . . . . . . . . . . . . (26,254) 40,194 13,940 (1,634) 21,317 19,683Foreign . . . . . . . . . . . . . . . . . . . . . . . . . . 77,153 156,477 233,630 14,127 271,388 285,515
Total . . . . . . . . . . . . . . . . . . . . . . . . 50,899 196,671 247,570 12,493 292,705 305,198
Total interest income:Domestic . . . . . . . . . . . . . . . . . . . . . . . . (26,952) 10,481 (16,471) 3,215 43,329 46,544Foreign . . . . . . . . . . . . . . . . . . . . . . . . . . 26,446 258,274 284,720 37,583 470,236 507,819
Total . . . . . . . . . . . . . . . . . . . . . . . ¥ (506) ¥268,755 ¥268,249 ¥ 40,798 ¥ 513,565 ¥554,363
Notes:(1) Volume/rate variance is allocated based on the percentage relationship of changes in volume and changes in rate to the total “net
change.”(2) Tax-exempt income of tax-exempt investment securities has not been calculated on a tax equivalent basis because the effect of such
calculation would not be material.
A-4

Fiscal year ended March 31, 2017versus
fiscal year ended March 31, 2018
Fiscal year ended March 31, 2018versus
fiscal year ended March 31, 2019
Increase (decrease)due to changes in
Net change
Increase (decrease)due to changes in
Net changeVolume(1) Rate(1) Volume(1) Rate(1)
(in millions)
Interest expense:Deposits:
Domestic . . . . . . . . . . . . . . . . . . . . . . . . . ¥ 2,436 ¥ 10,553 ¥ 12,989 ¥ 734 ¥ 8,435 ¥ 9,169Foreign . . . . . . . . . . . . . . . . . . . . . . . . . . 25,194 129,255 154,449 5,839 187,490 193,329
Total . . . . . . . . . . . . . . . . . . . . . . . . 27,630 139,808 167,438 6,573 195,925 202,498
Call money, funds purchased, and payablesunder repurchase agreements and securitieslending transactions:
Domestic . . . . . . . . . . . . . . . . . . . . . . . . . (17,597) 49,240 31,643 (4,692) 78,896 74,204Foreign . . . . . . . . . . . . . . . . . . . . . . . . . . (1,256) 37,786 36,530 (5,708) 98,289 92,581
Total . . . . . . . . . . . . . . . . . . . . . . . . (18,853) 87,026 68,173 (10,400) 177,185 166,785
Due to trust account—Domestic . . . . . . . . . . . (4) (94) (98) — 15 15
Other short-term borrowings and tradingaccount liabilities:
Domestic . . . . . . . . . . . . . . . . . . . . . . . . . 388 (1,055) (667) (3,693) 6,133 2,440Foreign . . . . . . . . . . . . . . . . . . . . . . . . . . 10,690 22,375 33,065 9,845 49,329 59,174
Total . . . . . . . . . . . . . . . . . . . . . . . . 11,078 21,320 32,398 6,152 55,462 61,614
Long-term debt:Domestic . . . . . . . . . . . . . . . . . . . . . . . . . 38,127 (27,817) 10,310 2,065 48,594 50,659Foreign . . . . . . . . . . . . . . . . . . . . . . . . . . 1,582 (20,687) (19,105) 10,816 (3,161) 7,655
Total . . . . . . . . . . . . . . . . . . . . . . . . 39,709 (48,504) (8,795) 12,881 45,433 58,314
Total interest expense:Domestic . . . . . . . . . . . . . . . . . . . . . . . . . 23,350 30,827 54,177 (5,586) 142,073 136,487Foreign . . . . . . . . . . . . . . . . . . . . . . . . . . 36,210 168,729 204,939 20,792 331,947 352,739
Total . . . . . . . . . . . . . . . . . . . . . . . . ¥ 59,560 ¥199,556 ¥259,116 ¥ 15,206 ¥474,020 ¥489,226
Net interest income:Domestic . . . . . . . . . . . . . . . . . . . . . . . . . ¥(50,302) ¥ (20,346) ¥ (70,648) ¥ 8,801 ¥ (98,744) ¥ (89,943)Foreign . . . . . . . . . . . . . . . . . . . . . . . . . . (9,764) 89,545 79,781 16,791 138,289 155,080
Total . . . . . . . . . . . . . . . . . . . . . . . . ¥(60,066) ¥ 69,199 ¥ 9,133 ¥ 25,592 ¥ 39,545 ¥ 65,137
Note:(1) Volume/rate variance is allocated based on the percentage relationship of changes in volume and changes in rate to the total “net
change.”
A-5
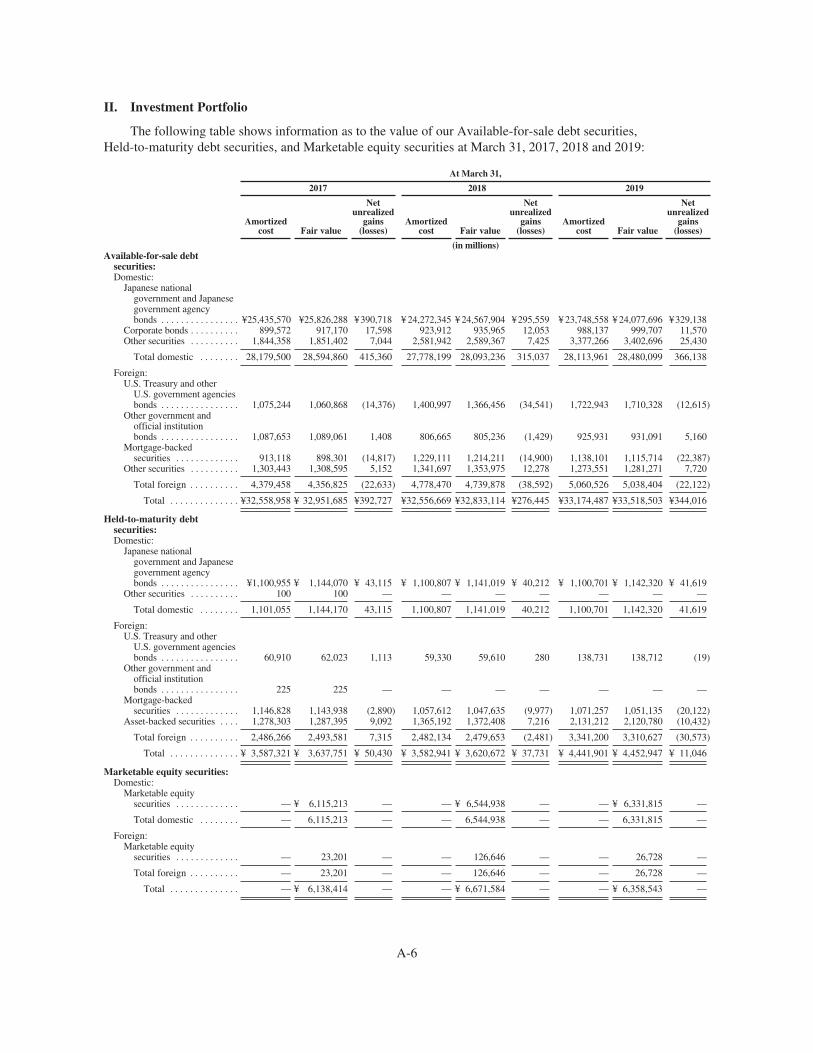
II. Investment Portfolio
The following table shows information as to the value of our Available-for-sale debt securities,Held-to-maturity debt securities, and Marketable equity securities at March 31, 2017, 2018 and 2019:
At March 31,
2017 2018 2019
Amortizedcost Fair value
Netunrealized
gains(losses)
Amortizedcost Fair value
Netunrealized
gains(losses)
Amortizedcost Fair value
Netunrealized
gains(losses)
(in millions)Available-for-sale debt
securities:Domestic:
Japanese nationalgovernment and Japanesegovernment agencybonds . . . . . . . . . . . . . . . . ¥25,435,570 ¥25,826,288 ¥390,718 ¥ 24,272,345 ¥ 24,567,904 ¥295,559 ¥ 23,748,558 ¥ 24,077,696 ¥329,138
Corporate bonds . . . . . . . . . . 899,572 917,170 17,598 923,912 935,965 12,053 988,137 999,707 11,570Other securities . . . . . . . . . . 1,844,358 1,851,402 7,044 2,581,942 2,589,367 7,425 3,377,266 3,402,696 25,430
Total domestic . . . . . . . . 28,179,500 28,594,860 415,360 27,778,199 28,093,236 315,037 28,113,961 28,480,099 366,138
Foreign:U.S. Treasury and other
U.S. government agenciesbonds . . . . . . . . . . . . . . . . 1,075,244 1,060,868 (14,376) 1,400,997 1,366,456 (34,541) 1,722,943 1,710,328 (12,615)
Other government andofficial institutionbonds . . . . . . . . . . . . . . . . 1,087,653 1,089,061 1,408 806,665 805,236 (1,429) 925,931 931,091 5,160
Mortgage-backedsecurities . . . . . . . . . . . . . 913,118 898,301 (14,817) 1,229,111 1,214,211 (14,900) 1,138,101 1,115,714 (22,387)
Other securities . . . . . . . . . . 1,303,443 1,308,595 5,152 1,341,697 1,353,975 12,278 1,273,551 1,281,271 7,720
Total foreign . . . . . . . . . . 4,379,458 4,356,825 (22,633) 4,778,470 4,739,878 (38,592) 5,060,526 5,038,404 (22,122)
Total . . . . . . . . . . . . . . ¥32,558,958 ¥ 32,951,685 ¥392,727 ¥32,556,669 ¥32,833,114 ¥276,445 ¥33,174,487 ¥33,518,503 ¥344,016
Held-to-maturity debtsecurities:Domestic:
Japanese nationalgovernment and Japanesegovernment agencybonds . . . . . . . . . . . . . . . . ¥1,100,955 ¥ 1,144,070 ¥ 43,115 ¥ 1,100,807 ¥ 1,141,019 ¥ 40,212 ¥ 1,100,701 ¥ 1,142,320 ¥ 41,619
Other securities . . . . . . . . . . 100 100 — — — — — — —
Total domestic . . . . . . . . 1,101,055 1,144,170 43,115 1,100,807 1,141,019 40,212 1,100,701 1,142,320 41,619
Foreign:U.S. Treasury and other
U.S. government agenciesbonds . . . . . . . . . . . . . . . . 60,910 62,023 1,113 59,330 59,610 280 138,731 138,712 (19)
Other government andofficial institutionbonds . . . . . . . . . . . . . . . . 225 225 — — — — — — —
Mortgage-backedsecurities . . . . . . . . . . . . . 1,146,828 1,143,938 (2,890) 1,057,612 1,047,635 (9,977) 1,071,257 1,051,135 (20,122)
Asset-backed securities . . . . 1,278,303 1,287,395 9,092 1,365,192 1,372,408 7,216 2,131,212 2,120,780 (10,432)
Total foreign . . . . . . . . . . 2,486,266 2,493,581 7,315 2,482,134 2,479,653 (2,481) 3,341,200 3,310,627 (30,573)
Total . . . . . . . . . . . . . . ¥ 3,587,321 ¥ 3,637,751 ¥ 50,430 ¥ 3,582,941 ¥ 3,620,672 ¥ 37,731 ¥ 4,441,901 ¥ 4,452,947 ¥ 11,046
Marketable equity securities:Domestic:
Marketable equitysecurities . . . . . . . . . . . . . — ¥ 6,115,213 — — ¥ 6,544,938 — — ¥ 6,331,815 —
Total domestic . . . . . . . . — 6,115,213 — — 6,544,938 — — 6,331,815 —
Foreign:Marketable equity
securities . . . . . . . . . . . . . — 23,201 — — 126,646 — — 26,728 —
Total foreign . . . . . . . . . . — 23,201 — — 126,646 — — 26,728 —
Total . . . . . . . . . . . . . . — ¥ 6,138,414 — — ¥ 6,671,584 — — ¥ 6,358,543 —
A-6
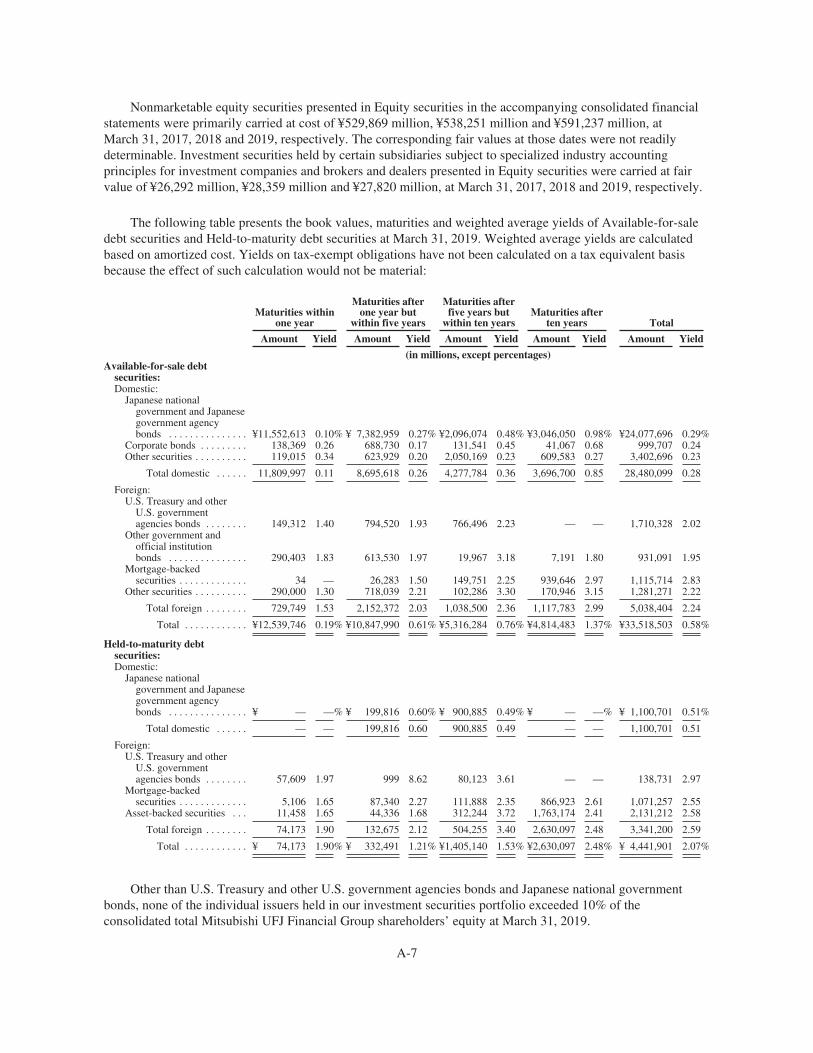
Nonmarketable equity securities presented in Equity securities in the accompanying consolidated financialstatements were primarily carried at cost of ¥529,869 million, ¥538,251 million and ¥591,237 million, atMarch 31, 2017, 2018 and 2019, respectively. The corresponding fair values at those dates were not readilydeterminable. Investment securities held by certain subsidiaries subject to specialized industry accountingprinciples for investment companies and brokers and dealers presented in Equity securities were carried at fairvalue of ¥26,292 million, ¥28,359 million and ¥27,820 million, at March 31, 2017, 2018 and 2019, respectively.
The following table presents the book values, maturities and weighted average yields of Available-for-saledebt securities and Held-to-maturity debt securities at March 31, 2019. Weighted average yields are calculatedbased on amortized cost. Yields on tax-exempt obligations have not been calculated on a tax equivalent basisbecause the effect of such calculation would not be material:
Maturities withinone year
Maturities afterone year but
within five years
Maturities afterfive years but
within ten yearsMaturities after
ten years Total
Amount Yield Amount Yield Amount Yield Amount Yield Amount Yield
(in millions, except percentages)Available-for-sale debt
securities:Domestic:
Japanese nationalgovernment and Japanesegovernment agencybonds . . . . . . . . . . . . . . . ¥11,552,613 0.10% ¥ 7,382,959 0.27% ¥2,096,074 0.48% ¥3,046,050 0.98% ¥24,077,696 0.29%
Corporate bonds . . . . . . . . . 138,369 0.26 688,730 0.17 131,541 0.45 41,067 0.68 999,707 0.24Other securities . . . . . . . . . . 119,015 0.34 623,929 0.20 2,050,169 0.23 609,583 0.27 3,402,696 0.23
Total domestic . . . . . . 11,809,997 0.11 8,695,618 0.26 4,277,784 0.36 3,696,700 0.85 28,480,099 0.28
Foreign:U.S. Treasury and other
U.S. governmentagencies bonds . . . . . . . . 149,312 1.40 794,520 1.93 766,496 2.23 — — 1,710,328 2.02
Other government andofficial institutionbonds . . . . . . . . . . . . . . . 290,403 1.83 613,530 1.97 19,967 3.18 7,191 1.80 931,091 1.95
Mortgage-backedsecurities . . . . . . . . . . . . . 34 — 26,283 1.50 149,751 2.25 939,646 2.97 1,115,714 2.83
Other securities . . . . . . . . . . 290,000 1.30 718,039 2.21 102,286 3.30 170,946 3.15 1,281,271 2.22
Total foreign . . . . . . . . 729,749 1.53 2,152,372 2.03 1,038,500 2.36 1,117,783 2.99 5,038,404 2.24
Total . . . . . . . . . . . . ¥12,539,746 0.19% ¥10,847,990 0.61% ¥5,316,284 0.76% ¥4,814,483 1.37% ¥33,518,503 0.58%
Held-to-maturity debtsecurities:Domestic:
Japanese nationalgovernment and Japanesegovernment agencybonds . . . . . . . . . . . . . . . ¥ — —% ¥ 199,816 0.60% ¥ 900,885 0.49% ¥ — —% ¥ 1,100,701 0.51%
Total domestic . . . . . . — — 199,816 0.60 900,885 0.49 — — 1,100,701 0.51
Foreign:U.S. Treasury and other
U.S. governmentagencies bonds . . . . . . . . 57,609 1.97 999 8.62 80,123 3.61 — — 138,731 2.97
Mortgage-backedsecurities . . . . . . . . . . . . . 5,106 1.65 87,340 2.27 111,888 2.35 866,923 2.61 1,071,257 2.55
Asset-backed securities . . . 11,458 1.65 44,336 1.68 312,244 3.72 1,763,174 2.41 2,131,212 2.58
Total foreign . . . . . . . . 74,173 1.90 132,675 2.12 504,255 3.40 2,630,097 2.48 3,341,200 2.59
Total . . . . . . . . . . . . ¥ 74,173 1.90% ¥ 332,491 1.21% ¥1,405,140 1.53% ¥2,630,097 2.48% ¥ 4,441,901 2.07%
Other than U.S. Treasury and other U.S. government agencies bonds and Japanese national governmentbonds, none of the individual issuers held in our investment securities portfolio exceeded 10% of theconsolidated total Mitsubishi UFJ Financial Group shareholders’ equity at March 31, 2019.
A-7

III. Loan Portfolio
The following table shows our loans outstanding, before deduction of allowance for credit losses, bydomicile and industry of the borrower at March 31 for each of the five fiscal years ended March 31, 2019.Classification of loans by industry is based on the industry segment loan classification as defined by the Bank ofJapan for regulatory reporting purposes and is not necessarily based on the use of proceeds:
At March 31,
2015 2016 2017 2018 2019
(in millions)
Domestic:Manufacturing . . . . . . . . . . ¥ 11,703,428 ¥ 12,158,642 ¥ 11,796,803 ¥ 10,876,625 ¥ 11,153,996Construction . . . . . . . . . . . 977,892 913,180 819,262 781,262 717,664Real estate . . . . . . . . . . . . . 10,911,240 11,175,130 11,622,372 11,763,769 11,706,419Services . . . . . . . . . . . . . . . 2,684,355 2,503,446 2,549,300 2,689,086 2,653,191Wholesale and retail . . . . . 8,345,481 7,891,364 7,970,579 7,989,080 7,643,397Banks and other financial
institutions(1) . . . . . . . . . 4,329,964 5,146,932 5,223,906 4,818,364 5,213,020Communication and
information services . . . 1,527,811 1,509,858 1,634,584 1,551,533 1,510,596Other industries . . . . . . . . . 12,674,004 14,739,826 8,898,712 8,939,291 8,756,483Consumer . . . . . . . . . . . . . 16,720,590 16,397,560 16,491,010 16,287,332 15,802,024
Total domestic . . . . . . 69,874,765 72,435,938 67,006,528 65,696,342 65,156,790
Foreign:Governments and official
institutions . . . . . . . . . . . 1,052,051 1,125,031 1,037,795 920,538 841,695Banks and other financial
institutions(1) . . . . . . . . . 11,973,021 13,654,335 13,844,964 12,851,570 11,641,373Commercial and
industrial . . . . . . . . . . . . 29,593,255 30,056,474 30,279,641 30,591,173 31,951,169Other . . . . . . . . . . . . . . . . . 6,065,782 5,818,747 6,334,551 7,270,928 7,597,502
Total foreign . . . . . . . 48,684,109 50,654,587 51,496,951 51,634,209 52,031,739
Total . . . . . . . . . 118,558,874 123,090,525 118,503,479 117,330,551 117,188,529Unearned income, unamortized
premiums—net and deferredloan fees—net . . . . . . . . . . . . (293,672) (299,567) (288,507) (294,656) (304,588)
Total(2) . . . . . . . . ¥118,265,202 ¥122,790,958 ¥118,214,972 ¥117,035,895 ¥116,883,941
Notes:(1) Loans to so-called “non-bank finance companies” are generally included in the “Banks and other financial institutions” category.
Non-bank finance companies are primarily engaged in consumer lending, factoring and credit card businesses.(2) The above table includes loans held for sale of ¥88,927 million, ¥100,889 million, ¥185,940 million, ¥226,923 million and
¥291,794 million at March 31, 2015, 2016, 2017, 2018 and 2019, respectively, which are carried at the lower of cost or fair value.
A-8

Maturities and Sensitivities of Loans to Changes in Interest Rates
The following table shows the maturities of our loan portfolio at March 31, 2019:
Maturity
One year or less One to five years Over five years Total
(in millions)
Domestic:Manufacturing . . . . . . . . . . . . . . . . . . . . . . ¥ 6,212,225 ¥ 3,356,894 ¥ 1,584,877 ¥ 11,153,996Construction . . . . . . . . . . . . . . . . . . . . . . . 396,243 225,160 96,261 717,664Real estate . . . . . . . . . . . . . . . . . . . . . . . . . 2,828,822 4,000,616 4,876,981 11,706,419Services . . . . . . . . . . . . . . . . . . . . . . . . . . . 1,151,797 1,044,960 456,434 2,653,191Wholesale and retail . . . . . . . . . . . . . . . . . 5,430,996 1,735,157 477,244 7,643,397Banks and other financial institutions . . . . 3,374,489 1,218,358 620,173 5,213,020Communication and information
services . . . . . . . . . . . . . . . . . . . . . . . . . 328,360 751,835 430,401 1,510,596Other industries . . . . . . . . . . . . . . . . . . . . . 5,563,384 1,994,653 1,198,446 8,756,483Consumer . . . . . . . . . . . . . . . . . . . . . . . . . 2,166,861 3,008,857 10,626,306 15,802,024
Total Domestic . . . . . . . . . . . . . . . . . 27,453,177 17,336,490 20,367,123 65,156,790
Foreign . . . . . . . . . . . . . . . . . . . . . . . . . . . . . . . 20,923,818 18,992,979 12,114,942 52,031,739
Total . . . . . . . . . . . . . . . . . . . . . ¥48,376,995 ¥36,329,469 ¥32,482,065 ¥117,188,529
The above loans due after one year which had predetermined interest rates and floating or adjustable interestrates at March 31, 2019 are shown below:
Domestic Foreign Total
(in millions)
Predetermined rate . . . . . . . . . . . . . . . . . . . . . . . . . . . . . . . . . . . . . . . . ¥17,217,580 ¥ 4,668,477 ¥21,886,057Floating or adjustable rate . . . . . . . . . . . . . . . . . . . . . . . . . . . . . . . . . . 20,486,033 26,439,444 46,925,477
Total . . . . . . . . . . . . . . . . . . . . . . . . . . . . . . . . . . . . . . . . . . . . . . ¥37,703,613 ¥31,107,921 ¥68,811,534
Nonaccrual, Past Due and Restructured Loans
We generally discontinue the accrual of interest income on loans when substantial doubt exists as to the fulland timely collection of either principal or interest, when principal or interest is contractually past due one monthor more with respect to loans within all classes of the Commercial segment, three months or more with respect toloans within the Card, MUFG Americas Holdings, and Krungsri segments, and six months or more with respectto loans within the Residential segment.
Generally, accruing loans that are modified in a troubled debt restructuring (“TDR”) remain as accruingloans subsequent to the modification, and nonaccrual loans remain as nonaccrual. However, if a nonaccrual loanhas been restructured as a TDR, the borrower is not delinquent under the restructured terms, and demonstratesthat its financial condition has improved, we may reclassify the loan to accrual status. This determination isgenerally performed at least once a year through a detailed internal credit rating review process. Once anonaccrual loan is deemed to be a TDR, we will continue to designate the loan as a TDR even if the loan isreclassified to accrual status.
A-9

The following table shows the distribution of our nonaccrual loans, restructured loans and accruing loanswhich are contractually past due 90 days or more as to principal or interest payments at March 31 of each of thefive fiscal years ended March 31, 2019, based on the domicile and type of industry of the borrowers:
At March 31,
2015 2016 2017 2018 2019
(in millions)Nonaccrual loans:
Domestic:Manufacturing . . . . . . . . . . . . . . . . . . . . . . . . . ¥ 119,052 ¥ 372,875 ¥ 185,124 ¥ 77,188 ¥ 65,921Construction . . . . . . . . . . . . . . . . . . . . . . . . . . 20,150 15,256 15,248 10,922 9,877Real estate . . . . . . . . . . . . . . . . . . . . . . . . . . . . 85,625 66,210 50,142 37,853 26,513Services . . . . . . . . . . . . . . . . . . . . . . . . . . . . . . 54,801 41,056 38,977 31,733 27,115Wholesale and retail . . . . . . . . . . . . . . . . . . . . 158,454 132,858 131,545 108,639 94,990Banks and other financial institutions . . . . . . . 5,715 675 2,432 1,145 898Communication and information services . . . 23,204 20,270 18,711 13,815 11,955Other industries . . . . . . . . . . . . . . . . . . . . . . . . 19,094 29,715 10,352 37,677 26,110Consumer . . . . . . . . . . . . . . . . . . . . . . . . . . . . 199,665 174,106 161,680 149,491 143,668
Total domestic . . . . . . . . . . . . . . . . . . . . . 685,760 853,021 614,211 468,463 407,047
Foreign:Governments and official institutions . . . . . . . 40 132 — — —Banks and other financial institutions . . . . . . . 7,372 14,337 5,902 1,716 1,160Commercial and industrial . . . . . . . . . . . . . . . 144,609 264,163 301,685 215,601 219,669Other . . . . . . . . . . . . . . . . . . . . . . . . . . . . . . . . 75,916 68,514 64,834 67,869 78,780
Total foreign . . . . . . . . . . . . . . . . . . . . . . 227,937 347,146 372,421 285,186 299,609
Total . . . . . . . . . . . . . . . . . . . . . . . . . . . . ¥ 913,697 ¥1,200,167 ¥ 986,632 ¥ 753,649 ¥ 706,656
Restructured loans:Domestic . . . . . . . . . . . . . . . . . . . . . . . . . . . . . . . ¥ 735,348 ¥ 459,294 ¥ 682,041 ¥ 557,368 ¥ 511,151Foreign . . . . . . . . . . . . . . . . . . . . . . . . . . . . . . . . 144,089 166,240 158,784 137,674 127,931
Total . . . . . . . . . . . . . . . . . . . . . . . . . . . . ¥ 879,437 ¥ 625,534 ¥ 840,825 ¥ 695,042 ¥ 639,082
Accruing loans contractually past due 90 days ormore:Domestic . . . . . . . . . . . . . . . . . . . . . . . . . . . . . . . ¥ 48,050 ¥ 47,919 ¥ 37,650 ¥ 17,356 ¥ 13,621Foreign(1) . . . . . . . . . . . . . . . . . . . . . . . . . . . . . . . 360 314 3,430 2,408 2,778
Total . . . . . . . . . . . . . . . . . . . . . . . . . . . . ¥ 48,410 ¥ 48,233 ¥ 41,080 ¥ 19,764 ¥ 16,399
Total(2) . . . . . . . . . . . . . . . . . . . . . . . . . . . ¥1,841,544 ¥1,873,934 ¥1,868,537 ¥1,468,455 ¥1,362,137
Notes:(1) Foreign accruing loans contractually past due 90 days or more do not include ¥5,666 million, ¥1,930 million, ¥1,514 million,
¥549 million and ¥234 million of Federal Deposit Insurance Corporation (“FDIC”) covered loans held by MUFG Americas Holdingswhich are subject to the guidance on loans and debt securities acquired with deteriorated credit quality at March 31, 2015, 2016, 2017,2018 and 2019, respectively.
(2) The sum of nonaccrual loans, restructured loans and accruing loans contractually past due 90 days or more includes large groups ofsmaller-balance homogenous loans that have not been modified and are collectively evaluated for impairment, and accruing loanscontractually past due 90 days or more. However, these loans are excluded from the impaired loan balances of ¥1,331,123 million and¥1,209,791 million, at March 31, 2018 and 2019, respectively, disclosed in Note 4 to our consolidated financial statements includedelsewhere in this Annual Report.
Gross interest income which would have been accrued at the original terms on domestic nonaccrual andrestructured loans outstanding during the fiscal year ended March 31, 2019 was approximately ¥33.8 billion, ofwhich ¥16.3 billion was included in the results of operations for the fiscal year. Gross interest income whichwould have been accrued at the original terms on foreign nonaccrual and restructured loans outstanding for thefiscal year ended March 31, 2019 was approximately ¥29.9 billion, of which ¥15.9 billion was included in theresults of operations for the fiscal year.
A-10
Potential Problem Loans
We do not have potential problem loans where known information about possible credit problems ofborrowers causes management to have serious doubts as to the borrowers’ ability to comply with the present loanrepayment terms that are not disclosed as nonaccrual loans, restructured loans and accruing loans past due90 days or more.
Foreign Loans Outstanding
We had no cross-border outstandings to borrowers domiciled in a foreign country which in total exceeded0.75% of our consolidated total assets at March 31, 2017, 2018 and 2019. Cross-border outstandings are defined,for this purpose, as loans (including accrued interest), acceptances, interest-earning deposits with other banks,other interest-earning investments and any other monetary assets denominated in Japanese yen or other non-localcurrencies. Material local currency loans outstanding which are neither hedged nor funded by local currencyborrowings are included in cross-border outstandings.
Guarantees of outstandings to borrowers domiciled in other countries are considered to be outstandings ofthe guarantor. Loans made to, or deposits placed with, a branch of a foreign bank located outside the foreignbank’s home country are considered to be loans to, or deposits with, the foreign bank. Outstandings of a countrydo not include principal or interest amounts which are supported by written, legally enforceable guarantees byguarantors of other countries or the amounts of outstandings to the extent that they are secured by tangible, liquidcollateral held and realizable by MUFG Bank, Mitsubishi UFJ Trust and Banking and their subsidiaries outsidethe country in which they operate.
In addition to credit risk, cross-border outstandings are subject to country risk that as a result of political oreconomic conditions in a country, borrowers may be unable or unwilling to pay principal and interest accordingto contractual terms. Other risks related to cross-border outstandings include the possibility of insufficientforeign exchange and restrictions on its availability.
In order to manage country risk, we establish various risk management measures internally. Among otherthings, we regularly monitor economic conditions and other factors globally and assess country risk in eachcountry where we have cross-border exposure. For the purposes of monitoring and controlling the amount ofcredit exposed to country risk, we set a country limit, the maximum amount of credit exposure for an individualcountry, in consideration of the level of country risk and our ability to bear such potential risk. We alsodetermine our credit policy for each country in accordance with our country risk level and our business plan withregard to the country. The assessment of country risk, establishment of country limits, and determination ofcountry credit policies are subject to review and approval by our senior management and are updatedperiodically.
Loan Concentrations
At March 31, 2019, there were no concentrations of loans to a single industry group of borrowers, as definedby the Bank of Japan industry segment loan classifications, which exceeded 10 % of our consolidated total loans,except for loans in a category disclosed in the table of loans outstanding above.
Credit Risk Management
We have a credit rating system, under which borrowers and transactions are graded on a worldwide basis.We calculate probability of default by statistical means and manage our credit portfolio based on this creditrating system. For a detailed description of this system and other elements of our risk management structure, see“Item 11. Quantitative and Qualitative Disclosures about Credit, Market and Other Risk—Credit RiskManagement.”
A-11
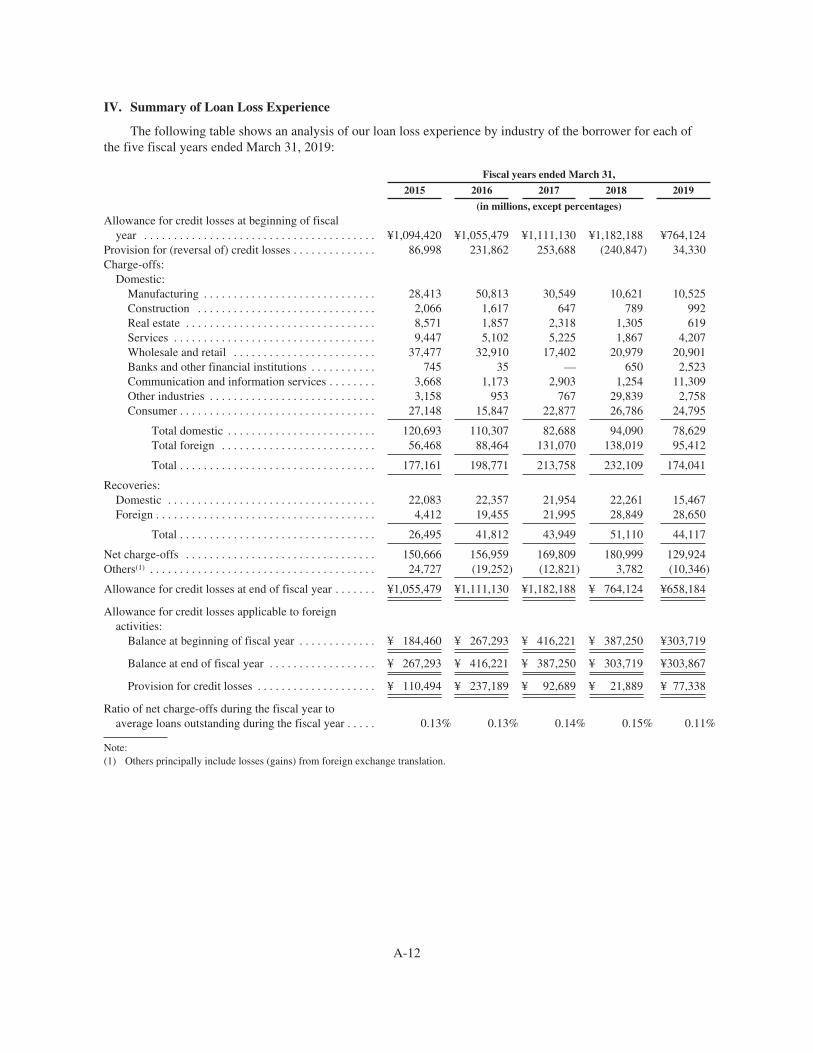
IV. Summary of Loan Loss Experience
The following table shows an analysis of our loan loss experience by industry of the borrower for each ofthe five fiscal years ended March 31, 2019:
Fiscal years ended March 31,
2015 2016 2017 2018 2019
(in millions, except percentages)Allowance for credit losses at beginning of fiscal
year . . . . . . . . . . . . . . . . . . . . . . . . . . . . . . . . . . . . . . . ¥1,094,420 ¥1,055,479 ¥1,111,130 ¥1,182,188 ¥764,124Provision for (reversal of) credit losses . . . . . . . . . . . . . . 86,998 231,862 253,688 (240,847) 34,330Charge-offs:
Domestic:Manufacturing . . . . . . . . . . . . . . . . . . . . . . . . . . . . . 28,413 50,813 30,549 10,621 10,525Construction . . . . . . . . . . . . . . . . . . . . . . . . . . . . . . 2,066 1,617 647 789 992Real estate . . . . . . . . . . . . . . . . . . . . . . . . . . . . . . . . 8,571 1,857 2,318 1,305 619Services . . . . . . . . . . . . . . . . . . . . . . . . . . . . . . . . . . 9,447 5,102 5,225 1,867 4,207Wholesale and retail . . . . . . . . . . . . . . . . . . . . . . . . 37,477 32,910 17,402 20,979 20,901Banks and other financial institutions . . . . . . . . . . . 745 35 — 650 2,523Communication and information services . . . . . . . . 3,668 1,173 2,903 1,254 11,309Other industries . . . . . . . . . . . . . . . . . . . . . . . . . . . . 3,158 953 767 29,839 2,758Consumer . . . . . . . . . . . . . . . . . . . . . . . . . . . . . . . . . 27,148 15,847 22,877 26,786 24,795
Total domestic . . . . . . . . . . . . . . . . . . . . . . . . . 120,693 110,307 82,688 94,090 78,629Total foreign . . . . . . . . . . . . . . . . . . . . . . . . . . 56,468 88,464 131,070 138,019 95,412
Total . . . . . . . . . . . . . . . . . . . . . . . . . . . . . . . . . 177,161 198,771 213,758 232,109 174,041
Recoveries:Domestic . . . . . . . . . . . . . . . . . . . . . . . . . . . . . . . . . . . 22,083 22,357 21,954 22,261 15,467Foreign . . . . . . . . . . . . . . . . . . . . . . . . . . . . . . . . . . . . . 4,412 19,455 21,995 28,849 28,650
Total . . . . . . . . . . . . . . . . . . . . . . . . . . . . . . . . . 26,495 41,812 43,949 51,110 44,117
Net charge-offs . . . . . . . . . . . . . . . . . . . . . . . . . . . . . . . . 150,666 156,959 169,809 180,999 129,924Others(1) . . . . . . . . . . . . . . . . . . . . . . . . . . . . . . . . . . . . . . 24,727 (19,252) (12,821) 3,782 (10,346)
Allowance for credit losses at end of fiscal year . . . . . . . ¥1,055,479 ¥1,111,130 ¥1,182,188 ¥ 764,124 ¥658,184
Allowance for credit losses applicable to foreignactivities:
Balance at beginning of fiscal year . . . . . . . . . . . . . ¥ 184,460 ¥ 267,293 ¥ 416,221 ¥ 387,250 ¥303,719
Balance at end of fiscal year . . . . . . . . . . . . . . . . . . ¥ 267,293 ¥ 416,221 ¥ 387,250 ¥ 303,719 ¥303,867
Provision for credit losses . . . . . . . . . . . . . . . . . . . . ¥ 110,494 ¥ 237,189 ¥ 92,689 ¥ 21,889 ¥ 77,338
Ratio of net charge-offs during the fiscal year toaverage loans outstanding during the fiscal year . . . . . 0.13% 0.13% 0.14% 0.15% 0.11%
Note:(1) Others principally include losses (gains) from foreign exchange translation.
A-12
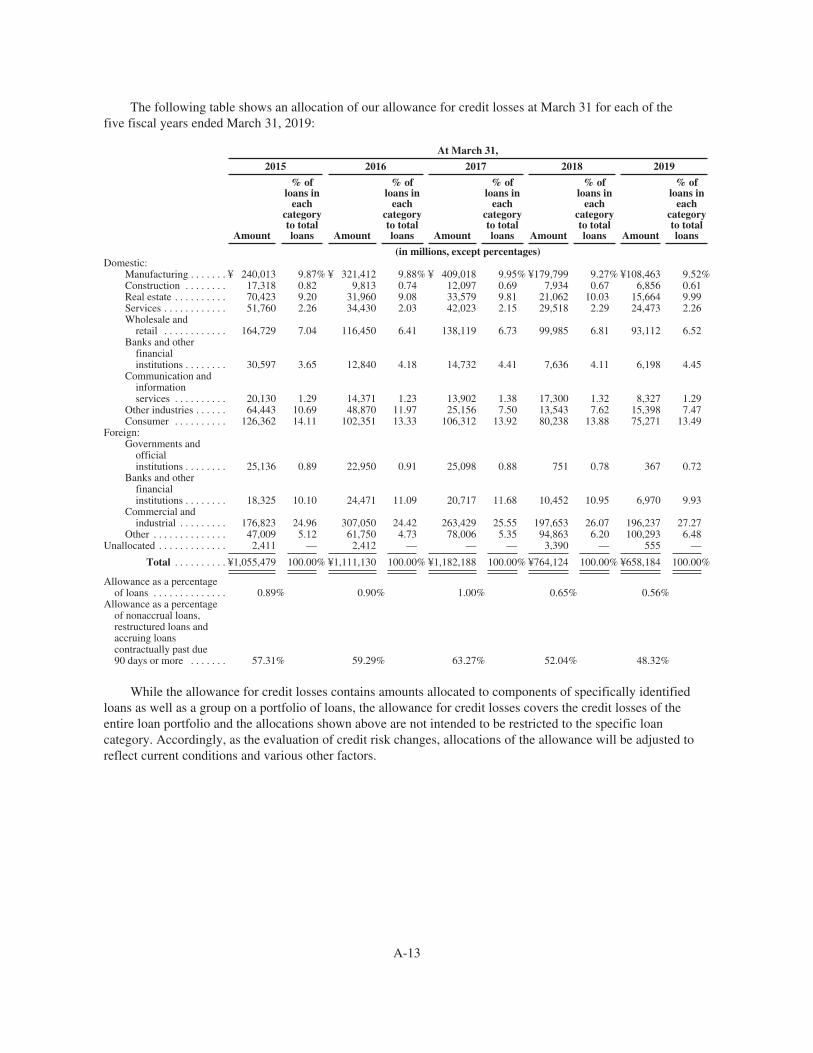
The following table shows an allocation of our allowance for credit losses at March 31 for each of thefive fiscal years ended March 31, 2019:
At March 31,
2015 2016 2017 2018 2019
Amount
% ofloans in
eachcategoryto totalloans Amount
% ofloans in
eachcategoryto totalloans Amount
% ofloans in
eachcategoryto totalloans Amount
% ofloans in
eachcategoryto totalloans Amount
% ofloans in
eachcategoryto totalloans
(in millions, except percentages)Domestic:
Manufacturing . . . . . . . ¥ 240,013 9.87% ¥ 321,412 9.88% ¥ 409,018 9.95% ¥179,799 9.27% ¥108,463 9.52%Construction . . . . . . . . 17,318 0.82 9,813 0.74 12,097 0.69 7,934 0.67 6,856 0.61Real estate . . . . . . . . . . 70,423 9.20 31,960 9.08 33,579 9.81 21,062 10.03 15,664 9.99Services . . . . . . . . . . . . 51,760 2.26 34,430 2.03 42,023 2.15 29,518 2.29 24,473 2.26Wholesale and
retail . . . . . . . . . . . . 164,729 7.04 116,450 6.41 138,119 6.73 99,985 6.81 93,112 6.52Banks and other
financialinstitutions . . . . . . . . 30,597 3.65 12,840 4.18 14,732 4.41 7,636 4.11 6,198 4.45
Communication andinformationservices . . . . . . . . . . 20,130 1.29 14,371 1.23 13,902 1.38 17,300 1.32 8,327 1.29
Other industries . . . . . . 64,443 10.69 48,870 11.97 25,156 7.50 13,543 7.62 15,398 7.47Consumer . . . . . . . . . . 126,362 14.11 102,351 13.33 106,312 13.92 80,238 13.88 75,271 13.49
Foreign:Governments and
officialinstitutions . . . . . . . . 25,136 0.89 22,950 0.91 25,098 0.88 751 0.78 367 0.72
Banks and otherfinancialinstitutions . . . . . . . . 18,325 10.10 24,471 11.09 20,717 11.68 10,452 10.95 6,970 9.93
Commercial andindustrial . . . . . . . . . 176,823 24.96 307,050 24.42 263,429 25.55 197,653 26.07 196,237 27.27
Other . . . . . . . . . . . . . . 47,009 5.12 61,750 4.73 78,006 5.35 94,863 6.20 100,293 6.48Unallocated . . . . . . . . . . . . . 2,411 — 2,412 — — — 3,390 — 555 —
Total . . . . . . . . . . ¥1,055,479 100.00% ¥1,111,130 100.00% ¥1,182,188 100.00% ¥764,124 100.00% ¥658,184 100.00%
Allowance as a percentageof loans . . . . . . . . . . . . . . 0.89% 0.90% 1.00% 0.65% 0.56%
Allowance as a percentageof nonaccrual loans,restructured loans andaccruing loanscontractually past due90 days or more . . . . . . . 57.31% 59.29% 63.27% 52.04% 48.32%
While the allowance for credit losses contains amounts allocated to components of specifically identifiedloans as well as a group on a portfolio of loans, the allowance for credit losses covers the credit losses of theentire loan portfolio and the allocations shown above are not intended to be restricted to the specific loancategory. Accordingly, as the evaluation of credit risk changes, allocations of the allowance will be adjusted toreflect current conditions and various other factors.
A-13

V. Deposits
The following table shows the average amount of, and the average rate paid on, the following depositcategories for the fiscal years ended March 31, 2017, 2018 and 2019:
Fiscal years ended March 31,
2017 2018 2019
Averageamount
Averagerate
Averageamount
Averagerate
Averageamount
Averagerate
(in millions, except percentages)Domestic offices:
Non-interest-bearing demanddeposits . . . . . . . . . . . . . . . . . . ¥ 20,034,315 —% ¥ 22,701,413 —% ¥ 24,429,358 —%
Interest-bearing demanddeposits . . . . . . . . . . . . . . . . . . 69,961,568 0.02 76,104,436 0.03 80,318,814 0.05
Deposits at notice . . . . . . . . . . . . 1,704,160 0.00 1,773,780 0.00 1,658,467 0.01Time deposits . . . . . . . . . . . . . . . 41,782,117 0.08 41,501,996 0.08 40,670,338 0.07Certificates of deposit . . . . . . . . . 3,708,639 0.02 3,760,848 0.01 2,014,290 0.01
Foreign offices:Non-interest-bearing demand
deposits . . . . . . . . . . . . . . . . . . 5,636,431 — 5,477,038 — 5,356,424 —Interest-bearing deposits,
principally time deposits andcertificates of deposit . . . . . . . 38,411,021 0.79 41,421,717 1.10 41,945,626 1.55
Total . . . . . . . . . . . . . . . . . . ¥181,238,251 ¥192,741,228 ¥196,393,317
Deposits at notice represent interest-bearing demand deposits which require the depositor to give two ormore days notice in advance of withdrawal.
The average amounts of total deposits by foreign depositors included in domestic offices for the fiscal yearsended March 31, 2017, 2018 and 2019 were ¥886,274 million, ¥882,772 million and ¥820,311 million,respectively.
At March 31, 2019, the balances and remaining maturities of time deposits and certificates of deposit(“CDs”) issued by domestic offices in amounts of ¥10 million (approximately U.S.$90 thousand at the FederalReserve Bank of New York’s noon buying rate on March 29, 2019) or more and total foreign deposits issued inamounts of U.S.$100,000 or more are shown in the following table:
Timedeposits
Certificates ofdeposit Total
(in millions)Domestic offices:
Three months or less . . . . . . . . . . . . . . . . . . . . . . . . . . . . . . . . . . ¥ 6,329,422 ¥ 1,427,695 ¥ 7,757,117Over three months through six months . . . . . . . . . . . . . . . . . . . . 4,038,389 146,870 4,185,259Over six months through twelve months . . . . . . . . . . . . . . . . . . 10,298,134 148,671 10,446,805Over twelve months . . . . . . . . . . . . . . . . . . . . . . . . . . . . . . . . . . 3,439,282 71,317 3,510,599
Total . . . . . . . . . . . . . . . . . . . . . . . . . . . . . . . . . . . . . . . . . . ¥ 24,105,227 ¥ 1,794,553 ¥ 25,899,780
Foreign offices . . . . . . . . . . . . . . . . . . . . . . . . . . . . . . . . . . . . . . . . . . . ¥ 23,858,381
A-14

VI Short-Term Borrowings
The following table shows certain additional information with respect to our short-term borrowings for thefiscal years ended March 31, 2017, 2018 and 2019:
Fiscal years ended March 31,
2017 2018 2019
(in millions, except percentages)
Call money, funds purchased, and payables under repurchaseagreements and securities lending transactions:
Average balance outstanding during the fiscal year . . . . . . . . ¥32,789,499 ¥28,052,275 ¥ 26,406,493Maximum balance outstanding at any month-end during the
fiscal year . . . . . . . . . . . . . . . . . . . . . . . . . . . . . . . . . . . . . . 32,927,067 28,757,355 31,395,497Balance at end of fiscal year . . . . . . . . . . . . . . . . . . . . . . . . . . 25,217,396 28,757,355 28,588,039Weighted average interest rate during the fiscal year . . . . . . . 0.31% 0.61% 1.28%Weighted average interest rate on balance at end of fiscal
year . . . . . . . . . . . . . . . . . . . . . . . . . . . . . . . . . . . . . . . . . . . 0.27% 0.61% 1.13%Due to trust account:
Average balance outstanding during the fiscal year . . . . . . . . ¥ 3,122,190 ¥ 3,065,511 ¥ 3,062,655Maximum balance outstanding at any month-end during the
fiscal year . . . . . . . . . . . . . . . . . . . . . . . . . . . . . . . . . . . . . . 4,099,102 3,386,158 3,531,717Balance at end of fiscal year . . . . . . . . . . . . . . . . . . . . . . . . . . 3,335,155 3,386,158 2,735,952Weighted average interest rate during the fiscal year . . . . . . . 0.01% 0.00% 0.00%Weighted average interest rate on balance at end of fiscal
year . . . . . . . . . . . . . . . . . . . . . . . . . . . . . . . . . . . . . . . . . . . 0.00% 0.00% 0.00%Other short-term borrowings:
Average balance outstanding during the fiscal year . . . . . . . . ¥ 6,527,129 ¥ 7,491,384 ¥ 6,812,706Maximum balance outstanding at any month-end during the
fiscal year . . . . . . . . . . . . . . . . . . . . . . . . . . . . . . . . . . . . . . 7,969,521 8,705,257 7,588,971Balance at end of fiscal year . . . . . . . . . . . . . . . . . . . . . . . . . . 7,969,521 6,881,124 6,731,073Weighted average interest rate during the fiscal year . . . . . . . 0.58% 0.92% 1.82%Weighted average interest rate on balance at end of fiscal
year . . . . . . . . . . . . . . . . . . . . . . . . . . . . . . . . . . . . . . . . . . . 0.66% 1.29% 1.97%
A-15
CONSOLIDATED FINANCIAL STATEMENTS
INDEX
Page
Report of Independent Registered Public Accounting Firm . . . . . . . . . . . . . . . . . . . . . . . . . . . . . . . . . . . . . F-3Consolidated Balance Sheets as of March 31, 2018 and 2019 . . . . . . . . . . . . . . . . . . . . . . . . . . . . . . . . . . . F-4Consolidated Statements of Income for the Fiscal Years ended March 31, 2017, 2018 and 2019 . . . . . . . . F-6Consolidated Statements of Comprehensive Income for the Fiscal Years ended March 31, 2017, 2018
and 2019 . . . . . . . . . . . . . . . . . . . . . . . . . . . . . . . . . . . . . . . . . . . . . . . . . . . . . . . . . . . . . . . . . . . . . . . . . . . F-8Consolidated Statements of Equity for the Fiscal Years ended March 31, 2017, 2018 and 2019 . . . . . . . . F-9Consolidated Statements of Cash Flows for the Fiscal Years ended March 31, 2017, 2018 and 2019 . . . . F-11Notes to Consolidated Financial Statements . . . . . . . . . . . . . . . . . . . . . . . . . . . . . . . . . . . . . . . . . . . . . . . . . F-13
1. Basis of Financial Statements and Summary of Significant Accounting Policies . . . . . . . . . . . . . . F-132. Business Developments . . . . . . . . . . . . . . . . . . . . . . . . . . . . . . . . . . . . . . . . . . . . . . . . . . . . . . . . . . . F-333. Investment Securities . . . . . . . . . . . . . . . . . . . . . . . . . . . . . . . . . . . . . . . . . . . . . . . . . . . . . . . . . . . . . F-364. Loans and Allowance for Credit Losses . . . . . . . . . . . . . . . . . . . . . . . . . . . . . . . . . . . . . . . . . . . . . . F-445. Premises and Equipment . . . . . . . . . . . . . . . . . . . . . . . . . . . . . . . . . . . . . . . . . . . . . . . . . . . . . . . . . . F-626. Goodwill and Other Intangible Assets . . . . . . . . . . . . . . . . . . . . . . . . . . . . . . . . . . . . . . . . . . . . . . . . F-637. Income Taxes . . . . . . . . . . . . . . . . . . . . . . . . . . . . . . . . . . . . . . . . . . . . . . . . . . . . . . . . . . . . . . . . . . . F-668. Pledged Assets and Collateral . . . . . . . . . . . . . . . . . . . . . . . . . . . . . . . . . . . . . . . . . . . . . . . . . . . . . . F-709. Deposits . . . . . . . . . . . . . . . . . . . . . . . . . . . . . . . . . . . . . . . . . . . . . . . . . . . . . . . . . . . . . . . . . . . . . . . F-7210. Call Money and Funds Purchased . . . . . . . . . . . . . . . . . . . . . . . . . . . . . . . . . . . . . . . . . . . . . . . . . . F-7211. Due to Trust Account . . . . . . . . . . . . . . . . . . . . . . . . . . . . . . . . . . . . . . . . . . . . . . . . . . . . . . . . . . . . F-7312. Short-term Borrowings and Long-term Debt . . . . . . . . . . . . . . . . . . . . . . . . . . . . . . . . . . . . . . . . . F-7313. Severance Indemnities and Pension Plans . . . . . . . . . . . . . . . . . . . . . . . . . . . . . . . . . . . . . . . . . . . . F-7614. Other Assets and Liabilities . . . . . . . . . . . . . . . . . . . . . . . . . . . . . . . . . . . . . . . . . . . . . . . . . . . . . . . F-8815. Offsetting of Derivatives, Repurchase Agreements, and Securities Lending Transactions . . . . . . F-9016. Repurchase Agreements, and Securities Lending Transactions Accounted for as Secured
Borrowings . . . . . . . . . . . . . . . . . . . . . . . . . . . . . . . . . . . . . . . . . . . . . . . . . . . . . . . . . . . . . . . . . . . . F-9117. Preferred Stock . . . . . . . . . . . . . . . . . . . . . . . . . . . . . . . . . . . . . . . . . . . . . . . . . . . . . . . . . . . . . . . . F-9318. Common Stock and Capital Surplus . . . . . . . . . . . . . . . . . . . . . . . . . . . . . . . . . . . . . . . . . . . . . . . . F-9319. Retained Earnings, Legal Reserve and Dividends . . . . . . . . . . . . . . . . . . . . . . . . . . . . . . . . . . . . . . F-9520. Accumulated Other Comprehensive Income (Loss) . . . . . . . . . . . . . . . . . . . . . . . . . . . . . . . . . . . . F-9721. Noncontrolling Interests . . . . . . . . . . . . . . . . . . . . . . . . . . . . . . . . . . . . . . . . . . . . . . . . . . . . . . . . . F-10122. Regulatory Capital Requirements . . . . . . . . . . . . . . . . . . . . . . . . . . . . . . . . . . . . . . . . . . . . . . . . . . F-10223. Earnings per Common Share Applicable to Common Shareholders of MUFG . . . . . . . . . . . . . . . F-10924. Derivative Financial Instruments . . . . . . . . . . . . . . . . . . . . . . . . . . . . . . . . . . . . . . . . . . . . . . . . . . . F-10925. Obligations Under Guarantees and Other Off-balance Sheet Instruments . . . . . . . . . . . . . . . . . . . F-11626. Variable Interest Entities . . . . . . . . . . . . . . . . . . . . . . . . . . . . . . . . . . . . . . . . . . . . . . . . . . . . . . . . . F-12027. Commitments and Contingent Liabilities . . . . . . . . . . . . . . . . . . . . . . . . . . . . . . . . . . . . . . . . . . . . F-13128. Fees and Commissions Income . . . . . . . . . . . . . . . . . . . . . . . . . . . . . . . . . . . . . . . . . . . . . . . . . . . . F-13329. Trading Account Profits and Losses . . . . . . . . . . . . . . . . . . . . . . . . . . . . . . . . . . . . . . . . . . . . . . . . F-13430. Business Segments . . . . . . . . . . . . . . . . . . . . . . . . . . . . . . . . . . . . . . . . . . . . . . . . . . . . . . . . . . . . . . F-13531. Foreign Activities . . . . . . . . . . . . . . . . . . . . . . . . . . . . . . . . . . . . . . . . . . . . . . . . . . . . . . . . . . . . . . F-13832. Fair Value . . . . . . . . . . . . . . . . . . . . . . . . . . . . . . . . . . . . . . . . . . . . . . . . . . . . . . . . . . . . . . . . . . . . F-14033. Stock-based Compensation . . . . . . . . . . . . . . . . . . . . . . . . . . . . . . . . . . . . . . . . . . . . . . . . . . . . . . . F-15934. Parent Company Only Financial Information . . . . . . . . . . . . . . . . . . . . . . . . . . . . . . . . . . . . . . . . . F-16435. Subsequent Events . . . . . . . . . . . . . . . . . . . . . . . . . . . . . . . . . . . . . . . . . . . . . . . . . . . . . . . . . . . . . . F-167
F-1

(This page is intentionally left blank)
F-2
REPORT OF INDEPENDENT REGISTERED PUBLIC ACCOUNTING FIRM
To the Board of Directors and the Shareholders ofMitsubishi UFJ Financial Group, Inc.(Kabushiki Kaisha Mitsubishi UFJ Financial Group)
Opinion on the Financial Statements
We have audited the accompanying consolidated balance sheets of Mitsubishi UFJ Financial Group, Inc.(Kabushiki Kaisha Mitsubishi UFJ Financial Group) (“MUFG”) and subsidiaries (together, the “MUFG Group”)as of March 31, 2018 and 2019, the related consolidated statements of income, comprehensive income, equityand cash flows for each of the three years in the period ended March 31, 2019, and the related notes (collectivelyreferred to as the “financial statements”) (all expressed in Japanese yen). In our opinion, the financial statementspresent fairly, in all material respects, the financial position of the MUFG Group as of March 31, 2018 and 2019,and the results of its operations and its cash flows for each of the three years in the period ended March 31, 2019,in conformity with accounting principles generally accepted in the United States of America.
We have also audited, in accordance with the standards of the Public Company Accounting Oversight Board(United States) (“PCAOB”), the MUFG Group’s internal control over financial reporting as of March 31, 2019,based on criteria established in Internal Control—Integrated Framework (2013) issued by the Committee ofSponsoring Organizations of the Treadway Commission and our report dated July 10, 2019, expressed anunqualified opinion on the MUFG Group’s internal control over financial reporting.
Change in Accounting Principle
As discussed in Note 1 to the financial statements, the MUFG Group has changed its method of accountingfor unrealized holding gains and losses on equity investment securities on April 1, 2018 due to the adoption ofFinancial Accounting Standards Board Accounting Standards Update 2016-01, Financial Instruments—Overall(Subtopic 825-10)—Recognition and Measurement of Financial Assets and Financial Liabilities.
Basis for Opinion
These financial statements are the responsibility of the MUFG Group’s management. Our responsibility isto express an opinion on the MUFG Group’s financial statements based on our audits. We are a publicaccounting firm registered with the PCAOB and are required to be independent with respect to the MUFG Groupin accordance with the U.S. federal securities laws and the applicable rules and regulations of the Securities andExchange Commission and the PCAOB.
We conducted our audits in accordance with the standards of the PCAOB. Those standards require that weplan and perform the audit to obtain reasonable assurance about whether the financial statements are free ofmaterial misstatement, whether due to error or fraud. Our audits included performing procedures to assess therisks of material misstatement of the financial statements, whether due to error or fraud, and performingprocedures that respond to those risks. Such procedures included examining, on a test basis, evidence regardingthe amounts and disclosures in the financial statements. Our audits also included evaluating the accountingprinciples used and significant estimates made by management, as well as evaluating the overall presentation ofthe financial statements. We believe that our audits provide a reasonable basis for our opinion.
/s/ Deloitte Touche Tohmatsu LLC
Tokyo, JapanJuly 10, 2019
We have served as the MUFG Group’s auditor since 1976.
F-3

MITSUBISHI UFJ FINANCIAL GROUP, INC. AND SUBSIDIARIES
CONSOLIDATED BALANCE SHEETSAS OF MARCH 31, 2018 AND 2019
(in millions) 2018 2019
ASSETSCash and due from banks (Note 8) . . . . . . . . . . . . . . . . . . . . . . . . . . . . . . . . . . . . . ¥ 32,648,387 ¥ 33,924,340Interest-earning deposits in other banks (Note 8) . . . . . . . . . . . . . . . . . . . . . . . . . . 43,209,662 40,646,920
Cash, due from banks and interest-earning deposits in other banks . . . . . . . . . . 75,858,049 74,571,260
Call loans and funds sold . . . . . . . . . . . . . . . . . . . . . . . . . . . . . . . . . . . . . . . . . . . . 896,360 1,109,995Receivables under resale agreements (Note 15) . . . . . . . . . . . . . . . . . . . . . . . . . . . 5,725,921 10,974,740Receivables under securities borrowing transactions (Note 15) . . . . . . . . . . . . . . . 9,268,756 2,758,573Trading account assets (including assets pledged that secured parties are
permitted to sell or repledge of ¥6,558,587 and ¥7,512,025 in 2018 and 2019)(including ¥15,007,706 and ¥18,597,303 measured at fair value under the fairvalue option in 2018 and 2019) (Notes 8, 15, 24 and 32) . . . . . . . . . . . . . . . . . . 35,186,689 40,576,618
Investment securities (Notes 3, 8 and 32):Available-for-sale debt securities (including assets pledged that secured
parties are permitted to sell or repledge of ¥11,358,439 and ¥6,981,664 in2018 and 2019) . . . . . . . . . . . . . . . . . . . . . . . . . . . . . . . . . . . . . . . . . . . . . . . . 32,833,114 33,518,503
Held-to-maturity debt securities (including assets pledged that secured partiesare permitted to sell or repledge of ¥414,857 and ¥160,828 in 2018 and2019) (fair value of ¥3,620,672 and ¥4,452,947 in 2018 and 2019) . . . . . . . . 3,582,941 4,441,901
Equity securities (including assets pledged that secured parties are permittedto sell or repledge of ¥1,650 and ¥1,364 in 2018 and 2019) (including¥6,699,943 and ¥6,413,867 in 2018 and 2019 measured at fair value) . . . . . 7,238,194 6,977,600
Total investment securities . . . . . . . . . . . . . . . . . . . . . . . . . . . . . . . . . . . . . . . 43,654,249 44,938,004
Loans, net of unearned income, unamortized premiums and deferred loan fees(including assets pledged that secured parties are permitted to sell or repledgeof ¥898,186 and ¥802,185 in 2018 and 2019) (Notes 4 and 8) . . . . . . . . . . . . . . 117,035,895 116,883,941
Allowance for credit losses (Note 4) . . . . . . . . . . . . . . . . . . . . . . . . . . . . . . . . . . . . (764,124) (658,184)
Net loans . . . . . . . . . . . . . . . . . . . . . . . . . . . . . . . . . . . . . . . . . . . . . . . . . . . . . . . 116,271,771 116,225,757
Premises and equipment—net (Note 5) . . . . . . . . . . . . . . . . . . . . . . . . . . . . . . . . . 1,013,588 973,600Accrued interest . . . . . . . . . . . . . . . . . . . . . . . . . . . . . . . . . . . . . . . . . . . . . . . . . . . . 324,624 359,648Customers’ acceptance liability . . . . . . . . . . . . . . . . . . . . . . . . . . . . . . . . . . . . . . . 183,084 247,996Intangible assets—net (Notes 2 and 6) . . . . . . . . . . . . . . . . . . . . . . . . . . . . . . . . . . 1,011,119 927,196Goodwill (Notes 2 and 6) . . . . . . . . . . . . . . . . . . . . . . . . . . . . . . . . . . . . . . . . . . . . 441,334 433,891Deferred tax assets (Note 7) . . . . . . . . . . . . . . . . . . . . . . . . . . . . . . . . . . . . . . . . . . 68,704 89,719Other assets (Notes 8, 13, 14 and 32) . . . . . . . . . . . . . . . . . . . . . . . . . . . . . . . . . . . 10,666,064 11,041,902
Total assets . . . . . . . . . . . . . . . . . . . . . . . . . . . . . . . . . . . . . . . . . . . . . . . ¥300,570,312 ¥305,228,899
Assets of consolidated VIEs included in total assets above that can be usedonly to settle obligations of consolidated VIEs (Note 26)
Cash and due from banks . . . . . . . . . . . . . . . . . . . . . . . . . . . . . . . . . . . . . . . . . . . . ¥ 130 ¥ 7Interest-earning deposits in other banks . . . . . . . . . . . . . . . . . . . . . . . . . . . . . . . . . 23,161 23,655Trading account assets . . . . . . . . . . . . . . . . . . . . . . . . . . . . . . . . . . . . . . . . . . . . . . 477,583 528,690Investment securities . . . . . . . . . . . . . . . . . . . . . . . . . . . . . . . . . . . . . . . . . . . . . . . . 1,952,683 1,828,194Loans . . . . . . . . . . . . . . . . . . . . . . . . . . . . . . . . . . . . . . . . . . . . . . . . . . . . . . . . . . . . 16,550,107 15,545,328All other assets . . . . . . . . . . . . . . . . . . . . . . . . . . . . . . . . . . . . . . . . . . . . . . . . . . . . 187,329 294,212
Total assets of consolidated VIEs . . . . . . . . . . . . . . . . . . . . . . . . . . . . . ¥ 19,190,993 ¥ 18,220,086
F-4

MITSUBISHI UFJ FINANCIAL GROUP, INC. AND SUBSIDIARIES
CONSOLIDATED BALANCE SHEETS—(Continued)AS OF MARCH 31, 2018 AND 2019
(in millions, except shares) 2018 2019
LIABILITIES AND EQUITYDeposits (Notes 8 and 9):
Domestic offices:Non-interest-bearing . . . . . . . . . . . . . . . . . . . . . . . . . . . . . . . . . . . . . . . . . . . . ¥ 24,406,759 ¥ 25,222,218Interest-bearing . . . . . . . . . . . . . . . . . . . . . . . . . . . . . . . . . . . . . . . . . . . . . . . . 125,195,310 124,859,036
Overseas offices:Non-interest-bearing . . . . . . . . . . . . . . . . . . . . . . . . . . . . . . . . . . . . . . . . . . . . 5,455,677 5,220,557Interest-bearing . . . . . . . . . . . . . . . . . . . . . . . . . . . . . . . . . . . . . . . . . . . . . . . . 40,616,847 43,978,978
Total deposits . . . . . . . . . . . . . . . . . . . . . . . . . . . . . . . . . . . . . . . . . . . . . 195,674,593 199,280,789
Call money and funds purchased (Notes 8 and 10) . . . . . . . . . . . . . . . . . . . . . . . . . 2,452,543 2,450,320Payables under repurchase agreements (Notes 8, 15 and 16) . . . . . . . . . . . . . . . . . 18,134,594 25,224,632Payables under securities lending transactions (Notes 8, 15 and 16) . . . . . . . . . . . 8,170,218 913,087Due to trust account (Note 11) . . . . . . . . . . . . . . . . . . . . . . . . . . . . . . . . . . . . . . . . 3,386,158 2,735,952Other short-term borrowings (including ¥264,783 and ¥289,755 measured at fair
value under the fair value option in 2018 and 2019) (Notes 8, 12 and 32) . . . . . 6,881,124 6,731,073Trading account liabilities (Notes 15, 24 and 32) . . . . . . . . . . . . . . . . . . . . . . . . . . 12,222,331 13,009,492Obligations to return securities received as collateral (Notes 15, 16 and 32) . . . . . 3,176,962 3,087,026Bank acceptances outstanding . . . . . . . . . . . . . . . . . . . . . . . . . . . . . . . . . . . . . . . . . 183,084 247,996Accrued interest . . . . . . . . . . . . . . . . . . . . . . . . . . . . . . . . . . . . . . . . . . . . . . . . . . . . 165,921 214,735Long-term debt (including ¥333,985 and ¥325,808 measured at fair value
under the fair value option in 2018 and 2019) (Notes 8, 12 and 32) . . . . . . . . . 27,069,556 27,990,543Other liabilities (Notes 1, 7, 8, 13, 14 and 27) . . . . . . . . . . . . . . . . . . . . . . . . . . . . 7,407,413 7,358,506
Total liabilities . . . . . . . . . . . . . . . . . . . . . . . . . . . . . . . . . . . . . . . . . . . . 284,924,497 289,244,151
Commitments and contingent liabilities (Notes 25 and 27)Mitsubishi UFJ Financial Group shareholders’ equity:
Capital stock (Notes 17 and 18)—common stock authorized, 33,000,000,000shares; common stock issued, 13,900,028,020 shares and 13,667,770,520shares at March 31, 2018 and 2019, with no stated value . . . . . . . . . . . . . . . . 2,090,270 2,090,270
Capital surplus (Note 18) . . . . . . . . . . . . . . . . . . . . . . . . . . . . . . . . . . . . . . . . . . 5,740,165 5,577,186Retained earnings (Notes 19 and 35):
Appropriated for legal reserve . . . . . . . . . . . . . . . . . . . . . . . . . . . . . . . . . . . . 239,571 239,571Unappropriated retained earnings . . . . . . . . . . . . . . . . . . . . . . . . . . . . . . . . . . 4,945,733 8,094,026
Accumulated other comprehensive income, net of taxes (Note 20) . . . . . . . . . . 2,477,315 (284,269)Treasury stock, at cost—737,772,882 common shares and 745,921,774
common shares at March 31, 2018 and 2019 . . . . . . . . . . . . . . . . . . . . . . . . . (522,872) (517,236)
Total Mitsubishi UFJ Financial Group shareholders’ equity . . . . . . . . . 14,970,182 15,199,548Noncontrolling interests (Note 21) . . . . . . . . . . . . . . . . . . . . . . . . . . . . . . . . . . . . . 675,633 785,200
Total equity . . . . . . . . . . . . . . . . . . . . . . . . . . . . . . . . . . . . . . . . . . . . . . . 15,645,815 15,984,748
Total liabilities and equity . . . . . . . . . . . . . . . . . . . . . . . . . . . . . . . . . . ¥300,570,312 ¥305,228,899
Liabilities of consolidated VIEs for which creditors or beneficial interestholders do not have recourse to the general credit of Mitsubishi UFJFinancial Group (Note 26)
Other short-term borrowings . . . . . . . . . . . . . . . . . . . . . . . . . . . . . . . . . . . . . . . . . . ¥ 28,451 ¥ 20,535Long-term debt . . . . . . . . . . . . . . . . . . . . . . . . . . . . . . . . . . . . . . . . . . . . . . . . . . . . 510,948 490,033All other liabilities . . . . . . . . . . . . . . . . . . . . . . . . . . . . . . . . . . . . . . . . . . . . . . . . . . 84,040 62,146
Total liabilities of consolidated VIEs . . . . . . . . . . . . . . . . . . . . . . . . . . ¥ 623,439 ¥ 572,714
See the accompanying notes to Consolidated Financial Statements.
F-5

MITSUBISHI UFJ FINANCIAL GROUP, INC. AND SUBSIDIARIES
CONSOLIDATED STATEMENTS OF INCOMEFOR THE FISCAL YEARS ENDED MARCH 31, 2017, 2018 AND 2019
(in millions) 2017 2018 2019
Interest income:Loans, including fees (Note 4) . . . . . . . . . . . . . . . . . . . . . . . . . . . . . . . ¥ 2,023,649 ¥2,271,219 ¥2,576,417Deposits in other banks . . . . . . . . . . . . . . . . . . . . . . . . . . . . . . . . . . . . . 78,735 126,608 183,327Investment securities:
Interest . . . . . . . . . . . . . . . . . . . . . . . . . . . . . . . . . . . . . . . . . . . . . . 235,638 198,715 237,378Dividends . . . . . . . . . . . . . . . . . . . . . . . . . . . . . . . . . . . . . . . . . . . . 135,506 145,186 160,825
Trading account assets . . . . . . . . . . . . . . . . . . . . . . . . . . . . . . . . . . . . . . 455,860 432,595 499,724Call loans and funds sold . . . . . . . . . . . . . . . . . . . . . . . . . . . . . . . . . . . . 11,023 10,808 10,354Receivables under resale agreements and securities borrowing
transactions . . . . . . . . . . . . . . . . . . . . . . . . . . . . . . . . . . . . . . . . . . . . 50,356 73,885 145,354
Total . . . . . . . . . . . . . . . . . . . . . . . . . . . . . . . . . . . . . . . . . . . . 2,990,767 3,259,016 3,813,379
Interest expense:Deposits . . . . . . . . . . . . . . . . . . . . . . . . . . . . . . . . . . . . . . . . . . . . . . . . . 347,430 514,868 717,366Call money and funds purchased . . . . . . . . . . . . . . . . . . . . . . . . . . . . . . 1,791 5,248 3,913Payables under repurchase agreements and securities lending
transactions . . . . . . . . . . . . . . . . . . . . . . . . . . . . . . . . . . . . . . . . . . . . 100,796 165,512 333,632Due to trust account . . . . . . . . . . . . . . . . . . . . . . . . . . . . . . . . . . . . . . . . 207 109 124Other short-term borrowings and trading account liabilities . . . . . . . . . 61,137 93,535 155,149Long-term debt . . . . . . . . . . . . . . . . . . . . . . . . . . . . . . . . . . . . . . . . . . . 258,278 249,483 307,797
Total . . . . . . . . . . . . . . . . . . . . . . . . . . . . . . . . . . . . . . . . . . . . 769,639 1,028,755 1,517,981
Net interest income . . . . . . . . . . . . . . . . . . . . . . . . . . . . . . . . . . . . . . . 2,221,128 2,230,261 2,295,398Provision for (reversal of) credit losses (Note 4) . . . . . . . . . . . . . . . . 253,688 (240,847) 34,330
Net interest income after provision for (reversal of) creditlosses . . . . . . . . . . . . . . . . . . . . . . . . . . . . . . . . . . . . . . . . . . . . . . . . . 1,967,440 2,471,108 2,261,068
Non-interest income:Fees and commissions income (Note 28) . . . . . . . . . . . . . . . . . . . . . . . 1,414,893 1,462,792 1,438,578Foreign exchange losses—net (Note 29) . . . . . . . . . . . . . . . . . . . . . . . . (134,885) (49,561) (95,987)Trading account profits (losses)—net (Notes 29 and 32) . . . . . . . . . . . (639,184) (73,114) 168,900Investment securities gains (losses)—net (Note 3)(1)(2) . . . . . . . . . . . . . 281,158 286,903 (252,307)Equity in earnings of equity method investees—net (Note 14) . . . . . . 197,821 227,984 209,732Gains on sales of loans (Note 4) . . . . . . . . . . . . . . . . . . . . . . . . . . . . . . 13,286 16,109 22,663Other non-interest income (Note 21) . . . . . . . . . . . . . . . . . . . . . . . . . . . 63,617 63,978 103,665
Total . . . . . . . . . . . . . . . . . . . . . . . . . . . . . . . . . . . . . . . . . . . . 1,196,706 1,935,091 1,595,244
Non-interest expense:Salaries and employee benefits (Note 13) . . . . . . . . . . . . . . . . . . . . . . . 1,139,677 1,165,357 1,175,405Occupancy expenses—net (Notes 5 and 27) . . . . . . . . . . . . . . . . . . . . . 176,819 179,100 179,780Fees and commissions expenses . . . . . . . . . . . . . . . . . . . . . . . . . . . . . . 273,675 297,847 313,745Outsourcing expenses, including data processing . . . . . . . . . . . . . . . . . 258,345 276,236 275,052Depreciation of premises and equipment (Note 5) . . . . . . . . . . . . . . . . 99,774 96,180 98,867Amortization of intangible assets (Note 6) . . . . . . . . . . . . . . . . . . . . . . 227,942 234,376 235,083Impairment of intangible assets (Note 6) . . . . . . . . . . . . . . . . . . . . . . . 5,803 21,900 118,108Insurance premiums, including deposit insurance . . . . . . . . . . . . . . . . . 91,881 91,847 93,756Communications . . . . . . . . . . . . . . . . . . . . . . . . . . . . . . . . . . . . . . . . . . 55,274 58,067 59,166Taxes and public charges . . . . . . . . . . . . . . . . . . . . . . . . . . . . . . . . . . . . 94,047 90,210 95,358Impairment of goodwill (Note 6) . . . . . . . . . . . . . . . . . . . . . . . . . . . . . 6,638 — —Provision for (reversal of) off-balance sheet credit instruments . . . . . . 106,556 (96,054) 38,463Other non-interest expenses (Notes 5, 21 and 27) . . . . . . . . . . . . . . . . . 355,172 329,314 302,687
Total . . . . . . . . . . . . . . . . . . . . . . . . . . . . . . . . . . . . . . . . . . . . 2,891,603 2,744,380 2,985,470
F-6
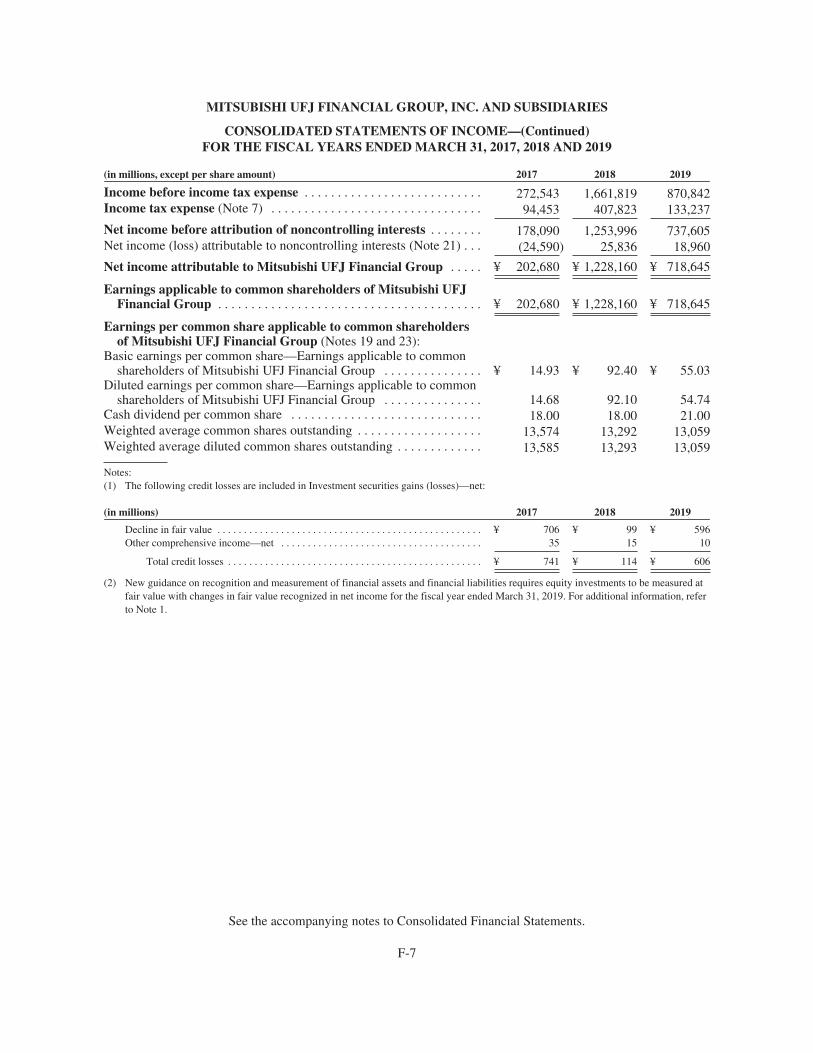
MITSUBISHI UFJ FINANCIAL GROUP, INC. AND SUBSIDIARIES
CONSOLIDATED STATEMENTS OF INCOME—(Continued)FOR THE FISCAL YEARS ENDED MARCH 31, 2017, 2018 AND 2019
(in millions, except per share amount) 2017 2018 2019
Income before income tax expense . . . . . . . . . . . . . . . . . . . . . . . . . . . 272,543 1,661,819 870,842Income tax expense (Note 7) . . . . . . . . . . . . . . . . . . . . . . . . . . . . . . . . 94,453 407,823 133,237
Net income before attribution of noncontrolling interests . . . . . . . . 178,090 1,253,996 737,605Net income (loss) attributable to noncontrolling interests (Note 21) . . . (24,590) 25,836 18,960
Net income attributable to Mitsubishi UFJ Financial Group . . . . . ¥ 202,680 ¥ 1,228,160 ¥ 718,645
Earnings applicable to common shareholders of Mitsubishi UFJFinancial Group . . . . . . . . . . . . . . . . . . . . . . . . . . . . . . . . . . . . . . . . ¥ 202,680 ¥ 1,228,160 ¥ 718,645
Earnings per common share applicable to common shareholdersof Mitsubishi UFJ Financial Group (Notes 19 and 23):
Basic earnings per common share—Earnings applicable to commonshareholders of Mitsubishi UFJ Financial Group . . . . . . . . . . . . . . . ¥ 14.93 ¥ 92.40 ¥ 55.03
Diluted earnings per common share—Earnings applicable to commonshareholders of Mitsubishi UFJ Financial Group . . . . . . . . . . . . . . . 14.68 92.10 54.74
Cash dividend per common share . . . . . . . . . . . . . . . . . . . . . . . . . . . . . 18.00 18.00 21.00Weighted average common shares outstanding . . . . . . . . . . . . . . . . . . . 13,574 13,292 13,059Weighted average diluted common shares outstanding . . . . . . . . . . . . . 13,585 13,293 13,059
Notes:(1) The following credit losses are included in Investment securities gains (losses)—net:
(in millions) 2017 2018 2019
Decline in fair value . . . . . . . . . . . . . . . . . . . . . . . . . . . . . . . . . . . . . . . . . . . . . . . . . . ¥ 706 ¥ 99 ¥ 596Other comprehensive income—net . . . . . . . . . . . . . . . . . . . . . . . . . . . . . . . . . . . . . . 35 15 10
Total credit losses . . . . . . . . . . . . . . . . . . . . . . . . . . . . . . . . . . . . . . . . . . . . . . . . ¥ 741 ¥ 114 ¥ 606
(2) New guidance on recognition and measurement of financial assets and financial liabilities requires equity investments to be measured atfair value with changes in fair value recognized in net income for the fiscal year ended March 31, 2019. For additional information, referto Note 1.
See the accompanying notes to Consolidated Financial Statements.
F-7

MITSUBISHI UFJ FINANCIAL GROUP, INC. AND SUBSIDIARIES
CONSOLIDATED STATEMENTS OF COMPREHENSIVE INCOMEFOR THE FISCAL YEARS ENDED MARCH 31, 2017, 2018 AND 2019
(in millions) 2017 2018 2019
Net income before attribution of noncontrolling interests . . . . . . ¥ 178,090 ¥ 1,253,996 ¥ 737,605Other comprehensive income (loss), net of tax (Note 20):
Net unrealized gains on investment securities(1) . . . . . . . . . . . . . 12,961 230,308 88,180Net debt valuation adjustments . . . . . . . . . . . . . . . . . . . . . . . . . . (8,552) (2,178) 9,729Net unrealized losses on derivatives qualifying for cash flow
hedges . . . . . . . . . . . . . . . . . . . . . . . . . . . . . . . . . . . . . . . . . . . (13,245) (7,025) (4,890)Defined benefit plans (Note 13) . . . . . . . . . . . . . . . . . . . . . . . . . 103,572 109,838 (88,940)Foreign currency translation adjustments . . . . . . . . . . . . . . . . . . (143,210) (104,778) (42,212)
Total . . . . . . . . . . . . . . . . . . . . . . . . . . . . . . . . . . . . . . . . . . (48,474) 226,165 (38,133)
Comprehensive income . . . . . . . . . . . . . . . . . . . . . . . . . . . . . . . . . . . 129,616 1,480,161 699,472Net income (loss) attributable to noncontrolling interests . . . . . (24,590) 25,836 18,960Other comprehensive income (loss) attributable to
noncontrolling interests . . . . . . . . . . . . . . . . . . . . . . . . . . . . . . (24,765) 1,320 21,209
Comprehensive income attributable to Mitsubishi UFJ FinancialGroup . . . . . . . . . . . . . . . . . . . . . . . . . . . . . . . . . . . . . . . . . . . . . . . ¥ 178,971 ¥ 1,453,005 ¥ 659,303
Note:(1) Included unrealized gains (losses) related to only debt securities for the fiscal year ended March 31, 2019.
See the accompanying notes to Consolidated Financial Statements.
F-8
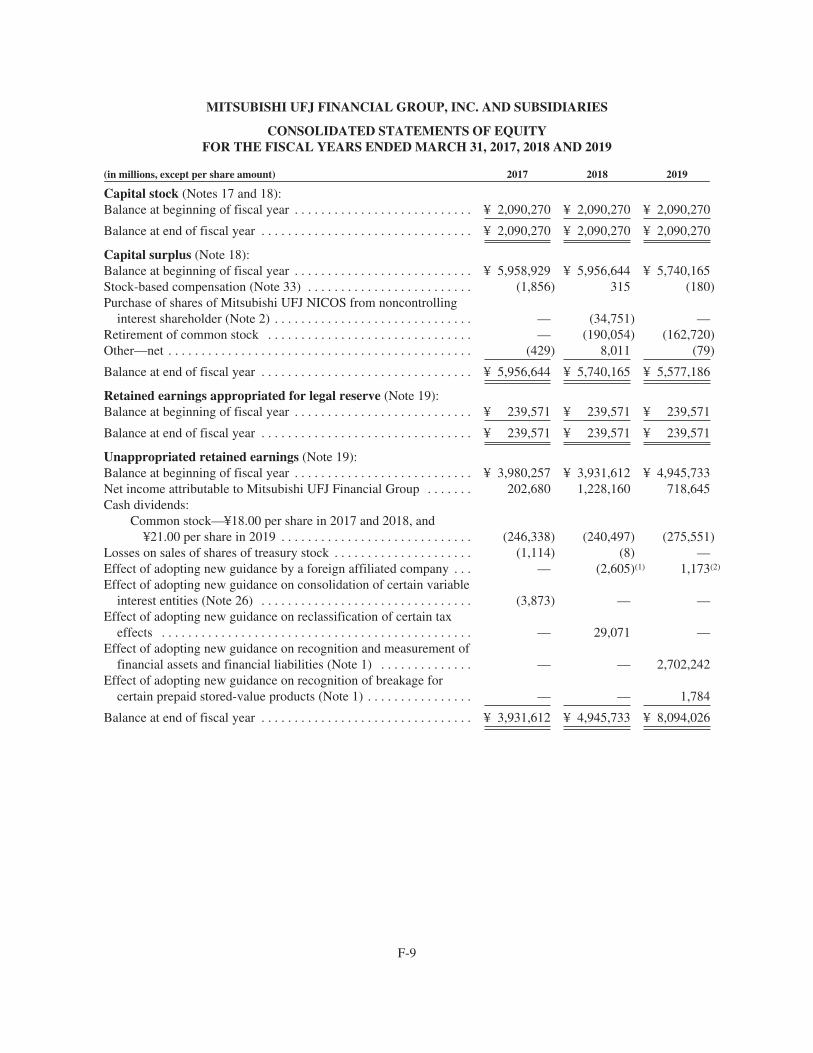
MITSUBISHI UFJ FINANCIAL GROUP, INC. AND SUBSIDIARIES
CONSOLIDATED STATEMENTS OF EQUITYFOR THE FISCAL YEARS ENDED MARCH 31, 2017, 2018 AND 2019
(in millions, except per share amount) 2017 2018 2019
Capital stock (Notes 17 and 18):Balance at beginning of fiscal year . . . . . . . . . . . . . . . . . . . . . . . . . . . ¥ 2,090,270 ¥ 2,090,270 ¥ 2,090,270
Balance at end of fiscal year . . . . . . . . . . . . . . . . . . . . . . . . . . . . . . . . ¥ 2,090,270 ¥ 2,090,270 ¥ 2,090,270
Capital surplus (Note 18):Balance at beginning of fiscal year . . . . . . . . . . . . . . . . . . . . . . . . . . . ¥ 5,958,929 ¥ 5,956,644 ¥ 5,740,165Stock-based compensation (Note 33) . . . . . . . . . . . . . . . . . . . . . . . . . (1,856) 315 (180)Purchase of shares of Mitsubishi UFJ NICOS from noncontrolling
interest shareholder (Note 2) . . . . . . . . . . . . . . . . . . . . . . . . . . . . . . — (34,751) —Retirement of common stock . . . . . . . . . . . . . . . . . . . . . . . . . . . . . . . — (190,054) (162,720)Other—net . . . . . . . . . . . . . . . . . . . . . . . . . . . . . . . . . . . . . . . . . . . . . . (429) 8,011 (79)
Balance at end of fiscal year . . . . . . . . . . . . . . . . . . . . . . . . . . . . . . . . ¥ 5,956,644 ¥ 5,740,165 ¥ 5,577,186
Retained earnings appropriated for legal reserve (Note 19):Balance at beginning of fiscal year . . . . . . . . . . . . . . . . . . . . . . . . . . . ¥ 239,571 ¥ 239,571 ¥ 239,571
Balance at end of fiscal year . . . . . . . . . . . . . . . . . . . . . . . . . . . . . . . . ¥ 239,571 ¥ 239,571 ¥ 239,571
Unappropriated retained earnings (Note 19):Balance at beginning of fiscal year . . . . . . . . . . . . . . . . . . . . . . . . . . . ¥ 3,980,257 ¥ 3,931,612 ¥ 4,945,733Net income attributable to Mitsubishi UFJ Financial Group . . . . . . . 202,680 1,228,160 718,645Cash dividends:
Common stock—¥18.00 per share in 2017 and 2018, and¥21.00 per share in 2019 . . . . . . . . . . . . . . . . . . . . . . . . . . . . . (246,338) (240,497) (275,551)
Losses on sales of shares of treasury stock . . . . . . . . . . . . . . . . . . . . . (1,114) (8) —Effect of adopting new guidance by a foreign affiliated company . . . — (2,605)(1) 1,173(2)
Effect of adopting new guidance on consolidation of certain variableinterest entities (Note 26) . . . . . . . . . . . . . . . . . . . . . . . . . . . . . . . . (3,873) — —
Effect of adopting new guidance on reclassification of certain taxeffects . . . . . . . . . . . . . . . . . . . . . . . . . . . . . . . . . . . . . . . . . . . . . . . — 29,071 —
Effect of adopting new guidance on recognition and measurement offinancial assets and financial liabilities (Note 1) . . . . . . . . . . . . . . — — 2,702,242
Effect of adopting new guidance on recognition of breakage forcertain prepaid stored-value products (Note 1) . . . . . . . . . . . . . . . . — — 1,784
Balance at end of fiscal year . . . . . . . . . . . . . . . . . . . . . . . . . . . . . . . . ¥ 3,931,612 ¥ 4,945,733 ¥ 8,094,026
F-9

MITSUBISHI UFJ FINANCIAL GROUP, INC. AND SUBSIDIARIES
CONSOLIDATED STATEMENTS OF EQUITY—(Continued)FOR THE FISCAL YEARS ENDED MARCH 31, 2017, 2018 AND 2019
(in millions) 2017 2018 2019
Accumulated other comprehensive income (loss), net of taxes:Balance at beginning of fiscal year . . . . . . . . . . . . . . . . . . . . . . . . . . . ¥ 2,301,259 ¥ 2,281,423 ¥ 2,477,315Net change during the fiscal year . . . . . . . . . . . . . . . . . . . . . . . . . . . . (23,709) 224,845 (59,342)Effect of adopting new guidance by a foreign affiliated company . . . — 118 —Effect of adopting new guidance on consolidation of certain variable
interest entities (Note 26) . . . . . . . . . . . . . . . . . . . . . . . . . . . . . . . . 3,873 — —Effect of adopting new guidance on reclassification of certain tax
effects . . . . . . . . . . . . . . . . . . . . . . . . . . . . . . . . . . . . . . . . . . . . . . . — (29,071) —Effect of adopting new guidance on recognition and measurement of
financial assets and financial liabilities (Note 1) . . . . . . . . . . . . . . — — (2,702,242)
Balance at end of fiscal year . . . . . . . . . . . . . . . . . . . . . . . . . . . . . . . . ¥ 2,281,423 ¥ 2,477,315 ¥ (284,269)
Treasury stock, at cost:Balance at beginning of fiscal year . . . . . . . . . . . . . . . . . . . . . . . . . . . ¥ (299,661) ¥ (513,988) ¥ (522,872)Purchases of shares of treasury stock (Note 18) . . . . . . . . . . . . . . . . . (217,803) (201,102) (161,043)Sales of shares of treasury stock . . . . . . . . . . . . . . . . . . . . . . . . . . . . . 3,491 2,098 3,775Retirement of common stock . . . . . . . . . . . . . . . . . . . . . . . . . . . . . . . — 190,054 162,720Net decrease (increase) resulting from changes in interests in
consolidated subsidiaries, consolidated variable interest entities,and affiliated companies . . . . . . . . . . . . . . . . . . . . . . . . . . . . . . . . . (15) 66 184
Balance at end of fiscal year . . . . . . . . . . . . . . . . . . . . . . . . . . . . . . . . ¥ (513,988) ¥ (522,872) ¥ (517,236)
Total Mitsubishi UFJ Financial Group shareholders’ equity . . . . ¥13,985,532 ¥14,970,182 ¥15,199,548
Noncontrolling interests:Balance at beginning of fiscal year . . . . . . . . . . . . . . . . . . . . . . . . . . . ¥ 577,642 ¥ 779,176 ¥ 675,633Initial subscriptions of noncontrolling interests . . . . . . . . . . . . . . . . . 112,644 48,828 108,235Transactions between the consolidated subsidiaries and the related
noncontrolling interest shareholders . . . . . . . . . . . . . . . . . . . . . . . . 113,878 (120,216) (2,830)Decrease in noncontrolling interests related to deconsolidation of
subsidiaries . . . . . . . . . . . . . . . . . . . . . . . . . . . . . . . . . . . . . . . . . . . (563,918) (22,556) (20,497)Decrease in noncontrolling interests related to disposition of
subsidiaries . . . . . . . . . . . . . . . . . . . . . . . . . . . . . . . . . . . . . . . . . . . (1,026) — —Purchase of shares of Mitsubishi UFJ NICOS from noncontrolling
interest shareholder (Note 2) . . . . . . . . . . . . . . . . . . . . . . . . . . . . . . — (15,390) —Net income (loss) attributable to noncontrolling interests . . . . . . . . . (24,590) 25,836 18,960Dividends paid to noncontrolling interests . . . . . . . . . . . . . . . . . . . . . (6,842) (21,675) (15,853)Other comprehensive income (loss), net of taxes . . . . . . . . . . . . . . . . (24,765) 1,320 21,209Effect of adopting new guidance on consolidation of certain variable
interest entities (Note 26) . . . . . . . . . . . . . . . . . . . . . . . . . . . . . . . . 595,982 — —Other—net . . . . . . . . . . . . . . . . . . . . . . . . . . . . . . . . . . . . . . . . . . . . . . 171 310 343
Balance at end of fiscal year . . . . . . . . . . . . . . . . . . . . . . . . . . . . . . . . ¥ 779,176 ¥ 675,633 ¥ 785,200
Total equity . . . . . . . . . . . . . . . . . . . . . . . . . . . . . . . . . . . . . . . . . . . . ¥14,764,708 ¥15,645,815 ¥15,984,748
Notes:(1) The effect mainly resulted from the adoption of new accounting guidance on “Targeted Improvements to Accounting for Hedging
Activities”. See Note 14 for more information.(2) The effect resulted from the adoption of new accounting guidance on “Leases”.
See the accompanying notes to Consolidated Financial Statements.
F-10

MITSUBISHI UFJ FINANCIAL GROUP, INC. AND SUBSIDIARIES
CONSOLIDATED STATEMENTS OF CASH FLOWSFOR THE FISCAL YEARS ENDED MARCH 31, 2017, 2018 AND 2019
(in millions) 2017(1) 2018(1) 2019Cash flows from operating activities:
Net income before attribution of noncontrolling interests . . . . . . . . . . . . . . . . . . . . . . . . . ¥ 178,090 ¥ 1,253,996 ¥ 737,605Adjustments to reconcile net income before attribution of noncontrolling interests to net
cash provided by operating activities:Depreciation and amortization (Notes 5 and 6) . . . . . . . . . . . . . . . . . . . . . . . . . . . . . 327,716 330,556 333,950Impairment of goodwill (Note 6) . . . . . . . . . . . . . . . . . . . . . . . . . . . . . . . . . . . . . . . . 6,638 — —Impairment of intangible assets (Note 6) . . . . . . . . . . . . . . . . . . . . . . . . . . . . . . . . . . 5,803 21,900 118,108Provision for (reversal of) credit losses (Note 4) . . . . . . . . . . . . . . . . . . . . . . . . . . . . 253,688 (240,847) 34,330Employee benefit cost (income) for severance indemnities and pension plans
(Note 13) . . . . . . . . . . . . . . . . . . . . . . . . . . . . . . . . . . . . . . . . . . . . . . . . . . . . . . . . 20,274 (7,955) (19,839)Investment securities (gains) losses—net . . . . . . . . . . . . . . . . . . . . . . . . . . . . . . . . . (281,158) (286,903) 252,307Amortization of premiums on investment securities . . . . . . . . . . . . . . . . . . . . . . . . . 95,091 118,863 78,509Changes in financial instruments measured at fair value under fair value option,
excluding trading account securities—net (Note 32) . . . . . . . . . . . . . . . . . . . . . . . 103,845 (13,456) 13,880Foreign exchange (gains) losses—net . . . . . . . . . . . . . . . . . . . . . . . . . . . . . . . . . . . . (136,976) (208,398) 565,304Equity in earnings of equity method investees—net . . . . . . . . . . . . . . . . . . . . . . . . . (197,821) (227,984) (209,732)Provision (benefit) for deferred income tax expense . . . . . . . . . . . . . . . . . . . . . . . . . (212,368) 120,595 (47,796)Decrease (increase) in trading account assets, excluding foreign exchange contracts . . 42,609 5,653,904 (2,695,035)Increase (decrease) in trading account liabilities, excluding foreign exchange
contracts . . . . . . . . . . . . . . . . . . . . . . . . . . . . . . . . . . . . . . . . . . . . . . . . . . . . . . . . . 521,093 (6,433,948) 1,370,846Decrease in unearned income, unamortized premiums and deferred loan fees . . . . . (20,476) (35,857) (7,054)Decrease (increase) in accrued interest receivable and other receivables . . . . . . . . . 49,783 (172,599) (135,656)Increase in accrued interest payable and other payables . . . . . . . . . . . . . . . . . . . . . . 66,419 153,365 92,334Net increase (decrease) in accrued income taxes and decrease (increase) in income
tax receivables . . . . . . . . . . . . . . . . . . . . . . . . . . . . . . . . . . . . . . . . . . . . . . . . . . . . (81,083) 1,212 (136,047)Increase (decrease) in allowance for repayment of excess interest . . . . . . . . . . . . . . (7,790) (15,658) 1,258Net decrease (increase) in collateral for derivative transactions . . . . . . . . . . . . . . . . (276,476) 259,287 (79,338)Increase in cash collateral for the use of Bank of Japan’s settlement
infrastructure . . . . . . . . . . . . . . . . . . . . . . . . . . . . . . . . . . . . . . . . . . . . . . . . . . . . . (207,498) (643,568) (60,462)Other—net . . . . . . . . . . . . . . . . . . . . . . . . . . . . . . . . . . . . . . . . . . . . . . . . . . . . . . . . . 441,026 (190,341) 20,862
Net cash provided by (used in) operating activities . . . . . . . . . . . . . . . . . . . . . . 690,429 (563,836) 228,334
Cash flows from investing activities:Proceeds from sales of Available-for-sale debt securities (including proceeds from
debt securities under the fair value option) (Note 3) . . . . . . . . . . . . . . . . . . . . . . . 37,348,721 30,995,426 31,283,601Proceeds from maturities of Available-for-sale debt securities (including proceeds
from debt securities under the fair value option) (Note 3) . . . . . . . . . . . . . . . . . . . 26,684,497 40,011,298 26,448,801Purchases of Available-for-sale debt securities (including purchases of debt
securities under the fair value option) (Note 3) . . . . . . . . . . . . . . . . . . . . . . . . . . . (54,588,932) (71,593,326) (62,309,072)Proceeds from maturities of Held-to-maturity debt securities . . . . . . . . . . . . . . . . . . 810,838 1,085,603 560,646Purchases of Held-to-maturity debt securities . . . . . . . . . . . . . . . . . . . . . . . . . . . . . . (632,116) (1,156,122) (1,192,989)Proceeds from sales and redemption of Equity securities (including proceeds from
equity securities under the fair value option) . . . . . . . . . . . . . . . . . . . . . . . . . . . . . 1,768,580 2,377,333 2,722,948Purchases of Equity securities (including purchases of equity securities under the
fair value option) . . . . . . . . . . . . . . . . . . . . . . . . . . . . . . . . . . . . . . . . . . . . . . . . . . (1,727,841) (2,197,171) (2,770,356)Acquisition of MUFG Capital Analytics LLC (formerly Capital Analytics II LLC),
a subsidiary of TB, net of cash acquired (Note 2) . . . . . . . . . . . . . . . . . . . . . . . . . (4,154) — —Purchase of common stock and preferred stock investment in Security Bank
Corporation, an equity method investee of BK (Note 2) . . . . . . . . . . . . . . . . . . . . (91,993) — —Acquisition of MUFG Investor Services (US) (formerly Rydex Fund Services,
LLC), a subsidiary of TB, net of cash acquired (Note 2) . . . . . . . . . . . . . . . . . . . . (17,175) — —Purchase of common stock in Hitachi Capital Corporation, an equity method
investee of MUFG (Note 2) . . . . . . . . . . . . . . . . . . . . . . . . . . . . . . . . . . . . . . . . . . (91,877) — —Acquisition of Hattha Kaksekar Limited, a subsidiary of Krungsri, net of cash
acquired (Note 2) . . . . . . . . . . . . . . . . . . . . . . . . . . . . . . . . . . . . . . . . . . . . . . . . . . (556) — —Purchase of common stock in Bank Danamon, an equity method investee of BK
(Note 2) . . . . . . . . . . . . . . . . . . . . . . . . . . . . . . . . . . . . . . . . . . . . . . . . . . . . . . . . . — — (132,335)Net decrease (increase) in loans . . . . . . . . . . . . . . . . . . . . . . . . . . . . . . . . . . . . . . . . . 2,514,824 (169,478) 330,198Net decrease (increase) in call loans, funds sold, and receivables under resale
agreements and securities borrowing transactions . . . . . . . . . . . . . . . . . . . . . . . . . (6,971,016) 4,187,093 627,327Proceeds from sales of premises and equipment . . . . . . . . . . . . . . . . . . . . . . . . . . . . 32,512 12,211 26,191Capital expenditures for premises and equipment . . . . . . . . . . . . . . . . . . . . . . . . . . . (116,786) (159,003) (126,479)Purchases of intangible assets . . . . . . . . . . . . . . . . . . . . . . . . . . . . . . . . . . . . . . . . . . (237,253) (239,755) (276,880)Proceeds from sales and dispositions of investments in equity method investees . . . 66,729 39,710 161,566Proceeds from sales of consolidated VIEs and subsidiaries—net . . . . . . . . . . . . . . . 244,476 122,962 64,395Other—net . . . . . . . . . . . . . . . . . . . . . . . . . . . . . . . . . . . . . . . . . . . . . . . . . . . . . . . . . (151,078) (72,765) (49,590)
Net cash provided by (used in) investing activities . . . . . . . . . . . . . . . . . . . . . . 4,840,400 3,244,016 (4,632,028)
F-11

MITSUBISHI UFJ FINANCIAL GROUP, INC. AND SUBSIDIARIES
CONSOLIDATED STATEMENTS OF CASH FLOWS—(Continued)FOR THE FISCAL YEARS ENDED MARCH 31, 2017, 2018 AND 2019
(in millions) 2017(1) 2018(1) 2019
Cash flows from financing activities:Net increase in deposits . . . . . . . . . . . . . . . . . . . . . . . . . . . . . . . . . . . . . . . . . . . . . . . . . . . 10,902,923 5,720,011 3,602,674Net increase (decrease) in call money, funds purchased, and payables under repurchase
agreements and securities lending transactions . . . . . . . . . . . . . . . . . . . . . . . . . . . . . . . (2,790,342) 3,963,120 (303,042)Net increase (decrease) in due to trust account . . . . . . . . . . . . . . . . . . . . . . . . . . . . . . . . . (3,002,999) 51,003 (650,206)Net decrease in other short-term borrowings . . . . . . . . . . . . . . . . . . . . . . . . . . . . . . . . . . . (1,221,838) (957,705) (118,443)Proceeds from issuance of long-term debt . . . . . . . . . . . . . . . . . . . . . . . . . . . . . . . . . . . . . 12,265,629 6,671,031 5,020,636Repayments of long-term debt . . . . . . . . . . . . . . . . . . . . . . . . . . . . . . . . . . . . . . . . . . . . . . (6,641,722) (5,485,894) (4,236,887)Proceeds from sales of treasury stock . . . . . . . . . . . . . . . . . . . . . . . . . . . . . . . . . . . . . . . . 256 1,316 2,322Payments for acquisition of treasury stock (Note 18) . . . . . . . . . . . . . . . . . . . . . . . . . . . . (217,803) (201,102) (159,962)Payments for acquisition of shares of certain subsidiaries from noncontrolling interest
shareholders . . . . . . . . . . . . . . . . . . . . . . . . . . . . . . . . . . . . . . . . . . . . . . . . . . . . . . . . . . (1,612) (318) —Payments for acquisition of shares of Mitsubishi UFJ NICOS from noncontrolling
interest shareholders (Note 2) . . . . . . . . . . . . . . . . . . . . . . . . . . . . . . . . . . . . . . . . . . . . — (50,000) —Dividends paid . . . . . . . . . . . . . . . . . . . . . . . . . . . . . . . . . . . . . . . . . . . . . . . . . . . . . . . . . . (246,345) (240,514) (275,581)Dividends paid by subsidiaries to noncontrolling interests . . . . . . . . . . . . . . . . . . . . . . . . (6,842) (21,675) (15,853)Other—net . . . . . . . . . . . . . . . . . . . . . . . . . . . . . . . . . . . . . . . . . . . . . . . . . . . . . . . . . . . . . 105,995 (87,067) 197,673
Net cash provided by financing activities . . . . . . . . . . . . . . . . . . . . . . . . . . . . . . . . . 9,145,300 9,362,206 3,063,331
Effect of exchange rate changes on cash and cash equivalents . . . . . . . . . . . . . . . . . . . . . . (334,793) (188,149) 43,975
Net increase in cash and cash equivalents . . . . . . . . . . . . . . . . . . . . . . . . . . . . . . . . . . . . . . . 14,341,336 11,854,237 (1,296,388)
Cash and cash equivalents at beginning of fiscal year . . . . . . . . . . . . . . . . . . . . . . . . . . . . . 49,677,883 64,019,219 75,873,456Cash and cash equivalents:
Cash, due from banks and interest-earning deposits in other banks . . . . . . . . . . . . . . . . . 64,009,770 75,858,049 74,571,260Restricted cash included in other assets . . . . . . . . . . . . . . . . . . . . . . . . . . . . . . . . . . . . . . . 9,449 15,407 5,808
Cash and cash equivalents at end of fiscal year . . . . . . . . . . . . . . . . . . . . . . . . . . . . . . . . . . ¥ 64,019,219 ¥ 75,873,456 ¥ 74,577,068
Supplemental disclosure of cash flow information:Cash paid during the fiscal year for:Interest . . . . . . . . . . . . . . . . . . . . . . . . . . . . . . . . . . . . . . . . . . . . . . . . . . . . . . . . . . . . . . . . . . . . ¥ 779,239 ¥ 1,040,337 ¥ 1,488,136Income taxes, net of refunds . . . . . . . . . . . . . . . . . . . . . . . . . . . . . . . . . . . . . . . . . . . . . . . . . . . 373,887 265,225 302,019Non-cash investing and financing activities:Assets acquired under capital lease arrangements . . . . . . . . . . . . . . . . . . . . . . . . . . . . . . . . . . . 7,065 7,111 11,280Adoption of new guidance on consolidation of certain variable interest entities (Note 26):
Increase in total assets, excluding cash and cash equivalents . . . . . . . . . . . . . . . . . . . . . . 598,236 — —Increase in total liabilities . . . . . . . . . . . . . . . . . . . . . . . . . . . . . . . . . . . . . . . . . . . . . . . . . 32,254 — —Increase in noncontrolling interests . . . . . . . . . . . . . . . . . . . . . . . . . . . . . . . . . . . . . . . . . . 595,982 — —
Acquisition of MUFG Capital Analytics LLC, a subsidiary of TB (Note 2):Fair value of assets acquired, excluding cash and cash equivalents . . . . . . . . . . . . . . . . . 5,038 — —Fair value of liabilities assumed . . . . . . . . . . . . . . . . . . . . . . . . . . . . . . . . . . . . . . . . . . . . . 884 — —
Acquisition of MUFG Investor Services (US), LLC, a subsidiary of TB (Note 2):Fair value of assets acquired, excluding cash and cash equivalents . . . . . . . . . . . . . . . . . 17,847 — —Fair value of liabilities assumed . . . . . . . . . . . . . . . . . . . . . . . . . . . . . . . . . . . . . . . . . . . . . 672 — —
Acquisition of Hattha Kaksekar Limited, a subsidiary of Krungsri (Note 2):Fair value of assets acquired, excluding cash and cash equivalents . . . . . . . . . . . . . . . . . 54,186 — —Fair value of liabilities assumed . . . . . . . . . . . . . . . . . . . . . . . . . . . . . . . . . . . . . . . . . . . . . 53,630 — —
Marketable Equity Securities issued by Bank Danamon transferred to investments insubsidiaries and affiliates (Note 2) . . . . . . . . . . . . . . . . . . . . . . . . . . . . . . . . . . . . . . . . . . . . . — — 98,934
Available-for-sale debt securities transferred to Held-to-maturity debt securities . . . . . . . . . . — — 221,537
Note:(1) The reclassification of certain items on the consolidated balance sheets resulted in reclassification of the consolidated statements of cash
flows for the fiscal years ended March 31, 2017 and 2018, respectively. See Note 1 Reclassifications for further information.
See the accompanying notes to Consolidated Financial Statements.
F-12
MITSUBISHI UFJ FINANCIAL GROUP, INC. AND SUBSIDIARIES
NOTES TO CONSOLIDATED FINANCIAL STATEMENTS
1. BASIS OF FINANCIAL STATEMENTS AND SUMMARY OF SIGNIFICANT ACCOUNTINGPOLICIES
Description of Business
Mitsubishi UFJ Financial Group, Inc. (“MUFG”) is a holding company for MUFG Bank, Ltd. (formerly,The Bank of Tokyo-Mitsubishi UFJ, Ltd., “MUFG Bank” or “BK”), Mitsubishi UFJ Trust and BankingCorporation (“Mitsubishi UFJ Trust and Banking” or “TB”), Mitsubishi UFJ Securities Holdings Co., Ltd.(“Mitsubishi UFJ Securities Holdings” or “SCHD”), Mitsubishi UFJ NICOS Co., Ltd. (“Mitsubishi UFJNICOS”), and other subsidiaries. Mitsubishi UFJ Securities Holdings is an intermediate holding company forMitsubishi UFJ Morgan Stanley Securities Co., Ltd. (“Mitsubishi UFJ Morgan Stanley Securities”). Through itssubsidiaries and affiliated companies, MUFG engages in a broad range of financial operations, includingcommercial banking, investment banking, trust banking and asset management services, securities businesses,and credit card businesses, and it provides related services to individual and corporate customers. See Note 30 formore information by business segment.
Basis of Financial Statements
The accompanying consolidated financial statements are presented in Japanese yen, the currency of thecountry in which MUFG is incorporated and principally operates. The accompanying consolidated financialstatements have been prepared on the basis of accounting principles generally accepted in the United States ofAmerica (“U.S. GAAP”). In certain respects, the accompanying consolidated financial statements reflectadjustments which are not included in the consolidated financial statements issued by MUFG and certain of itssubsidiaries in accordance with applicable statutory requirements and accounting practices in their respectivecountries of incorporation. The major adjustments include those relating to (1) investment securities,(2) derivative financial instruments, (3) allowance for credit losses, (4) income taxes, (5) consolidation,(6) premises and equipment, (7) transfer of financial assets, (8) accrued severance indemnities and pensionliabilities, (9) goodwill and other intangible assets and (10) lease transactions.
Fiscal years of certain subsidiaries, which end on December 31, and MUFG’s fiscal year, which ends onMarch 31, have been treated as coterminous. For the fiscal years ended March 31, 2017, 2018 and 2019, theeffect of recording intervening events for the three-month periods ended March 31 on MUFG’s proportionateequity in net income of subsidiaries with fiscal years ended on December 31, would have resulted in an increaseof ¥10.22 billion, a decrease of ¥10.76 billion, and an increase of ¥19.97 billion to net income attributable toMitsubishi UFJ Financial Group, respectively. No intervening events occurred during each of the three-monthperiods ended March 31, 2017, 2018 and 2019 which, if recorded, would have had material effects onconsolidated total assets, loans, total liabilities, deposits or total equity as of March 31, 2017, 2018 and 2019.
Use of Estimates
The preparation of consolidated financial statements in conformity with U.S. GAAP requires managementto make estimates and assumptions that affect the reported amounts of assets and liabilities and disclosures ofcontingent assets and liabilities at the date of the consolidated financial statements and the reported amounts ofrevenues and expenses during the reporting period. Actual results could differ from those estimates. Materialestimates that are particularly susceptible to management judgment primarily relate to the allowance for creditlosses, the valuation of deferred tax assets, the valuation of financial instruments, the accounting for goodwilland intangible assets, impairment of investment securities, the allowances for repayment of excess interest andaccrued severance indemnities and pension liabilities.
F-13

MITSUBISHI UFJ FINANCIAL GROUP, INC. AND SUBSIDIARIES
NOTES TO CONSOLIDATED FINANCIAL STATEMENTS—(Continued)
Summary of Significant Accounting Policies
Significant accounting policies applied in the accompanying consolidated financial statements aresummarized below:
Consolidation—The accompanying consolidated financial statements include the accounts of MUFG, itssubsidiaries and certain variable interest entities (“VIE”s) (together, the “MUFG Group”). In situations in whichthe MUFG Group has a controlling financial interest in other entities, including certain VIEs, such entities areconsolidated and noncontrolling interests, if any, are recorded in Total equity. Intercompany transactions andbalances have been eliminated. Investments in affiliated companies (companies over which the MUFG Group hasthe ability to exercise significant influence) are accounted for by the equity method of accounting and arereported in Other assets. The MUFG Group’s equity interest in the earnings of these equity investees and other-than-temporary impairment (“OTTI”) are reported in Equity in earnings of equity method investees-net. TheMUFG Group recognizes an impairment loss on investments in equity method investees that is other-than-temporary. The MUFG Group determines whether loss on investments is other-than-temporary, throughconsideration of various factors, such as inability to recover the carrying amount of the investment, the inabilityof the investee to sustain an earnings capacity that would justify the carrying amount of the investment, thelength of time and the extent to which the fair value has been less than cost, the financial condition and near-termprospects of the investees, and the intent and ability to retain its investment in the investees for a period of timesufficient to allow for any anticipated recovery in the fair value. The MUFG Group also evaluates additionalfactors, such as the condition and trend of the economic cycle, and trends in the general market.
The MUFG Group consolidates VIEs if it has the power to direct the activities of a VIE which mostsignificantly impact the VIE’s economic performance and has the obligation to absorb losses or the right toreceive benefits that could potentially be significant to the VIE. To assess whether a VIE should be consolidatedor not, the MUFG Group considers all factors, such as the purpose and design of the VIE, contractualarrangements, and the MUFG Group’s involvement in both the establishment of the VIE and day-to-dayactivities of the VIE. The MUFG Group considers a right to make the most significant decisions affecting a VIEto determine whether it is deemed to have the power to direct the activities of the VIE. Furthermore, the MUFGGroup considers its economic interests in the VIE, including investments in debt or equity instruments issued bythe VIE, liquidity and credit enhancement, and guarantees to determine whether such interests are potentiallysignificant to the VIE or not.
Assets that the MUFG Group holds in an agency, fiduciary or trust capacity are not assets of the MUFGGroup and, accordingly, are not included in the accompanying consolidated balance sheets.
Cash Flows—For the purposes of reporting cash flows, cash and cash equivalents consist of Cash and duefrom banks, Interest-earning deposits in other banks, and certain restricted cash included in Other assets.Restricted cash included in cash and cash equivalents represents cash or deposits subject to withdrawal or usagerestrictions, and mainly consist of reserves on deposits with the Bank of Japan and similar reserves required forforeign offices and subsidiaries engaged in banking businesses in foreign countries. Cash flows from qualifiedhedging activities are classified in the same category as the items being hedged.
Translation of Foreign Currency Financial Statements and Foreign Currency Transactions—Financialstatements of overseas entities are translated into Japanese yen using the respective fiscal year-end exchangerates for assets and liabilities. Income and expense items are translated at average rates of exchange for therespective fiscal years.
Foreign currency translation gains and losses related to the financial statements of overseas entities of theMUFG Group, net of related income tax effects, are credited or charged directly to Foreign currency translation
F-14
MITSUBISHI UFJ FINANCIAL GROUP, INC. AND SUBSIDIARIES
NOTES TO CONSOLIDATED FINANCIAL STATEMENTS—(Continued)
adjustments, a component of Accumulated other comprehensive income (“Accumulated OCI”). Tax effects ofgains and losses on foreign currency translation of the financial statements of overseas entities are not recognizedunless it is apparent that the temporary differences will reverse in the foreseeable future.
Foreign currency-denominated assets and liabilities are translated into the functional currencies of theindividual entities included in consolidation at the respective fiscal year-end foreign exchange rates. Foreigncurrency-denominated income and expenses are translated using average rates of exchange for the respectivefiscal years. Gains and losses from such translation are included in Foreign exchange gains (losses)—net, asappropriate.
Repurchase Agreements, Securities Lending and Other Secured Financing Transactions—Securities soldwith agreements to repurchase (“repurchase agreements”), securities purchased with agreements to resell (“resaleagreements”) and securities lending and borrowing transactions are accounted for as secured financing or lendingtransactions, if the transferor has not surrendered control over the securities. Repurchase agreements and resaleagreements are generally carried at the amounts at which the securities will be subsequently sold or repurchased,and securities lending and borrowing transactions are generally carried at the amount of cash collateral advancedor received. If they meet the relevant conditions for the surrender of control, they are accounted for as sales ofsecurities with related off-balance sheet forward repurchase commitments or purchases of securities with relatedoff-balance sheet forward resale commitments. For the fiscal years ended March 31, 2017, 2018 and 2019, therewere no such transactions accounted for as sales or purchases.
Collateral—For secured lending transactions, including resale agreements, securities borrowingtransactions, commercial lending and derivative transactions, the MUFG Group, as a secured party, generally hasthe right to require the counterparties to provide collateral, including letters of credit, cash, securities and otherfinancial assets. For most secured lending transactions, the MUFG Group maintains strict levels ofcollateralization governed by a daily mark-to-market analysis. Financial assets pledged as collateral are generallynegotiable financial instruments and are permitted to be sold or repledged by secured parties. If theMUFG Group sells these financial assets received as collateral, it recognizes the proceeds from the sale and itsobligation to return the collateral. For secured borrowing transactions, principally repurchase agreements andsecurities lending transactions and derivative transactions, where the secured party has the right to sell orrepledge financial assets pledged as collateral, the MUFG Group separately discloses those financial assetspledged as collateral in the accompanying consolidated balance sheets.
Trading Account Securities—Securities and money market instruments held in anticipation of short-termmarket movements and for resale to customers are included in Trading account assets, and short trading positionsof these instruments are included in Trading account liabilities. Trading positions are carried at fair value in theaccompanying consolidated balance sheets and recorded on a trade date basis. Changes in the fair value oftrading positions are recognized in Trading account profits (losses). The MUFG Group has elected the fair valueoption for certain foreign securities. See Note 32 for a further discussion of fair value option.
Investment Securities—Debt securities for which the MUFG Group has both the ability and positive intent tohold to maturity are classified as Held-to-maturity debt securities and are carried at amortized cost. Debtsecurities that the MUFG Group may not hold to maturity other than those classified as Trading accountsecurities, are classified as Available-for-sale debt securities, and are carried at their fair values, with unrealizedgains and losses reported on a net-of-tax basis within Accumulated OCI, net of taxes, which is a component ofequity. For debt securities, an OTTI is recognized in earnings for a security if the MUFG Group has intent to sellsuch a debt security or if it is more likely than not the MUFG Group will be required to sell such a debt securitybefore recovery of its amortized cost basis. If not, the credit component of an OTTI is recognized in earnings, but
F-15
MITSUBISHI UFJ FINANCIAL GROUP, INC. AND SUBSIDIARIES
NOTES TO CONSOLIDATED FINANCIAL STATEMENTS—(Continued)
the noncredit component is recognized in Accumulated OCI. In determining other-than-temporary declines in fairvalue to be recognized as an impairment loss on debt securities, the MUFG Group generally considers factorssuch as the ability and positive intent to hold the investments for a period of time sufficient to allow foranticipated recovery in fair value, the financial condition of the issuer, the extent of decline in fair value, and thelength of time that the decline in fair value below cost has existed.
Equity securities include marketable equity investment securities and nonmarketable equity investmentsecurities. Marketable equity investment securities are measured at fair value with unrealized gains or lossesreflected in net income. Nonmarketable equity investment securities are primarily measured at cost minusimpairment, if any, plus or minus changes resulting from observable price changes. Nonmarketable equityinvestment securities held by subsidiaries that are investment companies or brokers and dealers, are subject to thespecialized industry accounting principles for investment companies and brokers and dealers. Securities of thosesubsidiaries are carried at their fair values.
Interest and dividends on investment securities are reported in Interest income. Dividends are recognizedwhen the shareholder right to receive the dividend is established. Gains and losses on disposition of investmentsecurities are computed using the average cost method and are recognized on the trade date.
Derivative Financial Instruments—The MUFG Group engages in derivative activities involving swaps,forwards, futures, options, and other types of derivative contracts. Derivatives are used in trading activities togenerate trading revenues and fee income for its own account and to respond to customers’ financial needs.Derivatives are also used to manage counterparty credit risk and market risk exposures to fluctuations in interestand foreign exchange rates, equity and commodity prices.
Derivatives entered into for trading purposes are carried at fair value and are reported as Trading accountassets or Trading account liabilities, as appropriate. The fair values of derivative contracts executed with thesame counterparty under legally enforceable master netting agreements are presented on a gross basis. Changesin the fair value of such contracts are recognized currently in Foreign exchange gains (losses)—net with respectto foreign exchange contracts and in Trading account profits (losses)—net with respect to interest rate contractsand other types of contracts.
Embedded features that are not clearly and closely related to the host contracts and meet the definition ofderivatives are separated from the host contracts and measured at fair value unless the contracts embedding thederivatives are measured at fair value in their entirety.
Derivatives are also used to manage exposures to fluctuations in interest and foreign exchange rates arisingfrom mismatches of asset and liability positions. Certain of those derivatives are designated as hedginginstruments and qualify for hedge accounting. The MUFG Group designates a derivative as a hedging instrumentat the inception of each such hedge relationship, and it documents, for such individual hedging relationships, therisk management objective and strategy, including the item being hedged, the specific risk being hedged and themethod used to assess the hedge effectiveness. In order for a hedging relationship to qualify for hedgeaccounting, the changes in the fair value of the derivative instruments must be highly effective in achievingoffsetting changes in fair values or variable cash flows of the hedged items attributable to the risk being hedged.Any ineffectiveness, which arises during the hedging relationship, is recognized in Non-interest income orexpense in the period in which it arises. All qualifying hedging derivatives are valued at fair value and includedin Other assets or Other liabilities, as appropriate. For cash flow hedges, the unrealized changes in fair value tothe extent effective are recognized in Accumulated OCI. Amounts realized on cash flow hedges related tovariable rate loans are recognized in Net interest income in the period when the cash flow from the hedged item
F-16
MITSUBISHI UFJ FINANCIAL GROUP, INC. AND SUBSIDIARIES
NOTES TO CONSOLIDATED FINANCIAL STATEMENTS—(Continued)
is realized. The fair value of cash flow hedges related to forecasted transactions, if any, is recognized inNon-interest income or expense in the period when the forecasted transaction occurs. Any difference that arisesfrom gains or losses on hedging derivatives offsetting corresponding gains or losses on the hedged items, andgains and losses on derivatives attributable to the risks excluded from the assessment of hedge effectiveness arerecognized in Non-interest income or expense.
Loans—Loans originated by the MUFG Group (“originated loans”) are carried at the principal amountoutstanding, adjusted for unearned income and deferred net nonrefundable loan fees and costs. Originated loansheld and intended for dispositions or sale in secondary markets are transferred to the held-for-sale classificationand carried at the lower of cost or estimated fair value generally on an individual loan basis. Loan originationfees, net of certain direct origination costs, are deferred and recognized over the contractual life of the loan as anadjustment to yield using a method that approximates the interest method. Interest income on loans that are notimpaired is accrued and credited to interest income as it is earned. Unearned income and discounts or premiumson purchased loans are deferred and recognized over the remaining contractual terms of the loans using a methodthat approximates the interest method when such purchased loans are outside the scope of the guidance on loansand debt securities acquired with deteriorated credit quality as described below.
The MUFG Group classifies its loan portfolio into the following portfolio segments—Commercial,Residential, Card, MUFG Americas Holdings Corporation (“MUFG Americas Holdings ” or “MUAH”), andBank of Ayudhya Public Company Limited (“Krungsri”) based on the grouping used by the MUFG Group todetermine the allowance for credit losses. The MUFG Group further classifies the Commercial segment intoclasses based on initial measurement attributes, risk characteristics, and its method of monitoring and assessingcredit risk.
Originated loans are considered impaired when, based on current information and events, it is probable thatthe MUFG Group will be unable to collect all the scheduled payments of principal or interest when dueaccording to the contractual terms of the loan agreement. Past due status is determined based on the contractualterms of the loan and the actual number of days since the last payment date, and is considered in determiningimpairment. Originated loans that experience insignificant payment delays and payment shortfalls generally arenot classified as impaired. Management determines the significance of payment delays and payment shortfalls ona case-by-case basis, taking into consideration all of the circumstances surrounding the loan and the borrower,including the length of the delay, the reasons for the delay, the borrower’s prior payment record, and the amountof the shortfall in relation to the principal and interest owed. Impairment is generally evaluated on a loan-by-loanbasis by either the present value of expected future cash flows discounted at the loan’s effective interest rate, theloan’s observable market price, or the fair value of the collateral if the loan is collateral dependent.
Originated loans are generally placed on nonaccrual status when substantial doubt exists as to the full andtimely collection of either principal or interest, specifically when principal or interest is contractually past dueone month or more with respect to loans within all classes of the Commercial segment, three months or morewith respect to loans within the Card, MUFG Americas Holdings, and Krungsri segments, and six months ormore with respect to loans within the Residential segment. A nonaccrual loan may be restored to an accrualstatus when interest and principal payments become current and management expects that the borrower willmake future contractual payments as scheduled. When a loan is placed on nonaccrual status, interest accrued butnot received is generally reversed against interest income. Cash receipts on nonaccrual loans, for which theultimate collectibility of principal is uncertain, are applied as principal reductions; otherwise, such collections arecredited to income.
The MUFG Group modifies certain loans in conjunction with its loss-mitigation activities. Through thesemodifications, concessions are granted to a borrower who is experiencing financial difficulty, generally in order
F-17
MITSUBISHI UFJ FINANCIAL GROUP, INC. AND SUBSIDIARIES
NOTES TO CONSOLIDATED FINANCIAL STATEMENTS—(Continued)
to minimize economic loss, to avoid foreclosure or repossession of collateral, and to ultimately maximizepayments received from the borrower. The concessions granted vary by portfolio segment, by program, and byborrower-specific characteristics, and may include interest rate reductions, term extensions, payment deferrals,and partial principal forgiveness. Loan modifications that represent concessions made to borrowers who areexperiencing financial difficulties are identified as troubled debt restructurings (“TDRs”).
Generally, accruing loans that are modified in a TDR remain as accruing loans subsequent to themodification, and nonaccrual loans remain as nonaccrual. However, if a nonaccrual loan has been modified as aTDR, the borrower is not delinquent under the modified terms, and demonstrates that its financial condition hasimproved, the MUFG Group may reclassify the loan to accrual status. This determination is generally performedat least once a year through a detailed internal credit rating review process. Once a nonaccrual loan is deemed tobe a TDR, the MUFG Group will continue to designate the loan as a TDR even if the loan is reclassified toaccrual status.
A loan that has been modified into a TDR is considered to be impaired until it matures, is repaid, or isotherwise liquidated, regardless of whether the borrower performs under the modified terms. Because loansmodified in TDRs are considered to be impaired, these loans are measured for impairment using the MUFGGroup’s established asset-specific allowance methodology, which considers the expected default rates for themodified loans. See “Allowance for Credit Losses” for a discussion for each portfolio segment.
In accordance with the guidance on loans and debt securities acquired with deteriorated credit quality,impaired loans acquired for which it is probable that the MUFG Group will be unable to collect all contractualreceivables are initially recorded at the present value of amounts expected to be received. For these impairedloans, the related valuation allowances are not carried over or created initially. Accretable yield is limited to theexcess of the investor’s estimate of undiscounted cash flows over the investor’s initial investment in the loan.Subsequent increases in cash flows expected to be collected are recognized prospectively through adjustment ofthe loan’s yield over its remaining life after reduction of any remaining allowance for credit losses for the loanestablished after its acquisition, if any, while any decrease in such cash flows below those initially expected atacquisition plus additional cash flows expected to be collected arising from changes in estimate after acquisitionis recognized as an impairment.
Loan Securitization—The MUFG Group securitizes and services commercial, industrial, and residentialloans in the normal course of business. The MUFG Group accounts for a transfer of loans in a securitizationtransaction as a sale if it meets relevant conditions for the surrender of control. Otherwise, the transfer isaccounted for as a collateralized borrowing transaction. When a securitization is accounted for as a sale, theproceeds from a sale of financial assets consist of the cash and any other assets obtained, including beneficialinterests and separately recognized servicing assets, in the transfer less any liabilities incurred, includingseparately recognized servicing liabilities. All proceeds and reductions of proceeds from a sale shall be initiallymeasured at fair value.
Allowance for Credit Losses—The MUFG Group maintains an allowance for credit losses to absorbprobable losses inherent in the loan portfolio. Actual credit losses (amounts deemed uncollectible, in whole or inpart), net of recoveries, are generally determined based on detailed loan reviews and a credit assessment bymanagement at each balance sheet date, and are deducted from the allowance for credit losses as net charge-offs.The MUFG Group generally applies its charge-off policy to all loans in its portfolio regardless of the type ofborrower. Management believes that the provision for credit losses is adequate and the allowance is at theappropriate amount to absorb probable losses inherent in the loan portfolio. During the fiscal year endedMarch 31, 2019, the MUFG Group did not make any significant changes to the methodologies or policies used todetermine its allowance for credit losses.
F-18

MITSUBISHI UFJ FINANCIAL GROUP, INC. AND SUBSIDIARIES
NOTES TO CONSOLIDATED FINANCIAL STATEMENTS—(Continued)
Key elements relating to the policies and discipline used in determining the allowance for credit losses arecredit classification and the related borrower categorization process. The categorization is based on conditionsthat may affect the ability of borrowers to service their debt, taking into consideration current financialinformation, historical payment experience, credit documentation, public information, analyses of relevantindustry segments or existing economic conditions. In determining the appropriate level of the allowance, theMUFG Group evaluates the probable loss by collateral value, historical loss experience, probability of insolvencyand category of loan based on its type and characteristics. The MUFG Group calculates the allowance for creditlosses over the loss emergence period that is a time between a loss occurring event and the subsequentconfirmation of a loss. The MUFG Group updates these conditions and probable loss on a regular basis and uponthe occurrence of unexpected change in the economic environment.
The methodologies used to estimate the allowance and the charge-off policy for each portfolio segment areas follows:
Commercial segment
In the Commercial segment, the methodology for assessing the appropriateness of the allowance consists ofseveral key elements, which include the allocated allowance for loans individually evaluated for impairment, theformula allowance, and the allocated allowance for large groups of smaller-balance homogeneous loans.
The allocated allowance for loans individually evaluated for impairment represents the impairmentallowance determined in accordance with the guidance on accounting by creditors for the impairment of a loan.The factors considered by management in determining impairment are the internal credit rating assigned to eachborrower which represents the borrower’s creditworthiness determined based on payment status, the number ofdelinquencies, and the probability of collecting principal and interest payments when due. The impairment of aloan is measured based on the present value of expected future cash flows discounted at the loan’s originaleffective interest rate, or the loan’s observable market price, or the fair value of the collateral if the loan iscollateral dependent.
The formula allowance is applied to loans that are categorized as Normal or Close Watch, excluding loansidentified as a TDR, based on the internal credit rating and historical loss factors which are based on the lossexperience. See Note 4 for the information on loans to borrowers categorized based on the internal borrowerrating. Estimated losses inherent in the loans at the balance sheet date are calculated by multiplying the defaultratio by the nonrecoverable ratio (determined as a complement of the recovery ratio). The default ratio isdetermined by each internal credit rating, taking into account the historical number of defaults of borrowerswithin each internal credit rating divided by the total number of borrowers. The recovery ratio is mainlydetermined by the historical experience of collections against loans in default. The default ratio, the recoveryratio and other indicators are continually reviewed to determine the appropriate level of the allowance. Becausethe evaluation of inherent loss for these loans involves an uncertainty, subjectivity and judgment, the estimationof the formula allowance is back-tested by comparing the allowance with the actual results subsequent to thebalance sheet date. The results of such back-testing are evaluated by management to determine whether themanner and level of the formula allowance needs to be changed in subsequent years.
The allocated allowance for large groups of smaller-balance homogeneous loans is established through aprocess that begins with estimates of probable losses inherent in the portfolio. These estimates are based uponvarious analyses, including historical delinquency and historical loss experience.
Loans that have been modified into a TDR are treated as impaired loans. For nonaccrual TDRs, theallowance for credit losses is provided for these loans using the discounted cash flow method, or based on the fair
F-19

MITSUBISHI UFJ FINANCIAL GROUP, INC. AND SUBSIDIARIES
NOTES TO CONSOLIDATED FINANCIAL STATEMENTS—(Continued)
value of the collateral. For TDRs accounted for as accruing loans, the allowance for credit losses is determinedby discounting the estimated future cash flows using the original effective interest rate of the loans prior tomodification.
In relation to loans categorized as Legally/Virtually Bankrupt, the carrying amount of loans less estimatedvalue of the collateral and guaranteed amount is generally considered uncollectible, and is charged off.
Residential segment
In the Residential segment, the loans are comprised of smaller-balance homogeneous loans that are pooledby their internal credit ratings-based on the number of delinquencies. The loans in this segment are generallysecured by collateral. Collateral values are based on internal valuation sources, and the allowance is determinedfor unsecured amounts. The allowance for the nondelinquent group of loans is determined based on historicalloss experience. For delinquent groups of loans, the MUFG Group determines the allowance based on theprobability of insolvency by the number of actual delinquencies and historical loss experience.
Loans that have been modified into a TDR are treated as impaired loans. For nonaccrual TDRs, theallowance for credit losses is provided for these loans using the discounted cash flow method, or based on the fairvalue of the collateral. For TDRs accounted for as accruing loans, the allowance for credit losses is determinedby discounting the estimated future cash flows using the original effective interest rate of the loans prior tomodification.
In relation to loans that are in past due status over a certain period of time and deemed uncollectible, thecarrying amount of loans less estimated value of the collateral and guaranteed amount is generally considereduncollectible and charged off.
Card segment
In the Card segment, the loans are smaller-balance homogeneous loans that are pooled by their internalcredit rating based on the number of delinquencies. The allowance for loans in this segment is generallydetermined based on the probability of insolvency by the number of actual delinquencies and historical lossexperience. For calculating the allocated allowance for loans specifically identified for evaluation, impaired loansare aggregated for the purpose of measuring impairment using historical loss factors.
Loans that have been modified into a TDR are treated as impaired loans, and the allowance for credit lossesis determined using the discounted cash flow method whereby the estimated future cash flows are discountedusing the original effective interest rate of the loans prior to modification.
In relation to loans that are in past due status over a certain period of time and deemed uncollectible, theamount of loans is generally fully charged off.
MUFG Americas Holdings segment
In the MUFG Americas Holdings segment, the methodology for assessing the appropriateness of theallowance consists of several key elements, which include the allocated allowance for loans individuallyevaluated for impairment, the formula allowance, the allocated allowance for large groups of smaller-balancehomogeneous loans, and the unallocated allowance.
F-20

MITSUBISHI UFJ FINANCIAL GROUP, INC. AND SUBSIDIARIES
NOTES TO CONSOLIDATED FINANCIAL STATEMENTS—(Continued)
The allocated allowance for loans individually evaluated for impairment is established for loans whenmanagement determines that the MUFG Group will be unable to collect all amounts due according to thecontractual terms of the loan agreement, including interest payments. Impaired loans are carried at the lower ofthe recorded investment in the loan, the present value of expected future cash flows discounted at the loan’seffective rate, the loan’s observable market price, or the fair value of the collateral, if the loan is collateraldependent.
The formula allowance is calculated by applying historical loss factors to outstanding loans. Historical lossfactors are based on the historical loss experience and may be adjusted for significant factors that, inmanagement’s judgment, affect the collectibility of the portfolio as of the balance sheet date.
The allocated allowance for large groups of smaller-balance homogeneous loans is established for consumerloans as well as for smaller balance commercial loans. These loans are managed on a pool basis, and loss factorsare based on expected net charge-off ranges.
The unallocated allowance represents an estimate of additional losses inherent in the loan portfolio and iscomposed of attribution factors, which are based upon management’s evaluation of various conditions that arenot directly measured in the determination of the allocated allowance. The conditions used for consideration ofthe unallocated allowance at each balance sheet date include factors, such as existing general economic andbusiness conditions affecting the key lending areas and products of the MUFG Group, credit quality trends andrisk identification, collateral values, loan volumes, underwriting standards and concentrations, specific industryconditions, recent loss experience and the duration of the current business cycle. The MUFG Group reviewsthese conditions and has an internal discussion with senior credit officers on a quarterly basis.
Loans that have been modified into a TDR are treated as impaired loans. For nonaccrual TDRs, theallowance for credit losses is provided for these loans using the discounted cash flow method, or based on the fairvalue of the collateral. For TDRs accounted for as accruing loans, the allowance for credit losses is determinedby using the discounted cash flow method whereby the estimated future cash flows are discounted using theoriginal effective interest rate of the loans prior to modification.
Commercial loans are generally considered uncollectible based on an evaluation of the financial conditionof a borrower as well as the value of any collateral and, when considered to be uncollectible, loans are chargedoff in whole or in part. Consumer loans are generally considered uncollectible based on past due status and thevalue of any collateral and, when considered to be uncollectible, loans are charged off in whole or in part.
Krungsri segment
In the Krungsri segment, the methodology for assessing the appropriateness of the allowance consists ofseveral key elements, which include the allocated allowance for loans individually evaluated for impairment, theformula allowance, and the allocated allowance for large groups of smaller-balance homogeneous loans.
The allocated allowance for loans individually evaluated for impairment is established for loans whenmanagement determines that the MUFG Group will be unable to collect all amounts due according to thecontractual terms of the loan agreement, including interest payments. Impaired loans are carried at the lower ofthe recorded investment in the loan, the present value of expected future cash flows discounted at the loan’seffective rate, the loan’s observable market price, or the fair value of the collateral, if the loan is collateraldependent.
F-21
MITSUBISHI UFJ FINANCIAL GROUP, INC. AND SUBSIDIARIES
NOTES TO CONSOLIDATED FINANCIAL STATEMENTS—(Continued)
The formula allowance is calculated by applying historical loss factors to outstanding loans. Historical lossfactors are based on the historical loss experience and may be adjusted for significant factors that, inmanagement’s judgment, affect the collectibility of the portfolio as of the balance sheet date.
The allocated allowance for large groups of smaller-balance homogeneous loans is established for smallerbalance loans such as housing loans, credit card loans, and personal loans. These loans are managed on a poolbasis, and loss factors are based on expected net charge-off ranges.
Loans that have been modified into a TDR are treated as impaired loans. For nonaccrual TDRs, theallowance for credit losses is provided for these loans using the discounted cash flow method, or based on the fairvalue of the collateral. For TDRs accounted for as accruing loans, the allowance for credit losses is determinedby using the discounted cash flow method whereby the estimated future cash flows are discounted using theoriginal effective interest rate of the loans prior to modification.
Loans to customers are charged off when they are determined to be uncollectible considering the financialcondition of a borrower.
Allowance for Off-Balance Sheet Credit Instruments—The MUFG Group maintains an allowance for creditlosses on off-balance sheet credit instruments, including commitments to extend credit, guarantees, standbyletters of credit and other financial instruments. The allowance is recorded as a liability in Other liabilities. TheMUFG Group adopts the same methodology used in determining the allowance for credit losses on loans.Potential credit losses related to derivatives are considered in the fair value of the derivatives.
Premises and Equipment—Premises and equipment are stated at cost less accumulated depreciation andamortization. Depreciation is charged to operations over the estimated useful lives of the related assets.Leasehold improvements are depreciated over the terms of the respective leases or the estimated useful lives ofthe improvements, whichever is shorter. MUFG, MUFG Bank and Mitsubishi UFJ Trust and Banking apply thedeclining-balance method in depreciating their premises and equipment, while other subsidiaries mainly applythe straight-line method, at rates principally based on the following estimated useful lives:
Years
Buildings . . . . . . . . . . . . . . . . . . . . . . . . . . . . . . . . . . . . . . . . . . . . . . . . . . . . . . . . . . . . . . . . . . . . . . . . . . 15 to 50Equipment and furniture . . . . . . . . . . . . . . . . . . . . . . . . . . . . . . . . . . . . . . . . . . . . . . . . . . . . . . . . . . . . . . 2 to 20Leasehold improvements . . . . . . . . . . . . . . . . . . . . . . . . . . . . . . . . . . . . . . . . . . . . . . . . . . . . . . . . . . . . . . 5 to 39
Maintenance, repairs and minor improvements are charged to operations as incurred. Major improvementsare capitalized. Net gains or losses on dispositions of premises and equipment are included in Other non-interestincome or expense, as appropriate.
Long-lived assets are reviewed for impairment whenever events or changes in circumstances indicate thatthe carrying amount of an asset may not be recoverable. Recoverability of an asset to be held and used ismeasured by a comparison of the carrying amount to future undiscounted net cash flows expected to be generatedby the asset. If an asset is considered to be impaired, the impairment to be recognized is measured by the amountby which the carrying amount of the asset exceeds the fair value. For purposes of recognition and measurementof an impairment loss, a long-lived asset or assets are grouped with other assets and liabilities at the lowest levelwith independent and identifiable cash flows. Assets to be disposed of by sale are reported at the lower of thecarrying amount or fair value less estimated cost to sell.
F-22
MITSUBISHI UFJ FINANCIAL GROUP, INC. AND SUBSIDIARIES
NOTES TO CONSOLIDATED FINANCIAL STATEMENTS—(Continued)
Asset retirement obligations related to restoration of certain leased properties upon lease termination arerecorded in Other liabilities with a corresponding increase in leasehold improvements. The amounts represent thepresent value of expected future cash flows associated with returning such leased properties to their originalcondition. The difference between the gross and present value of expected future cash flows is accreted over thelife of the related leases as a non-interest expense.
Goodwill—The MUFG Group recognizes goodwill, as of the acquisition date, measured as the excess of thepurchase price over the fair value of the net assets acquired. Goodwill related to investments in equity methodinvestees is included in Other assets as a part of the carrying amount of investments in equity method investees.
Goodwill arising from a business combination is not amortized but is tested at least annually forimpairment. Goodwill is recorded at a designated reporting unit level for the purpose of assessing impairment.
A reporting unit is an operating segment, or an identified business unit one level below an operatingsegment. An impairment loss is recognized to the extent that the carrying amount of goodwill exceeds its impliedfair value.
Intangible assets—Intangible assets consist of software, core deposit intangibles, customer relationships,trade names and other intangible assets. These are amortized over their estimated useful lives unless they haveindefinite useful lives. Amortization of intangible assets is computed in a manner that best reflects the economicbenefits of the intangible assets as follows:
Useful lives(years) Amortization method
Software . . . . . . . . . . . . . . . . . . . . . . . . . . . . . . . . . . . . . . . . . . . . 2 to 10 Straight-lineCore deposit intangibles . . . . . . . . . . . . . . . . . . . . . . . . . . . . . . . 10 to 16 Straight-lineCustomer relationships . . . . . . . . . . . . . . . . . . . . . . . . . . . . . . . . 7 to 27 Straight-line, Declining-balanceTrade names . . . . . . . . . . . . . . . . . . . . . . . . . . . . . . . . . . . . . . . . . 7 to 40 Straight-line
Intangible assets having indefinite useful lives are not amortized but are subject to annual impairment tests.An impairment exists if the carrying value of an indefinite-lived intangible asset exceeds its fair value. For otherintangible assets subject to amortization, an impairment is recognized if the carrying amount is not recoverableand the carrying amount exceeds the fair value of the intangible asset.
The MUFG Group capitalizes certain costs associated with the acquisition or development of internal-usesoftware. Costs subject to capitalization are salaries and employee benefits for employees who are directlyassociated with and who devote time to the internal-use computer software project, to the extent of time spentdirectly on the project. Once the software is ready for its intended use, the MUFG Group begins to amortizecapitalized costs on a straight-line basis.
Accrued Severance and Pension Liabilities—The MUFG Group has defined benefit pension plans and otherpostretirement benefit plans, including severance indemnities plans (“SIPs”). The liabilities related to these plansare computed and recognized based on actuarial computations. Net actuarial gains and losses that arise fromdifferences between actual experience and assumptions are generally amortized over the average remainingservice period of participating employees if it exceeds the corridor, which is defined as the greater of 10% of planassets or the projected benefit obligation. Under the guidance related to employers’ accounting for definedbenefit pension and other postretirement plans, the MUFG Group recognizes a net liability or asset to report thefunded status of its defined benefit pension and other postretirement plans in the accompanying consolidatedbalance sheets and mainly recognizes changes in the funded status of defined benefit pension and otherpostretirement plans in the year in which the changes occur in Accumulated OCI. Based on actuarialcomputations of current and future employee benefits, the service cost component is charged to Salaries and
F-23

MITSUBISHI UFJ FINANCIAL GROUP, INC. AND SUBSIDIARIES
NOTES TO CONSOLIDATED FINANCIAL STATEMENTS—(Continued)
employee benefits while other components of net pension benefit/cost are charged to Other non-interestexpenses. The MUFG Group measures plan assets and benefit obligations as of the date of the consolidatedbalance sheets.
Long-Term Debt—Premiums, discounts and issuance costs of long-term debt are amortized based on themethod that approximates the interest method over the term of the long-term debt.
Obligations under Guarantees—The MUFG Group provides customers with a variety of guarantees andsimilar arrangements, including standby letters of credit, financial and performance guarantees, credit protection,and liquidity facilities. The MUFG Group recognizes guarantee fee income over the guarantee period based onthe contractual terms of the guarantee contracts. It is the MUFG Group’s business practice to receive a guaranteefee at the inception of the guarantee, which approximates market value of the guarantee and is initially recordedas a liability, which is then recognized as guarantee fee income over the guarantee period.
Allowance for Repayment of Excess Interest—The MUFG Group maintains an allowance for repayment ofexcess interest based on an analysis of past experience of reimbursement of excess interest, borrowers’ profile,recent trend of borrowers’ claims for reimbursement, and management’s future forecasts. The allowance isrecorded as a liability in Other liabilities.
Fees and Commissions—The MUFG Group recognizes revenue from contracts with customers in theamount of consideration it expects to receive upon the transfer of control of a good or service. The timing ofrecognition is dependent on whether the MUFG Group satisfies a performance obligation by transferring controlof the product or service to a customer over time or at a point in time.
The following is an explanation of the MUFG Group’s key revenue from contracts with customers and thetiming of its recognition.
Fees and commissions on deposits consist of fees and commissions charged for transaction-based servicessuch as usage of automated teller machines and withdrawal services, and for periodic account maintenanceservices. The MUFG Group’s performance obligation for transaction-based services is satisfied and the fees andcommissions are recognized at the point in time when the MUFG Group’s performance under the terms of acontractual arrangement is completed, which is at the settlement of a transaction, while the MUFG Group’sperformance obligation for maintenance services is satisfied and the fees and commissions are recognized overthe course of each month.
Fees and commissions on remittances and transfers consist of fees and commissions charged for settlementtransactions such as domestic fund remittances, including electronic banking transactions, and are recognized atthe point in time when the MUFG Group’s performance under the terms of a contractual arrangement iscompleted, which is at the settlement of a transaction.
Fees and commissions on foreign trading business consist of fees and commissions charged for fundcollection and trade-related financing services related to foreign trading business, and are recognized in theperiod in which the related service is provided. If they arise from foreign trading business activities under whichthe customer consumes the related services at a point in time (e.g. foreign exchange fees), such fees arerecognized at the same point in time. If they arise from foreign trading business activities under which thecustomer consumes the related services equally over the period of service (e.g. commercial letters of credit), suchfees are recognized over the same period.
F-24
MITSUBISHI UFJ FINANCIAL GROUP, INC. AND SUBSIDIARIES
NOTES TO CONSOLIDATED FINANCIAL STATEMENTS—(Continued)
Fees and commissions on credit card business consist of fees and commissions such as interchange income,royalty and other service charges from franchisees. Interchange income from the credit card business isrecognized as processed transactions are settled through the associated payment networks, while royalty andother service charges related to the credit card business are recognized on a straight-line basis over the period ofservice.
Fees and commissions on security-related services primarily consist of fees and commissions for sales andtransfers of securities including investment funds, underwriting, brokerage and advisory services, arrangementfees on securitizations, and agency services for the calculation and payment of dividends. Fees and commissionson security-related services are recognized in the period in which the related service is provided. If they arisefrom security-related services under which the customer consumes the related services at a point in time(e.g. sales and transfers of securities are executed at the customer’s direction; underwritings of debt and equitysecurities or securitizations are completed at the trade date; advice is provided to the clients; and dividends arecalculated and then paid to investors), such fees are recognized at the same point in time. If they arise fromsecurity-related services under which the customer consumes the related services equally over the period ofservice (e.g. retainer fees on M&A advisory fees), such fees are recognized over the same period. The advisoryfees which are paid upon meeting certain performance goals (e.g. success fees on M&A advisory fees) arerecognized at the point in time when the performance goals are met.
Fees and commissions on administration and management services for investment funds primarily consist offees and commissions earned from administrating and managing investment funds, including assets undermanagement on behalf of clients. Such fees and commissions are recognized equally over the period of service atthe amount calculated primarily based on the outstanding amount of each entrusted asset, the percentage of fees,and the extent of the service provided to administer the investment funds.
Trust fees consist primarily of fees earned by fiduciary asset management and administration services forcorporate pension plans and investment funds, and are recognized on an accrual basis, generally based on thevolume of trust assets under management and/or the operating performance for the accounting period of eachtrust account. With respect to the trust accounts with a guarantee of trust principal, trust fees are determinedbased on the profits earned by individual trust accounts during the trust accounting period, less deductions,including provision for reserves, impairment for individual investments and dividends paid to beneficiarycertificate holders. The trust fees for these trust accounts are accrued based on the amounts expected to be earnedduring the accounting period of each trust account.
Guarantee fees consist of fees related to the guarantee business such as providing guarantees on residentialmortgage loans and other loans, and are recognized over the contractual periods of the respective guarantees.
Insurance commissions consist of commissions earned from third-party insurance companies for marketingand selling insurance products and for the maintenance of insurance contracts. The former is recognized at thepoint in time which the associated service is fulfilled as the insurance contract is established by the insurancecompany, while the latter is recognized over the insurance period.
Fees and commissions on real estate business primarily consist of fees from real estate agent services, andare recognized in the period in which the related service is provided when assisting customers in the sales orpurchase of real estate property.
Other fees and commissions include various fees and commissions earned on services to customers whichhave performance obligations that the MUFG Group completes in order to recognize revenue. The primaryportion includes non-refundable financing related fees such as arrangement fees that are recognized when theservice is provided.
F-25
MITSUBISHI UFJ FINANCIAL GROUP, INC. AND SUBSIDIARIES
NOTES TO CONSOLIDATED FINANCIAL STATEMENTS—(Continued)
Income Taxes—The MUFG Group accounts for income taxes under the asset and liability method, whichrequires the recognition of deferred tax assets and deferred tax liabilities for the expected future tax consequencesof events that have been included in the accompanying consolidated financial statements. Under this method,deferred tax assets and deferred tax liabilities are determined based on the differences between the financialstatements and tax basis of assets and liabilities using enacted tax rates in effect for the year in which thedifferences are expected to reverse. The effect of a change in tax rates on deferred tax assets and deferred taxliabilities is recognized in income in the period that includes the enactment date.
The MUFG Group records net deferred tax assets to the extent these assets will more likely than not berealized. In making such determination, all available positive and negative evidence is considered, includingfuture reversals of existing taxable temporary differences, projected future taxable income, tax planningstrategies and recent financial operations. In the event the MUFG Group were to determine that it would be ableto realize deferred tax assets in the future in excess of their net recorded amount, the MUFG Group would makean adjustment to the valuation allowance, which would reduce the provision for income taxes.
Uncertain tax positions are recorded on the basis of a two-step process whereby (1) it is determined whetherit is more likely than not that the tax position will be sustained on the basis of its technical merits, and (2) forthose tax positions that meet the more-likely-than-not recognition threshold, the MUFG Group recognizes thelargest amount of tax benefit that is more than 50% likely to be realized upon ultimate settlement with the relatedtax authority. The MUFG Group recognizes interest and penalties related to unrecognized tax benefits withinincome tax expense. Accrued interest and penalties are included within Other liabilities.
Free Distributions of Common Shares—As permitted by the Companies Act of Japan (the “CompaniesAct”), Japanese companies, upon approval by the Board of Directors, may make a free distribution of shares, inthe form of a “stock split” as defined, to shareholders. In accordance with generally accepted accounting practicein Japan, such distribution does not give rise to any change in capital stock or capital surplus accounts. Commonshares distributed are recorded as shares issued on the distribution date. See Note 18 for further information.
Earnings per Common Share—Basic earnings per share (“EPS”) excludes dilutive effects of potentialcommon shares and is computed by dividing earnings applicable to common stock shareholders by the weightedaverage number of common shares outstanding for the period, while diluted EPS gives effect to all dilutivepotential common shares that were outstanding during the period. See Note 23 for the computation of basic anddiluted EPS.
Treasury Stock—The MUFG Group presents its treasury stock, including shares of MUFG owned by itssubsidiaries and affiliated companies, as a reduction of equity on the accompanying consolidated balance sheetsat cost and accounts for treasury stock transactions under an average cost method. Gains (losses) on sales oftreasury stock are charged to capital surplus and unappropriated retained earnings.
Comprehensive Income—Comprehensive income includes net income before attribution to noncontrollinginterests and other comprehensive income (“OCI”). All changes in unrealized gains and losses on investmentsecurities, unrealized gains and losses on derivatives qualifying for cash flow hedges, defined benefit plans andforeign currency translation adjustments constitute OCI and are presented, with related income tax effects, in theaccompanying consolidated statements of comprehensive income. OCI also includes changes in the instrument-specific credit risk on financial liabilities (“debt valuation adjustments” or “DVA”) accounted for under the fairvalue option.
Stock-Based Compensation—MUFG and certain of its subsidiaries have a stock compensation-type stockoption plan (“Stock Option Plan”) for directors (excluding outside directors and directors serving as audit
F-26

MITSUBISHI UFJ FINANCIAL GROUP, INC. AND SUBSIDIARIES
NOTES TO CONSOLIDATED FINANCIAL STATEMENTS—(Continued)
committee members), corporate executives, executive officers and senior fellows (collectively, “officers”).Compensation costs under the Stock Option Plan are recognized based on the grant date fair value of the stockoption (“Stock Acquisition Rights”) over the period during officers are required to provide service in accordancewith the terms of the plan. MUFG and certain of its subsidiaries also have performance-based stockcompensation plan (“the Board Incentive Plan”). The awards granted under the Board Incentive Plan areclassified as either liability for the part of award which are provided to officers in cash or equity for the part ofaward which are provided to officers in the common shares of MUFG. Compensation costs are recognized overthe requisite service period for the entire awards. For awards classified as liability, compensation costs aremeasured based on the fair value calculated by the quoted price of common shares of MUFG at the date of fiscalyear-end and remeasured at the end of each reporting period. Changes in quoted prices of common shares ofMUFG between the date of grant and the settlement of awards are recognized in the period which the changesoccur. For awards classified as equity, compensation costs are measured based on the grant date fair value by thequoted price of the common shares of MUFG for employees or the fair value as of earlier of the date theperformance commitment is reached or the date of completion of officers’ performance for nonemployees. SeeNote 33 for further discussion of stock-based compensation plans.
Reclassifications
Certain reclassifications and format changes have been made to the consolidated financial statements for thefiscal years ended March 31, 2017 and 2018 to conform to the presentation for the fiscal year ended March 31,2019. These reclassifications and format changes include reclassifications of equity investment securities from“Available-for-sale securities” and “Other investment securities” to a new line labeled as “Equity securities”within Investment securities in the consolidated balance sheet to report all marketable and nonmarketable equityinvestment securities separately from Available-for-sale debt securities and Held-to-maturity debt securities. Therelated cash flows were also reclassified from “Proceeds from sales and maturities of Available-for-salesecurities” and “Proceeds from sales and redemption of Other investment securities” to “Proceeds from sales andredemption of Equity securities”, and from “Purchases of Available-for-sale securities” and “Purchases of Otherinvestment securities” to “Purchases of Equity securities” in cash flows from investing activities in theconsolidated statements of cash flows. These reclassifications and format changes did not result in a change topreviously reported financial condition, results of operations, and cash flows.
Accounting Changes
Revenue from Contracts with Customers—In May 2014, the FASB issued new guidance which supersedesthe then-current revenue recognition requirements, including most industry-specific guidance. The core principleof the guidance is that an entity should recognize revenue to depict the transfer of promised goods or services tocustomers in an amount that reflects the consideration to which the entity expects to be entitled in exchange forthose goods or services. The guidance also requires additional disclosures about the nature, amount, timing anduncertainty of revenue and cash flows arising from contracts with customers, including significant judgments andchanges in judgments, and assets recognized from the costs incurred to obtain or fulfill a contract. InMarch 2016, the FASB issued further guidance related to the principal-versus-agent assessment which requiresan entity to determine the nature of the promise to the customer by identifying each specified good or service tobe provided and assessing whether an entity controls each specified good or service before that good or service istransferred to the customer. In addition, in April 2016, the FASB issued guidance clarifying certain aspects ofidentification of promised goods or services and provides implementation guidance on licensing of intellectualproperty. Furthermore, in May 2016, the FASB issued guidance which amends the guidance on assessingcollectibility, presentation of sales taxes, noncash consideration, and contract modifications and completedcontracts at transition, and on disclosure around transition. In December 2016, the FASB issued additional
F-27
MITSUBISHI UFJ FINANCIAL GROUP, INC. AND SUBSIDIARIES
NOTES TO CONSOLIDATED FINANCIAL STATEMENTS—(Continued)
guidance which amends the new revenue standard to clarify certain aspects, including the scope and disclosurerequirements. This guidance is effective for annual reporting periods beginning after December 15, 2017,including interim periods within that reporting period. The MUFG Group adopted the guidance on April 1, 2018on a modified retrospective method, and there was no material impact on its financial position and results ofoperations. For additional information, see Note 28.
Recognition and Measurement of Financial Assets and Financial Liabilities—In January 2016, the FASBissued new guidance which requires equity investments, except those accounted for under the equity method ofaccounting or those that result in consolidation of the investee, to be measured at fair value with changes in fairvalue recognized in net income. However, for equity investments that do not have readily determinable fairvalues, the fair value may be measured at cost minus impairment, if any, plus or minus changes resulting fromobservable price changes in orderly transactions for the identical or a similar investment of the same issuer(“themeasurement alternative”), and the impairment assessment is simplified by performing a qualitative assessmentto identify impairments. For financial liabilities which were elected to measure at fair value in accordance withthe fair value option, this guidance also requires an entity to present separately in other comprehensive incomethe portion of the changes in the fair value of financial liabilities resulting from a change in the instrument-specific credit risk. In addition, this guidance eliminates the requirement to disclose the methods and significantassumptions used to estimate the fair value for financial instruments measured at amortized cost, and clarifies,for disclosure purposes, the requirement for the use of an exit price notion in the determination of the fair valueof financial instruments measured at amortized cost. This guidance also clarifies that an entity must evaluate theneed for a valuation allowance on a deferred tax asset related to available-for-sale securities in combination withthe entity’s other deferred tax assets. This guidance is effective for annual reporting periods beginning afterDecember 15, 2017, including interim periods within that reporting period. Early adoption is not permittedexcept for the amendments related to the accounting for financial liabilities under the fair value option. InFebruary 2018, the FASB issued additional guidance to improve certain aspects of the new guidance. The MUFGGroup adopted the guidance on April 1, 2018. Upon adoption, the MUFG Group recorded an increase in thebeginning balance of retained earnings as of April 1, 2018 of ¥2,702 billion, with a corresponding decrease inAccumulated OCI, net of taxes. Other amendments required under the new guidance did not have a materialimpact on the MUFG Group’s financial position and results of operations. As a result of adopting this guidance,marketable equity investment securities are measured at fair value with unrealized gains or losses reflected in netincome. Prior to adoption, such unrealized gains and losses were reflected in other comprehensive income.Nonmarketable equity investment securities previously accounted for under the cost method of accounting arenow measured at cost minus impairment, if any, plus or minus changes resulting from observable price changes.
Recognition of Breakage for Certain Prepaid Stored-Value Products—In March 2016, the FASB issued newguidance which clarifies that liabilities related to the sale of certain prepaid stored-value products are financialliabilities. The guidance also provides a narrow scope exception to the guidance on extinguishments of liabilitiesto require that breakage for those liabilities be accounted for consistent with the breakage model required by theguidance on revenue from contracts with customers for non-financial liabilities. This guidance is effective forfiscal years beginning after December 15, 2017, including interim periods within those fiscal years. Earlyapplication is permitted, including adoption in an interim period. The MUFG Group adopted this guidance onApril 1, 2018. Upon adoption, the MUFG Group recorded an increase in the beginning balance of retainedearnings as of April 1, 2018 of ¥1,784 million, net of taxes.
Classification of Certain Cash Receipts and Cash Payments—In August 2016, the FASB issued newguidance which provides specific guidance on eight cash flow classification issues to reduce diversity in practice.This guidance is effective for fiscal years beginning after December 15, 2017, including interim periods withinthose fiscal years. Early adoption is permitted. Since this guidance only impacts classification in the statement of
F-28

MITSUBISHI UFJ FINANCIAL GROUP, INC. AND SUBSIDIARIES
NOTES TO CONSOLIDATED FINANCIAL STATEMENTS—(Continued)
cash flows, adoption will not affect the MUFG Group’s consolidated statements of income or consolidatedbalance sheets. The MUFG Group adopted this guidance on April 1, 2018, and there was no material impact onits consolidated statements of cash flows.
Intra-Entity Transfers of Assets Other Than Inventory—In October 2016, the FASB issued new guidancewhich simplifies the accounting for the income tax consequences of intra-entity transfers of assets other thaninventory. Under current U.S. GAAP, the recognition of current and deferred income taxes for an intra-entityasset transfer is prohibited until the asset has been sold to an outside party. This guidance eliminates thisexception for all intra-entity sales of assets other than inventory. This guidance is effective for annual reportingperiods beginning after December 15, 2017, including interim periods within those annual reporting periods.Early adoption is permitted. The MUFG Group adopted this guidance on April 1, 2018, and there was no materialimpact on its financial position and results of operations.
Clarifying the Definition of a Business—In January 2017, the FASB issued new guidance which clarifies thedefinition of a business with the objective of adding guidance to assist entities with evaluating whethertransactions should be accounted for as acquisitions (or disposals) of assets or businesses. This guidance requiresthat when substantially all of the fair value of the gross assets acquired (or disposed of) is concentrated in a singleidentifiable asset or a group of similar identifiable assets, an integrated set of assets and activities is not abusiness. This guidance also requires that to be considered a business, an integrated set of assets and activitiesmust include, at a minimum, an input and a substantive process that together significantly contribute to the abilityto create outputs, provides a framework to evaluate whether both an input and a substantive process are present,and removes the current requirement to assess if a market participant could replace any missing elements.Furthermore, this guidance narrows the definition of outputs so that the term is consistent with how outputs aredescribed in the new revenue standard. This guidance is effective for annual periods beginning afterDecember 15, 2017, including interim periods within those periods. Early application is permitted fortransactions that occur in a period for which financial statements have not been issued. The MUFG Groupadopted this guidance on April 1, 2018, and there was no material impact on its financial position and results ofoperations.
Clarifying the Scope of Asset Derecognition Guidance and Accounting for Partial Sales of NonfinancialAssets—In February 2017, the FASB issued new guidance which clarifies the scope of the guidance onderecognition of nonfinancial assets and provides guidance on the accounting for partial sales of nonfinancialassets. This guidance defines an in substance nonfinancial asset, unifies guidance related to partial sales ofnonfinancial assets, eliminates rules specifically addressing sales of real estate, removes exceptions to thefinancial asset derecognition model, and clarifies the accounting for contributions of nonfinancial assets to jointventure. The effective date and early adoption of this guidance will be the same as the effective date and earlyadoption of the new revenue standard. The MUFG Group adopted this guidance on April 1, 2018, and there wasno material impact on its financial position and results of operations.
Improving the Presentation of Net Periodic Pension Cost and Net Periodic Postretirement Benefit Cost—InMarch 2017, the FASB issued new guidance which requires that an employer report the service cost componentin the same line item or items as other compensation costs arising from services rendered by the pertinentemployees during the period. The other components of net benefit cost are required to be presented in the incomestatement separately from the service cost component and outside a subtotal of income from operations, if one ispresented. This guidance also allows only the service cost component to be eligible for capitalization whenapplicable. This guidance is effective for annual periods beginning after December 15, 2017, including interimperiods within those annual periods. Early adoption is permitted as of the beginning of an annual period forwhich financial statements (interim or annual) have not been issued. The MUFG Group retrospectively adopted
F-29
MITSUBISHI UFJ FINANCIAL GROUP, INC. AND SUBSIDIARIES
NOTES TO CONSOLIDATED FINANCIAL STATEMENTS—(Continued)
this guidance on April 1, 2018 using the practical expedient permitted by this guidance and reclassified thenon-service cost components of net pension benefit/cost to Other non-interest expenses, and there was nomaterial impact on its financial position and results of operation. See Note 13 for further information.
Scope of Modification Accounting—In May 2017, the FASB issued new guidance which clarifies when toaccount for a change to the terms or conditions of a share-based payment award as a modification. Under thisguidance, modification accounting is required only if the fair value, the vesting conditions, or the classification ofthe award changes as a result of the change in terms or conditions. This guidance is effective for annual periods,and interim periods within those annual periods, beginning after December 15, 2017. Early adoption is permitted,including adoption in any interim period, for which financial statements have not yet been issued. The MUFGGroup adopted this guidance on April 1, 2018, and there was no material impact on its financial position andresults of operations.
Disclosure Framework—Changes to the Disclosure Requirements for Fair Value Measurement—In August2018, the FASB issued new guidance which modifies the disclosure requirements on fair value measurements.This guidance removes disclosure requirements for the amount of and reasons for transfers between Level 1 andLevel 2 of the fair value hierarchy, the policy for timing of transfers between levels, and valuation processes forLevel 3 fair value measurements. In addition, the guidance modifies disclosure requirements for investments incertain entities that calculate net asset value and modifies disclosure requirements related to measurementuncertainty. Lastly, the guidance adds disclosure requirements for changes in unrealized gains and losses for theperiod that are included in other comprehensive income for recurring Level 3 fair value measurements held at theend of the reporting period, and the guidance adds disclosure requirements related to the range and weightedaverage of significant unobservable inputs used to develop Level 3 fair value measurements. This guidance iseffective for fiscal years, and interim periods within those fiscal years, beginning after December 15, 2019. Earlyadoption is permitted upon issuance of this guidance. An entity is permitted to early adopt any removed ormodified disclosures upon issuance of this guidance and delay adoption of the additional disclosures until theireffective date. The MUFG Group early adopted removal disclosure requirements as of March 31, 2019 and willadopt other requirements of this guidance on or prior to the effective date. The guidance affected disclosures inthe notes to the consolidated financial statements and did not affect its financial position and results ofoperations. See Note 32 for further information.
Recently Issued Accounting Pronouncements
Leases—In February 2016, the FASB issued new guidance which requires that lessees recognize in thestatement of financial position a liability to make lease payments (the lease liability) and a right-of-use assetrepresenting its right to use the underlying asset for the lease term. The accounting applied by lessors is largelyunchanged, but the accounting model for leveraged leases is not retained for leases that commence after theeffective date of this guidance. This guidance also requires entities to provide qualitative and quantitativedisclosures about the amount, timing and uncertainty of cash flows arising from leases. This guidance is effectivefor fiscal years beginning after December 15, 2018, including interim periods within those fiscal years. Earlyapplication is permitted.
The MUFG Group adopted this guidance on April 1, 2019 under a modified retrospective approach, andrecorded approximately ¥0.4 trillion of right-of-use assets and ¥0.5 trillion of lease liabilities on the MUFGGroup’s consolidated balance sheet. The adoption of this guidance was not material to the MUFG Group’s resultsof operations.
Measurement of Credit Losses on Financial Instruments—In June 2016, the FASB issued new guidancewhich replaces the incurred loss impairment methodology in current U.S. GAAP with a methodology that reflects
F-30
MITSUBISHI UFJ FINANCIAL GROUP, INC. AND SUBSIDIARIES
NOTES TO CONSOLIDATED FINANCIAL STATEMENTS—(Continued)
expected credit losses and requires consideration of a broader range of reasonable and supportable information toestimate credit losses. Under this guidance, the measurement of expected credit losses is based on relevantinformation about past events, including historical experience, current conditions, and reasonable andsupportable forecasts that affect the collectibility of the reported amount of the financial asset (or a group offinancial assets) measured at amortized cost basis. For available-for-sale debt securities, a credit loss is recordedthrough an allowance for credit losses and the amount of the allowance is limited to the amount by which fairvalue is below amortized cost. For purchased financial assets with a more-than-insignificant amount of creditdeterioration since origination that are measured at amortized cost basis, the initial allowance for credit losses isadded to the purchase price rather than being reported as a credit loss expense, only subsequent changes in theallowance are recorded as a credit loss expense, and interest income is recognized based on the effective interestrate, excluding the discount embedded in the purchase price that is attributable to the acquirer’s assessment ofcredit losses at acquisition. This guidance also expands the disclosure requirements regarding an entity’sassumptions, models, and methods for estimating the allowance, and requires the entity to disclose the amortizedcost balance for each class of financial asset by credit quality indicator, disaggregated by the year of origination.In April 2019, the FASB issued additional guidance to improve certain aspects of this guidance. This guidance iseffective for fiscal years beginning after December 15, 2019, including interim periods within those fiscal years.Early adoption is permitted for fiscal years beginning after December 15, 2018, including interim periods withinthose fiscal years. The MUFG Group is currently evaluating what effect the guidance above will have on itsconsolidated financial statements and related disclosures. The MUFG Group’s implementation efforts includeidentifying key interpretive issues, assessing the impact and developing credit forecasting models and processes.
Simplifying the Test for Goodwill Impairment—In January 2017, the FASB issued new guidance whichsimplifies how an entity is required to test goodwill for impairment by eliminating Step 2 from the goodwillimpairment test. Under Step 2, an entity had to perform procedures to determine the fair value at the impairmenttesting date of its assets and liabilities (including unrecognized assets and liabilities) following the procedure thatwould be required in determining the fair value of assets acquired and liabilities assumed in a businesscombination. This guidance eliminates Step 2 and instead requires an entity to perform its goodwill impairmenttest by comparing the fair value of a reporting unit with its carrying amount. This guidance also eliminates therequirements for any reporting unit with a zero or negative carrying amount to perform a qualitative assessmentand, if it fails that qualitative test, to perform Step 2 of the goodwill impairment test, and instead requires thedisclosure of the amount of goodwill allocated to each reporting unit with a zero or negative carrying amount ofnet assets. This guidance is effective for its annual or any interim goodwill impairment tests in fiscal yearsbeginning after December 15, 2019. Early adoption is permitted for interim or annual goodwill impairment testsperformed on testing dates after January 1, 2017. The MUFG Group is currently evaluating what effect theguidance will have on its consolidated financial statements and related disclosures.
Premium Amortization on Purchased Callable Debt Securities—In March 2017, the FASB issued newguidance which shortens the amortization period for certain callable debt securities held at a premium,specifically requiring the premium to be amortized to the earliest call date. This guidance does not require anaccounting change for securities held at a discount, and the discount continues to be amortized to maturity. Thisguidance is effective for fiscal years, and interim periods within those fiscal years, beginning after December 15,2018. Early adoption is permitted, including adoption in an interim period. The MUFG Group is currentlyevaluating what effect the guidance will have on its consolidated financial statements and related disclosures.
Targeted Improvements to Accounting for Hedging Activities—In August 2017, the FASB issued newguidance which better aligns an entity’s risk management activities and financial reporting for hedgingrelationships through changes to both the designation and measurement guidance for qualifying hedgingrelationships and the presentation of hedge results. To meet that objective, this guidance expands and refines
F-31
MITSUBISHI UFJ FINANCIAL GROUP, INC. AND SUBSIDIARIES
NOTES TO CONSOLIDATED FINANCIAL STATEMENTS—(Continued)
hedge accounting for both nonfinancial and financial risk components and aligns the recognition and presentationof the effects of the hedging instrument and the hedged item in the financial statements. In addition, this guidanceincludes certain targeted improvements to ease the application of current guidance related to the assessment ofhedge effectiveness. This guidance also modifies the requirement to disclose the effect on the income statementof fair value and cash flow hedges, eliminates the requirement to disclose the ineffective portion of the change infair value of hedging instruments, and requires new tabular disclosures related to cumulative basis adjustmentsfor fair value hedges. This guidance is effective for fiscal years beginning after December 15, 2018, and interimperiods within those fiscal years. Early application is permitted in any interim period after issuance of thisguidance. The MUFG Group does not expect that the adoption of this guidance will have a material impact on itsconsolidated financial statements and related disclosures.
Improvements to Nonemployee Share-Based Payment Accounting—In June 2018, the FASB issued newguidance which largely aligns the accounting for share-based payment awards issued to employees andnonemployees. Under this guidance, equity-classified share-based payment awards issued to nonemployees aremeasured at the grant date, instead of the previous requirement to measure the awards at the earlier of the date atwhich the performance commitment is reached or the date of performance completion. For awards issued tononemployees with performance conditions, compensation cost associated with the awards is recognized whenachievement of the performance condition is probable, instead of the previous requirement to recognize the costsbased on the lowest aggregate fair value. This guidance also eliminates the previous requirement to reassess theclassification for certain nonemployee awards upon vesting. This guidance is effective for fiscal years beginningafter December 15, 2018, including interim periods within that fiscal year. Early adoption is permitted, but noearlier than an entity’s adoption date of the new revenue standard. The MUFG Group is currently evaluatingwhat effect the guidance will have on its consolidated financial statements and related disclosures.
Disclosure Framework—Changes to the Disclosure Requirements for Defined Benefit Plans—In August2018, the FASB issued new guidance which modifies the disclosure requirements for employers that sponsordefined benefit pension or other postretirement plans. This guidance removes certain disclosure requirements,including amounts in Accumulated OCI expected to be recognized as components of net periodic benefit costover the next fiscal year and the amount and timing of plan assets expected to be returned to the employer,clarifies disclosure requirements for defined benefit plans with projected or accumulated benefit obligations inexcess of plan assets, and adds disclosure requirements for weighted-average interest crediting rates for cashbalance plans and other plans with promised interest crediting rates as well as an explanation of the reasons forsignificant gains and losses related to changes in the benefit obligation for the period. This guidance is effectivefor fiscal years ending after December 15, 2020. Early adoption is permitted. The MUFG Group is currentlyevaluating what effect the guidance will have on its disclosures.
Customer’s Accounting for Implementation Costs Incurred in a Cloud Computing Arrangement That Is aService Contract—In August 2018, the FASB issued new guidance which aligns the requirements for capitalizingimplementation costs incurred in a hosting arrangement that is a service contract with the requirements forcapitalizing implementation costs incurred to develop or obtain internal-use software. This guidance requires anentity (customer) in a hosting arrangement that is a service contract to follow the guidance on internal-usesoftware to determine which implementation costs to capitalize as an asset related to the service contract andwhich costs to expense. This guidance also requires the entity (customer) to expense the capitalizedimplementation costs of a hosting arrangement that is a service contract over the term of the hosting arrangement,apply the existing impairment guidance on internal-use software to the capitalized implementation costs as if thecosts were long-lived assets, and present the capitalized-implementation-cost-related items in the same line itemsin the financial statements as those relating to fees associated with the hosting element (service) of thearrangement. This guidance is effective for fiscal years beginning after December 15, 2019, and interim periods
F-32

MITSUBISHI UFJ FINANCIAL GROUP, INC. AND SUBSIDIARIES
NOTES TO CONSOLIDATED FINANCIAL STATEMENTS—(Continued)
within those fiscal years. Early adoption is permitted, including adoption in any interim period. The MUFGGroup is currently evaluating what effect the guidance will have on its consolidated financial statements andrelated disclosures.
Inclusion of the Secured Overnight Financing Rate (SOFR) Overnight Index Swap (OIS) Rate as aBenchmark Interest Rate for Hedge Accounting Purposes—In October 2018, the FASB issued new guidancewhich permits use of the Overnight Index Swap (“OIS”) rate based on Secured Overnight Financing Rate as aU.S. benchmark interest rate for hedge accounting purposes in addition to the interest rates on direct Treasuryobligations of the U.S. government, the London Interbank Offered Rate (“LIBOR”), the OIS rate based on theFed Funds Effective Rate, and the Securities Industry and Financial Markets Association Municipal Swap Rate.This guidance is effective for fiscal years beginning after December 15, 2018, and interim periods within thosefiscal years. Early adoption is permitted in any interim period upon issuance of this guidance if an entity alreadyhas adopted the new hedge accounting standard. The MUFG Group is currently evaluating what effect theguidance will have on its consolidated financial statements and related disclosure.
2. BUSINESS DEVELOPMENTS
MUFG Bank’s Acquisition of Security Bank Corporation’s shares
On April 1, 2016, MUFG Bank acquired newly issued common shares and preferred shares with votingrights of Security Bank Corporation (“Security Bank”), representing in the aggregate approximately 20.0% ofSecurity Bank’s equity interest for ¥91,993 million. Security Bank is listed on the Philippines Stock Exchangeand is not part of any local conglomerate in the Philippines. Considering both MUFG Bank’s ownership of thecommon stock and preferred stock and representation on the board of directors, the MUFG Group has determinedthat MUFG Bank has the ability to exercise significant influence over the operating and financial policies ofSecurity Bank and applied the equity method of accounting for its investment.
Mitsubishi UFJ Trust and Banking’s Acquisition of Capital Analytics II LLC
On April 30, 2016, Mitsubishi UFJ Trust and Banking acquired 100% ownership of Capital Analytics IILLC for ¥4,494 million in cash, and thereby recorded goodwill of ¥2,858 million and intangible assets of¥1,388 million. Capital Analytics II LLC is an overseas fund management company that mainly provides fundadministration services for private equity funds. The purpose of this acquisition is to meet the diversified globalfund administration needs of its Japanese and overseas customers through the utilization of Capital Analytics IILLC’s unparalleled operational expertise and the MUFG Group’s extensive network. Upon conclusion of theacquisition, Capital Analytics II LLC was renamed MUFG Capital Analytics LLC. During the fiscal year endedMarch 31, 2017, measurement period adjustments were applied to the acquisition date fair values, whichdecreased goodwill by ¥115 million.
Krungsri’s Acquisition of Hattha Kaksekar Limited
On September 12, 2016, Krungsri acquired 100% ownership of Hattha Kaksekar Limited for¥15,703 million in cash, and thereby recorded goodwill of ¥8,280 million and intangible assets of ¥476 million.
Hattha Kaksekar Limited is a financial institution in Cambodia providing financial services primarily to soleproprietors. The purpose of this acquisition is to enable the MUFG Group to tap into the growth of theCambodian market by leveraging the knowhow of Ngern Tid Lor Co., Ltd., a subsidiary of Krungsri engaged inmicrofinance in Thailand, with an aim to promote and develop the microfinance business.
F-33

MITSUBISHI UFJ FINANCIAL GROUP, INC. AND SUBSIDIARIES
NOTES TO CONSOLIDATED FINANCIAL STATEMENTS—(Continued)
MUFG’s Acquisition of Hitachi Capital Corporation’s shares
On October 3, 2016, MUFG acquired 23.0% of the common shares of Hitachi Capital Corporation (“HitachiCapital”) for ¥91,877 million from Hitachi, Ltd. Considering both MUFG’s ownership of the common stock andrepresentation on the board of directors, the MUFG Group has determined that MUFG has the ability to exercisesignificant influence over the operating and financial policies of Hitachi Capital and applied the equity method ofaccounting for its investment.
Mitsubishi UFJ Trust and Banking’s Acquisition of Rydex Fund Services, LLC
On October 4, 2016, Mitsubishi UFJ Trust and Banking acquired 100% ownership of Rydex Fund Services,LLC for ¥17,431 million in cash, and thereby recorded goodwill of ¥5,232 million and intangible assets of¥11,507 million. Rydex Fund Services, LLC is an overseas fund management company that mainly providesfund administration services for funds established under the 1940 Investment Companies Act of the UnitedStates. The purpose of this acquisition is to meet the diversified global fund administration needs of its Japaneseand overseas customers through the utilization of Rydex Fund Services, LLC’s unparalleled operational expertiseand the MUFG Group’s extensive network. Upon conclusion of the acquisition, Rydex Fund Services, LLC wasrenamed MUFG Investor Services (US), LLC.
Mitsubishi UFJ NICOS Became a Wholly-Owned Subsidiary
On May 15, 2017, MUFG and its subsidiary Mitsubishi UFJ NICOS entered into a share exchangeagreement for MUFG to acquire the remaining 15.02% ownership of Mitsubishi UFJ NICOS by agreeing, onOctober 2, 2017, to pay ¥50,000 million cash to the only holder of Mitsubishi UFJ NICOS common stock otherthan MUFG. The transaction was accounted for as a non-cancellable forward purchase contract. Accordingly, aliability of ¥50,000 million was recognized in Other liabilities on the accompanying consolidated balance sheetwith a corresponding reduction in Noncontrolling interests of ¥15,390 million and Capital surplus of¥34,751 million, and an increase in Accumulated OCI, net of taxes of ¥141 million. On October 2, 2017, MUFGsettled Other liabilities of ¥50,000 million. The purpose of making a wholly-owned subsidiary is to effect a shiftin posture enabling a more flexible response to changes in the business environment and the swift pursuit ofgroup synergies.
Acquisition of shares in Bank Danamon in Indonesia
On December 26, 2017, MUFG Bank entered into conditional share purchase agreements with AsiaFinancial (Indonesia) Pte. Ltd. (“AFI”) and other affiliated entities (the “Sellers”) to acquire their 73.8% equityinterests in an Indonesian bank, PT Bank Danamon Indonesia, Tbk. (“Danamon”), subject to applicableregulatory approvals.
Danamon, which was established in 1956, is the fifth most profitable Indonesian commercial bank in termsof net income. Danamon provides banking and financial products and services to consumer, micro-finance, smalland medium enterprise (“SME”) and corporate customers, with a network of around 1,800 offices in Indonesia.
MUFG Bank intends to establish an integrated and comprehensive services platform that serves as agateway for clients wishing to make inroads into Indonesia’s growing economy as well as local companiesseeking to expand into the region. This investment is also expected to strategically allow MUFG Bank to benefitfrom Danamon’s foothold in the developing local retail and SME segments to deepen its banking franchise inIndonesia.
F-34

MITSUBISHI UFJ FINANCIAL GROUP, INC. AND SUBSIDIARIES
NOTES TO CONSOLIDATED FINANCIAL STATEMENTS—(Continued)
This strategic investment by MUFG Bank will be executed through three steps (the “ProposedTransaction”), and the completion of the Proposed Transaction will result in MUFG Bank becoming the largestshareholder in Danamon and Danamon becoming a consolidated subsidiary of MUFG Bank.
In Step 1, MUFG Bank acquired an initial 19.9% equity interest in Danamon from the Sellers onDecember 29, 2017, based on a price of IDR 8,323 (approximately ¥70(1)) per share, for an investment amount ofIDR 15,875 billion (approximately ¥133 billion(1)). The price was based on a price book-value ratio of 2.0calculated on the basis of Danamon’s net assets as of September 30, 2017 with certain adjustments applied. AFIcontinues to be the majority shareholder in Danamon after closing of Step 1. MUFG Bank classified Danamon’sequity securities as Available-for-sale securities on the acquisition date.
In Step 2, MUFG Bank acquired an additional 20.1% equity interest in Danamon from the Sellers onAugust 3, 2018, based on a price of IDR 8,921 (approximately ¥69(2)) per share, for an investment amount ofIDR 17,187 billion (approximately ¥132.3 billion(2)). The price was based on a price book-value ratio of 2.0calculated on the basis of Danamon’s net assets as of June 30, 2018 with certain adjustments applied. As a result,equity interest in Danamon increased to 40%, and MUFG Bank started to apply the equity method of accountingfor its investment in Danamon during the six months ended September 30, 2018.
In Step 3, MUFG Bank intends to seek the necessary approvals to increase its equity interest in Danamonbeyond the 40%, and this will provide an opportunity for all other existing Danamon shareholders to either remainas shareholders or receive cash from MUFG Bank. With the closing of Step 3, MUFG Bank’s final equity interest inDanamon is expected to be above 73.8%. The prices for Danamon’s shares in Step 3 will be based on a similarapproach as Step 1 and Step 2. See Note 35 for further developments on acquisition of shares in Danamon.
Notes:(1) Calculated based on the exchange rate of IDR1 = ¥0.0084(2) Calculated based on the exchange rate of IDR1 = ¥0.0077
Acquisition of Colonial First State Global Asset Management
On October 31, 2018, Mitsubishi UFJ Trust and Banking entered into a Share Sale Deed withCommonwealth Bank of Australia (“CBA”), and its wholly-owned subsidiary, Colonial First State GroupLimited (the “Seller”) to acquire 100% of the shares in each of nine subsidiaries of the Seller, which collectivelyrepresent CBA’s global asset management business known as Colonial First State Global Asset Management(“CFSGAM”), for approximately ¥328 billion or approximately AUD 4.0 billion, subject to applicable regulatoryand other approvals and certain conditions.
CFSGAM is the third largest asset management group by assets under management in Asian marketsexcluding Japan, offers a wide range of products including equities, fixed income and alternatives, and hasspecialist capabilities in Asian and emerging equity markets, alternatives (property and infrastructure), as well aspassive and other products. The investment in CFSGAM aims to meet various client needs by expanding productlineup and enhancing presence as the largest asset management firm in the Asia and Oceania region.
Acquisition of DVB Bank SE’s Aviation Finance Division
On March 1, 2019, MUFG Bank and its consolidated subsidiary, BOT Lease Co., Ltd. (“BOT Lease”),entered into an agreement with DVB Bank SE (“DVB”) to transfer DVB’s aviation finance division to MUFGBank and BOT Lease, subject to applicable regulatory and other approvals and certain conditions. Under theagreement, the entire aviation finance client lending portfolio of approximately ¥716.3 billion or approximately€5.6 billion, employees, and other parts of the operating infrastructure will be transferred to MUFG Bank. Inaddition, DVB’s aviation investment management and asset management businesses will be transferred to anewly established subsidiary of BOT Lease.
F-35
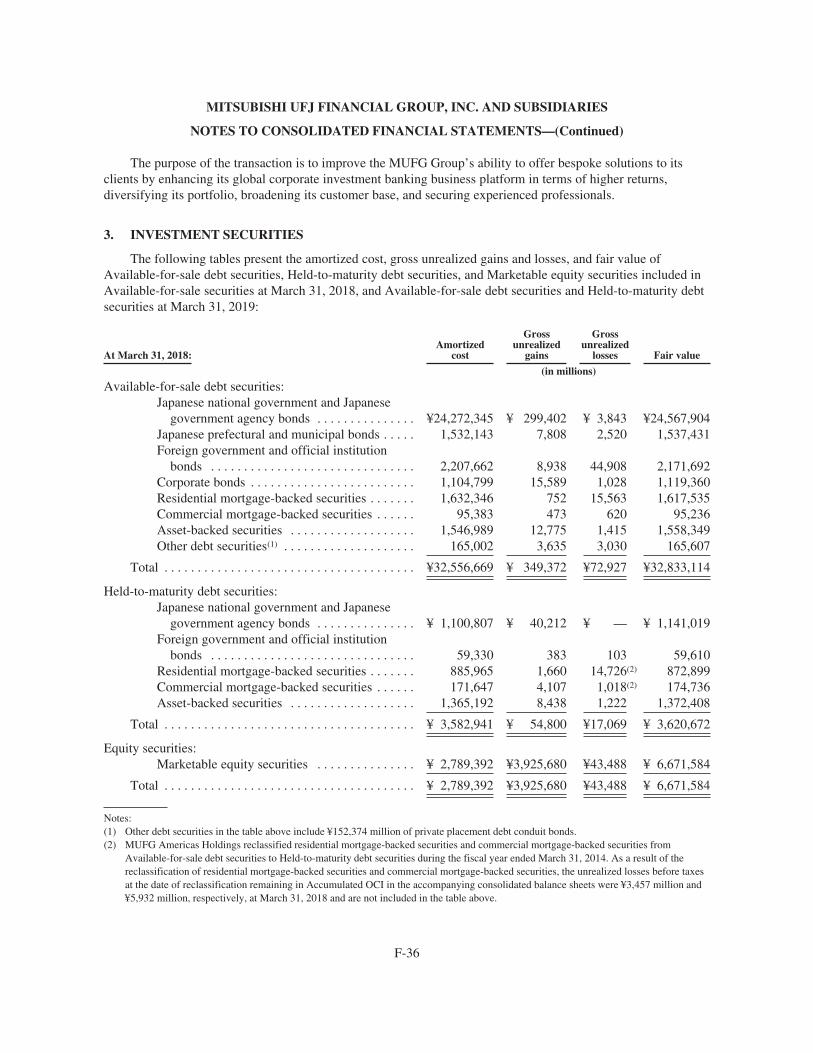
MITSUBISHI UFJ FINANCIAL GROUP, INC. AND SUBSIDIARIES
NOTES TO CONSOLIDATED FINANCIAL STATEMENTS—(Continued)
The purpose of the transaction is to improve the MUFG Group’s ability to offer bespoke solutions to itsclients by enhancing its global corporate investment banking business platform in terms of higher returns,diversifying its portfolio, broadening its customer base, and securing experienced professionals.
3. INVESTMENT SECURITIES
The following tables present the amortized cost, gross unrealized gains and losses, and fair value ofAvailable-for-sale debt securities, Held-to-maturity debt securities, and Marketable equity securities included inAvailable-for-sale securities at March 31, 2018, and Available-for-sale debt securities and Held-to-maturity debtsecurities at March 31, 2019:
At March 31, 2018:Amortized
cost
Grossunrealized
gains
Grossunrealized
losses Fair value
(in millions)
Available-for-sale debt securities:Japanese national government and Japanese
government agency bonds . . . . . . . . . . . . . . . ¥24,272,345 ¥ 299,402 ¥ 3,843 ¥24,567,904Japanese prefectural and municipal bonds . . . . . 1,532,143 7,808 2,520 1,537,431Foreign government and official institution
bonds . . . . . . . . . . . . . . . . . . . . . . . . . . . . . . . 2,207,662 8,938 44,908 2,171,692Corporate bonds . . . . . . . . . . . . . . . . . . . . . . . . . 1,104,799 15,589 1,028 1,119,360Residential mortgage-backed securities . . . . . . . 1,632,346 752 15,563 1,617,535Commercial mortgage-backed securities . . . . . . 95,383 473 620 95,236Asset-backed securities . . . . . . . . . . . . . . . . . . . 1,546,989 12,775 1,415 1,558,349Other debt securities(1) . . . . . . . . . . . . . . . . . . . . 165,002 3,635 3,030 165,607
Total . . . . . . . . . . . . . . . . . . . . . . . . . . . . . . . . . . . . . . ¥32,556,669 ¥ 349,372 ¥72,927 ¥32,833,114
Held-to-maturity debt securities:Japanese national government and Japanese
government agency bonds . . . . . . . . . . . . . . . ¥ 1,100,807 ¥ 40,212 ¥ — ¥ 1,141,019Foreign government and official institution
bonds . . . . . . . . . . . . . . . . . . . . . . . . . . . . . . . 59,330 383 103 59,610Residential mortgage-backed securities . . . . . . . 885,965 1,660 14,726(2) 872,899Commercial mortgage-backed securities . . . . . . 171,647 4,107 1,018(2) 174,736Asset-backed securities . . . . . . . . . . . . . . . . . . . 1,365,192 8,438 1,222 1,372,408
Total . . . . . . . . . . . . . . . . . . . . . . . . . . . . . . . . . . . . . . ¥ 3,582,941 ¥ 54,800 ¥17,069 ¥ 3,620,672
Equity securities:Marketable equity securities . . . . . . . . . . . . . . . ¥ 2,789,392 ¥3,925,680 ¥43,488 ¥ 6,671,584
Total . . . . . . . . . . . . . . . . . . . . . . . . . . . . . . . . . . . . . . ¥ 2,789,392 ¥3,925,680 ¥43,488 ¥ 6,671,584
Notes:(1) Other debt securities in the table above include ¥152,374 million of private placement debt conduit bonds.(2) MUFG Americas Holdings reclassified residential mortgage-backed securities and commercial mortgage-backed securities from
Available-for-sale debt securities to Held-to-maturity debt securities during the fiscal year ended March 31, 2014. As a result of thereclassification of residential mortgage-backed securities and commercial mortgage-backed securities, the unrealized losses before taxesat the date of reclassification remaining in Accumulated OCI in the accompanying consolidated balance sheets were ¥3,457 million and¥5,932 million, respectively, at March 31, 2018 and are not included in the table above.
F-36

MITSUBISHI UFJ FINANCIAL GROUP, INC. AND SUBSIDIARIES
NOTES TO CONSOLIDATED FINANCIAL STATEMENTS—(Continued)
At March 31, 2019:Amortized
cost
Grossunrealized
gains
Grossunrealized
losses Fair value
(in millions)
Available-for-sale debt securities:Japanese national government and Japanese
government agency bonds . . . . . . . . . . . . . . . ¥23,748,558 ¥ 330,115 ¥ 977 ¥24,077,696Japanese prefectural and municipal bonds . . . . . 2,203,978 22,593 5 2,226,566Foreign government and official institution
bonds . . . . . . . . . . . . . . . . . . . . . . . . . . . . . . . 2,648,874 18,099 25,554 2,641,419Corporate bonds . . . . . . . . . . . . . . . . . . . . . . . . . 1,117,302 14,251 822 1,130,731Residential mortgage-backed securities . . . . . . . 1,635,220 1,469 21,338 1,615,351Commercial mortgage-backed securities . . . . . . 132,996 310 2,351 130,955Asset-backed securities . . . . . . . . . . . . . . . . . . . 1,494,629 10,846 2,553 1,502,922Other debt securities(1) . . . . . . . . . . . . . . . . . . . . 192,930 2,851 2,918 192,863
Total . . . . . . . . . . . . . . . . . . . . . . . . . . . . . . . . . . . . . . ¥33,174,487 ¥ 400,534 ¥56,518 ¥33,518,503
Held-to-maturity debt securities:Japanese national government and Japanese
government agency bonds . . . . . . . . . . . . . . . ¥ 1,100,701 ¥ 41,619 ¥ — ¥ 1,142,320Foreign government and official institution
bonds . . . . . . . . . . . . . . . . . . . . . . . . . . . . . . . 138,731 193 212 138,712Residential mortgage-backed securities . . . . . . . 910,990 1,209 21,202(2) 890,997Commercial mortgage-backed securities . . . . . . 160,267 1,903 2,032(2) 160,138Asset-backed securities . . . . . . . . . . . . . . . . . . . 2,131,212 1,415 11,847 2,120,780
Total . . . . . . . . . . . . . . . . . . . . . . . . . . . . . . . . . . . . . . ¥ 4,441,901 ¥ 46,339 ¥35,293 ¥ 4,452,947
Notes:(1) Other debt securities in the table above mainly include ¥112,822 million of private placement debt conduit bonds.(2) MUFG Americas Holdings reclassified residential mortgage-backed securities and commercial mortgage-backed securities from
Available-for-sale debt securities to Held-to-maturity debt securities. As a result of the reclassification of residential mortgage-backedsecurities and commercial mortgage-backed securities, the unrealized losses before taxes at the date of reclassification remaining inAccumulated OCI in the accompanying consolidated balance sheets were ¥10,591 million and ¥4,667 million, respectively, at March 31,2019 and are not included in the table above.
F-37

MITSUBISHI UFJ FINANCIAL GROUP, INC. AND SUBSIDIARIES
NOTES TO CONSOLIDATED FINANCIAL STATEMENTS—(Continued)
Contractual Maturities
The amortized cost and fair values of Held-to-maturity debt securities and the fair values ofAvailable-for-sale debt securities at March 31, 2019 by contractual maturity are shown below. Expectedmaturities may be shorter than contractual maturities because issuers of debt securities may have the right to callor prepay obligations with or without penalties. Debt securities not due at a single maturity date and securitiesembedded with call or prepayment options, such as mortgage-backed securities, are included in the table belowbased on their contractual maturities.
Held-to-maturity debtsecurities
Available-for-saledebt securities
Amortizedcost Fair value Fair value
(in millions)
Due in one year or less . . . . . . . . . . . . . . . . . . . . . . . . . . . . . . . . . . . . ¥ 74,173 ¥ 74,059 ¥12,539,746Due from one year to five years . . . . . . . . . . . . . . . . . . . . . . . . . . . . . 332,491 341,814 10,847,990Due from five years to ten years . . . . . . . . . . . . . . . . . . . . . . . . . . . . . 1,405,140 1,434,699 5,316,284Due after ten years . . . . . . . . . . . . . . . . . . . . . . . . . . . . . . . . . . . . . . . 2,630,097 2,602,375 4,814,483
Total . . . . . . . . . . . . . . . . . . . . . . . . . . . . . . . . . . . . . . . . . . . . . . . . . . ¥4,441,901 ¥4,452,947 ¥33,518,503
Realized Gains and Losses and Transfers of Investment Securities
For the fiscal years ended March 31, 2017 and 2018, gross realized gains on sales of Available-for-sale debtsecurities and marketable equity securities were ¥367,548 million and ¥330,508 million, respectively, and grossrealized losses on sales of Available-for-sale debt securities and marketable equity securities were¥63,031 million and ¥49,290 million, respectively.
For the fiscal year ended March 31, 2019, gross realized gains on sales of Available-for-sale debt securitieswere ¥45,244 million and gross realized losses on sales of Available-for-sale debt securities were¥16,541 million.
For the fiscal year ended March 31, 2017, the MUFG Group transferred certain securities which had acarrying value of ¥14,142 million from Held-to-maturity securities to Available-for-sale securities in response tothe Volcker Rule of the Dodd-Frank Act. These securities were sold and the MUFG Group recorded a profit of¥669 million for the fiscal year ended March 31, 2017. The transfer was in accordance with the circumstancesconsistent with a Held-to-maturity classification, therefore, management has determined the transfer out ofHeld-to-maturity is consistent with the original designation and does not taint the remaining portfolio.
Other-than-temporary Impairments of Investment Securities
For the fiscal years ended March 31, 2017 and 2018, losses resulting from impairment of investmentsecurities to reflect the decline in value considered to be other-than-temporary were ¥33,823 million and¥8,196 million, respectively, which were included in Investment securities gains (losses)—net in theaccompanying consolidated statements of income. The losses of ¥33,823 million for the fiscal year endedMarch 31, 2017 included losses of ¥32,038 million from marketable equity securities, ¥741 million fromAvailable-for-sale debt securities which mainly comprised of corporate bonds, and ¥1,044 million fromnonmarketable equity securities. The losses of ¥8,196 million for the fiscal year ended March 31, 2018 includedlosses of ¥6,660 million from marketable equity securities, ¥114 million from Available-for-sale debt securitieswhich mainly comprised of corporate bonds, and ¥1,422 million from nonmarketable equity securities.
F-38

MITSUBISHI UFJ FINANCIAL GROUP, INC. AND SUBSIDIARIES
NOTES TO CONSOLIDATED FINANCIAL STATEMENTS—(Continued)
For the fiscal year ended March 31, 2019, losses resulting from impairment of investment securities toreflect the decline in value considered to be other-than-temporary were ¥606 million, which were included inInvestment securities gains (losses)—net in the accompanying consolidated statements of income. The losses of¥606 million for the fiscal year ended March 31, 2019 was recorded substantially from Available-for-sale debtsecurities which mainly comprised of corporate bonds. Impairment of marketable equity securities is eliminatedaccording to new guidance on recognition and measurement of financial assets and financial liabilities. TheAvailable-for-sale securities (AFS category) is eliminated for equity securities and, therefore, OTTI review is notrequired for those securities.
Gross Unrealized Losses and Fair Value
The following tables show the gross unrealized losses and fair value of Available-for-sale debt securities,Held-to-maturity debt securities and Equity securities at March 31, 2018, and Available-for-sale debt securities,Held-to-maturity debt securities at March 31, 2019, by length of time that individual securities in each categoryhave been in a continuous loss position:
Less than 12 months 12 months or more Total
At March 31, 2018: Fair value
Grossunrealized
losses Fair value
Grossunrealized
losses Fair value
Grossunrealized
lossesNumber ofsecurities
(in millions, except number of securities)Available-for-sale debt securities:
Japanese national governmentand Japanese governmentagency bonds . . . . . . . . . . . ¥4,767,893 ¥ 2,701 ¥ 187,000 ¥ 1,142 ¥ 4,954,893 ¥ 3,843 140
Japanese prefectural andmunicipal bonds . . . . . . . . . 400,705 453 353,047 2,067 753,752 2,520 193
Foreign government andofficial institution bonds . . 846,818 16,955 818,937 27,953 1,665,755 44,908 157
Corporate bonds . . . . . . . . . . . 312,993 856 74,717 172 387,710 1,028 150Residential mortgage-backed
securities . . . . . . . . . . . . . . 438,545 2,644 623,285 12,919 1,061,830 15,563 503Commercial mortgage-backed
securities . . . . . . . . . . . . . . 50,898 386 9,067 234 59,965 620 60Asset-backed securities . . . . . 144,073 1,403 5,345 12 149,418 1,415 29Other debt securities . . . . . . . 12,341 367 56,117 2,663 68,458 3,030 23
Total . . . . . . . . . . . . . . . . . . . . . . . . ¥6,974,266 ¥25,765 ¥2,127,515 ¥47,162 ¥ 9,101,781 ¥72,927 1,255
Held-to-maturity debt securities:Foreign government and
official institution bonds . . ¥ 55,837 ¥ 103 ¥ — ¥ — ¥ 55,837 ¥ 103 10Residential mortgage-backed
securities . . . . . . . . . . . . . . 299,286 3,487 451,968 11,239 751,254 14,726 332Commercial mortgage-backed
securities . . . . . . . . . . . . . . 2,150 2 169,065 1,016 171,215 1,018 32Asset-backed securities . . . . . 275,814 1,222 — — 275,814 1,222 11
Total . . . . . . . . . . . . . . . . . . . . . . . . ¥ 633,087 ¥ 4,814 ¥ 621,033 ¥12,255 ¥ 1,254,120 ¥17,069 385
Equity securities:Marketable equity
securities . . . . . . . . . . . . . . ¥ 448,489 ¥43,482 ¥ 28 ¥ 6 ¥ 448,517 ¥43,488 116
Total . . . . . . . . . . . . . . . . . . . . . . . . ¥ 448,489 ¥43,482 ¥ 28 ¥ 6 ¥ 448,517 ¥43,488 116
F-39
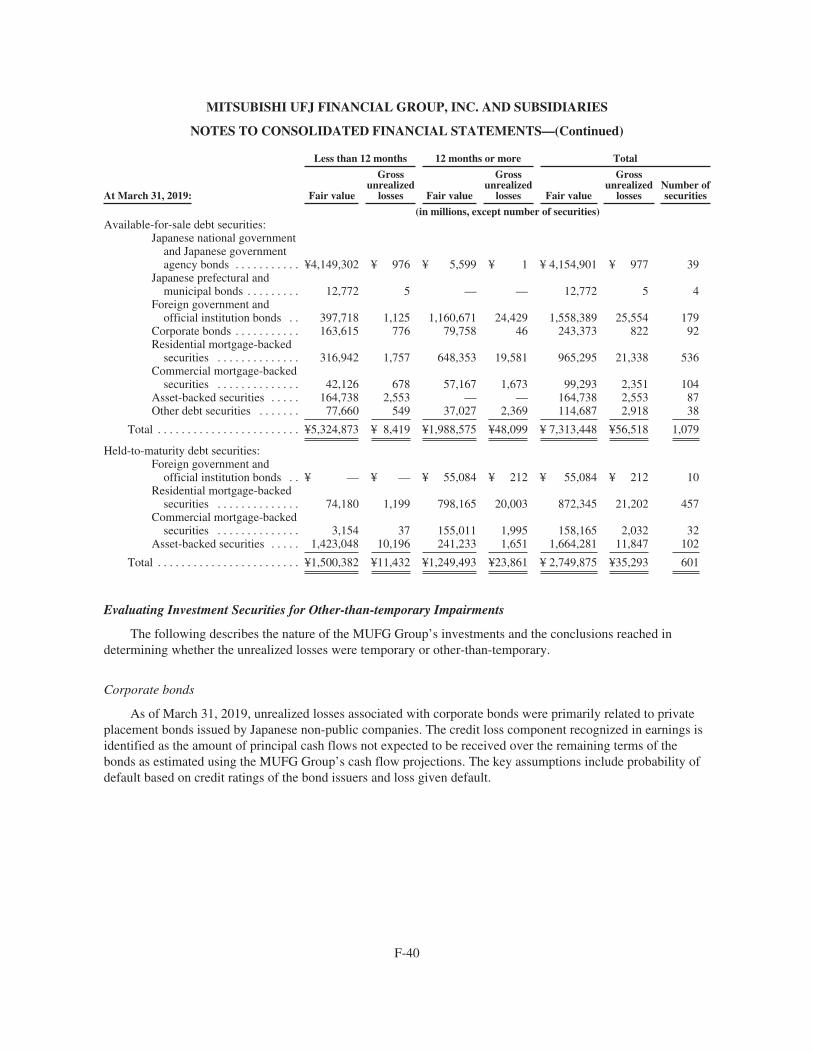
MITSUBISHI UFJ FINANCIAL GROUP, INC. AND SUBSIDIARIES
NOTES TO CONSOLIDATED FINANCIAL STATEMENTS—(Continued)
Less than 12 months 12 months or more Total
At March 31, 2019: Fair value
Grossunrealized
losses Fair value
Grossunrealized
losses Fair value
Grossunrealized
lossesNumber ofsecurities
(in millions, except number of securities)Available-for-sale debt securities:
Japanese national governmentand Japanese governmentagency bonds . . . . . . . . . . . ¥4,149,302 ¥ 976 ¥ 5,599 ¥ 1 ¥ 4,154,901 ¥ 977 39
Japanese prefectural andmunicipal bonds . . . . . . . . . 12,772 5 — — 12,772 5 4
Foreign government andofficial institution bonds . . 397,718 1,125 1,160,671 24,429 1,558,389 25,554 179
Corporate bonds . . . . . . . . . . . 163,615 776 79,758 46 243,373 822 92Residential mortgage-backed
securities . . . . . . . . . . . . . . 316,942 1,757 648,353 19,581 965,295 21,338 536Commercial mortgage-backed
securities . . . . . . . . . . . . . . 42,126 678 57,167 1,673 99,293 2,351 104Asset-backed securities . . . . . 164,738 2,553 — — 164,738 2,553 87Other debt securities . . . . . . . 77,660 549 37,027 2,369 114,687 2,918 38
Total . . . . . . . . . . . . . . . . . . . . . . . . ¥5,324,873 ¥ 8,419 ¥1,988,575 ¥48,099 ¥ 7,313,448 ¥56,518 1,079
Held-to-maturity debt securities:Foreign government and
official institution bonds . . ¥ — ¥ — ¥ 55,084 ¥ 212 ¥ 55,084 ¥ 212 10Residential mortgage-backed
securities . . . . . . . . . . . . . . 74,180 1,199 798,165 20,003 872,345 21,202 457Commercial mortgage-backed
securities . . . . . . . . . . . . . . 3,154 37 155,011 1,995 158,165 2,032 32Asset-backed securities . . . . . 1,423,048 10,196 241,233 1,651 1,664,281 11,847 102
Total . . . . . . . . . . . . . . . . . . . . . . . . ¥1,500,382 ¥11,432 ¥1,249,493 ¥23,861 ¥ 2,749,875 ¥35,293 601
Evaluating Investment Securities for Other-than-temporary Impairments
The following describes the nature of the MUFG Group’s investments and the conclusions reached indetermining whether the unrealized losses were temporary or other-than-temporary.
Corporate bonds
As of March 31, 2019, unrealized losses associated with corporate bonds were primarily related to privateplacement bonds issued by Japanese non-public companies. The credit loss component recognized in earnings isidentified as the amount of principal cash flows not expected to be received over the remaining terms of thebonds as estimated using the MUFG Group’s cash flow projections. The key assumptions include probability ofdefault based on credit ratings of the bond issuers and loss given default.
F-40
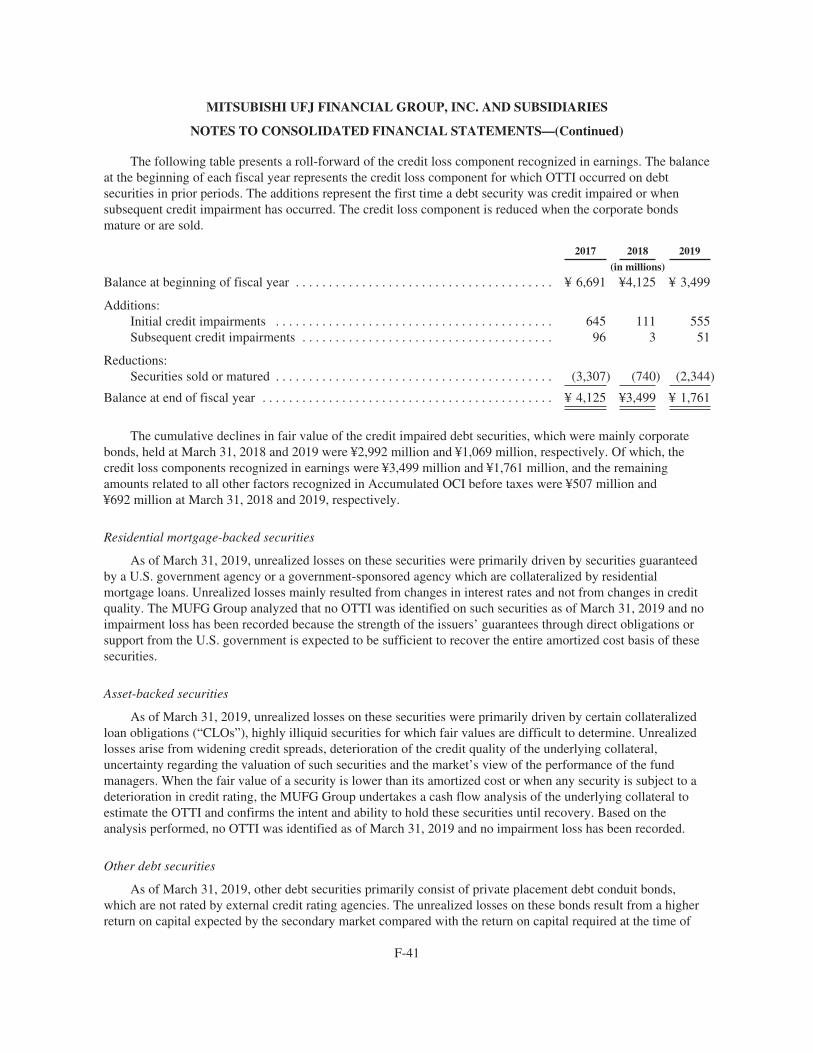
MITSUBISHI UFJ FINANCIAL GROUP, INC. AND SUBSIDIARIES
NOTES TO CONSOLIDATED FINANCIAL STATEMENTS—(Continued)
The following table presents a roll-forward of the credit loss component recognized in earnings. The balanceat the beginning of each fiscal year represents the credit loss component for which OTTI occurred on debtsecurities in prior periods. The additions represent the first time a debt security was credit impaired or whensubsequent credit impairment has occurred. The credit loss component is reduced when the corporate bondsmature or are sold.
2017 2018 2019
(in millions)
Balance at beginning of fiscal year . . . . . . . . . . . . . . . . . . . . . . . . . . . . . . . . . . . . . . . ¥ 6,691 ¥4,125 ¥ 3,499
Additions:Initial credit impairments . . . . . . . . . . . . . . . . . . . . . . . . . . . . . . . . . . . . . . . . . . 645 111 555Subsequent credit impairments . . . . . . . . . . . . . . . . . . . . . . . . . . . . . . . . . . . . . . 96 3 51
Reductions:Securities sold or matured . . . . . . . . . . . . . . . . . . . . . . . . . . . . . . . . . . . . . . . . . . (3,307) (740) (2,344)
Balance at end of fiscal year . . . . . . . . . . . . . . . . . . . . . . . . . . . . . . . . . . . . . . . . . . . . ¥ 4,125 ¥3,499 ¥ 1,761
The cumulative declines in fair value of the credit impaired debt securities, which were mainly corporatebonds, held at March 31, 2018 and 2019 were ¥2,992 million and ¥1,069 million, respectively. Of which, thecredit loss components recognized in earnings were ¥3,499 million and ¥1,761 million, and the remainingamounts related to all other factors recognized in Accumulated OCI before taxes were ¥507 million and¥692 million at March 31, 2018 and 2019, respectively.
Residential mortgage-backed securities
As of March 31, 2019, unrealized losses on these securities were primarily driven by securities guaranteedby a U.S. government agency or a government-sponsored agency which are collateralized by residentialmortgage loans. Unrealized losses mainly resulted from changes in interest rates and not from changes in creditquality. The MUFG Group analyzed that no OTTI was identified on such securities as of March 31, 2019 and noimpairment loss has been recorded because the strength of the issuers’ guarantees through direct obligations orsupport from the U.S. government is expected to be sufficient to recover the entire amortized cost basis of thesesecurities.
Asset-backed securities
As of March 31, 2019, unrealized losses on these securities were primarily driven by certain collateralizedloan obligations (“CLOs”), highly illiquid securities for which fair values are difficult to determine. Unrealizedlosses arise from widening credit spreads, deterioration of the credit quality of the underlying collateral,uncertainty regarding the valuation of such securities and the market’s view of the performance of the fundmanagers. When the fair value of a security is lower than its amortized cost or when any security is subject to adeterioration in credit rating, the MUFG Group undertakes a cash flow analysis of the underlying collateral toestimate the OTTI and confirms the intent and ability to hold these securities until recovery. Based on theanalysis performed, no OTTI was identified as of March 31, 2019 and no impairment loss has been recorded.
Other debt securities
As of March 31, 2019, other debt securities primarily consist of private placement debt conduit bonds,which are not rated by external credit rating agencies. The unrealized losses on these bonds result from a higherreturn on capital expected by the secondary market compared with the return on capital required at the time of
F-41
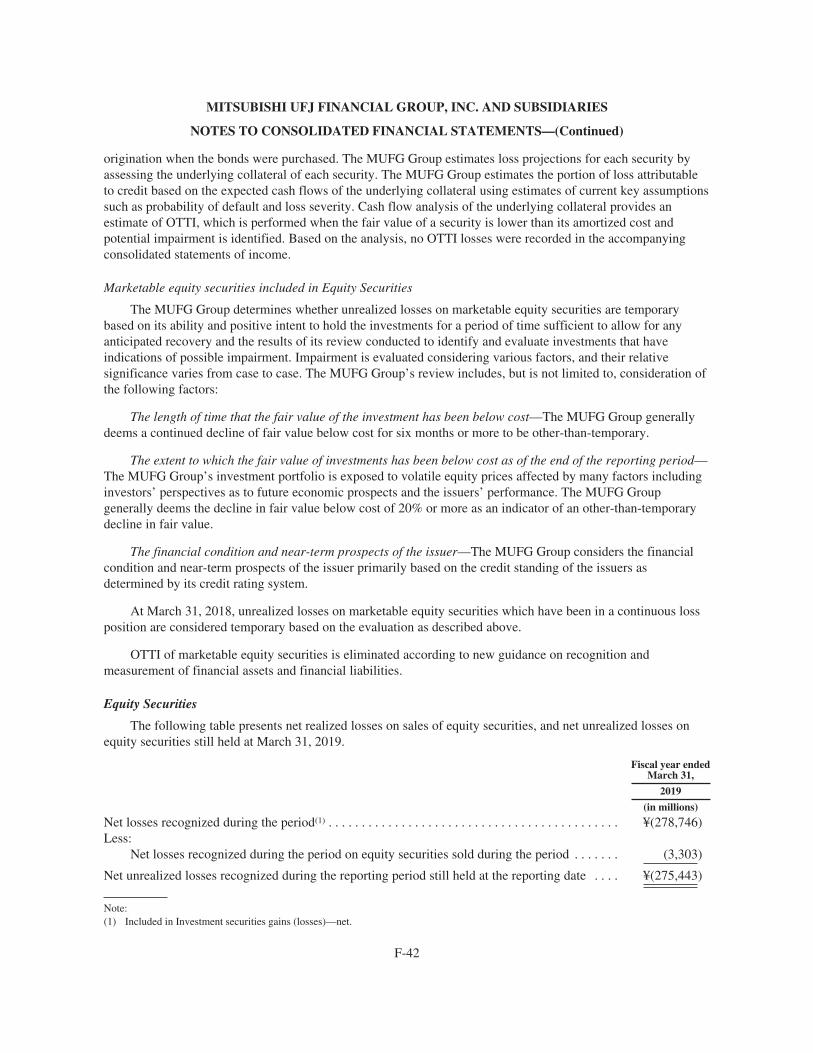
MITSUBISHI UFJ FINANCIAL GROUP, INC. AND SUBSIDIARIES
NOTES TO CONSOLIDATED FINANCIAL STATEMENTS—(Continued)
origination when the bonds were purchased. The MUFG Group estimates loss projections for each security byassessing the underlying collateral of each security. The MUFG Group estimates the portion of loss attributableto credit based on the expected cash flows of the underlying collateral using estimates of current key assumptionssuch as probability of default and loss severity. Cash flow analysis of the underlying collateral provides anestimate of OTTI, which is performed when the fair value of a security is lower than its amortized cost andpotential impairment is identified. Based on the analysis, no OTTI losses were recorded in the accompanyingconsolidated statements of income.
Marketable equity securities included in Equity Securities
The MUFG Group determines whether unrealized losses on marketable equity securities are temporarybased on its ability and positive intent to hold the investments for a period of time sufficient to allow for anyanticipated recovery and the results of its review conducted to identify and evaluate investments that haveindications of possible impairment. Impairment is evaluated considering various factors, and their relativesignificance varies from case to case. The MUFG Group’s review includes, but is not limited to, consideration ofthe following factors:
The length of time that the fair value of the investment has been below cost—The MUFG Group generallydeems a continued decline of fair value below cost for six months or more to be other-than-temporary.
The extent to which the fair value of investments has been below cost as of the end of the reporting period—The MUFG Group’s investment portfolio is exposed to volatile equity prices affected by many factors includinginvestors’ perspectives as to future economic prospects and the issuers’ performance. The MUFG Groupgenerally deems the decline in fair value below cost of 20% or more as an indicator of an other-than-temporarydecline in fair value.
The financial condition and near-term prospects of the issuer—The MUFG Group considers the financialcondition and near-term prospects of the issuer primarily based on the credit standing of the issuers asdetermined by its credit rating system.
At March 31, 2018, unrealized losses on marketable equity securities which have been in a continuous lossposition are considered temporary based on the evaluation as described above.
OTTI of marketable equity securities is eliminated according to new guidance on recognition andmeasurement of financial assets and financial liabilities.
Equity Securities
The following table presents net realized losses on sales of equity securities, and net unrealized losses onequity securities still held at March 31, 2019.
Fiscal year endedMarch 31,
2019
(in millions)
Net losses recognized during the period(1) . . . . . . . . . . . . . . . . . . . . . . . . . . . . . . . . . . . . . . . . . . . . ¥(278,746)Less:
Net losses recognized during the period on equity securities sold during the period . . . . . . . (3,303)
Net unrealized losses recognized during the reporting period still held at the reporting date . . . . ¥(275,443)
Note:(1) Included in Investment securities gains (losses)—net.
F-42
MITSUBISHI UFJ FINANCIAL GROUP, INC. AND SUBSIDIARIES
NOTES TO CONSOLIDATED FINANCIAL STATEMENTS—(Continued)
Nonmarketable Equity Securities
Nonmarketable equity securities included in Equity securities were primarily carried at cost of¥538,251 million at March 31, 2018, because their fair values were not readily determinable.
The remaining balances were nonmarketable equity securities included in Equity securities held by certainsubsidiaries subject to specialized industry accounting principles for investment companies and broker-dealersand carried at fair value of ¥28,359 million at March 31, 2018. See Note 32 for the valuation techniques andinputs used to estimate the fair values.
With respect to cost-method investments of ¥97,586 million at March 31, 2018, the MUFG Group estimateda fair value using commonly accepted valuation techniques to determine whether the investments were impairedin each reporting period. See Note 32 for the details of these commonly accepted valuation techniques. If the fairvalue of the investment is less than the cost of the investment, the MUFG Group proceeds to evaluate whetherthe impairment is other-than-temporary.
With respect to cost-method investments of ¥440,665 million at March 31, 2018, the MUFG Groupperformed a test to determine whether any impairment indicators existed for each investment in each reportingperiod. If an impairment indicator exists, the MUFG Group estimates the fair value of the cost-methodinvestment. If the fair value of the investment is less than the cost of the investment, the MUFG Group performsan evaluation of whether the impairment is other-than-temporary. The primary method the MUFG Group uses toidentify impairment indicators is a comparison of the MUFG Group’s share of an investee’s net assets to the costof the MUFG Group’s investment in the investee. The MUFG Group also considers whether significant adversechanges in the regulatory, economic or technological environment have occurred with respect to the investee.The MUFG Group periodically monitors the status of each investee including the credit rating, which is generallyupdated once a year based on the annual financial statements of the issuer. In addition, if an event that couldimpact the credit rating of an investee occurs, the MUFG Group reassesses the appropriateness of the creditrating assigned to the issuer in order to maintain an updated credit rating. The MUFG Group did not estimate thefair value of cost-method investments, which had aggregated costs of ¥437,486 million at March 31, 2018, sinceit was not practical and the MUFG Group identified no impairment indicators.
Based on the procedures described above, the MUFG Group recognized OTTI losses on the cost-methodinvestments of ¥1,044 million and ¥1,422 million for the fiscal years ended March 31, 2017 and 2018,respectively. Each impairment loss was recognized based on the specific circumstances of each individualcompany. No impairment loss was individually material.
F-43

MITSUBISHI UFJ FINANCIAL GROUP, INC. AND SUBSIDIARIES
NOTES TO CONSOLIDATED FINANCIAL STATEMENTS—(Continued)
Measurement Alternative of Equity Securities
The following table presents the carrying value of nonmarketable equity securities held at March 31, 2019,that were measured under the measurement alternative, and the related adjustments for these securities for thefiscal year ended March 31, 2019.
Fiscal year endedMarch 31,
2019
(in millions)
Measurement alternative balance at March 31, 2019 . . . . . . . . . . . . . . . . . . . . . . . . . . . . . . . . . . . ¥ 563,733Measurement alternative impairment losses(1) . . . . . . . . . . . . . . . . . . . . . . . . . . . . . . . . . . . . . . . . ¥ (2,292)Measurement alternative downward changes for observable prices(1)(2) . . . . . . . . . . . . . . . . . . . . ¥ —Measurement alternative upward changes for observable prices(1)(2)(3) . . . . . . . . . . . . . . . . . . . . . ¥ 53,077
Notes:(1) Included in Investment securities gains (losses)—net.(2) Under the measurement alternative, nonmarketable equity securities are carried at cost plus or minus changes resulting from observable
prices in orderly transactions for the identical or a similar investment of the same issuer.(3) The MUFG Group applied measurement alternative upward changes to certain nonmarketable equity securities, resulting from
observable prices in orderly transactions, such as partial repurchase and transactions by other entities.
4. LOANS AND ALLOWANCE FOR CREDIT LOSSES
Loans at March 31, 2018 and 2019 by domicile and industry of the borrower are summarized below.Classification of loans by industry is based on the industry segment loan classifications as defined by the Bank ofJapan.
2018 2019
(in millions)
Domestic:Manufacturing . . . . . . . . . . . . . . . . . . . . . . . . . . . . . . . . . . . . . . . . . . . . . . . . . ¥ 10,876,625 ¥ 11,153,996Construction . . . . . . . . . . . . . . . . . . . . . . . . . . . . . . . . . . . . . . . . . . . . . . . . . . 781,262 717,664Real estate . . . . . . . . . . . . . . . . . . . . . . . . . . . . . . . . . . . . . . . . . . . . . . . . . . . . 11,763,769 11,706,419Services . . . . . . . . . . . . . . . . . . . . . . . . . . . . . . . . . . . . . . . . . . . . . . . . . . . . . . 2,689,086 2,653,191Wholesale and retail . . . . . . . . . . . . . . . . . . . . . . . . . . . . . . . . . . . . . . . . . . . . 7,989,080 7,643,397Banks and other financial institutions(1) . . . . . . . . . . . . . . . . . . . . . . . . . . . . . 4,818,364 5,213,020Communication and information services . . . . . . . . . . . . . . . . . . . . . . . . . . . 1,551,533 1,510,596Other industries . . . . . . . . . . . . . . . . . . . . . . . . . . . . . . . . . . . . . . . . . . . . . . . . 8,939,291 8,756,483Consumer . . . . . . . . . . . . . . . . . . . . . . . . . . . . . . . . . . . . . . . . . . . . . . . . . . . . 16,287,332 15,802,024
Total domestic . . . . . . . . . . . . . . . . . . . . . . . . . . . . . . . . . . . . . . . . . . . . . 65,696,342 65,156,790
Foreign:Governments and official institutions . . . . . . . . . . . . . . . . . . . . . . . . . . . . . . . 920,538 841,695Banks and other financial institutions(1) . . . . . . . . . . . . . . . . . . . . . . . . . . . . . 12,851,570 11,641,373Commercial and industrial . . . . . . . . . . . . . . . . . . . . . . . . . . . . . . . . . . . . . . . 30,591,173 31,951,169Other . . . . . . . . . . . . . . . . . . . . . . . . . . . . . . . . . . . . . . . . . . . . . . . . . . . . . . . . 7,270,928 7,597,502
Total foreign . . . . . . . . . . . . . . . . . . . . . . . . . . . . . . . . . . . . . . . . . . . . . . 51,634,209 52,031,739
Unearned income, unamortized premiums—net and deferred loan fees—net . . . . (294,656) (304,588)
Total(2) . . . . . . . . . . . . . . . . . . . . . . . . . . . . . . . . . . . . . . . . . . . . . . . . . . . ¥117,035,895 ¥116,883,941
F-44

MITSUBISHI UFJ FINANCIAL GROUP, INC. AND SUBSIDIARIES
NOTES TO CONSOLIDATED FINANCIAL STATEMENTS—(Continued)
Notes:(1) Loans to so-called “non-bank finance companies” are generally included in the “Banks and other financial institutions” category.
Non-bank finance companies are primarily engaged in consumer lending, factoring and credit card businesses.(2) The above table includes loans held for sale of ¥226,923 million and ¥291,794 million at March 31, 2018 and 2019, respectively.
The MUFG Group classifies its loan portfolio into the following portfolio segments—Commercial,Residential, Card, MUFG Americas Holdings, and Krungsri based on the grouping used by the MUFG Group todetermine the allowance for credit losses. See Note 1 for further information.
Nonaccrual Loans
Originated loans are generally placed on nonaccrual status when substantial doubt exists as to the full andtimely collection of either principal or interest, when principal or interest is contractually past due one month ormore with respect to loans within all classes of the Commercial segment, three months or more with respect toloans within the Card, MUFG Americas Holdings, and Krungsri segments, and six months or more with respectto loans within the Residential segment. See Note 1 for further information.
The nonaccrual loans by class at March 31, 2018 and 2019 is shown below:
2018 2019
(in millions)Commercial
Domestic . . . . . . . . . . . . . . . . . . . . . . . . . . . . . . . . . . . . . . . . . . . . . . . . . . . . . . . . . . . . . . . . . . . . . . ¥332,994 ¥272,777Manufacturing . . . . . . . . . . . . . . . . . . . . . . . . . . . . . . . . . . . . . . . . . . . . . . . . . . . . . . . . . . . . . . 77,163 65,896Construction . . . . . . . . . . . . . . . . . . . . . . . . . . . . . . . . . . . . . . . . . . . . . . . . . . . . . . . . . . . . . . . 10,791 9,813Real estate . . . . . . . . . . . . . . . . . . . . . . . . . . . . . . . . . . . . . . . . . . . . . . . . . . . . . . . . . . . . . . . . . 33,317 23,152Services . . . . . . . . . . . . . . . . . . . . . . . . . . . . . . . . . . . . . . . . . . . . . . . . . . . . . . . . . . . . . . . . . . . 30,717 26,188Wholesale and retail . . . . . . . . . . . . . . . . . . . . . . . . . . . . . . . . . . . . . . . . . . . . . . . . . . . . . . . . . 108,175 94,531Banks and other financial institutions . . . . . . . . . . . . . . . . . . . . . . . . . . . . . . . . . . . . . . . . . . . . 1,145 898Communication and information services . . . . . . . . . . . . . . . . . . . . . . . . . . . . . . . . . . . . . . . . 13,815 11,955Other industries . . . . . . . . . . . . . . . . . . . . . . . . . . . . . . . . . . . . . . . . . . . . . . . . . . . . . . . . . . . . . 37,549 25,406Consumer . . . . . . . . . . . . . . . . . . . . . . . . . . . . . . . . . . . . . . . . . . . . . . . . . . . . . . . . . . . . . . . . . 20,322 14,938
Foreign-excluding MUAH and Krungsri . . . . . . . . . . . . . . . . . . . . . . . . . . . . . . . . . . . . . . . . . . . . . 109,516 111,002Residential . . . . . . . . . . . . . . . . . . . . . . . . . . . . . . . . . . . . . . . . . . . . . . . . . . . . . . . . . . . . . . . . . . . . . . . . 69,464 68,499Card . . . . . . . . . . . . . . . . . . . . . . . . . . . . . . . . . . . . . . . . . . . . . . . . . . . . . . . . . . . . . . . . . . . . . . . . . . . . . 61,387 61,419MUAH . . . . . . . . . . . . . . . . . . . . . . . . . . . . . . . . . . . . . . . . . . . . . . . . . . . . . . . . . . . . . . . . . . . . . . . . . . . 52,282 46,549Krungsri . . . . . . . . . . . . . . . . . . . . . . . . . . . . . . . . . . . . . . . . . . . . . . . . . . . . . . . . . . . . . . . . . . . . . . . . . . 121,286 127,424
Total(1) . . . . . . . . . . . . . . . . . . . . . . . . . . . . . . . . . . . . . . . . . . . . . . . . . . . . . . . . . . . . . . . . . . . . . . . . . . . . ¥746,929 ¥687,670
Note:(1) The above table does not include loans held for sale of ¥61 million and ¥12,702 million at March 31, 2018 and 2019, respectively, and
loans acquired with deteriorated credit quality of ¥6,659 million and ¥6,284 million at March 31, 2018 and 2019, respectively.
F-45

MITSUBISHI UFJ FINANCIAL GROUP, INC. AND SUBSIDIARIES
NOTES TO CONSOLIDATED FINANCIAL STATEMENTS—(Continued)
Impaired Loans
The MUFG Group’s impaired loans primarily include nonaccrual loans and TDRs. The following tableshows information about impaired loans by class at March 31, 2018 and 2019:
Recorded Loan Balance
At March 31, 2018:
Requiringan Allowance for
Credit Losses
Not Requiringan Allowance forCredit Losses(1) Total(2)
UnpaidPrincipalBalance
RelatedAllowance forCredit Losses
(in millions)Commercial
Domestic . . . . . . . . . . . . . . . . . . . . . . ¥ 626,469 ¥188,984 ¥ 815,453 ¥ 875,795 ¥331,851Manufacturing . . . . . . . . . . . . . . 361,268 36,566 397,834 408,124 166,098Construction . . . . . . . . . . . . . . . . 10,936 7,172 18,108 18,490 7,921Real estate . . . . . . . . . . . . . . . . . 43,553 23,053 66,606 71,809 10,665Services . . . . . . . . . . . . . . . . . . . 38,097 16,600 54,697 59,335 25,890Wholesale and retail . . . . . . . . . 128,661 49,628 178,289 189,404 94,832Banks and other financial
institutions . . . . . . . . . . . . . . . 1,125 26 1,151 1,151 972Communication and information
services . . . . . . . . . . . . . . . . . 18,782 7,852 26,634 28,082 16,041Other industries . . . . . . . . . . . . . 12,978 34,282 47,260 67,525 5,350Consumer . . . . . . . . . . . . . . . . . . 11,069 13,805 24,874 31,875 4,082
Foreign-excluding MUAH andKrungsri . . . . . . . . . . . . . . . . . . . . . 122,243 40,249 162,492 190,518 82,855
Loans acquired with deterioratedcredit quality . . . . . . . . . . . . . . . . . 7,837 — 7,837 15,470 4,324
Residential(4) . . . . . . . . . . . . . . . . . . . . . . . 105,089 6,261 111,350 134,777 16,928Card(4) . . . . . . . . . . . . . . . . . . . . . . . . . . . . 66,964 388 67,352 74,840 21,223MUAH(4) . . . . . . . . . . . . . . . . . . . . . . . . . . 48,895 33,650 82,545 94,565 7,743Krungsri(4) . . . . . . . . . . . . . . . . . . . . . . . . . 58,529 25,565 84,094 90,957 29,402
Total(3) . . . . . . . . . . . . . . . . . . . . . . . . . . . . ¥1,036,026 ¥295,097 ¥1,331,123 ¥1,476,922 ¥494,326
F-46

MITSUBISHI UFJ FINANCIAL GROUP, INC. AND SUBSIDIARIES
NOTES TO CONSOLIDATED FINANCIAL STATEMENTS—(Continued)
Recorded Loan Balance
At March 31, 2019:
Requiringan Allowance for
Credit Losses
Not Requiringan Allowance forCredit Losses(1) Total(2)
UnpaidPrincipalBalance
RelatedAllowance forCredit Losses
(in millions)Commercial
Domestic . . . . . . . . . . . . . . . . . . . . . . ¥560,474 ¥157,465 ¥ 717,939 ¥ 759,399 ¥227,004Manufacturing . . . . . . . . . . . . . . 349,597 28,189 377,786 384,306 92,919Construction . . . . . . . . . . . . . . . . 8,366 5,975 14,341 14,779 6,574Real estate . . . . . . . . . . . . . . . . . 20,848 29,961 50,809 55,943 5,704Services . . . . . . . . . . . . . . . . . . . 30,239 13,020 43,259 46,838 20,059Wholesale and retail . . . . . . . . . 118,253 45,620 163,873 175,714 84,503Banks and other financial
institutions . . . . . . . . . . . . . . . 1,012 21 1,033 1,033 830Communication and information
services . . . . . . . . . . . . . . . . . 8,794 6,929 15,723 16,587 6,817Other industries . . . . . . . . . . . . . 13,772 17,989 31,761 38,342 6,874Consumer . . . . . . . . . . . . . . . . . . 9,593 9,761 19,354 25,857 2,724
Foreign-excluding MUAH andKrungsri . . . . . . . . . . . . . . . . . . . . . 127,521 34,484 162,005 183,133 85,966
Loans acquired with deterioratedcredit quality . . . . . . . . . . . . . . . . . 8,136 — 8,136 14,990 5,450
Residential(4) . . . . . . . . . . . . . . . . . . . . . . . 97,176 6,495 103,671 120,526 14,357Card(4) . . . . . . . . . . . . . . . . . . . . . . . . . . . . 64,691 330 65,021 72,226 21,829MUAH(4) . . . . . . . . . . . . . . . . . . . . . . . . . . 46,552 23,208 69,760 83,300 8,294Krungsri(4) . . . . . . . . . . . . . . . . . . . . . . . . . 57,066 26,193 83,259 90,377 28,254
Total(3) . . . . . . . . . . . . . . . . . . . . . . . . . . . . ¥961,616 ¥248,175 ¥1,209,791 ¥1,323,951 ¥391,154
Notes:(1) These loans do not require an allowance for credit losses because the recorded loan balance equals, or does not exceed, the present value
of expected future cash flows discounted at the loans’ original effective interest rate, loans’ observable market price, or the fair value ofthe collateral if the loan is a collateral-dependent loan.
(2) Included in impaired loans at March 31, 2018 and 2019 are accrual TDRs as follows: ¥536,748 million and ¥497,013 million—Commercial; ¥40,734 million and ¥34,449 million—Residential; ¥28,541 million and ¥26,183 million—Card; ¥39,333 million and¥33,155 million—MUFG Americas Holdings; and ¥24,899 million and ¥26,851 million—Krungsri, respectively.
(3) In addition to impaired loans presented in the above table, there were impaired loans held for sale of ¥61 million and ¥12,702 million atMarch 31, 2018 and 2019, respectively.
(4) Impaired Loans for Residential, Card, MUAH and Krungsri segments in the above table include loans acquired with deteriorated creditquality.
F-47
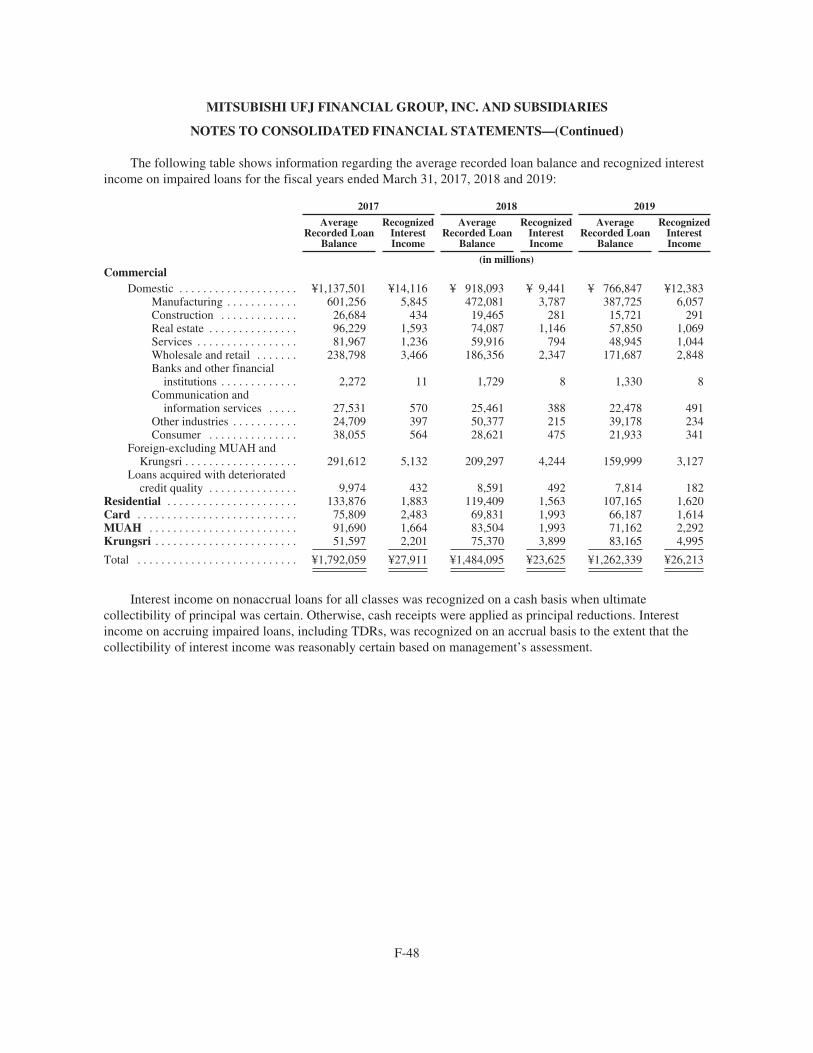
MITSUBISHI UFJ FINANCIAL GROUP, INC. AND SUBSIDIARIES
NOTES TO CONSOLIDATED FINANCIAL STATEMENTS—(Continued)
The following table shows information regarding the average recorded loan balance and recognized interestincome on impaired loans for the fiscal years ended March 31, 2017, 2018 and 2019:
2017 2018 2019
AverageRecorded Loan
Balance
RecognizedInterestIncome
AverageRecorded Loan
Balance
RecognizedInterestIncome
AverageRecorded Loan
Balance
RecognizedInterestIncome
(in millions)Commercial
Domestic . . . . . . . . . . . . . . . . . . . . ¥1,137,501 ¥14,116 ¥ 918,093 ¥ 9,441 ¥ 766,847 ¥12,383Manufacturing . . . . . . . . . . . . 601,256 5,845 472,081 3,787 387,725 6,057Construction . . . . . . . . . . . . . 26,684 434 19,465 281 15,721 291Real estate . . . . . . . . . . . . . . . 96,229 1,593 74,087 1,146 57,850 1,069Services . . . . . . . . . . . . . . . . . 81,967 1,236 59,916 794 48,945 1,044Wholesale and retail . . . . . . . 238,798 3,466 186,356 2,347 171,687 2,848Banks and other financial
institutions . . . . . . . . . . . . . 2,272 11 1,729 8 1,330 8Communication and
information services . . . . . 27,531 570 25,461 388 22,478 491Other industries . . . . . . . . . . . 24,709 397 50,377 215 39,178 234Consumer . . . . . . . . . . . . . . . 38,055 564 28,621 475 21,933 341
Foreign-excluding MUAH andKrungsri . . . . . . . . . . . . . . . . . . . 291,612 5,132 209,297 4,244 159,999 3,127
Loans acquired with deterioratedcredit quality . . . . . . . . . . . . . . . 9,974 432 8,591 492 7,814 182
Residential . . . . . . . . . . . . . . . . . . . . . . 133,876 1,883 119,409 1,563 107,165 1,620Card . . . . . . . . . . . . . . . . . . . . . . . . . . . 75,809 2,483 69,831 1,993 66,187 1,614MUAH . . . . . . . . . . . . . . . . . . . . . . . . . 91,690 1,664 83,504 1,993 71,162 2,292Krungsri . . . . . . . . . . . . . . . . . . . . . . . . 51,597 2,201 75,370 3,899 83,165 4,995
Total . . . . . . . . . . . . . . . . . . . . . . . . . . . ¥1,792,059 ¥27,911 ¥1,484,095 ¥23,625 ¥1,262,339 ¥26,213
Interest income on nonaccrual loans for all classes was recognized on a cash basis when ultimatecollectibility of principal was certain. Otherwise, cash receipts were applied as principal reductions. Interestincome on accruing impaired loans, including TDRs, was recognized on an accrual basis to the extent that thecollectibility of interest income was reasonably certain based on management’s assessment.
F-48

MITSUBISHI UFJ FINANCIAL GROUP, INC. AND SUBSIDIARIES
NOTES TO CONSOLIDATED FINANCIAL STATEMENTS—(Continued)
The following table shows a roll-forward of accrual TDRs and other impaired loans (including nonaccrualTDRs) for the fiscal years ended March 31, 2017, 2018 and 2019:
2017 2018 2019
(in millions)
Accrual TDRs:Balance at beginning of fiscal year . . . . . . . . . . . . . . . . . . . . . . . . . . . . . . . ¥ 613,844 ¥ 819,819 ¥ 670,255
Additions (new accrual TDR status)(1) . . . . . . . . . . . . . . . . . . . . . . . . . 492,269 144,368 71,033Transfers to other impaired loans (including nonaccrual TDRs) . . . . . (40,182) (25,122) (19,053)Loans sold . . . . . . . . . . . . . . . . . . . . . . . . . . . . . . . . . . . . . . . . . . . . . . . (1,637) (39,378) (26)Principal payments and other . . . . . . . . . . . . . . . . . . . . . . . . . . . . . . . . (244,475) (229,432) (104,558)
Balance at end of fiscal year(1) . . . . . . . . . . . . . . . . . . . . . . . . . . . . . . . . . . . ¥ 819,819 ¥ 670,255 ¥ 617,651
Other impaired loans (including nonaccrual TDRs):Balance at beginning of fiscal year . . . . . . . . . . . . . . . . . . . . . . . . . . . . . . . ¥1,111,306 ¥ 896,031 ¥ 660,868
Additions (new other impaired loans (including nonaccrual TDRs)status)(1)(2) . . . . . . . . . . . . . . . . . . . . . . . . . . . . . . . . . . . . . . . . . . . . . 541,789 281,275 222,003
Charge-off . . . . . . . . . . . . . . . . . . . . . . . . . . . . . . . . . . . . . . . . . . . . . . . (106,097) (98,355) (55,309)Transfers to accrual TDRs . . . . . . . . . . . . . . . . . . . . . . . . . . . . . . . . . . (333,478) (43,858) (22,110)Loans sold . . . . . . . . . . . . . . . . . . . . . . . . . . . . . . . . . . . . . . . . . . . . . . . (44,984) (31,581) (26,022)Principal payments and other . . . . . . . . . . . . . . . . . . . . . . . . . . . . . . . . (272,505) (342,644) (187,290)
Balance at end of fiscal year(1) . . . . . . . . . . . . . . . . . . . . . . . . . . . . . . . . . . . ¥ 896,031 ¥ 660,868 ¥ 592,140
Notes:(1) For the fiscal year ended March 31, 2017, lease receivables of ¥875 million and ¥74 million in the Krungsri segment, which were accrual
TDRs and nonaccrual TDRs, respectively, are excluded from the additions of accrual TDRs and other impaired loans, respectively, andthe related ending balances of such TDRs amounting to ¥4,065 million and ¥389 million, are also excluded from the balance of accrualTDRs and other impaired loans, respectively, as of March 31, 2017. For the fiscal year ended March 31, 2018, lease receivables of¥1,809 million and ¥113 million in the Krungsri segment, which were accrual TDRs and nonaccrual TDRs, respectively, are excludedfrom the additions of accrual TDRs and other impaired loans, respectively, and the related ending balances of such TDRs amounting to¥4,282 million and ¥1,286 million, are also excluded from the balance of accrual TDRs and other impaired loans, respectively, as ofMarch 31, 2018. For the fiscal year ended March 31, 2019, lease receivables of ¥2,947 million and ¥2,088 million in the Krungsrisegment, which were accrual TDRs and nonaccrual TDRs, respectively, are excluded from the additions of accrual TDRs and otherimpaired loans, respectively, and the related ending balances of such TDRs amounting to ¥5,060 million and ¥3,361 million, are alsoexcluded from the balance of accrual TDRs and other impaired loans, respectively, as of March 31, 2019.
(2) Included in the additions of other impaired loans for the fiscal years ended March 31, 2017, 2018 and 2019 are nonaccrual TDRs asfollows: ¥11,699 million, ¥12,002 million and ¥13,493 million—Card; ¥25,023 million, ¥12,799 million and ¥12,738 million—MUFGAmericas Holdings; and ¥7,471 million, ¥12,280 million and ¥10,519 million—Krungsri, respectively.
F-49

MITSUBISHI UFJ FINANCIAL GROUP, INC. AND SUBSIDIARIES
NOTES TO CONSOLIDATED FINANCIAL STATEMENTS—(Continued)
Troubled Debt Restructurings
The following table summarizes the MUFG Group’s TDRs by class for the fiscal years ended March 31,2017, 2018 and 2019:
2017 2018 2019
Troubled Debt Restructurings
Pre-ModificationOutstanding
RecordedInvestment
Post-ModificationOutstanding
RecordedInvestment
Pre-ModificationOutstanding
RecordedInvestment
Post-ModificationOutstanding
RecordedInvestment
Pre-ModificationOutstanding
RecordedInvestment
Post-ModificationOutstanding
RecordedInvestment
(in millions)
Commercial(1)(3)
Domestic . . . . . . . . . . . . ¥377,563 ¥377,563 ¥ 70,380 ¥ 69,021 ¥ 36,693 ¥ 36,693Manufacturing . . . . 335,347 335,347 35,954 35,954 11,654 11,654Construction . . . . . 1,377 1,377 1,020 1,020 703 703Real estate . . . . . . . 7,457 7,457 1,269 1,269 948 948Services . . . . . . . . . 5,268 5,268 4,139 4,139 2,141 2,141Wholesale and
retail . . . . . . . . . 22,868 22,868 16,280 14,921 19,315 19,315Banks and other
financialinstitutions . . . . . — — 246 246 — —
Communicationand informationservices . . . . . . . 2,405 2,405 9,643 9,643 268 268
Other industries . . . 1,493 1,493 761 761 472 472Consumer . . . . . . . 1,348 1,348 1,068 1,068 1,192 1,192
Foreign-excludingMUAH andKrungsri . . . . . . . . . . . 58,178 58,178 25,522 25,522 5,692 5,692
Loans acquired withdeteriorated creditquality . . . . . . . . . . . . 1,030 1,030 — — 50 50
Residential(1)(3) . . . . . . . . . . . 13,092 13,092 9,763 9,763 7,379 7,379Card(2)(3) . . . . . . . . . . . . . . . . 17,256 16,759 17,436 16,912 19,685 18,837MUAH(2)(3) . . . . . . . . . . . . . . 38,558 38,449 40,578 38,224 19,837 19,837Krungsri(2)(3) . . . . . . . . . . . . . 32,340 32,340 24,015 23,929 24,392 24,330
Total . . . . . . . . . . . . . . . . . . . ¥538,017 ¥537,411 ¥187,694 ¥183,371 ¥113,728 ¥112,818
F-50
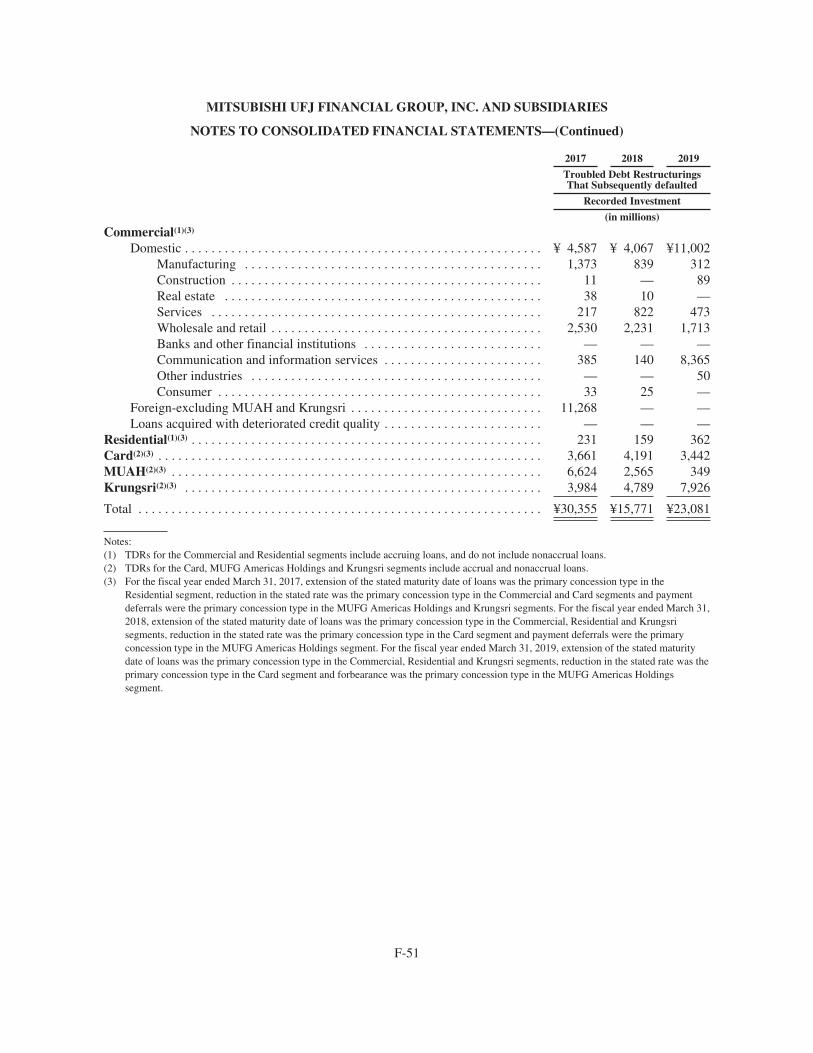
MITSUBISHI UFJ FINANCIAL GROUP, INC. AND SUBSIDIARIES
NOTES TO CONSOLIDATED FINANCIAL STATEMENTS—(Continued)
2017 2018 2019
Troubled Debt RestructuringsThat Subsequently defaulted
Recorded Investment
(in millions)
Commercial(1)(3)
Domestic . . . . . . . . . . . . . . . . . . . . . . . . . . . . . . . . . . . . . . . . . . . . . . . . . . . . . . ¥ 4,587 ¥ 4,067 ¥11,002Manufacturing . . . . . . . . . . . . . . . . . . . . . . . . . . . . . . . . . . . . . . . . . . . . . 1,373 839 312Construction . . . . . . . . . . . . . . . . . . . . . . . . . . . . . . . . . . . . . . . . . . . . . . . 11 — 89Real estate . . . . . . . . . . . . . . . . . . . . . . . . . . . . . . . . . . . . . . . . . . . . . . . . 38 10 —Services . . . . . . . . . . . . . . . . . . . . . . . . . . . . . . . . . . . . . . . . . . . . . . . . . . 217 822 473Wholesale and retail . . . . . . . . . . . . . . . . . . . . . . . . . . . . . . . . . . . . . . . . . 2,530 2,231 1,713Banks and other financial institutions . . . . . . . . . . . . . . . . . . . . . . . . . . . — — —Communication and information services . . . . . . . . . . . . . . . . . . . . . . . . 385 140 8,365Other industries . . . . . . . . . . . . . . . . . . . . . . . . . . . . . . . . . . . . . . . . . . . . — — 50Consumer . . . . . . . . . . . . . . . . . . . . . . . . . . . . . . . . . . . . . . . . . . . . . . . . . 33 25 —
Foreign-excluding MUAH and Krungsri . . . . . . . . . . . . . . . . . . . . . . . . . . . . . 11,268 — —Loans acquired with deteriorated credit quality . . . . . . . . . . . . . . . . . . . . . . . . — — —
Residential(1)(3) . . . . . . . . . . . . . . . . . . . . . . . . . . . . . . . . . . . . . . . . . . . . . . . . . . . . . 231 159 362Card(2)(3) . . . . . . . . . . . . . . . . . . . . . . . . . . . . . . . . . . . . . . . . . . . . . . . . . . . . . . . . . . 3,661 4,191 3,442MUAH(2)(3) . . . . . . . . . . . . . . . . . . . . . . . . . . . . . . . . . . . . . . . . . . . . . . . . . . . . . . . . 6,624 2,565 349Krungsri(2)(3) . . . . . . . . . . . . . . . . . . . . . . . . . . . . . . . . . . . . . . . . . . . . . . . . . . . . . . 3,984 4,789 7,926
Total . . . . . . . . . . . . . . . . . . . . . . . . . . . . . . . . . . . . . . . . . . . . . . . . . . . . . . . . . . . . . ¥30,355 ¥15,771 ¥23,081
Notes:(1) TDRs for the Commercial and Residential segments include accruing loans, and do not include nonaccrual loans.(2) TDRs for the Card, MUFG Americas Holdings and Krungsri segments include accrual and nonaccrual loans.(3) For the fiscal year ended March 31, 2017, extension of the stated maturity date of loans was the primary concession type in the
Residential segment, reduction in the stated rate was the primary concession type in the Commercial and Card segments and paymentdeferrals were the primary concession type in the MUFG Americas Holdings and Krungsri segments. For the fiscal year ended March 31,2018, extension of the stated maturity date of loans was the primary concession type in the Commercial, Residential and Krungsrisegments, reduction in the stated rate was the primary concession type in the Card segment and payment deferrals were the primaryconcession type in the MUFG Americas Holdings segment. For the fiscal year ended March 31, 2019, extension of the stated maturitydate of loans was the primary concession type in the Commercial, Residential and Krungsri segments, reduction in the stated rate was theprimary concession type in the Card segment and forbearance was the primary concession type in the MUFG Americas Holdingssegment.
F-51

MITSUBISHI UFJ FINANCIAL GROUP, INC. AND SUBSIDIARIES
NOTES TO CONSOLIDATED FINANCIAL STATEMENTS—(Continued)
The following table summarizes outstanding recorded investment balances of TDRs by class atMarch 31, 2018 and 2019:
2018 2019
(in millions)
Commercial(1)
Domestic . . . . . . . . . . . . . . . . . . . . . . . . . . . . . . . . . . . . . . . . . . . . . . . . . . . . . . . . . . . . ¥482,566 ¥445,312Manufacturing . . . . . . . . . . . . . . . . . . . . . . . . . . . . . . . . . . . . . . . . . . . . . . . . . . . . 320,702 311,890Construction . . . . . . . . . . . . . . . . . . . . . . . . . . . . . . . . . . . . . . . . . . . . . . . . . . . . . 7,362 4,591Real estate . . . . . . . . . . . . . . . . . . . . . . . . . . . . . . . . . . . . . . . . . . . . . . . . . . . . . . . 33,289 27,657Services . . . . . . . . . . . . . . . . . . . . . . . . . . . . . . . . . . . . . . . . . . . . . . . . . . . . . . . . . 23,987 17,135Wholesale and retail . . . . . . . . . . . . . . . . . . . . . . . . . . . . . . . . . . . . . . . . . . . . . . . 70,119 69,350Banks and other financial institutions . . . . . . . . . . . . . . . . . . . . . . . . . . . . . . . . . . 6 135Communication and information services . . . . . . . . . . . . . . . . . . . . . . . . . . . . . . 12,837 3,780Other industries . . . . . . . . . . . . . . . . . . . . . . . . . . . . . . . . . . . . . . . . . . . . . . . . . . . 9,712 6,357Consumer . . . . . . . . . . . . . . . . . . . . . . . . . . . . . . . . . . . . . . . . . . . . . . . . . . . . . . . 4,552 4,417
Foreign-excluding MUAH and Krungsri . . . . . . . . . . . . . . . . . . . . . . . . . . . . . . . . . . . 54,182 51,701Residential(1) . . . . . . . . . . . . . . . . . . . . . . . . . . . . . . . . . . . . . . . . . . . . . . . . . . . . . . . . . . . . . 40,734 34,449Card(2) . . . . . . . . . . . . . . . . . . . . . . . . . . . . . . . . . . . . . . . . . . . . . . . . . . . . . . . . . . . . . . . . . . 67,352 65,021MUAH(2) . . . . . . . . . . . . . . . . . . . . . . . . . . . . . . . . . . . . . . . . . . . . . . . . . . . . . . . . . . . . . . . . 65,373 48,128Krungsri(2) . . . . . . . . . . . . . . . . . . . . . . . . . . . . . . . . . . . . . . . . . . . . . . . . . . . . . . . . . . . . . . 54,036 62,980
Total . . . . . . . . . . . . . . . . . . . . . . . . . . . . . . . . . . . . . . . . . . . . . . . . . . . . . . . . . . . . . . . . . . . ¥764,243 ¥707,591
Notes:(1) TDRs for the Commercial and Residential segments include accruing loans, and do not include nonaccrual loans.(2) TDRs for the Card, MUFG Americas Holdings and Krungsri segments include accrual and nonaccrual loans. Included in the outstanding
recorded investment balances as of March 31, 2018 and 2019 are nonaccrual TDRs as follows: ¥38,811 million and ¥38,838 million—Card; ¥26,040 million and ¥14,973 million—MUFG Americas Holdings; and ¥24,855 million and ¥31,069 million—Krungsri,respectively.
A modification of terms of a loan under a TDR mainly involves: (i) a reduction in the stated interest rateapplicable to the loan, (ii) an extension of the stated maturity date of the loan, (iii) a partial forgiveness of theprincipal of the loan, or (iv) a combination of all of these. Those loans are also considered impaired loans, andhence the allowance for credit losses is separately established for each loan. As a result, the amount of allowancefor credit losses increases in many cases upon classification as a TDR loan. The amount of pre-modificationoutstanding recorded investment and post-modification outstanding recorded investment may differ due to write-offs made as part of the concession. The impact of write-offs associated with TDRs on the MUFG Group’sresults of operations for the fiscal years ended March 31, 2017, 2018 and 2019 was not material.
TDRs for the Commercial and Residential segments in the above tables include accruing loans, and do notinclude nonaccrual loans. Once a loan is classified as a nonaccrual loan, a modification would have littlelikelihood of resulting in the recovery of the loan in view of the severity of the financial difficulty of theborrower. Therefore, even if a nonaccrual loan is modified, the loan continues to be classified as a nonaccrualloan. The vast majority of modifications to nonaccrual loans are temporary extensions of the maturity dates,typically for periods up to 90 days, and continually made as the borrower is unable to repay or refinance the loanat the extended maturity. Accordingly, the impact of such TDRs on the outstanding recorded investment isimmaterial, and the vast majority of nonaccrual TDRs have subsequently defaulted.
TDRs that subsequently defaulted in the Commercial and Residential segments in the above tables includethose accruing loans that became past due one month or more within the Commercial segment and six months or
F-52

MITSUBISHI UFJ FINANCIAL GROUP, INC. AND SUBSIDIARIES
NOTES TO CONSOLIDATED FINANCIAL STATEMENTS—(Continued)
more within the Residential segment, and those accruing loans reclassified to nonaccrual loans due to financialdifficulties even without delinquencies. This is because classification as a nonaccrual loan is regarded as defaultunder the MUFG Group’s credit policy. Also, the MUFG Group defines default as payment default for thepurpose of the disclosure.
In regards to the Card, MUFG Americas Holdings and Krungsri segments, the TDRs in the above tablesrepresent nonaccrual and accruing loans, and the defaulted loans in the above table represent nonaccruing andaccruing loans that became past due one month or more within the Card segment, 60 days or more within theMUFG Americas Holdings segment, and six months or more within the Krungsri segment.
Historical payment defaults are one of the factors considered when projecting future cash flows indetermining the allowance for credit losses for each segment.
The MUFG Group provided commitments to extend credit to customers with TDRs. The amounts of suchcommitments were ¥172,159 million and ¥169,819 million at March 31, 2018 and 2019, respectively. SeeNote 25 for further discussion of commitments to extend credit.
Credit Quality Indicator
Credit quality indicators of loans by class at March 31, 2018 and 2019 are shown below:
At March 31, 2018:
NormalCloseWatch
Likely to becomeBankrupt or
Legally/VirtuallyBankrupt Total(1)
(in millions)
CommercialDomestic . . . . . . . . . . . . . . . . . . . . . . . . . . . . . . ¥49,050,274 ¥1,690,924 ¥271,456 ¥51,012,654
Manufacturing . . . . . . . . . . . . . . . . . . . . . . 10,215,497 596,662 57,730 10,869,889Construction . . . . . . . . . . . . . . . . . . . . . . . 727,932 43,673 9,116 780,721Real estate . . . . . . . . . . . . . . . . . . . . . . . . . 11,379,291 279,931 32,692 11,691,914Services . . . . . . . . . . . . . . . . . . . . . . . . . . . 2,467,540 175,733 24,081 2,667,354Wholesale and retail . . . . . . . . . . . . . . . . . 7,518,383 374,706 77,870 7,970,959Banks and other financial institutions . . . . 4,800,281 10,923 1,145 4,812,349Communication and information
services . . . . . . . . . . . . . . . . . . . . . . . . . 1,491,093 48,153 11,958 1,551,204Other industries . . . . . . . . . . . . . . . . . . . . . 8,780,517 120,466 36,951 8,937,934Consumer . . . . . . . . . . . . . . . . . . . . . . . . . 1,669,740 40,677 19,913 1,730,330
Foreign-excluding MUAH and Krungsri . . . . . 36,049,123 569,137 108,276 36,726,536Loans acquired with deteriorated credit
quality . . . . . . . . . . . . . . . . . . . . . . . . . . . . . . 12,035 11,728 3,562 27,325
Total . . . . . . . . . . . . . . . . . . . . . . . . . . . . . ¥85,111,432 ¥2,271,789 ¥383,294 ¥87,766,515
Accrual Nonaccrual Total(1)
(in millions)
Residential . . . . . . . . . . . . . . . . . . . . . . . . . . . . . . . . . . . . . . . . . . . . . . . ¥14,012,978 ¥67,258 ¥14,080,236Card . . . . . . . . . . . . . . . . . . . . . . . . . . . . . . . . . . . . . . . . . . . . . . . . . . . . ¥ 528,108 ¥61,707 ¥ 589,815
F-53
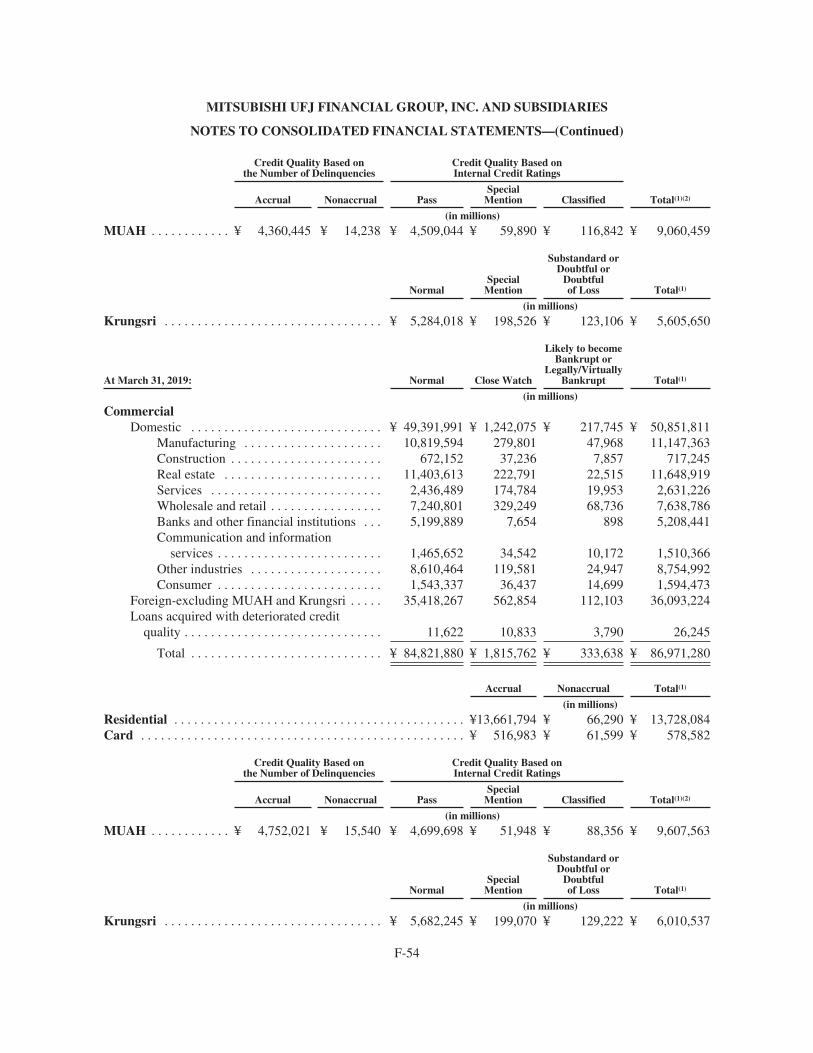
MITSUBISHI UFJ FINANCIAL GROUP, INC. AND SUBSIDIARIES
NOTES TO CONSOLIDATED FINANCIAL STATEMENTS—(Continued)
Credit Quality Based onthe Number of Delinquencies
Credit Quality Based onInternal Credit Ratings
Accrual Nonaccrual PassSpecial
Mention Classified Total(1)(2)
(in millions)
MUAH . . . . . . . . . . . . ¥ 4,360,445 ¥ 14,238 ¥ 4,509,044 ¥ 59,890 ¥ 116,842 ¥ 9,060,459
NormalSpecial
Mention
Substandard orDoubtful or
Doubtfulof Loss Total(1)
(in millions)
Krungsri . . . . . . . . . . . . . . . . . . . . . . . . . . . . . . . . . ¥ 5,284,018 ¥ 198,526 ¥ 123,106 ¥ 5,605,650
At March 31, 2019: Normal Close Watch
Likely to becomeBankrupt or
Legally/VirtuallyBankrupt Total(1)
(in millions)
CommercialDomestic . . . . . . . . . . . . . . . . . . . . . . . . . . . . . ¥ 49,391,991 ¥ 1,242,075 ¥ 217,745 ¥ 50,851,811
Manufacturing . . . . . . . . . . . . . . . . . . . . . 10,819,594 279,801 47,968 11,147,363Construction . . . . . . . . . . . . . . . . . . . . . . . 672,152 37,236 7,857 717,245Real estate . . . . . . . . . . . . . . . . . . . . . . . . 11,403,613 222,791 22,515 11,648,919Services . . . . . . . . . . . . . . . . . . . . . . . . . . 2,436,489 174,784 19,953 2,631,226Wholesale and retail . . . . . . . . . . . . . . . . . 7,240,801 329,249 68,736 7,638,786Banks and other financial institutions . . . 5,199,889 7,654 898 5,208,441Communication and information
services . . . . . . . . . . . . . . . . . . . . . . . . . 1,465,652 34,542 10,172 1,510,366Other industries . . . . . . . . . . . . . . . . . . . . 8,610,464 119,581 24,947 8,754,992Consumer . . . . . . . . . . . . . . . . . . . . . . . . . 1,543,337 36,437 14,699 1,594,473
Foreign-excluding MUAH and Krungsri . . . . . 35,418,267 562,854 112,103 36,093,224Loans acquired with deteriorated credit
quality . . . . . . . . . . . . . . . . . . . . . . . . . . . . . . 11,622 10,833 3,790 26,245
Total . . . . . . . . . . . . . . . . . . . . . . . . . . . . . ¥ 84,821,880 ¥ 1,815,762 ¥ 333,638 ¥ 86,971,280
Accrual Nonaccrual Total(1)
(in millions)
Residential . . . . . . . . . . . . . . . . . . . . . . . . . . . . . . . . . . . . . . . . . . . . ¥13,661,794 ¥ 66,290 ¥ 13,728,084Card . . . . . . . . . . . . . . . . . . . . . . . . . . . . . . . . . . . . . . . . . . . . . . . . . ¥ 516,983 ¥ 61,599 ¥ 578,582
Credit Quality Based onthe Number of Delinquencies
Credit Quality Based onInternal Credit Ratings
Accrual Nonaccrual PassSpecial
Mention Classified Total(1)(2)
(in millions)
MUAH . . . . . . . . . . . . ¥ 4,752,021 ¥ 15,540 ¥ 4,699,698 ¥ 51,948 ¥ 88,356 ¥ 9,607,563
NormalSpecial
Mention
Substandard orDoubtful or
Doubtfulof Loss Total(1)
(in millions)
Krungsri . . . . . . . . . . . . . . . . . . . . . . . . . . . . . . . . . ¥ 5,682,245 ¥ 199,070 ¥ 129,222 ¥ 6,010,537
F-54

MITSUBISHI UFJ FINANCIAL GROUP, INC. AND SUBSIDIARIES
NOTES TO CONSOLIDATED FINANCIAL STATEMENTS—(Continued)
Notes:(1) Total loans in the above table do not include loans held for sale, and represent balances without adjustments in relation to unearned
income, unamortized premiums and deferred loan fees.(2) Total loans of MUFG Americas Holdings do not include FDIC covered loans which are not individually rated totaling ¥953 million and
¥689 million as of March 31, 2018 and 2019, respectively. The MUFG Group will be reimbursed for a substantial portion of any futurelosses on FDIC covered loans under the terms of the FDIC loss share agreements.
The MUFG Group classifies loans into risk categories based on relevant information about the ability ofborrowers to service their debt, including, but not limited to, historical and current financial information,historical and current payment experience, credit documentation, public and non-public information aboutborrowers and current economic trends as deemed appropriate to each segment.
The primary credit quality indicator for loans within all classes of the Commercial segment is the internalcredit rating assigned to each borrower based on the MUFG Group’s internal borrower ratings of 1 through 15,with the rating of 1 assigned to a borrower with the highest quality of credit. When assigning a credit rating to aborrower, the MUFG Group evaluates the borrower’s expected debt-service capability based on variousinformation, including financial and operating information of the borrower as well as information on the industryin which the borrower operates, and the borrower’s business profile, management and compliance system. Inevaluating a borrower’s debt-service capability, the MUFG Group also conducts an assessment of the level ofearnings and an analysis of the borrower’s net worth. Based on the internal borrower rating, loans within theCommercial segment are categorized as Normal (internal borrower ratings of 1 through 9), Close Watch (internalborrower ratings of 10 through 12), and Likely to become Bankrupt or Legally/Virtually Bankrupt (internalborrower ratings of 13 through 15).
Loans to borrowers categorized as Normal represent those that are not deemed to have collectibility issues.
Loans to borrowers categorized as Close Watch represent those that require close monitoring as theborrower has begun to exhibit elements of potential concern with respect to its business performance andfinancial condition, the borrower has begun to exhibit elements of serious concern with respect to its businessperformance and financial condition, including business problems requiring long-term solutions, or theborrower’s loans are TDRs or loans contractually past due 90 days or more for special reasons.
Loans to borrowers categorized as Likely to become Bankrupt or Legally/Virtually Bankrupt represent thosethat have a higher probability of default than those categorized as Close Watch due to serious debt repaymentproblems with poor progress in achieving restructuring plans, the borrower being considered virtually bankruptwith no prospects for an improvement in business operations, or the borrower being legally bankrupt with noprospects for continued business operations because of non-payment, suspension of business, voluntaryliquidation or filing for legal liquidation.
The accrual status is a primary credit quality indicator for loans within the Residential segment, the Cardsegment and consumer loans within the MUFG Americas Holdings segment. The accrual status of these loans isdetermined based on the number of delinquent payments. See Note 1 for further details of categorization ofAccrual and Nonaccrual.
Commercial loans within the MUFG Americas Holdings segment are categorized as either pass or criticizedbased on the internal credit rating assigned to each borrower. Criticized credits are those that are internally riskgraded as Special Mention, Substandard or Doubtful. Special Mention credits are potentially weak, as theborrower has begun to exhibit deteriorating trends, which, if not corrected, may jeopardize repayment of the loanand result in further downgrade. Classified credits are those that are internally risk graded as Substandard or
F-55
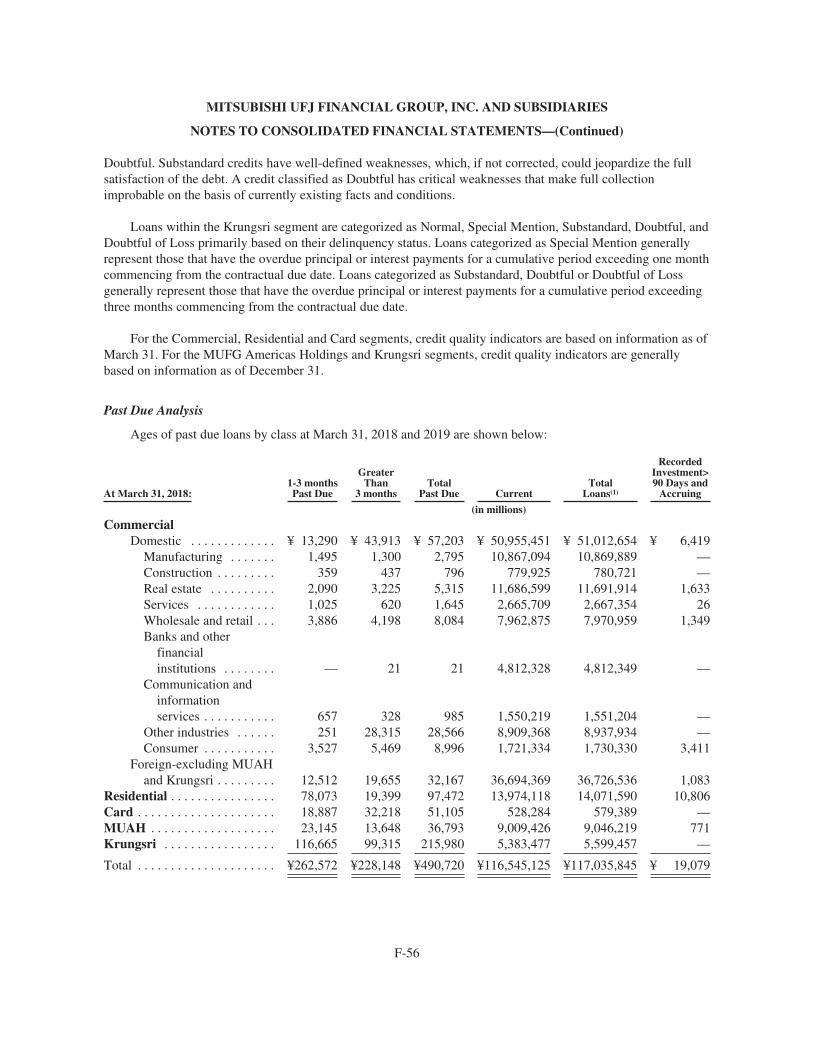
MITSUBISHI UFJ FINANCIAL GROUP, INC. AND SUBSIDIARIES
NOTES TO CONSOLIDATED FINANCIAL STATEMENTS—(Continued)
Doubtful. Substandard credits have well-defined weaknesses, which, if not corrected, could jeopardize the fullsatisfaction of the debt. A credit classified as Doubtful has critical weaknesses that make full collectionimprobable on the basis of currently existing facts and conditions.
Loans within the Krungsri segment are categorized as Normal, Special Mention, Substandard, Doubtful, andDoubtful of Loss primarily based on their delinquency status. Loans categorized as Special Mention generallyrepresent those that have the overdue principal or interest payments for a cumulative period exceeding one monthcommencing from the contractual due date. Loans categorized as Substandard, Doubtful or Doubtful of Lossgenerally represent those that have the overdue principal or interest payments for a cumulative period exceedingthree months commencing from the contractual due date.
For the Commercial, Residential and Card segments, credit quality indicators are based on information as ofMarch 31. For the MUFG Americas Holdings and Krungsri segments, credit quality indicators are generallybased on information as of December 31.
Past Due Analysis
Ages of past due loans by class at March 31, 2018 and 2019 are shown below:
At March 31, 2018:1-3 monthsPast Due
GreaterThan
3 monthsTotal
Past Due CurrentTotal
Loans(1)
RecordedInvestment>90 Days and
Accruing
(in millions)
CommercialDomestic . . . . . . . . . . . . . ¥ 13,290 ¥ 43,913 ¥ 57,203 ¥ 50,955,451 ¥ 51,012,654 ¥ 6,419
Manufacturing . . . . . . . 1,495 1,300 2,795 10,867,094 10,869,889 —Construction . . . . . . . . . 359 437 796 779,925 780,721 —Real estate . . . . . . . . . . 2,090 3,225 5,315 11,686,599 11,691,914 1,633Services . . . . . . . . . . . . 1,025 620 1,645 2,665,709 2,667,354 26Wholesale and retail . . . 3,886 4,198 8,084 7,962,875 7,970,959 1,349Banks and other
financialinstitutions . . . . . . . . — 21 21 4,812,328 4,812,349 —
Communication andinformationservices . . . . . . . . . . . 657 328 985 1,550,219 1,551,204 —
Other industries . . . . . . 251 28,315 28,566 8,909,368 8,937,934 —Consumer . . . . . . . . . . . 3,527 5,469 8,996 1,721,334 1,730,330 3,411
Foreign-excluding MUAHand Krungsri . . . . . . . . . 12,512 19,655 32,167 36,694,369 36,726,536 1,083
Residential . . . . . . . . . . . . . . . . 78,073 19,399 97,472 13,974,118 14,071,590 10,806Card . . . . . . . . . . . . . . . . . . . . . 18,887 32,218 51,105 528,284 579,389 —MUAH . . . . . . . . . . . . . . . . . . . 23,145 13,648 36,793 9,009,426 9,046,219 771Krungsri . . . . . . . . . . . . . . . . . 116,665 99,315 215,980 5,383,477 5,599,457 —
Total . . . . . . . . . . . . . . . . . . . . . ¥262,572 ¥228,148 ¥490,720 ¥116,545,125 ¥117,035,845 ¥ 19,079
F-56
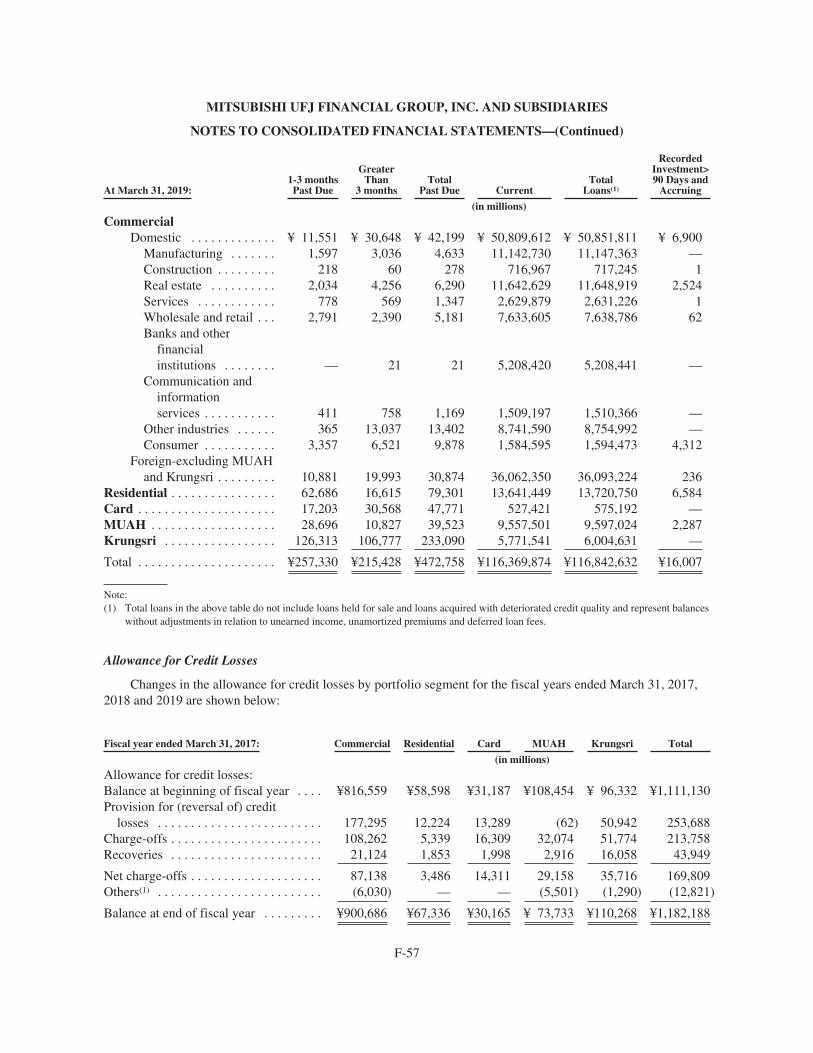
MITSUBISHI UFJ FINANCIAL GROUP, INC. AND SUBSIDIARIES
NOTES TO CONSOLIDATED FINANCIAL STATEMENTS—(Continued)
At March 31, 2019:1-3 monthsPast Due
GreaterThan
3 monthsTotal
Past Due CurrentTotal
Loans(1)
RecordedInvestment>90 Days and
Accruing
(in millions)
CommercialDomestic . . . . . . . . . . . . . ¥ 11,551 ¥ 30,648 ¥ 42,199 ¥ 50,809,612 ¥ 50,851,811 ¥ 6,900
Manufacturing . . . . . . . 1,597 3,036 4,633 11,142,730 11,147,363 —Construction . . . . . . . . . 218 60 278 716,967 717,245 1Real estate . . . . . . . . . . 2,034 4,256 6,290 11,642,629 11,648,919 2,524Services . . . . . . . . . . . . 778 569 1,347 2,629,879 2,631,226 1Wholesale and retail . . . 2,791 2,390 5,181 7,633,605 7,638,786 62Banks and other
financialinstitutions . . . . . . . . — 21 21 5,208,420 5,208,441 —
Communication andinformationservices . . . . . . . . . . . 411 758 1,169 1,509,197 1,510,366 —
Other industries . . . . . . 365 13,037 13,402 8,741,590 8,754,992 —Consumer . . . . . . . . . . . 3,357 6,521 9,878 1,584,595 1,594,473 4,312
Foreign-excluding MUAHand Krungsri . . . . . . . . . 10,881 19,993 30,874 36,062,350 36,093,224 236
Residential . . . . . . . . . . . . . . . . 62,686 16,615 79,301 13,641,449 13,720,750 6,584Card . . . . . . . . . . . . . . . . . . . . . 17,203 30,568 47,771 527,421 575,192 —MUAH . . . . . . . . . . . . . . . . . . . 28,696 10,827 39,523 9,557,501 9,597,024 2,287Krungsri . . . . . . . . . . . . . . . . . 126,313 106,777 233,090 5,771,541 6,004,631 —
Total . . . . . . . . . . . . . . . . . . . . . ¥257,330 ¥215,428 ¥472,758 ¥116,369,874 ¥116,842,632 ¥16,007
Note:(1) Total loans in the above table do not include loans held for sale and loans acquired with deteriorated credit quality and represent balances
without adjustments in relation to unearned income, unamortized premiums and deferred loan fees.
Allowance for Credit Losses
Changes in the allowance for credit losses by portfolio segment for the fiscal years ended March 31, 2017,2018 and 2019 are shown below:
Fiscal year ended March 31, 2017: Commercial Residential Card MUAH Krungsri Total
(in millions)
Allowance for credit losses:Balance at beginning of fiscal year . . . . ¥816,559 ¥58,598 ¥31,187 ¥108,454 ¥ 96,332 ¥1,111,130Provision for (reversal of) credit
losses . . . . . . . . . . . . . . . . . . . . . . . . . 177,295 12,224 13,289 (62) 50,942 253,688Charge-offs . . . . . . . . . . . . . . . . . . . . . . . 108,262 5,339 16,309 32,074 51,774 213,758Recoveries . . . . . . . . . . . . . . . . . . . . . . . 21,124 1,853 1,998 2,916 16,058 43,949
Net charge-offs . . . . . . . . . . . . . . . . . . . . 87,138 3,486 14,311 29,158 35,716 169,809Others(1) . . . . . . . . . . . . . . . . . . . . . . . . . (6,030) — — (5,501) (1,290) (12,821)
Balance at end of fiscal year . . . . . . . . . ¥900,686 ¥67,336 ¥30,165 ¥ 73,733 ¥110,268 ¥1,182,188
F-57

MITSUBISHI UFJ FINANCIAL GROUP, INC. AND SUBSIDIARIES
NOTES TO CONSOLIDATED FINANCIAL STATEMENTS—(Continued)
Fiscal year ended March 31, 2018: Commercial Residential Card MUAH Krungsri Total
(in millions)
Allowance for credit losses:Balance at beginning of fiscal
year . . . . . . . . . . . . . . . . . . . . . . . ¥ 900,686 ¥ 67,336 ¥ 30,165 ¥ 73,733 ¥ 110,268 ¥ 1,182,188Provision for (reversal of) credit
losses . . . . . . . . . . . . . . . . . . . . . (297,401) (22,291) 23,422 (9,309) 64,732 (240,847)Charge-offs . . . . . . . . . . . . . . . . . . . 134,807 3,838 22,696 14,701 56,067 232,109Recoveries . . . . . . . . . . . . . . . . . . . 24,913 1,339 1,228 6,140 17,490 51,110
Net charge-offs . . . . . . . . . . . . . . . . 109,894 2,499 21,468 8,561 38,577 180,999Others(1) . . . . . . . . . . . . . . . . . . . . . (2,293) — — (2,098) 8,173 3,782
Balance at end of fiscal year . . . . . ¥ 491,098 ¥ 42,546 ¥ 32,119 ¥ 53,765 ¥ 144,596 ¥ 764,124
Fiscal year ended March 31, 2019: Commercial Residential Card MUAH Krungsri Total
(in millions)
Allowance for credit losses:Balance at beginning of fiscal
year . . . . . . . . . . . . . . . . . . . . . . . ¥ 491,098 ¥ 42,546 ¥ 32,119 ¥ 53,765 ¥ 144,596 ¥ 764,124Provision for (reversal of) credit
losses . . . . . . . . . . . . . . . . . . . . . (43,850) (4,480) 23,809 9,277 49,574 34,330Charge-offs . . . . . . . . . . . . . . . . . . . 76,664 274 24,310 13,224 59,569 174,041Recoveries . . . . . . . . . . . . . . . . . . . 17,565 834 932 3,733 21,053 44,117
Net charge-offs . . . . . . . . . . . . . . . . 59,099 (560) 23,378 9,491 38,516 129,924Others(1) . . . . . . . . . . . . . . . . . . . . . 1,466 — — (970) (10,842) (10,346)
Balance at end of fiscal year . . . . . ¥ 389,615 ¥ 38,626 ¥ 32,550 ¥ 52,581 ¥ 144,812 ¥ 658,184
Note:(1) Others are principally comprised of gains or losses from foreign exchange translation.
F-58
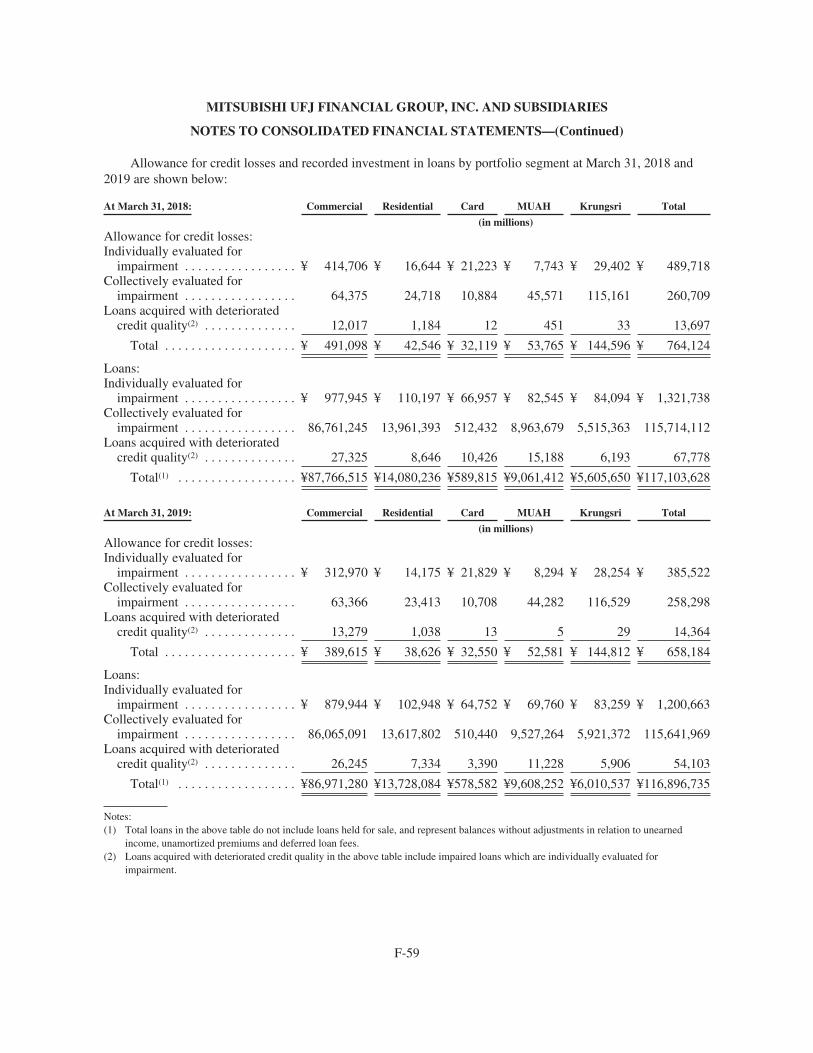
MITSUBISHI UFJ FINANCIAL GROUP, INC. AND SUBSIDIARIES
NOTES TO CONSOLIDATED FINANCIAL STATEMENTS—(Continued)
Allowance for credit losses and recorded investment in loans by portfolio segment at March 31, 2018 and2019 are shown below:
At March 31, 2018: Commercial Residential Card MUAH Krungsri Total
(in millions)Allowance for credit losses:Individually evaluated for
impairment . . . . . . . . . . . . . . . . . ¥ 414,706 ¥ 16,644 ¥ 21,223 ¥ 7,743 ¥ 29,402 ¥ 489,718Collectively evaluated for
impairment . . . . . . . . . . . . . . . . . 64,375 24,718 10,884 45,571 115,161 260,709Loans acquired with deteriorated
credit quality(2) . . . . . . . . . . . . . . 12,017 1,184 12 451 33 13,697
Total . . . . . . . . . . . . . . . . . . . . ¥ 491,098 ¥ 42,546 ¥ 32,119 ¥ 53,765 ¥ 144,596 ¥ 764,124
Loans:Individually evaluated for
impairment . . . . . . . . . . . . . . . . . ¥ 977,945 ¥ 110,197 ¥ 66,957 ¥ 82,545 ¥ 84,094 ¥ 1,321,738Collectively evaluated for
impairment . . . . . . . . . . . . . . . . . 86,761,245 13,961,393 512,432 8,963,679 5,515,363 115,714,112Loans acquired with deteriorated
credit quality(2) . . . . . . . . . . . . . . 27,325 8,646 10,426 15,188 6,193 67,778
Total(1) . . . . . . . . . . . . . . . . . . ¥87,766,515 ¥14,080,236 ¥589,815 ¥9,061,412 ¥5,605,650 ¥117,103,628
At March 31, 2019: Commercial Residential Card MUAH Krungsri Total
(in millions)Allowance for credit losses:Individually evaluated for
impairment . . . . . . . . . . . . . . . . . ¥ 312,970 ¥ 14,175 ¥ 21,829 ¥ 8,294 ¥ 28,254 ¥ 385,522Collectively evaluated for
impairment . . . . . . . . . . . . . . . . . 63,366 23,413 10,708 44,282 116,529 258,298Loans acquired with deteriorated
credit quality(2) . . . . . . . . . . . . . . 13,279 1,038 13 5 29 14,364
Total . . . . . . . . . . . . . . . . . . . . ¥ 389,615 ¥ 38,626 ¥ 32,550 ¥ 52,581 ¥ 144,812 ¥ 658,184
Loans:Individually evaluated for
impairment . . . . . . . . . . . . . . . . . ¥ 879,944 ¥ 102,948 ¥ 64,752 ¥ 69,760 ¥ 83,259 ¥ 1,200,663Collectively evaluated for
impairment . . . . . . . . . . . . . . . . . 86,065,091 13,617,802 510,440 9,527,264 5,921,372 115,641,969Loans acquired with deteriorated
credit quality(2) . . . . . . . . . . . . . . 26,245 7,334 3,390 11,228 5,906 54,103
Total(1) . . . . . . . . . . . . . . . . . . ¥86,971,280 ¥13,728,084 ¥578,582 ¥9,608,252 ¥6,010,537 ¥116,896,735
Notes:(1) Total loans in the above table do not include loans held for sale, and represent balances without adjustments in relation to unearned
income, unamortized premiums and deferred loan fees.(2) Loans acquired with deteriorated credit quality in the above table include impaired loans which are individually evaluated for
impairment.
F-59

MITSUBISHI UFJ FINANCIAL GROUP, INC. AND SUBSIDIARIES
NOTES TO CONSOLIDATED FINANCIAL STATEMENTS—(Continued)
Nonperforming loans were actively disposed of by sales during recent years. The allocated allowance forcredit losses for such loans was removed from the allowance for credit losses and transferred to the valuationallowance for loans held for sale upon a decision to sell. Net charge-offs in the above table include a decreasefrom charge-offs in the allowance for credit losses amounting to ¥11.0 billion and ¥12.2 billion for the fiscalyears ended March 31, 2017 and 2018, respectively, and an increase from recoveries in the allowance for creditlosses amounting to ¥15.1 billion for the fiscal year ended March 31, 2019 due to loan disposal activity.
The MUFG Group sold ¥833 billion, ¥1,409 billion and ¥1,769 billion of loans within the Commercialsegment during the fiscal years ended March 31, 2017, 2018 and 2019, respectively.
Loans Acquired in a Transfer
In accordance with the guidance on loans and debt securities acquired with deteriorated credit quality, thefollowing table sets forth information regarding loans acquired in connection with mergers, for which it is probable,at acquisition, that the MUFG Group will be unable to collect all contractually required payments receivable.
2018 2019
(in millions)
Loans acquired during the fiscal year:Contractually required payments receivable at acquisition . . . . . . . . . . . . . . . . . . . . . . . . . ¥ 537 ¥ 3,880Cash flows expected to be collected at acquisition . . . . . . . . . . . . . . . . . . . . . . . . . . . . . . . . 197 1,449Fair value of loans at acquisition . . . . . . . . . . . . . . . . . . . . . . . . . . . . . . . . . . . . . . . . . . . . . 197 1,449Accretable yield for loans within the scope of the guidance on loans and debt
securities acquired with deteriorated credit quality:Balance at beginning of fiscal year . . . . . . . . . . . . . . . . . . . . . . . . . . . . . . . . . . . . . . . . . . . . ¥ 40,917 ¥ 29,672
Additions . . . . . . . . . . . . . . . . . . . . . . . . . . . . . . . . . . . . . . . . . . . . . . . . . . . . . . . . . . . . — —Accretion . . . . . . . . . . . . . . . . . . . . . . . . . . . . . . . . . . . . . . . . . . . . . . . . . . . . . . . . . . . . (14,067) (7,178)Disposals . . . . . . . . . . . . . . . . . . . . . . . . . . . . . . . . . . . . . . . . . . . . . . . . . . . . . . . . . . . . (11) —Reclassifications from (to) nonaccretable difference . . . . . . . . . . . . . . . . . . . . . . . . . . 3,267 896Foreign currency translation adjustments . . . . . . . . . . . . . . . . . . . . . . . . . . . . . . . . . . . (434) (230)
Balance at end of fiscal year . . . . . . . . . . . . . . . . . . . . . . . . . . . . . . . . . . . . . . . . . . . . . . . . . ¥ 29,672 ¥ 23,160
Loans within the scope of the guidance on loans and debt securities acquired withdeteriorated credit quality:
Outstanding balance at beginning of fiscal year . . . . . . . . . . . . . . . . . . . . . . . . . . . . . . ¥223,695 ¥180,011Outstanding balance at end of fiscal year . . . . . . . . . . . . . . . . . . . . . . . . . . . . . . . . . . . 180,011 161,525Carrying amount at beginning of fiscal year . . . . . . . . . . . . . . . . . . . . . . . . . . . . . . . . . 91,176 67,778Carrying amount at end of fiscal year . . . . . . . . . . . . . . . . . . . . . . . . . . . . . . . . . . . . . . 67,778 54,103
Nonaccruing loans within the scope of the guidance on loans and debt securitiesacquired with deteriorated credit quality:
Carrying amount at acquisition date during fiscal year . . . . . . . . . . . . . . . . . . . . . . . . ¥ 197 ¥ 1,449Carrying amount at end of fiscal year . . . . . . . . . . . . . . . . . . . . . . . . . . . . . . . . . . . . . . 6,659 6,284
Allowance for credit losses within the scope of the guidance on loans and debtsecurities acquired with deteriorated credit quality:
Balance of allowance for credit losses at beginning of fiscal year . . . . . . . . . . . . . . . . ¥ 14,523 ¥ 13,697Additional provisions during fiscal year . . . . . . . . . . . . . . . . . . . . . . . . . . . . . . . . . . . . 2,285 1,744Reductions of allowance during fiscal year . . . . . . . . . . . . . . . . . . . . . . . . . . . . . . . . . 732 401Balance of allowance for credit losses at end of fiscal year . . . . . . . . . . . . . . . . . . . . . 13,697 14,364
F-60
MITSUBISHI UFJ FINANCIAL GROUP, INC. AND SUBSIDIARIES
NOTES TO CONSOLIDATED FINANCIAL STATEMENTS—(Continued)
The MUFG Group considered prepayments in the determination of contractual cash flows and cash flowsexpected to be collected based on historical results.
Lease Receivables
As part of its financing activities, the MUFG Group enters into leasing arrangements with customers. The MUFGGroup’s leasing operations are conducted through leasing subsidiaries and consist principally of direct financing leasesinvolving various types of data processing equipment, office equipment and transportation equipment.
As of March 31, 2018 and 2019, the components of the investment in direct financing leases were asfollows:
2018 2019
(in millions)
Minimum lease payments receivable . . . . . . . . . . . . . . . . . . . . . . . . . . . . . . . . . . . . . . . ¥1,862,664 ¥1,922,339Estimated residual values of leased property . . . . . . . . . . . . . . . . . . . . . . . . . . . . . . . . . 31,650 27,468Less—unearned income . . . . . . . . . . . . . . . . . . . . . . . . . . . . . . . . . . . . . . . . . . . . . . . . . (279,081) (299,283)
Net investment in direct financing leases . . . . . . . . . . . . . . . . . . . . . . . . . . . . . . . . . . . . ¥1,615,233 ¥1,650,524
Future minimum lease payment receivables under noncancelable leasing agreements as of March 31, 2019were as follows:
DirectFinancing
Leases
(in millions)
Fiscal year ending March 31:2020 . . . . . . . . . . . . . . . . . . . . . . . . . . . . . . . . . . . . . . . . . . . . . . . . . . . . . . . . . . . . . . . . . . . . . . . . ¥ 510,4392021 . . . . . . . . . . . . . . . . . . . . . . . . . . . . . . . . . . . . . . . . . . . . . . . . . . . . . . . . . . . . . . . . . . . . . . . . 425,0232022 . . . . . . . . . . . . . . . . . . . . . . . . . . . . . . . . . . . . . . . . . . . . . . . . . . . . . . . . . . . . . . . . . . . . . . . . 353,3552023 . . . . . . . . . . . . . . . . . . . . . . . . . . . . . . . . . . . . . . . . . . . . . . . . . . . . . . . . . . . . . . . . . . . . . . . . 240,6092024 . . . . . . . . . . . . . . . . . . . . . . . . . . . . . . . . . . . . . . . . . . . . . . . . . . . . . . . . . . . . . . . . . . . . . . . . 171,2862025 and thereafter . . . . . . . . . . . . . . . . . . . . . . . . . . . . . . . . . . . . . . . . . . . . . . . . . . . . . . . . . . . . 221,627
Total minimum lease payment receivables . . . . . . . . . . . . . . . . . . . . . . . . . . . . . . . . . . . . . . . . . . . . . . ¥1,922,339
Sales of Loans
The MUFG Group originates various types of loans to corporate and individual borrowers in Japan andoverseas in the normal course of business. In order to improve its loan quality, MUFG Bank and Mitsubishi UFJTrust and Banking actively disposed of nonperforming loans. Most of the nonperforming loans were disposed ofby sales to third parties without any continuing involvement. Management of MUFG Bank and Mitsubishi UFJTrust and Banking generally approves disposals after significant sales terms, including prices, are negotiated. Assuch, loans are disposed of by sales shortly after the loans are transferred to the held-for-sale classification. Thenet gains on the sales of loans were ¥19,466 million, ¥2,976 million and ¥20,696 million for the fiscal yearsended March 31, 2017, 2018 and 2019, respectively.
Related Party Loans
In some cases, the banking subsidiaries of MUFG make loans to related parties, including their directors andexecutive officers, in the course of their normal commercial banking business. At March 31, 2018 and 2019,outstanding loans to such related parties were not material.
F-61
MITSUBISHI UFJ FINANCIAL GROUP, INC. AND SUBSIDIARIES
NOTES TO CONSOLIDATED FINANCIAL STATEMENTS—(Continued)
In the opinion of management, these related party loans were made on substantially the same terms,including interest rates and collateral requirements, as those terms prevailing at the date these loans were made.For the fiscal years ended March 31, 2017, 2018 and 2019, there were no loans to related parties that werecharged off. Additionally, at March 31, 2017, 2018, and 2019, there were no loans to related parties that wereimpaired.
5. PREMISES AND EQUIPMENT
Premises and equipment at March 31, 2018 and 2019 consisted of the following:
2018 2019
(in millions)
Land . . . . . . . . . . . . . . . . . . . . . . . . . . . . . . . . . . . . . . . . . . . . . . . . . . . . . . . . . . . . . . . . . ¥ 370,669 ¥ 362,742Buildings . . . . . . . . . . . . . . . . . . . . . . . . . . . . . . . . . . . . . . . . . . . . . . . . . . . . . . . . . . . . . 739,665 829,606Equipment and furniture . . . . . . . . . . . . . . . . . . . . . . . . . . . . . . . . . . . . . . . . . . . . . . . . . 659,699 648,598Leasehold improvements . . . . . . . . . . . . . . . . . . . . . . . . . . . . . . . . . . . . . . . . . . . . . . . . . 311,645 305,281Construction in progress . . . . . . . . . . . . . . . . . . . . . . . . . . . . . . . . . . . . . . . . . . . . . . . . . 119,195 34,002
Total . . . . . . . . . . . . . . . . . . . . . . . . . . . . . . . . . . . . . . . . . . . . . . . . . . . . . . . . . . . . 2,200,873 2,180,229Less accumulated depreciation . . . . . . . . . . . . . . . . . . . . . . . . . . . . . . . . . . . . . . . . . . . . 1,187,285 1,206,629
Premises and equipment-net . . . . . . . . . . . . . . . . . . . . . . . . . . . . . . . . . . . . . . . . . . . . . . ¥1,013,588 ¥ 973,600
Premises and equipment include capitalized leases, principally related to data processing equipment, whichamounted to ¥31,458 million and ¥34,141 million at March 31, 2018 and 2019, respectively. Accumulateddepreciation on such capitalized leases at March 31, 2018 and 2019 amounted to ¥17,298 million and¥19,946 million, respectively.
MUFG Bank has entered into sales agreements to sell its buildings and land and, under separate agreements,leased those properties back for its business operations, including bank branches. MUFG Bank either providednonrecourse financing to the buyers for the sales proceeds or invested in the equity or common stock of thebuyers. As a result, MUFG Bank was considered to have continuing involvement with the properties. Foraccounting and reporting purposes, these transactions were accounted for under the financing method with thesales proceeds recognized as a financing obligation. The properties were reported on the accompanyingconsolidated balance sheets and depreciated. The financing obligation at March 31, 2018 and 2019 was¥41,892 million and ¥40,732 million, respectively.
For the fiscal years ended March 31, 2017, 2018 and 2019, the MUFG Group recognized ¥5,964 million,¥39,358 million and ¥31,345 million, respectively, of impairment losses for long-lived assets, primarily realestate which was either formerly used for its banking operations and is no longer used or real estate that is beingused where recovery of the carrying amount is doubtful. In addition, ¥901 million, ¥213 million and ¥411 millionof impairment losses were recognized for real estate held for sale for the fiscal years ended March 31, 2017, 2018and 2019, respectively. These losses are included in Other non-interest expenses. In computing the amount ofimpairment losses, fair value was determined primarily based on market prices, if available, or the estimatedprice based on an appraisal.
Impairment losses for the fiscal year ended March 31, 2018 included ¥34,016 million of losses on long-livedassets used for MUFG Bank’s operations. In relation to a restructuring of operating divisions of MUFG Bank,which is a transformation of Corporate Banking Business Group and Retail Banking Business Group intoRetail & Commercial Banking Business Group and Japanese Corporate & Investment Banking Business Group,
F-62
MITSUBISHI UFJ FINANCIAL GROUP, INC. AND SUBSIDIARIES
NOTES TO CONSOLIDATED FINANCIAL STATEMENTS—(Continued)
based on an MUFG Re-Imagining Strategy published on May 15, 2017, and the new medium-term business plan,MUFG Bank reevaluated the profitability of some of its domestic operating assets. As a result of thereevaluation, it was determined that carrying amounts of these operating assets were unlikely to be recovered,and the impairment losses were recorded.
Impairment losses for the fiscal year ended March 31, 2019 included ¥21,096 million losses on long-livedassets, including land, buildings, and equipment and furniture, which were held by certain consumer financesubsidiary. See Note 6 for the details of these impairments.
6. GOODWILL AND OTHER INTANGIBLE ASSETS
Goodwill
The table below presents the movement in the carrying amount of goodwill by business segment during thefiscal years ended March 31, 2018 and 2019:
Effective April 1, 2018, the MUFG Group reorganized its business groups in an effort to further integratethe expertise and capabilities of its consolidated subsidiaries to respond to the needs of customers moreeffectively and efficiently, as part of its current medium-term business plan. To make and execute unified group-wide strategies based on customer characteristics and the nature of business, the MUFG Group integrated theoperations of its consolidated subsidiaries into six business segments.—Retail & Commercial Banking, JapaneseCorporate & Investment Banking, Global Corporate & Investment Banking, Global Commercial Banking, AssetManagement & Investor Services, and Global Markets. See Note 30 for the business segment information of theMUFG Group.
GlobalCommercial
BankingBusinessGroup
AssetManagement &
InvestorServicesBusinessGroup
GlobalMarketsBusinessGroup Total
(in millions)
Balance at March 31, 2017:Goodwill(1) . . . . . . . . . . . . . . . . . . . . . . . . . . . . . . . . . . . . . . . ¥ 611,827 ¥ 28,134 ¥2,300 ¥ 642,261Accumulated impairment losses(1) . . . . . . . . . . . . . . . . . . . . . (177,750) (14,368) — (192,118)
434,077 13,766 2,300 450,143Foreign currency translation adjustments and other . . . . . . . . (8,399) (410) — (8,809)
Balance at March 31, 2018:Goodwill . . . . . . . . . . . . . . . . . . . . . . . . . . . . . . . . . . . . . . . . . 603,428 27,724 2,300 633,452Accumulated impairment losses . . . . . . . . . . . . . . . . . . . . . . . (177,750) (14,368) — (192,118)
425,678 13,356 2,300 441,334Foreign currency translation adjustments and other . . . . . . . . (7,206) (237) — (7,443)
Balance at March 31, 2019:Goodwill . . . . . . . . . . . . . . . . . . . . . . . . . . . . . . . . . . . . . . . . . 596,222 27,487 2,300 626,009Accumulated impairment losses . . . . . . . . . . . . . . . . . . . . . . . (177,750) (14,368) — (192,118)
¥ 418,472 ¥ 13,119 ¥2,300 ¥ 433,891
Note:(1) Effective April 1, 2018, the MUFG Group reorganized its business groups. Goodwill originally recognized for Retail Banking Business
Group, Corporate Banking Business Group, Trust Assets Business Group and Global Business Group other than MUAH and Krungsri
F-63

MITSUBISHI UFJ FINANCIAL GROUP, INC. AND SUBSIDIARIES
NOTES TO CONSOLIDATED FINANCIAL STATEMENTS—(Continued)
was ¥1,900,019 million, which has been fully impaired before April 1, 2017. As these impairment losses recorded in past before thereorganization of the segment and are irrelevant to the annual impairment test under the new segment, the accumulated impaired loss isnot allocated to new business segments after the reorganization of business group.
U.S. GAAP requires to test goodwill for impairment at least annually, or more frequently if events orchanges in circumstances indicate that goodwill may be impaired, using a two-step process that begins with anestimation of the fair value of a reporting unit, which is to be compared with the carrying amount of the reportingunit including goodwill, to identify potential impairment of goodwill. If the carrying amount of a reporting unitincluding goodwill exceeds its estimated fair value, the second step of the goodwill impairment test is performedto measure the amount of impairment loss recorded in the consolidated statements of income. This test requirescomparison of the implied fair value of the reporting unit’s goodwill with the carrying amount of its goodwill.
For the fiscal years ended March 31, 2017, the MUFG Group recognized ¥6,638 million, in impairment ofgoodwill relating to reporting units within the Trust Assets Business Group segment. There were no impairmentlosses recognized for the fiscal years ended March 31, 2018 and 2019. The MUFG Group readjusted its futurecash flow projection of the reporting units in this segment, considering the subsidiaries’ recent businessperformance. Due to the situation, the fair value of the reporting units, which were based on discounted futurecash flows, fell below the carrying amounts of the reporting units. Accordingly, the second step of the goodwillimpairment test was performed for the reporting units. As a result, the carrying amounts of the reporting units’goodwill exceeded the implied fair value of the reporting units’ goodwill, and the impairment losses wererecognized on the related goodwill.
Other Intangible Assets
The table below presents the gross carrying amount, accumulated amortization and net carrying amount, intotal and by major class of other intangible assets at March 31, 2018 and 2019:
2018 2019
Grosscarryingamount
Accumulatedamortization
Netcarryingamount
Grosscarryingamount
Accumulatedamortization
Netcarryingamount
(in millions)
Intangible assets subject to amortization:Software . . . . . . . . . . . . . . . . . . . . . . ¥2,585,161 ¥1,852,333 ¥ 732,828 ¥2,703,413 ¥2,029,775 ¥673,638Core deposit intangibles . . . . . . . . . . 128,679 83,382 45,297 126,796 88,643 38,153Customer relationships . . . . . . . . . . . 391,832 227,079 164,753 387,936 246,526 141,410Trade names . . . . . . . . . . . . . . . . . . . 77,821 30,801 47,020 77,204 34,283 42,921Other . . . . . . . . . . . . . . . . . . . . . . . . 9,706 3,977 5,729 9,601 4,220 5,381
Total . . . . . . . . . . . . . . . . . . . . . ¥3,193,199 ¥2,197,572 995,627 ¥3,304,950 ¥2,403,447 901,503
Intangible assets not subject toamortization:
Other(1) . . . . . . . . . . . . . . . . . . . . . . . 15,492 25,693
Total . . . . . . . . . . . . . . . . . . . . . . . . . . . . . ¥1,011,119 ¥927,196
Note:(1) Intangible assets not subject to amortization includes ¥7,268 million and ¥17,431 million of mortgage servicing rights accounted for at
fair value at March 31, 2018 and 2019, respectively.
Intangible assets subject to amortization acquired during the fiscal year ended March 31, 2018 amounted to¥242,017 million, which primarily consisted of ¥239,460 million of software and ¥2,200 million of customer
F-64
MITSUBISHI UFJ FINANCIAL GROUP, INC. AND SUBSIDIARIES
NOTES TO CONSOLIDATED FINANCIAL STATEMENTS—(Continued)
relationships. The weighted average amortization periods for these assets are 5 years and 22 years, respectively.There is no significant residual value estimated for these assets. Intangible assets not subject to amortizationacquired during the fiscal year ended March 31, 2018 amounted to ¥28 million.
Intangible assets subject to amortization acquired during the fiscal year ended March 31, 2019 amounted to¥262,700 million, which primarily consisted of ¥262,408 million of software. The weighted average amortizationperiods for these assets are 6 years. There is no significant residual value estimated for these assets. Intangibleassets not subject to amortization acquired during the fiscal year ended March 31, 2019 amounted to¥11,172 million.
For the fiscal years ended March 31, 2017, 2018 and 2019, the MUFG Group recognized ¥5,803 million,¥21,900 million and ¥118,108 million, respectively, of impairment losses for intangible assets whose carryingamounts exceeded their fair value. In computing the amount of impairment losses, fair value was determinedprimarily based on the present value of expected future cash flows, the estimated value based on appraisals, ormarket prices.
The impairment loss for the fiscal year ended March 31, 2018 included a loss of ¥11,121 million relating tothe foreign subsidiary’s customer relationships under the Trust Asset Business Group segment. The intangibleassets were valued based on discounted expected future cash flows. The estimated future cash flows of the abovecustomer relationships were revised downward due to a decrease in acquired customer base. Accordingly, theMUFG group revaluated the intangible assets and recognized impairment losses.
The impairment loss for the fiscal year ended March 31, 2019 included a loss of ¥137,186 million relating tosoftware held by certain consumer finance subsidiary under the Retail & Commercial Banking Business Groupsegment. The consumer finance subsidiary determined to fundamentally review its current system integrationplan, comprehensively taking into account the scale, complexity and the degree of difficulty for the systemdevelopment to respond rapid changes in payments market in an appropriate manner, at the meeting of the Boardof Directors on March 25, 2019. The consumer finance subsidiary considered software under developmentunlikely to have cost reduction effect and remain in use in the future, and reevaluated the profitability of existingsoftware in relation to its system integration plan. As a result, it was determined that carrying amounts of bothsystem software under development and long lived assets group of credit business, including existing systemsoftware, land, buildings, and equipment and furniture exceeded their fair values, and ¥87,596 million and¥28,494 million of impairment losses were recognized on system software under development and existingsoftware, respectively. In computing the amount of impairment losses, the fair value was primarily estimatedusing an income approach. The income approach is based on the present value of expected cash flows, whichrepresents market participant perspective. In addition to the impairments on software, ¥21,096 million ofimpairment losses on long-lived assets, including land, buildings, and equipment and furniture, were recognized.
The estimated aggregate amortization expense for intangible assets for the next five fiscal years is asfollows:
(in millions)
Fiscal year ending March 31:2020 . . . . . . . . . . . . . . . . . . . . . . . . . . . . . . . . . . . . . . . . . . . . . . . . . . . . . . . . . . . . . . . . . . . . . . . . . ¥230,9622021 . . . . . . . . . . . . . . . . . . . . . . . . . . . . . . . . . . . . . . . . . . . . . . . . . . . . . . . . . . . . . . . . . . . . . . . . . 195,1262022 . . . . . . . . . . . . . . . . . . . . . . . . . . . . . . . . . . . . . . . . . . . . . . . . . . . . . . . . . . . . . . . . . . . . . . . . . 160,5042023 . . . . . . . . . . . . . . . . . . . . . . . . . . . . . . . . . . . . . . . . . . . . . . . . . . . . . . . . . . . . . . . . . . . . . . . . . 120,3502024 . . . . . . . . . . . . . . . . . . . . . . . . . . . . . . . . . . . . . . . . . . . . . . . . . . . . . . . . . . . . . . . . . . . . . . . . . 83,523
F-65

MITSUBISHI UFJ FINANCIAL GROUP, INC. AND SUBSIDIARIES
NOTES TO CONSOLIDATED FINANCIAL STATEMENTS—(Continued)
7. INCOME TAXES
Income before Income Tax Expense
Income before income tax expense by jurisdiction for the fiscal years ended March 31, 2017, 2018 and 2019was as follows:
2017 2018 2019
(in millions)
Domestic income (loss) . . . . . . . . . . . . . . . . . . . . . . . . . . . . . . . . . . . . . . . . . ¥(413,499) ¥ 803,057 ¥228,018Foreign income . . . . . . . . . . . . . . . . . . . . . . . . . . . . . . . . . . . . . . . . . . . . . . . 686,042 858,762 642,824
Total . . . . . . . . . . . . . . . . . . . . . . . . . . . . . . . . . . . . . . . . . . . . . . . . . . . . ¥ 272,543 ¥1,661,819 ¥870,842
Income Tax Expense (Benefit)
The detail of current and deferred income tax expense (benefit) for the fiscal years ended March 31, 2017,2018 and 2019 was as follows:
2017 2018 2019
(in millions)
Current:Domestic . . . . . . . . . . . . . . . . . . . . . . . . . . . . . . . . . . . . . . . . . . . . . . . ¥ 176,415 ¥ 180,109 ¥ 57,303Foreign . . . . . . . . . . . . . . . . . . . . . . . . . . . . . . . . . . . . . . . . . . . . . . . . . 130,406 107,119 123,730
Total . . . . . . . . . . . . . . . . . . . . . . . . . . . . . . . . . . . . . . . . . . . . . . . 306,821 287,228 181,033
Deferred:Domestic . . . . . . . . . . . . . . . . . . . . . . . . . . . . . . . . . . . . . . . . . . . . . . . (217,485) 116,873 (32,746)Foreign . . . . . . . . . . . . . . . . . . . . . . . . . . . . . . . . . . . . . . . . . . . . . . . . . 5,117 3,722 (15,050)
Total . . . . . . . . . . . . . . . . . . . . . . . . . . . . . . . . . . . . . . . . . . . . . . . (212,368) 120,595 (47,796)
Income tax expense . . . . . . . . . . . . . . . . . . . . . . . . . . . . . . . . . . . . . . . . . . . 94,453 407,823 133,237Income tax expense (benefit) reported in Accumulated OCI relating to:
Investment securities . . . . . . . . . . . . . . . . . . . . . . . . . . . . . . . . . . . . . . 20,237 120,588 15,590Debt valuation adjustments . . . . . . . . . . . . . . . . . . . . . . . . . . . . . . . . . (3,926) (960) 4,293Derivatives qualifying for cash flow hedges . . . . . . . . . . . . . . . . . . . . (9,443) (4,421) (1,845)Defined benefit plans . . . . . . . . . . . . . . . . . . . . . . . . . . . . . . . . . . . . . . 48,504 50,774 (38,229)Foreign currency translation adjustments . . . . . . . . . . . . . . . . . . . . . . (1,957) (34,527) 15,148
Total . . . . . . . . . . . . . . . . . . . . . . . . . . . . . . . . . . . . . . . . . . . . . . . 53,415 131,454 (5,043)
Total . . . . . . . . . . . . . . . . . . . . . . . . . . . . . . . . . . . . . . . . . . . . . . . . . . . . . . . ¥ 147,868 ¥ 539,277 ¥ 128,194
The MUFG Group files tax returns on a consolidated basis for corporate income taxes within Japan. Aconsolidated basis for corporate income taxes results in the reporting of taxable income or loss based upon thecombined profits or losses of the parent company and its wholly-owned domestic subsidiaries.
In June 2016, the Tokyo Metropolitan Government Bureau of Taxation promulgated revisions to the localtax law. The revision reduces the effective statutory rate of corporate income tax from approximately 31.5% as ofMarch 31, 2016 to 30.6% for the fiscal year beginning on or after April 1, 2017. The revision resulted in adecrease of ¥26,820 million in income tax expense for the fiscal year ended March 31, 2017.
F-66

MITSUBISHI UFJ FINANCIAL GROUP, INC. AND SUBSIDIARIES
NOTES TO CONSOLIDATED FINANCIAL STATEMENTS—(Continued)
In the United States of America, on December 22, 2017, the Tax Cuts & Jobs Act was signed into lawreducing the federal corporate income tax rate from 35% to 21% effective January 1, 2018. As a result of thereduction in the corporate income tax rate, the MUFG Group revalued its net deferred tax liabilities at March 31,2018, resulting in a one-time tax benefit of ¥10,395 million.
Reconciliation of Effective Income Tax Rate
Income taxes in Japan applicable to the MUFG Group are imposed by the national, prefectural andmunicipal governments, and in the aggregate resulted in a normal effective statutory rate of approximately31.5%, 30.6%, and 30.6% for the fiscal years ended March 31, 2017, 2018 and 2019, respectively. Foreignsubsidiaries are subject to income taxes of the countries in which they operate.
A reconciliation of the effective income tax rates reflected in the accompanying consolidated statements ofincome to the combined normal effective statutory tax rates for the fiscal years ended March 31, 2017, 2018 and2019 is as follows:
2017 2018 2019
Combined normal effective statutory tax rate . . . . . . . . . . . . . . . . . . . . . . . . . . . . . . . . . . 31.5% 30.6% 30.6%Nondeductible expenses . . . . . . . . . . . . . . . . . . . . . . . . . . . . . . . . . . . . . . . . . . . . . . 2.0 0.2 0.5Impairment of goodwill . . . . . . . . . . . . . . . . . . . . . . . . . . . . . . . . . . . . . . . . . . . . . . . 0.8 — —Foreign tax credit and payments . . . . . . . . . . . . . . . . . . . . . . . . . . . . . . . . . . . . . . . . (9.6) (1.7) (3.3)Lower tax rates applicable to income of subsidiaries . . . . . . . . . . . . . . . . . . . . . . . . (0.2) (0.4) (2.5)Change in valuation allowance . . . . . . . . . . . . . . . . . . . . . . . . . . . . . . . . . . . . . . . . . 25.4 (3.0) (1.4)Nontaxable dividends received . . . . . . . . . . . . . . . . . . . . . . . . . . . . . . . . . . . . . . . . . (12.5) (2.0) (9.1)Undistributed earnings of subsidiaries . . . . . . . . . . . . . . . . . . . . . . . . . . . . . . . . . . . 3.5 0.7 0.6Tax and interest expense for uncertainty in income taxes . . . . . . . . . . . . . . . . . . . . (0.6) 0.0 0.6Noncontrolling interest income . . . . . . . . . . . . . . . . . . . . . . . . . . . . . . . . . . . . . . . . . 5.4 0.1 0.2Effect of changes in tax laws . . . . . . . . . . . . . . . . . . . . . . . . . . . . . . . . . . . . . . . . . . . (9.8) (0.6) 0.0Other—net . . . . . . . . . . . . . . . . . . . . . . . . . . . . . . . . . . . . . . . . . . . . . . . . . . . . . . . . . (1.2) 0.6 (0.9)
Effective income tax rate . . . . . . . . . . . . . . . . . . . . . . . . . . . . . . . . . . . . . . . . . . . . . . . . . 34.7% 24.5% 15.3%
F-67

MITSUBISHI UFJ FINANCIAL GROUP, INC. AND SUBSIDIARIES
NOTES TO CONSOLIDATED FINANCIAL STATEMENTS—(Continued)
Deferred Tax Assets and Liabilities
Deferred tax assets and liabilities are computed for each tax jurisdiction using currently enacted tax ratesapplicable to periods when the temporary differences are expected to reverse. The tax effects of the itemscomprising the MUFG Group’s net deferred tax assets at March 31, 2018 and 2019 were as follows:
2018 2019
(in millions)
Deferred tax assets:Allowance for credit losses . . . . . . . . . . . . . . . . . . . . . . . . . . . . . . . . . . . . . . . . . . . ¥ 337,718 ¥ 301,222Operating loss carryforwards . . . . . . . . . . . . . . . . . . . . . . . . . . . . . . . . . . . . . . . . . 167,355 177,143Loans . . . . . . . . . . . . . . . . . . . . . . . . . . . . . . . . . . . . . . . . . . . . . . . . . . . . . . . . . . . . 3,483 691Accrued liabilities and other . . . . . . . . . . . . . . . . . . . . . . . . . . . . . . . . . . . . . . . . . . 133,728 236,363Premises and equipment, including sale-and-leaseback transactions . . . . . . . . . . . 120,505 158,144Derivative financial instruments . . . . . . . . . . . . . . . . . . . . . . . . . . . . . . . . . . . . . . . 111,677 101,118Defined benefit plans . . . . . . . . . . . . . . . . . . . . . . . . . . . . . . . . . . . . . . . . . . . . . . . — 5,238Valuation allowance . . . . . . . . . . . . . . . . . . . . . . . . . . . . . . . . . . . . . . . . . . . . . . . . (215,130) (218,191)
Total deferred tax assets . . . . . . . . . . . . . . . . . . . . . . . . . . . . . . . . . . . . . . . . . 659,336 761,728
Deferred tax liabilities:Investment securities (including trading account assets at fair value under the fair
value option) . . . . . . . . . . . . . . . . . . . . . . . . . . . . . . . . . . . . . . . . . . . . . . . . . . . . 973,390 911,483Intangible assets . . . . . . . . . . . . . . . . . . . . . . . . . . . . . . . . . . . . . . . . . . . . . . . . . . . 52,396 38,772Lease transactions . . . . . . . . . . . . . . . . . . . . . . . . . . . . . . . . . . . . . . . . . . . . . . . . . . 83,445 65,115Defined benefit plans . . . . . . . . . . . . . . . . . . . . . . . . . . . . . . . . . . . . . . . . . . . . . . . 15,484 —Other . . . . . . . . . . . . . . . . . . . . . . . . . . . . . . . . . . . . . . . . . . . . . . . . . . . . . . . . . . . . 119,970 280,701
Total deferred tax liabilities . . . . . . . . . . . . . . . . . . . . . . . . . . . . . . . . . . . . . . 1,244,685 1,296,071
Net deferred tax assets (liabilities) . . . . . . . . . . . . . . . . . . . . . . . . . . . . . . . . . . . . . . . . . ¥ (585,349) ¥ (534,343)
The valuation allowance was provided primarily against deferred tax assets recorded at MUFG and itssubsidiaries with operating loss carryforwards. The valuation allowance is determined to reduce the measurementof deferred tax assets not expected to be realized. Management considers all available evidence, both positive andnegative, to determine whether the valuation allowance is necessary based on the weight of that evidence.Management determines the amount of the valuation allowance based on future reversals of existing taxabletemporary differences and future taxable income exclusive of reversing temporary differences. Future taxableincome is developed from forecasted operating results, based on recent historical trends and approved businessplans, the eligible carryforward periods and other relevant factors.
For certain subsidiaries where strong negative evidence exists, such as the existence of significant amountsof operating loss carryforwards, cumulative losses and the expiration of unused operating loss carryforwards inrecent years, a valuation allowance was recognized against the deferred tax assets as of March 31, 2018 and 2019to the extent that it is more likely than not that they will not be realized.
For the fiscal year ended March 31, 2018, the MUFG Group released a valuation allowance of¥53,360 million which was mainly due to the commencement of a certain subsidiary’s application of theconsolidated corporate-tax system. Management believes that the net operating loss carryforwards related toJapanese corporate taxes will be fully utilized by the application of the consolidated corporate-tax system.
F-68

MITSUBISHI UFJ FINANCIAL GROUP, INC. AND SUBSIDIARIES
NOTES TO CONSOLIDATED FINANCIAL STATEMENTS—(Continued)
Income taxes are not provided on undistributed earnings of certain foreign subsidiaries that are consideredto be indefinitely reinvested in the operations of such subsidiaries. At March 31, 2018 and 2019, theundistributed earnings of such foreign subsidiaries amounted to approximately ¥38,358 million and¥48,103 million, respectively. Determination of the amount of unrecognized deferred tax liabilities with respectto these undistributed earnings is not practicable because of the complexity associated with its hypotheticalcalculation including foreign withholding taxes and foreign tax credits. MUFG has neither plans nor the intentionto dispose of investments in such foreign subsidiaries and, accordingly, does not expect to record capital gains orlosses, or otherwise monetize the undistributed earnings of such foreign subsidiaries.
Furthermore, under the Japanese tax law, 95% of a dividend received from a foreign company in which adomestic company has held generally at least 25% of the outstanding shares for a continuous period of sixmonths or more ending on the date on which the dividend is declared can be excluded from the domesticcompany’s taxable income. Therefore, if undistributed earnings of certain foreign subsidiaries are repatriatedthrough dividends, only 5% of the amount of dividends will be included in taxable income.
Operating Loss and Tax Credit Carryforwards
At March 31, 2019, the MUFG Group had operating loss carryforwards for corporate tax of¥527,882 million and tax credit carryforwards of ¥52,546 million for tax purposes. Such carryforwards, if notutilized, are scheduled to expire as follows:
Operating losscarryforwards
Tax creditcarryforwards
(in millions)
Fiscal year ending March 31:2020 . . . . . . . . . . . . . . . . . . . . . . . . . . . . . . . . . . . . . . . . . . . . . . . . . . . . . . . . . . ¥ 33,066 ¥ 7002021 . . . . . . . . . . . . . . . . . . . . . . . . . . . . . . . . . . . . . . . . . . . . . . . . . . . . . . . . . . 12,727 1942022 . . . . . . . . . . . . . . . . . . . . . . . . . . . . . . . . . . . . . . . . . . . . . . . . . . . . . . . . . . 23,346 2302023 . . . . . . . . . . . . . . . . . . . . . . . . . . . . . . . . . . . . . . . . . . . . . . . . . . . . . . . . . . 68,850 2322024 . . . . . . . . . . . . . . . . . . . . . . . . . . . . . . . . . . . . . . . . . . . . . . . . . . . . . . . . . . 105,110 1822025 . . . . . . . . . . . . . . . . . . . . . . . . . . . . . . . . . . . . . . . . . . . . . . . . . . . . . . . . . . 167,035 1172026 and thereafter . . . . . . . . . . . . . . . . . . . . . . . . . . . . . . . . . . . . . . . . . . . . . . 95,686 46,239
No definite expiration date . . . . . . . . . . . . . . . . . . . . . . . . . . . . . . . . . . . . . . . . . . . . 22,062 4,652
Total . . . . . . . . . . . . . . . . . . . . . . . . . . . . . . . . . . . . . . . . . . . . . . . . . . . . . . ¥527,882 ¥52,546
Uncertainty in Income Tax
The following is a roll-forward of the MUFG Group’s unrecognized tax benefits for the fiscal years endedMarch 31, 2017, 2018 and 2019:
2017 2018 2019
(in millions)
Balance at beginning of fiscal year . . . . . . . . . . . . . . . . . . . . . . . . . . . . . . . . . . . . . . ¥ 9,950 ¥ 7,851 ¥12,917Gross amount of increases for current year’s tax positions . . . . . . . . . . . . . . . 888 427 313Gross amount of increases for prior years’ tax positions . . . . . . . . . . . . . . . . . 1,014 6,642 8,836Gross amount of decreases for prior years’ tax positions . . . . . . . . . . . . . . . . . (95) (455) (1,090)Net amount of changes relating to settlements with tax authorities . . . . . . . . . (39) (1,074) —Decreases due to lapse of applicable statutes of limitations . . . . . . . . . . . . . . . (3,437) (253) (1,540)Foreign exchange translation and others . . . . . . . . . . . . . . . . . . . . . . . . . . . . . (430) (221) (276)
Balance at end of fiscal year . . . . . . . . . . . . . . . . . . . . . . . . . . . . . . . . . . . . . . . . . . . ¥ 7,851 ¥12,917 ¥19,160
F-69
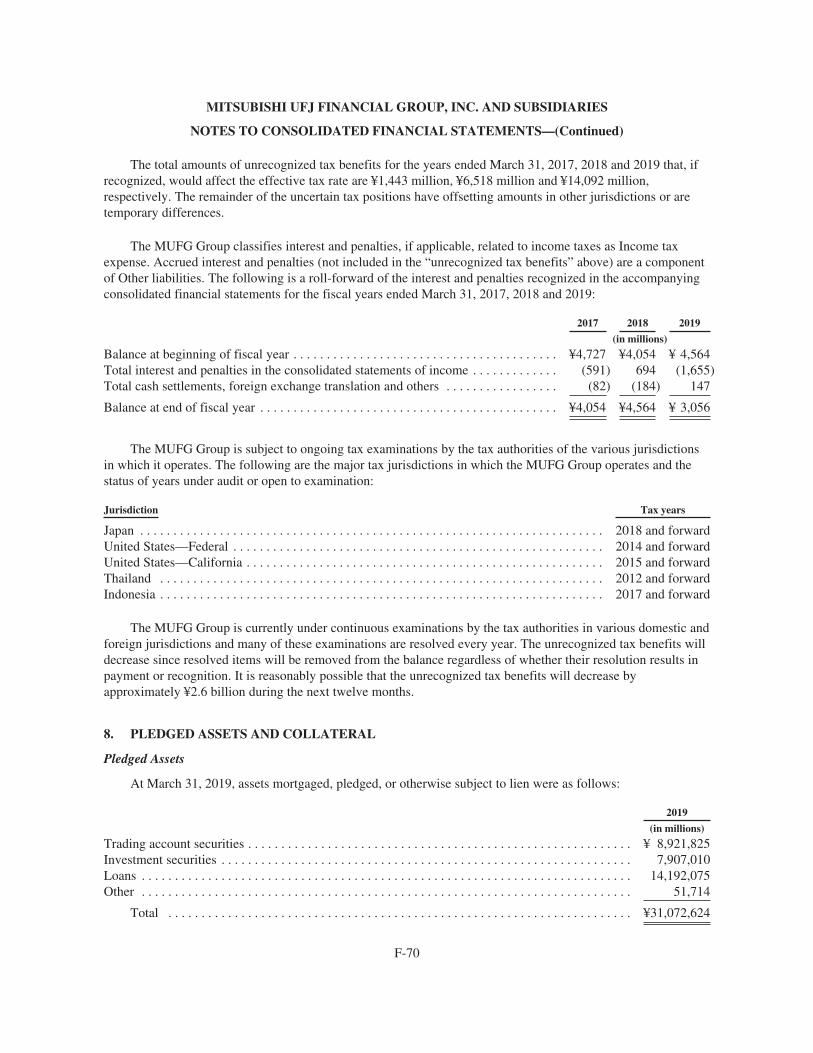
MITSUBISHI UFJ FINANCIAL GROUP, INC. AND SUBSIDIARIES
NOTES TO CONSOLIDATED FINANCIAL STATEMENTS—(Continued)
The total amounts of unrecognized tax benefits for the years ended March 31, 2017, 2018 and 2019 that, ifrecognized, would affect the effective tax rate are ¥1,443 million, ¥6,518 million and ¥14,092 million,respectively. The remainder of the uncertain tax positions have offsetting amounts in other jurisdictions or aretemporary differences.
The MUFG Group classifies interest and penalties, if applicable, related to income taxes as Income taxexpense. Accrued interest and penalties (not included in the “unrecognized tax benefits” above) are a componentof Other liabilities. The following is a roll-forward of the interest and penalties recognized in the accompanyingconsolidated financial statements for the fiscal years ended March 31, 2017, 2018 and 2019:
2017 2018 2019
(in millions)
Balance at beginning of fiscal year . . . . . . . . . . . . . . . . . . . . . . . . . . . . . . . . . . . . . . . . ¥4,727 ¥4,054 ¥ 4,564Total interest and penalties in the consolidated statements of income . . . . . . . . . . . . . (591) 694 (1,655)Total cash settlements, foreign exchange translation and others . . . . . . . . . . . . . . . . . (82) (184) 147
Balance at end of fiscal year . . . . . . . . . . . . . . . . . . . . . . . . . . . . . . . . . . . . . . . . . . . . . ¥4,054 ¥4,564 ¥ 3,056
The MUFG Group is subject to ongoing tax examinations by the tax authorities of the various jurisdictionsin which it operates. The following are the major tax jurisdictions in which the MUFG Group operates and thestatus of years under audit or open to examination:
Jurisdiction Tax years
Japan . . . . . . . . . . . . . . . . . . . . . . . . . . . . . . . . . . . . . . . . . . . . . . . . . . . . . . . . . . . . . . . . . . . . . . 2018 and forwardUnited States—Federal . . . . . . . . . . . . . . . . . . . . . . . . . . . . . . . . . . . . . . . . . . . . . . . . . . . . . . . . 2014 and forwardUnited States—California . . . . . . . . . . . . . . . . . . . . . . . . . . . . . . . . . . . . . . . . . . . . . . . . . . . . . . 2015 and forwardThailand . . . . . . . . . . . . . . . . . . . . . . . . . . . . . . . . . . . . . . . . . . . . . . . . . . . . . . . . . . . . . . . . . . . 2012 and forwardIndonesia . . . . . . . . . . . . . . . . . . . . . . . . . . . . . . . . . . . . . . . . . . . . . . . . . . . . . . . . . . . . . . . . . . . 2017 and forward
The MUFG Group is currently under continuous examinations by the tax authorities in various domestic andforeign jurisdictions and many of these examinations are resolved every year. The unrecognized tax benefits willdecrease since resolved items will be removed from the balance regardless of whether their resolution results inpayment or recognition. It is reasonably possible that the unrecognized tax benefits will decrease byapproximately ¥2.6 billion during the next twelve months.
8. PLEDGED ASSETS AND COLLATERAL
Pledged Assets
At March 31, 2019, assets mortgaged, pledged, or otherwise subject to lien were as follows:
2019
(in millions)
Trading account securities . . . . . . . . . . . . . . . . . . . . . . . . . . . . . . . . . . . . . . . . . . . . . . . . . . . . . . . . . . ¥ 8,921,825Investment securities . . . . . . . . . . . . . . . . . . . . . . . . . . . . . . . . . . . . . . . . . . . . . . . . . . . . . . . . . . . . . . 7,907,010Loans . . . . . . . . . . . . . . . . . . . . . . . . . . . . . . . . . . . . . . . . . . . . . . . . . . . . . . . . . . . . . . . . . . . . . . . . . . 14,192,075Other . . . . . . . . . . . . . . . . . . . . . . . . . . . . . . . . . . . . . . . . . . . . . . . . . . . . . . . . . . . . . . . . . . . . . . . . . . 51,714
Total . . . . . . . . . . . . . . . . . . . . . . . . . . . . . . . . . . . . . . . . . . . . . . . . . . . . . . . . . . . . . . . . . . . . . . ¥31,072,624
F-70

MITSUBISHI UFJ FINANCIAL GROUP, INC. AND SUBSIDIARIES
NOTES TO CONSOLIDATED FINANCIAL STATEMENTS—(Continued)
The above pledged assets were classified by type of liabilities to which they related as follows:
2019
(in millions)
Deposits . . . . . . . . . . . . . . . . . . . . . . . . . . . . . . . . . . . . . . . . . . . . . . . . . . . . . . . . . . . . . . . . . . . . . . . . ¥ 223,075Payables under repurchase agreements and securities lending transactions . . . . . . . . . . . . . . . . . . . . 16,316,732Other short-term borrowings and long-term debt . . . . . . . . . . . . . . . . . . . . . . . . . . . . . . . . . . . . . . . . 14,522,393Other . . . . . . . . . . . . . . . . . . . . . . . . . . . . . . . . . . . . . . . . . . . . . . . . . . . . . . . . . . . . . . . . . . . . . . . . . . 10,424
Total . . . . . . . . . . . . . . . . . . . . . . . . . . . . . . . . . . . . . . . . . . . . . . . . . . . . . . . . . . . . . . . . . . . . . . ¥31,072,624
At March 31, 2019, certain investment securities, principally Japanese national government and Japanesegovernment agency bonds, loans, and other assets with a combined carrying value of ¥19,875,392 million werepledged for acting as a collection agent of public funds, for settlement of exchange at the Bank of Japan andJapanese Banks’ Payment Clearing Network, for derivative transactions and for certain other purposes.
The MUFG Group engages in on-balance sheet securitizations. These securitizations of mortgage andapartment loans, which do not qualify for sales treatment, are accounted for as secured borrowings. The amountof loans in the table above represents the carrying amount of these transactions with the carrying amount of theassociated liabilities included in Other short-term borrowings and Long-term debt.
Under Japanese law, Japanese banks are required to maintain certain reserves on deposit with the Bank ofJapan based on the amount of deposit balances and certain other factors. There are similar reserve depositrequirements for foreign offices and subsidiaries engaged in banking businesses in foreign countries. AtMarch 31, 2018 and 2019 the reserve funds required to be maintained by the MUFG Group, which are includedin Cash and due from banks and Interest-earning deposits in other banks, were ¥2,679,482 million and¥2,568,340 million, respectively.
Collateral
The MUFG Group accepts and provides financial assets as collateral for transactions, principallycommercial loans, repurchase agreements and securities lending transactions, call money, and derivatives.Financial assets eligible for such collateral include, among others, marketable equity securities, trade and notesreceivable and CDs.
Secured parties, including creditors and counterparties to certain transactions with the MUFG Group, maysell or repledge financial assets provided as collateral. Certain contracts, however, may not be specific about thesecured party’s right to sell or repledge collateral under the applicable statutes and, therefore, whether or not thesecured party is permitted to sell or repledge collateral would differ depending on the interpretations of specificprovisions of the existing statutes, contract or certain market practices.
If the MUFG Group determines, based on available information, that a financial asset provided as collateralmight not be sold or repledged by the secured parties, such collateral is not separately reported in theaccompanying consolidated balance sheets. If a secured party is permitted to sell or repledge financial assetsprovided as collateral by contract or custom under the existing statutes, the MUFG Group reports such pledgedfinancial assets separately on the face of the accompanying consolidated balance sheets. At March 31, 2019, theMUFG Group pledged ¥30,204 billion of assets that may not be sold or repledged by the secured parties.
Certain banking subsidiaries accept collateral for commercial loans and certain banking transactions under astandardized agreement with customers, which provides that these banking subsidiaries may require the
F-71

MITSUBISHI UFJ FINANCIAL GROUP, INC. AND SUBSIDIARIES
NOTES TO CONSOLIDATED FINANCIAL STATEMENTS—(Continued)
customers to provide collateral or guarantees with respect to the loans and other banking transactions. Financialassets pledged as collateral are generally negotiable and transferable instruments, and such negotiability andtransferability are authorized by applicable legislation. In principle, Japanese legislation permits these bankingsubsidiaries to repledge financial assets accepted as collateral unless otherwise prohibited by contract or relevantstatutes. Nevertheless, the MUFG Group did not sell or repledge nor does it plan to sell or repledge suchcollateral accepted in connection with commercial loans before a debtor’s default or other credit events specifiedin the agreements as it is not customary within the banking industry in Japan to dispose of collateral before adebtor’s default and other specified credit events. Derivative agreements commonly used in the marketplace donot prohibit a secured party’s disposition of financial assets received as collateral, and in resale agreements andsecurities borrowing transactions, securities accepted as collateral may be sold or repledged by the securedparties. At March 31, 2018 and 2019, the fair value of the collateral accepted by the MUFG Group that ispermitted to be sold or repledged was ¥25,358 billion and ¥22,927 billion, respectively, of which ¥17,738 billionand ¥16,514 billion, respectively, was sold or repledged.
At March 31, 2018 and 2019, the cash collateral pledged for derivative transactions, which is included inOther assets, was ¥1,473,109 million and ¥1,276,897 million, respectively, and the cash collateral received forderivative transactions, which is included in Other liabilities, was ¥1,158,053 million and ¥844,234 million,respectively.
9. DEPOSITS
The balances of time deposits, including CDs, issued in amounts of ¥10 million (approximatelyU.S.$90 thousand at the Federal Reserve Bank of New York’s noon buying rate on March 29, 2019) or more withrespect to domestic deposits and issued in amounts of U.S.$100,000 or more with respect to foreign depositswere ¥27,381,920 million and ¥22,386,612 million, respectively, at March 31, 2018, and ¥25,899,780 millionand ¥23,858,381 million, respectively, at March 31, 2019.
The maturity information at March 31, 2019 for domestic and foreign time deposits, including CDs, issummarized as follows:
Domestic Foreign
(in millions)Due in one year or less . . . . . . . . . . . . . . . . . . . . . . . . . . . . . . . . . . . . . . . . . . . . . . . . ¥33,351,324 ¥23,559,245Due after one year through two years . . . . . . . . . . . . . . . . . . . . . . . . . . . . . . . . . . . . . 4,987,763 1,145,596Due after two years through three years . . . . . . . . . . . . . . . . . . . . . . . . . . . . . . . . . . . 2,688,960 351,794Due after three years through four years . . . . . . . . . . . . . . . . . . . . . . . . . . . . . . . . . . . 539,629 146,985Due after four years through five years . . . . . . . . . . . . . . . . . . . . . . . . . . . . . . . . . . . . 574,244 22,104Due after five years . . . . . . . . . . . . . . . . . . . . . . . . . . . . . . . . . . . . . . . . . . . . . . . . . . . 836,549 29,634
Total . . . . . . . . . . . . . . . . . . . . . . . . . . . . . . . . . . . . . . . . . . . . . . . . . . . . . . . . . . ¥42,978,469 ¥25,255,358
10. CALL MONEY AND FUNDS PURCHASED
A summary of funds transactions for the fiscal years ended March 31, 2018 and 2019 is as follows:
2018 2019
(in millions, except percentages and days)Outstanding at end of fiscal year:
Amount . . . . . . . . . . . . . . . . . . . . . . . . . . . . . . . . . . . . . . . . . . . . . . . . ¥ 2,452,543 ¥ 2,450,320Principal range of maturities . . . . . . . . . . . . . . . . . . . . . . . . . . . . . . . . 1 day to 30 days 1 day to 30 daysWeighted average interest rate . . . . . . . . . . . . . . . . . . . . . . . . . . . . . . 0.31% 0.12%
F-72
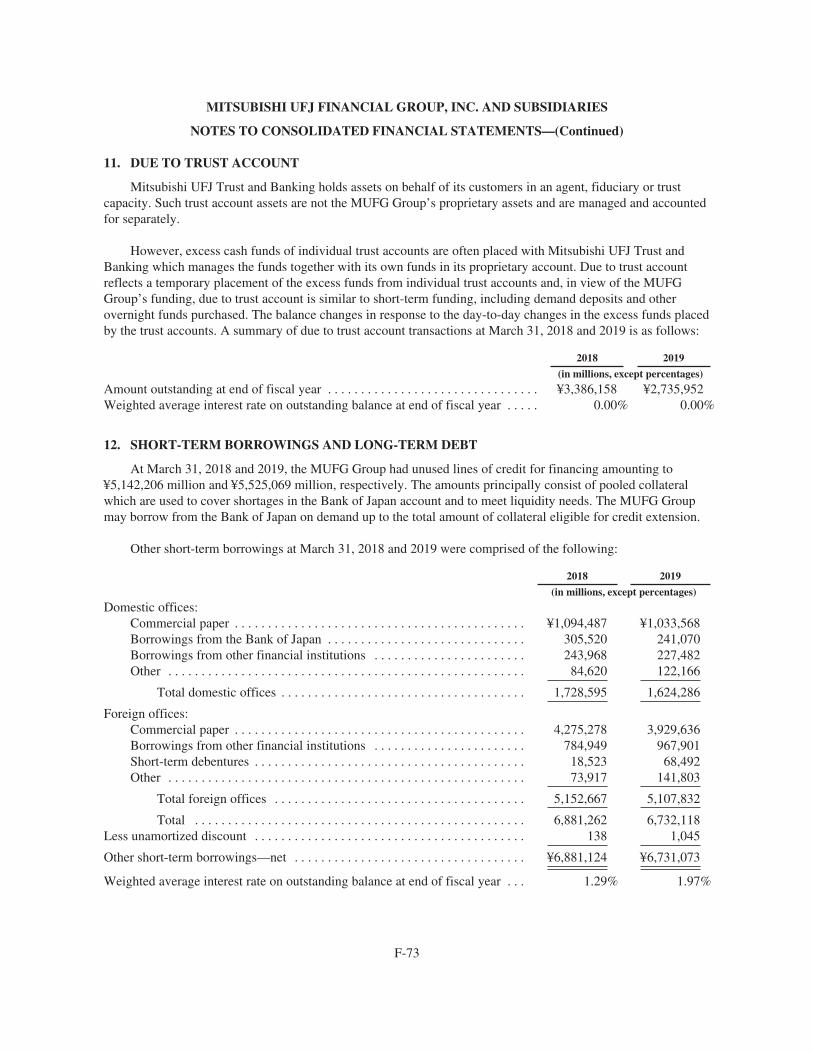
MITSUBISHI UFJ FINANCIAL GROUP, INC. AND SUBSIDIARIES
NOTES TO CONSOLIDATED FINANCIAL STATEMENTS—(Continued)
11. DUE TO TRUST ACCOUNT
Mitsubishi UFJ Trust and Banking holds assets on behalf of its customers in an agent, fiduciary or trustcapacity. Such trust account assets are not the MUFG Group’s proprietary assets and are managed and accountedfor separately.
However, excess cash funds of individual trust accounts are often placed with Mitsubishi UFJ Trust andBanking which manages the funds together with its own funds in its proprietary account. Due to trust accountreflects a temporary placement of the excess funds from individual trust accounts and, in view of the MUFGGroup’s funding, due to trust account is similar to short-term funding, including demand deposits and otherovernight funds purchased. The balance changes in response to the day-to-day changes in the excess funds placedby the trust accounts. A summary of due to trust account transactions at March 31, 2018 and 2019 is as follows:
2018 2019
(in millions, except percentages)
Amount outstanding at end of fiscal year . . . . . . . . . . . . . . . . . . . . . . . . . . . . . . . . ¥3,386,158 ¥2,735,952Weighted average interest rate on outstanding balance at end of fiscal year . . . . . 0.00% 0.00%
12. SHORT-TERM BORROWINGS AND LONG-TERM DEBT
At March 31, 2018 and 2019, the MUFG Group had unused lines of credit for financing amounting to¥5,142,206 million and ¥5,525,069 million, respectively. The amounts principally consist of pooled collateralwhich are used to cover shortages in the Bank of Japan account and to meet liquidity needs. The MUFG Groupmay borrow from the Bank of Japan on demand up to the total amount of collateral eligible for credit extension.
Other short-term borrowings at March 31, 2018 and 2019 were comprised of the following:
2018 2019
(in millions, except percentages)
Domestic offices:Commercial paper . . . . . . . . . . . . . . . . . . . . . . . . . . . . . . . . . . . . . . . . . . . . ¥1,094,487 ¥1,033,568Borrowings from the Bank of Japan . . . . . . . . . . . . . . . . . . . . . . . . . . . . . . 305,520 241,070Borrowings from other financial institutions . . . . . . . . . . . . . . . . . . . . . . . 243,968 227,482Other . . . . . . . . . . . . . . . . . . . . . . . . . . . . . . . . . . . . . . . . . . . . . . . . . . . . . . 84,620 122,166
Total domestic offices . . . . . . . . . . . . . . . . . . . . . . . . . . . . . . . . . . . . . 1,728,595 1,624,286
Foreign offices:Commercial paper . . . . . . . . . . . . . . . . . . . . . . . . . . . . . . . . . . . . . . . . . . . . 4,275,278 3,929,636Borrowings from other financial institutions . . . . . . . . . . . . . . . . . . . . . . . 784,949 967,901Short-term debentures . . . . . . . . . . . . . . . . . . . . . . . . . . . . . . . . . . . . . . . . . 18,523 68,492Other . . . . . . . . . . . . . . . . . . . . . . . . . . . . . . . . . . . . . . . . . . . . . . . . . . . . . . 73,917 141,803
Total foreign offices . . . . . . . . . . . . . . . . . . . . . . . . . . . . . . . . . . . . . . 5,152,667 5,107,832
Total . . . . . . . . . . . . . . . . . . . . . . . . . . . . . . . . . . . . . . . . . . . . . . . . . . 6,881,262 6,732,118Less unamortized discount . . . . . . . . . . . . . . . . . . . . . . . . . . . . . . . . . . . . . . . . . 138 1,045
Other short-term borrowings—net . . . . . . . . . . . . . . . . . . . . . . . . . . . . . . . . . . . ¥6,881,124 ¥6,731,073
Weighted average interest rate on outstanding balance at end of fiscal year . . . 1.29% 1.97%
F-73

MITSUBISHI UFJ FINANCIAL GROUP, INC. AND SUBSIDIARIES
NOTES TO CONSOLIDATED FINANCIAL STATEMENTS—(Continued)
Long-term debt (with original maturities of more than one year) at March 31, 2018 and 2019 was comprisedof the following:
2018 2019
(in millions)MUFG:
Obligations under capital leases . . . . . . . . . . . . . . . . . . . . . . . . . . . . . . . . . . . . . . . . . . . . . . . . . . . . . ¥ 1,973 ¥ 1,725Unsubordinated debt(1):
Fixed rate bonds, payable in US dollars, due 2021-2039, principally 2.19%-4.29% . . . . . . . . 1,737,809 2,949,022Fixed rate bonds, payable in Euro, due 2021-2033, principally 0.40%-1.75% . . . . . . . . . . . . . 230,629 301,124Fixed rate bonds, payable in other currencies, due 2025-2027, principally 3.55%-4.05%(2) . . 17,639 21,257Floating rate bonds, payable in US dollars, due 2021-2023, principally 3.31%-4.51% . . . . . . 424,795 765,188Floating rate bonds, payable in Euro, due 2023, principally 0.24% . . . . . . . . . . . . . . . . . . . . . — 43,596
Total . . . . . . . . . . . . . . . . . . . . . . . . . . . . . . . . . . . . . . . . . . . . . . . . . . . . . . . . . . . . . . . . . . 2,410,872 4,080,187
Subordinated debt(1):Fixed rate bonds, payable in Japanese yen, due 2024-2030, principally 0.37%-1.39% . . . . . . 482,662 618,925Adjustable rate bonds, payable in Japanese yen, due 2024-2028, principally 0.30%-0.66% . . 795,944 890,359Adjustable rate bonds, payable in Japanese yen, no stated maturity, principally
1.03%-4.42% . . . . . . . . . . . . . . . . . . . . . . . . . . . . . . . . . . . . . . . . . . . . . . . . . . . . . . . . . . . . . 1,557,610 1,706,695Adjustable rate borrowings, payable in Japanese yen, due 2025-2028, principally
0.46%-0.50% . . . . . . . . . . . . . . . . . . . . . . . . . . . . . . . . . . . . . . . . . . . . . . . . . . . . . . . . . . . . . 32,500 32,500Adjustable rate borrowings, payable in Japanese yen, no stated maturity, principally
1.17%-4.78% . . . . . . . . . . . . . . . . . . . . . . . . . . . . . . . . . . . . . . . . . . . . . . . . . . . . . . . . . . . . . 1,500 45,960Floating rate bonds, payable in Japanese yen, no stated maturity, principally 3.00% . . . . . . . . 3,500 3,500Floating rate borrowings, payable in Japanese yen, due 2025-2028, principally
0.57%-0.79% . . . . . . . . . . . . . . . . . . . . . . . . . . . . . . . . . . . . . . . . . . . . . . . . . . . . . . . . . . . . . 76,000 86,000
Total . . . . . . . . . . . . . . . . . . . . . . . . . . . . . . . . . . . . . . . . . . . . . . . . . . . . . . . . . . . . . . . . . . 2,949,716 3,383,939
Total . . . . . . . . . . . . . . . . . . . . . . . . . . . . . . . . . . . . . . . . . . . . . . . . . . . . . . . . . . . . . . . . . . . . . . . . 5,362,561 7,465,851
MUFG Bank:Obligations under capital leases . . . . . . . . . . . . . . . . . . . . . . . . . . . . . . . . . . . . . . . . . . . . . . . . . . . . . ¥ 6,906 ¥ 7,704Obligation under sale-and-leaseback transactions . . . . . . . . . . . . . . . . . . . . . . . . . . . . . . . . . . . . . . . 41,892 40,732Unsubordinated debt(1):
Fixed rate bonds, payable in Japanese yen, due 2019-2027, principally 0.22%-2.69% . . . . . . 346,800 234,500Fixed rate bonds, payable in US dollars, due 2019-2049, principally 0.00%-4.70% . . . . . . . . 1,451,745 1,284,812Fixed rate bonds, payable in Euro, due 2022-2037, principally 0.88%-2.06% . . . . . . . . . . . . . 111,956 112,687Fixed rate bonds, payable in other currencies, due 2021-2047, principally 0.00%-5.30%(2) . . 19,502 19,084Fixed rate borrowings, payable in Japanese yen, due 2019-2028, principally
0.00%-0.25% . . . . . . . . . . . . . . . . . . . . . . . . . . . . . . . . . . . . . . . . . . . . . . . . . . . . . . . . . . . . . 9,561,784 10,786,372Fixed rate borrowings, payable in US dollars, due 2018, principally 7.49% . . . . . . . . . . . . . . 38 —Fixed rate borrowings, payable in Euro, due 2026, principally 0.00% . . . . . . . . . . . . . . . . . . . 1,044 —Fixed rate borrowings, payable in other currencies, due 2030, principally 2.93%(2) . . . . . . . . . — 9,483Adjustable rate bonds, payable in US dollars, due 2030, principally 3.00% . . . . . . . . . . . . . . . 1,062 1,110Floating rate bonds, payable in US dollars, due 2018, principally 3.13% . . . . . . . . . . . . . . . . . 53,120 —Floating rate borrowings, payable in US dollars, due 2019-2031, principally
2.64%-3.34% . . . . . . . . . . . . . . . . . . . . . . . . . . . . . . . . . . . . . . . . . . . . . . . . . . . . . . . . . . . . . 1,071,239 1,008,949Floating rate borrowings, payable in Euro, due 2021-2022, principally 0.00%-0.06% . . . . . . 20,150 15,382Floating rate borrowings, payable in other currencies, due 2028, principally 3.23%(2) . . . . . . — 5,240
Total . . . . . . . . . . . . . . . . . . . . . . . . . . . . . . . . . . . . . . . . . . . . . . . . . . . . . . . . . . . . . . . . . . 12,638,440 13,477,619
Subordinated debt(1):Fixed rate bonds, payable in Japanese yen, due 2019-2031, principally 1.31%-2.91% . . . . . . 520,350 513,420Fixed rate borrowings, payable in Japanese yen, due 2022-2035, principally
0.37%-2.24% . . . . . . . . . . . . . . . . . . . . . . . . . . . . . . . . . . . . . . . . . . . . . . . . . . . . . . . . . . . . . 98,400 73,400Adjustable rate borrowings, payable in Japanese yen, due 2024-2028, principally
0.37%-2.56% . . . . . . . . . . . . . . . . . . . . . . . . . . . . . . . . . . . . . . . . . . . . . . . . . . . . . . . . . . . . . 73,000 20,000
F-74
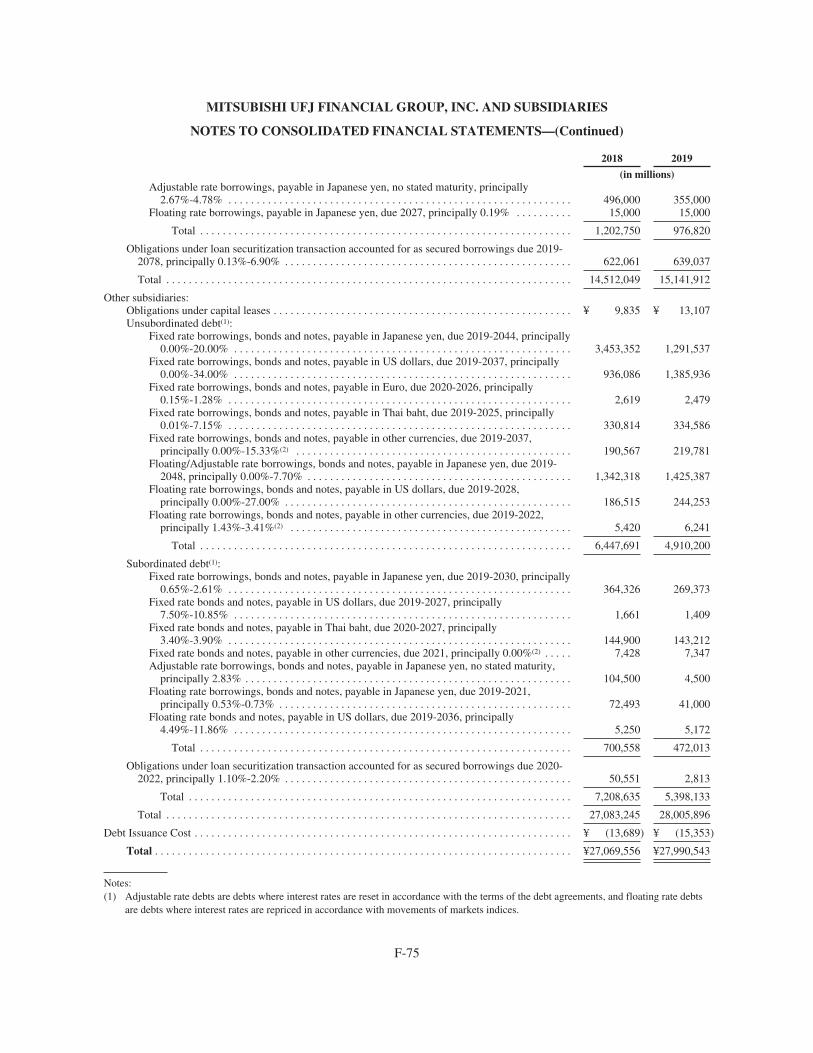
MITSUBISHI UFJ FINANCIAL GROUP, INC. AND SUBSIDIARIES
NOTES TO CONSOLIDATED FINANCIAL STATEMENTS—(Continued)
2018 2019
(in millions)Adjustable rate borrowings, payable in Japanese yen, no stated maturity, principally
2.67%-4.78% . . . . . . . . . . . . . . . . . . . . . . . . . . . . . . . . . . . . . . . . . . . . . . . . . . . . . . . . . . . . . 496,000 355,000Floating rate borrowings, payable in Japanese yen, due 2027, principally 0.19% . . . . . . . . . . 15,000 15,000
Total . . . . . . . . . . . . . . . . . . . . . . . . . . . . . . . . . . . . . . . . . . . . . . . . . . . . . . . . . . . . . . . . . . 1,202,750 976,820
Obligations under loan securitization transaction accounted for as secured borrowings due 2019-2078, principally 0.13%-6.90% . . . . . . . . . . . . . . . . . . . . . . . . . . . . . . . . . . . . . . . . . . . . . . . . . . . 622,061 639,037
Total . . . . . . . . . . . . . . . . . . . . . . . . . . . . . . . . . . . . . . . . . . . . . . . . . . . . . . . . . . . . . . . . . . . . . . . . 14,512,049 15,141,912
Other subsidiaries:Obligations under capital leases . . . . . . . . . . . . . . . . . . . . . . . . . . . . . . . . . . . . . . . . . . . . . . . . . . . . . ¥ 9,835 ¥ 13,107Unsubordinated debt(1):
Fixed rate borrowings, bonds and notes, payable in Japanese yen, due 2019-2044, principally0.00%-20.00% . . . . . . . . . . . . . . . . . . . . . . . . . . . . . . . . . . . . . . . . . . . . . . . . . . . . . . . . . . . . 3,453,352 1,291,537
Fixed rate borrowings, bonds and notes, payable in US dollars, due 2019-2037, principally0.00%-34.00% . . . . . . . . . . . . . . . . . . . . . . . . . . . . . . . . . . . . . . . . . . . . . . . . . . . . . . . . . . . . 936,086 1,385,936
Fixed rate borrowings, bonds and notes, payable in Euro, due 2020-2026, principally0.15%-1.28% . . . . . . . . . . . . . . . . . . . . . . . . . . . . . . . . . . . . . . . . . . . . . . . . . . . . . . . . . . . . . 2,619 2,479
Fixed rate borrowings, bonds and notes, payable in Thai baht, due 2019-2025, principally0.01%-7.15% . . . . . . . . . . . . . . . . . . . . . . . . . . . . . . . . . . . . . . . . . . . . . . . . . . . . . . . . . . . . . 330,814 334,586
Fixed rate borrowings, bonds and notes, payable in other currencies, due 2019-2037,principally 0.00%-15.33%(2) . . . . . . . . . . . . . . . . . . . . . . . . . . . . . . . . . . . . . . . . . . . . . . . . . 190,567 219,781
Floating/Adjustable rate borrowings, bonds and notes, payable in Japanese yen, due 2019-2048, principally 0.00%-7.70% . . . . . . . . . . . . . . . . . . . . . . . . . . . . . . . . . . . . . . . . . . . . . . . 1,342,318 1,425,387
Floating rate borrowings, bonds and notes, payable in US dollars, due 2019-2028,principally 0.00%-27.00% . . . . . . . . . . . . . . . . . . . . . . . . . . . . . . . . . . . . . . . . . . . . . . . . . . . 186,515 244,253
Floating rate borrowings, bonds and notes, payable in other currencies, due 2019-2022,principally 1.43%-3.41%(2) . . . . . . . . . . . . . . . . . . . . . . . . . . . . . . . . . . . . . . . . . . . . . . . . . . 5,420 6,241
Total . . . . . . . . . . . . . . . . . . . . . . . . . . . . . . . . . . . . . . . . . . . . . . . . . . . . . . . . . . . . . . . . . . 6,447,691 4,910,200
Subordinated debt(1):Fixed rate borrowings, bonds and notes, payable in Japanese yen, due 2019-2030, principally
0.65%-2.61% . . . . . . . . . . . . . . . . . . . . . . . . . . . . . . . . . . . . . . . . . . . . . . . . . . . . . . . . . . . . . 364,326 269,373Fixed rate bonds and notes, payable in US dollars, due 2019-2027, principally
7.50%-10.85% . . . . . . . . . . . . . . . . . . . . . . . . . . . . . . . . . . . . . . . . . . . . . . . . . . . . . . . . . . . . 1,661 1,409Fixed rate bonds and notes, payable in Thai baht, due 2020-2027, principally
3.40%-3.90% . . . . . . . . . . . . . . . . . . . . . . . . . . . . . . . . . . . . . . . . . . . . . . . . . . . . . . . . . . . . . 144,900 143,212Fixed rate bonds and notes, payable in other currencies, due 2021, principally 0.00%(2) . . . . . 7,428 7,347Adjustable rate borrowings, bonds and notes, payable in Japanese yen, no stated maturity,
principally 2.83% . . . . . . . . . . . . . . . . . . . . . . . . . . . . . . . . . . . . . . . . . . . . . . . . . . . . . . . . . . 104,500 4,500Floating rate borrowings, bonds and notes, payable in Japanese yen, due 2019-2021,
principally 0.53%-0.73% . . . . . . . . . . . . . . . . . . . . . . . . . . . . . . . . . . . . . . . . . . . . . . . . . . . . 72,493 41,000Floating rate bonds and notes, payable in US dollars, due 2019-2036, principally
4.49%-11.86% . . . . . . . . . . . . . . . . . . . . . . . . . . . . . . . . . . . . . . . . . . . . . . . . . . . . . . . . . . . . 5,250 5,172
Total . . . . . . . . . . . . . . . . . . . . . . . . . . . . . . . . . . . . . . . . . . . . . . . . . . . . . . . . . . . . . . . . . . 700,558 472,013
Obligations under loan securitization transaction accounted for as secured borrowings due 2020-2022, principally 1.10%-2.20% . . . . . . . . . . . . . . . . . . . . . . . . . . . . . . . . . . . . . . . . . . . . . . . . . . . 50,551 2,813
Total . . . . . . . . . . . . . . . . . . . . . . . . . . . . . . . . . . . . . . . . . . . . . . . . . . . . . . . . . . . . . . . . . . . . 7,208,635 5,398,133
Total . . . . . . . . . . . . . . . . . . . . . . . . . . . . . . . . . . . . . . . . . . . . . . . . . . . . . . . . . . . . . . . . . . . . . . . . 27,083,245 28,005,896
Debt Issuance Cost . . . . . . . . . . . . . . . . . . . . . . . . . . . . . . . . . . . . . . . . . . . . . . . . . . . . . . . . . . . . . . . . . . . ¥ (13,689) ¥ (15,353)
Total . . . . . . . . . . . . . . . . . . . . . . . . . . . . . . . . . . . . . . . . . . . . . . . . . . . . . . . . . . . . . . . . . . . . . . . . . . ¥27,069,556 ¥27,990,543
Notes:(1) Adjustable rate debts are debts where interest rates are reset in accordance with the terms of the debt agreements, and floating rate debts
are debts where interest rates are repriced in accordance with movements of markets indices.
F-75

MITSUBISHI UFJ FINANCIAL GROUP, INC. AND SUBSIDIARIES
NOTES TO CONSOLIDATED FINANCIAL STATEMENTS—(Continued)
(2) Minor currencies, such as Australian dollars, British pounds, Indonesian rupiah, Brazilian real, Russian ruble, etc, have been summarizedinto the “other currencies” classification.
The MUFG Group uses derivative financial instruments to manage its interest rate and currency exposuresfor certain debts. The derivative financial instruments include swaps, forwards, options and other types ofderivatives. As a result of these derivative instruments, the effective rates reflected in the table above may differfrom the coupon rates. The interest rates for the adjustable and floating rate debt shown in the above table arethose in effect at March 31, 2018 and 2019.
Certain debt agreements permit the MUFG Group to redeem the related debt, in whole or in part, prior tomaturity at the option of the issuer on terms specified in the respective agreements.
The following is a summary of maturities of long-term debt subsequent to March 31, 2019:
MUFG BKOther
subsidiaries Total
(in millions)
Fiscal year ending March 31:2020 . . . . . . . . . . . . . . . . . . . . . . . . . . . . . . . . . . . . . ¥ 450 ¥ 1,551,272 ¥1,502,213 ¥ 3,053,9352021 . . . . . . . . . . . . . . . . . . . . . . . . . . . . . . . . . . . . . 685,348 8,552,229 895,647 10,133,2242022 . . . . . . . . . . . . . . . . . . . . . . . . . . . . . . . . . . . . . 1,172,368 2,166,840 720,272 4,059,4802023 . . . . . . . . . . . . . . . . . . . . . . . . . . . . . . . . . . . . . 746,235 663,227 580,257 1,989,7192024 . . . . . . . . . . . . . . . . . . . . . . . . . . . . . . . . . . . . . 265,873 315,828 414,380 996,0812025 and thereafter . . . . . . . . . . . . . . . . . . . . . . . . . 4,595,577 1,892,516 1,285,364 7,773,457
Total . . . . . . . . . . . . . . . . . . . . . . . . . . . . . . . . ¥7,465,851 ¥15,141,912 ¥5,398,133 ¥28,005,896
New Issuances of Bonds for Basel III
For the fiscal year ended March 31, 2019, the MUFG Group issued to institutional investors in Japan¥155,000 million aggregate principal amount of unsecured perpetual subordinated Additional Tier 1 notes. Thesenotes are subject to the MUFG Group’s discretion to cease interest payments and a write-down of the principalupon the occurrence of certain events, including when the MUFG Group’s Common Equity Tier 1 ratio declinesbelow 5.125%, when the MUFG Group is deemed to be at risk of becoming non-viable or when the MUFGGroup becomes subject to bankruptcy proceedings.
For the fiscal year ended March 31, 2019, the MUFG Group issued $13,220 million (approximately¥1,467,288 million), €1,000 million (approximately ¥124,560 million) and HK$302 million (approximately¥4,270 million) of bonds with an intent to count towards Total Loss-Absorbing Capacity (“TLAC”) to globalinstitutional investors to meet the TLAC requirement under the standards issued by the Financial Stability Board(“FSB”). Under the FSB’s TLAC standard, the MUFG Group is required to hold TLAC debt in an amount notless than 16% of risk-weighted assets and 6% of the applicable Basel III leverage ratio denominator byJanuary 1, 2019, and not less than 18% of risk-weighted assets and 6.75% of the applicable Basel III leverageratio denominator by January 1, 2022.
13. SEVERANCE INDEMNITIES AND PENSION PLANS
Defined Benefit Pension Plans
The MUFG Group has funded non-contributory defined benefit pension plans, which cover substantially allof its employees and mainly provide for lifetime annuity payments commencing at age 65 (“pension benefits”)based on eligible compensation at the time of severance, rank, years of service and other factors.
F-76

MITSUBISHI UFJ FINANCIAL GROUP, INC. AND SUBSIDIARIES
NOTES TO CONSOLIDATED FINANCIAL STATEMENTS—(Continued)
MUFG Bank and certain domestic subsidiaries, Mitsubishi UFJ Trust and Banking, Mitsubishi UFJSecurities Holdings, Mitsubishi UFJ NICOS and some subsidiaries of MUFG have non-contributory CorporateDefined Benefit Pension plans which provide benefits to all their domestic employees.
The MUFG Group also offers qualified and nonqualified defined benefit pension plans in foreign officesand subsidiaries for their employees. The qualified plans are non-contributory defined pension plans, whichprovide benefits upon retirement based on years of service and average compensation and cover substantially allof the employees of such foreign offices and subsidiaries. With respect to the offices and subsidiaries in theUnited States of America, the qualified plans are funded on a current basis in compliance with the requirement ofthe Employee Retirement Income Security Act of the United States of America. The nonqualified plans arenon-contributory defined benefit pension plans, under which certain employees earn pay and interest credits oncompensation amounts above the maximum stipulated by applicable laws under the qualified plans.
Severance Indemnities Plans
The MUFG Group has SIPs under which their employees in Japan, other than those who are directors, areentitled, under most circumstances, upon mandatory retirement at normal retirement age or earlier termination ofemployment, to lump-sum severance indemnities based on eligible compensation at the time of severance, rank,years of service and other factors. Under SIPs, benefit payments in the form of a lump-sum cash payment with nooption to receive annuity payments, upon mandatory retirement at normal retirement age or earlier termination ofemployment, are provided. When a benefit is paid in a single payment to a benefit payee under the plans, thepayment represents final relief of the obligation.
Other Postretirement Plans
The MUFG Group’s foreign offices and subsidiaries, primarily in the United States of America, providetheir employees with certain postretirement medical and life insurance benefits (“other benefits”).
F-77

MITSUBISHI UFJ FINANCIAL GROUP, INC. AND SUBSIDIARIES
NOTES TO CONSOLIDATED FINANCIAL STATEMENTS—(Continued)
Net periodic cost of pension benefits and other benefits for the fiscal years ended March 31, 2017, 2018 and2019 include the following components:
Domestic subsidiaries Foreign offices and subsidiaries
2017 2018 2019 2017 2018 2019
Pensionbenefitsand SIP
Pensionbenefitsand SIP
Pensionbenefitsand SIP
Pensionbenefits
Otherbenefits
Pensionbenefits
Otherbenefits
Pensionbenefits
Otherbenefits
(in millions)
Service cost—benefitsearned during thefiscal year . . . . . . . . . ¥ 49,057 ¥ 47,064 ¥ 48,352 ¥ 13,107 ¥ 990 ¥ 10,169 ¥ 676 ¥ 12,395 ¥ 525
Interest cost onprojected benefitobligation . . . . . . . . . 12,308 14,383 13,504 15,287 1,229 15,359 1,079 14,958 1,046
Expected return on planassets . . . . . . . . . . . . . (60,255) (68,432) (74,270) (29,339) (2,047) (32,110) (2,122) (33,266) (2,314)
Amortization of netactuarial loss . . . . . . . 17,764 7,309 731 12,707 1,366 8,847 1,124 9,993 707
Amortization of priorservice cost . . . . . . . . (6,348) (1,094) (1,210) (2,045) (1,534) (3,090) (2,775) (3,039) (2,020)
Loss (gain) onsettlements andcurtailment . . . . . . . . (1,765) (4,394) (5,980) (208) — 52 — 49 —
Net periodic benefit cost(income) . . . . . . . . . . ¥ 10,761 ¥ (5,164) ¥(18,873) ¥ 9,509 ¥ 4 ¥ (773) ¥(2,018) ¥ 1,090 ¥(2,056)
As a result of adopting the new guidance issued in March 2017, as described in Note 1, the service costcomponent continues to be presented in Salaries and employee benefits while other components of net pensionbenefit/cost (i.e., Interest cost on projected benefit obligation, Expected return on plan assets, Amortization of netactuarial loss, Amortization of prior service cost, and Loss (gain) on settlements and curtailment disclosed in theabove table) are now presented in Other non-interest expenses.
F-78
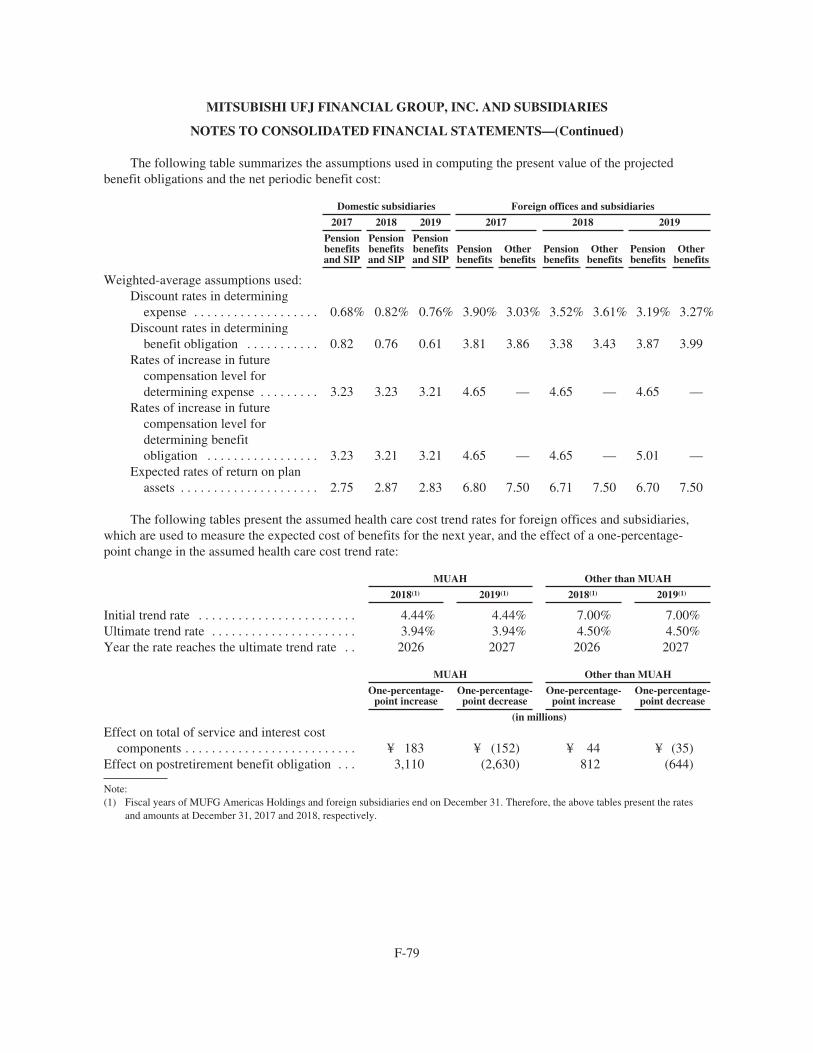
MITSUBISHI UFJ FINANCIAL GROUP, INC. AND SUBSIDIARIES
NOTES TO CONSOLIDATED FINANCIAL STATEMENTS—(Continued)
The following table summarizes the assumptions used in computing the present value of the projectedbenefit obligations and the net periodic benefit cost:
Domestic subsidiaries Foreign offices and subsidiaries
2017 2018 2019 2017 2018 2019
Pensionbenefitsand SIP
Pensionbenefitsand SIP
Pensionbenefitsand SIP
Pensionbenefits
Otherbenefits
Pensionbenefits
Otherbenefits
Pensionbenefits
Otherbenefits
Weighted-average assumptions used:Discount rates in determining
expense . . . . . . . . . . . . . . . . . . . 0.68% 0.82% 0.76% 3.90% 3.03% 3.52% 3.61% 3.19% 3.27%Discount rates in determining
benefit obligation . . . . . . . . . . . 0.82 0.76 0.61 3.81 3.86 3.38 3.43 3.87 3.99Rates of increase in future
compensation level fordetermining expense . . . . . . . . . 3.23 3.23 3.21 4.65 — 4.65 — 4.65 —
Rates of increase in futurecompensation level fordetermining benefitobligation . . . . . . . . . . . . . . . . . 3.23 3.21 3.21 4.65 — 4.65 — 5.01 —
Expected rates of return on planassets . . . . . . . . . . . . . . . . . . . . . 2.75 2.87 2.83 6.80 7.50 6.71 7.50 6.70 7.50
The following tables present the assumed health care cost trend rates for foreign offices and subsidiaries,which are used to measure the expected cost of benefits for the next year, and the effect of a one-percentage-point change in the assumed health care cost trend rate:
MUAH Other than MUAH
2018(1) 2019(1) 2018(1) 2019(1)
Initial trend rate . . . . . . . . . . . . . . . . . . . . . . . . 4.44% 4.44% 7.00% 7.00%Ultimate trend rate . . . . . . . . . . . . . . . . . . . . . . 3.94% 3.94% 4.50% 4.50%Year the rate reaches the ultimate trend rate . . 2026 2027 2026 2027
MUAH Other than MUAH
One-percentage-point increase
One-percentage-point decrease
One-percentage-point increase
One-percentage-point decrease
(in millions)
Effect on total of service and interest costcomponents . . . . . . . . . . . . . . . . . . . . . . . . . . ¥ 183 ¥ (152) ¥ 44 ¥ (35)
Effect on postretirement benefit obligation . . . 3,110 (2,630) 812 (644)
Note:(1) Fiscal years of MUFG Americas Holdings and foreign subsidiaries end on December 31. Therefore, the above tables present the rates
and amounts at December 31, 2017 and 2018, respectively.
F-79
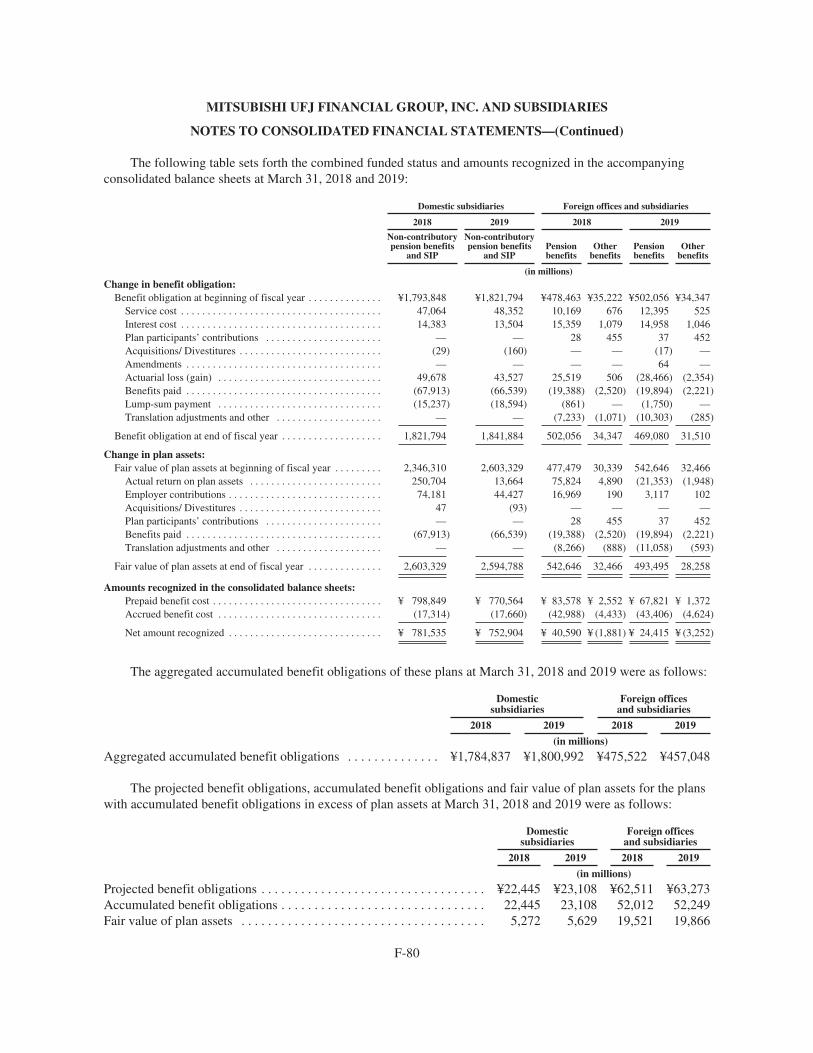
MITSUBISHI UFJ FINANCIAL GROUP, INC. AND SUBSIDIARIES
NOTES TO CONSOLIDATED FINANCIAL STATEMENTS—(Continued)
The following table sets forth the combined funded status and amounts recognized in the accompanyingconsolidated balance sheets at March 31, 2018 and 2019:
Domestic subsidiaries Foreign offices and subsidiaries
2018 2019 2018 2019
Non-contributorypension benefits
and SIP
Non-contributorypension benefits
and SIPPensionbenefits
Otherbenefits
Pensionbenefits
Otherbenefits
(in millions)Change in benefit obligation:
Benefit obligation at beginning of fiscal year . . . . . . . . . . . . . . ¥1,793,848 ¥1,821,794 ¥478,463 ¥35,222 ¥502,056 ¥34,347Service cost . . . . . . . . . . . . . . . . . . . . . . . . . . . . . . . . . . . . . . 47,064 48,352 10,169 676 12,395 525Interest cost . . . . . . . . . . . . . . . . . . . . . . . . . . . . . . . . . . . . . . 14,383 13,504 15,359 1,079 14,958 1,046Plan participants’ contributions . . . . . . . . . . . . . . . . . . . . . . — — 28 455 37 452Acquisitions/ Divestitures . . . . . . . . . . . . . . . . . . . . . . . . . . . (29) (160) — — (17) —Amendments . . . . . . . . . . . . . . . . . . . . . . . . . . . . . . . . . . . . . — — — — 64 —Actuarial loss (gain) . . . . . . . . . . . . . . . . . . . . . . . . . . . . . . . 49,678 43,527 25,519 506 (28,466) (2,354)Benefits paid . . . . . . . . . . . . . . . . . . . . . . . . . . . . . . . . . . . . . (67,913) (66,539) (19,388) (2,520) (19,894) (2,221)Lump-sum payment . . . . . . . . . . . . . . . . . . . . . . . . . . . . . . . (15,237) (18,594) (861) — (1,750) —Translation adjustments and other . . . . . . . . . . . . . . . . . . . . — — (7,233) (1,071) (10,303) (285)
Benefit obligation at end of fiscal year . . . . . . . . . . . . . . . . . . . 1,821,794 1,841,884 502,056 34,347 469,080 31,510
Change in plan assets:Fair value of plan assets at beginning of fiscal year . . . . . . . . . 2,346,310 2,603,329 477,479 30,339 542,646 32,466
Actual return on plan assets . . . . . . . . . . . . . . . . . . . . . . . . . 250,704 13,664 75,824 4,890 (21,353) (1,948)Employer contributions . . . . . . . . . . . . . . . . . . . . . . . . . . . . . 74,181 44,427 16,969 190 3,117 102Acquisitions/ Divestitures . . . . . . . . . . . . . . . . . . . . . . . . . . . 47 (93) — — — —Plan participants’ contributions . . . . . . . . . . . . . . . . . . . . . . — — 28 455 37 452Benefits paid . . . . . . . . . . . . . . . . . . . . . . . . . . . . . . . . . . . . . (67,913) (66,539) (19,388) (2,520) (19,894) (2,221)Translation adjustments and other . . . . . . . . . . . . . . . . . . . . — — (8,266) (888) (11,058) (593)
Fair value of plan assets at end of fiscal year . . . . . . . . . . . . . . 2,603,329 2,594,788 542,646 32,466 493,495 28,258
Amounts recognized in the consolidated balance sheets:Prepaid benefit cost . . . . . . . . . . . . . . . . . . . . . . . . . . . . . . . . ¥ 798,849 ¥ 770,564 ¥ 83,578 ¥ 2,552 ¥ 67,821 ¥ 1,372Accrued benefit cost . . . . . . . . . . . . . . . . . . . . . . . . . . . . . . . (17,314) (17,660) (42,988) (4,433) (43,406) (4,624)
Net amount recognized . . . . . . . . . . . . . . . . . . . . . . . . . . . . . ¥ 781,535 ¥ 752,904 ¥ 40,590 ¥ (1,881) ¥ 24,415 ¥ (3,252)
The aggregated accumulated benefit obligations of these plans at March 31, 2018 and 2019 were as follows:
Domesticsubsidiaries
Foreign officesand subsidiaries
2018 2019 2018 2019
(in millions)
Aggregated accumulated benefit obligations . . . . . . . . . . . . . . ¥1,784,837 ¥1,800,992 ¥475,522 ¥457,048
The projected benefit obligations, accumulated benefit obligations and fair value of plan assets for the planswith accumulated benefit obligations in excess of plan assets at March 31, 2018 and 2019 were as follows:
Domesticsubsidiaries
Foreign officesand subsidiaries
2018 2019 2018 2019
(in millions)
Projected benefit obligations . . . . . . . . . . . . . . . . . . . . . . . . . . . . . . . . . . ¥22,445 ¥23,108 ¥62,511 ¥63,273Accumulated benefit obligations . . . . . . . . . . . . . . . . . . . . . . . . . . . . . . . 22,445 23,108 52,012 52,249Fair value of plan assets . . . . . . . . . . . . . . . . . . . . . . . . . . . . . . . . . . . . . 5,272 5,629 19,521 19,866
F-80

MITSUBISHI UFJ FINANCIAL GROUP, INC. AND SUBSIDIARIES
NOTES TO CONSOLIDATED FINANCIAL STATEMENTS—(Continued)
MUFG Bank, Mitsubishi UFJ Trust and Banking, Mitsubishi UFJ Securities Holdings, Mitsubishi UFJNICOS and other subsidiaries paid special lump-sum termination benefits which are not a part of pension plansto certain early-terminated employees. The amounts charged to operations for such early termination benefits forthe fiscal years ended March 31, 2017, 2018 and 2019 were ¥7,722 million, ¥10,153 million and ¥9,325 million,respectively.
The following table presents the amounts recognized in Accumulated OCI of the MUFG Group atMarch 31, 2018 and 2019:
Domestic subsidiaries Foreign offices and subsidiaries
2018 2019 2018 2019
Pensionbenefitsand SIP
Pensionbenefitsand SIP
Pensionbenefits
Otherbenefits
Pensionbenefits
Otherbenefits
(in millions)
Net actuarial loss . . . . . . . . . . . . . . . . . ¥ 135,656 ¥ 245,037 ¥111,820 ¥ 7,449 ¥ 126,238 ¥ 8,628Prior service cost . . . . . . . . . . . . . . . . . (6,669) (5,459) (17,936) (6,237) (14,536) (4,263)
Gross amount recognized inAccumulated OCI . . . . . . . . . . . . . . 128,987 239,578 93,884 1,212 111,702 4,365
Taxes . . . . . . . . . . . . . . . . . . . . . . . . . . (81,747) (115,816) (25,251) (358) (29,875) (1,282)
Net amount recognized inAccumulated OCI . . . . . . . . . . . . . . ¥ 47,240 ¥ 123,762 ¥ 68,633 ¥ 854 ¥ 81,827 ¥ 3,083
The following table presents OCI for the fiscal years ended March 31, 2018 and 2019:
Domestic subsidiaries Foreign offices and subsidiaries
2018 2019 2018 2019
Pensionbenefitsand SIP
Pensionbenefitsand SIP
Pensionbenefits
Otherbenefits
Pensionbenefits
Otherbenefits
(in millions)
Net actuarial loss (gain) arising duringthe year . . . . . . . . . . . . . . . . . . . . . . . ¥(132,593) ¥ 104,132 ¥ (18,165) ¥ (2,262) ¥ 26,155 ¥ 1,908
Prior service cost arising during theyear . . . . . . . . . . . . . . . . . . . . . . . . . . — — — — 65 —
Losses (gains) due to amortization:Net actuarial loss . . . . . . . . . . . . . (7,309) (731) (8,847) (1,124) (9,993) (707)Prior service cost . . . . . . . . . . . . . 1,094 1,210 3,090 2,775 3,039 2,020
Curtailment and settlement . . . . . . . . . 4,394 5,980 (52) — (49) —Foreign currency translation
adjustments . . . . . . . . . . . . . . . . . . . — — (3,502) (36) (1,399) (68)
Total changes in Accumulated OCI . . . ¥(134,414) ¥ 110,591 ¥ (27,476) ¥ (647) ¥ 17,818 ¥ 3,153
F-81

MITSUBISHI UFJ FINANCIAL GROUP, INC. AND SUBSIDIARIES
NOTES TO CONSOLIDATED FINANCIAL STATEMENTS—(Continued)
The following table presents the expected amounts that will be amortized from Accumulated OCI ascomponents of net periodic benefit cost, before taxes, for the fiscal year ending March 31, 2020:
Domesticsubsidiaries
Foreign officesand subsidiaries
Pensionbenefitsand SIP
Pensionbenefits
Otherbenefits
(in millions)
Net actuarial loss . . . . . . . . . . . . . . . . . . . . . . . . . . . . . . . . . . . . . . . . . . . . . . . . . . ¥ 5,395 ¥ 7,731 ¥ 1,130Prior service cost . . . . . . . . . . . . . . . . . . . . . . . . . . . . . . . . . . . . . . . . . . . . . . . . . . (1,269) (3,056) (1,916)
Total . . . . . . . . . . . . . . . . . . . . . . . . . . . . . . . . . . . . . . . . . . . . . . . . . . . . . . . . . . . . ¥ 4,126 ¥ 4,675 ¥ (786)
Investment policies
MUFG’s investment policy for plan assets is based on an asset liability matching strategy which is intendedto maintain adequate liquidity for benefit payments and to achieve a stable increase in the plan assets in themedium and long-term through proper risk control and return maximization. As a general rule, investmentpolicies for plan assets are reviewed periodically for some plans and in the following situations for all plans:(1) large fluctuations in pension plan liabilities caused by modifications to pension plans, or (2) changes in themarket environment. The plan assets allocation strategies are the principal determinant in achieving expectedinvestment returns on the plan assets. Actual asset allocations may fluctuate within acceptable ranges due tomarket value variability. Plan assets are managed by a combination of internal and external asset managementcompanies and are rebalanced when market fluctuations cause an asset category to fall outside of its strategicasset allocation range. Performance of each plan asset category is compared against established indices andsimilar plan asset groups to evaluate whether the risk associated with the portfolio is appropriate for the level ofreturn.
The weighted-average target asset allocation of plan assets for the pension benefits and other benefits atMarch 31, 2019 was as follows:
Domesticsubsidiaries
Foreign officesand subsidiaries
Asset category
Pensionbenefitsand SIP
Pensionbenefits
Otherbenefits
Japanese equity securities . . . . . . . . . . . . . . . . . . . . . . . . . . . . . . . . . . . . . . . . . . . . 39.3% 0.3% —%Japanese debt securities . . . . . . . . . . . . . . . . . . . . . . . . . . . . . . . . . . . . . . . . . . . . . . 32.1 — —Non-Japanese equity securities . . . . . . . . . . . . . . . . . . . . . . . . . . . . . . . . . . . . . . . . 14.9 48.5 70.0Non-Japanese debt securities . . . . . . . . . . . . . . . . . . . . . . . . . . . . . . . . . . . . . . . . . . 9.1 39.1 30.0Real estate . . . . . . . . . . . . . . . . . . . . . . . . . . . . . . . . . . . . . . . . . . . . . . . . . . . . . . . . 1.3 9.9 —Short-term assets . . . . . . . . . . . . . . . . . . . . . . . . . . . . . . . . . . . . . . . . . . . . . . . . . . . 3.3 2.2 —
Total . . . . . . . . . . . . . . . . . . . . . . . . . . . . . . . . . . . . . . . . . . . . . . . . . . . . . . . . . 100.0% 100.0% 100.0%
Basis and procedure for estimating long-term return of each asset category
MUFG’s expected long-term rate of return on plan assets for domestic defined benefit pension plans andSIPs is based on a building-block methodology, which calculates the total long-term rate of return of the planassets by aggregating the weighted rate of return derived from both long-term historical performance andforward-looking return expectations from each asset category.
F-82

MITSUBISHI UFJ FINANCIAL GROUP, INC. AND SUBSIDIARIES
NOTES TO CONSOLIDATED FINANCIAL STATEMENTS—(Continued)
MUFG has determined the expected long-term rate of return for each asset category as follows:
‰ Japanese equity securities: the rate for Japanese debt securities plus a premium for the risk associatedwith Japanese equity securities
‰ Japanese debt securities: economic growth rate of Japan
‰ Non-Japanese equity securities: the rate for non-Japanese debt securities plus a premium for the riskassociated with non-Japanese equity securities
‰ Non-Japanese debt securities: global economic growth rate
Foreign offices and subsidiaries periodically reconsider the expected long-term rate of return for their planassets. They evaluate the investment return volatility of different asset categories and compare the liabilitystructure of their pension and other benefits to those of other companies, while considering their funding policyto maintain a funded status sufficient to meet participants’ benefit obligations, and reduce long-term fundingrequirements and pension costs. Based on this information, foreign offices and subsidiaries update the expectedlong-term rate of return.
Cash flows
The MUFG Group expects to contribute to the plan assets for the fiscal year ending March 31, 2020 basedupon its current funded status and expected asset return assumptions as follows:
For the pension benefits of domestic subsidiaries . . . . . . . . . . . . . . . . . . . . . . . . . . . . . . . . . ¥ 32.7 billionFor the pension benefits of foreign offices and subsidiaries . . . . . . . . . . . . . . . . . . . . . . . . . 0.7 billionFor the other benefits of foreign offices and subsidiaries . . . . . . . . . . . . . . . . . . . . . . . . . . . 0.4 billion
Estimated future benefit payments
The following table presents benefit payments expected to be paid, which include the effect of expectedfuture service for the fiscal years indicated:
Domesticsubsidiaries
Foreign officesand subsidiaries
Pensionbenefitsand SIP
Pensionbenefits
Otherbenefits
(in millions)
Fiscal year ending March 31:2020 . . . . . . . . . . . . . . . . . . . . . . . . . . . . . . . . . . . . . . . . . . . . . . . . . . . . . . ¥ 84,558 ¥ 19,923 ¥ 1,9972021 . . . . . . . . . . . . . . . . . . . . . . . . . . . . . . . . . . . . . . . . . . . . . . . . . . . . . . 82,297 20,928 2,0722022 . . . . . . . . . . . . . . . . . . . . . . . . . . . . . . . . . . . . . . . . . . . . . . . . . . . . . . 82,320 21,903 2,1292023 . . . . . . . . . . . . . . . . . . . . . . . . . . . . . . . . . . . . . . . . . . . . . . . . . . . . . . 81,710 22,881 2,1772024 . . . . . . . . . . . . . . . . . . . . . . . . . . . . . . . . . . . . . . . . . . . . . . . . . . . . . . 81,684 23,726 2,205Thereafter (2025-2029) . . . . . . . . . . . . . . . . . . . . . . . . . . . . . . . . . . . . . . . 401,772 162,850 10,222
F-83

MITSUBISHI UFJ FINANCIAL GROUP, INC. AND SUBSIDIARIES
NOTES TO CONSOLIDATED FINANCIAL STATEMENTS—(Continued)
Fair value measurement of the plan assets
The following is a description of the valuation methodologies used for plan assets measured at fair value aswell as the classification of the plan assets pursuant to the fair value hierarchy described in Note 32:
Government bonds and other debt securities
When quoted prices are available in an active market, the MUFG Group adopts the quoted prices to measurethe fair value of securities and such securities are classified in Level 1 of the fair value hierarchy. Level 1securities include Japanese government bonds, most non-Japanese government bonds and certain corporatebonds. When quoted prices are available but not traded actively, such securities are classified in Level 2 of thefair value hierarchy. When quoted prices are not available, the MUFG Group generally estimates fair values byusing non-binding prices obtained from independent pricing vendors. Such securities are generally classified inLevel 2 of the fair value hierarchy. Level 2 securities include certain non-Japanese government bonds, officialinstitution bonds and corporate bonds. When there is lack of liquidity for securities or significant inputs adoptedto the fair value measurements are unobservable, such securities are classified in Level 3 of the fair valuehierarchy. Such Level 3 securities mainly consist of non-Japanese corporate bonds.
Marketable equity securities
When quoted prices are available in an active market, the MUFG Group adopts the quoted prices to measurethe fair value of marketable equity securities and such securities are classified in Level 1 of the fair valuehierarchy. When quoted prices are available but not traded actively, such securities are classified in Level 2 ofthe fair value hierarchy.
Japanese pooled funds
Japanese pooled funds are investment fund vehicles designed for Japanese pension plan investments underJapanese pension trust fund regulations. Based upon the nature of the funds’ investments, Japanese pooled fundsare categorized into four major fund types: Japanese marketable equity securities type, Japanese debt securitiestype, Non-Japanese marketable equity securities type and Non-Japanese debt securities type. The other types offunds invest in short-term financial instruments or loans receivable. Japanese pooled funds are generally readilyredeemable at their net asset values. The fair values of Japanese pooled funds are measured at their net assetvalues per share (or its equivalent) as a practical expedient.
Other investment funds
Other investment funds include mutual funds, private investments funds, common collective funds, privateequity funds and real estate funds. The listed investment funds or mutual funds are valued at quoted prices andclassified in Level 1 or Level 2 of the fair value hierarchy. When there is no available market quotation, the fairvalues are generally determined at net asset values per share (or its equivalent) as a practical expedient. Otherinvestment funds classified in Level 3 of the fair value hierarchy consist of certain real estate funds whose fairvalues are not measured at their net asset values but by using significant unobservable inputs and there is inherentlack of the funds’ liquidity.
Japanese general accounts of life insurance companies
These instruments are contracts with life insurance companies that guarantee return of a certain level offixed income, which are mainly invested in assets with low market risk such as Japanese debt securities. They aremeasured at conversion value and classified in Level 2 of the fair value hierarchy.
F-84

MITSUBISHI UFJ FINANCIAL GROUP, INC. AND SUBSIDIARIES
NOTES TO CONSOLIDATED FINANCIAL STATEMENTS—(Continued)
Other investments
Other investments mainly consist of call loans and the rest consist of miscellaneous accounts such asdeposits with banks and short-term investments. These instruments are generally classified in Level 1 or Level 2of the fair value hierarchy depending on observability of the inputs to measure their fair values.
The following table presents the fair value of each major category of plan assets as of March 31, 2018 and2019:
Pension benefits and SIP Investments:
At March 31, 2018 Domestic subsidiaries Foreign offices and subsidiaries
Assets category Level 1 Level 2 Level 3 Total Level 1 Level 2 Level 3 Total
(in millions)Japanese government bonds . . . . . . . . . . . ¥ 139,847 ¥ — ¥ — ¥ 139,847 ¥ — ¥ — ¥ — ¥ —Non-Japanese government bonds . . . . . . 15,552 944 — 16,496 17,945 4,081 — 22,026Other debt securities . . . . . . . . . . . . . . . . 201 3,482 1,071 4,754 — 81,968 — 81,968Japanese marketable equity securities . . . 934,691 — — 934,691 887 — — 887Non-Japanese marketable equity
securities . . . . . . . . . . . . . . . . . . . . . . . 71,729 255 — 71,984 42,166 815 — 42,981Other investment funds . . . . . . . . . . . . . . — — — — 99,798 9,997 — 109,795(2)
Japanese general account of lifeinsurance companies(1) . . . . . . . . . . . . . — 225,925 — 225,925 — — — —
Other investments . . . . . . . . . . . . . . . . . . 3,485 23,195 — 26,680 2 4,867 155 5,024
Total . . . . . . . . . . . . . . . . . . . . . . . . . . . . . ¥1,165,505 ¥253,801 ¥1,071 ¥1,420,377 ¥160,798 ¥101,728 ¥155 ¥262,681
At March 31, 2019 Domestic subsidiaries Foreign offices and subsidiaries
Assets category Level 1 Level 2 Level 3 Total Level 1 Level 2 Level 3 Total
(in millions)Japanese government bonds . . . . . . . . . . . ¥ 146,060 ¥ — ¥ — ¥ 146,060 ¥ — ¥ — ¥ — ¥ —Non-Japanese government bonds . . . . . . 8,570 656 — 9,226 38,687 4,615 — 43,302Other debt securities . . . . . . . . . . . . . . . . 109 3,698 1,030 4,837 — 100,462 — 100,462Japanese marketable equity securities . . . 855,353 — — 855,353 — — — —Non-Japanese marketable equity
securities . . . . . . . . . . . . . . . . . . . . . . . 64,957 234 — 65,191 20,569 652 — 21,221Other investment funds . . . . . . . . . . . . . . — — — — 73,286 9,044 — 82,330(2)
Japanese general account of lifeinsurance companies(1) . . . . . . . . . . . . . — 222,460 — 222,460 — — — —
Other investments . . . . . . . . . . . . . . . . . . 917 18,626 — 19,543 18 4,415 188 4,621
Total . . . . . . . . . . . . . . . . . . . . . . . . . . . . . ¥1,075,966 ¥245,674 ¥1,030 ¥1,322,670 ¥132,560 ¥119,188 ¥188 ¥251,936
Notes:(1) “Japanese general accounts of life insurance companies” is a contract with life insurance companies that guarantees a return of
approximately 1.24% from April 1, 2017 to March 31, 2018 and 1.24% from April 1, 2018 to March 31, 2019.(2) Other investment funds of the foreign offices and subsidiaries include mutual funds and real estate funds of ¥93,821 million and
¥516 million, respectively, which were held by MUFG Americas Holdings at December 31, 2017 and ¥68,556 million and nil,respectively, at December 31, 2018.
F-85
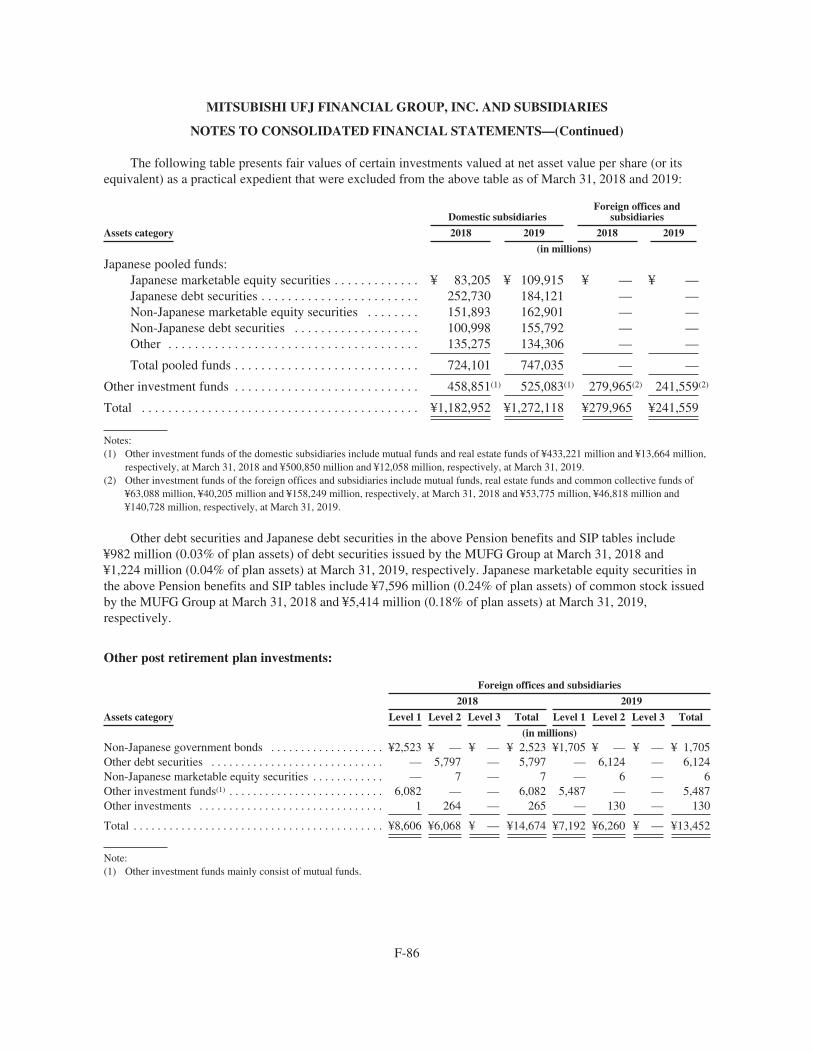
MITSUBISHI UFJ FINANCIAL GROUP, INC. AND SUBSIDIARIES
NOTES TO CONSOLIDATED FINANCIAL STATEMENTS—(Continued)
The following table presents fair values of certain investments valued at net asset value per share (or itsequivalent) as a practical expedient that were excluded from the above table as of March 31, 2018 and 2019:
Domestic subsidiariesForeign offices and
subsidiaries
Assets category 2018 2019 2018 2019
(in millions)
Japanese pooled funds:Japanese marketable equity securities . . . . . . . . . . . . . ¥ 83,205 ¥ 109,915 ¥ — ¥ —Japanese debt securities . . . . . . . . . . . . . . . . . . . . . . . . 252,730 184,121 — —Non-Japanese marketable equity securities . . . . . . . . 151,893 162,901 — —Non-Japanese debt securities . . . . . . . . . . . . . . . . . . . 100,998 155,792 — —Other . . . . . . . . . . . . . . . . . . . . . . . . . . . . . . . . . . . . . . 135,275 134,306 — —
Total pooled funds . . . . . . . . . . . . . . . . . . . . . . . . . . . . 724,101 747,035 — —
Other investment funds . . . . . . . . . . . . . . . . . . . . . . . . . . . . 458,851(1) 525,083(1) 279,965(2) 241,559(2)
Total . . . . . . . . . . . . . . . . . . . . . . . . . . . . . . . . . . . . . . . . . . ¥1,182,952 ¥1,272,118 ¥279,965 ¥241,559
Notes:(1) Other investment funds of the domestic subsidiaries include mutual funds and real estate funds of ¥433,221 million and ¥13,664 million,
respectively, at March 31, 2018 and ¥500,850 million and ¥12,058 million, respectively, at March 31, 2019.(2) Other investment funds of the foreign offices and subsidiaries include mutual funds, real estate funds and common collective funds of
¥63,088 million, ¥40,205 million and ¥158,249 million, respectively, at March 31, 2018 and ¥53,775 million, ¥46,818 million and¥140,728 million, respectively, at March 31, 2019.
Other debt securities and Japanese debt securities in the above Pension benefits and SIP tables include¥982 million (0.03% of plan assets) of debt securities issued by the MUFG Group at March 31, 2018 and¥1,224 million (0.04% of plan assets) at March 31, 2019, respectively. Japanese marketable equity securities inthe above Pension benefits and SIP tables include ¥7,596 million (0.24% of plan assets) of common stock issuedby the MUFG Group at March 31, 2018 and ¥5,414 million (0.18% of plan assets) at March 31, 2019,respectively.
Other post retirement plan investments:
Foreign offices and subsidiaries
2018 2019
Assets category Level 1 Level 2 Level 3 Total Level 1 Level 2 Level 3 Total
(in millions)Non-Japanese government bonds . . . . . . . . . . . . . . . . . . . ¥2,523 ¥ — ¥ — ¥ 2,523 ¥1,705 ¥ — ¥ — ¥ 1,705Other debt securities . . . . . . . . . . . . . . . . . . . . . . . . . . . . . — 5,797 — 5,797 — 6,124 — 6,124Non-Japanese marketable equity securities . . . . . . . . . . . . — 7 — 7 — 6 — 6Other investment funds(1) . . . . . . . . . . . . . . . . . . . . . . . . . . 6,082 — — 6,082 5,487 — — 5,487Other investments . . . . . . . . . . . . . . . . . . . . . . . . . . . . . . . 1 264 — 265 — 130 — 130
Total . . . . . . . . . . . . . . . . . . . . . . . . . . . . . . . . . . . . . . . . . . ¥8,606 ¥6,068 ¥ — ¥14,674 ¥7,192 ¥6,260 ¥ — ¥13,452
Note:(1) Other investment funds mainly consist of mutual funds.
F-86
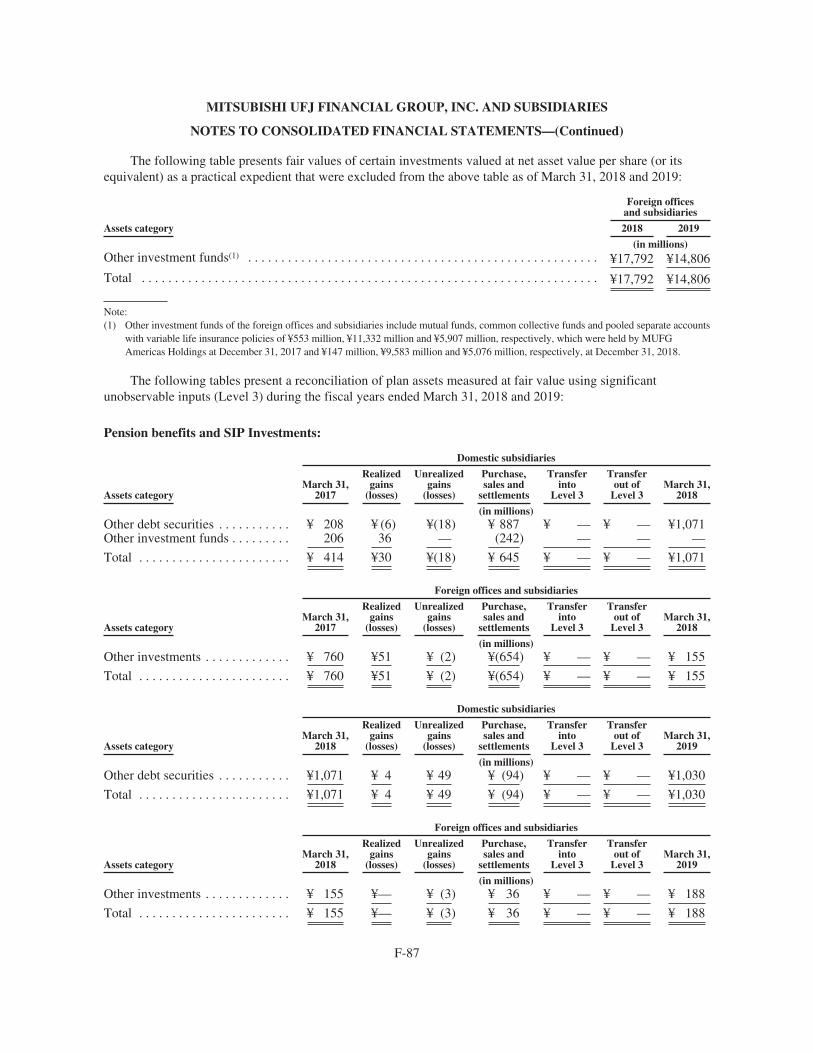
MITSUBISHI UFJ FINANCIAL GROUP, INC. AND SUBSIDIARIES
NOTES TO CONSOLIDATED FINANCIAL STATEMENTS—(Continued)
The following table presents fair values of certain investments valued at net asset value per share (or itsequivalent) as a practical expedient that were excluded from the above table as of March 31, 2018 and 2019:
Foreign officesand subsidiaries
Assets category 2018 2019
(in millions)Other investment funds(1) . . . . . . . . . . . . . . . . . . . . . . . . . . . . . . . . . . . . . . . . . . . . . . . . . . . . . ¥17,792 ¥14,806
Total . . . . . . . . . . . . . . . . . . . . . . . . . . . . . . . . . . . . . . . . . . . . . . . . . . . . . . . . . . . . . . . . . . . . . ¥17,792 ¥14,806
Note:(1) Other investment funds of the foreign offices and subsidiaries include mutual funds, common collective funds and pooled separate accounts
with variable life insurance policies of ¥553 million, ¥11,332 million and ¥5,907 million, respectively, which were held by MUFGAmericas Holdings at December 31, 2017 and ¥147 million, ¥9,583 million and ¥5,076 million, respectively, at December 31, 2018.
The following tables present a reconciliation of plan assets measured at fair value using significantunobservable inputs (Level 3) during the fiscal years ended March 31, 2018 and 2019:
Pension benefits and SIP Investments:
Domestic subsidiaries
Assets categoryMarch 31,
2017
Realizedgains
(losses)
Unrealizedgains
(losses)
Purchase,sales and
settlements
Transferinto
Level 3
Transferout of
Level 3March 31,
2018
(in millions)Other debt securities . . . . . . . . . . . ¥ 208 ¥ (6) ¥(18) ¥ 887 ¥ — ¥ — ¥1,071Other investment funds . . . . . . . . . 206 36 — (242) — — —
Total . . . . . . . . . . . . . . . . . . . . . . . ¥ 414 ¥30 ¥(18) ¥ 645 ¥ — ¥ — ¥1,071
Foreign offices and subsidiaries
Assets categoryMarch 31,
2017
Realizedgains
(losses)
Unrealizedgains
(losses)
Purchase,sales and
settlements
Transferinto
Level 3
Transferout of
Level 3March 31,
2018
(in millions)Other investments . . . . . . . . . . . . . ¥ 760 ¥51 ¥ (2) ¥(654) ¥ — ¥ — ¥ 155
Total . . . . . . . . . . . . . . . . . . . . . . . ¥ 760 ¥51 ¥ (2) ¥(654) ¥ — ¥ — ¥ 155
Domestic subsidiaries
Assets categoryMarch 31,
2018
Realizedgains
(losses)
Unrealizedgains
(losses)
Purchase,sales and
settlements
Transferinto
Level 3
Transferout of
Level 3March 31,
2019
(in millions)Other debt securities . . . . . . . . . . . ¥1,071 ¥ 4 ¥ 49 ¥ (94) ¥ — ¥ — ¥1,030
Total . . . . . . . . . . . . . . . . . . . . . . . ¥1,071 ¥ 4 ¥ 49 ¥ (94) ¥ — ¥ — ¥1,030
Foreign offices and subsidiaries
Assets categoryMarch 31,
2018
Realizedgains
(losses)
Unrealizedgains
(losses)
Purchase,sales and
settlements
Transferinto
Level 3
Transferout of
Level 3March 31,
2019
(in millions)Other investments . . . . . . . . . . . . . ¥ 155 ¥— ¥ (3) ¥ 36 ¥ — ¥ — ¥ 188
Total . . . . . . . . . . . . . . . . . . . . . . . ¥ 155 ¥— ¥ (3) ¥ 36 ¥ — ¥ — ¥ 188
F-87

MITSUBISHI UFJ FINANCIAL GROUP, INC. AND SUBSIDIARIES
NOTES TO CONSOLIDATED FINANCIAL STATEMENTS—(Continued)
Defined Contribution Plans
The MUFG Group maintains several qualified defined contribution plans in its domestic and foreign officesand subsidiaries, all of which are administered in accordance with applicable local laws and regulations. Eachoffice and subsidiary matches eligible employee contributions up to a certain percentage of benefits-eligiblecompensation per pay period, subject to plan and legal limits. Terms of the plan, including matching percentageand vesting periods, are individually determined by each office and subsidiary.
The cost of these defined contribution plans charged to operations for the fiscal years ended March 31,2017, 2018 and 2019 was ¥15,636 million, ¥17,413 million and ¥17,859 million, respectively.
14. OTHER ASSETS AND LIABILITIES
Major components of other assets and liabilities at March 31, 2018 and 2019 were as follows:
2018 2019
(in millions)
Other assets:Accounts receivable:
Receivables from brokers, dealers and customers for securitiestransactions . . . . . . . . . . . . . . . . . . . . . . . . . . . . . . . . . . . . . . . . . . . . . . . ¥ 1,017,194 ¥ 1,141,075
Other . . . . . . . . . . . . . . . . . . . . . . . . . . . . . . . . . . . . . . . . . . . . . . . . . . . . . . 1,190,885 1,394,794Investments in equity method investees . . . . . . . . . . . . . . . . . . . . . . . . . . . . . . . 2,219,196 2,487,389Prepaid benefit cost (Note 13) . . . . . . . . . . . . . . . . . . . . . . . . . . . . . . . . . . . . . . . 884,979 839,757Cash collateral pledged for derivative transactions (Note 8) . . . . . . . . . . . . . . . 1,473,109 1,276,897Cash collateral for the use of Bank of Japan’s settlement infrastructure . . . . . . 851,066 911,528Other . . . . . . . . . . . . . . . . . . . . . . . . . . . . . . . . . . . . . . . . . . . . . . . . . . . . . . . . . . 3,029,635 2,990,462
Total . . . . . . . . . . . . . . . . . . . . . . . . . . . . . . . . . . . . . . . . . . . . . . . . . . ¥10,666,064 ¥11,041,902
Other liabilities:Accounts payable:
Payables to brokers, dealers and customers for securities transactions . . . ¥ 1,247,652 ¥ 1,289,672Other . . . . . . . . . . . . . . . . . . . . . . . . . . . . . . . . . . . . . . . . . . . . . . . . . . . . . . 1,357,387 1,308,733
Deferred tax liabilities . . . . . . . . . . . . . . . . . . . . . . . . . . . . . . . . . . . . . . . . . . . . . 654,053 624,062Allowance for off-balance sheet credit instruments . . . . . . . . . . . . . . . . . . . . . . 81,739 119,307Accrued benefit cost (Note 13) . . . . . . . . . . . . . . . . . . . . . . . . . . . . . . . . . . . . . . 64,735 65,690Guarantees and indemnifications . . . . . . . . . . . . . . . . . . . . . . . . . . . . . . . . . . . . 41,349 45,346Cash collateral received for derivative transactions (Note 8) . . . . . . . . . . . . . . . 1,158,053 844,234Accrued and other liabilities . . . . . . . . . . . . . . . . . . . . . . . . . . . . . . . . . . . . . . . . 2,802,445 3,061,462
Total . . . . . . . . . . . . . . . . . . . . . . . . . . . . . . . . . . . . . . . . . . . . . . . . . . ¥ 7,407,413 ¥ 7,358,506
Investments in equity method investees include marketable equity securities carried at ¥1,627,896 millionand ¥1,936,468 million at March 31, 2018 and 2019, respectively. Corresponding aggregated market values were¥3,186,618 million and ¥2,702,838 million, respectively. Marketable equity securities include Morgan Stanley’scommon stock carried at ¥1,206,998 million and ¥1,326,339 million at March 31, 2018 and 2019, respectively.As of March 31, 2019, the MUFG Group held approximately 24.01% of its common stock. Investments in equitymethod investees also include investments in Morgan Stanley MUFG Securities, Co., Ltd. at ¥174,459 millionand ¥178,679 million at March 31, 2018 and 2019, respectively.
F-88

MITSUBISHI UFJ FINANCIAL GROUP, INC. AND SUBSIDIARIES
NOTES TO CONSOLIDATED FINANCIAL STATEMENTS—(Continued)
The MUFG Group periodically evaluates whether a loss in value of investments in equity method investeesis other-than-temporary. As a result of evaluations, the MUFG Group recognized other-than-temporary declinesin the value of an investment and recorded impairment losses related to certain affiliated companies of¥5,465 million, ¥29,442 million and ¥51,645 million for the fiscal years ended March 31, 2017, 2018 and 2019respectively. The impairment losses are included in Equity in earnings of equity method investees—net in theaccompanying consolidated statements of income.
Summarized Financial Information of the MUFG Group’s Equity Method Investees
Summarized financial information of Morgan Stanley, the largest portion of the MUFG Group’s equitymethod investees, as of March 31, 2018 and 2019, and for each of the three years ended March 31, 2019 is asfollows:
2018 2019
(in billions)
Trading assets . . . . . . . . . . . . . . . . . . . . . . . . . . . . . . . . . . . . . . . . . . . . . . . . . . . . . . . . . . . . . . ¥29,008 ¥ 29,392Securities purchased under agreements to resell . . . . . . . . . . . . . . . . . . . . . . . . . . . . . . . . . . . 8,525 10,718Securities borrowed . . . . . . . . . . . . . . . . . . . . . . . . . . . . . . . . . . . . . . . . . . . . . . . . . . . . . . . . . 14,431 15,416Total assets . . . . . . . . . . . . . . . . . . . . . . . . . . . . . . . . . . . . . . . . . . . . . . . . . . . . . . . . . . . . . . . . 91,207 97,223Deposits . . . . . . . . . . . . . . . . . . . . . . . . . . . . . . . . . . . . . . . . . . . . . . . . . . . . . . . . . . . . . . . . . . 17,043 19,948Customer and other payables . . . . . . . . . . . . . . . . . . . . . . . . . . . . . . . . . . . . . . . . . . . . . . . . . . 20,709 21,431Borrowings . . . . . . . . . . . . . . . . . . . . . . . . . . . . . . . . . . . . . . . . . . . . . . . . . . . . . . . . . . . . . . . . 20,713 21,165Total liabilities . . . . . . . . . . . . . . . . . . . . . . . . . . . . . . . . . . . . . . . . . . . . . . . . . . . . . . . . . . . . . 82,762 88,134Noncontrolling interests . . . . . . . . . . . . . . . . . . . . . . . . . . . . . . . . . . . . . . . . . . . . . . . . . . . . . . 155 130
2017 2018 2019
(in billions)
Net revenues . . . . . . . . . . . . . . . . . . . . . . . . . . . . . . . . . . . . . . . . . . . . . . . . . . . . . . . ¥3,939 ¥4,354 ¥ 4,365Total non-interest expenses . . . . . . . . . . . . . . . . . . . . . . . . . . . . . . . . . . . . . . . . . . . . 2,871 3,133 3,170Income from continuing operations before income taxes . . . . . . . . . . . . . . . . . . . . . 1,068 1,221 1,195Net income applicable to Morgan Stanley . . . . . . . . . . . . . . . . . . . . . . . . . . . . . . . . 730 759 944
Morgan Stanley early adopted the new accounting guidance on “Targeted Improvements to Accounting forHedging Activities” on January 1, 2018. This resulted in recording a cumulative catch-up adjustment by MorganStanley, decreasing the MUFG Group’s proportionate share of Retained earnings as reflected on the MUFGGroup’s consolidated statement of equity.
Summarized financial information of the MUFG Group’s equity method investees, other than MorganStanley as of March 31, 2018 and 2019, and for each of the three years ended March 31, 2019 is as follows:
2018 2019
(in billions)
Net loans . . . . . . . . . . . . . . . . . . . . . . . . . . . . . . . . . . . . . . . . . . . . . . . . . . . . . . . . . . . . . . . . . . ¥14,343 ¥15,772Total assets . . . . . . . . . . . . . . . . . . . . . . . . . . . . . . . . . . . . . . . . . . . . . . . . . . . . . . . . . . . . . . . . 26,008 28,910Deposits . . . . . . . . . . . . . . . . . . . . . . . . . . . . . . . . . . . . . . . . . . . . . . . . . . . . . . . . . . . . . . . . . . . 7,783 9,103Total liabilities . . . . . . . . . . . . . . . . . . . . . . . . . . . . . . . . . . . . . . . . . . . . . . . . . . . . . . . . . . . . . 21,209 23,423Noncontrolling interests . . . . . . . . . . . . . . . . . . . . . . . . . . . . . . . . . . . . . . . . . . . . . . . . . . . . . . 1,009 1,135
F-89
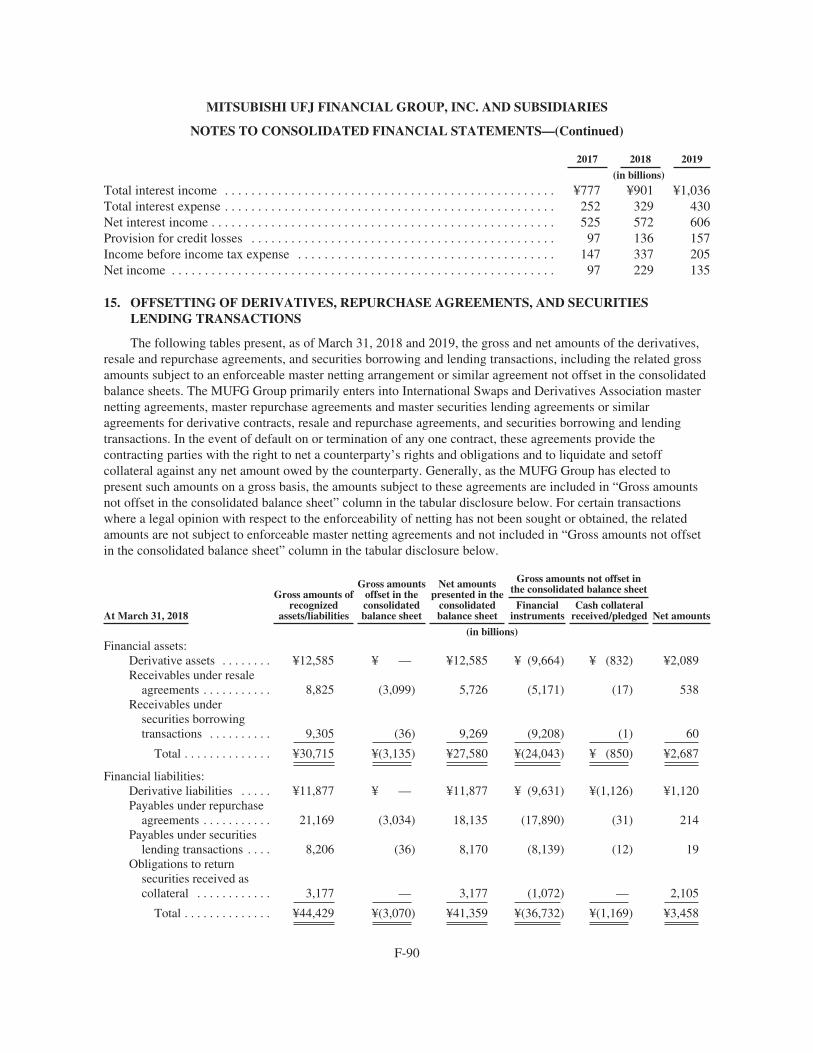
MITSUBISHI UFJ FINANCIAL GROUP, INC. AND SUBSIDIARIES
NOTES TO CONSOLIDATED FINANCIAL STATEMENTS—(Continued)
2017 2018 2019
(in billions)
Total interest income . . . . . . . . . . . . . . . . . . . . . . . . . . . . . . . . . . . . . . . . . . . . . . . . . . ¥777 ¥901 ¥1,036Total interest expense . . . . . . . . . . . . . . . . . . . . . . . . . . . . . . . . . . . . . . . . . . . . . . . . . . 252 329 430Net interest income . . . . . . . . . . . . . . . . . . . . . . . . . . . . . . . . . . . . . . . . . . . . . . . . . . . . 525 572 606Provision for credit losses . . . . . . . . . . . . . . . . . . . . . . . . . . . . . . . . . . . . . . . . . . . . . . 97 136 157Income before income tax expense . . . . . . . . . . . . . . . . . . . . . . . . . . . . . . . . . . . . . . . 147 337 205Net income . . . . . . . . . . . . . . . . . . . . . . . . . . . . . . . . . . . . . . . . . . . . . . . . . . . . . . . . . . 97 229 135
15. OFFSETTING OF DERIVATIVES, REPURCHASE AGREEMENTS, AND SECURITIESLENDING TRANSACTIONS
The following tables present, as of March 31, 2018 and 2019, the gross and net amounts of the derivatives,resale and repurchase agreements, and securities borrowing and lending transactions, including the related grossamounts subject to an enforceable master netting arrangement or similar agreement not offset in the consolidatedbalance sheets. The MUFG Group primarily enters into International Swaps and Derivatives Association masternetting agreements, master repurchase agreements and master securities lending agreements or similaragreements for derivative contracts, resale and repurchase agreements, and securities borrowing and lendingtransactions. In the event of default on or termination of any one contract, these agreements provide thecontracting parties with the right to net a counterparty’s rights and obligations and to liquidate and setoffcollateral against any net amount owed by the counterparty. Generally, as the MUFG Group has elected topresent such amounts on a gross basis, the amounts subject to these agreements are included in “Gross amountsnot offset in the consolidated balance sheet” column in the tabular disclosure below. For certain transactionswhere a legal opinion with respect to the enforceability of netting has not been sought or obtained, the relatedamounts are not subject to enforceable master netting agreements and not included in “Gross amounts not offsetin the consolidated balance sheet” column in the tabular disclosure below.
At March 31, 2018
Gross amounts ofrecognized
assets/liabilities
Gross amountsoffset in theconsolidatedbalance sheet
Net amountspresented in the
consolidatedbalance sheet
Gross amounts not offset inthe consolidated balance sheet
Net amountsFinancial
instrumentsCash collateral
received/pledged
(in billions)Financial assets:
Derivative assets . . . . . . . . ¥12,585 ¥ — ¥12,585 ¥ (9,664) ¥ (832) ¥2,089Receivables under resale
agreements . . . . . . . . . . . 8,825 (3,099) 5,726 (5,171) (17) 538Receivables under
securities borrowingtransactions . . . . . . . . . . 9,305 (36) 9,269 (9,208) (1) 60
Total . . . . . . . . . . . . . . ¥30,715 ¥(3,135) ¥27,580 ¥(24,043) ¥ (850) ¥2,687
Financial liabilities:Derivative liabilities . . . . . ¥11,877 ¥ — ¥11,877 ¥ (9,631) ¥(1,126) ¥1,120Payables under repurchase
agreements . . . . . . . . . . . 21,169 (3,034) 18,135 (17,890) (31) 214Payables under securities
lending transactions . . . . 8,206 (36) 8,170 (8,139) (12) 19Obligations to return
securities received ascollateral . . . . . . . . . . . . 3,177 — 3,177 (1,072) — 2,105
Total . . . . . . . . . . . . . . ¥44,429 ¥(3,070) ¥41,359 ¥(36,732) ¥(1,169) ¥3,458
F-90

MITSUBISHI UFJ FINANCIAL GROUP, INC. AND SUBSIDIARIES
NOTES TO CONSOLIDATED FINANCIAL STATEMENTS—(Continued)
At March 31, 2019
Gross amounts ofrecognized
assets/liabilities
Gross amountsoffset in theconsolidatedbalance sheet
Net amountspresented in the
consolidatedbalance sheet
Gross amounts not offset inthe consolidated balance sheet
Net amountsFinancial
instrumentsCash collateral
received/pledged
(in billions)Financial assets:
Derivative assets . . . . . . . . ¥13,205 ¥ — ¥13,205 ¥(10,752) ¥ (590) ¥1,863Receivables under resale
agreements . . . . . . . . . . . 13,885 (2,910) 10,975 (9,793) (20) 1,162Receivables under
securities borrowingtransactions . . . . . . . . . . 2,759 — 2,759 (2,693) — 66
Total . . . . . . . . . . . . . . ¥29,849 ¥(2,910) ¥26,939 ¥(23,238) ¥ (610) ¥3,091
Financial liabilities:Derivative liabilities . . . . . ¥12,710 ¥ — ¥12,710 ¥(10,671) ¥ (933) ¥1,106Payables under repurchase
agreements . . . . . . . . . . . 28,125 (2,900) 25,225 (24,930) (15) 280Payables under securities
lending transactions . . . . 913 — 913 (880) — 33Obligations to return
securities received ascollateral . . . . . . . . . . . . 3,087 — 3,087 (1,244) — 1,843
Total . . . . . . . . . . . . . . ¥44,835 ¥(2,900) ¥41,935 ¥(37,725) ¥ (948) ¥3,262
16. REPURCHASE AGREEMENTS, AND SECURITIES LENDING TRANSACTIONS ACCOUNTEDFOR AS SECURED BORROWINGS
The following tables present gross obligations for payables under repurchase agreements, payables undersecurities lending transactions and obligations to return securities received as collateral by remaining contractualmaturity and class of collateral pledged at March 31, 2018 and 2019. Potential risks associated with thesearrangements primarily relate to market and liquidity risks. To manage risks associated with market exposure, theMUFG Group generally revalues the collateral underlying its repurchase agreements and securities lendingtransactions on a daily basis and monitors the value of the underlying securities, consisting of primarily high-quality securities such as Japanese national government and Japanese government agency bonds, and foreigngovernment and official institution bonds. In the event the market value of such securities falls below the relatedagreements at contract amounts plus accrued interest, the MUFG Group may be required to deposit additionalcollateral when appropriate. To address liquidity risks, the MUFG Group conducts stress tests to ensure theadequate level of liquidity is maintained in the event of a decline in the fair value of any collateral pledged.
March 31, 2018
Remaining Contractual Maturity
Overnightand open
30 daysor less
31-90days
Over90 days Total
(in billions)Payables under repurchase agreements . . . . . . . . . . ¥2,290 ¥14,328 ¥2,004 ¥2,547 ¥21,169Payables under securities lending transactions . . . . 4,647 2,343 1,216 — 8,206Obligations to return securities received as
collateral . . . . . . . . . . . . . . . . . . . . . . . . . . . . . . . 2,855 202 120 — 3,177
Total . . . . . . . . . . . . . . . . . . . . . . . . . . . . . . . . . . . . ¥9,792 ¥16,873 ¥3,340 ¥2,547 ¥32,552
F-91

MITSUBISHI UFJ FINANCIAL GROUP, INC. AND SUBSIDIARIES
NOTES TO CONSOLIDATED FINANCIAL STATEMENTS—(Continued)
March 31, 2019
Remaining Contractual Maturity
Overnightand open
30 daysor less
31-90days
Over90 days Total
(in billions)
Payables under repurchase agreements . . . . . . . . . . ¥3,892 ¥18,586 ¥2,824 ¥2,823 ¥28,125Payables under securities lending transactions . . . . 913 — — — 913Obligations to return securities received as
collateral . . . . . . . . . . . . . . . . . . . . . . . . . . . . . . . 2,572 396 117 2 3,087
Total . . . . . . . . . . . . . . . . . . . . . . . . . . . . . . . . . . . . ¥7,377 ¥18,982 ¥2,941 ¥2,825 ¥32,125
Secured borrowing by the class of collateral pledged at March 31, 2018 and 2019 was as follows:
March 31, 2018
Payables underrepurchaseagreements
Payables undersecurities lending
transactions
Obligationsto return
securities receivedas collateral Total
(in billions)
Japanese national government and Japanesegovernment agency bonds . . . . . . . . . . . . . . . . . . ¥ 2,462 ¥7,085 ¥1,242 ¥10,789
Foreign government and official institutionbonds . . . . . . . . . . . . . . . . . . . . . . . . . . . . . . . . . . 14,316 36 1,344 15,696
Corporate bonds . . . . . . . . . . . . . . . . . . . . . . . . . . . 570 — 84 654Residential mortgage-backed securities . . . . . . . . . 3,567 — — 3,567Other debt securities . . . . . . . . . . . . . . . . . . . . . . . . 121 — — 121Marketable equity securities . . . . . . . . . . . . . . . . . . 123 1,085 507 1,715Others . . . . . . . . . . . . . . . . . . . . . . . . . . . . . . . . . . . 10 — — 10
Total . . . . . . . . . . . . . . . . . . . . . . . . . . . . . . . . . . . . ¥21,169 ¥8,206 ¥3,177 ¥32,552
March 31, 2019
Payables underrepurchaseagreements
Payables undersecurities lending
transactions
Obligationsto return
securities receivedas collateral Total
(in billions)
Japanese national government and Japanesegovernment agency bonds . . . . . . . . . . . . . . . . . . ¥ 8,306 ¥ 21 ¥ 856 ¥ 9,183
Foreign government and official institutionbonds . . . . . . . . . . . . . . . . . . . . . . . . . . . . . . . . . . 14,291 — 1,286 15,577
Corporate bonds . . . . . . . . . . . . . . . . . . . . . . . . . . . 705 — 172 877Residential mortgage-backed securities . . . . . . . . . 4,369 — — 4,369Other debt securities . . . . . . . . . . . . . . . . . . . . . . . . 238 — — 238Marketable equity securities . . . . . . . . . . . . . . . . . . 200 892 772 1,864Others . . . . . . . . . . . . . . . . . . . . . . . . . . . . . . . . . . . 16 — 1 17
Total . . . . . . . . . . . . . . . . . . . . . . . . . . . . . . . . . . . . ¥28,125 ¥ 913 ¥3,087 ¥32,125
F-92

MITSUBISHI UFJ FINANCIAL GROUP, INC. AND SUBSIDIARIES
NOTES TO CONSOLIDATED FINANCIAL STATEMENTS—(Continued)
17. PREFERRED STOCK
Pursuant to the Articles of Incorporation, MUFG had been authorized to issue 400,000,000 shares ofClass 5 Preferred Stock, 200,000,000 shares of Class 6 Preferred Stock, and 200,000,000 shares of Class 7Preferred Stock without par value as of March 31, 2019.
All classes of preferred stock are non-voting and have preference over common stock for the payment ofdividends and the distribution of assets in the event of a liquidation or dissolution of MUFG. They are allnon-cumulative and non-participating with respect to dividend payments. Shareholders of all classes of preferredstock have the right to receive a liquidation distribution at ¥2,500 and do not have the right to participate in anyfurther liquidation distributions.
As of March 31, 2017, 2018 and 2019, there was no preferred stock outstanding and the entire amount ofCapital stock on the consolidated balance sheets consisted of only common stock.
18. COMMON STOCK AND CAPITAL SURPLUS
The changes in the number of issued shares of common stock during the fiscal years ended March 31, 2017,2018 and 2019 were as follows:
2017 2018 2019
(shares)
Balance at beginning of fiscal year . . . . . . . . . . . . . . . . . . . 14,168,853,820 14,168,853,820 13,900,028,020Retirement of shares of common stock . . . . . . . . . . . . . . . . — (268,825,800) (232,257,500)
Balance at end of fiscal year . . . . . . . . . . . . . . . . . . . . . . . . 14,168,853,820 13,900,028,020 13,667,770,520
Under the Companies Act, issuances of common stock, including conversions of bonds and notes, arerequired to be credited to the common stock account for at least 50% of the proceeds and to the legal capitalsurplus account (“legal capital surplus”) for the remaining amounts.
The Companies Act permits Japanese companies, upon approval by the Board of Directors, to issue sharesin the form of a “stock split,” as defined in the Companies Act. Also, prior to April 1, 1991, Japanese companieswere permitted to issue free share distributions. MUFG Bank and Mitsubishi UFJ Trust and Banking from timeto time made free share distributions. These free distributions usually ranged from 5% to 10% of outstandingcommon stock and publicly-owned corporations in the United States issuing shares in similar transactions wouldbe required to account for them as stock dividends as of the shareholders’ record date by reducing retainedearnings and increasing the appropriate capital accounts by an amount equal to the fair value of the shares issued.The application of such U.S. accounting practices to the cumulative free distributions made by MUFG Bank andMitsubishi UFJ Trust and Banking at March 31, 2019, would have increased capital accounts by¥1,910,106 million with a corresponding decrease in unappropriated retained earnings.
The Companies Act permits that common stock, legal reserve, additional paid-in capital, and other capitalsurplus and retained earnings can be transferred among these accounts under certain conditions upon the approvalof a shareholders’ meeting. The Companies Act limits the increase of paid-in capital in case disposition oftreasury stock and issuance of common stock are performed at the same time.
As for Capital surplus, the fee retained by MUFG’s subsidiary as underwriting compensation, net of stockissuance expense, was included in the total Capital surplus balance.
F-93
MITSUBISHI UFJ FINANCIAL GROUP, INC. AND SUBSIDIARIES
NOTES TO CONSOLIDATED FINANCIAL STATEMENTS—(Continued)
Treasury Stock
The Companies Act permits Japanese companies to effect purchases of their own shares pursuant to aresolution by the shareholders at an annual general meeting until the conclusion of the following ordinary generalmeeting of shareholders, and to hold such shares as their treasury stock indefinitely regardless of purpose.However, the Companies Act requires the amount of treasury stock purchased should be within the amount ofretained earnings available for dividends. Disposition of treasury stock is subject to the approval of the Board ofDirectors and is to follow the procedures similar to a public offering of shares for subscription.
From May 17, 2016 to June 13, 2016, MUFG repurchased 190,614,800 shares of MUFG’s common stock.These purchases were made through Off-Auction Own Share Repurchase Trading (ToSTNeT-3) of the TokyoStock Exchange and by market purchases based on the discretionary dealing contract regarding repurchase ofown shares for approximately ¥100 billion in aggregate in satisfaction of the resolution adopted at the meeting ofthe Board of Directors of MUFG held on May 16, 2016. The repurchase plan as authorized by the Board ofDirectors of MUFG allowed for the repurchase of an aggregate amount of up to 230,000,000 shares, whichrepresents the equivalent of 1.67% of the total number of common shares outstanding, or of an aggregaterepurchase amount of up to ¥100 billion. The purpose of the repurchase is to enhance the return of earnings toshareholders, to improve capital efficiency, and to implement flexible capital policies.
From November 15, 2016 to December 22, 2016, MUFG repurchased 142,238,800 shares of MUFG’scommon stock by market purchases based on the discretionary dealing contract regarding repurchase of ownshares for approximately ¥100 billion in aggregate in satisfaction of the resolution adopted at the meeting of theBoard of Directors of MUFG held on November 14, 2016. The repurchase plan, as authorized by the Board ofDirectors of MUFG, allowed for the repurchase of an aggregate amount of up to 230,000,000 shares, whichrepresents the equivalent of 1.69% of the total number of common shares outstanding, or of an aggregaterepurchase amount of up to ¥100 billion. The purpose of the repurchase is to enhance the return of earnings toshareholders, to improve capital efficiency, and to implement flexible capital policies.
From May 16, 2017 to June 21, 2017 MUFG repurchased 141,158,900 shares of MUFG’s common stock bymarket purchases based on the discretionary dealing contract regarding repurchase of own shares forapproximately ¥100 billion in aggregate in satisfaction of the resolution adopted at the meeting of the Board ofDirectors of MUFG held on May 15, 2017. The repurchase plan as authorized by the Board of Directors ofMUFG allowed for the repurchase of an aggregate amount of up to 200,000,000 shares, which represents theequivalent of 1.49% of the total number of common shares outstanding, or of an aggregate repurchase amount ofup to ¥100 billion. The purpose of the repurchase is to enhance the return of earnings to shareholders, to improvecapital efficiency, and to implement flexible capital policies. On July 20, 2017, MUFG cancelled all the acquiredshares in satisfaction of the resolution adopted at the meeting of the Board of Directors of MUFG held onMay 15, 2017.
From November 15, 2017 to December 22, 2017, MUFG repurchased 127,666,900 shares of MUFG’scommon stock by market purchases based on the discretionary dealing contract regarding repurchase of ownshares for approximately ¥100 billion, in aggregate, in satisfaction of the resolution adopted at the meeting of theBoard of Directors of MUFG held on November 14, 2017. The repurchase plan as authorized by the Board ofDirectors of MUFG allowed for the repurchase of an aggregate amount of up to 200,000,000 shares, whichrepresents the equivalent of 1.50% of the total number of common shares outstanding, or of an aggregaterepurchase amount of up to ¥100 billion. The purpose of the repurchase is to enhance the return of earnings toshareholders, to improve capital efficiency, and to implement flexible capital policies. On January 22, 2018,MUFG cancelled all of the acquired shares in satisfaction of the resolution adopted at the meeting of the Board ofDirectors of MUFG held on November 14, 2017.
F-94

MITSUBISHI UFJ FINANCIAL GROUP, INC. AND SUBSIDIARIES
NOTES TO CONSOLIDATED FINANCIAL STATEMENTS—(Continued)
From May 16, 2018 to June 4, 2018, MUFG repurchased 72,420,700 shares of MUFG’s common stock bymarket purchases based on the discretionary dealing contract regarding repurchase of own shares forapproximately ¥50 billion, in aggregate, in satisfaction of the resolution adopted at the meeting of the Board ofDirectors of MUFG held on May 15, 2018. The repurchase plan as authorized by the Board of Directors ofMUFG allowed for the repurchase of an aggregate amount of up to 100,000,000 shares, which represents theequivalent of 0.76% of the total number of common shares outstanding, or of an aggregate repurchase amount ofup to ¥50 billion. The purpose of the repurchase is to enhance the return of earnings to shareholders, to improvecapital efficiency, and to implement flexible capital policies. On July 20, 2018, MUFG cancelled all of theacquired shares in satisfaction of the resolution adopted at the meeting of the Board of Directors of MUFG heldon May 15, 2018.
From November 14, 2018 to December 10, 2018, MUFG repurchased 159,836,800 shares of MUFG’scommon stock by market purchases based on the discretionary dealing contract regarding repurchase of ownshares for approximately ¥100 billion, in aggregate, in satisfaction of the resolution adopted at the meeting of theBoard of Directors of MUFG held on November 13, 2018. The repurchase plan as authorized by the Board ofDirectors of MUFG allowed for the repurchase of an aggregate amount of up to 200,000,000 shares, whichrepresents the equivalent of 1.52% of the total number of common shares outstanding, or of an aggregaterepurchase amount of up to ¥100 billion. The purpose of the repurchase is to enhance the return of earnings toshareholders, to improve capital efficiency, and to implement flexible capital policies. On January 22, 2019,MUFG cancelled all of the acquired shares in satisfaction of the resolution adopted at the meeting of the Board ofDirectors of MUFG held on November 13, 2018.
Parent Company Shares Held by Subsidiaries and Affiliated Companies
At March 31, 2019, certain subsidiaries and affiliated companies owned shares of common stock of MUFG.Such shares are included in treasury stock in the accompanying consolidated balance sheets and deducted fromthe MUFG’s shareholders’ equity.
19. RETAINED EARNINGS, LEGAL RESERVE AND DIVIDENDS
In addition to the Companies Act, Japanese banks, including MUFG Bank and Mitsubishi UFJ Trust andBanking, are required to comply with the Banking Law of Japan (the “Banking Law”).
Legal Reserve Set Aside as Appropriation of Retained Earnings and Legal Capital Surplus
Under the Companies Act
The Companies Act provides that an amount at least equal to 10% of the aggregate amount of cashdividends and certain appropriations of retained earnings associated with cash outlays applicable to each periodshall be appropriated and set aside as a legal reserve until the aggregate amount of legal reserve set aside as anappropriation of retained earnings and the legal capital surplus equals 25% of stated capital as defined in theCompanies Act.
Under the Banking Law
The Banking Law provides that an amount at least equal to 20% of the aggregate amount of cash dividendsand certain appropriations of retained earnings associated with cash outlays applicable to each fiscal year shall beappropriated and set aside as a legal reserve until the aggregate amount of legal reserve set aside as appropriationof retained earnings and the legal capital surplus equals 100% of stated capital as defined in the Companies Act.
F-95
MITSUBISHI UFJ FINANCIAL GROUP, INC. AND SUBSIDIARIES
NOTES TO CONSOLIDATED FINANCIAL STATEMENTS—(Continued)
Transfer of Legal Reserve
Under the Companies Act
Under the Companies Act, Japanese companies, including MUFG, were permitted, pursuant to a resolutionby the shareholders at a general meeting, to make legal reserve set aside as appropriation of retained earnings andlegal capital surplus available for dividends until the aggregate amount of the legal reserve and legal capitalsurplus equals 25% of stated capital as defined in the Companies Act.
Under the Companies Act, Japanese companies, including MUFG, MUFG Bank and Mitsubishi UFJ Trustand Banking, are permitted, primarily pursuant to a resolution by the shareholders at a general meeting, totransfer legal capital surplus and legal reserve to stated capital and/or retained earnings without limitations ofthresholds, thereby effectively removing the thresholds provided for in the Companies Act and Banking Law atthe company’s discretion.
Under the Banking Law
Under the Banking Law, Japanese banks, including MUFG Bank and Mitsubishi UFJ Trust and Banking,were permitted, pursuant to a resolution by the shareholders at a general meeting, to set aside a legal reserve asan appropriation of retained earnings and legal capital surplus available for dividends until the aggregate amountof the legal reserve and legal capital surplus equals 100% of stated capital as defined in the Companies Act.
Unappropriated Retained Earnings and Dividends
In addition to the provision that requires an appropriation for legal reserve as described above, theCompanies Act and the Banking Law impose certain limitations on the amount available for dividends.
Under the Companies Act, the amount available for dividends is based on the amount recorded in MUFG’sgeneral books of account maintained in accordance with accounting principles generally accepted in Japan(“Japanese GAAP”). The adjustments included in the accompanying consolidated financial statements but notrecorded in MUFG’s general books of account, as explained in Note 1, have no effect on the determination ofretained earnings available for dividends under the Companies Act. Under the Banking Law, MUFG, MUFGBank and Mitsubishi UFJ Trust and Banking have to meet the minimum capital adequacy requirements anddistributions of retained earnings of MUFG, MUFG Bank and Mitsubishi UFJ Trust and Banking, which areotherwise distributable to shareholders, are restricted in order to maintain the minimum capital requirements.
MUFG, formerly known as Mitsubishi Tokyo Financial Group, was established on April 2, 2001 withcommon stock of ¥924,400 million, preferred stock of ¥222,100 million, legal capital surplus of¥2,838,693 million and no retained earnings in accordance with the Commercial Code of Japan (“the Code”),which was replaced by the Companies Act, and Japanese GAAP.
On October 1, 2005, MUFG started with common stock and preferred stock of ¥1,383,052 million, a legalcapital surplus of ¥3,577,570 million and retained earnings of ¥757,458 million in accordance with the Code andJapanese GAAP.
MUFG’s amount available for dividends, at March 31, 2019, was ¥4,221,793 million, which is based on theamount recorded in MUFG’s general books of account under Japanese GAAP.
Annual dividends, including those for preferred stock, are approved by the shareholders at an annual generalmeeting held subsequent to the fiscal year to which the dividends are applicable. In addition, a semi-annualinterim dividend payment may be made by resolution of the Board of Directors, subject to limitations imposed bythe Companies Act and the Banking Law.
F-96

MITSUBISHI UFJ FINANCIAL GROUP, INC. AND SUBSIDIARIES
NOTES TO CONSOLIDATED FINANCIAL STATEMENTS—(Continued)
In the accompanying consolidated statements of equity, dividends and appropriations to legal reserve shownfor each fiscal year represent dividends approved and paid during the fiscal year and the related appropriation tolegal reserve.
20. ACCUMULATED OTHER COMPREHENSIVE INCOME (LOSS)
The following table presents the changes in Accumulated OCI, net of tax and net of noncontrolling interests,for the fiscal years ended March 31, 2017, 2018 and 2019:
2017 2018 2019
(in millions)Accumulated other comprehensive income (loss), net of taxes:Net unrealized gains (losses) on investment securities(1):
Balance at beginning of fiscal year . . . . . . . . . . . . . . . . . . . . . . . . . . . . . . . . . . . . . ¥1,995,314 ¥2,032,807 ¥ 2,270,346Net change during the fiscal year . . . . . . . . . . . . . . . . . . . . . . . . . . . . . . . . . . . . . . . 31,984 244,249 60,616Effect of adopting new guidance by a foreign affiliated company . . . . . . . . . . . . . — 118 —Effect of adopting new guidance on consolidation of certain variable interest
entities (Note 26) . . . . . . . . . . . . . . . . . . . . . . . . . . . . . . . . . . . . . . . . . . . . . . . . . 5,509 — —Effect of adopting new guidance on reclassification on certain tax effects . . . . . . . — (6,828) —Effect of adopting new guidance on recognition and measurement of financial
assets and financial liabilities (Note 1) . . . . . . . . . . . . . . . . . . . . . . . . . . . . . . . . — — (2,700,331)
Balance at end of fiscal year . . . . . . . . . . . . . . . . . . . . . . . . . . . . . . . . . . . . . . . . . . ¥2,032,807 ¥2,270,346 ¥ (369,369)
Net debt valuation adjustments:Balance at beginning of fiscal year . . . . . . . . . . . . . . . . . . . . . . . . . . . . . . . . . . . . . ¥ (2,080) ¥ (10,632) ¥ (16,488)Net change during the fiscal year . . . . . . . . . . . . . . . . . . . . . . . . . . . . . . . . . . . . . . . (8,552) (2,178) 9,729Effect of adopting new guidance on reclassification on certain tax effects . . . . . . . — (3,678) —Effect of adopting new guidance on recognition and measurement of financial
assets and financial liabilities (Note 1) . . . . . . . . . . . . . . . . . . . . . . . . . . . . . . . . — — (1,911)
Balance at end of fiscal year . . . . . . . . . . . . . . . . . . . . . . . . . . . . . . . . . . . . . . . . . . ¥ (10,632) ¥ (16,488) ¥ (8,670)
Net unrealized gains (losses) on derivatives qualifying for cash flow hedges:Balance at beginning of fiscal year . . . . . . . . . . . . . . . . . . . . . . . . . . . . . . . . . . . . . ¥ 4,516 ¥ (8,729) ¥ (19,250)Net change during the fiscal year . . . . . . . . . . . . . . . . . . . . . . . . . . . . . . . . . . . . . . . (13,245) (7,025) (4,890)Effect of adopting new guidance on reclassification on certain tax effects . . . . . . . — (3,496) —
Balance at end of fiscal year . . . . . . . . . . . . . . . . . . . . . . . . . . . . . . . . . . . . . . . . . . ¥ (8,729) ¥ (19,250) ¥ (24,140)
Defined benefit plans:Balance at beginning of fiscal year . . . . . . . . . . . . . . . . . . . . . . . . . . . . . . . . . . . . . ¥ (317,422) ¥ (214,062) ¥ (119,593)Net change during the fiscal year . . . . . . . . . . . . . . . . . . . . . . . . . . . . . . . . . . . . . . . 103,360 109,012 (88,680)Effect of adopting new guidance on reclassification on certain tax effects . . . . . . . — (14,543) —
Balance at end of fiscal year . . . . . . . . . . . . . . . . . . . . . . . . . . . . . . . . . . . . . . . . . . ¥ (214,062) ¥ (119,593) ¥ (208,273)
Foreign currency translation adjustments:Balance at beginning of fiscal year . . . . . . . . . . . . . . . . . . . . . . . . . . . . . . . . . . . . . ¥ 620,931 ¥ 482,039 ¥ 362,300Net change during the fiscal year . . . . . . . . . . . . . . . . . . . . . . . . . . . . . . . . . . . . . . . (137,256) (119,213) (36,117)Effect of adopting new guidance on consolidation of certain variable interest
entities (Note 26) . . . . . . . . . . . . . . . . . . . . . . . . . . . . . . . . . . . . . . . . . . . . . . . . . (1,636) — —Effect of adopting new guidance on reclassification on certain tax effects . . . . . . . — (526) —
Balance at end of fiscal year . . . . . . . . . . . . . . . . . . . . . . . . . . . . . . . . . . . . . . . . . . ¥ 482,039 ¥ 362,300 ¥ 326,183
Balance at end of fiscal year . . . . . . . . . . . . . . . . . . . . . . . . . . . . . . . . . . . . . . . . . . . . . . ¥2,281,423 ¥2,477,315 ¥ (284,269)
Note:(1) Included unrealized gains (losses) related to only debt securities for the fiscal year ended March 31, 2019.
F-97

MITSUBISHI UFJ FINANCIAL GROUP, INC. AND SUBSIDIARIES
NOTES TO CONSOLIDATED FINANCIAL STATEMENTS—(Continued)
The following table presents the before tax and net of tax changes in each component of Accumulated OCIfor the fiscal years ended March 31, 2017, 2018 and 2019:
2017 2018 2019
Before tax
Tax(expense)or benefit Net of tax Before tax
Tax(expense)or benefit Net of tax Before tax
Tax(expense)or benefit Net of tax
(in millions)Net unrealized gains (losses) on
investment securities:Net unrealized gains on
investment securities(1) . . . . . . . ¥ 307,476 ¥(107,082) ¥ 200,394 ¥ 631,154 ¥(204,916) ¥ 426,238 ¥ 132,723 ¥ (24,690) ¥108,033Reclassification adjustment for
gains included in net incomebefore attribution ofnoncontrolling interests . . . . . . . (274,278) 86,845 (187,433) (280,258) 84,328 (195,930) (28,953) 9,100 (19,853)
Net change . . . . . . . . . . . . . . 33,198 (20,237) 12,961 350,896 (120,588) 230,308 103,770 (15,590) 88,180Net unrealized gains (losses) on
investment securitiesattributable to noncontrollinginterests . . . . . . . . . . . . . . . . . . . (19,023) (13,941) 27,564
Net unrealized gains oninvestment securitiesattributable to Mitsubishi UFJFinancial Group . . . . . . . . . . . . 31,984 244,249 60,616
Net debt valuation adjustments:Net debt valuation adjustments . . . (12,693) 3,994 (8,699) (3,555) 1,088 (2,467) 13,006 (3,982) 9,024Reclassification adjustment for
losses included in net incomebefore attribution ofnoncontrolling interests . . . . . . . 215 (68) 147 417 (128) 289 1,016 (311) 705
Net change . . . . . . . . . . . . . . (12,478) 3,926 (8,552) (3,138) 960 (2,178) 14,022 (4,293) 9,729Net debt valuation adjustments
attributable to noncontrollinginterests . . . . . . . . . . . . . . . . . . . — — —
Net debt valuation adjustmentsattributable to Mitsubishi UFJFinancial Group . . . . . . . . . . . . (8,552) (2,178) 9,729
Net unrealized gains (losses) onderivatives qualifying for cash flowhedges:
Net unrealized losses onderivatives qualifying for cashflow hedges . . . . . . . . . . . . . . . . (4,321) 2,041 (2,280) (3,430) 1,571 (1,859) (10,397) 2,825 (7,572)
Reclassification adjustment forlosses (gains) included in netincome before attribution ofnoncontrolling interests . . . . . . . (18,367) 7,402 (10,965) (8,016) 2,850 (5,166) 3,662 (980) 2,682
Net change . . . . . . . . . . . . . . (22,688) 9,443 (13,245) (11,446) 4,421 (7,025) (6,735) 1,845 (4,890)Net unrealized gains on
derivatives qualifying for cashflow hedges attributable tononcontrolling interests . . . . . . . — — —
Net unrealized losses onderivatives qualifying for cashflow hedges attributable toMitsubishi UFJ FinancialGroup . . . . . . . . . . . . . . . . . . . . (13,245) (7,025) (4,890)
F-98
MITSUBISHI UFJ FINANCIAL GROUP, INC. AND SUBSIDIARIES
NOTES TO CONSOLIDATED FINANCIAL STATEMENTS—(Continued)
2017 2018 2019
Before tax
Tax(expense)or benefit Net of tax Before tax
Tax(expense)or benefit Net of tax Before tax
Tax(expense)or benefit Net of tax
(in millions)Defined benefit plans:
Defined benefit plans . . . . . . . . . . . . . . 131,971 (41,852) 90,119 154,708 (48,537) 106,171 (126,001) 37,655 (88,346)Reclassification adjustment for losses
(gains) included in net incomebefore attribution of noncontrollinginterests . . . . . . . . . . . . . . . . . . . . . . . 20,105 (6,652) 13,453 5,904 (2,237) 3,667 (1,168) 574 (594)
Net change . . . . . . . . . . . . . . . . . . 152,076 (48,504) 103,572 160,612 (50,774) 109,838 (127,169) 38,229 (88,940)Defined benefit plans attributable to
noncontrolling interests . . . . . . . . . . 212 826 (260)
Defined benefit plans attributable toMitsubishi UFJ Financial Group . . . 103,360 109,012 (88,680)
Foreign currency translation adjustments:Foreign currency translation
adjustments . . . . . . . . . . . . . . . . . . . . (148,460) 2,424 (146,036) (137,811) 32,767 (105,044) (18,062) (17,932) (35,994)Reclassification adjustment for losses
(gains) included in net incomebefore attribution of noncontrollinginterests . . . . . . . . . . . . . . . . . . . . . . . 3,293 (467) 2,826 (1,494) 1,760 266 (9,002) 2,784 (6,218)
Net change . . . . . . . . . . . . . . . . . . (145,167) 1,957 (143,210) (139,305) 34,527 (104,778) (27,064) (15,148) (42,212)Foreign currency translation
adjustments attributable tononcontrolling interests . . . . . . . . . . (5,954) 14,435 (6,095)
Foreign currency translationadjustments attributable toMitsubishi UFJ Financial Group . . . (137,256) (119,213) (36,117)
Other comprehensive income (loss)attributable to Mitsubishi UFJ FinancialGroup . . . . . . . . . . . . . . . . . . . . . . . . . . . . ¥ (23,709) ¥ 224,845 ¥(59,342)
Note:(1) Included unrealized gains (losses) related to only debt securities for the fiscal year ended March 31, 2019.
F-99
MITSUBISHI UFJ FINANCIAL GROUP, INC. AND SUBSIDIARIES
NOTES TO CONSOLIDATED FINANCIAL STATEMENTS—(Continued)
The following table presents the effect of the reclassification of significant items out of AccumulatedOCI on the respective line items of the accompanying consolidated statements of income for the fiscal yearsended March 31, 2017, 2018 and 2019:
2017 2018 2019
Details of Accumulated OCI componentsAmount reclassified out of
Accumulated OCILine items in the consolidated
statements of income
(in millions)
Net unrealized losses (gains) on investmentsecurities
Net gains on sales and redemptions ofAvailable-for-sale debt securities(1) . . . ¥(307,041) ¥(287,279) ¥(29,182)
Investment securities gains(losses)—net
Impairment losses on investmentsecurities . . . . . . . . . . . . . . . . . . . . . . . . 32,744 6,759 596
Investment securities gains(losses)—net
Other . . . . . . . . . . . . . . . . . . . . . . . . . . . . . 19 262 (367)
(274,278) (280,258) (28,953) Total before tax86,845 84,328 9,100 Income tax expense
¥(187,433) ¥(195,930) ¥(19,853) Net of tax
Net debt valuation adjustments . . . . . . . . . . . . .
¥ 215 ¥ 417 ¥ 1,016
Equity in earnings ofequitymethod investees—net
215 417 1,016 Total before tax(68) (128) (311) Income tax expense
¥ 147 ¥ 289 ¥ 705 Net of tax
Net unrealized losses (gains) on derivativesqualifying for cash flow hedges
Interest rate contracts . . . . . . . . . . . . . . . . ¥ (18,332) ¥ (7,782) ¥ 3,739 Interest income on Loans,including fees
Other . . . . . . . . . . . . . . . . . . . . . . . . . . . . . (35) (234) (77)
(18,367) (8,016) 3,662 Total before tax7,402 2,850 (980) Income tax expense
¥ (10,965) ¥ (5,166) ¥ 2,682 Net of tax
Defined benefit plansNet actuarial loss(2) . . . . . . . . . . . . . . . . . .
¥ 31,837 ¥ 17,280 ¥ 11,431Other non-interestexpenses
Prior service cost(2) . . . . . . . . . . . . . . . . . .(9,927) (6,959) (6,269)
Other non-interestexpenses
Gain on settlements and curtailment, andother(2) . . . . . . . . . . . . . . . . . . . . . . . . . . (1,805) (4,417) (6,330)
Other non-interestexpenses
20,105 5,904 (1,168) Total before tax(6,652) (2,237) 574 Income tax expense
¥ 13,453 ¥ 3,667 ¥ (594) Net of tax
F-100

MITSUBISHI UFJ FINANCIAL GROUP, INC. AND SUBSIDIARIES
NOTES TO CONSOLIDATED FINANCIAL STATEMENTS—(Continued)
2017 2018 2019
Details of Accumulated OCI componentsAmount reclassified out of
Accumulated OCILine items in the consolidated
statements of income
(in millions)
Foreign currency translation adjustments . . . . ¥ (39) ¥ (5,743) ¥ (9,004) Other non-interest income3,332 4,249 2 Other non-interest expenses
3,293 (1,494) (9,002) Total before tax(467) 1,760 2,784 Income tax expense
¥ 2,826 ¥ 266 ¥ (6,218) Net of tax
Total reclassifications for the period . . . . . . . . ¥(269,032) ¥(283,447) ¥(34,445) Total before tax87,060 86,573 11,167 Income tax expense
¥(181,972) ¥(196,874) ¥(23,278) Net of tax
Notes:(1) Included unrealized gains (losses) related to only debt securities for the fiscal year ended March 31, 2019 while included unrealized gains
(losses) related to both debt and equity securities for the fiscal years ended March 31, 2017 and 2018.(2) These Accumulated OCI components are components of net periodic benefit cost. See Note 13 for more information.
21. NONCONTROLLING INTERESTS
Deconsolidation of Subsidiaries
The gains and losses due to deconsolidation of subsidiaries were recognized under “Other non-interestincome” and “Other non-interest expenses,” respectively, in the accompanying consolidated statements ofincome. The amount of net losses was ¥2,848 million for the fiscal year ended March 31, 2017, the amount of netgains was ¥4,448 million for the fiscal year ended March 31, 2018 and the amount of net gains was¥7,228 million for the fiscal year ended March 31, 2019, respectively.
Changes in MUFG’s Ownership Interests in Subsidiaries
The following table presents the effect on MUFG’s shareholders’ equity from changes in ownership ofsubsidiaries resulting from transactions with the noncontrolling interest shareholders during the fiscal yearsended March 31, 2017, 2018 and 2019:
2017 2018 2019
(in millions)
Net income attributable to Mitsubishi UFJ Financial Group . . . . . . . . . . . . . ¥202,680 ¥1,228,160 ¥718,645Transactions between Mitsubishi UFJ Financial Group and the
noncontrolling interest shareholders:Purchase of shares of Mitsubishi UFJ NICOS from noncontrolling
interest shareholder (Note 2) . . . . . . . . . . . . . . . . . . . . . . . . . . . . . . . . — (34,751) —Other . . . . . . . . . . . . . . . . . . . . . . . . . . . . . . . . . . . . . . . . . . . . . . . . . . . . (429) 8,006 (78)
Net transfers to the noncontrolling interest shareholders . . . . . . . . . . . . . . . . (429) (26,745) (78)
Change from net income attributable to Mitsubishi UFJ Financial Groupand transactions between Mitsubishi UFJ Financial Group and thenoncontrolling interest shareholders . . . . . . . . . . . . . . . . . . . . . . . . . . . . . . ¥202,251 ¥1,201,415 ¥718,567
F-101
MITSUBISHI UFJ FINANCIAL GROUP, INC. AND SUBSIDIARIES
NOTES TO CONSOLIDATED FINANCIAL STATEMENTS—(Continued)
22. REGULATORY CAPITAL REQUIREMENTS
Japan
MUFG, MUFG Bank, Mitsubishi UFJ Trust and Banking and Mitsubishi UFJ Securities Holdings aresubject to various regulatory capital requirements promulgated by the regulatory authorities of the countries inwhich they operate. Failure to meet minimum capital requirements will initiate certain mandatory actions byregulators that, if undertaken, could have a direct material effect on MUFG’s consolidated financial statements.
In Japan, MUFG, MUFG Bank, and Mitsubishi UFJ Trust and Banking are subject to regulatory capitalrequirements promulgated by the Financial Services Agency of Japan (“FSA”) in accordance with the provisionsof the Banking Law and related regulations. A banking institution is subject to the minimum capital requirementsboth on a consolidated basis and a stand-alone basis, and is required to maintain the minimum capital irrespectiveof whether it operates independently or as a subsidiary under the control of another company. When a bankholding company manages operations of its banking subsidiaries, it is required to maintain the minimum capitaladequacy ratio on a consolidated basis in the same manner as its subsidiary banks. The FSA provides two sets ofcapital adequacy guidelines. One is a set of guidelines applicable to Japanese banks and bank holding companieswith their foreign offices conducting international operations, as defined, and the other is applicable to Japanesebanks and bank holding companies that are not engaged in international operations conducted by their foreignoffices.
The Basel Committee on Banking Supervision (“BCBS”) of the Bank for International Settlements(“BIS”) sets capital adequacy standards for all internationally active banks to ensure minimum levels of capital.
The Basel Committee revised the 1988 Accord (“Basel I”) in June 2004 and released “InternationalConvergence of Capital Measurement and Capital Standards: A Revised Framework” (“Basel II”). In addition,the Group of Central Bank Governors and Heads of Supervision reached an agreement on the new globalregulatory framework, which has been referred to as “Basel III,” in July and September 2010. In December 2010,the Basel Committee agreed on the details of the Basel III rules. Effective as of March 31, 2013, Basel III wasadopted by the FSA with transitional measures for Japanese banking institutions with international operationsconducted by their foreign offices. MUFG calculated capital ratios as of March 31, 2018 and 2019 in accordancewith Basel III.
Capital Ratios
Basel III, the same as Basel II, is based on “three pillars”: (1) minimum capital requirements, (2) the self-regulation of financial institutions based on supervisory review process, and (3) market discipline through thedisclosure of information. The framework of the 1988 Accord, Basel I is improved and expanded to be includedin “minimum capital requirements” as the first pillar of Basel II and Basel III.
As for the denominator of the capital ratio, the Basel framework provides the following risk-basedapproaches and a range of options for determining risk-weighted assets.
“Credit Risk”
The Basel framework provides options for determining the risk-weighted assets for credit risk to allowbanks to select approaches that are most appropriate for their level of risk assessment. Banks choose one ofthree approaches: “Standardized Approach,” “Foundation Internal Ratings-Based Approach” or “AdvancedInternal Ratings-Based Approach (“AIRB”).”
F-102

MITSUBISHI UFJ FINANCIAL GROUP, INC. AND SUBSIDIARIES
NOTES TO CONSOLIDATED FINANCIAL STATEMENTS—(Continued)
“Market Risk”
In the “Amendment to the Capital Accord to incorporate market risks” of the year 1996, a choice betweentwo methodologies “the Standardized Measurement Method” and “Internal Models Approach” is permitted.“Combination of Internal Models Approach and the Standardized Measurement Method” is also allowedunder certain conditions. This is unchanged in Basel III.
“Operational Risk”
Operational risk, which is defined as the risk of loss resulting from inadequate or failed internal processes,people and systems or from external events, is newly added in Basel II. The Basel framework presents threemethods for calculating operational risk capital charges: (i) the Basic Indicator Approach; (ii) theStandardized Approach; or (iii) Advanced Measurement Approaches (“AMA”). Banks adopt one of thethree approaches to determine the risk-weighted assets for operational risk.
Banks need to obtain approval from their supervisors prior to adopting the following approaches to calculatecapital requirements for each risk:
‰ the Advanced Internal Ratings-Based Approach for credit risk
‰ the Internal Models Approach for market risk
‰ the Standardized Approach and AMA for operational risk
With approval from the FSA, MUFG and most of its major subsidiaries adopt AIRB to calculate capitalrequirements for credit risk, adopt the AMA to calculate capital requirements for operational risk, as for marketrisk, adopt the Internal Models Approach mainly to calculate general market risk and adopt the StandardizedMeasurement Method to calculate specific risk.
The MUFG Group’s proprietary assets do not include trust assets under management and administration in acapacity of agent or fiduciary and, accordingly trust account assets are generally not included in the capitalmeasure. However, guarantees for trust principal are counted as off-balance sheet items requiring a capital chargein accordance with the capital adequacy guidelines.
Under Basel III, as adopted by the FSA, MUFG’s risk-weighted assets increased, largely reflecting the newcapital charge of the credit valuation adjustment (CVA), the credit risk related to asset value correlationmultiplier for large financial institutions, and the 250% risk-weighted threshold items not deducted fromCommon Equity Tier 1 capital, as well as the conversion of certain Basel II capital deductions to risk-weightedassets, such as securitizations.
On the other hand, as for the numerator of the capital ratio, there are three primary regulatory capital ratiosused to assess capital adequacy, Common Equity Tier 1, Tier 1 and Total capital ratios, which are determined bydividing applicable capital components by risk-weighted assets. Tier 1 capital consists of Common Equity Tier 1capital and Additional Tier 1 capital. Common Equity Tier 1 capital is primarily consisting of common stock,capital surplus, retained earnings, and Accumulated OCI. Regulatory adjustments including certain intangiblefixed assets, such as goodwill, and defined-benefit pension fund assets, are made to Common Equity Tier 1.Additional Tier 1 capital generally consists of Basel III compliant preferred securities, and during the transitionperiod, other capital that meets Tier 1 requirements under Basel II standards.
Tier 2 capital generally consists of Basel III compliant subordinated debts, capital that meets Tier 2requirements under Basel II standards during the transition period, certain allowances for credit losses, andnoncontrolling interests in subsidiaries’ Tier 2 instruments. Total capital is defined as the sum of Tier 1 andTier 2 capital.
F-103

MITSUBISHI UFJ FINANCIAL GROUP, INC. AND SUBSIDIARIES
NOTES TO CONSOLIDATED FINANCIAL STATEMENTS—(Continued)
Effective March 31, 2016, the FSA’s capital conservation buffer, countercyclical buffer and the GlobalSystematically Important Bank (“G-SIB”), as designated by the FSB, surcharge requirements became applicableto Japanese banking institutions with international operations conducted through foreign offices. Therequirements had been phased in and fully implemented as of March 31, 2019. MUFG is required to maintain acapital conservation buffer of 1.875% and 2.5%, a G-SIB surcharge of 1.125% and 1.5%, and a countercyclicalbuffer of 0.01% and 0.04%, in addition to the 4.50% minimum Common Equity Tier 1 capital ratio, as ofMarch 31, 2018 and 2019, respectively.
Leverage Ratios
The leverage ratio is designed for monitoring and preventing the build-up of excessive leverage in thebanking sector and is expressed as the ratio of Tier 1 capital to both on and off-balance sheet assets adjusted inaccordance with the FSA guidance. In December 2017, the Group of Central Bank Governors and Heads ofSupervision announced final Basel III reforms. The announced reforms include revisions to the measurement ofthe leverage ratio and a 3% minimum leverage ratio requirement, plus a G-SIB leverage ratio buffer equal to50% of the applicable G-SIB capital surcharge. The announcement sets forth implementation dates of January 1,2018 for the minimum leverage ratio requirement and January 1, 2022 for the G-SIB leverage ratio bufferrequirement. Effective as of March 31, 2019, the minimum leverage ratio requirement was adopted by the FSA.
The risk-adjusted capital amounts and ratios, and leverage ratios, of MUFG, MUFG Bank and MitsubishiUFJ Trust and Banking presented in the following table are based on amounts calculated in accordance withJapanese GAAP as required by the FSA.
ActualFor capital
adequacy purposes
Amount Ratio Amount Ratio
(in millions, except percentages)Consolidated:
At March 31, 2018:Total capital (to risk-weighted assets):
MUFG(1) . . . . . . . . . . . . . . . . . . . . . . . . . . . . . . . . . . . . . . . . . . . ¥18,795,480 16.56% ¥12,492,344 11.01%BK . . . . . . . . . . . . . . . . . . . . . . . . . . . . . . . . . . . . . . . . . . . . . . . 14,470,240 15.90 7,280,570 8.00TB . . . . . . . . . . . . . . . . . . . . . . . . . . . . . . . . . . . . . . . . . . . . . . . . 2,545,648 20.03 1,016,420 8.00
Tier1 capital (to risk-weighted assets):MUFG(1) . . . . . . . . . . . . . . . . . . . . . . . . . . . . . . . . . . . . . . . . . . . 16,251,749 14.32 10,223,072 9.01BK . . . . . . . . . . . . . . . . . . . . . . . . . . . . . . . . . . . . . . . . . . . . . . . 12,374,074 13.59 5,460,427 6.00TB . . . . . . . . . . . . . . . . . . . . . . . . . . . . . . . . . . . . . . . . . . . . . . . . 2,245,853 17.67 762,315 6.00
Common Equity Tier1 capital (to risk-weighted assets):MUFG(1) . . . . . . . . . . . . . . . . . . . . . . . . . . . . . . . . . . . . . . . . . . . 14,284,945 12.58 8,521,118 7.51BK . . . . . . . . . . . . . . . . . . . . . . . . . . . . . . . . . . . . . . . . . . . . . . . 10,788,381 11.85 4,095,321 4.50TB . . . . . . . . . . . . . . . . . . . . . . . . . . . . . . . . . . . . . . . . . . . . . . . . 2,060,107 16.21 571,736 4.50
At March 31, 2019:Total capital (to risk-weighted assets):
MUFG(1) . . . . . . . . . . . . . . . . . . . . . . . . . . . . . . . . . . . . . . . . . . . ¥18,769,793 16.03% ¥14,097,771 12.04%BK . . . . . . . . . . . . . . . . . . . . . . . . . . . . . . . . . . . . . . . . . . . . . . . 14,632,620 14.42 8,114,105 8.00TB . . . . . . . . . . . . . . . . . . . . . . . . . . . . . . . . . . . . . . . . . . . . . . . . 2,213,195 24.40 725,540 8.00
Tier1 capital (to risk-weighted assets):MUFG(1) . . . . . . . . . . . . . . . . . . . . . . . . . . . . . . . . . . . . . . . . . . . 16,276,301 13.90 11,755,949 10.04BK . . . . . . . . . . . . . . . . . . . . . . . . . . . . . . . . . . . . . . . . . . . . . . . 12,639,454 12.46 6,085,579 6.00TB . . . . . . . . . . . . . . . . . . . . . . . . . . . . . . . . . . . . . . . . . . . . . . . . 1,928,955 21.26 544,155 6.00
Common Equity Tier1 capital (to risk-weighted assets):MUFG(1) . . . . . . . . . . . . . . . . . . . . . . . . . . . . . . . . . . . . . . . . . . . 14,322,407 12.23 9,999,582 8.54BK . . . . . . . . . . . . . . . . . . . . . . . . . . . . . . . . . . . . . . . . . . . . . . . 10,990,820 10.83 4,564,184 4.50TB . . . . . . . . . . . . . . . . . . . . . . . . . . . . . . . . . . . . . . . . . . . . . . . . 1,775,565 19.57 408,116 4.50
Leverage ratio(2):MUFG . . . . . . . . . . . . . . . . . . . . . . . . . . . . . . . . . . . . . . . . . . . . 16,276,301 4.94 9,871,460 3.00BK . . . . . . . . . . . . . . . . . . . . . . . . . . . . . . . . . . . . . . . . . . . . . . . 12,639,454 4.63 8,189,494 3.00TB . . . . . . . . . . . . . . . . . . . . . . . . . . . . . . . . . . . . . . . . . . . . . . . . 1,928,955 5.09 1,135,795 3.00
F-104

MITSUBISHI UFJ FINANCIAL GROUP, INC. AND SUBSIDIARIES
NOTES TO CONSOLIDATED FINANCIAL STATEMENTS—(Continued)
ActualFor capital
adequacy purposes
Amount Ratio Amount Ratio
(in millions, except percentages)Stand-alone:
At March 31, 2018:Total capital (to risk-weighted assets):
BK . . . . . . . . . . . . . . . . . . . . . . . . . . . . . . . . . . . . . . . . . . . . . . . ¥13,211,327 16.90% ¥ 6,252,458 8.00%TB . . . . . . . . . . . . . . . . . . . . . . . . . . . . . . . . . . . . . . . . . . . . . . . . 2,529,316 19.88 1,017,331 8.00
Tier1 capital (to risk-weighted assets):BK . . . . . . . . . . . . . . . . . . . . . . . . . . . . . . . . . . . . . . . . . . . . . . . 11,344,078 14.51 4,689,344 6.00TB . . . . . . . . . . . . . . . . . . . . . . . . . . . . . . . . . . . . . . . . . . . . . . . . 2,232,760 17.55 762,998 6.00
Common Equity Tier1 capital (to risk-weighted assets):BK . . . . . . . . . . . . . . . . . . . . . . . . . . . . . . . . . . . . . . . . . . . . . . . 9,802,445 12.54 3,517,008 4.50TB . . . . . . . . . . . . . . . . . . . . . . . . . . . . . . . . . . . . . . . . . . . . . . . . 2,057,760 16.18 572,249 4.50
At March 31, 2019:Total capital (to risk-weighted assets):
BK . . . . . . . . . . . . . . . . . . . . . . . . . . . . . . . . . . . . . . . . . . . . . . . ¥13,560,583 15.58% ¥ 6,959,207 8.00%TB . . . . . . . . . . . . . . . . . . . . . . . . . . . . . . . . . . . . . . . . . . . . . . . . 2,195,098 24.25 723,953 8.00
Tier1 capital (to risk-weighted assets):BK . . . . . . . . . . . . . . . . . . . . . . . . . . . . . . . . . . . . . . . . . . . . . . . 11,773,839 13.53 5,219,405 6.00TB . . . . . . . . . . . . . . . . . . . . . . . . . . . . . . . . . . . . . . . . . . . . . . . . 1,911,237 21.12 542,965 6.00
Common Equity Tier1 capital (to risk-weighted assets):BK . . . . . . . . . . . . . . . . . . . . . . . . . . . . . . . . . . . . . . . . . . . . . . . 10,172,206 11.69 3,914,554 4.50TB . . . . . . . . . . . . . . . . . . . . . . . . . . . . . . . . . . . . . . . . . . . . . . . . 1,758,237 19.42 407,224 4.50
Leverage ratio(2):BK . . . . . . . . . . . . . . . . . . . . . . . . . . . . . . . . . . . . . . . . . . . . . . . 11,773,839 4.84 7,284,812 3.00TB . . . . . . . . . . . . . . . . . . . . . . . . . . . . . . . . . . . . . . . . . . . . . . . . 1,911,237 5.55 1,031,484 3.00
Notes:(1) Effective March 31, 2016, the FSA’s capital conservation buffer, countercyclical buffer and G-SIB surcharge requirements became
applicable to Japanese banking institutions with international operations conducted through foreign offices. As a result, in addition to the4.50% minimum Common Equity Tier 1 capital ratio, MUFG is required to maintain a capital conservation buffer of 1.875% and aG-SIB surcharge of 1.125% as of March 31, 2018 and a capital conservation buffer of 2.5% and a G-SIB surcharge of 1.5% as ofMarch 31, 2019. As of the same date, the countercyclical buffer applicable to MUFG is 0.04%.
(2) Effective as of March 31, 2019, the minimum leverage ratio requirement was adopted by the FSA.
Mitsubishi UFJ Morgan Stanley Securities and other securities subsidiaries in Japan and overseas are alsosubject to regulatory capital requirements of the countries or jurisdictions in which they operate. In Japan, theFinancial Instruments and Exchange Act and related ordinance require financial instruments firms to maintain aminimum capital ratio of 120% calculated as a percentage of capital accounts less certain fixed assets, asdetermined in accordance with Japanese GAAP, against amounts equivalent to market, counterparty credit andoperational risks. Specific guidelines are issued as a ministerial ordinance which details the definition of essentialcomponents of the capital ratios, including capital, deductible fixed asset items and risks, and related measures.Failure to maintain a minimum capital ratio will trigger mandatory regulatory actions. A capital ratio of less than140% will call for regulatory reporting and a capital ratio of less than 100% may lead to a suspension of all orpart of the business for a period of time and cancellation of a registration.
At March 31, 2018, Mitsubishi UFJ Morgan Stanley Securities’s capital accounts less certain fixed assets of¥446,539 million on a stand-alone basis and ¥473,296 million on a consolidated basis, were 291.2% and 293.2%of the total amounts equivalent to market, counterparty credit and operational risks, respectively. At March 31,2019, its capital accounts less certain fixed assets of ¥446,609 million on a stand-alone basis and ¥469,272million on a consolidated basis, were 331.6% and 332.2% of the total amounts equivalent to market, counterpartycredit and operational risks, respectively.
Management believes, as of March 31, 2019, that MUFG, MUFG Bank, Mitsubishi UFJ Trust and Banking,Mitsubishi UFJ Morgan Stanley Securities and other regulated securities subsidiaries met all capital adequacyrequirements to which they are subject.
F-105

MITSUBISHI UFJ FINANCIAL GROUP, INC. AND SUBSIDIARIES
NOTES TO CONSOLIDATED FINANCIAL STATEMENTS—(Continued)
United States of America
In the United States of America, MUFG Americas Holdings and its banking subsidiary MUFG Union Bank,N.A. (“MUFG Union Bank” or “BK(US)”), MUFG Bank’s largest subsidiaries operating outside Japan, aresubject to various regulatory capital requirements administered by the U. S. Federal banking agencies. Failure tomeet minimum capital requirements can initiate certain mandatory, and possibly additional discretionary, actionsby regulators that, if undertaken, could have a material effect on MUFG Americas Holdings’s consolidatedfinancial statements. Under capital adequacy guidelines and the regulatory framework for prompt correctiveaction, MUFG Americas Holdings and MUFG Union Bank must meet specific capital guidelines that involvequantitative measures of MUFG Americas Holdings’s and MUFG Union Bank’s assets, liabilities, and certainoff-balance sheet items as calculated under regulatory accounting practices. MUFG Americas Holdings’s capitalamounts and MUFG Union Bank’s prompt corrective action classification are also subject to qualitativejudgments by the regulators about components, risk-weightings and other factors. Prompt corrective actionprovisions are not applicable to bank holding companies such as MUFG Americas Holdings. MUFG Union Bankis subject to laws and regulations that limit the amount of dividends MUFG Union Bank can pay to MUFGAmericas Holdings.
Quantitative measures established by regulation to help ensure capital adequacy require MUFG AmericasHoldings and MUFG Union Bank to maintain minimum amounts and ratios (set forth in the tables below) ofTotal and Tier 1 capital (as defined in the regulations) to risk-weighted assets (as defined) and of Tier 1 capital(as defined) to quarterly average assets (as defined).
In July 2013, the Board of Governors of the Federal Reserve System and the other U.S. Federal bankingagencies adopted final rules making significant changes to the U.S. regulatory capital framework forU.S. banking organizations (U.S. Basel III). The final rules are intended to conform this framework to the BCBS’current international regulatory capital accord (Basel III). These rules replace the U.S. Federal banking agencies’general risk-based capital rules (commonly known as “Basel I”), advanced approaches rules (commonly knownas “Basel II”) that are applicable to certain large banking organizations (including MUFG Union Bank), andleverage rules, and are subject to certain transition provisions. Among other requirements, the U.S. Basel III rulesrevise the definition of capital, increase minimum capital ratios, and introduce a minimum Common EquityTier 1 capital ratio of 4.5% and a capital conservation buffer of 2.5% (for a total minimum Common EquityTier 1 capital ratio of 7.0%) and a potential countercyclical buffer of up to 2.5%, which would be imposed byregulators at their discretion if it is determined that a period of excessive credit growth is contributing to anincrease in financial institution systemic risk; mandate a Tier 1 leverage ratio of 4% and introduce, for large andinternationally active bank holding companies, a Tier 1 Supplementary Leverage Ratio that is currently set at 3%and which incorporates off-balance sheet exposures; revise Basel I rules for calculating risk-weighted assetsunder a standardized approach; modify the existing Basel II advanced approaches rules for calculating risk-weighted assets under U.S. Basel III; and eliminate, for advanced approaches institutions, over a four-yearphase-in period beginning on January 1, 2014, the Accumulated OCI or loss exclusion that had applied underBasel I and Basel II rules.
As a result of the Federal Reserve’s approval of MUFG Americas Holdings’s request to opt out of theadvanced approaches methodology in the fourth quarter of 2014, MUFG Americas Holdings calculated itsregulatory capital ratios under U.S. Basel I rules at December 31, 2014 and became subject to the U.S. Basel IIIstandardized approach on January 1, 2015, with certain provisions subject to phase-in periods. As permitted forinstitutions not subject to the advanced approaches methodology, MUFG Americas Holdings made a one-timepermanent election in the first quarter of 2015 to exclude certain components of the Accumulated OCI from itsregulatory capital calculations. MUFG Union Bank continues to be subject to the advanced approaches rules.Advanced approaches institutions were required to apply U.S. Basel III rules beginning on January 1, 2014. The
F-106

MITSUBISHI UFJ FINANCIAL GROUP, INC. AND SUBSIDIARIES
NOTES TO CONSOLIDATED FINANCIAL STATEMENTS—(Continued)
U.S. Basel III rules are scheduled to be substantially phased in by January 1, 2019. Effective June 30, 2015,MUFG Americas Holdings updated the methodologies applied to the calculation of its regulatory capital ratiosdue to recent regulatory guidance, which clarified the treatment of certain off-balance sheet credit exposures.These methodologies were applied to MUFG Americas Holdings’s capital ratios and increased the ratios byapproximately 50 basis points. This change did not affect MUFG Union Bank’s ratios as the U.S. Office of theComptroller of the Currency (“OCC”) had previously adopted this guidance.
As required under U.S. Basel III rules, the 2.5% capital conservation buffer is being implemented on aphased-in basis in equal increments of 0.625% per year over a four-year period that commenced on January 1,2016. MUFG Americas Holdings and MUFG Union Bank would satisfy the minimum capital requirementsincluding the capital conservation buffer on a fully phased-in basis if those requirements were effective as ofDecember 31, 2018.
The figures on the table below are calculated according to U.S. Basel III as of December 31, 2017 and 2018.MUFG Americas Holdings’s actual capital amounts and ratios are presented as follows:
ActualMinimum capitalratios required(1)
Amount Ratio Amount Ratio
(in millions, except percentages)
MUAH:At December 31, 2017:
Total capital (to risk-weighted assets) . . . . . . . . . . . . . . . . . . . $17,106 17.76% $ 8,910 9.250%Tier 1 capital (to risk-weighted assets) . . . . . . . . . . . . . . . . . . 15,708 16.31 6,984 7.250Tier 1 capital (to quarterly average assets)(2) . . . . . . . . . . . . . 15,708 10.06 6,245 4.000Common Equity Tier 1 capital (to risk-weighted assets) . . . . 15,708 16.31 5,539 5.750
At December 31, 2018:Total capital (to risk-weighted assets) . . . . . . . . . . . . . . . . . . . $14,904 14.60% $10,081 9.875%Tier 1 capital (to risk-weighted assets) . . . . . . . . . . . . . . . . . . 14,256 13.96 8,039 7.875Tier 1 capital (to quarterly average assets)(2) . . . . . . . . . . . . . 14,256 8.77 6,502 4.000Common Equity Tier 1 capital (to risk-weighted assets) . . . . 14,256 13.96 6,508 6.375
Notes:(1) The minimum capital requirement includes a capital conservation buffer of 1.250% at December 31, 2017 and 1.875% at December 31,
2018.(2) Excludes certain deductions.
F-107
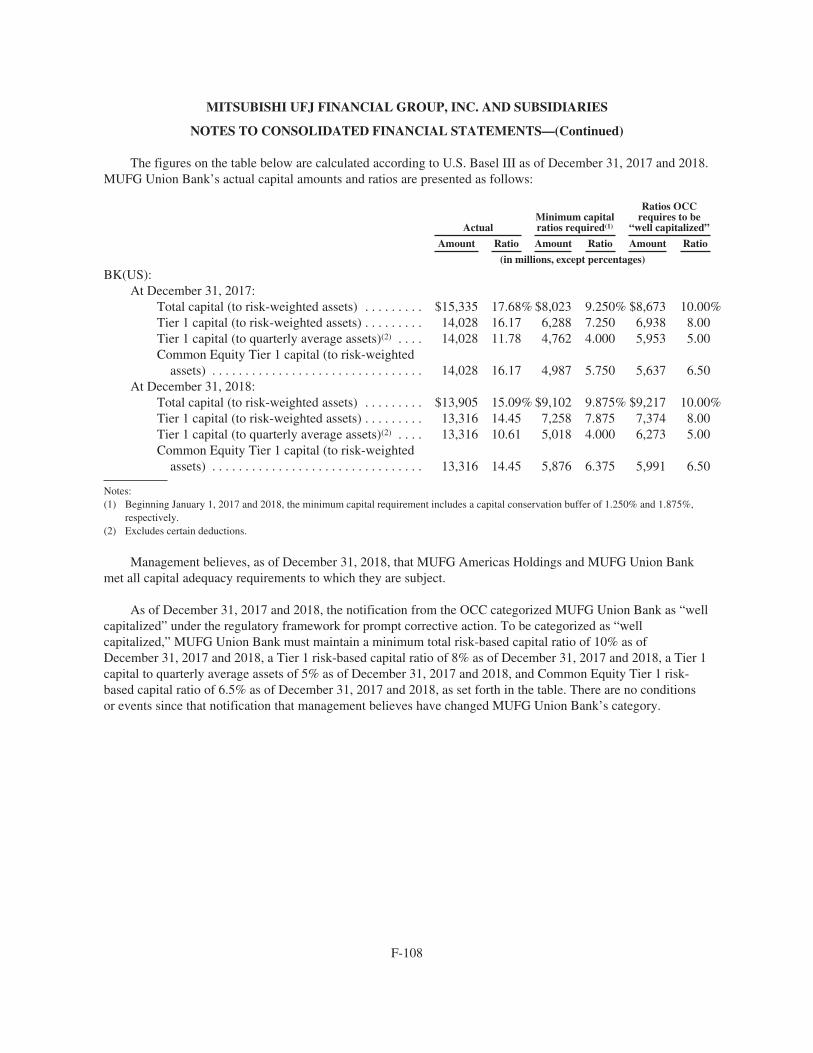
MITSUBISHI UFJ FINANCIAL GROUP, INC. AND SUBSIDIARIES
NOTES TO CONSOLIDATED FINANCIAL STATEMENTS—(Continued)
The figures on the table below are calculated according to U.S. Basel III as of December 31, 2017 and 2018.MUFG Union Bank’s actual capital amounts and ratios are presented as follows:
ActualMinimum capitalratios required(1)
Ratios OCCrequires to be
“well capitalized”
Amount Ratio Amount Ratio Amount Ratio
(in millions, except percentages)
BK(US):At December 31, 2017:
Total capital (to risk-weighted assets) . . . . . . . . . $15,335 17.68% $8,023 9.250% $8,673 10.00%Tier 1 capital (to risk-weighted assets) . . . . . . . . . 14,028 16.17 6,288 7.250 6,938 8.00Tier 1 capital (to quarterly average assets)(2) . . . . 14,028 11.78 4,762 4.000 5,953 5.00Common Equity Tier 1 capital (to risk-weighted
assets) . . . . . . . . . . . . . . . . . . . . . . . . . . . . . . . . 14,028 16.17 4,987 5.750 5,637 6.50At December 31, 2018:
Total capital (to risk-weighted assets) . . . . . . . . . $13,905 15.09% $9,102 9.875% $9,217 10.00%Tier 1 capital (to risk-weighted assets) . . . . . . . . . 13,316 14.45 7,258 7.875 7,374 8.00Tier 1 capital (to quarterly average assets)(2) . . . . 13,316 10.61 5,018 4.000 6,273 5.00Common Equity Tier 1 capital (to risk-weighted
assets) . . . . . . . . . . . . . . . . . . . . . . . . . . . . . . . . 13,316 14.45 5,876 6.375 5,991 6.50
Notes:(1) Beginning January 1, 2017 and 2018, the minimum capital requirement includes a capital conservation buffer of 1.250% and 1.875%,
respectively.(2) Excludes certain deductions.
Management believes, as of December 31, 2018, that MUFG Americas Holdings and MUFG Union Bankmet all capital adequacy requirements to which they are subject.
As of December 31, 2017 and 2018, the notification from the OCC categorized MUFG Union Bank as “wellcapitalized” under the regulatory framework for prompt corrective action. To be categorized as “wellcapitalized,” MUFG Union Bank must maintain a minimum total risk-based capital ratio of 10% as ofDecember 31, 2017 and 2018, a Tier 1 risk-based capital ratio of 8% as of December 31, 2017 and 2018, a Tier 1capital to quarterly average assets of 5% as of December 31, 2017 and 2018, and Common Equity Tier 1 risk-based capital ratio of 6.5% as of December 31, 2017 and 2018, as set forth in the table. There are no conditionsor events since that notification that management believes have changed MUFG Union Bank’s category.
F-108

MITSUBISHI UFJ FINANCIAL GROUP, INC. AND SUBSIDIARIES
NOTES TO CONSOLIDATED FINANCIAL STATEMENTS—(Continued)
23. EARNINGS PER COMMON SHARE APPLICABLE TO COMMON SHAREHOLDERS OF MUFG
Reconciliations of net income and weighted average number of common shares outstanding used for thecomputation of basic EPS to the adjusted amounts for the computation of diluted EPS for the fiscal years endedMarch 31, 2017, 2018 and 2019 are as follows:
2017 2018 2019
(in millions)
Income (Numerator):Net income attributable to Mitsubishi UFJ Financial Group . . . . . . . ¥ 202,680 ¥ 1,228,160 ¥ 718,645
Effect of dilutive instruments:Stock acquisition rights and restricted stock units—Morgan
Stanley . . . . . . . . . . . . . . . . . . . . . . . . . . . . . . . . . . . . . . . . . . . (3,212) (3,826) (3,745)
Earnings applicable to common shareholders of Mitsubishi UFJFinancial Group and assumed conversions . . . . . . . . . . . . . . . . . . . ¥ 199,468 ¥ 1,224,334 ¥ 714,900
2017 2018 2019
(thousands of shares)
Shares (Denominator):Weighted average common shares outstanding . . . . . . . . . . . . . . . . . 13,574,314 13,291,842 13,058,698Effect of dilutive instruments:
Stock acquisition rights and the common shares of MUFGunder the Board Incentive Plan(1) . . . . . . . . . . . . . . . . . . . . . . 10,571 1,650 484
Weighted average common shares for diluted computation . . . . . . . . 13,584,885 13,293,492 13,059,182
2017 2018 2019
(in yen)
Earnings per common share applicable to common shareholdersof Mitsubishi UFJ Financial Group:
Basic earnings per common share:Earnings applicable to common shareholders of Mitsubishi
UFJ Financial Group . . . . . . . . . . . . . . . . . . . . . . . . . . . . . . . . ¥ 14.93 ¥ 92.40 ¥ 55.03
Diluted earnings per common share:Earnings applicable to common shareholders of Mitsubishi
UFJ Financial Group(1) . . . . . . . . . . . . . . . . . . . . . . . . . . . . . . ¥ 14.68 ¥ 92.10 ¥ 54.74
Note:(1) For the fiscal year ended March 31, 2019, the performance-based plan under the Board Incentive Plan could potentially dilute earnings
per common share but were not included in the computation of diluted earnings per common share due to their antidilutive effects.
24. DERIVATIVE FINANCIAL INSTRUMENTS
The MUFG Group uses various derivative financial instruments both for trading purposes and for purposesother than trading (primarily risk management purposes) in the normal course of business to meet the financialneeds of its customers, as a source of revenue and to manage its exposures to a variety of risks.
Market risk is the possibility that future changes in market indices make the financial instruments lessvaluable. The MUFG Group is a party to derivative financial instruments, including swaps, forwards, options and
F-109

MITSUBISHI UFJ FINANCIAL GROUP, INC. AND SUBSIDIARIES
NOTES TO CONSOLIDATED FINANCIAL STATEMENTS—(Continued)
other types of derivatives, dealing primarily with market risk associated with interest rates, foreign currencies,equity and commodity prices, and credit risk associated with counterparty’s nonperformance of transactions.
Credit risk is the possibility that a loss may result from a counterparty’s failure to perform according to theterms and conditions of the contract, which may exceed the value of underlying collateral. To reduce credit risk,the MUFG Group may require collateral or guarantees based on a case-by-case assessment of creditworthiness ofeach customer and evaluation of the instrument. The MUFG Group also uses master netting agreements in orderto mitigate overall counterparty credit risk.
Trading Activities
The MUFG Group’s trading activities include dealing and customer accommodation activities. As part of itstrading activities, the MUFG Group offers a variety of derivative financial instruments for managing interest rateand foreign exchange risk to its domestic and foreign corporate and financial institution customers. The MUFGGroup also enters into other types of derivative transactions, including equity and credit-related contracts, for itsown account.
Risk Management Activities
As part of the MUFG Group’s risk management activities, asset and liability management is viewed as oneof the methods for the MUFG Group to manage its interest rate exposures on interest-bearing assets andliabilities. The MUFG Group uses certain derivative financial instruments in order to minimize significantunplanned fluctuations in earnings that are caused by interest rate volatility. For example, an increase or adecrease in interest income and interest expense on hedged variable rate assets and liabilities as a result ofinterest rate fluctuations are expected to be substantially offset by the variability in earnings by gains and losseson the derivative instruments that are linked to these hedged assets and liabilities.
The MUFG Group enters into interest rate swaps and other contracts primarily to manage the interest raterisk of its loans, investment securities and deposit liabilities. Interest rate contracts, which are generallynon-leveraged generic interest rate and basis swaps, options and futures, allow the MUFG Group to effectivelymanage its interest rate risk position. Option contracts primarily consist of caps, floors, swaptions and options onindex futures. Futures contracts used for asset and liability management activities are primarily index futuresproviding for cash payments based upon the movement of an underlying rate index.
The MUFG Group enters into forward exchange contracts, currency swaps and other contracts in responseto currency exposures resulting from on-balance sheet assets and liabilities denominated in foreign currencies inorder to limit the net foreign exchange position by currency to an appropriate level.
Derivatives Designated as Hedges
The MUFG Group adopts hedging strategies and applies hedge accounting to certain derivative transactionsentered by MUFG Americas Holdings whose fiscal period ends on December 31.
Cash Flow Hedges
At December 31, 2018, MUFG Americas Holdings used interest rate floors with a notional amount of¥55.5 billion and interest rate swaps with a notional amount of ¥19.3 billion to hedge the risk of changes in cashflows attributable to changes in the designated benchmark interest rate on LIBOR indexed loans and LIBORindexed short-term borrowings, respectively. At December 31, 2018, the weighted average remaining life ofactive cash flow hedges was 2.6 years.
F-110

MITSUBISHI UFJ FINANCIAL GROUP, INC. AND SUBSIDIARIES
NOTES TO CONSOLIDATED FINANCIAL STATEMENTS—(Continued)
For cash flow hedges, the effective portion of the gain or loss on the hedging instruments is reported as acomponent of OCI and reclassified into earnings in the same period or periods during which the hedged cashflows are recognized in net interest income. Gains and losses representing hedge ineffectiveness are recognizedin non-interest expense in the period in which they arise. At December 31, 2018, MUFG Americas Holdingsexpects to reclassify approximately ¥9.8 billion of losses from Accumulated OCI as a reduction to net interestincome during the year ending December 31, 2019. This amount could differ from amounts actually realized dueto changes in interest rates, hedge terminations and the addition of other hedges subsequent to December 31,2018.
Fair Value Hedges
MUFG Americas Holdings engaged in an interest rate hedging strategy in which one or more interest rateswaps were associated with a specified interest bearing liability, in order to convert the liability from a fixed rateto a floating rate instrument. This strategy mitigated the changes in fair value of the hedged liability caused bychanges in the designated benchmark interest rate, LIBOR.
For fair value hedges, any ineffectiveness is recognized in non-interest expense in the period in which itarises. The change in the fair value of the hedged item and the hedging instrument, to the extent completelyeffective, offsets with no impact on earnings. For the fiscal years ended December 31, 2017 and 2018, MUFGAmericas Holdings recorded losses on the hedging instruments and gains on the hedged liability, both of whichwere less than ¥1 billion.
Notional Amounts of Derivative Contracts
The following table summarizes the notional amounts of derivative contracts at March 31, 2018 and 2019:
Notional amounts(1)
2018 2019
(in trillions)
Interest rate contracts . . . . . . . . . . . . . . . . . . . . . . . . . . . . . . . . . . . . . . . . . . . . . . . . . . . . . . ¥1,219.7 ¥1,409.6Foreign exchange contracts . . . . . . . . . . . . . . . . . . . . . . . . . . . . . . . . . . . . . . . . . . . . . . . . . . 220.8 230.5Equity contracts . . . . . . . . . . . . . . . . . . . . . . . . . . . . . . . . . . . . . . . . . . . . . . . . . . . . . . . . . . . 6.1 6.4Commodity contracts . . . . . . . . . . . . . . . . . . . . . . . . . . . . . . . . . . . . . . . . . . . . . . . . . . . . . . 0.3 0.2Credit derivatives . . . . . . . . . . . . . . . . . . . . . . . . . . . . . . . . . . . . . . . . . . . . . . . . . . . . . . . . . 6.5 7.2Others . . . . . . . . . . . . . . . . . . . . . . . . . . . . . . . . . . . . . . . . . . . . . . . . . . . . . . . . . . . . . . . . . . 3.1 3.0
Total . . . . . . . . . . . . . . . . . . . . . . . . . . . . . . . . . . . . . . . . . . . . . . . . . . . . . . . . . . . . . . . ¥1,456.5 ¥1,656.9
Note:(1) Includes both written and purchased positions.
F-111

MITSUBISHI UFJ FINANCIAL GROUP, INC. AND SUBSIDIARIES
NOTES TO CONSOLIDATED FINANCIAL STATEMENTS—(Continued)
Impact of Derivatives on the Consolidated Balance Sheets
The following table summarizes fair value information on derivative instruments that are recorded on theMUFG Group’s consolidated balance sheets at March 31, 2018 and 2019:
Fair value of derivative instruments
2018(1)(5) 2019(1)(5)
Not designatedas hedges(2)
Designatedas hedges(3)
Totalderivatives(4)
Not designatedas hedges(2)
Designatedas hedges(3)
Totalderivatives(4)
(in billions)Derivative assets:
Interest rate contracts . . . . . . . . . . . . . . ¥ 8,712 ¥ — ¥ 8,712 ¥10,108 ¥ 1 ¥ 10,109Foreign exchange contracts . . . . . . . . . 3,557 — 3,557 2,795 — 2,795Equity contracts . . . . . . . . . . . . . . . . . . 207 — 207 188 — 188Commodity contracts . . . . . . . . . . . . . . 35 — 35 27 — 27Credit derivatives . . . . . . . . . . . . . . . . . 72 — 72 84 — 84Others . . . . . . . . . . . . . . . . . . . . . . . . . . 2 — 2 2 — 2
Total derivative assets . . . . . . . . . ¥12,585 ¥ — ¥12,585 ¥13,204 ¥ 1 ¥ 13,205
Derivative liabilities:Interest rate contracts . . . . . . . . . . . . . . ¥ 8,674 ¥ 17 ¥ 8,691 ¥ 9,896 ¥ — ¥ 9,896Foreign exchange contracts . . . . . . . . . 3,000 — 3,000 2,671 — 2,671Equity contracts . . . . . . . . . . . . . . . . . . 227 — 227 183 — 183Commodity contracts . . . . . . . . . . . . . . 33 — 33 27 — 27Credit derivatives . . . . . . . . . . . . . . . . . 71 — 71 69 — 69Others(6) . . . . . . . . . . . . . . . . . . . . . . . . (145) — (145) (136) — (136)
Total derivative liabilities . . . . . . ¥11,860 ¥ 17 ¥11,877 ¥12,710 ¥ — ¥ 12,710
Notes:(1) The fair value of derivative instruments is presented on a gross basis even when derivative instruments are subject to master netting
agreements. Cash collateral payable and receivable associated with derivative instruments are not added to or netted against the fair valueamounts.
(2) The derivative instruments which are not designated as a hedging instrument are held for trading and risk management purposes, and arepresented in Trading account assets/liabilities except for (6).
(3) The MUFG Group adopts hedging strategies and applies hedge accounting to certain derivative transactions entered into by MUFGAmericas Holdings. The derivative instruments which are designated as hedging instruments are presented in Other assets or Otherliabilities on the accompanying consolidated balance sheets.
(4) This table does not include contracts with embedded derivatives for which the fair value option has been elected.(5) For more information about fair value measurement and assumptions used to measure the fair value of derivatives, see Note 32.(6) Others include mainly bifurcated embedded derivatives carried at fair value, which are presented in Deposits and Long-term debt.
F-112
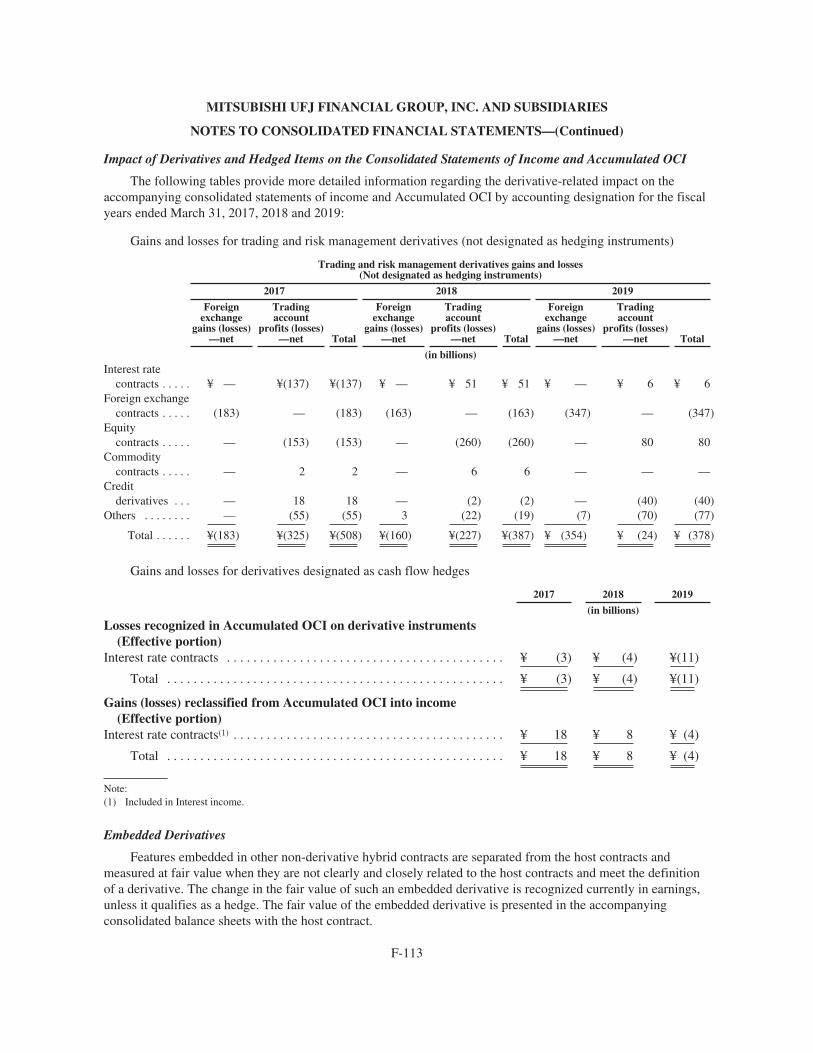
MITSUBISHI UFJ FINANCIAL GROUP, INC. AND SUBSIDIARIES
NOTES TO CONSOLIDATED FINANCIAL STATEMENTS—(Continued)
Impact of Derivatives and Hedged Items on the Consolidated Statements of Income and Accumulated OCI
The following tables provide more detailed information regarding the derivative-related impact on theaccompanying consolidated statements of income and Accumulated OCI by accounting designation for the fiscalyears ended March 31, 2017, 2018 and 2019:
Gains and losses for trading and risk management derivatives (not designated as hedging instruments)
Trading and risk management derivatives gains and losses(Not designated as hedging instruments)
2017 2018 2019
Foreignexchange
gains (losses)—net
Tradingaccount
profits (losses)—net Total
Foreignexchange
gains (losses)—net
Tradingaccount
profits (losses)—net Total
Foreignexchange
gains (losses)—net
Tradingaccount
profits (losses)—net Total
(in billions)Interest rate
contracts . . . . . ¥ — ¥(137) ¥(137) ¥ — ¥ 51 ¥ 51 ¥ — ¥ 6 ¥ 6Foreign exchange
contracts . . . . . (183) — (183) (163) — (163) (347) — (347)Equity
contracts . . . . . — (153) (153) — (260) (260) — 80 80Commodity
contracts . . . . . — 2 2 — 6 6 — — —Credit
derivatives . . . — 18 18 — (2) (2) — (40) (40)Others . . . . . . . . — (55) (55) 3 (22) (19) (7) (70) (77)
Total . . . . . . ¥(183) ¥(325) ¥(508) ¥(160) ¥(227) ¥(387) ¥ (354) ¥ (24) ¥ (378)
Gains and losses for derivatives designated as cash flow hedges
2017 2018 2019
(in billions)
Losses recognized in Accumulated OCI on derivative instruments(Effective portion)
Interest rate contracts . . . . . . . . . . . . . . . . . . . . . . . . . . . . . . . . . . . . . . . . . . ¥ (3) ¥ (4) ¥(11)
Total . . . . . . . . . . . . . . . . . . . . . . . . . . . . . . . . . . . . . . . . . . . . . . . . . . . ¥ (3) ¥ (4) ¥(11)
Gains (losses) reclassified from Accumulated OCI into income(Effective portion)
Interest rate contracts(1) . . . . . . . . . . . . . . . . . . . . . . . . . . . . . . . . . . . . . . . . . ¥ 18 ¥ 8 ¥ (4)
Total . . . . . . . . . . . . . . . . . . . . . . . . . . . . . . . . . . . . . . . . . . . . . . . . . . . ¥ 18 ¥ 8 ¥ (4)
Note:(1) Included in Interest income.
Embedded Derivatives
Features embedded in other non-derivative hybrid contracts are separated from the host contracts andmeasured at fair value when they are not clearly and closely related to the host contracts and meet the definitionof a derivative. The change in the fair value of such an embedded derivative is recognized currently in earnings,unless it qualifies as a hedge. The fair value of the embedded derivative is presented in the accompanyingconsolidated balance sheets with the host contract.
F-113
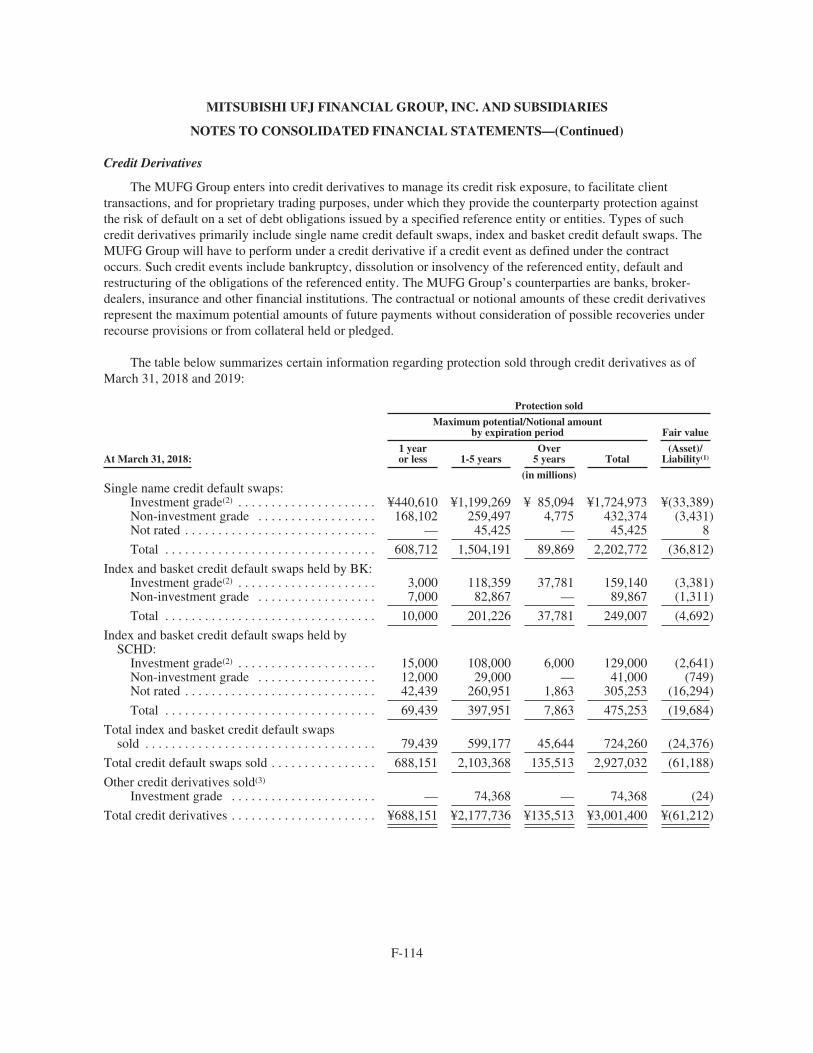
MITSUBISHI UFJ FINANCIAL GROUP, INC. AND SUBSIDIARIES
NOTES TO CONSOLIDATED FINANCIAL STATEMENTS—(Continued)
Credit Derivatives
The MUFG Group enters into credit derivatives to manage its credit risk exposure, to facilitate clienttransactions, and for proprietary trading purposes, under which they provide the counterparty protection againstthe risk of default on a set of debt obligations issued by a specified reference entity or entities. Types of suchcredit derivatives primarily include single name credit default swaps, index and basket credit default swaps. TheMUFG Group will have to perform under a credit derivative if a credit event as defined under the contractoccurs. Such credit events include bankruptcy, dissolution or insolvency of the referenced entity, default andrestructuring of the obligations of the referenced entity. The MUFG Group’s counterparties are banks, broker-dealers, insurance and other financial institutions. The contractual or notional amounts of these credit derivativesrepresent the maximum potential amounts of future payments without consideration of possible recoveries underrecourse provisions or from collateral held or pledged.
The table below summarizes certain information regarding protection sold through credit derivatives as ofMarch 31, 2018 and 2019:
Protection sold
Maximum potential/Notional amountby expiration period Fair value
At March 31, 2018:1 yearor less 1-5 years
Over5 years Total
(Asset)/Liability(1)
(in millions)Single name credit default swaps:
Investment grade(2) . . . . . . . . . . . . . . . . . . . . . ¥440,610 ¥1,199,269 ¥ 85,094 ¥1,724,973 ¥(33,389)Non-investment grade . . . . . . . . . . . . . . . . . . 168,102 259,497 4,775 432,374 (3,431)Not rated . . . . . . . . . . . . . . . . . . . . . . . . . . . . . — 45,425 — 45,425 8
Total . . . . . . . . . . . . . . . . . . . . . . . . . . . . . . . . 608,712 1,504,191 89,869 2,202,772 (36,812)
Index and basket credit default swaps held by BK:Investment grade(2) . . . . . . . . . . . . . . . . . . . . . 3,000 118,359 37,781 159,140 (3,381)Non-investment grade . . . . . . . . . . . . . . . . . . 7,000 82,867 — 89,867 (1,311)
Total . . . . . . . . . . . . . . . . . . . . . . . . . . . . . . . . 10,000 201,226 37,781 249,007 (4,692)
Index and basket credit default swaps held bySCHD:
Investment grade(2) . . . . . . . . . . . . . . . . . . . . . 15,000 108,000 6,000 129,000 (2,641)Non-investment grade . . . . . . . . . . . . . . . . . . 12,000 29,000 — 41,000 (749)Not rated . . . . . . . . . . . . . . . . . . . . . . . . . . . . . 42,439 260,951 1,863 305,253 (16,294)
Total . . . . . . . . . . . . . . . . . . . . . . . . . . . . . . . . 69,439 397,951 7,863 475,253 (19,684)
Total index and basket credit default swapssold . . . . . . . . . . . . . . . . . . . . . . . . . . . . . . . . . . . 79,439 599,177 45,644 724,260 (24,376)
Total credit default swaps sold . . . . . . . . . . . . . . . . 688,151 2,103,368 135,513 2,927,032 (61,188)
Other credit derivatives sold(3)
Investment grade . . . . . . . . . . . . . . . . . . . . . . — 74,368 — 74,368 (24)
Total credit derivatives . . . . . . . . . . . . . . . . . . . . . . ¥688,151 ¥2,177,736 ¥135,513 ¥3,001,400 ¥(61,212)
F-114

MITSUBISHI UFJ FINANCIAL GROUP, INC. AND SUBSIDIARIES
NOTES TO CONSOLIDATED FINANCIAL STATEMENTS—(Continued)
Protection sold
Maximum potential/Notional amountby expiration period Fair value
At March 31, 2019:1 yearor less 1-5 years
Over5 years Total
(Asset)/Liability(1)
(in millions)Single name credit default swaps:
Investment grade(2) . . . . . . . . . . . . . . . . . . . . . ¥378,527 ¥1,603,962 ¥145,689 ¥2,128,178 ¥(30,303)Non-investment grade . . . . . . . . . . . . . . . . . . 112,901 238,330 5,672 356,903 (127)Not rated . . . . . . . . . . . . . . . . . . . . . . . . . . . . . — 5,097 — 5,097 (47)
Total . . . . . . . . . . . . . . . . . . . . . . . . . . . . . . . . 491,428 1,847,389 151,361 2,490,178 (30,477)
Index and basket credit default swaps held by BK:Investment grade(2) . . . . . . . . . . . . . . . . . . . . . — 120,854 — 120,854 (82)Non-investment grade . . . . . . . . . . . . . . . . . . — 101,001 — 101,001 (2,010)
Total . . . . . . . . . . . . . . . . . . . . . . . . . . . . . . . . — 221,855 — 221,855 (2,092)
Index and basket credit default swaps held bySCHD:
Investment grade(2) . . . . . . . . . . . . . . . . . . . . . 13,000 194,618 8,000 215,618 (3,853)Non-investment grade . . . . . . . . . . . . . . . . . . — — — — —Not rated . . . . . . . . . . . . . . . . . . . . . . . . . . . . . 8,863 206,832 3,444 219,139 (3,043)
Total . . . . . . . . . . . . . . . . . . . . . . . . . . . . . . . . 21,863 401,450 11,444 434,757 (6,896)
Total index and basket credit default swapssold . . . . . . . . . . . . . . . . . . . . . . . . . . . . . . . . . . . 21,863 623,305 11,444 656,612 (8,988)
Total credit default swaps sold . . . . . . . . . . . . . . . . 513,291 2,470,694 162,805 3,146,790 (39,465)
Other credit derivatives sold(3)
Investment grade . . . . . . . . . . . . . . . . . . . . . . 77,693 — — 77,693 (620)
Total credit derivatives . . . . . . . . . . . . . . . . . . . . . . ¥590,984 ¥2,470,694 ¥162,805 ¥3,224,483 ¥(40,085)
Notes:(1) Fair value amounts are shown on a gross basis prior to cash collateral or counterparty netting.(2) The MUFG Group considers ratings of Baa3/BBB- or higher to meet the definition of investment grade.(3) Other credit derivatives primarily consist of total return swaps.
Single name credit default swaps—Single name credit default swap protects the buyer against the loss ofprincipal on a bond or loan in case of a default by the issuer. The protection buyer pays a premium to the MUFGGroup and is protected for the period of the credit default swap. As the seller of protection, the MUFG Group inturn will have to perform under a credit default swap if a credit event as defined under the contracts occurs. Inorder to provide an indication of the current payment/performance risk of the credit default swaps, the externalcredit ratings, primarily those provided by Moody’s and Standard & Poor’s (“S&P”), of the underlying referenceentity of the credit default swaps are disclosed.
Index and basket credit default swaps—Index and basket credit default swaps are credit default swaps thatreference multiple names through underlying baskets or portfolios of single name credit default swaps. Typically,in the event of a default on one of the underlying names, the MUFG Group, as the seller of protection, will haveto pay a pro-rata portion of the total notional amount of the credit default index or basket contract. In order toprovide an indication of the current payment/performance risk of these credit default swaps, MUFG Bank andMitsubishi UFJ Securities Holdings rating scale based upon the entity’s internal ratings, which generallycorrespond to ratings defined by primarily Moody’s and S&P, of the underlying reference entities comprising thebasket or index were calculated and disclosed.
F-115

MITSUBISHI UFJ FINANCIAL GROUP, INC. AND SUBSIDIARIES
NOTES TO CONSOLIDATED FINANCIAL STATEMENTS—(Continued)
The MUFG Group may economically hedge its exposure to credit derivatives by entering into offsettingderivative contracts. The carrying value and notional amounts of credit protection sold in which the MUFGGroup held purchased protection with identical underlying referenced entities were approximately ¥52 billionand ¥2,416 billion, respectively, at March 31, 2018, and approximately ¥35 billion and ¥2,687 billion,respectively, at March 31, 2019.
Collateral is held by the MUFG Group in relation to these instruments. Collateral requirements aredetermined at the counterparty level and cover numerous transactions and products as opposed to individualcontracts.
Credit Risk, Liquidity Risk and Credit-risk-related Contingent Features
Certain derivative instruments held by the MUFG Group contain provisions that require the MUFG Group’sdebt to maintain an investment grade credit rating from each of the major credit rating agencies. If the MUFGGroup’s debt were to fall below investment grade, it would be in violation of these provisions, and thecounterparties to the derivative instruments could request payments on early termination or demand immediateand ongoing full overnight collateralization on derivative instruments in net liability positions. The aggregate fairvalue of all derivative instruments with credit-risk-related contingent features that were in a liability position atMarch 31, 2018 and 2019 was approximately ¥0.7 trillion and ¥0.6 trillion, respectively, for which the MUFGGroup has posted collateral of approximately ¥127 billion and ¥85 billion, respectively, in the normal course ofbusiness. The amount of additional collateral and early termination amount which could be requested if theMUFG Group’s debt falls below investment grade was ¥78 billion and ¥65 billion, respectively, as of March 31,2018 and ¥84 billion and ¥56 billion, respectively, as of March 31, 2019.
25. OBLIGATIONS UNDER GUARANTEES AND OTHER OFF-BALANCE SHEET INSTRUMENTS
Obligations under Guarantees
The MUFG Group provides customers with a variety of guarantees and similar arrangements, includingstandby letters of credit, financial and performance guarantees, credit protection, liquidity facilities, otheroff-balance sheet credit-related support and similar instruments, in order to meet the customers’ financial andbusiness needs. The tables below present the contractual or notional amounts of such guarantees at March 31,2018 and 2019. The contractual or notional amounts of these instruments represent the maximum potentialamounts of future payments without consideration of possible recoveries under recourse provisions or fromcollateral held or pledged.
For certain types of derivatives, such as written interest rate options and written currency options, themaximum potential future payments are unlimited. Accordingly, it is impracticable to estimate the maximumpotential amount of future payments. As such, the notional amounts of the related contracts, other than themaximum potential payments, are included in the table.
The MUFG Group mitigates its credit risk exposure resulting from guarantees by utilizing varioustechniques, including collateralization in the form of cash, securities, and real estate properties based onmanagement’s credit assessment of the guaranteed parties and the related credit profile. In order to manage thecredit risk exposure, the MUFG Group also enters into sub-participation contracts with third parties who willfund a portion of the credit facility and bear its share of the loss to be incurred in the event that the customer failsto fulfill its obligations. The following table includes guarantees of ¥403.2 billion and ¥468.9 billion atMarch 31, 2018 and 2019, respectively, which are syndicated out to third parties. The contractual or notional
F-116

MITSUBISHI UFJ FINANCIAL GROUP, INC. AND SUBSIDIARIES
NOTES TO CONSOLIDATED FINANCIAL STATEMENTS—(Continued)
amounts summarized in the following table do not necessarily bear any direct relationship to the future actualcredit exposure, primarily because of risk management techniques of the MUFG Group.
Maximumpotential/
Contractualor Notional
amount
Amount by expiration period
At March 31, 2018:1 yearor less 1-5 years
Over5 years
(in billions)
Standby letters of credit and financial guarantees . . . . . . . . . ¥ 4,311 ¥ 3,115 ¥ 850 ¥ 346Performance guarantees . . . . . . . . . . . . . . . . . . . . . . . . . . . . . 3,051 2,144 801 106Derivative instruments(1) . . . . . . . . . . . . . . . . . . . . . . . . . . . . 40,513 15,230 18,314 6,969Liabilities of trust accounts . . . . . . . . . . . . . . . . . . . . . . . . . . 9,444 6,017 558 2,869Others . . . . . . . . . . . . . . . . . . . . . . . . . . . . . . . . . . . . . . . . . . . 22 2 4 16
Total . . . . . . . . . . . . . . . . . . . . . . . . . . . . . . . . . . . . . . . . ¥57,341 ¥26,508 ¥20,527 ¥10,306
Maximumpotential/
Contractualor Notional
amount
Amount by expiration period
At March 31, 2019:1 yearor less 1-5 years
Over5 years
(in billions)
Standby letters of credit and financial guarantees . . . . . . . . . ¥ 3,901 ¥ 2,792 ¥ 838 ¥ 271Performance guarantees . . . . . . . . . . . . . . . . . . . . . . . . . . . . . 3,256 2,332 784 140Derivative instruments(1) . . . . . . . . . . . . . . . . . . . . . . . . . . . . 58,025 29,734 20,921 7,370Liabilities of trust accounts . . . . . . . . . . . . . . . . . . . . . . . . . . 11,520 5,884 420 5,216Others . . . . . . . . . . . . . . . . . . . . . . . . . . . . . . . . . . . . . . . . . . . 53 12 13 28
Total . . . . . . . . . . . . . . . . . . . . . . . . . . . . . . . . . . . . . . . . ¥76,755 ¥40,754 ¥22,976 ¥13,025
Note:(1) Credit derivatives sold by the MUFG Group are excluded from this presentation.
Nature of Guarantee Contracts
Standby letters of credit and financial guarantees generally include an obligation of an issuer or a designatedthird-party to guarantee the performance of the customer to the beneficiary under the terms of contracts such aslending contracts and other similar financial transactions. The MUFG Group is required to make payments to theguaranteed parties in the event that the customers fail to fulfill the obligations under the contracts. The guaranteeswhose contractual maturities are over 5 years are mainly comprised of guarantees of housing loans.
Performance guarantees are contracts that contingently require the MUFG Group to make payments to theguaranteed party based on another party’s failure to perform under an obligating agreement, except financialobligation. For example, performance guarantees include guarantees of completion of construction projects.
Derivative instruments that are deemed to be included within the definition of guarantees as prescribed inthe guidance on guarantees include certain written options and credit default swaps. In order for the MUFGGroup to determine if those derivative instruments meet the definition of guarantees, as prescribed in theguidance on guarantees, the MUFG Group has to track whether the counterparties are actually exposed to lossesthat will result from the adverse change in the underlyings. Accordingly, the MUFG Group has disclosedinformation on all credit default swaps and certain written options for which there is a possibility of meeting thedefinition of guarantees as prescribed in the guidance on guarantees, regardless of whether the counterparties
F-117
MITSUBISHI UFJ FINANCIAL GROUP, INC. AND SUBSIDIARIES
NOTES TO CONSOLIDATED FINANCIAL STATEMENTS—(Continued)
have assets or liabilities related to the underlyings of the derivatives. However, credit derivatives sold by theMUFG Group at March 31, 2018 and 2019 are excluded from this presentation, as they are disclosed in Note 24.
Liabilities of trust accounts represent the trustee’s potential responsibility for temporary payments tocreditors of liabilities of trust accounts making use of funds of the MUFG Group, unless there are certainagreements with trust creditors that have provisions limiting the MUFG Group’s exposure as a trustee to the trustaccount assets. A trust may incur external liabilities to obtain certain services during the terms of the trustarrangement. While in principle, any liabilities of a trust are payable by the trust account and its beneficiaries. Atrustee’s responsibility may be interpreted to encompass temporary payments for the trust account liabilitieswhen the trust account does not maintain sufficient liquidity available for such liabilities unless the agreementwith trust creditors limits the trustee’s exposure to the trust account assets. At March 31, 2018 and 2019, therewere liabilities of ¥9,444 billion and ¥11,520 billion, respectively, in the segregated records of trust accountsincluding the amounts related to liabilities with provisions limiting trustee responsibility. Liabilities of trustaccounts principally includes obligations to return collateral under security lending transactions. The MUFGGroup has experienced no significant losses on such responsibilities and its exposure to the risk associated withthe temporary payments is judged to be remote because trust account liabilities are generally covered by thecorresponding trust account assets. The MUFG Group continuously monitors the liabilities of trust accounts andassesses the trust account’s ability to perform its obligations to prevent any unfavorable outcomes; the MUFGGroup claims its recourse for its temporary payments against the trust account assets and the beneficiaries.
Carrying Amount
At March 31, 2018 and 2019, the carrying amounts of the liabilities related to guarantees and similarinstruments set forth above were ¥1,110,505 million and ¥1,051,297 million, respectively, which are included inOther liabilities and Trading account liabilities. The guarantees and similar instruments comprising the largestcomponents of the total were options sold in the amount of ¥1,069,156 million and ¥1,005,951 million as ofMarch 31, 2018 and 2019, respectively. Credit derivatives sold by the MUFG Group at March 31, 2018 and 2019are excluded from this presentation, as they are disclosed in Note 24. In addition, Other liabilities include anallowance for off-balance sheet instruments of ¥31,101 million and ¥96,946 million at March 31, 2018 and 2019,respectively, related to these transactions.
Performance Risk
The MUFG Group monitors performance risk of its guarantees using the same credit rating system utilizedfor estimating probabilities of default with its loan portfolio. The MUFG Group’s credit rating system isconsistent with both the method of evaluating credit risk under Basel III and those of third-party credit ratingagencies. On certain underlying referenced credits or entities, ratings are not available. Such referenced creditsare included in the “Not rated” category in the following tables.
F-118

MITSUBISHI UFJ FINANCIAL GROUP, INC. AND SUBSIDIARIES
NOTES TO CONSOLIDATED FINANCIAL STATEMENTS—(Continued)
Presented in the tables below is the maximum potential amount of future payments classified based uponinternal credit ratings as of March 31, 2018 and 2019. The determination of the maximum potential futurepayments is based on the notional amount of the guarantees without consideration of possible recoveries underrecourse provisions or from collateral held or pledged. Such amounts do not represent the anticipated losses, ifany, on these guarantees.
Amount by borrower grade
At March 31, 2018:
Maximumpotential/
Contractualor Notional
amount NormalClose
Watch(1)
Likely tobecome
Bankruptor Legally/Virtually
Bankrupt(2)Not
rated
(in billions)
Standby letters of credit and financial guarantees . . . . . . . . . ¥4,311 ¥4,211 ¥ 83 ¥13 ¥ 4Performance guarantees . . . . . . . . . . . . . . . . . . . . . . . . . . . . . 3,051 2,910 113 5 23
Total . . . . . . . . . . . . . . . . . . . . . . . . . . . . . . . . . . . . . . . . ¥7,362 ¥7,121 ¥196 ¥18 ¥27
Amount by borrower grade
At March 31, 2019:
Maximumpotential/
Contractualor Notional
amount NormalClose
Watch(1)
Likely tobecome
Bankruptor Legally/Virtually
Bankrupt(2)Not
rated
(in billions)
Standby letters of credit and financial guarantees . . . . . . . . . ¥3,901 ¥3,779 ¥ 98 ¥21 ¥ 3Performance guarantees . . . . . . . . . . . . . . . . . . . . . . . . . . . . . 3,256 3,070 79 78 29
Total . . . . . . . . . . . . . . . . . . . . . . . . . . . . . . . . . . . . . . . . ¥7,157 ¥6,849 ¥177 ¥99 ¥32
Notes:(1) Borrowers classified as Close Watch represent those that require close monitoring as the borrower has begun to exhibit elements of
potential concern with respect to its business performance and financial condition, the borrower has begun to exhibit elements of seriousconcern with respect to its business performance and financial condition, including business problems requiring long-term solutions, orthe borrower’s loans are TDRs or loans contractually past due 90 days or more for special reasons.
(2) Borrowers classified as Likely to become Bankrupt or Legally/Virtually Bankrupt represent those that have a higher probability ofdefault than those categorized as Close Watch due to serious debt repayment problems with poor progress in achieving restructuringplans, the borrower being considered virtually bankrupt with no prospects for an improvement in business operations, or the borrowerbeing legally bankrupt with no prospects for continued business operations because of non-payment, suspension of business, voluntaryliquidation or filing for legal liquidation.
The guarantees the MUFG Group does not classify based upon internal credit ratings are as follows.
The MUFG Group records all derivative contracts at fair value. Aggregate market risk limits have beenestablished, and market risk measures are routinely monitored against these limits. The MUFG Group alsomanages its exposure to these derivative contracts through a variety of risk mitigation strategies, including, butnot limited to, offsetting economic hedge positions. The MUFG Group expects the risk of loss to be remote andbelieves that the notional amounts of the derivative contracts generally exceed its exposure.
Liabilities of trust accounts represent the trustee’s potential responsibility for temporary payments tocreditors of liabilities of trust accounts using funds of the MUFG Group. The MUFG Group has experienced nosignificant losses on such responsibilities and its exposure to the risk associated with the temporary payments isjudged to be remote because trust account liabilities are generally covered by the corresponding trust accountassets.
F-119

MITSUBISHI UFJ FINANCIAL GROUP, INC. AND SUBSIDIARIES
NOTES TO CONSOLIDATED FINANCIAL STATEMENTS—(Continued)
The MUFG Group conducts securities lending transactions for institutional customers as a fully disclosedagent. At times, securities lending indemnifications are issued to guarantee that a security lending customer willbe made whole in the event the borrower does not return the security subject to the lending agreement andcollateral held is insufficient to cover the market value of the security. All lending transactions are collateralized,primarily by cash. At March 31, 2019, the MUFG Group had no exposure that would require it to pay under thissecurities lending indemnification, since the collateral market value exceeds the fair value of securities lent.
Other Off-balance Sheet Instruments
In addition to obligations under guarantees and similar arrangements set forth above, the MUFG Groupissues other off-balance sheet instruments to meet the financial needs of its customers and for purposes other thantrading. Such off-balance sheet instruments consist of lending-related commitments, including commitments toextend credit and commercial letters of credit that the MUFG Group provides to meet the financing needs of itscustomers. Once the MUFG Group issues these off-balance sheet instruments, the MUFG Group is required toextend credit to or make certain payments to the customers or beneficiaries specified pursuant to the underlyingcontracts unless otherwise provided in the contracts. Since many of these commitments expire without beingdrawn upon, the total commitment amounts do not necessarily represent future cash requirements. At March 31,2019, approximately 64% of these commitments will expire within one year, 33% from one year to five yearsand 3% after five years. The table below presents the contractual amounts with regard to such instruments atMarch 31, 2018 and 2019:
2018 2019
(in billions)
Commitments to extend credit . . . . . . . . . . . . . . . . . . . . . . . . . . . . . . . . . . . . . . . . . . . . . . . . . ¥80,090 ¥77,273Commercial letters of credit . . . . . . . . . . . . . . . . . . . . . . . . . . . . . . . . . . . . . . . . . . . . . . . . . . . 1,191 1,057Commitments to make investments . . . . . . . . . . . . . . . . . . . . . . . . . . . . . . . . . . . . . . . . . . . . . 183 240Other . . . . . . . . . . . . . . . . . . . . . . . . . . . . . . . . . . . . . . . . . . . . . . . . . . . . . . . . . . . . . . . . . . . . . 13 5
Commitments to extend credit, which generally have fixed expiration dates or other termination clauses, arelegally binding agreements to lend to customers. Commitments are different from guarantees in that thecommitments are generally revocable or have provisions that enable the MUFG Group to avoid payments in theevent of violations of any conditions of the contracts and certain deterioration of the potential borrowers’financial condition.
Commercial letters of credit, generally used for trade transactions, are typically secured by the underlyinggoods. The MUFG Group continually monitors the type and amount of collateral and other securities, andrequires counterparties to provide additional collateral or guarantors as necessary.
Commitments to make investments are legally binding contracts to make additional contributions tocorporate recovery or private equity investment funds in accordance with limited partnership agreements. Someof these funds, in which the MUFG Group has significant variable interests, are described in Note 26.
26. VARIABLE INTEREST ENTITIES
In the normal course of business, the MUFG Group has financial interests and other contractual obligationsin various entities which may be deemed to be VIEs such as asset-backed conduits, various investment funds,special purpose entities created for structured financing, repackaged instruments, entities created for thesecuritization of the MUFG Group’s assets and trust arrangements.
F-120

MITSUBISHI UFJ FINANCIAL GROUP, INC. AND SUBSIDIARIES
NOTES TO CONSOLIDATED FINANCIAL STATEMENTS—(Continued)
The following tables present the assets and liabilities of consolidated VIEs recorded on the accompanyingconsolidated balance sheets at March 31, 2018 and 2019:
Consolidated VIEs Consolidated assets
At March 31, 2018: Total
Cash anddue from
banks
Interest-earningdeposits in
other banks
Tradingaccountassets
Investmentsecurities Loans
All otherassets
(in millions)Asset-backed conduits . . . . ¥ 7,390,029 ¥ 52,703 ¥ 44,902 ¥ 2,273 ¥1,777,017 ¥ 5,502,892 ¥ 10,242Investment funds . . . . . . . . 598,662 — 10,300 461,036 19,895 — 107,431Special purpose entities
created for structuredfinancing . . . . . . . . . . . . . 198,484 — 2,332 — — 149,194 46,958
Repackaged instruments . . . 152,781 520 — 17,376 92,210 42,632 43Securitization of the MUFG
Group’s assets . . . . . . . . 10,852,539 — — — — 10,827,488 25,051Trust arrangements . . . . . . . 7,177,407 — 10,541 702 152,277 7,011,255 2,632Others . . . . . . . . . . . . . . . . . 44,247 361 14,236 — 42 12,963 16,645
Total consolidated assetsbefore elimination . . . . . 26,414,149 53,584 82,311 481,387 2,041,441 23,546,424 209,002
The amounts eliminated inconsolidation . . . . . . . . . (7,223,156) (53,454) (59,150) (3,804) (88,758) (6,996,317) (21,673)
Total consolidated assets . . ¥19,190,993 ¥ 130 ¥ 23,161 ¥477,583 ¥1,952,683 ¥16,550,107 ¥187,329
Consolidated liabilities
Total DepositsOther short-term
borrowingsLong-term
debtAll otherliabilities
(in millions)Asset-backed conduits . . . . . . . . . . . . . . . . . ¥ 7,409,190 ¥ — ¥ 5,176,663 ¥ 1,708,354 ¥ 524,173Investment funds . . . . . . . . . . . . . . . . . . . . . 11,735 — — — 11,735Special purpose entities created for
structured financing . . . . . . . . . . . . . . . . . 115,353 — 587 112,054 2,712Repackaged instruments . . . . . . . . . . . . . . . 148,928 — 12,676 132,012 4,240Securitization of the MUFG Group’s
assets . . . . . . . . . . . . . . . . . . . . . . . . . . . . 10,816,672 — 5,000 10,806,145 5,527Trust arrangements . . . . . . . . . . . . . . . . . . . 7,171,852 7,103,738 655 — 67,459Others . . . . . . . . . . . . . . . . . . . . . . . . . . . . . 43,030 — 24,747 1,603 16,680
Total consolidated liabilities beforeelimination . . . . . . . . . . . . . . . . . . . . . . . . 25,716,760 7,103,738 5,220,328 12,760,168 632,526
The amounts eliminated inconsolidation . . . . . . . . . . . . . . . . . . . . . . (15,347,991) — (3,028,987) (12,248,680) (70,324)
The amount of liabilities with recourse tothe general credit of the MUFGGroup . . . . . . . . . . . . . . . . . . . . . . . . . . . . (9,745,330) (7,103,738) (2,162,890) (540) (478,162)
Liabilities of consolidated VIEs for whichcreditors or beneficial interest holders donot have recourse to the general credit ofthe MUFG Group . . . . . . . . . . . . . . . . . . ¥ 623,439 ¥ — ¥ 28,451 ¥ 510,948 ¥ 84,040
F-121
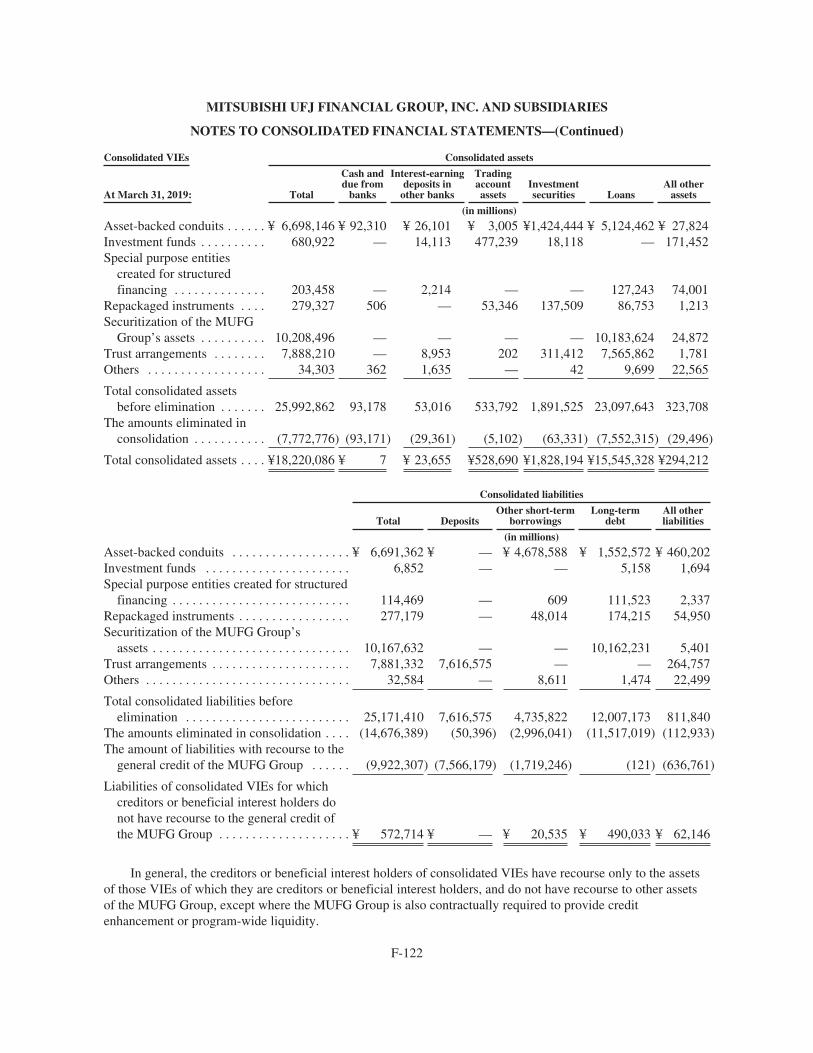
MITSUBISHI UFJ FINANCIAL GROUP, INC. AND SUBSIDIARIES
NOTES TO CONSOLIDATED FINANCIAL STATEMENTS—(Continued)
Consolidated VIEs Consolidated assets
At March 31, 2019: Total
Cash anddue from
banks
Interest-earningdeposits in
other banks
Tradingaccountassets
Investmentsecurities Loans
All otherassets
(in millions)
Asset-backed conduits . . . . . . ¥ 6,698,146 ¥ 92,310 ¥ 26,101 ¥ 3,005 ¥1,424,444 ¥ 5,124,462 ¥ 27,824Investment funds . . . . . . . . . . 680,922 — 14,113 477,239 18,118 — 171,452Special purpose entities
created for structuredfinancing . . . . . . . . . . . . . . 203,458 — 2,214 — — 127,243 74,001
Repackaged instruments . . . . 279,327 506 — 53,346 137,509 86,753 1,213Securitization of the MUFG
Group’s assets . . . . . . . . . . 10,208,496 — — — — 10,183,624 24,872Trust arrangements . . . . . . . . 7,888,210 — 8,953 202 311,412 7,565,862 1,781Others . . . . . . . . . . . . . . . . . . 34,303 362 1,635 — 42 9,699 22,565
Total consolidated assetsbefore elimination . . . . . . . 25,992,862 93,178 53,016 533,792 1,891,525 23,097,643 323,708
The amounts eliminated inconsolidation . . . . . . . . . . . (7,772,776) (93,171) (29,361) (5,102) (63,331) (7,552,315) (29,496)
Total consolidated assets . . . . ¥18,220,086 ¥ 7 ¥ 23,655 ¥528,690 ¥1,828,194 ¥15,545,328 ¥294,212
Consolidated liabilities
Total DepositsOther short-term
borrowingsLong-term
debtAll otherliabilities
(in millions)
Asset-backed conduits . . . . . . . . . . . . . . . . . . ¥ 6,691,362 ¥ — ¥ 4,678,588 ¥ 1,552,572 ¥ 460,202Investment funds . . . . . . . . . . . . . . . . . . . . . . 6,852 — — 5,158 1,694Special purpose entities created for structured
financing . . . . . . . . . . . . . . . . . . . . . . . . . . . 114,469 — 609 111,523 2,337Repackaged instruments . . . . . . . . . . . . . . . . . 277,179 — 48,014 174,215 54,950Securitization of the MUFG Group’s
assets . . . . . . . . . . . . . . . . . . . . . . . . . . . . . . 10,167,632 — — 10,162,231 5,401Trust arrangements . . . . . . . . . . . . . . . . . . . . . 7,881,332 7,616,575 — — 264,757Others . . . . . . . . . . . . . . . . . . . . . . . . . . . . . . . 32,584 — 8,611 1,474 22,499
Total consolidated liabilities beforeelimination . . . . . . . . . . . . . . . . . . . . . . . . . 25,171,410 7,616,575 4,735,822 12,007,173 811,840
The amounts eliminated in consolidation . . . . (14,676,389) (50,396) (2,996,041) (11,517,019) (112,933)The amount of liabilities with recourse to the
general credit of the MUFG Group . . . . . . (9,922,307) (7,566,179) (1,719,246) (121) (636,761)
Liabilities of consolidated VIEs for whichcreditors or beneficial interest holders donot have recourse to the general credit ofthe MUFG Group . . . . . . . . . . . . . . . . . . . . ¥ 572,714 ¥ — ¥ 20,535 ¥ 490,033 ¥ 62,146
In general, the creditors or beneficial interest holders of consolidated VIEs have recourse only to the assetsof those VIEs of which they are creditors or beneficial interest holders, and do not have recourse to other assetsof the MUFG Group, except where the MUFG Group is also contractually required to provide creditenhancement or program-wide liquidity.
F-122

MITSUBISHI UFJ FINANCIAL GROUP, INC. AND SUBSIDIARIES
NOTES TO CONSOLIDATED FINANCIAL STATEMENTS—(Continued)
The following tables present the total assets of non-consolidated VIEs, the maximum exposure to lossresulting from the MUFG Group’s involvement with non-consolidated VIEs and the assets and liabilities whichrelate to the MUFG’s variable interests in non-consolidated VIEs at March 31, 2018 and 2019:
Non-consolidated VIEs On-balance sheet assetsOn-balance sheet
liabilities
At March 31, 2018: Total assetsMaximumexposure Total
Tradingaccountassets
Investmentsecurities Loans
Allotherassets Total
All otherliabilities
(in millions)Asset-backed
conduits . . . . . . ¥ 29,011,749 ¥ 5,721,627 ¥ 4,645,697 ¥ 620 ¥1,541,591 ¥3,103,486 ¥ — ¥ — ¥ —Investment
funds . . . . . . . . 45,090,381 1,776,366 1,525,127 213,722 891,062 413,855 6,488 17,919 17,919Special purpose
entities createdfor structuredfinancing . . . . . 35,437,349 4,016,999 3,193,621 309,560 116,961 2,697,126 69,974 7,217 7,217
Repackagedinstruments . . . 10,212,933 2,576,619 2,487,377 759,591 1,421,716 236,852 69,218 — —
Others . . . . . . . . . 49,582,444 3,760,375 2,740,529 94,882 61,192 2,482,141 102,314 24,830 24,830
Total . . . . . . ¥169,334,856 ¥17,851,986 ¥14,592,351 ¥1,378,375 ¥4,032,522 ¥8,933,460 ¥247,994 ¥ 49,966 ¥ 49,966
Non-consolidated VIEs On-balance sheet assetsOn-balance sheet
liabilities
At March 31, 2019: Total assetsMaximumexposure Total
Tradingaccountassets
Investmentsecurities Loans
Allotherassets Total
All otherliabilities
(in millions)Asset-backed
conduits . . . . . . ¥29,621,609 ¥ 6,221,274 ¥ 4,982,357 ¥ 659 ¥1,704,553 ¥3,277,145 ¥ — ¥ — ¥ —Investment
funds . . . . . . . . 67,750,419 1,952,676 1,753,823 187,166 1,253,705 304,310 8,642 206 206Special purpose
entities createdfor structuredfinancing . . . . . 42,676,571 3,972,450 3,015,593 252,597 48,895 2,709,008 5,093 9,827 9,827
Repackagedinstruments . . . 12,885,367 3,477,545 3,383,161 690,305 2,169,798 478,252 44,806 6,087 6,087
Others . . . . . . . . . 60,074,743 3,482,153 2,454,807 123,595 65,451 2,145,665 120,096 57,567 57,567
Total . . . . . . ¥213,008,709 ¥19,106,098 ¥15,589,741 ¥1,254,322 ¥5,242,402 ¥8,914,380 ¥178,637 ¥73,687 ¥73,687
Maximum exposure to loss on each type of entity is determined based on the carrying amount of anyon-balance sheet assets and any off-balance sheet liabilities held, net of any recourse liabilities. Therefore, themaximum exposure to loss represents the maximum loss the MUFG Group could possibly incur at each balancesheet date and does not reflect the likelihood of such a loss being incurred. The difference between the amount ofon-balance sheet assets and the maximum exposure to loss primarily comprises the remaining undrawncommitments.
In February 2015, the FASB issued new guidance which amends the consolidation analysis under thecurrent consolidation guidance. The amendments change the VIE analysis for limited partnerships and similar
F-123

MITSUBISHI UFJ FINANCIAL GROUP, INC. AND SUBSIDIARIES
NOTES TO CONSOLIDATED FINANCIAL STATEMENTS—(Continued)
legal entities, the criteria for evaluating whether fees paid to a decision maker or a service provider are a variableinterest, the effect of fee arrangements and related parties on the primary beneficiary determination, and rescindthe indefinite deferral provision that affects the consolidation evaluation for certain investment funds. TheMUFG group adopted this new accounting guidance on April 1, 2016, which resulted in the consolidation anddeconsolidation of certain investment funds. The net increase in the MUFG Group’s consolidated assets,liabilities and Noncontrolling interests, were ¥628,236 million, ¥32,254 million and ¥595,982 million,respectively, as of April 1, 2016. The cumulative effect on retained earnings was a decrease of ¥3,873 millionupon the adoption.
Asset-Backed Conduits
This category primarily comprises the following:
Multi-Seller Conduits (MUFG-sponsored Asset-Backed Commercial Paper (“ABCP”) Conduits and OtherABCP Conduits)
The MUFG Group administers several conduits under asset-backed financing programs under which theconduits purchase financial assets, primarily trade accounts receivable, from the MUFG Group’s customers byissuing short-term financing instruments, primarily commercial paper, to third-party investors. Under the asset-backed financing programs, the MUFG Group acts as an agent for the conduits, which enter into agreements withthe MUFG Group’s customers where the customers transfer financial assets to the conduits in exchange formonetary consideration. The MUFG Group also underwrites commercial paper for the conduits that is secured bythe assets held by them and provides program-wide liquidity and credit enhancement facilities to the conduits.The MUFG Group receives fees related to the services it provides to the conduits and the program-wide liquidityand credit enhancement. The MUFG Group considers itself to be the primary beneficiary of the multi-sellerconduits because, as an agent and sponsor, the MUFG Group has the power to direct activities of the conduitsthat most significantly impact the conduits’ economic performance and also has the obligation to absorb losses ofthe conduits that could potentially be significant to the conduits through the program-wide liquidity and creditenhancement. Consequently, the MUFG Group consolidates the conduits.
In addition to the entities described above, the MUFG Group participates as a provider of financing toseveral conduits that are administered by third parties. Most of these conduits are established under a multi-sellerasset-backed financing program and the MUFG Group provides financing along with other financial institutions.With respect to these conduits, the MUFG Group is not considered as the primary beneficiary because theMUFG Group’s participation in the conduits is only to provide financing along with other third-party financialinstitutions and it does not have the power to direct the activities of the conduits. Consequently, theMUFG Group does not consolidate the conduits.
Asset-Backed Conduits (MUFG-sponsored Asset-Backed Loan (“ABL”) Programs and Other Programs)
The MUFG Group administers several conduits under asset-backed financing programs where the MUFGGroup provides financing to fund the conduits’ purchases of financial assets, comprising primarily trade accountsreceivable, from its customers. The MUFG Group acts as an agent and sponsor for the conduits, which enter intoagreements with the MUFG Group’s customers where the customers transfer assets to the conduits in exchangefor monetary consideration. In most cases, the MUFG Group is the sole provider of financing that is secured bythe assets held by the conduits. The MUFG Group considers itself to be the primary beneficiary of the conduitsbecause, as an agent and sponsor for the conduits, the MUFG Group has the power to direct activities of theconduits, such as selection of the assets to be purchased and condition for purchases, and debt collection from the
F-124

MITSUBISHI UFJ FINANCIAL GROUP, INC. AND SUBSIDIARIES
NOTES TO CONSOLIDATED FINANCIAL STATEMENTS—(Continued)
original obligors, that most significantly impact the conduits’ economic performance, and also has the obligationto absorb losses of the conduits that could potentially be significant to the conduits through financing it provides.Consequently, the MUFG Group consolidates the conduits.
In addition, the MUFG Group is involved with entities, which take in most cases the form of a trust, whereoriginators of financial assets, which primarily comprise lease receivables, entrust the assets with trust banks andreceive beneficial certificates of trusts in exchange. The originators then transfer the beneficiary certificates tothe MUFG Group in exchange for cash. The originators of the financial assets entrusted continue to be involvedin the assets as servicers. Because the originators are deemed to have the power to direct activities of the entitiesthat most significantly impact the entities’ economic performance through their role as a servicer, the MUFGGroup is not considered as the primary beneficiary of these entities. Consequently, the MUFG Group does notconsolidate these entities.
The MUFG Group also participates as a provider of financing to the ABL programs that are managed bythird parties. The MUFG Group is not considered as the primary beneficiary of the entities used in theseprograms as the MUFG Group’s participation in the entities is only to provide financing along with other thirdparties and it does not have the power to direct the activities of the entities. Consequently, the MUFG Group doesnot consolidate the entities used in these programs.
Investment Funds
This category primarily comprises the following:
Corporate Recovery Funds
These entities are established by fund managers, which are unrelated to the MUFG Group, for the purposeof investing in debt or equity instruments issued by distressed companies. After investment, the fund managerswork closely with the management of the entities and attempt to enhance corporate value by various meansincluding corporate restructuring and reorganization. Their exit strategies include, among others, sales to othersand initial public offerings.
Typically, these entities take the form of a limited partnership which is entirely funded by general andlimited partner interests. These partnerships are considered as VIEs unless the limited partners hold substantivekick-out rights or participating rights.
The MUFG Group mostly serves as a limited partner in corporate recovery funds that are considered asVIEs, and does not have the power to direct the activities of these funds that most significantly impact theeconomic performance of these funds. Therefore, the MUFG Group does not consider itself to be the primarybeneficiary of these funds and does not consolidate them.
Private Equity Funds
The MUFG Group is involved in venture capital funds that are established by either the MUFG Group’sentities or fund managers unrelated to the MUFG Group. These entities have specific investment objectives inconnection with their acquisition of equity interests, such as providing financing and other support to start-upbusinesses, medium and small entities in a particular geographical area, and to companies with certaintechnology or companies in a high-growth industry.
F-125
MITSUBISHI UFJ FINANCIAL GROUP, INC. AND SUBSIDIARIES
NOTES TO CONSOLIDATED FINANCIAL STATEMENTS—(Continued)
These entities typically take the form of a limited partnership and usually are entirely funded by general andlimited partner interests. These partnerships are considered as VIEs unless the limited partners hold substantivekick-out rights or participating rights.
The MUFG Group participates in these partnerships as a general partner or limited partner. The MUFGGroup consolidates these funds, which are considered as VIEs, if the MUFG Group has the power to direct theactivities of these funds that most significantly impact the economic performance of these funds, and also has theobligation to absorb losses of these funds that could potentially be significant to these funds or the right toreceive benefits from these funds that could potentially be significant to these funds.
Investment Trusts
The MUFG Group invests in investment trusts that are professionally managed collective investmentschemes which pool money from many investors and invest in, among others, equity and debt securities. Most ofthese funds take the form of a trust where there is a separation in investment decisions, which is assumed by aninvestment manager who has no investment in a trust, and ownership through beneficiary interests issued by atrust are owned by investors. Therefore, these investment trusts are considered as VIEs. The MUFG Groupconsolidates these funds if the MUFG Group has the power to direct the activities of these funds that mostsignificantly impact the economic performance of these funds, and also has the obligation to absorb losses ofthese funds that could potentially be significant to these funds or the right to receive benefits from these fundsthat could potentially be significant to these funds.
Buy-out Financing Vehicles
The MUFG Group provides financing to buy-out vehicles. The buy-out vehicles are established by equityinvestments from, among others, private equity funds or the management of target companies for the purpose ofpurchasing the equity shares of target companies. Along with other financial institutions, the MUFG Groupprovides financing to the buy-out vehicles in the form of loans. While the buy-out vehicles’ equity is normallysubstantive in its amount and the rights and obligations associated with it, in some cases, the vehicles have equitythat is insufficient to absorb expected variability primarily because the amount provided by equity investors isnominal in nature. These vehicles engage in non-investment activities, and are considered as VIEs. In most cases,the MUFG Group’s participation in these vehicles is only to provide financing to the vehicles, and the power todirect the activities that most significantly impact the economic performance of the vehicles is held by themanagement of target companies. As a result, the MUFG Group is not considered as the primary beneficiary ofthese vehicles and does not consolidate them.
Other Investment Funds
The MUFG Group’s investments in VIEs through MUFG Americas Holdings primarily consist of equityinvestments in low-income housing credit (“LIHC”) structures, designed to generate a return primarily throughthe realization of federal tax credits. MUFG Americas Holdings considers itself as the primary beneficiary ofcertain types of LIHC investments.
LIHC Unguaranteed Syndicated Investment Funds
MUFG Americas Holdings creates the investment funds, serves as the managing investor member, and sellslimited investor member interests to third parties. MUFG Americas Holdings receives benefits through incomefrom the structuring of these funds, servicing fees for managing the funds and, as an investor member, tax
F-126

MITSUBISHI UFJ FINANCIAL GROUP, INC. AND SUBSIDIARIES
NOTES TO CONSOLIDATED FINANCIAL STATEMENTS—(Continued)
benefits and tax credits to reduce the MUFG Americas Holdings tax liability. MUFG Americas Holdingsconsiders itself to be the primary beneficiary and consolidates them upon adoption of the current guidancebecause, as a sponsor and managing member of the funds, it has the power to direct activities that mostsignificantly impact the funds’ economic performance and also has the obligation to absorb losses of the fundsthat could potentially be significant to the funds.
LIHC Guaranteed Syndicated Investment Funds
MUFG Americas Holdings also forms limited liability companies, which in turn invest in LIHC operatingpartnerships, to create LIHC guaranteed syndicated investment funds. Interests in these funds are sold to thirdparties who pay a premium for a guaranteed return. MUFG Americas Holdings earns structuring fees from thesale of these funds and asset management fees. MUFG Americas Holdings serves as the funds’ sponsor andnon-member asset manager, and also guarantees a minimum rate of return throughout the investment term,therefore, it directs the activities that most significantly impact the funds’ economic performance and also has anobligation to absorb losses pertaining to its minimum rate of return guarantee to investors. Therefore, the MUFGGroup is considered as the primary beneficiary of these funds and consolidates them.
Special Purpose Entities Created for Structured Financing
This category primarily comprises the following:
Leasing Transaction Vehicles
These entities are established to raise funds to purchase or build equipment and machinery including, amongothers, commercial vessels, passenger and cargo aircraft, and production equipment for the purpose of leasingthem to lessees who use the equipment and machinery as part of their business operations. These entitiestypically take the form of a limited partnership or a special purpose company where they fund their purchases ofequipment and machinery via senior and subordinate financing. When entities take the form of a limitedpartnership, these entities are considered as VIEs unless limited partners hold substantive kick-out rights orparticipating rights. The entities considered as VIEs are typically funded only by senior financing or there is aguarantee provided to the senior financing by parties unrelated to those providing the senior financing. In mostcases, the MUFG Group participates in the senior financing and does not participate in the subordinate financingor provide guarantees. Generally, because the MUFG Group’s participation in these entities is only to providefinancing, it does not have the power to direct the activities of the entities that most significantly impact theeconomic performance of the entities. Therefore, the MUFG Group does not consider itself to be the primarybeneficiary of these entities and does not consolidate them, except for limited circumstances where the MUFGGroup is directly involved with the structuring of the transaction and has the power to direct the activities of theentities that most significantly impact the economic performance of the entities.
Project Financing Vehicles
These entities are established to raise funds in connection with, among others, production of naturalresources, construction and development of urban infrastructure (including power plants and grids, highways andports), and the development of real estate properties or complexes. These projects typically involve specialpurpose companies which issue senior and subordinate financing to raise funds in connection with the variousprojects. The subordinate financing is usually provided by parties that will ultimately make use of the assetsconstructed or developed. By contrast, the senior financing is typically provided by financial institutions,including the MUFG Group. Because the MUFG Group’s participation in these entities is only to provide
F-127

MITSUBISHI UFJ FINANCIAL GROUP, INC. AND SUBSIDIARIES
NOTES TO CONSOLIDATED FINANCIAL STATEMENTS—(Continued)
financing, it does not have the power to direct the activities that most significantly impact the economicperformance of these entities. Therefore, the MUFG Group is not considered as the primary beneficiary of theseentities and does not consolidate them.
Sale-and-Leaseback Vehicles
The MUFG Group is involved with vehicles that acquire assets, primarily real estate, from the MUFGGroup’s customers and other unrelated parties where the sellers of the assets continue to use the assets throughleaseback agreements. These vehicles typically take the form of a limited partnership, and are considered as VIEsunless the limited partners hold substantive kick-out rights or participating rights. The subordinated financing ofthese vehicles considered as VIEs is usually provided by the sellers of the assets, with the MUFG Groupproviding senior financing for the vehicles. Because the MUFG Group’s participation in these vehicles is only toprovide senior financing, it does not have the power to direct the activities that most significantly impact theeconomic performance of these vehicles. Therefore, the MUFG Group is not considered as the primarybeneficiary and does not consolidate them.
Securitization of Client Real Estate Properties
These entities are established for the purpose of securitizing real estate properties held by the MUFGGroup’s customers. In most cases, these entities take the form of a limited partnership or a special purposecompany. When entities take the form of a limited partnership, these entities are considered as VIEs unless thelimited partners hold substantive kick-out rights or participating rights. The entities considered as VIEs aretypically funded by senior and subordinated financing where the original owners of the real estate propertiesprovide the subordinated financing, primarily in the form of partnership interests or subordinated notes, andfinancial institutions, including the MUFG Group, provide senior financing in the form of senior loans. Becausethe MUFG Group’s participation in these vehicles is only to provide a portion of senior financing, it does nothave the power to direct the activities that most significantly impact the economic performance of these entities.Therefore, the MUFG Group is not considered as the primary beneficiary and does not consolidate these entities.
Repackaged Instruments
This category primarily comprises the following:
Investments in Financially-Engineered Products
The MUFG Group is involved in special purpose entities that have been established to issue financialproducts through the engineering and repackaging of existing financial instruments such as collateralized debtobligations (“CDOs”). These entities are considered as VIEs because the holders of the equity investment at riskdo not have the power to direct the activities that most significantly impact their economic performance. Theseentities are generally arranged and managed by parties that are not related to the MUFG Group. The MUFGGroup’s involvement with the entities arranged and managed by third parties is for investment purposes. In thesecases, the MUFG Group participates as one of many other investors and the MUFG Group typically holdsinvestments in senior tranches or tranches with high credit ratings. Therefore, the MUFG Group does not havethe power to direct activities of the entities that most significantly impact the entities’ economic performance,and thus is not considered as the primary beneficiary of these entities and does not consolidate these entities.
In certain instances, special purpose entities have been established and are managed by the MUFG Group.The MUFG Group’s involvement includes establishing and arranging the transaction and underwriting securities
F-128

MITSUBISHI UFJ FINANCIAL GROUP, INC. AND SUBSIDIARIES
NOTES TO CONSOLIDATED FINANCIAL STATEMENTS—(Continued)
issued by the entities to general investors. For these entities, the MUFG Group has the power to direct activitiesthat most significantly impact the economic performance and it has the obligation to absorb losses or receivebenefits that could potentially be significant to the entities. As such, the MUFG Group considers itself as theprimary beneficiary of these entities and consolidates them.
Investments in Securitized Financial Instruments
The MUFG Group holds investments in special purpose entities that issue securitized financial products.The assets held by the entities include credit card receivables and residential mortgage loans. These entities areestablished and managed by parties that are unrelated to the MUFG Group and the MUFG Group’s involvementwith these entities is for its own investment purposes. In all cases, the MUFG Group participates as one of manyother investors and the MUFG Group does not have the power to direct activities of the entities that mostsignificantly impact the entities’ economic performance. Therefore, the MUFG Group is not considered as theprimary beneficiary of these entities and does not consolidate them.
Securitization of the MUFG Group’s Assets
This category primarily comprises the following:
Securitization for issuing interests or financing
The MUFG Group establishes entities to securitize its own financial assets that include, among others,corporate and retail loans and lease receivables. The entities used for securitization, which typically take the formof a special purpose company or a trust, are established by the MUFG Group and, in most cases, issue senior andsubordinate interests or financing. After securitization, the MUFG Group typically continues to servicesecuritized assets as a servicer. The MUFG Group may also retain subordinate interests or financing or otherinterests. The MUFG Group is considered as the primary beneficiary and consolidates the entities used forsecuritization since it has the obligation to absorb losses through subordinate interests, and also has the power fordetermining and implementing policies as servicer that give it the ability to manage the entities’ assets thatbecome delinquent or are in default in order to improve the economic performance of the entities.
Eligible beneficiary interests in housing loan trusts
The MUFG Group establishes trusts, which acquire the MUFG Group’s housing loans and in turn issuebeneficiary interests to the MUFG Group, to pledge these beneficiary interests as collateral for borrowings fromthe Bank of Japan, as a result of the decision by the Bank of Japan on June 30, 2016 to accept these beneficialinterests as collateral in the same way as it does for Japanese national government bonds. The MUFG Group isconsidered as the primary beneficiary and consolidates the trusts since it has the obligation to absorb lossesthrough beneficiary interests, and also has the power for determining and implementing policies as servicer thatgive it the ability to manage housing loans owned by the trusts that become delinquent or are in default in orderto improve the economic performance of the trusts.
Trust Arrangements
The MUFG Group offers, primarily through Mitsubishi UFJ Trust and Banking, a variety of trust productsand services including securities investment trusts, pension trusts and trusts used as securitization vehicles. In atypical trust arrangement, however, the MUFG Group manages and administers assets on behalf of the customersin an agency, fiduciary and trust capacity and does not assume risks associated with the entrusted assets. The
F-129

MITSUBISHI UFJ FINANCIAL GROUP, INC. AND SUBSIDIARIES
NOTES TO CONSOLIDATED FINANCIAL STATEMENTS—(Continued)
trusts are generally considered as VIEs because the trust beneficiaries, who provide all of the equity at risk,usually do not have power to direct the activities that most significantly impact its economic performance in thearrangements. The MUFG Group, however, is not considered as the primary beneficiary, except for the casementioned below, because it merely receives fees for compensation for its services on terms that are customaryfor these activities and the fees are insignificant relative to the total amount of the trusts’ economic performanceand variability. Therefore, the MUFG Group does not consolidate these entities.
With respect to the jointly operated designated money in trusts, Mitsubishi UFJ Trust and Banking poolsmoney from investors and determines how best to invest it. In addition, certain investors, such as money reservefunds and investment funds, place excess funds in the jointly operated designated money trusts. Mitsubishi UFJTrust and Banking typically invests in high-quality financial assets, including government bonds, corporatebonds and corporate loans including loans to Mitsubishi UFJ Trust and Banking and receives fees ascompensation for services. In this role as a sponsor of these trusts’ Mitsubishi UFJ Trust and Banking providesguarantees under which it is required to compensate a loss on the stated principal of the trust beneficial interests.Mitsubishi UFJ Trust and Banking is considered as the primary beneficiary of these trusts’ because it is exposedto a potentially significant amount of losses and also has the power to direct activities of these trusts’ that mostsignificantly impact their economic performance. Upon consolidation of the trusts, the certificates issued to theinvestors are accounted for as deposit liabilities as the products are structured and marketed to customers similarto Mitsubishi UFJ Trust and Banking’s term deposit products.
Mitsubishi UFJ Trust and Banking considers the likelihood of incurring losses on the stated principalguarantee to be highly remote. In the trusts’ operational history that extends over decades, the stated principalguarantee has never been called upon. The variability in fair value of the net assets of the trusts has beenprimarily affected by the fluctuations in interest rates, and the majority of such variability has been absorbed byinvestors or trust beneficiaries.
Others
This category primarily comprises the following:
Financing Vehicles of the MUFG Group’s Customers
The MUFG Group is involved with several entities that are established by the MUFG Group’s customers.These entities borrow funds from financial institutions and extend loans to their group entities. These entitieseffectively work as fund-raising vehicles for their respective group entities and enable the groups to achieveefficient financing by integrating their financing activities into a single entity. In all cases, the MUFG Group isnot considered as the primary beneficiary because the MUFG Group’s participation in these entities is only toprovide financing, and the customers effectively hold the power to direct activities of these entities that mostsignificantly impact the economic performance of the entities. Consequently, the MUFG Group does notconsolidate these entities.
Funding Vehicles
The MUFG Group has established several wholly-owned off-shore vehicles which issue securities, typicallypreferred stock that is fully guaranteed by the MUFG Group, to investors unrelated to the MUFG Group to fundpurchases of debt instruments issued by the MUFG Group. These entities are considered as VIEs because theMUFG Group’s investment in the vehicles’ equity is not considered at risk and substantive as the entire amountraised by the vehicles was used to purchase debt instruments issued by the MUFG Group. Because the MUFGGroup does not have variable interests in these vehicles, the MUFG Group does not consolidate these entities.
F-130
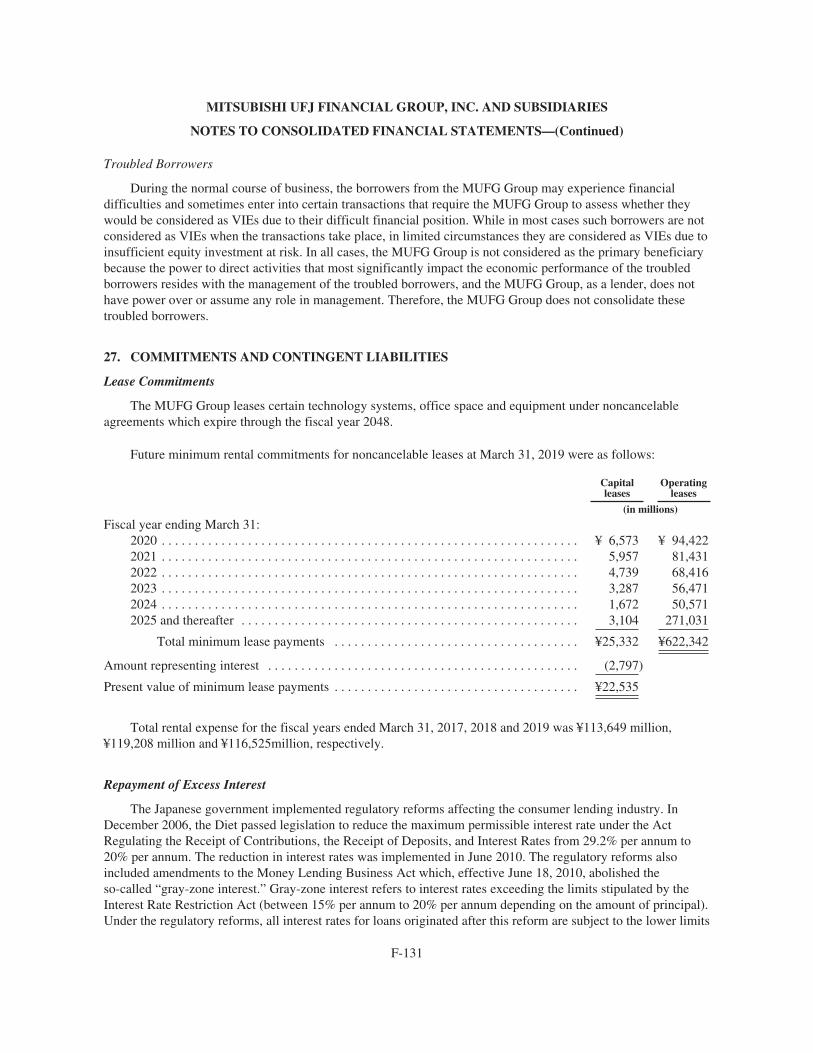
MITSUBISHI UFJ FINANCIAL GROUP, INC. AND SUBSIDIARIES
NOTES TO CONSOLIDATED FINANCIAL STATEMENTS—(Continued)
Troubled Borrowers
During the normal course of business, the borrowers from the MUFG Group may experience financialdifficulties and sometimes enter into certain transactions that require the MUFG Group to assess whether theywould be considered as VIEs due to their difficult financial position. While in most cases such borrowers are notconsidered as VIEs when the transactions take place, in limited circumstances they are considered as VIEs due toinsufficient equity investment at risk. In all cases, the MUFG Group is not considered as the primary beneficiarybecause the power to direct activities that most significantly impact the economic performance of the troubledborrowers resides with the management of the troubled borrowers, and the MUFG Group, as a lender, does nothave power over or assume any role in management. Therefore, the MUFG Group does not consolidate thesetroubled borrowers.
27. COMMITMENTS AND CONTINGENT LIABILITIES
Lease Commitments
The MUFG Group leases certain technology systems, office space and equipment under noncancelableagreements which expire through the fiscal year 2048.
Future minimum rental commitments for noncancelable leases at March 31, 2019 were as follows:
Capitalleases
Operatingleases
(in millions)
Fiscal year ending March 31:2020 . . . . . . . . . . . . . . . . . . . . . . . . . . . . . . . . . . . . . . . . . . . . . . . . . . . . . . . . . . . . . . . ¥ 6,573 ¥ 94,4222021 . . . . . . . . . . . . . . . . . . . . . . . . . . . . . . . . . . . . . . . . . . . . . . . . . . . . . . . . . . . . . . . 5,957 81,4312022 . . . . . . . . . . . . . . . . . . . . . . . . . . . . . . . . . . . . . . . . . . . . . . . . . . . . . . . . . . . . . . . 4,739 68,4162023 . . . . . . . . . . . . . . . . . . . . . . . . . . . . . . . . . . . . . . . . . . . . . . . . . . . . . . . . . . . . . . . 3,287 56,4712024 . . . . . . . . . . . . . . . . . . . . . . . . . . . . . . . . . . . . . . . . . . . . . . . . . . . . . . . . . . . . . . . 1,672 50,5712025 and thereafter . . . . . . . . . . . . . . . . . . . . . . . . . . . . . . . . . . . . . . . . . . . . . . . . . . . 3,104 271,031
Total minimum lease payments . . . . . . . . . . . . . . . . . . . . . . . . . . . . . . . . . . . . . ¥25,332 ¥622,342
Amount representing interest . . . . . . . . . . . . . . . . . . . . . . . . . . . . . . . . . . . . . . . . . . . . . . . (2,797)
Present value of minimum lease payments . . . . . . . . . . . . . . . . . . . . . . . . . . . . . . . . . . . . . ¥22,535
Total rental expense for the fiscal years ended March 31, 2017, 2018 and 2019 was ¥113,649 million,¥119,208 million and ¥116,525million, respectively.
Repayment of Excess Interest
The Japanese government implemented regulatory reforms affecting the consumer lending industry. InDecember 2006, the Diet passed legislation to reduce the maximum permissible interest rate under the ActRegulating the Receipt of Contributions, the Receipt of Deposits, and Interest Rates from 29.2% per annum to20% per annum. The reduction in interest rates was implemented in June 2010. The regulatory reforms alsoincluded amendments to the Money Lending Business Act which, effective June 18, 2010, abolished theso-called “gray-zone interest.” Gray-zone interest refers to interest rates exceeding the limits stipulated by theInterest Rate Restriction Act (between 15% per annum to 20% per annum depending on the amount of principal).Under the regulatory reforms, all interest rates for loans originated after this reform are subject to the lower limits
F-131
MITSUBISHI UFJ FINANCIAL GROUP, INC. AND SUBSIDIARIES
NOTES TO CONSOLIDATED FINANCIAL STATEMENTS—(Continued)
imposed by the Interest Rate Restriction Act. Furthermore, the new regulations require stringent reviewprocedures for consumer finance companies before lending, and with the exception of certain provisions, one ofthose new regulations introduces a limit on aggregate credit extensions to one-third of the borrower’s annualincome.
Formerly, consumer finance companies were able to charge interest rates exceeding the limits stipulated bythe Interest Rate Restriction Act so long as the payment was made voluntarily by the borrowers, and the lendercomplied with various notice and other requirements. Accordingly, MUFG’s consumer finance subsidiaries andequity method investees offered loans at interest rates above the Interest Rate Restriction Act. Upon theimplementation of the regulatory reforms in June 2010, they lowered the interest rates for loans originated afterthis reform to below the Interest Rate Restriction Act.
In 2006, the Supreme Court of Japan passed decisions in a manner more favorable to borrowers requiringreimbursement of previously paid interest exceeding the limits stipulated by the Interest Rate Restriction Act incertain circumstances. Borrowers’ claims for reimbursement of excess interest arose after such decisions andother regulatory changes. The MUFG Group maintains an allowance for repayment of excess interest based on ananalysis of past experience of reimbursement of excess interest, borrowers’ profile, recent trend of borrowers’claims for reimbursement, and management future forecasts. Management believes that the provision forrepayment of excess interest is adequate and the allowance is at the appropriate amount to absorb probablelosses, so that the impact of future claims for reimbursement of excess interest will not have a material adverseeffect on the MUFG Group’s financial position and results of operations. The allowance for repayment of excessinterest established by MUFG’s consumer finance subsidiaries, which was included in Other liabilities, was¥23,724 million and ¥24,983 million as of March 31, 2018 and 2019, respectively. Provision (reversal) related tothe allowance is included in Other non-interest expenses in the accompanying consolidated statements of income.For the fiscal years ended March 31, 2017, 2018 and 2019, there was a negative impact of ¥56,911 million, niland ¥15,632 million, respectively, on Equity in earnings of equity method investees—net in the accompanyingconsolidated statements of income.
Litigation
In the ordinary course of business, the MUFG Group is subject to various litigation and regulatory matters.In accordance with applicable accounting guidance, the MUFG Group establishes an accrued liability for losscontingencies arising from litigation and regulatory matters when they are determined to be probable in theiroccurrence and the probable loss amount can be reasonably estimated. Based upon current knowledge andconsultation with counsel, management believes the eventual outcome of such litigation and regulatory matters,where losses are probable and the probable loss amounts can be reasonably estimated, would not have a materialadverse effect on the MUFG Group’s financial position, results of operations or cash flows. Additionally,management believes the amount of loss that is reasonably possible, but not probable, from various litigation andregulatory matters is not material to the MUFG Group’s financial position, results of operations or cash flows.
F-132

MITSUBISHI UFJ FINANCIAL GROUP, INC. AND SUBSIDIARIES
NOTES TO CONSOLIDATED FINANCIAL STATEMENTS—(Continued)
28. FEES AND COMMISSIONS INCOME
Disaggregation of Contract Revenue
Details of fees and commissions income for the fiscal years ended March 31, 2017, 2018 and 2019 were asfollows:
2017 2018 2019
(in millions)
Fees and commissions on deposits . . . . . . . . . . . . . . . . . . . . . . . . . . . . ¥ 53,891 ¥ 53,483 ¥ 52,624Fees and commissions on remittances and transfers . . . . . . . . . . . . . . 168,571 169,300 168,756Fees and commissions on foreign trading business . . . . . . . . . . . . . . . 75,024 78,239 73,176Fees and commissions on credit card business . . . . . . . . . . . . . . . . . . 198,145 212,515 225,877Fees and commissions on security-related services . . . . . . . . . . . . . . . 239,516 258,728 233,448Fees and commissions on administration and management services
for investment funds . . . . . . . . . . . . . . . . . . . . . . . . . . . . . . . . . . . . . 155,708 159,481 147,597Trust fees . . . . . . . . . . . . . . . . . . . . . . . . . . . . . . . . . . . . . . . . . . . . . . . 103,110 112,399 115,002Guarantee fees(1) . . . . . . . . . . . . . . . . . . . . . . . . . . . . . . . . . . . . . . . . . . 41,818 44,160 44,962Insurance commissions . . . . . . . . . . . . . . . . . . . . . . . . . . . . . . . . . . . . . 59,853 49,223 46,918Fees and commissions on real estate business . . . . . . . . . . . . . . . . . . . 39,808 40,573 45,160Other fees and commissions(2) . . . . . . . . . . . . . . . . . . . . . . . . . . . . . . . 279,449 284,691 285,058
Total . . . . . . . . . . . . . . . . . . . . . . . . . . . . . . . . . . . . . . . . . . . . . . . ¥1,414,893 ¥1,462,792 ¥1,438,578
Notes:(1) Guarantee fees are not within the scope of the guidance on revenue from contracts with customers.(2) Other fees and commissions include non-refundable financing related fees that are not within the scope of the guidance on revenue from
contracts with customers.
The following is an explanation of the relationship with revenue information disclosed for each reportablesegment.
These revenues from contracts with customers are related to various reportable segments disclosed inNote 30. The business segment information is derived from the internal management reporting system used bymanagement to measure the performance of the MUFG Group’s business segments. In addition, the businesssegment information is primarily based on the financial information prepared in accordance with accountingprinciples generally accepted in Japan as adjusted in accordance with internal management accounting rules andpractices. Further, the format and information as disclosed in Note 30 are not consistent with the accompanyingconsolidated financial statements prepared on the basis of U.S. GAAP. For example, management does not useinformation on segments’ gross revenue to allocate resources and assess performance.
The majority of fees and commissions on deposits are from the business activities relevant to Retail &Commercial Banking Business Group (“R&C”), with Global Commercial Banking Group (“GCB”) providing asmaller impact.
The business activities relevant to fees and commissions on remittances and transfers are attributable toR&C, Japanese Corporate Investment Banking Group (“JCIB”), Global Corporate Investment Banking Group(“GCIB”), and GCB with no significant concentration in any particular segments.
The business activities relevant to fees and commissions on foreign trading business are attributable toR&C, JCIB, GCIB, and GCB with no significant concentration in any particular segments.
F-133
MITSUBISHI UFJ FINANCIAL GROUP, INC. AND SUBSIDIARIES
NOTES TO CONSOLIDATED FINANCIAL STATEMENTS—(Continued)
The business activities relevant to fees and commissions on credit card business are substantiallyattributable to R&C.
The majority of fees and commissions on security-related services are from the business activities relevantto R&C, with JCIB and GCIB providing a smaller impact.
The business activities relevant to fees and commissions on administration and management services forinvestment funds are substantially attributable to Asset Management & Investor Service Business Group(“AM/IS”).
The business activities relevant to trust fees are attributable to R&C, JCIB, and AM/IS with no significantconcentration in any particular segments.
The majority of insurance commissions are from the business activities relevant to R&C, with GCBproviding a smaller impact.
The business activities relevant to fees and commissions on real estate business are attributable to R&C andJCIB with no significant concentration in any particular segments.
Contract Balances
Contract balances are recognized in the consolidated balance sheets in accordance with the definition ofreceivables and contract liabilities specified in the guidance on revenue from contracts with customers.Receivables include receivables for which the services are completed, and accrued income which represents theamount of consideration unpaid for the performance obligations that have been fulfilled pursuant to certaincontracts under which the services are continuously provided. Contract liabilities include unearned revenuewhich represents the amount of consideration received for the performance obligations that have not beenfulfilled pursuant to certain contracts under which the services are continuously provided.
As of March 31, 2019, receivables from contracts with customers of ¥185 billion were included primarily inOther assets, and contract liabilities of ¥8 billion were included in Other liabilities.
29. TRADING ACCOUNT PROFITS AND LOSSES
The MUFG Group performs trading activities through market-making, sales and arbitrage, whilemaintaining risk levels within appropriate limits in accordance with its risk management policy.
The MUFG Group has trading account securities and trading derivative assets and liabilities for thispurpose. In addition, the trading account securities include foreign currency-denominated debt securities such asforeign government or official institution bonds, corporate bonds and mortgage-backed securities, which aremainly comprised of securities measured at fair value under the fair value option.
F-134

MITSUBISHI UFJ FINANCIAL GROUP, INC. AND SUBSIDIARIES
NOTES TO CONSOLIDATED FINANCIAL STATEMENTS—(Continued)
Net trading gains (losses) for the fiscal years ended March 31, 2017, 2018 and 2019 were comprised of thefollowing:
2017 2018 2019
(in millions)
Interest rate and other derivative contracts . . . . . . . . . . . . . . . . . . . . . . . . . . ¥(325,007) ¥(226,788) ¥ (24,031)Trading account securities, excluding derivatives . . . . . . . . . . . . . . . . . . . . . (314,177) 153,674 192,931
Trading account profits (losses)—net . . . . . . . . . . . . . . . . . . . . . . . . . . . . . . (639,184) (73,114) 168,900Foreign exchange derivative contracts(1) . . . . . . . . . . . . . . . . . . . . . . . . . . . . (183,159) (159,986) (354,401)
Net trading losses . . . . . . . . . . . . . . . . . . . . . . . . . . . . . . . . . . . . . . . . . . . . . . ¥(822,343) ¥(233,100) ¥(185,501)
Note:(1) Losses on foreign exchange derivative contracts are included in Foreign exchange losses—net in the accompanying consolidated
statements of income. Foreign exchange losses—net in the accompanying consolidated statements of income are also comprised offoreign exchange gains other than derivative contracts and foreign exchange losses related to the fair value option.
For further information on the methodologies and assumptions used to estimate fair value, see Note 32,which also shows fair values of trading account securities by major category. Note 24 discloses furtherinformation regarding the derivative-related impact on Trading account profits (losses)—net by major category.
30. BUSINESS SEGMENTS
The reportable segments of the MUFG Group are subject to the periodical review by the ExecutiveCommittee, which represents the MUFG Group’s chief operating decision maker, to determine the allocation ofmanagement resources and assess performance. The MUFG Group has established its business units according tothe characteristics of customers and the nature of the underlying business. Each business unit engages in businessactivities based on comprehensive strategies developed for and aimed at respective targeted customers andbusinesses. The business segment information is primarily based on the financial information prepared inaccordance with accounting principles generally accepted in Japan as adjusted in accordance with internalmanagement accounting rules and practices. Accordingly, the format and information are not consistent with theaccompanying consolidated financial statements prepared on the basis of U.S. GAAP. A reconciliation isprovided for the total amounts of segments’ operating profit with income before income tax expense underU.S. GAAP.
See Note 31 for financial information relating to the MUFG Group’s operations by geographic area. Thegeographic financial information is consistent with the basis of the accompanying consolidated financialstatements.
Effective April 1, 2018, the MUFG Group reorganized its business groups in an effort to further integratethe expertise and capabilities of its consolidated subsidiaries to respond to the needs of customers moreeffectively and efficiently, as part of its current medium-term business plan. To make and execute unified group-wide strategies based on customer characteristics and the nature of business, the MUFG Group integrated theoperations of its consolidated subsidiaries into six business segments.—Retail & Commercial Banking, JapaneseCorporate & Investment Banking, Global Corporate & Investment Banking, Global Commercial Banking, AssetManagement & Investor Services, and Global Markets.
The following is a brief explanation of the MUFG Group’s business segments:
Retail & Commercial Banking Business Group—Covers the domestic retail and commercial bankingbusinesses of MUFG Bank, Mitsubishi UFJ Trust and Banking, Mitsubishi UFJ Securities Holdings, Mitsubishi
F-135
MITSUBISHI UFJ FINANCIAL GROUP, INC. AND SUBSIDIARIES
NOTES TO CONSOLIDATED FINANCIAL STATEMENTS—(Continued)
UFJ NICOS and other group companies of MUFG. This business group offers retail and small and medium-sizedenterprise customers in Japan an extensive array of commercial banking, trust banking and securities productsand services.
Japanese Corporate & Investment Banking Business Group—Covers the large Japanese corporatebusinesses of MUFG Bank, Mitsubishi UFJ Trust and Banking and Mitsubishi UFJ Securities Holdings,including the transaction banking, investment banking, trust banking and securities businesses. This businessgroup offers large Japanese corporations advanced financial solutions designed to respond to their diversified andglobalized needs and to contribute to their business and financial strategies through the global network of theMUFG group companies.
Global Corporate & Investment Banking Business Group—Covers the global corporate, investment andtransaction banking businesses of MUFG Bank and Mitsubishi UFJ Securities Holdings. Through a globalnetwork of offices and branches, this business group provides non-Japanese large corporate and financialinstitution customers with a comprehensive set of solutions that meet their increasingly diverse and sophisticatedfinancing needs.
Global Commercial Banking Business Group—Covers the retail and commercial banking businesses ofMUFG Union Bank and Krungsri. This business group offers a comprehensive array of financial products andservices such as loans, deposits, fund transfers, investments and asset management services for local retail, smalland medium-sized enterprise, and corporate customers across the Asia-Pacific region.
Asset Management & Investor Services Business Group—Covers the asset management and assetadministration businesses of Mitsubishi UFJ Trust and Banking and MUFG Bank. By integrating the trustbanking expertise of Mitsubishi UFJ Trust and Banking and the global strengths of MUFG Bank, the businessgroup offers a full range of asset management and administration services for corporations and pension funds,including pension fund management and administration, advice on pension structures, and payments tobeneficiaries, and also offer investment trusts for retail customers.
Global Markets Business Group—Covers the customer business and the treasury operations of MUFGBank, Mitsubishi UFJ Trust and Banking and Mitsubishi UFJ Securities Holdings. The customer businessincludes sales and trading in fixed income instruments, currencies and equities as well as other investmentproducts, and origination and distribution of financial products. The treasury operations include asset and liabilitymanagement as well as global investments for the MUFG Group.
Other—Consists mainly of the corporate centers of MUFG, MUFG Bank, Mitsubishi UFJ Trust andBanking and Mitsubishi UFJ Morgan Stanley Securities. The elimination of duplicated amounts of net revenuesamong business segments was also reflected in Other.
Management does not use information on segments’ total assets to allocate resources and assessperformance. Accordingly, business segment information on total assets is not presented.
F-136

MITSUBISHI UFJ FINANCIAL GROUP, INC. AND SUBSIDIARIES
NOTES TO CONSOLIDATED FINANCIAL STATEMENTS—(Continued)
Prior period business segment information has been restated to enable comparison between the relevantamounts for the fiscal years ended March 31, 2017, 2018 and 2019.
Customer Business
GlobalMarketsBusinessGroup Other Total(1)
Retail &Commercial
BankingBusinessGroup
JapaneseCorporate &Investment
BankingBusinessGroup
GlobalCorporate &Investment
BankingBusinessGroup
GlobalCommercial
BankingBusinessGroup
AssetManagement& Investor
ServicesBusinessGroup Total
(in billions)Fiscal year ended
March 31, 2017:Net revenue: . . . . . . . . . . . ¥1,568.0 ¥527.1 ¥418.3 ¥628.6 ¥176.7 ¥3,318.7 ¥686.8 ¥ 56.3 ¥4,061.8
BK and TB(2): . . . . . . 817.0 446.9 275.6 (1.8) 72.7 1,610.4 491.5 88.6 2,190.5Net interest
income . . . . . 482.0 143.8 107.3 (1.7) — 731.4 291.0 199.4 1,221.8Net fees . . . . . . 300.6 245.0 177.3 — 72.7 795.6 (8.2) (98.8) 688.6Other . . . . . . . . 34.4 58.1 (9.0) (0.1) — 83.4 208.7 (12.0) 280.1
Other than BKand TB . . . . . . . . . 751.0 80.2 142.7 630.4 104.0 1,708.3 195.3 (32.3) 1,871.3
Operating expenses . . . . . 1,234.1 290.0 236.0 435.8 114.7 2,310.6 217.4 162.3 2,690.3
Operating profit (loss) . . . ¥ 333.9 ¥237.1 ¥182.3 ¥192.8 ¥ 62.0 ¥1,008.1 ¥469.4 ¥(106.0) ¥1,371.5
Fiscal year endedMarch 31, 2018:
Net revenue: . . . . . . . . . . . ¥1,584.3 ¥522.6 ¥378.6 ¥666.3 ¥190.4 ¥3,342.2 ¥565.2 ¥ 10.7 ¥3,918.1BK and TB(2): . . . . . . 785.9 439.8 246.3 (3.5) 83.8 1,552.3 368.6 109.0 2,029.9
Net interestincome . . . . . 465.8 150.7 95.2 (3.4) — 708.3 182.0 229.4 1,119.7
Net fees . . . . . . 288.4 233.2 153.1 — 83.8 758.5 (12.2) (79.1) 667.2Other . . . . . . . . 31.7 55.9 (2.0) (0.1) — 85.5 198.8 (41.3) 243.0
Other than BKand TB . . . . . . . . . 798.4 82.8 132.3 669.8 106.6 1,789.9 196.6 (98.3) 1,888.2
Operating expenses . . . . . 1,227.6 295.6 242.8 463.6 119.4 2,349.0 225.7 142.8 2,717.5
Operating profit (loss) . . . ¥ 356.7 ¥227.0 ¥135.8 ¥202.7 ¥ 71.0 ¥ 993.2 ¥339.5 ¥(132.1) ¥1,200.6
Fiscal year endedMarch 31, 2019:
Net revenue: . . . . . . . . . . . ¥1,521.6 ¥541.5 ¥399.7 ¥706.9 ¥203.0 ¥3,372.7 ¥472.5 ¥ (32.8) ¥3,812.4BK and TB(2): . . . . . . 738.6 421.6 266.6 (1.4) 93.2 1,518.6 303.9 38.5 1,861.0
Net interestincome . . . . . 460.4 152.1 113.6 (1.4) — 724.7 183.1 237.4 1,145.2
Net fees . . . . . . 243.9 213.1 152.4 — 93.2 702.6 (14.2) (67.5) 620.9Other . . . . . . . . 34.3 56.4 0.6 — — 91.3 135.0 (131.4) 94.9
Other than BKand TB . . . . . . . . . 783.0 119.9 133.1 708.3 109.8 1,854.1 168.6 (71.3) 1,951.4
Operating expenses . . . . . 1,222.8 291.8 247.0 486.5 124.6 2,372.7 221.3 146.1 2,740.1
Operating profit (loss) . . . ¥ 298.8 ¥249.7 ¥152.7 ¥220.4 ¥ 78.4 ¥1,000.0 ¥251.2 ¥(178.9) ¥1,072.3
Notes:(1) Prior period business segment information has been restated to reflect the transfer of corporate loan-related businesses of Mitsubishi UFJ
Trust and Banking to MUFG Bank. In accordance with internal management accounting rules and practices, the transfer resulted in adecrease of the total operating profit by ¥24.3 billion and ¥23.5 billion for fiscal years ended March 31, 2017 and 2018, respectively.
(2) “BK and TB” is a sum of MUFG Bank on a stand-alone basis and Mitsubishi UFJ Trust and Banking on a stand-alone basis.
F-137
MITSUBISHI UFJ FINANCIAL GROUP, INC. AND SUBSIDIARIES
NOTES TO CONSOLIDATED FINANCIAL STATEMENTS—(Continued)
Reconciliation
As set forth above, the measurement basis and the income and expense items of the internal managementreporting system are different from the accompanying consolidated statements of income. Therefore, it isimpracticable to present reconciliations of all of the business segments’ information, other than operating profit,to corresponding items in the accompanying consolidated statements of income.
A reconciliation of operating profit under the internal management reporting system for the fiscal yearsended March 31, 2017, 2018 and 2019 above to income before income tax expense shown in the accompanyingconsolidated statements of income is as follows:
2017 2018 2019
(in billions)
Operating profit: . . . . . . . . . . . . . . . . . . . . . . . . . . . . . . . . . . . . . . . . . . . . . . . . . . . . . . . ¥1,372 ¥1,201 ¥1,072Reversal of (provision for) credit losses . . . . . . . . . . . . . . . . . . . . . . . . . . . . . . . . (254) 241 (34)Trading account profits (losses)—net . . . . . . . . . . . . . . . . . . . . . . . . . . . . . . . . . . (880) (287) 182Equity investment securities gains (losses)—net . . . . . . . . . . . . . . . . . . . . . . . . . . 181 215 (305)Debt investment securities gains (losses)—net . . . . . . . . . . . . . . . . . . . . . . . . . . . 48 71 (3)Foreign exchange gains (losses)—net . . . . . . . . . . . . . . . . . . . . . . . . . . . . . . . . . . (110) 7 47Equity in earnings of equity method investees—net . . . . . . . . . . . . . . . . . . . . . . . 198 228 210Impairment of goodwill . . . . . . . . . . . . . . . . . . . . . . . . . . . . . . . . . . . . . . . . . . . . . (7) — —Impairment of intangible assets . . . . . . . . . . . . . . . . . . . . . . . . . . . . . . . . . . . . . . . (6) (22) (118)Reversal of (provision for) off-balance sheet credit instruments . . . . . . . . . . . . . . (107) 96 (38)Other—net . . . . . . . . . . . . . . . . . . . . . . . . . . . . . . . . . . . . . . . . . . . . . . . . . . . . . . . (162) (88) (142)
Income before income tax expense . . . . . . . . . . . . . . . . . . . . . . . . . . . . . . . . . . . . . . . . ¥ 273 ¥1,662 ¥ 871
31. FOREIGN ACTIVITIES
Foreign operations include the business conducted by overseas offices, as well as international businessconducted from domestic offices, principally several international banking-related divisions of MUFG Bank’sand Mitsubishi UFJ Trust and Banking’s head office in Tokyo, and involve various transactions with debtors andcustomers residing outside Japan. Close integration of the MUFG Group’s foreign and domestic activities makesprecise estimates of the amounts of assets, liabilities, income and expenses attributable to foreign operationsdifficult and necessarily subjective. Assets, income and expenses attributable to foreign operations are allocatedto geographical areas based on the domicile of the debtors and customers.
F-138
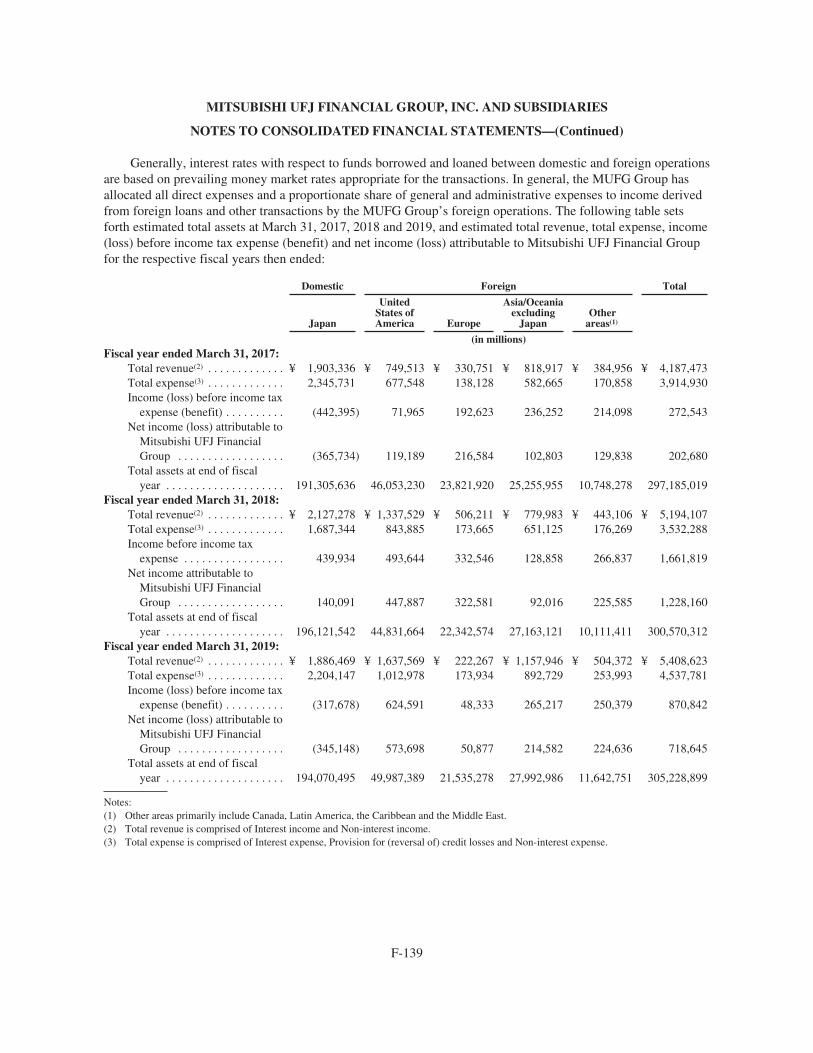
MITSUBISHI UFJ FINANCIAL GROUP, INC. AND SUBSIDIARIES
NOTES TO CONSOLIDATED FINANCIAL STATEMENTS—(Continued)
Generally, interest rates with respect to funds borrowed and loaned between domestic and foreign operationsare based on prevailing money market rates appropriate for the transactions. In general, the MUFG Group hasallocated all direct expenses and a proportionate share of general and administrative expenses to income derivedfrom foreign loans and other transactions by the MUFG Group’s foreign operations. The following table setsforth estimated total assets at March 31, 2017, 2018 and 2019, and estimated total revenue, total expense, income(loss) before income tax expense (benefit) and net income (loss) attributable to Mitsubishi UFJ Financial Groupfor the respective fiscal years then ended:
Domestic Foreign Total
Japan
UnitedStates ofAmerica Europe
Asia/Oceaniaexcluding
JapanOther
areas(1)
(in millions)Fiscal year ended March 31, 2017:
Total revenue(2) . . . . . . . . . . . . . ¥ 1,903,336 ¥ 749,513 ¥ 330,751 ¥ 818,917 ¥ 384,956 ¥ 4,187,473Total expense(3) . . . . . . . . . . . . . 2,345,731 677,548 138,128 582,665 170,858 3,914,930Income (loss) before income tax
expense (benefit) . . . . . . . . . . (442,395) 71,965 192,623 236,252 214,098 272,543Net income (loss) attributable to
Mitsubishi UFJ FinancialGroup . . . . . . . . . . . . . . . . . . (365,734) 119,189 216,584 102,803 129,838 202,680
Total assets at end of fiscalyear . . . . . . . . . . . . . . . . . . . . 191,305,636 46,053,230 23,821,920 25,255,955 10,748,278 297,185,019
Fiscal year ended March 31, 2018:Total revenue(2) . . . . . . . . . . . . . ¥ 2,127,278 ¥ 1,337,529 ¥ 506,211 ¥ 779,983 ¥ 443,106 ¥ 5,194,107Total expense(3) . . . . . . . . . . . . . 1,687,344 843,885 173,665 651,125 176,269 3,532,288Income before income tax
expense . . . . . . . . . . . . . . . . . 439,934 493,644 332,546 128,858 266,837 1,661,819Net income attributable to
Mitsubishi UFJ FinancialGroup . . . . . . . . . . . . . . . . . . 140,091 447,887 322,581 92,016 225,585 1,228,160
Total assets at end of fiscalyear . . . . . . . . . . . . . . . . . . . . 196,121,542 44,831,664 22,342,574 27,163,121 10,111,411 300,570,312
Fiscal year ended March 31, 2019:Total revenue(2) . . . . . . . . . . . . . ¥ 1,886,469 ¥ 1,637,569 ¥ 222,267 ¥ 1,157,946 ¥ 504,372 ¥ 5,408,623Total expense(3) . . . . . . . . . . . . . 2,204,147 1,012,978 173,934 892,729 253,993 4,537,781Income (loss) before income tax
expense (benefit) . . . . . . . . . . (317,678) 624,591 48,333 265,217 250,379 870,842Net income (loss) attributable to
Mitsubishi UFJ FinancialGroup . . . . . . . . . . . . . . . . . . (345,148) 573,698 50,877 214,582 224,636 718,645
Total assets at end of fiscalyear . . . . . . . . . . . . . . . . . . . . 194,070,495 49,987,389 21,535,278 27,992,986 11,642,751 305,228,899
Notes:(1) Other areas primarily include Canada, Latin America, the Caribbean and the Middle East.(2) Total revenue is comprised of Interest income and Non-interest income.(3) Total expense is comprised of Interest expense, Provision for (reversal of) credit losses and Non-interest expense.
F-139

MITSUBISHI UFJ FINANCIAL GROUP, INC. AND SUBSIDIARIES
NOTES TO CONSOLIDATED FINANCIAL STATEMENTS—(Continued)
The following is an analysis of certain asset and liability accounts related to foreign activities at March 31,2018 and 2019:
2018 2019
(in millions)
Cash and due from banks . . . . . . . . . . . . . . . . . . . . . . . . . . . . . . . . . . . . . . . . . . . . . . ¥ 1,816,704 ¥ 828,839Interest-earning deposits in other banks . . . . . . . . . . . . . . . . . . . . . . . . . . . . . . . . . . . 8,560,283 8,453,191
Total . . . . . . . . . . . . . . . . . . . . . . . . . . . . . . . . . . . . . . . . . . . . . . . . . . . . . . ¥10,376,987 ¥ 9,282,030
Trading account assets . . . . . . . . . . . . . . . . . . . . . . . . . . . . . . . . . . . . . . . . . . . . . . . . ¥23,904,678 ¥26,991,984
Investment securities . . . . . . . . . . . . . . . . . . . . . . . . . . . . . . . . . . . . . . . . . . . . . . . . . . ¥ 7,692,969 ¥ 8,779,340
Loans—net of unearned income, unamortized premiums and deferred loan fees . . . ¥51,339,696 ¥51,678,674
Deposits . . . . . . . . . . . . . . . . . . . . . . . . . . . . . . . . . . . . . . . . . . . . . . . . . . . . . . . . . . . . ¥45,818,648 ¥49,044,234
Funds borrowed:Call money, funds purchased . . . . . . . . . . . . . . . . . . . . . . . . . . . . . . . . . . . . . . . ¥ 355,666 ¥ 67,246Payables under repurchase agreements . . . . . . . . . . . . . . . . . . . . . . . . . . . . . . . . 8,181,347 9,459,547Payables under securities lending transactions . . . . . . . . . . . . . . . . . . . . . . . . . . 276,563 47,886Other short-term borrowings . . . . . . . . . . . . . . . . . . . . . . . . . . . . . . . . . . . . . . . . 5,152,667 5,107,832Long-term debt . . . . . . . . . . . . . . . . . . . . . . . . . . . . . . . . . . . . . . . . . . . . . . . . . . 2,223,246 2,697,463
Total . . . . . . . . . . . . . . . . . . . . . . . . . . . . . . . . . . . . . . . . . . . . . . . . . . . . . . ¥16,189,489 ¥17,379,974
Trading account liabilities . . . . . . . . . . . . . . . . . . . . . . . . . . . . . . . . . . . . . . . . . . . . . . ¥ 4,251,049 ¥ 3,897,844
32. FAIR VALUE
Fair value is defined as the price that would be received to sell an asset or paid to transfer a liability in anorderly transaction between market participants at the measurement date. The guidance on fair valuemeasurements also specifies a fair value hierarchy that prioritizes the inputs to valuation techniques used tomeasure fair value into three broad levels. The fair value hierarchy gives the highest priority to quoted prices inactive markets and the lowest priority to unobservable inputs, for example, the reporting entity’s own data. Basedon the observability of the inputs used in the valuation techniques, the following three-level hierarchy is specifiedby the guidance:
‰ Level 1—Unadjusted quoted prices for identical instruments in active markets.
‰ Level 2—Observable inputs other than Level 1 prices for substantially the full term of the instruments,such as quoted prices for similar instruments in active markets; quoted prices for identical or similarinstruments in markets that are not active; other inputs that are observable; or market-corroboratedinputs.
‰ Level 3—Unobservable inputs that are supported by little or no market activity and that are significantto the fair value of the instruments.
A financial instrument’s categorization within the fair value hierarchy is based upon the lowest level ofinput that is significant to the fair value measurement.
The MUFG Group has an established and documented process for determining fair values in accordancewith the guidance. When available, quoted prices are used to determine fair value. If quoted prices are not
F-140

MITSUBISHI UFJ FINANCIAL GROUP, INC. AND SUBSIDIARIES
NOTES TO CONSOLIDATED FINANCIAL STATEMENTS—(Continued)
available, fair value is based upon valuation techniques that use observable or unobservable inputs. The fairvalues of liabilities are determined by discounting future cash flows at a rate which incorporates the MUFGGroup’s own creditworthiness. In addition, valuation adjustments may be made to ensure the financialinstruments are recorded at fair value. These adjustments include, but are not limited to, amounts that reflectcounterparty credit quality, funding cost, liquidity risk and model risk.
The following section describes the valuation techniques used by the MUFG Group to measure fair valuesof certain financial instruments. The discussion includes the general classification of such financial instrumentsin accordance with the fair value hierarchy, a brief explanation of the valuation techniques, the significant inputsto those valuation techniques, and any additional significant assumptions.
Trading Account Assets and Liabilities—Trading Account Securities
When quoted prices are available in an active market, the MUFG Group uses quoted prices to measure thefair values of securities and such securities are classified in Level 1 of the fair value hierarchy. Examples ofLevel 1 securities include certain Japanese and foreign government bonds, and marketable equity securities.
When quoted prices are available but the securities are not traded in active markets, such securities areclassified in Level 2 of the fair value hierarchy. These securities include certain Japanese government agencybonds, Japanese prefectural and municipal bonds, foreign government and official institution bonds, corporatebonds, residential mortgage-backed securities and equity securities.
As for quoted prices provided by third-party vendors, independent price verification is performed by theMUFG group to determine the quality and reliability of the data for fair value measurement purposes. As part ofits independent price verification procedures, the MUFG group obtains a sufficient understanding of the vendors’pricing sources and valuation processes. Further, the MUFG group performs internal price verificationprocedures to ensure that the quoted prices provided from the third-party vendors are reasonable. Suchverification procedures include comparison of pricing sources and analysis of variances beyond certainthresholds.
When quoted prices are not available, the MUFG Group estimates fair values by using an internal model,quoted prices of securities with similar characteristics or non-binding prices obtained from independent thirdparties. Such securities include certain commercial paper, corporate bonds, asset-backed securities and residentialmortgage-backed securities. For commercial paper, the MUFG Group estimates fair value using discounted cashflows. The cash flows are estimated in accordance with the terms of contracts and discounted using a discountrate based on the yield curve estimated from market interest rates appropriate to the securities. Commercial paperis generally classified in Level 2 of the fair value hierarchy. For corporate bonds, the MUFG Group estimates fairvalue using discounted cash flows. The cash flows are estimated in accordance with the terms of contracts anddiscounted using discount rates applicable to the maturity of the bonds, which are adjusted to reflect credit risk ofissuers. Credit risk of issuers is reflected in the future cash flows being discounted by the interest rate applicableto the maturity of the bonds. Corporate bonds are classified in either Level 2 or Level 3 of the fair valuehierarchy, depending primarily on the significance of the adjustments to the unobservable input of creditworthiness. For residential mortgage-backed securities, the MUFG Group estimates fair value using non-bindingprices obtained from independent third parties. Residential mortgage-backed securities are classified as level 2unless otherwise significant unobservable input is used for the valuation.
When there is less liquidity for securities or significant inputs used in the fair value measurements areunobservable, such securities are classified in Level 3 of the fair value hierarchy. Examples of such Level 3securities include CLOs backed by general corporate loans, which are classified in asset-backed securities. The
F-141

MITSUBISHI UFJ FINANCIAL GROUP, INC. AND SUBSIDIARIES
NOTES TO CONSOLIDATED FINANCIAL STATEMENTS—(Continued)
fair value of CLOs is measured by weighing the estimated fair value amounts from the internal model and thenon-binding quotes from the independent broker-dealers. The weight of the quotes from independent broker-dealers is determined based on the result of inquiries with the broker-dealers to understand their basis of fairvalue calculation with consideration given to transaction volume. Key inputs to the internal model includeprojected cash flows through an analysis of underlying loans, probability of default which incorporates marketindices such as LCDX (which is an index of loan credit default swaps), prepayment rates and discount ratesreflecting liquidity premiums based on historical market data.
Trading Account Assets and Liabilities—Derivatives
Exchange-traded derivatives valued using quoted prices are classified in Level 1 of the fair value hierarchy.Examples of Level 1 derivatives include stock futures index and interest rate futures. However, the majority ofthe derivative contracts entered into by the MUFG Group are traded over-the-counter and valued using valuationtechniques as there are no quoted prices for such derivatives. The valuation techniques and inputs vary dependingon the types and contractual terms of the derivatives. The principal valuation techniques used to value derivativesinclude discounted cash flows, the Black-Scholes model and the Hull-White model. The key inputs includeinterest rate yield curve, foreign currency exchange rate, volatility, credit quality of the counterparty or theMUFG Group and spot price of the underlying. These models are commonly accepted in the financial industryand key inputs to the models are generally readily observable in an active market. Derivatives valued using suchvaluation techniques and inputs are generally classified in Level 2 of the fair value hierarchy. Examples of suchLevel 2 derivatives include plain-vanilla interest rate swaps, foreign currency forward contracts and currencyoption contracts.
Derivatives that are valued using valuation techniques with significant unobservable inputs are classified inLevel 3 of the fair value hierarchy. Examples of Level 3 derivatives include long-term interest rate or currencyswaps and certain credit derivatives, where significant inputs such as volatility, credit curves and correlation ofsuch inputs are unobservable.
Investment Securities
Investment securities include Available-for-sale debt and equity securities, whose fair values are measuredusing the same valuation techniques as the trading account securities described above. Investment securities alsoinclude investments in nonmarketable equity securities which are subject to specialized industry accountingprinciples. The valuation of such nonmarketable equity securities involves significant management judgment dueto the absence of quoted prices, lack of liquidity and the long term nature of these investments. Further, theremay be restriction on transfers of nonmarketable equity securities. The MUFG Group values such securitiesinitially at transaction price and subsequently adjusts such valuations, considering evidence such as current salestransactions of similar securities, initial public offerings, recent equity issuances and change in financialcondition of the investee company. Nonmarketable equity securities are included in Level 3 of the fair valuehierarchy.
Other Assets
Other assets measured at fair value mainly consist of securities received as collateral that may be sold orrepledged under securities lending transactions, money in trust for segregating cash deposited by customers onsecurity transactions and derivatives designated as hedging instruments. The securities received as collateralunder lending transactions mainly consist of certain Japanese and foreign government bonds which are valuedusing the valuation techniques previously described in the section entitled “Trading Accounts Assets andLiabilities—Trading Account Securities” above.
F-142
MITSUBISHI UFJ FINANCIAL GROUP, INC. AND SUBSIDIARIES
NOTES TO CONSOLIDATED FINANCIAL STATEMENTS—(Continued)
Money in trust for segregating cash deposited by customers on security transactions mainly consists ofcertain Japanese government bonds which are valued using the valuation techniques described in the “TradingAccount Assets and Liabilities—Trading Account Securities” above and is included in Level 1 or Level 2 of thefair value hierarchy depending on the component assets.
The fair values of derivatives designated as hedging instruments are measured using the valuationtechniques described in the “Trading Account Assets and Liabilities—Derivatives” above.
Obligations to Return Securities Received as Collateral
Obligations to return securities received as collateral under securities lending transactions are measured atthe fair values of the securities received as collateral. The securities received as collateral consist primarily ofcertain Japanese and foreign government bonds, whose fair values are measured using the valuation techniquesdescribed in the “Trading Account Assets and Liabilities—Trading Account Securities” above.
Other Short-term Borrowings and Long-term Debt
Certain short-term borrowings and long-term debt are measured at fair value due to the election of the fairvalue option. The fair value of these instruments are measured principally based on the discounted cash flows.Where the inputs into the valuation techniques are mainly based on observable inputs, these instruments areclassified in Level 2 of the fair value hierarchy. Where significant inputs are unobservable, they are classified inLevel 3 of the fair value hierarchy.
Market Valuation Adjustments
Counterparty credit risk adjustments are made to certain financial assets such as over-the-counterderivatives to factor in counterparty credit exposure. As not all counterparties have the same credit risk, it isnecessary in calculating credit risk adjustments, to take into account probability of a default event occurring foreach counterparty, which is primarily derived from observed or estimated spreads on credit default swaps. Inaddition, the counterparty credit risk adjustment takes into account the effect of credit risk mitigation such aspledged collateral and the legal right of offset with the counterparty.
Funding valuation adjustment (“FVA”) represents the adjustment to reflect the impact of uncollateralizedfunding. The FVA is calculated using the MUFG’s market funding spread and the funding exposure of anyuncollateralized component of the over-the-counter derivative instrument. The MUFG Group’s FVA frameworkincorporates key inputs, such as the expected future funding requirements arising from the MUFG Group’spositions with each counterparty and collateral arrangements, and the estimated market funding cost in theprincipal market, which considers the MUFG Group’s credit risk.
Liquidity adjustments are applied mainly to the instruments classified in Level 3 of the fair value hierarchywhen recent observable prices of such instruments are not available or such instruments are traded in inactive orless active markets. The liquidity adjustments are based on the facts and circumstances of the markets includingthe availability of external quotes and the time since the latest available quote.
Model valuation adjustments such as unobservable parameter valuation adjustments may be provided whenthe fair values of instruments are determined based on internally developed valuation techniques. Examples ofsuch adjustments include adjustments to the model price of certain derivatives where parameters such ascorrelation are unobservable. Unobservable parameter valuation adjustments are applied to mitigate theuncertainty inherent in the resulting valuation estimate.
F-143

MITSUBISHI UFJ FINANCIAL GROUP, INC. AND SUBSIDIARIES
NOTES TO CONSOLIDATED FINANCIAL STATEMENTS—(Continued)
Investments in Certain Entities That Calculate Net Asset Value per Share
The MUFG Group has interests in investment funds mainly private equity funds, and real estate funds thatare measured at fair value on a recurring or nonrecurring basis.
Private equity funds have specific investment objectives in connection with their acquisition of equityinterests, such as providing financing and other support to start-up businesses, medium and small entities in aparticular geographical area, and to companies with certain technology or companies in a high-growth industry.Generally, these investments cannot be redeemed with the funds, and the return of invested capital and its gainsare derived from distributions received upon the liquidation of the underlying assets of the fund, the timing ofwhich is uncertain.
Real estate funds invest globally and primarily in real estate companies, debt recapitalizations and directproperty. These investments are generally not redeemable with the funds. Distributions from each fund will bereceived as the underlying investments of the funds are liquidated, the timing of which is uncertain.
F-144

MITSUBISHI UFJ FINANCIAL GROUP, INC. AND SUBSIDIARIES
NOTES TO CONSOLIDATED FINANCIAL STATEMENTS—(Continued)
Assets and Liabilities Measured at Fair Value on a Recurring Basis
The following tables present the financial instruments carried at fair value by level within the fair valuehierarchy as of March 31, 2018 and 2019:
At March 31, 2018 Level 1 Level 2 Level 3 Fair Value
(in millions)Assets
Trading account assets:Trading securities(1) . . . . . . . . . . . . . . . . . . . . . . . . . . . . . . . . . . . . . . . . . ¥10,876,424 ¥10,876,080 ¥ 827,493 ¥22,579,997
Debt securitiesJapanese national government and Japanese government
agency bonds . . . . . . . . . . . . . . . . . . . . . . . . . . . . . . . . . . . . 1,388,143 477,530 — 1,865,673Japanese prefectural and municipal bonds . . . . . . . . . . . . . . . — 189,756 — 189,756Foreign government and official institution bonds . . . . . . . . . 8,190,781 469,342 1,047 8,661,170Corporate bonds . . . . . . . . . . . . . . . . . . . . . . . . . . . . . . . . . . . — 3,255,503 23,092 3,278,595Residential mortgage-backed securities . . . . . . . . . . . . . . . . . — 4,432,307 41,141 4,473,448Asset-backed securities . . . . . . . . . . . . . . . . . . . . . . . . . . . . . . — 186,351 684,637 870,988Other debt securities . . . . . . . . . . . . . . . . . . . . . . . . . . . . . . . . — 2,800 33,450 36,250Commercial paper . . . . . . . . . . . . . . . . . . . . . . . . . . . . . . . . . . — 1,210,775 — 1,210,775
Equity securities(2) . . . . . . . . . . . . . . . . . . . . . . . . . . . . . . . . . . . . . . 1,297,500 651,716 44,126 1,993,342Trading derivative assets . . . . . . . . . . . . . . . . . . . . . . . . . . . . . . . . . . . . . 71,175 12,420,100 93,900 12,585,175
Interest rate contracts . . . . . . . . . . . . . . . . . . . . . . . . . . . . . . . . . . . 3,320 8,681,427 27,092 8,711,839Foreign exchange contracts . . . . . . . . . . . . . . . . . . . . . . . . . . . . . . . 1,890 3,543,413 12,118 3,557,421Equity contracts . . . . . . . . . . . . . . . . . . . . . . . . . . . . . . . . . . . . . . . 65,965 118,351 22,994 207,310Commodity contracts . . . . . . . . . . . . . . . . . . . . . . . . . . . . . . . . . . . — 6,239 30,753 36,992Credit derivatives . . . . . . . . . . . . . . . . . . . . . . . . . . . . . . . . . . . . . . — 70,670 943 71,613
Investment securities:Available-for-sale debt securities . . . . . . . . . . . . . . . . . . . . . . . . . . . . . . 23,105,682 9,376,772 350,660 32,833,114
Japanese national government and Japanese government agencybonds . . . . . . . . . . . . . . . . . . . . . . . . . . . . . . . . . . . . . . . . . . . . . . 21,522,128 3,045,776 — 24,567,904
Japanese prefectural and municipal bonds . . . . . . . . . . . . . . . . . . . — 1,537,431 — 1,537,431Foreign government and official institution bonds . . . . . . . . . . . . . 1,583,554 567,946 20,192 2,171,692Corporate bonds . . . . . . . . . . . . . . . . . . . . . . . . . . . . . . . . . . . . . . . — 1,113,323 6,037 1,119,360Residential mortgage-backed securities . . . . . . . . . . . . . . . . . . . . . — 1,617,520 15 1,617,535Commercial mortgage-backed securities . . . . . . . . . . . . . . . . . . . . — 92,806 2,430 95,236Asset-backed securities . . . . . . . . . . . . . . . . . . . . . . . . . . . . . . . . . . — 1,397,177 161,172 1,558,349Other debt securities . . . . . . . . . . . . . . . . . . . . . . . . . . . . . . . . . . . . — 4,793 160,814 165,607
Equity securities(6) . . . . . . . . . . . . . . . . . . . . . . . . . . . . . . . . . . . . . . . . . . 6,255,413 416,171 28,359 6,699,943Marketable equity securities . . . . . . . . . . . . . . . . . . . . . . . . . . . . . . 6,255,413 416,171 — 6,671,584Nonmarketable equity securities . . . . . . . . . . . . . . . . . . . . . . . . . . . — — 28,359 28,359
Others(3)(4) . . . . . . . . . . . . . . . . . . . . . . . . . . . . . . . . . . . . . . . . . . . . . . . . . . . . 955,548 93,042 8,660 1,057,250
Total . . . . . . . . . . . . . . . . . . . . . . . . . . . . . . . . . . . . . . . . . . . . . . . . . . . . . . . . ¥41,264,242 ¥33,182,165 ¥1,309,072 ¥75,755,479
LiabilitiesTrading account liabilities:
Trading securities sold, not yet purchased . . . . . . . . . . . . . . . . . . . . . . . ¥ 208,354 ¥ 7,060 ¥ — ¥ 215,414Trading derivative liabilities . . . . . . . . . . . . . . . . . . . . . . . . . . . . . . . . . . 80,673 11,844,463 81,781 12,006,917
Interest rate contracts . . . . . . . . . . . . . . . . . . . . . . . . . . . . . . . . . . . 3,085 8,659,042 12,496 8,674,623Foreign exchange contracts . . . . . . . . . . . . . . . . . . . . . . . . . . . . . . . 2,058 2,992,812 5,382 3,000,252Equity contracts . . . . . . . . . . . . . . . . . . . . . . . . . . . . . . . . . . . . . . . 75,530 117,572 33,679 226,781Commodity contracts . . . . . . . . . . . . . . . . . . . . . . . . . . . . . . . . . . . — 4,362 30,070 34,432Credit derivatives . . . . . . . . . . . . . . . . . . . . . . . . . . . . . . . . . . . . . . — 70,675 154 70,829
Obligation to return securities received as collateral . . . . . . . . . . . . . . . . . . . 3,030,974 145,988 — 3,176,962Others(5) . . . . . . . . . . . . . . . . . . . . . . . . . . . . . . . . . . . . . . . . . . . . . . . . . . . . . . — 507,700 (25,528) 482,172
Total . . . . . . . . . . . . . . . . . . . . . . . . . . . . . . . . . . . . . . . . . . . . . . . . . . . . . . . . ¥ 3,320,001 ¥12,505,211 ¥ 56,253 ¥15,881,465
F-145
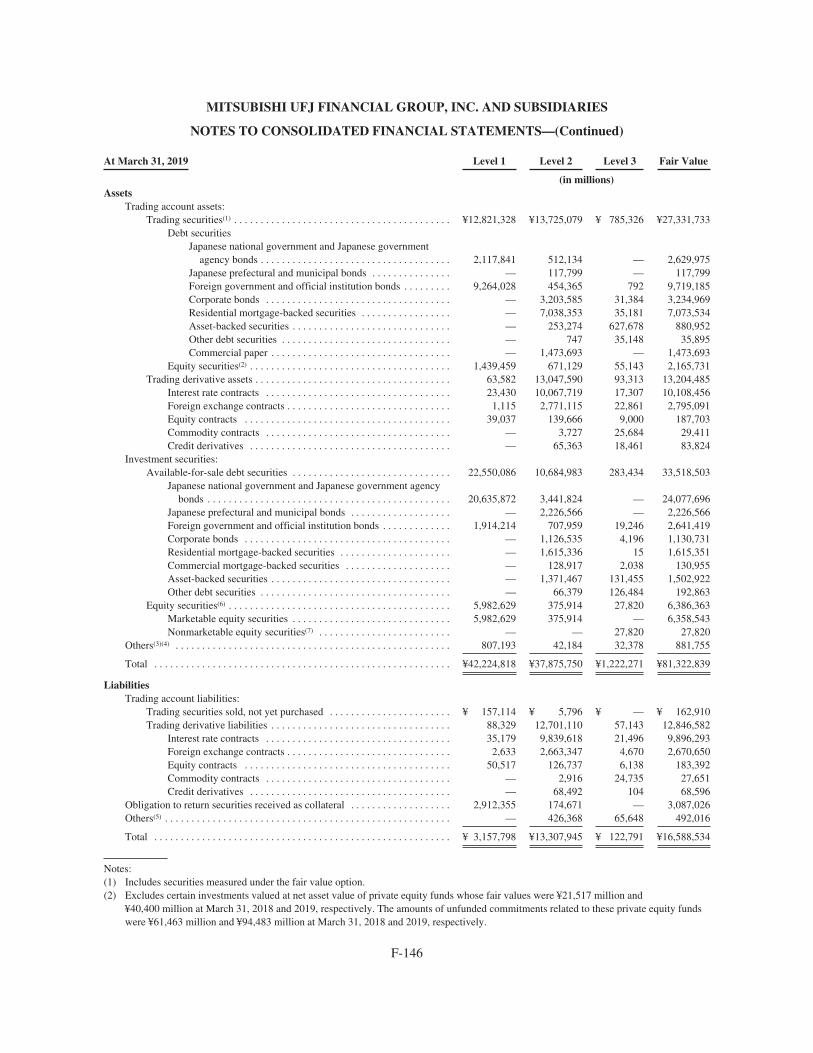
MITSUBISHI UFJ FINANCIAL GROUP, INC. AND SUBSIDIARIES
NOTES TO CONSOLIDATED FINANCIAL STATEMENTS—(Continued)
At March 31, 2019 Level 1 Level 2 Level 3 Fair Value
(in millions)Assets
Trading account assets:Trading securities(1) . . . . . . . . . . . . . . . . . . . . . . . . . . . . . . . . . . . . . . . . . ¥12,821,328 ¥13,725,079 ¥ 785,326 ¥27,331,733
Debt securitiesJapanese national government and Japanese government
agency bonds . . . . . . . . . . . . . . . . . . . . . . . . . . . . . . . . . . . . 2,117,841 512,134 — 2,629,975Japanese prefectural and municipal bonds . . . . . . . . . . . . . . . — 117,799 — 117,799Foreign government and official institution bonds . . . . . . . . . 9,264,028 454,365 792 9,719,185Corporate bonds . . . . . . . . . . . . . . . . . . . . . . . . . . . . . . . . . . . — 3,203,585 31,384 3,234,969Residential mortgage-backed securities . . . . . . . . . . . . . . . . . — 7,038,353 35,181 7,073,534Asset-backed securities . . . . . . . . . . . . . . . . . . . . . . . . . . . . . . — 253,274 627,678 880,952Other debt securities . . . . . . . . . . . . . . . . . . . . . . . . . . . . . . . . — 747 35,148 35,895Commercial paper . . . . . . . . . . . . . . . . . . . . . . . . . . . . . . . . . . — 1,473,693 — 1,473,693
Equity securities(2) . . . . . . . . . . . . . . . . . . . . . . . . . . . . . . . . . . . . . . 1,439,459 671,129 55,143 2,165,731Trading derivative assets . . . . . . . . . . . . . . . . . . . . . . . . . . . . . . . . . . . . . 63,582 13,047,590 93,313 13,204,485
Interest rate contracts . . . . . . . . . . . . . . . . . . . . . . . . . . . . . . . . . . . 23,430 10,067,719 17,307 10,108,456Foreign exchange contracts . . . . . . . . . . . . . . . . . . . . . . . . . . . . . . . 1,115 2,771,115 22,861 2,795,091Equity contracts . . . . . . . . . . . . . . . . . . . . . . . . . . . . . . . . . . . . . . . 39,037 139,666 9,000 187,703Commodity contracts . . . . . . . . . . . . . . . . . . . . . . . . . . . . . . . . . . . — 3,727 25,684 29,411Credit derivatives . . . . . . . . . . . . . . . . . . . . . . . . . . . . . . . . . . . . . . — 65,363 18,461 83,824
Investment securities:Available-for-sale debt securities . . . . . . . . . . . . . . . . . . . . . . . . . . . . . . 22,550,086 10,684,983 283,434 33,518,503
Japanese national government and Japanese government agencybonds . . . . . . . . . . . . . . . . . . . . . . . . . . . . . . . . . . . . . . . . . . . . . . 20,635,872 3,441,824 — 24,077,696
Japanese prefectural and municipal bonds . . . . . . . . . . . . . . . . . . . — 2,226,566 — 2,226,566Foreign government and official institution bonds . . . . . . . . . . . . . 1,914,214 707,959 19,246 2,641,419Corporate bonds . . . . . . . . . . . . . . . . . . . . . . . . . . . . . . . . . . . . . . . — 1,126,535 4,196 1,130,731Residential mortgage-backed securities . . . . . . . . . . . . . . . . . . . . . — 1,615,336 15 1,615,351Commercial mortgage-backed securities . . . . . . . . . . . . . . . . . . . . — 128,917 2,038 130,955Asset-backed securities . . . . . . . . . . . . . . . . . . . . . . . . . . . . . . . . . . — 1,371,467 131,455 1,502,922Other debt securities . . . . . . . . . . . . . . . . . . . . . . . . . . . . . . . . . . . . — 66,379 126,484 192,863
Equity securities(6) . . . . . . . . . . . . . . . . . . . . . . . . . . . . . . . . . . . . . . . . . . 5,982,629 375,914 27,820 6,386,363Marketable equity securities . . . . . . . . . . . . . . . . . . . . . . . . . . . . . . 5,982,629 375,914 — 6,358,543Nonmarketable equity securities(7) . . . . . . . . . . . . . . . . . . . . . . . . . — — 27,820 27,820
Others(3)(4) . . . . . . . . . . . . . . . . . . . . . . . . . . . . . . . . . . . . . . . . . . . . . . . . . . . . 807,193 42,184 32,378 881,755
Total . . . . . . . . . . . . . . . . . . . . . . . . . . . . . . . . . . . . . . . . . . . . . . . . . . . . . . . . ¥42,224,818 ¥37,875,750 ¥1,222,271 ¥81,322,839
LiabilitiesTrading account liabilities:
Trading securities sold, not yet purchased . . . . . . . . . . . . . . . . . . . . . . . ¥ 157,114 ¥ 5,796 ¥ — ¥ 162,910Trading derivative liabilities . . . . . . . . . . . . . . . . . . . . . . . . . . . . . . . . . . 88,329 12,701,110 57,143 12,846,582
Interest rate contracts . . . . . . . . . . . . . . . . . . . . . . . . . . . . . . . . . . . 35,179 9,839,618 21,496 9,896,293Foreign exchange contracts . . . . . . . . . . . . . . . . . . . . . . . . . . . . . . . 2,633 2,663,347 4,670 2,670,650Equity contracts . . . . . . . . . . . . . . . . . . . . . . . . . . . . . . . . . . . . . . . 50,517 126,737 6,138 183,392Commodity contracts . . . . . . . . . . . . . . . . . . . . . . . . . . . . . . . . . . . — 2,916 24,735 27,651Credit derivatives . . . . . . . . . . . . . . . . . . . . . . . . . . . . . . . . . . . . . . — 68,492 104 68,596
Obligation to return securities received as collateral . . . . . . . . . . . . . . . . . . . 2,912,355 174,671 — 3,087,026Others(5) . . . . . . . . . . . . . . . . . . . . . . . . . . . . . . . . . . . . . . . . . . . . . . . . . . . . . . — 426,368 65,648 492,016
Total . . . . . . . . . . . . . . . . . . . . . . . . . . . . . . . . . . . . . . . . . . . . . . . . . . . . . . . . ¥ 3,157,798 ¥13,307,945 ¥ 122,791 ¥16,588,534
Notes:(1) Includes securities measured under the fair value option.(2) Excludes certain investments valued at net asset value of private equity funds whose fair values were ¥21,517 million and
¥40,400 million at March 31, 2018 and 2019, respectively. The amounts of unfunded commitments related to these private equity fundswere ¥61,463 million and ¥94,483 million at March 31, 2018 and 2019, respectively.
F-146

MITSUBISHI UFJ FINANCIAL GROUP, INC. AND SUBSIDIARIES
NOTES TO CONSOLIDATED FINANCIAL STATEMENTS—(Continued)
(3) Mainly comprises securities received as collateral that may be sold or repledged under securities lending transactions, money in trust forsegregating cash deposited by customers on security transactions and derivative assets designated as hedging instruments.
(4) Excludes certain investments valued at net asset value of private equity funds, whose fair values at March 31, 2018 was ¥35 million, andthose at March 31, 2019 was nil, respectively. There was no amount of unfunded commitments related to these private equity funds atMarch 31, 2018 and 2019.
(5) Includes other short-term borrowings, long-term debt, bifurcated embedded derivatives carried at fair value and derivative liabilitiesdesignated as hedging instruments.
(6) The table above reflects changes in presentation that were made to equity investment securities at March 31, 2018. See Note 1 for furtherinformation.
(7) Excludes certain investments valued at net asset value of real estate funds and private funds, whose fair values at March 31, 2019 were¥17,583 million, and ¥9,921 million, respectively. The amounts of unfunded commitments related to these real estate funds and privatefunds at March 31, 2019 were ¥2,054 million, and nil, respectively.
F-147

MITSUBISHI UFJ FINANCIAL GROUP, INC. AND SUBSIDIARIES
NOTES TO CONSOLIDATED FINANCIAL STATEMENTS—(Continued)
Changes in Level 3 Recurring Fair Value Measurements
The following tables present a reconciliation of the assets and liabilities measured at fair value on arecurring basis using significant unobservable inputs (Level 3) during the fiscal years ended March 31, 2018 and2019. The determination to classify a financial instrument within Level 3 is based upon the significance of theunobservable inputs to overall fair value measurement. However, Level 3 financial instruments typically include,in addition to the unobservable or Level 3 input, observable inputs (inputs that are actively quoted and can bevalidated to external sources). Accordingly, the gains and losses in the tables below include changes in fair valuedue in part to observable inputs used in the valuation techniques.
March 31,2017
Total gains (losses)for the period
Purchases Issues Sales Settlements
Transfersinto
Level 3
Transfersout of
Level 3March 31,
2018
Change inunrealized
gains (losses)included inearnings forassets andliabilities
still held atMarch 31,
2018
Includedin
earnings
Includedin other
comprehensiveincome
(in millions)Assets
Trading account assets:Trading securities(1) . . . . . . . . . . . ¥ 799,493 ¥(25,944)(2) ¥ — ¥ 702,402 ¥ — ¥(281,927) ¥(376,333) ¥34,986 ¥(25,184) ¥ 827,493 ¥(26,391)(2)
Debt securitiesJapanese national
government and Japanesegovernment agencybonds . . . . . . . . . . . . . . . . — (4) — 1,079 — — — — (1,075) — —
Foreign government andofficial institutionbonds . . . . . . . . . . . . . . . . 1,836 720 — 107,685 — (107,157) (1,064) — (973) 1,047 (2)
Corporate bonds . . . . . . . . . . 25,521 (6,424) — 3,170 — (533) (10,391) 34,885(5) (23,136)(5) 23,092 (6,377)Residential mortgage-
backed securities . . . . . . . 47,914 1,014 — — — — (7,787) — — 41,141 829Asset-backed securities . . . . 654,814 (21,124) — 576,668 — (172,324) (353,397) — — 684,637 (19,387)Other debt securities . . . . . . 35,552 (2,102) — — — — — — — 33,450 (2,102)
Equity securities . . . . . . . . . . . 33,856 1,976 — 13,800 — (1,913) (3,694) 101 — 44,126 648Trading derivatives—net . . . . . . . 37,245 3,912(2) 520 1,367 (1,518) — (23,699) (466) (5,242) 12,119 (9,055)(2)
Interest rate contracts—net . . . 28,551 (4,730) (42) — — — (8,810) (2,433) 2,060 14,596 (3,908)Foreign exchange
contracts—net . . . . . . . . . . . 14,858 (2,434) 294 26 — — (67) 1,996(5) (7,937) 6,736 1,713Equity contracts—net . . . . . . . (6,312) 12,518 272 687 (1,154) — (17,302) (29)(5) 635(5) (10,685) (5,446)Commodity contracts—net . . . 370 30 (4) 654 (364) — (3) — — 683 116Credit derivatives—net . . . . . . (222) (1,472) — — — — 2,483 — — 789 (1,530)
Investment securities:Available-for-sale debt
securities . . . . . . . . . . . . . . . . . 337,526 4,831(3) (15,344) 319,092 — (163) (264,616) 93 (30,759) 350,660 (167)(3)
Foreign government andofficial institution bonds . . . 20,099 — (186) 621 — — (342) — — 20,192 —
Corporate bonds . . . . . . . . . . . . 36,932 150 (43) 521 — (52) (805) 93(5) (30,759)(5) 6,037 (167)Residential mortgage-backed
securities . . . . . . . . . . . . . . . 15 — — — — — — — — 15 —Commercial mortgage-backed
securities . . . . . . . . . . . . . . . 2,971 — 4 — — — (545) — — 2,430 —Asset-backed securities . . . . . . 116,919 4,681 (9,605) 306,680 — — (257,503) — — 161,172 —Other debt securities . . . . . . . . 160,590 — (5,514) 11,270 — (111) (5,421) — — 160,814 —
Equity securities . . . . . . . . . . . . . 26,292 1,640(3) — 3,930 — (2,782) (7) — (714) 28,359 300(3)
Nonmarketable equitysecurities . . . . . . . . . . . . . . . 26,292 1,640 — 3,930 — (2,782) (7) — (714) 28,359 300
Others . . . . . . . . . . . . . . . . . . . . . . . 3,850 (426)(7) (37) 5,584 — (311) — — — 8,660 (592)(7)
Total . . . . . . . . . . . . . . . . . . . . . . . . ¥1,204,406 ¥(15,987) ¥(14,861) ¥1,032,375 ¥ (1,518) ¥(285,183) ¥(664,655) ¥34,613 ¥(61,899) ¥1,227,291 ¥(35,905)
LiabilitiesOthers . . . . . . . . . . . . . . . . . . . . . . . . ¥ 28,432 ¥ 4,508(4) ¥ (2,005) ¥ — ¥ 6,601 ¥ — ¥ (27,824) ¥ 1,056(6) ¥(31,290)(6) ¥ (25,528) ¥ 35,010(4)
Total . . . . . . . . . . . . . . . . . . . . . . . . . ¥ 28,432 ¥ 4,508 ¥ (2,005) ¥ — ¥ 6,601 ¥ — ¥ (27,824) ¥ 1,056 ¥(31,290) ¥ (25,528) ¥ 35,010
F-148
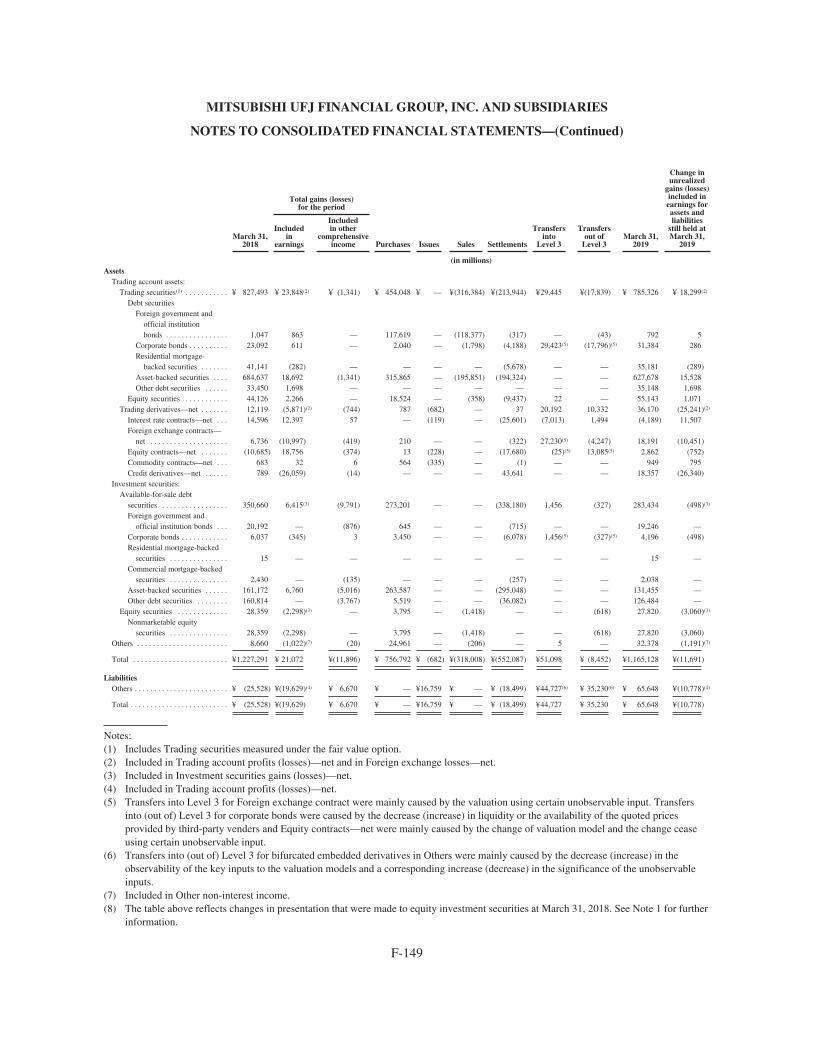
MITSUBISHI UFJ FINANCIAL GROUP, INC. AND SUBSIDIARIES
NOTES TO CONSOLIDATED FINANCIAL STATEMENTS—(Continued)
March 31,2018
Total gains (losses)for the period
Purchases Issues Sales Settlements
Transfersinto
Level 3
Transfersout of
Level 3March 31,
2019
Change inunrealized
gains (losses)included inearnings forassets andliabilities
still held atMarch 31,
2019
Includedin
earnings
Includedin other
comprehensiveincome
(in millions)Assets
Trading account assets:Trading securities(1) . . . . . . . . . . . ¥ 827,493 ¥ 23,848(2) ¥ (1,341) ¥ 454,048 ¥ — ¥(316,384) ¥(213,944) ¥29,445 ¥(17,839) ¥ 785,326 ¥ 18,299(2)
Debt securitiesForeign government and
official institutionbonds . . . . . . . . . . . . . . . . 1,047 863 — 117,619 — (118,377) (317) — (43) 792 5
Corporate bonds . . . . . . . . . . 23,092 611 — 2,040 — (1,798) (4,188) 29,423(5) (17,796)(5) 31,384 286Residential mortgage-
backed securities . . . . . . . 41,141 (282) — — — — (5,678) — — 35,181 (289)Asset-backed securities . . . . 684,637 18,692 (1,341) 315,865 — (195,851) (194,324) — — 627,678 15,528Other debt securities . . . . . . 33,450 1,698 — — — — — — — 35,148 1,698
Equity securities . . . . . . . . . . . 44,126 2,266 — 18,524 — (358) (9,437) 22 — 55,143 1,071Trading derivatives—net . . . . . . . 12,119 (5,871)(2) (744) 787 (682) — 37 20,192 10,332 36,170 (25,241)(2)
Interest rate contracts—net . . . 14,596 12,397 57 — (119) — (25,601) (7,013) 1,494 (4,189) 11,507Foreign exchange contracts—
net . . . . . . . . . . . . . . . . . . . . 6,736 (10,997) (419) 210 — — (322) 27,230(5) (4,247) 18,191 (10,451)Equity contracts—net . . . . . . . (10,685) 18,756 (374) 13 (228) — (17,680) (25)(5) 13,085(5) 2,862 (752)Commodity contracts—net . . . 683 32 6 564 (335) — (1) — — 949 795Credit derivatives—net . . . . . . 789 (26,059) (14) — — — 43,641 — — 18,357 (26,340)
Investment securities:Available-for-sale debt
securities . . . . . . . . . . . . . . . . . 350,660 6,415(3) (9,791) 273,201 — — (338,180) 1,456 (327) 283,434 (498)(3)
Foreign government andofficial institution bonds . . . 20,192 — (876) 645 — — (715) — — 19,246 —
Corporate bonds . . . . . . . . . . . . 6,037 (345) 3 3,450 — — (6,078) 1,456(5) (327)(5) 4,196 (498)Residential mortgage-backed
securities . . . . . . . . . . . . . . . 15 — — — — — — — — 15 —Commercial mortgage-backed
securities . . . . . . . . . . . . . . . 2,430 — (135) — — — (257) — — 2,038 —Asset-backed securities . . . . . . 161,172 6,760 (5,016) 263,587 — — (295,048) — — 131,455 —Other debt securities . . . . . . . . 160,814 — (3,767) 5,519 — — (36,082) — — 126,484 —
Equity securities . . . . . . . . . . . . . 28,359 (2,298)(3) — 3,795 — (1,418) — — (618) 27,820 (3,060)(3)
Nonmarketable equitysecurities . . . . . . . . . . . . . . . 28,359 (2,298) — 3,795 — (1,418) — — (618) 27,820 (3,060)
Others . . . . . . . . . . . . . . . . . . . . . . . 8,660 (1,022)(7) (20) 24,961 — (206) — 5 — 32,378 (1,191)(7)
Total . . . . . . . . . . . . . . . . . . . . . . . . ¥1,227,291 ¥ 21,072 ¥(11,896) ¥ 756,792 ¥ (682) ¥(318,008) ¥(552,087) ¥51,098 ¥ (8,452) ¥1,165,128 ¥(11,691)
LiabilitiesOthers . . . . . . . . . . . . . . . . . . . . . . . . ¥ (25,528) ¥(19,629)(4) ¥ 6,670 ¥ — ¥16,759 ¥ — ¥ (18,499) ¥44,727(6) ¥ 35,230(6) ¥ 65,648 ¥(10,778)(4)
Total . . . . . . . . . . . . . . . . . . . . . . . . . ¥ (25,528) ¥(19,629) ¥ 6,670 ¥ — ¥16,759 ¥ — ¥ (18,499) ¥44,727 ¥ 35,230 ¥ 65,648 ¥(10,778)
Notes:(1) Includes Trading securities measured under the fair value option.(2) Included in Trading account profits (losses)—net and in Foreign exchange losses—net.(3) Included in Investment securities gains (losses)—net.(4) Included in Trading account profits (losses)—net.(5) Transfers into Level 3 for Foreign exchange contract were mainly caused by the valuation using certain unobservable input. Transfers
into (out of) Level 3 for corporate bonds were caused by the decrease (increase) in liquidity or the availability of the quoted pricesprovided by third-party venders and Equity contracts—net were mainly caused by the change of valuation model and the change ceaseusing certain unobservable input.
(6) Transfers into (out of) Level 3 for bifurcated embedded derivatives in Others were mainly caused by the decrease (increase) in theobservability of the key inputs to the valuation models and a corresponding increase (decrease) in the significance of the unobservableinputs.
(7) Included in Other non-interest income.(8) The table above reflects changes in presentation that were made to equity investment securities at March 31, 2018. See Note 1 for further
information.
F-149

MITSUBISHI UFJ FINANCIAL GROUP, INC. AND SUBSIDIARIES
NOTES TO CONSOLIDATED FINANCIAL STATEMENTS—(Continued)
Quantitative Information about Level 3 Fair Value Measurements
The following tables present information on the valuation techniques, significant unobservable inputs andtheir ranges for each major category of assets and liabilities measured at fair value on a recurring basis andclassified in Level 3:
At March 31, 2018 Fair value(1) Valuation technique Significant unobservable inputs RangeWeightedAverage(2)
(in millions)Assets
Trading securities andInvestment securities:
Foreign government andofficial institutionbonds . . . . . . . . . . . . . . ¥ 20,192 Return on equity method Probability of default 0.0%~0.4% 0.2%
Recovery rate 60.0%~70.0% 66.7%Market-required return on capital 8.0%~10.0% 9.5%
Residential mortgage-backed securities,Commercial mortgage-backed securities andAsset-backedsecurities . . . . . . . . . . . 110,536 Discounted cash flow Probability of default 1.2%~5.3% 4.5%
Recovery rate 60.0%~76.0% 66.3%684,586 Internal model(4) Asset correlations 9.0% 9.0%
Discount factor 1.0% 1.0%Prepayment rate 37.2% 37.2%Probability of default 0.0%~91.3% —(3)
Recovery rate 65.3% 65.3%Other debt securities . . . . 33,450 Discounted cash flow Liquidity premium 0.5%~2.4% 0.8%
149,759 Return on equity method Probability of default 0.0%~25.0% 0.3%Recovery rate 40.0%~90.0% 72.5%Market-required return on capital 8.0%~10.0% 9.7%
At March 31, 2018 Fair value(1) Valuation technique Significant unobservable inputs Range
(in millions)Trading derivatives—net:
Interest rate contracts—net . . . . 14,460 Option model Probability of default 0.0%~12.5%Correlation between interest rates 34.1%~52.7%Correlation between interest rate and
foreign exchange rate 19.7%~50.4%Recovery rate 41.0%~46.0%Volatility 13.4%~100.0%Probability of prepayment 100.0%
Foreign exchangecontracts—net . . . . . . . . . . . . 6,779 Option model Probability of default 0.0%~12.5%
Correlation between interest rates 40.3%~74.0%Correlation between interest rate and
foreign exchange rate 28.1%~50.7%Recovery rate 41.0%~46.0%Correlation between underlying assets 85.0%Volatility 10.3%~16.2%
Equity contracts—net . . . . . . . . (16,600) Option model Correlation between interest rate andequity 37.1%~39.0%
Correlation between foreign exchangerate and equity 7.0%~65.2%
Correlation between equities 20.6%~81.7%Correlation between underlying assets 76.0%
6,528 Discounted cash flow Term of litigation 2.0 years
F-150
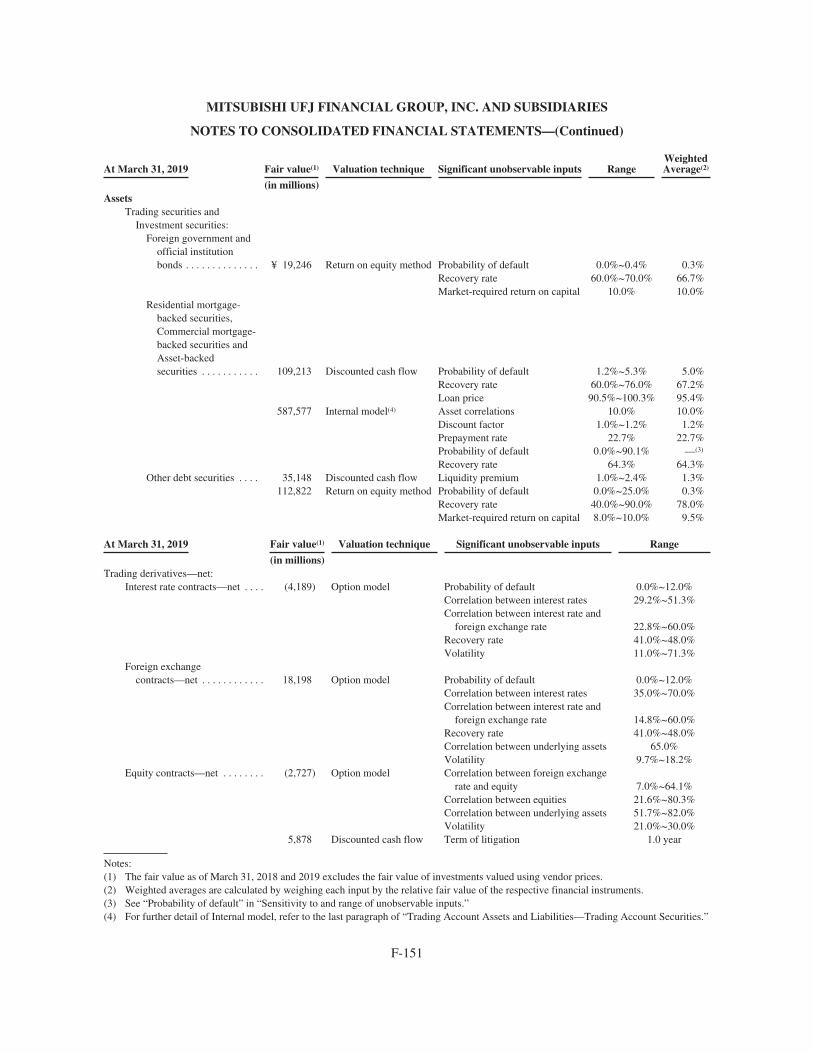
MITSUBISHI UFJ FINANCIAL GROUP, INC. AND SUBSIDIARIES
NOTES TO CONSOLIDATED FINANCIAL STATEMENTS—(Continued)
At March 31, 2019 Fair value(1) Valuation technique Significant unobservable inputs RangeWeightedAverage(2)
(in millions)Assets
Trading securities andInvestment securities:
Foreign government andofficial institutionbonds . . . . . . . . . . . . . . ¥ 19,246 Return on equity method Probability of default 0.0%~0.4% 0.3%
Recovery rate 60.0%~70.0% 66.7%Market-required return on capital 10.0% 10.0%
Residential mortgage-backed securities,Commercial mortgage-backed securities andAsset-backedsecurities . . . . . . . . . . . 109,213 Discounted cash flow Probability of default 1.2%~5.3% 5.0%
Recovery rate 60.0%~76.0% 67.2%Loan price 90.5%~100.3% 95.4%
587,577 Internal model(4) Asset correlations 10.0% 10.0%Discount factor 1.0%~1.2% 1.2%Prepayment rate 22.7% 22.7%Probability of default 0.0%~90.1% —(3)
Recovery rate 64.3% 64.3%Other debt securities . . . . 35,148 Discounted cash flow Liquidity premium 1.0%~2.4% 1.3%
112,822 Return on equity method Probability of default 0.0%~25.0% 0.3%Recovery rate 40.0%~90.0% 78.0%Market-required return on capital 8.0%~10.0% 9.5%
At March 31, 2019 Fair value(1) Valuation technique Significant unobservable inputs Range
(in millions)Trading derivatives—net:
Interest rate contracts—net . . . . (4,189) Option model Probability of default 0.0%~12.0%Correlation between interest rates 29.2%~51.3%Correlation between interest rate and
foreign exchange rate 22.8%~60.0%Recovery rate 41.0%~48.0%Volatility 11.0%~71.3%
Foreign exchangecontracts—net . . . . . . . . . . . . 18,198 Option model Probability of default 0.0%~12.0%
Correlation between interest rates 35.0%~70.0%Correlation between interest rate and
foreign exchange rate 14.8%~60.0%Recovery rate 41.0%~48.0%Correlation between underlying assets 65.0%Volatility 9.7%~18.2%
Equity contracts—net . . . . . . . . (2,727) Option model Correlation between foreign exchangerate and equity 7.0%~64.1%
Correlation between equities 21.6%~80.3%Correlation between underlying assets 51.7%~82.0%Volatility 21.0%~30.0%
5,878 Discounted cash flow Term of litigation 1.0 year
Notes:(1) The fair value as of March 31, 2018 and 2019 excludes the fair value of investments valued using vendor prices.(2) Weighted averages are calculated by weighing each input by the relative fair value of the respective financial instruments.(3) See “Probability of default” in “Sensitivity to and range of unobservable inputs.”(4) For further detail of Internal model, refer to the last paragraph of “Trading Account Assets and Liabilities—Trading Account Securities.”
F-151
MITSUBISHI UFJ FINANCIAL GROUP, INC. AND SUBSIDIARIES
NOTES TO CONSOLIDATED FINANCIAL STATEMENTS—(Continued)
Sensitivity to and range of unobservable inputs
Probability of default—Probability of default is an estimate of the likelihood that the default event willoccur and the MUFG Group will be unable to collect the contractual amounts. A significant increase (decrease)in the default rate would result in a significant decrease (increase) in a fair value through a decrease (increase) inthe estimated cash flows. Probability of default used in internal model of Residential mortgage-backed securities,Commercial mortgage-backed securities and Asset-backed securities represents that of underlying assets,whereas probability of default used in other valuation techniques represents the counterparty default risks,determined through the MUFG Group’s credit rating system.
The wide range of probability of default used in the internal model of Residential mortgage-backedsecurities, Commercial mortgage-backed securities and Asset-backed securities is mainly caused by Asset-backed securities. Asset-backed securities have a large number of underlying loans, mainly corporate loans, inseveral industries. The MUFG Group primarily makes investments in the senior tranches of such securities, withno investments in the equity portion. Thus, the MUFG Group’s investments have higher priority of paymentsthan mezzanine and equity and even if some of underlying loans become default, the MUFG Group may still beable to receive the full contractual payments.
For derivative contracts, the MUFG Group holds positions with a large number of counterparties withvarious credit quality, which results in wider range of probability of default. However, the majority ofcounterparties have higher ratings, categorized as “Normal” in the internal credit rating system, the inputs used toestimate fair value of derivative contracts are concentrated in the lower end of the range.
Discount factor and Liquidity premium—Discount factor and liquidity premium are adjustments todiscount rates to reflect uncertainty of cash flows and liquidity of the instruments. When recent prices of similarinstruments are unobservable in inactive or less active markets, discount rates are adjusted based on the facts andcircumstances of the markets including the availability of quotes and the time since the latest available quotes.A significant increase (decrease) in discount rate would result in a significant decrease (increase) in a fair value.
Recovery rate and Prepayment rate—Recovery rate is the proportion of the total outstanding balance of abond or loan that is expected to be collected in a liquidation scenario. For many debt securities (such asasset-backed securities), there is no directly observable market input for recovery, but indications of recoverylevels are available from third-party pricing services. The assumed recovery of a security may differ from itsactual recovery that will be observable in the future. Prepayment rate represents the proportion of principal that isexpected to be paid prematurely in each period on a security or pool of securities. Prepayment rates change thefuture cash flows for the investor and thereby change the fair value of the security. Recovery rate and prepaymentrate would affect estimation of future cash flows to a certain extent and changes in these inputs could result in asignificant increase or decrease in fair value.
Volatility—Volatility is a measure of the speed and severity of market price changes and is a key factor inpricing. Typically, instruments can become more expensive if volatility increases. A significant increase(decrease) in volatility would cause a significant increase (decrease) in the value of an option resulting in thesignificant increase (decrease) in fair value.
The level of volatility generally depends on the tenor of the underlying instrument and the strike price orlevel defined in the contract. Volatilities for certain combinations of tenor and strike price are not observable.The volatility inputs used to estimate fair value of interest rate contracts are distributed throughout the range.
F-152

MITSUBISHI UFJ FINANCIAL GROUP, INC. AND SUBSIDIARIES
NOTES TO CONSOLIDATED FINANCIAL STATEMENTS—(Continued)
Correlation—Correlation is a measure of the relationship between the movements of two variables (i.e. howthe change in one variable influences a change in the other variables). A variety of correlation-relatedassumptions are required for a wide range of instruments including foreign government and official institutionbonds, asset-backed securities, corporate bonds, derivatives and certain other instruments. In most cases,correlations used are not observable in the market and must be estimated using historical information. Changes incorrelation inputs can have a major impact, favorable or unfavorable, on the value of an instrument, dependingon its nature. In addition, the wide range of correlation inputs are primarily due to the complex and unique natureof these instruments. There are many different types of correlation inputs, including cross-asset correlation (suchas correlation between interest rate and equity), and same-asset correlation (such as correlation between interestrates). Correlation levels are highly dependent on market conditions and could have a relatively wide range oflevels within or across asset classes.
For interest rate contracts and foreign exchange contracts, the diversity in the portfolio held by the MUFGGroup is reflected in wide ranges of correlation, as the fair values of transactions with a variety of currencies andtenors are determined using several foreign exchange and interest rate curves. For equity derivative contracts, thewide range of correlation between interest rate and equity is primarily due to the large number of correlationpairs with different maturities of contracts. For credit derivative contracts, the wide range of correlation betweenunderlying assets is primarily due to factors such as reference assets with different maturities, capital structuresubordinations, and credit quality.
Term of litigation—Term of litigation is the estimated period until the resolution of a certain litigationmatter that relates to an issuer’s restricted shares (“Covered Litigation”) that the MUFG Group purchased, whichis referenced in certain swap transactions.
These swaps are valued using a discounted cash flow methodology and are dependent upon the finalresolution of the Covered Litigation. The settlement timing of the Covered Litigation is not observable in themarket, therefore the estimated term is classified as a level 3 input.
The restricted shares which the MUFG Group purchased will be convertible to listed shares of the issuer atthe end of the Covered Litigation. The restricted shares will be diluted dependent upon the settlement amount ofthe Covered Litigation and the dilution of the restricted shares is accomplished through an adjustment to theconversion rate of the restricted shares. In order to hedge the reduction of the conversion rate, the MUFG Groupentered into certain swaps with the seller which references the conversion rate. The value generated by thesetrades is subject to the ultimate term of the issuer’s litigation, subject to a minimum term referenced within thetrade contracts.
Market-required return on capital—Market-required return on capital is the return on capital expected bythe secondary market. A significant increase (decrease) in the market-required return on capital would result in asignificant decrease (increase) in a fair value of a financial asset.
Loan Price—Loan price refers to independent valuations which are supported by a number of third-partyquotes. A significant increase (decrease) in the loan price would result in a significant increase (decrease) in afair value of a financial asset.
Assets and Liabilities Measured at Fair Value on a Nonrecurring Basis
Certain assets and liabilities may be measured at fair value on a nonrecurring basis in periods subsequent totheir initial recognition. These assets are subject to fair value adjustments that result from the application of the
F-153
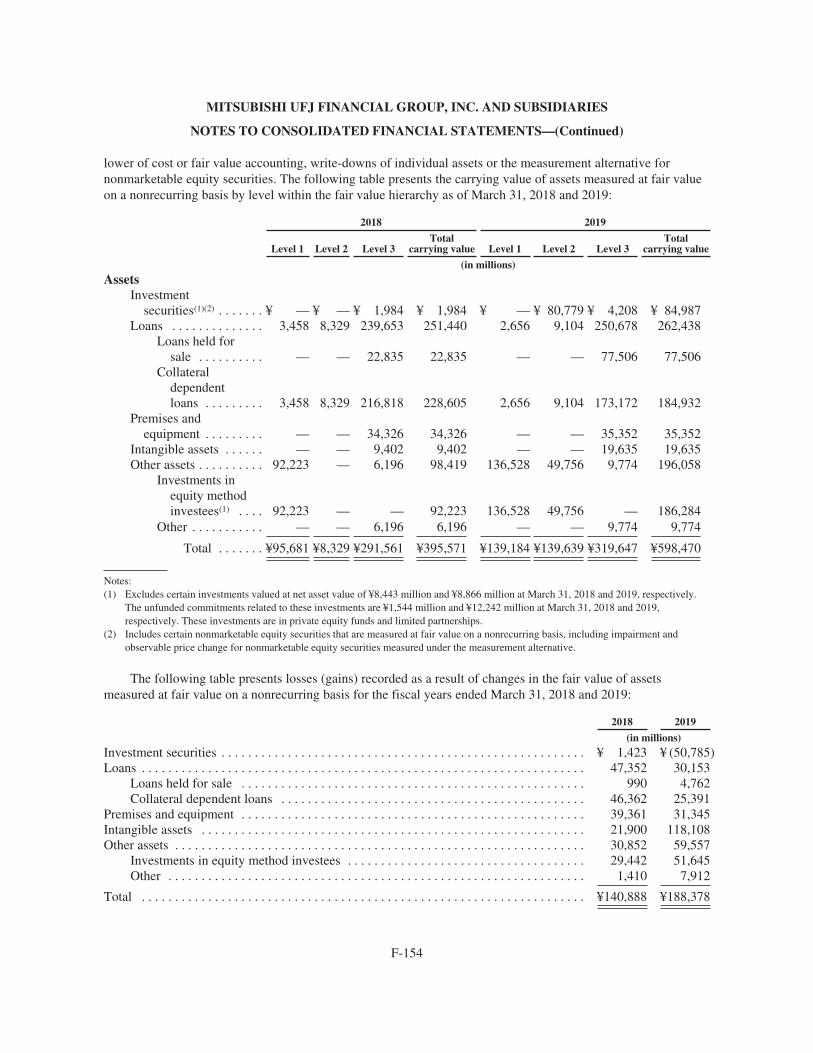
MITSUBISHI UFJ FINANCIAL GROUP, INC. AND SUBSIDIARIES
NOTES TO CONSOLIDATED FINANCIAL STATEMENTS—(Continued)
lower of cost or fair value accounting, write-downs of individual assets or the measurement alternative fornonmarketable equity securities. The following table presents the carrying value of assets measured at fair valueon a nonrecurring basis by level within the fair value hierarchy as of March 31, 2018 and 2019:
2018 2019
Level 1 Level 2 Level 3Total
carrying value Level 1 Level 2 Level 3Total
carrying value
(in millions)
AssetsInvestment
securities(1)(2) . . . . . . . ¥ — ¥ — ¥ 1,984 ¥ 1,984 ¥ — ¥ 80,779 ¥ 4,208 ¥ 84,987Loans . . . . . . . . . . . . . . 3,458 8,329 239,653 251,440 2,656 9,104 250,678 262,438
Loans held forsale . . . . . . . . . . — — 22,835 22,835 — — 77,506 77,506
Collateraldependentloans . . . . . . . . . 3,458 8,329 216,818 228,605 2,656 9,104 173,172 184,932
Premises andequipment . . . . . . . . . — — 34,326 34,326 — — 35,352 35,352
Intangible assets . . . . . . — — 9,402 9,402 — — 19,635 19,635Other assets . . . . . . . . . . 92,223 — 6,196 98,419 136,528 49,756 9,774 196,058
Investments inequity methodinvestees(1) . . . . 92,223 — — 92,223 136,528 49,756 — 186,284
Other . . . . . . . . . . . — — 6,196 6,196 — — 9,774 9,774
Total . . . . . . . ¥95,681 ¥8,329 ¥291,561 ¥395,571 ¥139,184 ¥139,639 ¥319,647 ¥598,470
Notes:(1) Excludes certain investments valued at net asset value of ¥8,443 million and ¥8,866 million at March 31, 2018 and 2019, respectively.
The unfunded commitments related to these investments are ¥1,544 million and ¥12,242 million at March 31, 2018 and 2019,respectively. These investments are in private equity funds and limited partnerships.
(2) Includes certain nonmarketable equity securities that are measured at fair value on a nonrecurring basis, including impairment andobservable price change for nonmarketable equity securities measured under the measurement alternative.
The following table presents losses (gains) recorded as a result of changes in the fair value of assetsmeasured at fair value on a nonrecurring basis for the fiscal years ended March 31, 2018 and 2019:
2018 2019
(in millions)
Investment securities . . . . . . . . . . . . . . . . . . . . . . . . . . . . . . . . . . . . . . . . . . . . . . . . . . . . . . . ¥ 1,423 ¥ (50,785)Loans . . . . . . . . . . . . . . . . . . . . . . . . . . . . . . . . . . . . . . . . . . . . . . . . . . . . . . . . . . . . . . . . . . . 47,352 30,153
Loans held for sale . . . . . . . . . . . . . . . . . . . . . . . . . . . . . . . . . . . . . . . . . . . . . . . . . . . . 990 4,762Collateral dependent loans . . . . . . . . . . . . . . . . . . . . . . . . . . . . . . . . . . . . . . . . . . . . . . 46,362 25,391
Premises and equipment . . . . . . . . . . . . . . . . . . . . . . . . . . . . . . . . . . . . . . . . . . . . . . . . . . . . 39,361 31,345Intangible assets . . . . . . . . . . . . . . . . . . . . . . . . . . . . . . . . . . . . . . . . . . . . . . . . . . . . . . . . . . 21,900 118,108Other assets . . . . . . . . . . . . . . . . . . . . . . . . . . . . . . . . . . . . . . . . . . . . . . . . . . . . . . . . . . . . . . 30,852 59,557
Investments in equity method investees . . . . . . . . . . . . . . . . . . . . . . . . . . . . . . . . . . . . 29,442 51,645Other . . . . . . . . . . . . . . . . . . . . . . . . . . . . . . . . . . . . . . . . . . . . . . . . . . . . . . . . . . . . . . . 1,410 7,912
Total . . . . . . . . . . . . . . . . . . . . . . . . . . . . . . . . . . . . . . . . . . . . . . . . . . . . . . . . . . . . . . . . . . . ¥140,888 ¥188,378
F-154

MITSUBISHI UFJ FINANCIAL GROUP, INC. AND SUBSIDIARIES
NOTES TO CONSOLIDATED FINANCIAL STATEMENTS—(Continued)
Investment securities for the year ended March 31, 2018 primarily include impaired cost-methodinvestments which were written down to fair value during the period. The fair values are determined based onrecent net asset value and projected future cash flows of investees. Investment securities for the year endedMarch 31, 2019 primarily include nonmarketable equity securities measured under the measurement alternative.See Note 3 for the details of the measurement alternative.
Loans include loans held for sale and collateral dependent loans. Loans held for sale are recorded at thelower of cost or estimated fair value. The fair value of the loans held for sale is based on secondary marketprices, recent transactions or discounted cash flows. These loans are principally classified in Level 3 of the fairvalue hierarchy, and when quoted prices are available but not traded actively, such loans held for sale areclassified in Level 2 of the fair value hierarchy. Collateral dependent loans are measured at fair value of theunderlying collateral. Collateral is comprised mainly of real estate and exchange-traded equity securities. TheMUFG Group maintains an established process for internally determining the fair value of real estate, using thefollowing valuation techniques and assumptions. Collateral dependent loans that are measured based onunderlying real estate collateral are classified in Level 3 of the fair value hierarchy.
‰ Replacement cost approach. The replacement cost approach is primarily used for buildings and the landthey are built on. This approach calculates the fair value of the collateral using the replacement cost ofthe property as of the valuation date. Replacement cost tables and useful life tables used for thisapproach are developed by subsidiaries of MUFG.
‰ Sales comparison approach. The sales comparison approach is mainly used for land. The fair value ofthe collateral located in Japan is based on Japanese government official land prices and standard landprices, considering the results of comparison analysis between the official roadside value which is usedfor tax purposes and the related government official land and standard land prices.
‰ Income approach. The income approach is, as a general rule, applied to all rental properties based on thehighest and best use concept. This approach calculates the fair value of the collateral using expectedfuture cash flows. In this approach, the expected annual net operating income is discounted using therelated capitalization yield. The significant assumptions within the income approach are the expectedannual net operating income and capitalization yield. The expected annual net operating income isestimated based on rental income of the property. The capitalization yield is determined based on thelocation and use of the property by subsidiaries of MUFG. The capitalization yield may be adjusted toreflect the trends in locations, occupancy rates and rent level and other factors.
Premises and equipment consist of those assets which were written down to fair value. The fair values aredetermined based on prices obtained from an appraiser or discounted cash flows. These impaired premises andequipment are classified as Level 3 of the fair value hierarchy.
Intangible assets consist of those assets which were written down to fair value. The fair values aredetermined based on discounted cash flows. These impaired intangible assets are classified as Level 3 of the fairvalue hierarchy.
Other assets mainly consist of investments in equity method investees which were written down to fair valuedue to impairment. When investments in equity method investees are marketable equity securities, the fair valuesare determined based on quoted prices. Impaired investments in equity method investees which are marketableequity securities are classified in either Level 1 or Level 2 of the fair value hierarchy. When investments inequity method investees are nonmarketable equity securities, the fair values are determined using the samemethodologies as those for impaired nonmarketable equity securities described above. Impaired investments inequity method investees which are nonmarketable equity securities are classified in Level 3 of the fair valuehierarchy.
F-155

MITSUBISHI UFJ FINANCIAL GROUP, INC. AND SUBSIDIARIES
NOTES TO CONSOLIDATED FINANCIAL STATEMENTS—(Continued)
Fair Value Option
The MUFG Group elected the fair value option for foreign currency-denominated debt securities and equitysecurities held by MUFG Bank and Mitsubishi UFJ Trust and Banking. The election was made to mitigateaccounting mismatches related to fluctuations of foreign exchange rates by allowing the gains and losses ontranslation of these securities to be included in current earnings. The gains and losses on translation of debtsecurities without the fair value option, are included in OCI, while the gains and losses on translation of foreigncurrency-denominated financial liabilities are included in current earnings. As a result of adopting the newguidance issued in January 2016, as described in Note 1, the gains and losses on change in fair value of equitysecurities with or without fair value option are included in current earnings.
The MUFG Group also elected the fair value option for certain financial instruments held by Mitsubishi UFJSecurities Holdings’s foreign subsidiaries because those financial instruments are managed on a fair value basis,and these exposures are considered to be trading-related positions. These financial assets are included in Otherassets. These financial liabilities are mainly included in Other short-term borrowings and Long-term debt.Unrealized gains and losses on such financial instruments are recognized in the accompanying consolidatedstatements of income.
The following table presents the gains or losses recorded for the fiscal years ended March 31, 2017, 2018and 2019 related to the eligible instruments for which the MUFG Group elected the fair value option:
2017 2018 2019
Tradingaccount
profits (losses)
Foreignexchange
gains (losses)
Totalchanges infair value
Tradingaccount
profits (losses)
Foreignexchange
gains (losses)
Totalchanges infair value
Tradingaccount
profits (losses)
Foreignexchange
gains (losses)
Totalchanges infair value
(in millions)
Financial assets:Trading account
securities(1) . . . . . ¥(464,947) ¥(407,439) ¥(872,386) ¥(148,242) ¥(267,507) ¥(415,749) ¥208,952 ¥186,578 ¥395,530
Total . . . . . . . . ¥(464,947) ¥(407,439) ¥(872,386) ¥(148,242) ¥(267,507) ¥(415,749) ¥208,952 ¥186,578 ¥395,530
Financial liabilities:Other short-term
borrowings(2) . . . . ¥ (10,380) ¥ — ¥ (10,380) ¥ 5,902 ¥ — ¥ 5,902 ¥ (5,559) ¥ — ¥ (5,559)Long-term debt(2) . . (93,464) — (93,464) 7,554 — 7,554 (8,322) — (8,322)
Total . . . . . . . . ¥(103,844) ¥ — ¥(103,844) ¥ 13,456 ¥ — ¥ 13,456 ¥ (13,881) ¥ — ¥ (13,881)
Notes:(1) Excludes Danamon’s equity securities. See Note 2 for reference.(2) Change in value attributable to the instrument-specific credit risk related to those financial liabilities are not material.
F-156

MITSUBISHI UFJ FINANCIAL GROUP, INC. AND SUBSIDIARIES
NOTES TO CONSOLIDATED FINANCIAL STATEMENTS—(Continued)
The following table presents the differences between the aggregate fair value and the aggregate remainingcontractual principal balance outstanding as of March 31, 2018 and 2019 for long-term debt instruments forwhich the fair value option has been elected:
2018 2019
Remainingaggregate
contractualamounts
outstanding Fair value
Fair valueover (under)remainingaggregate
contractualamounts
outstanding
Remainingaggregate
contractualamounts
outstanding Fair value
Fair valueover (under)remainingaggregate
contractualamounts
outstanding
(in millions)Financial liabilities:
Long-term debt . . . . . . . . . . . . ¥347,002 ¥333,985 ¥(13,017) ¥358,730 ¥325,808 ¥ (32,922)
Total . . . . . . . . . . . . . . . . . ¥347,002 ¥333,985 ¥(13,017) ¥358,730 ¥325,808 ¥ (32,922)
Interest income and expense related to the assets and liabilities for which the fair value option is elected aremeasured based on the contractual rates and dividend income related to these assets are recognized when theshareholder right to receive the dividend is established. These interest income and expense and dividend incomeare reported in the accompanying consolidated statements of income as either interest income or expense,depending on the nature of the related asset or liability.
F-157

MITSUBISHI UFJ FINANCIAL GROUP, INC. AND SUBSIDIARIES
NOTES TO CONSOLIDATED FINANCIAL STATEMENTS—(Continued)
Estimated Fair Value of Financial Instruments
The following is a summary of carrying amounts and estimated fair values by level within the fair valuehierarchy of financial instruments which are not carried at fair value on a recurring basis in the accompanyingconsolidated balance sheets as of March 31, 2018 and 2019:
Carryingamount
Estimated fair value
At March 31, 2018 Total Level 1 Level 2 Level 3
(in billions)
Financial assets:Cash and due from banks . . . . . . . . . . . . . . . . . . . . ¥ 32,648 ¥ 32,648 ¥32,648 ¥ — ¥ —Interest-earning deposits in other banks . . . . . . . . . 43,210 43,210 — 43,210 —Call loans and funds sold . . . . . . . . . . . . . . . . . . . . 896 896 — 896 —Receivables under resale agreements . . . . . . . . . . . 5,726 5,726 — 5,726 —Receivables under securities borrowing
transactions . . . . . . . . . . . . . . . . . . . . . . . . . . . . . 9,269 9,269 — 9,269 —Investment securities(1)(2) . . . . . . . . . . . . . . . . . . . . 3,684 3,797 1,197 1,051 1,549Loans, net of allowance for credit losses(3) . . . . . . 116,272 117,753 3 330 117,420Other financial assets(4) . . . . . . . . . . . . . . . . . . . . . 7,000 7,000 — 7,000 —
Financial liabilities:Deposits
Non-interest-bearing . . . . . . . . . . . . . . . . . . . . ¥ 29,862 ¥ 29,862 ¥ — ¥ 29,862 ¥ —Interest-bearing . . . . . . . . . . . . . . . . . . . . . . . . 165,831 165,825 — 165,825 —
Total deposits . . . . . . . . . . . . . . . . . . . . . 195,693 195,687 — 195,687 —Call money and funds purchased . . . . . . . . . . . . . . 2,453 2,453 — 2,453 —Payables under repurchase agreements . . . . . . . . . 18,135 18,135 — 18,135 —Payables under securities lending transactions . . . 8,170 8,170 — 8,170 —Due to trust account . . . . . . . . . . . . . . . . . . . . . . . . 3,386 3,386 — 3,386 —Other short-term borrowings . . . . . . . . . . . . . . . . . 6,617 6,617 — 6,617 —Long-term debt . . . . . . . . . . . . . . . . . . . . . . . . . . . . 26,861 26,919 — 26,919 —Other financial liabilities . . . . . . . . . . . . . . . . . . . . 6,642 6,642 — 6,642 —
F-158
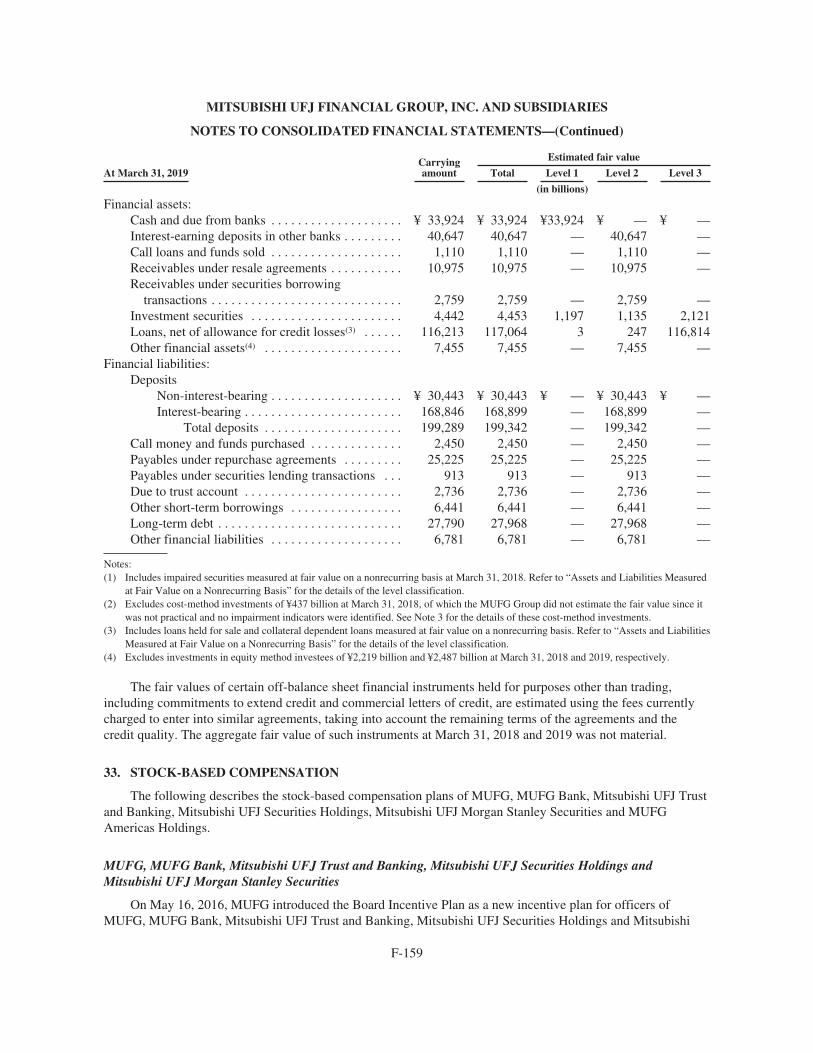
MITSUBISHI UFJ FINANCIAL GROUP, INC. AND SUBSIDIARIES
NOTES TO CONSOLIDATED FINANCIAL STATEMENTS—(Continued)
Carryingamount
Estimated fair value
At March 31, 2019 Total Level 1 Level 2 Level 3
(in billions)
Financial assets:Cash and due from banks . . . . . . . . . . . . . . . . . . . . ¥ 33,924 ¥ 33,924 ¥33,924 ¥ — ¥ —Interest-earning deposits in other banks . . . . . . . . . 40,647 40,647 — 40,647 —Call loans and funds sold . . . . . . . . . . . . . . . . . . . . 1,110 1,110 — 1,110 —Receivables under resale agreements . . . . . . . . . . . 10,975 10,975 — 10,975 —Receivables under securities borrowing
transactions . . . . . . . . . . . . . . . . . . . . . . . . . . . . . 2,759 2,759 — 2,759 —Investment securities . . . . . . . . . . . . . . . . . . . . . . . 4,442 4,453 1,197 1,135 2,121Loans, net of allowance for credit losses(3) . . . . . . 116,213 117,064 3 247 116,814Other financial assets(4) . . . . . . . . . . . . . . . . . . . . . 7,455 7,455 — 7,455 —
Financial liabilities:Deposits
Non-interest-bearing . . . . . . . . . . . . . . . . . . . . ¥ 30,443 ¥ 30,443 ¥ — ¥ 30,443 ¥ —Interest-bearing . . . . . . . . . . . . . . . . . . . . . . . . 168,846 168,899 — 168,899 —
Total deposits . . . . . . . . . . . . . . . . . . . . . 199,289 199,342 — 199,342 —Call money and funds purchased . . . . . . . . . . . . . . 2,450 2,450 — 2,450 —Payables under repurchase agreements . . . . . . . . . 25,225 25,225 — 25,225 —Payables under securities lending transactions . . . 913 913 — 913 —Due to trust account . . . . . . . . . . . . . . . . . . . . . . . . 2,736 2,736 — 2,736 —Other short-term borrowings . . . . . . . . . . . . . . . . . 6,441 6,441 — 6,441 —Long-term debt . . . . . . . . . . . . . . . . . . . . . . . . . . . . 27,790 27,968 — 27,968 —Other financial liabilities . . . . . . . . . . . . . . . . . . . . 6,781 6,781 — 6,781 —
Notes:(1) Includes impaired securities measured at fair value on a nonrecurring basis at March 31, 2018. Refer to “Assets and Liabilities Measured
at Fair Value on a Nonrecurring Basis” for the details of the level classification.(2) Excludes cost-method investments of ¥437 billion at March 31, 2018, of which the MUFG Group did not estimate the fair value since it
was not practical and no impairment indicators were identified. See Note 3 for the details of these cost-method investments.(3) Includes loans held for sale and collateral dependent loans measured at fair value on a nonrecurring basis. Refer to “Assets and Liabilities
Measured at Fair Value on a Nonrecurring Basis” for the details of the level classification.(4) Excludes investments in equity method investees of ¥2,219 billion and ¥2,487 billion at March 31, 2018 and 2019, respectively.
The fair values of certain off-balance sheet financial instruments held for purposes other than trading,including commitments to extend credit and commercial letters of credit, are estimated using the fees currentlycharged to enter into similar agreements, taking into account the remaining terms of the agreements and thecredit quality. The aggregate fair value of such instruments at March 31, 2018 and 2019 was not material.
33. STOCK-BASED COMPENSATION
The following describes the stock-based compensation plans of MUFG, MUFG Bank, Mitsubishi UFJ Trustand Banking, Mitsubishi UFJ Securities Holdings, Mitsubishi UFJ Morgan Stanley Securities and MUFGAmericas Holdings.
MUFG, MUFG Bank, Mitsubishi UFJ Trust and Banking, Mitsubishi UFJ Securities Holdings andMitsubishi UFJ Morgan Stanley Securities
On May 16, 2016, MUFG introduced the Board Incentive Plan as a new incentive plan for officers ofMUFG, MUFG Bank, Mitsubishi UFJ Trust and Banking, Mitsubishi UFJ Securities Holdings and Mitsubishi
F-159

MITSUBISHI UFJ FINANCIAL GROUP, INC. AND SUBSIDIARIES
NOTES TO CONSOLIDATED FINANCIAL STATEMENTS—(Continued)
UFJ Morgan Stanley Securities. On November 14, 2016, MUFG expanded the Board Incentive Plan to officerswho hold unexercised Stock Acquisition Rights granted under the Stock Option Plan. As a result of thistransaction, the Stock Option Plan remains available to officers who are on overseas assignment as of thetransition date and hold unexercised Stock Acquisition Rights. This transition which consists of the exchange ofunexercised Stock Acquisition Rights for common share of MUFG under the Board Incentive Plan was treated asmodification of the Stock Option Plan for accounting purpose and incremental compensation cost resulting fromthe modification was ¥2,028 million.
Stock Option Plan
MUFG, MUFG Bank, Mitsubishi UFJ Trust and Banking, Mitsubishi UFJ Securities Holdings andMitsubishi UFJ Morgan Stanley Securities have the Stock Option Plan.
The Stock Acquisition Rights under the Stock Option Plan were normally issued and granted to officersonce a year until the fiscal year ended March 31, 2013. They were normally issued and granted to officers exceptfor outside directors and corporate auditors once a year from the fiscal year ended March 31, 2014.
The class of shares to be issued or transferred upon exercise of the Stock Acquisition Rights is commonshares of MUFG. The number of shares to be issued or transferred upon exercise of each Stock Acquisition Right(“number of granted shares”) is 100 common shares of MUFG. In the event of a stock split or reverse stock splitof common shares of MUFG, the number of granted shares shall be adjusted in accordance with the ratio of thestock split or reverse stock split. If any events occur that require the adjustment to the number of granted shares(e.g., mergers, consolidations, corporate separations or capital reductions of MUFG), MUFG shall appropriatelyadjust the number of granted shares to a reasonable extent.
The contractual term of the Stock Acquisition Rights is approximately 30 years from the date of grant. Someof the Stock Acquisition Rights vest on the date of grant and the rest of the Stock Acquisition Rights granted vestdepending on the holders’ service periods as officers.
The Stock Acquisition Rights are only exercisable after the date on which the following conditions are met:(1) holder as a director, a corporate executive or an executive officer is no longer a director, a corporateexecutive and an executive officer, and (2) holder as a corporate auditor is no longer a corporate auditor, and(3) holder as a senior fellow is no longer a senior fellow. The exercise price is ¥1 per share.
The following is a summary of the Stock Acquisition Rights transactions of MUFG, MUFG Bank,Mitsubishi UFJ Trust and Banking, Mitsubishi UFJ Securities Holdings and Mitsubishi UFJ Morgan StanleySecurities for the fiscal year ended March 31, 2019:
Number ofshares
Weighted averageexercise price
Weighted averageremaining
contractual termAggregate
intrinsic value
(in years) (in millions)
Outstanding, beginning of fiscal year . . . . . . . 606,400 ¥ 1Transitioned to the Board
Incentive Plan(1) . . . . . . . . . . . . . . . . . . (121,100) 1
Outstanding, end of fiscal year . . . . . . . . . . . . 485,300 ¥ 1 22.86 ¥266
Exercisable, end of fiscal year . . . . . . . . . . . . — ¥ — — ¥ —
F-160

MITSUBISHI UFJ FINANCIAL GROUP, INC. AND SUBSIDIARIES
NOTES TO CONSOLIDATED FINANCIAL STATEMENTS—(Continued)
Notes:(1) All shares transitioned to the Board Incentive Plan were granted and vested. See the explanation of the following item, The Board
Incentive Plan, for more information.(2) There were no issuances under the Stock Option Plan during the fiscal years ended March 31, 2017, 2018 and 2019.
The MUFG Group recognized ¥252 million of compensation costs related to the Stock Acquisition Rightswith ¥77 million of the corresponding tax benefit for the fiscal year ended March 31, 2017.
Cash received from the exercise of the Stock Acquisition Rights for the fiscal years ended March 31, 2017and 2018 was ¥4 million and ¥0 million, respectively. The actual tax benefit realized for the tax deductions fromexercise of the Stock Acquisition Rights for the fiscal years ended March 31, 2017 and 2018 was ¥651 millionand ¥2 million, respectively.
The Board Incentive Plan
On May 16, 2016, MUFG’s compensation committee approved the introduction of a Board Incentive Planas a new incentive plan for officers and covers the fiscal years corresponding to the medium-term business planof MUFG under which common shares of MUFG and cash equivalent to the liquidation value of the commonshares of MUFG together with dividends attributable to the common shares of MUFG are delivered and/orprovided as compensation. The Board Incentive Plan uses the trust structure called a Board Incentive Plan Trust(“the BIP Trust”) and was authorized to purchase up to ¥15,800 million common shares of MUFG in the openmarket. The BIP Trust initially consisted of the BIP Trust I and the BIP Trust II and started on May 17, 2016,with the expiration date of August 31, 2018. These trusts period may be extended through the modification of thetrust agreement and additional contributions to the trust.
On November 14, 2016, MUFG’s compensation committee also approved the introduction of the BIPTrust III, using the same structure as above for officers to implement the transition from the Stock Option Planunder which Stock Acquisition Rights had previously been granted but have not been exercised by officers to theBoard Incentive Plan. The BIP Trust III was authorized to purchase up to ¥8,100 million common shares ofMUFG in the open market. In addition, on May 15, 2017, The BIP Trust III was also authorized to additionalpurchase and was revised amount of trust money up to ¥9,600 million common shares of MUFG. The BIP TrustIII started on November 15, 2016 and will end on November 30, 2019. If any beneficiary under the BIP Trust IIIremains as active officers at the initial expiration date, the trust period will be extended for additional three years.The extension of the trust period will be made in the same manner up to 30 years.
On May 15, 2018, MUFG’s compensation committee approved to continue with the Board Incentive Planwith amending it in part. As a result, the BIP Trust I and the BIP Trust II will be continued to August 31, 2021 byextending the trust period as approved at the compensation committee’s meeting. MUFG also approved to revisethe limited amount of trust money for the BIP Trust I and the BIP Trust II up to ¥16,700 million from¥15,800 million.
MUFG funded and established the BIP Trust, and from time to time, make contributions to the BIP Trustwhose beneficiaries are officers of MUFG, MUFG Bank, Mitsubishi UFJ Trust and Banking, Mitsubishi UFJSecurities Holdings and Mitsubishi UFJ Morgan Stanley Securities within the limit approved by MUFG’scompensation committee. MUFG Bank, Mitsubishi UFJ Trust and Banking, Mitsubishi UFJ Securities Holdingsand Mitsubishi UFJ Morgan Stanley Securities also reimburse MUFG for its contributions to the BIP Trust. Thetrustee of the BIP Trusts, Mitsubishi UFJ Trust and Banking, acquires common shares of MUFG in the openmarket in accordance with the instructions from the trust administrator, who is a third party that does not haveany interest in MUFG, MUFG Bank, Mitsubishi UFJ Trust and Banking, Mitsubishi UFJ Securities Holdings andMitsubishi UFJ Morgan Stanley Securities.
F-161
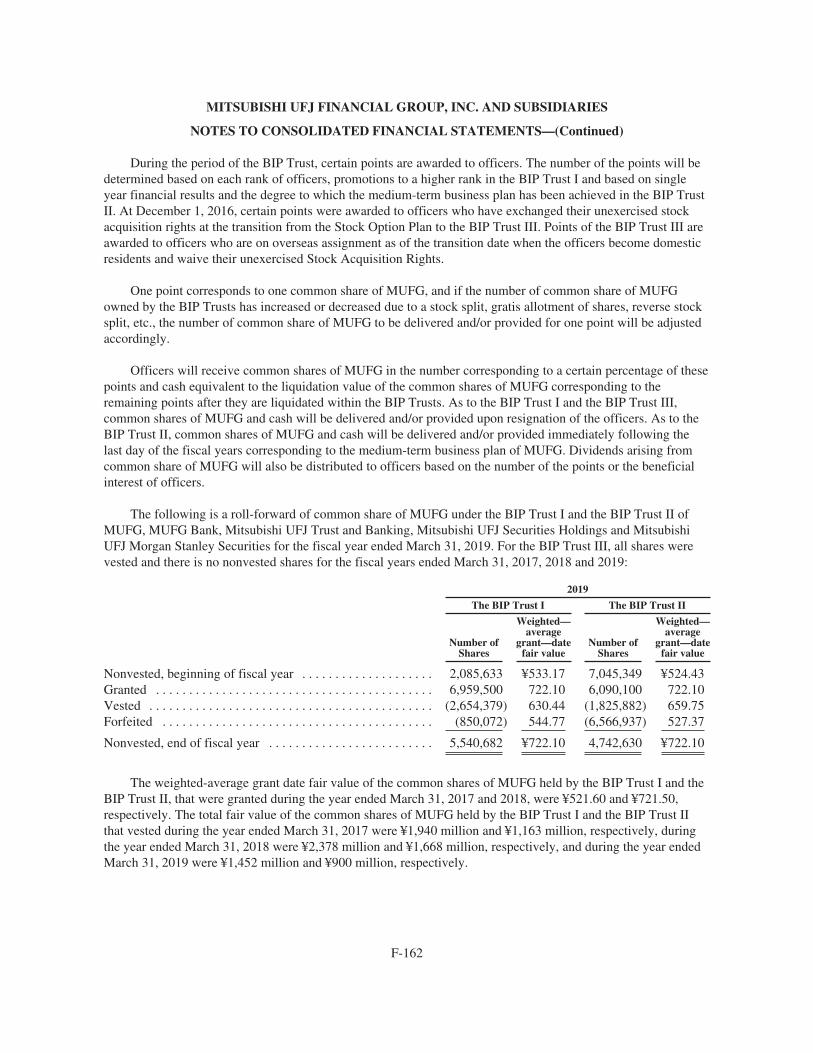
MITSUBISHI UFJ FINANCIAL GROUP, INC. AND SUBSIDIARIES
NOTES TO CONSOLIDATED FINANCIAL STATEMENTS—(Continued)
During the period of the BIP Trust, certain points are awarded to officers. The number of the points will bedetermined based on each rank of officers, promotions to a higher rank in the BIP Trust I and based on singleyear financial results and the degree to which the medium-term business plan has been achieved in the BIP TrustII. At December 1, 2016, certain points were awarded to officers who have exchanged their unexercised stockacquisition rights at the transition from the Stock Option Plan to the BIP Trust III. Points of the BIP Trust III areawarded to officers who are on overseas assignment as of the transition date when the officers become domesticresidents and waive their unexercised Stock Acquisition Rights.
One point corresponds to one common share of MUFG, and if the number of common share of MUFGowned by the BIP Trusts has increased or decreased due to a stock split, gratis allotment of shares, reverse stocksplit, etc., the number of common share of MUFG to be delivered and/or provided for one point will be adjustedaccordingly.
Officers will receive common shares of MUFG in the number corresponding to a certain percentage of thesepoints and cash equivalent to the liquidation value of the common shares of MUFG corresponding to theremaining points after they are liquidated within the BIP Trusts. As to the BIP Trust I and the BIP Trust III,common shares of MUFG and cash will be delivered and/or provided upon resignation of the officers. As to theBIP Trust II, common shares of MUFG and cash will be delivered and/or provided immediately following thelast day of the fiscal years corresponding to the medium-term business plan of MUFG. Dividends arising fromcommon share of MUFG will also be distributed to officers based on the number of the points or the beneficialinterest of officers.
The following is a roll-forward of common share of MUFG under the BIP Trust I and the BIP Trust II ofMUFG, MUFG Bank, Mitsubishi UFJ Trust and Banking, Mitsubishi UFJ Securities Holdings and MitsubishiUFJ Morgan Stanley Securities for the fiscal year ended March 31, 2019. For the BIP Trust III, all shares werevested and there is no nonvested shares for the fiscal years ended March 31, 2017, 2018 and 2019:
2019
The BIP Trust I The BIP Trust II
Number ofShares
Weighted—average
grant—datefair value
Number ofShares
Weighted—average
grant—datefair value
Nonvested, beginning of fiscal year . . . . . . . . . . . . . . . . . . . . 2,085,633 ¥533.17 7,045,349 ¥524.43Granted . . . . . . . . . . . . . . . . . . . . . . . . . . . . . . . . . . . . . . . . . . 6,959,500 722.10 6,090,100 722.10Vested . . . . . . . . . . . . . . . . . . . . . . . . . . . . . . . . . . . . . . . . . . . (2,654,379) 630.44 (1,825,882) 659.75Forfeited . . . . . . . . . . . . . . . . . . . . . . . . . . . . . . . . . . . . . . . . . (850,072) 544.77 (6,566,937) 527.37
Nonvested, end of fiscal year . . . . . . . . . . . . . . . . . . . . . . . . . 5,540,682 ¥722.10 4,742,630 ¥722.10
The weighted-average grant date fair value of the common shares of MUFG held by the BIP Trust I and theBIP Trust II, that were granted during the year ended March 31, 2017 and 2018, were ¥521.60 and ¥721.50,respectively. The total fair value of the common shares of MUFG held by the BIP Trust I and the BIP Trust IIthat vested during the year ended March 31, 2017 were ¥1,940 million and ¥1,163 million, respectively, duringthe year ended March 31, 2018 were ¥2,378 million and ¥1,668 million, respectively, and during the year endedMarch 31, 2019 were ¥1,452 million and ¥900 million, respectively.
F-162

MITSUBISHI UFJ FINANCIAL GROUP, INC. AND SUBSIDIARIES
NOTES TO CONSOLIDATED FINANCIAL STATEMENTS—(Continued)
The following is a summary of compensation costs, the corresponding tax benefit under the BIP Trust forthe fiscal year ended March 31, 2017, 2018 and 2019 and unrecognized compensation costs as of March 31,2017, 2018 and 2019:
2017 2018 2019
The BIPTrust I
The BIPTrust II
The BIPTrust III
The BIPTrust I
The BIPTrust II
The BIPTrust III
The BIPTrust I
The BIPTrust II
The BIPTrust III
(in millions)
Compensation costs . . . . . . . . . . . ¥1,238 ¥1,039 ¥2,112 ¥2,514 ¥1,452 ¥218 ¥1,601 ¥723 ¥520Tax benefit . . . . . . . . . . . . . . . . . . 379 318 385 770 445 67 490 221 159Unrecognized compensation
costs . . . . . . . . . . . . . . . . . . . . . 1,617 346 — 396 360 — 2,604 182 —
Unrecognized compensation costs are expected to be recognized over a weighted-average period of2.3 years for the BIP Trust I and 0.3 years for the BIP Trust II.
MUFG Americas Holdings
MUFG Americas Holdings adopted the MUAH Plan on June 8, 2015. Under the MUAH Plan, MUFGAmericas Holdings grants restricted stock units settled in ADRs representing shares of common stock of MUFGto key employees at the discretion of the Human Capital Committee of the Board of Directors (“the Committee”).The Committee determines the number of shares, vesting requirements and other features and conditions of therestricted stock units. Under the MUAH Plan, MUFG ADRs are purchased in the open market upon the vestingof the restricted stock units, through a revocable trust. There is no amount authorized to be issued under theMUAH Plan since all shares are purchased in the open market. These awards generally vest pro-rata on eachanniversary of the grant date and become fully vested three years from the grant date, provided that the employeehas completed the specified continuous service requirement. Generally, the grants vest earlier if the employeedies, is permanently and totally disabled, retires under certain grant, age and service conditions, or terminatesemployment under certain conditions. MUFG Americas Holdings also issues a small number of off-cycle grantseach year, primarily for reasons related to recruitment of new employees. The weighted-average service periodfor grants issued under the MUAH Plan with outstanding restricted stock units as of December 31, 2018 was3.0 years.
Participants in the MUAH Plan are entitled to “dividend equivalent credits” on their unvested restrictedstock units when MUFG pays dividends to its shareholders. The credit is equal to the dividends that theparticipants would have received on the shares had the shares been issued to the participants when the restrictedstock units were granted. “Dividend equivalent credits” arising from grants under the MUAH Plan are paid toparticipants in shares on an annual basis.
F-163
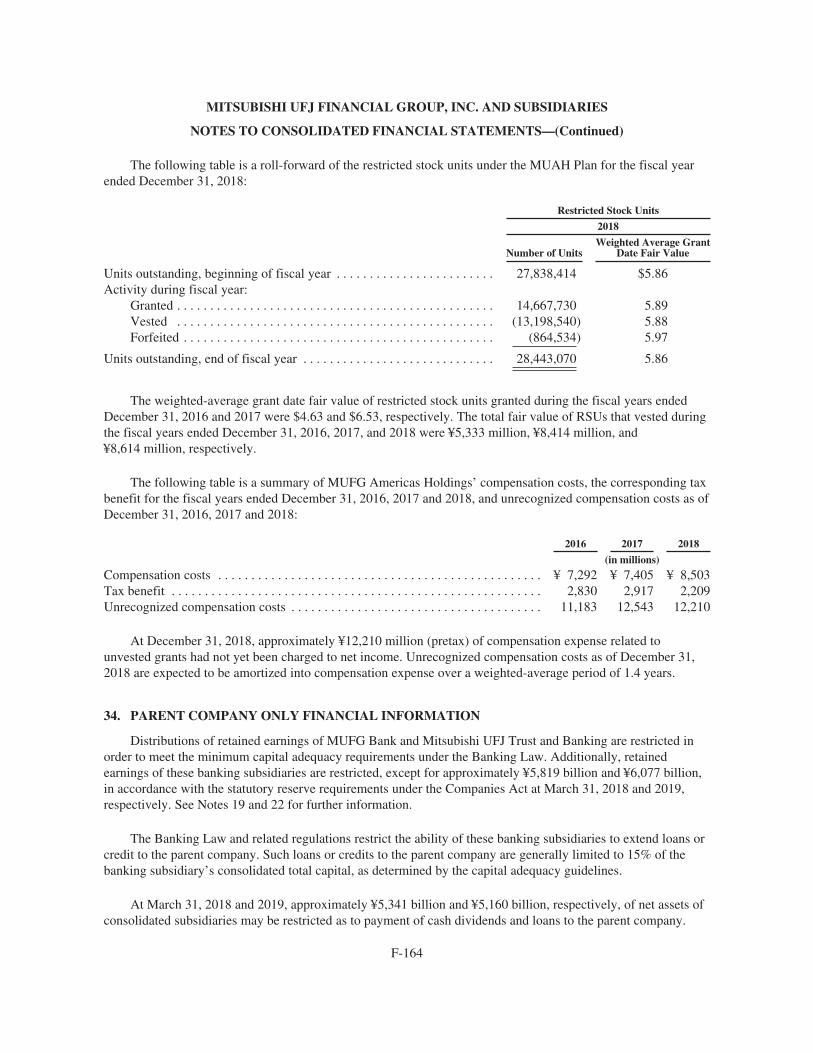
MITSUBISHI UFJ FINANCIAL GROUP, INC. AND SUBSIDIARIES
NOTES TO CONSOLIDATED FINANCIAL STATEMENTS—(Continued)
The following table is a roll-forward of the restricted stock units under the MUAH Plan for the fiscal yearended December 31, 2018:
Restricted Stock Units
2018
Number of UnitsWeighted Average Grant
Date Fair Value
Units outstanding, beginning of fiscal year . . . . . . . . . . . . . . . . . . . . . . . . 27,838,414 $5.86Activity during fiscal year:
Granted . . . . . . . . . . . . . . . . . . . . . . . . . . . . . . . . . . . . . . . . . . . . . . . . 14,667,730 5.89Vested . . . . . . . . . . . . . . . . . . . . . . . . . . . . . . . . . . . . . . . . . . . . . . . . (13,198,540) 5.88Forfeited . . . . . . . . . . . . . . . . . . . . . . . . . . . . . . . . . . . . . . . . . . . . . . . (864,534) 5.97
Units outstanding, end of fiscal year . . . . . . . . . . . . . . . . . . . . . . . . . . . . . 28,443,070 5.86
The weighted-average grant date fair value of restricted stock units granted during the fiscal years endedDecember 31, 2016 and 2017 were $4.63 and $6.53, respectively. The total fair value of RSUs that vested duringthe fiscal years ended December 31, 2016, 2017, and 2018 were ¥5,333 million, ¥8,414 million, and¥8,614 million, respectively.
The following table is a summary of MUFG Americas Holdings’ compensation costs, the corresponding taxbenefit for the fiscal years ended December 31, 2016, 2017 and 2018, and unrecognized compensation costs as ofDecember 31, 2016, 2017 and 2018:
2016 2017 2018
(in millions)
Compensation costs . . . . . . . . . . . . . . . . . . . . . . . . . . . . . . . . . . . . . . . . . . . . . . . . . ¥ 7,292 ¥ 7,405 ¥ 8,503Tax benefit . . . . . . . . . . . . . . . . . . . . . . . . . . . . . . . . . . . . . . . . . . . . . . . . . . . . . . . . 2,830 2,917 2,209Unrecognized compensation costs . . . . . . . . . . . . . . . . . . . . . . . . . . . . . . . . . . . . . . 11,183 12,543 12,210
At December 31, 2018, approximately ¥12,210 million (pretax) of compensation expense related tounvested grants had not yet been charged to net income. Unrecognized compensation costs as of December 31,2018 are expected to be amortized into compensation expense over a weighted-average period of 1.4 years.
34. PARENT COMPANY ONLY FINANCIAL INFORMATION
Distributions of retained earnings of MUFG Bank and Mitsubishi UFJ Trust and Banking are restricted inorder to meet the minimum capital adequacy requirements under the Banking Law. Additionally, retainedearnings of these banking subsidiaries are restricted, except for approximately ¥5,819 billion and ¥6,077 billion,in accordance with the statutory reserve requirements under the Companies Act at March 31, 2018 and 2019,respectively. See Notes 19 and 22 for further information.
The Banking Law and related regulations restrict the ability of these banking subsidiaries to extend loans orcredit to the parent company. Such loans or credits to the parent company are generally limited to 15% of thebanking subsidiary’s consolidated total capital, as determined by the capital adequacy guidelines.
At March 31, 2018 and 2019, approximately ¥5,341 billion and ¥5,160 billion, respectively, of net assets ofconsolidated subsidiaries may be restricted as to payment of cash dividends and loans to the parent company.
F-164
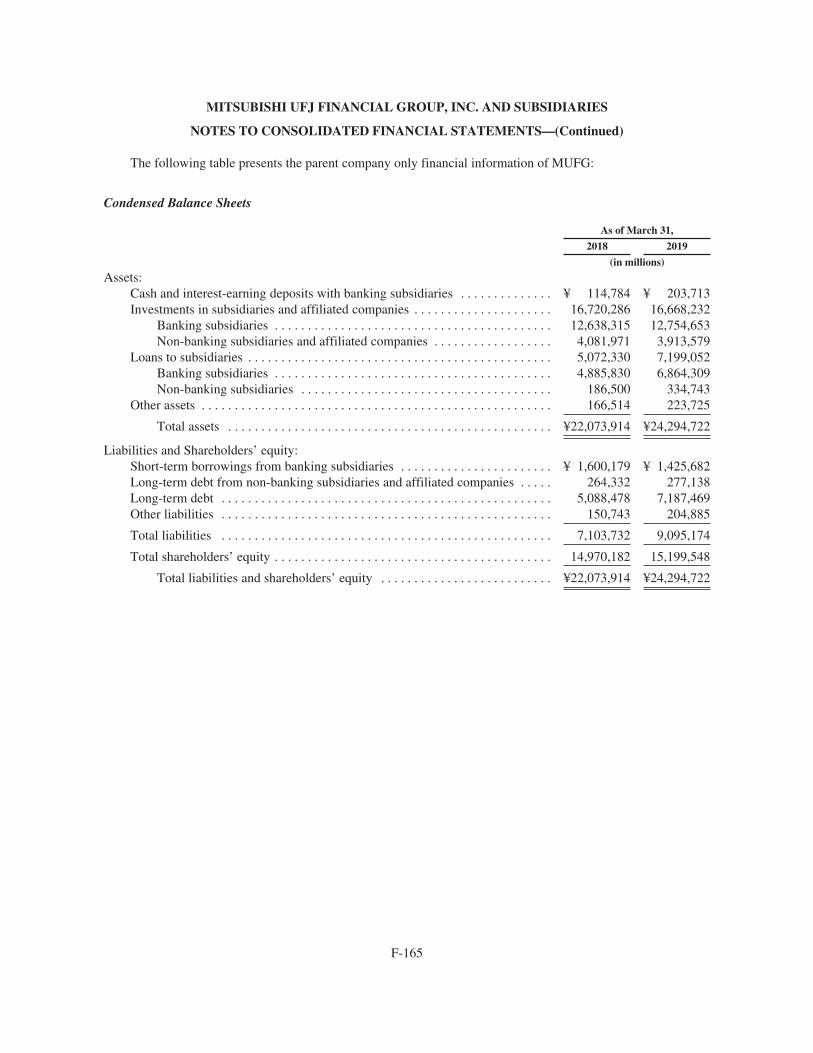
MITSUBISHI UFJ FINANCIAL GROUP, INC. AND SUBSIDIARIES
NOTES TO CONSOLIDATED FINANCIAL STATEMENTS—(Continued)
The following table presents the parent company only financial information of MUFG:
Condensed Balance Sheets
As of March 31,
2018 2019
(in millions)
Assets:Cash and interest-earning deposits with banking subsidiaries . . . . . . . . . . . . . . ¥ 114,784 ¥ 203,713Investments in subsidiaries and affiliated companies . . . . . . . . . . . . . . . . . . . . . 16,720,286 16,668,232
Banking subsidiaries . . . . . . . . . . . . . . . . . . . . . . . . . . . . . . . . . . . . . . . . . . 12,638,315 12,754,653Non-banking subsidiaries and affiliated companies . . . . . . . . . . . . . . . . . . 4,081,971 3,913,579
Loans to subsidiaries . . . . . . . . . . . . . . . . . . . . . . . . . . . . . . . . . . . . . . . . . . . . . . 5,072,330 7,199,052Banking subsidiaries . . . . . . . . . . . . . . . . . . . . . . . . . . . . . . . . . . . . . . . . . . 4,885,830 6,864,309Non-banking subsidiaries . . . . . . . . . . . . . . . . . . . . . . . . . . . . . . . . . . . . . . 186,500 334,743
Other assets . . . . . . . . . . . . . . . . . . . . . . . . . . . . . . . . . . . . . . . . . . . . . . . . . . . . . 166,514 223,725
Total assets . . . . . . . . . . . . . . . . . . . . . . . . . . . . . . . . . . . . . . . . . . . . . . . . . ¥22,073,914 ¥24,294,722
Liabilities and Shareholders’ equity:Short-term borrowings from banking subsidiaries . . . . . . . . . . . . . . . . . . . . . . . ¥ 1,600,179 ¥ 1,425,682Long-term debt from non-banking subsidiaries and affiliated companies . . . . . 264,332 277,138Long-term debt . . . . . . . . . . . . . . . . . . . . . . . . . . . . . . . . . . . . . . . . . . . . . . . . . . 5,088,478 7,187,469Other liabilities . . . . . . . . . . . . . . . . . . . . . . . . . . . . . . . . . . . . . . . . . . . . . . . . . . 150,743 204,885
Total liabilities . . . . . . . . . . . . . . . . . . . . . . . . . . . . . . . . . . . . . . . . . . . . . . . . . . 7,103,732 9,095,174
Total shareholders’ equity . . . . . . . . . . . . . . . . . . . . . . . . . . . . . . . . . . . . . . . . . . 14,970,182 15,199,548
Total liabilities and shareholders’ equity . . . . . . . . . . . . . . . . . . . . . . . . . . ¥22,073,914 ¥24,294,722
F-165

MITSUBISHI UFJ FINANCIAL GROUP, INC. AND SUBSIDIARIES
NOTES TO CONSOLIDATED FINANCIAL STATEMENTS—(Continued)
Condensed Statements of Income
Fiscal years ended March 31,
2017 2018 2019
(in millions)
Income:Dividends from subsidiaries and affiliated companies . . . . . . . . . ¥ 608,504 ¥ 576,332 ¥ 306,879
Banking subsidiaries . . . . . . . . . . . . . . . . . . . . . . . . . . . . . . . 535,512 487,491 207,161Non-banking subsidiaries and affiliated companies . . . . . . . 72,992 88,841 99,718
Management fees from subsidiaries . . . . . . . . . . . . . . . . . . . . . . . 26,095 26,073 28,305Interest income from subsidiaries . . . . . . . . . . . . . . . . . . . . . . . . . 48,665 80,670 127,117Foreign exchange gains (losses)—net . . . . . . . . . . . . . . . . . . . . . . 3,614 24,726 (20,598)Trading account losses—net . . . . . . . . . . . . . . . . . . . . . . . . . . . . . (41,279) (26,749) (8,078)Gains on sales of investment in subsidiaries and affiliated
companies . . . . . . . . . . . . . . . . . . . . . . . . . . . . . . . . . . . . . . . . . — — 252,253Other income . . . . . . . . . . . . . . . . . . . . . . . . . . . . . . . . . . . . . . . . . 1,427 1,508 3,199
Total income . . . . . . . . . . . . . . . . . . . . . . . . . . . . . . . . . . . . . 647,026 682,560 689,077
Expense:Operating expenses . . . . . . . . . . . . . . . . . . . . . . . . . . . . . . . . . . . . 25,692 26,016 28,168Interest expense to subsidiaries and affiliated companies . . . . . . 28,867 31,426 34,594Interest expense . . . . . . . . . . . . . . . . . . . . . . . . . . . . . . . . . . . . . . . 35,689 65,068 108,756Other expense . . . . . . . . . . . . . . . . . . . . . . . . . . . . . . . . . . . . . . . . 2,554 1,791 1,657
Total expense . . . . . . . . . . . . . . . . . . . . . . . . . . . . . . . . . . . . . 92,802 124,301 173,175
Equity in undistributed net income (loss) of subsidiaries and affiliatedcompanies—net . . . . . . . . . . . . . . . . . . . . . . . . . . . . . . . . . . . . . . . . . (362,899) 672,421 194,390
Income before income tax expense (benefit) . . . . . . . . . . . . . . . . . . . . 191,325 1,230,680 710,292Income tax expense (benefit) . . . . . . . . . . . . . . . . . . . . . . . . . . . . . . . . (11,355) 2,520 (8,353)
Net income . . . . . . . . . . . . . . . . . . . . . . . . . . . . . . . . . . . . . . . . . . . . . . ¥ 202,680 ¥ 1,228,160 ¥ 718,645
F-166
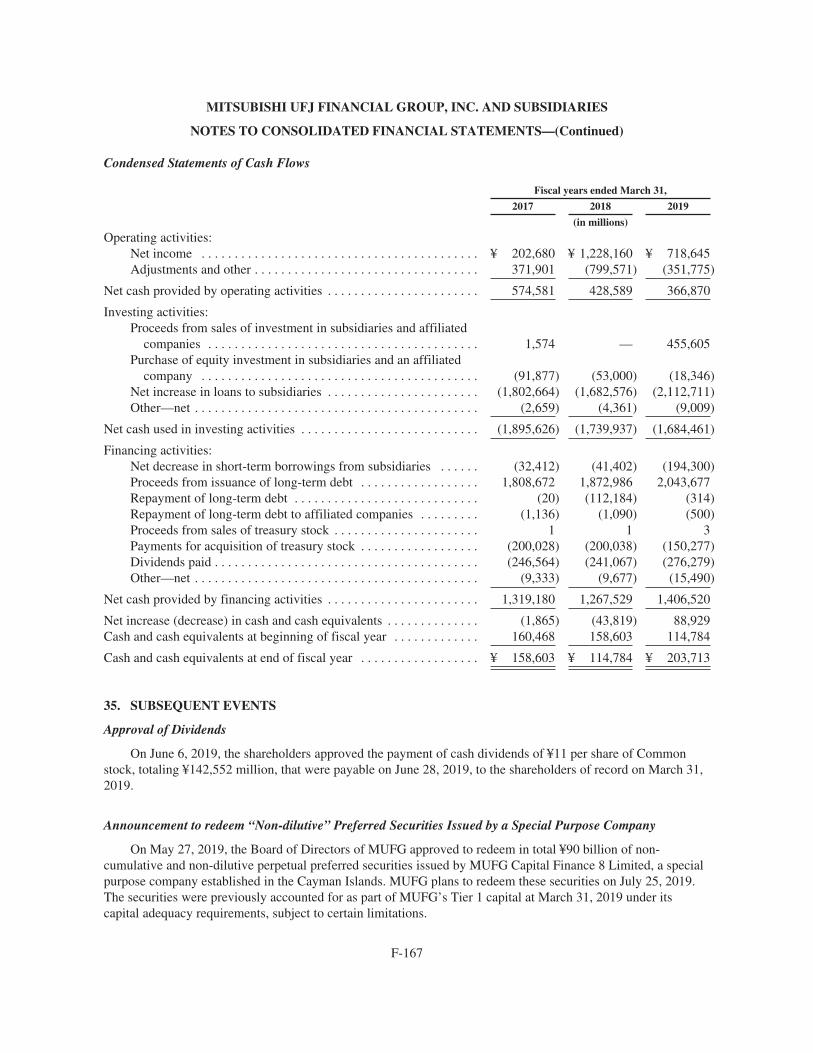
MITSUBISHI UFJ FINANCIAL GROUP, INC. AND SUBSIDIARIES
NOTES TO CONSOLIDATED FINANCIAL STATEMENTS—(Continued)
Condensed Statements of Cash Flows
Fiscal years ended March 31,
2017 2018 2019
(in millions)
Operating activities:Net income . . . . . . . . . . . . . . . . . . . . . . . . . . . . . . . . . . . . . . . . . . ¥ 202,680 ¥ 1,228,160 ¥ 718,645Adjustments and other . . . . . . . . . . . . . . . . . . . . . . . . . . . . . . . . . . 371,901 (799,571) (351,775)
Net cash provided by operating activities . . . . . . . . . . . . . . . . . . . . . . . 574,581 428,589 366,870
Investing activities:Proceeds from sales of investment in subsidiaries and affiliated
companies . . . . . . . . . . . . . . . . . . . . . . . . . . . . . . . . . . . . . . . . . 1,574 — 455,605Purchase of equity investment in subsidiaries and an affiliated
company . . . . . . . . . . . . . . . . . . . . . . . . . . . . . . . . . . . . . . . . . . (91,877) (53,000) (18,346)Net increase in loans to subsidiaries . . . . . . . . . . . . . . . . . . . . . . . (1,802,664) (1,682,576) (2,112,711)Other—net . . . . . . . . . . . . . . . . . . . . . . . . . . . . . . . . . . . . . . . . . . . (2,659) (4,361) (9,009)
Net cash used in investing activities . . . . . . . . . . . . . . . . . . . . . . . . . . . (1,895,626) (1,739,937) (1,684,461)
Financing activities:Net decrease in short-term borrowings from subsidiaries . . . . . . (32,412) (41,402) (194,300)Proceeds from issuance of long-term debt . . . . . . . . . . . . . . . . . . 1,808,672 1,872,986 2,043,677Repayment of long-term debt . . . . . . . . . . . . . . . . . . . . . . . . . . . . (20) (112,184) (314)Repayment of long-term debt to affiliated companies . . . . . . . . . (1,136) (1,090) (500)Proceeds from sales of treasury stock . . . . . . . . . . . . . . . . . . . . . . 1 1 3Payments for acquisition of treasury stock . . . . . . . . . . . . . . . . . . (200,028) (200,038) (150,277)Dividends paid . . . . . . . . . . . . . . . . . . . . . . . . . . . . . . . . . . . . . . . . (246,564) (241,067) (276,279)Other—net . . . . . . . . . . . . . . . . . . . . . . . . . . . . . . . . . . . . . . . . . . . (9,333) (9,677) (15,490)
Net cash provided by financing activities . . . . . . . . . . . . . . . . . . . . . . . 1,319,180 1,267,529 1,406,520
Net increase (decrease) in cash and cash equivalents . . . . . . . . . . . . . . (1,865) (43,819) 88,929Cash and cash equivalents at beginning of fiscal year . . . . . . . . . . . . . 160,468 158,603 114,784
Cash and cash equivalents at end of fiscal year . . . . . . . . . . . . . . . . . . ¥ 158,603 ¥ 114,784 ¥ 203,713
35. SUBSEQUENT EVENTS
Approval of Dividends
On June 6, 2019, the shareholders approved the payment of cash dividends of ¥11 per share of Commonstock, totaling ¥142,552 million, that were payable on June 28, 2019, to the shareholders of record on March 31,2019.
Announcement to redeem “Non-dilutive” Preferred Securities Issued by a Special Purpose Company
On May 27, 2019, the Board of Directors of MUFG approved to redeem in total ¥90 billion of non-cumulative and non-dilutive perpetual preferred securities issued by MUFG Capital Finance 8 Limited, a specialpurpose company established in the Cayman Islands. MUFG plans to redeem these securities on July 25, 2019.The securities were previously accounted for as part of MUFG’s Tier 1 capital at March 31, 2019 under itscapital adequacy requirements, subject to certain limitations.
F-167

MITSUBISHI UFJ FINANCIAL GROUP, INC. AND SUBSIDIARIES
NOTES TO CONSOLIDATED FINANCIAL STATEMENTS—(Continued)
Acquisition of shares in Bank Danamon in Indonesia
On April 29, 2019, MUFG Bank acquired an additional 54.0% equity interest in Danamon from AFI andother shareholders, based on a price of IDR 9,590 (approximately ¥77(1)) per share, for an investment amount ofIDR 50 trillion (approximately ¥397 billion). As a result, equity interest in Danamon increased to 94.0%, andDanamon became a consolidated subsidiary of MUFG Bank. In addition, MUFG Bank acquired an additional92.1% equity interest in PT Bank Nusantara Parahyangan, Tbk. (“BNP”) from ACOM CO., LTD., an equitymethod investee of MUFG, and other shareholders, based on a price of IDR 4,088 (approximately ¥33(1)) pershare, for an investment amount of IDR 3 trillion (approximately ¥24.1 billion). As a result, equity interest inBNP increased to 99.9%, and BNP became a consolidated subsidiary of MUFG Bank.
On May 1, 2019, MUFG Bank made BNP merged into Danamon, acquiring an additional equity interest inDanamon in exchange for its equity interest in BNP, which resulted in MUFG Bank holding 94.1% equityinterest in Danamon.
The initial accounting for the business combination is incomplete and supplemental pro forma informationof this acquisition could not be disclosed in the accompanying consolidated financial statements because thistransaction occurred near the time of the issuance of such consolidated financial statements and the MUFGGroup is still in the process of determining the fair value of assets acquired, liabilities assumed, and non-controlling interest.
See Note 2 for further information on the Acquisition of shares in Danamon.
Note:(1) Calculated based on the exchange rate of IDR1 = ¥0.008
* * * * *
F-168

EXHIBIT INDEX
Exhibit Description
1(a) Articles of Incorporation of Mitsubishi UFJ Financial Group, Inc., as amended on July 6, 2018(English translation)*
1(b) Board of Directors Regulations of Mitsubishi UFJ Financial Group, Inc., as amended onJune 25, 2015 (English translation)*
1(c) Corporation Meetings Regulations of Mitsubishi UFJ Financial Group, Inc., as amended onJuly 1, 2018 (English translation)*
1(d) Share Handling Regulations of Mitsubishi UFJ Financial Group, Inc., as amended on June 25,2015 (English Translation)**
1(e) Charter of the Audit Committee of Mitsubishi UFJ Financial Group, Inc., as amended on July 1,2018 (English translation)*
1(f) Charter of the Compensation Committee of Mitsubishi UFJ Financial Group, Inc., as amendedon July 1, 2018 (English translation)*
1(g) Charter of the Nominating and Governance Committee of Mitsubishi UFJ Financial Group,Inc., as amended on July 1, 2018 (English translation)*
1(h) Charter of the Risk Committee of Mitsubishi UFJ Financial Group, Inc., as amended on July 1,2018 (English translation)*
2(a) Form of American Depositary Receipt*
2(b) Form of Deposit Agreement, amended and restated as of December 22, 2004, among MitsubishiTokyo Financial Group, Inc. (subsequently renamed Mitsubishi UFJ Financial Group, Inc.), TheBank of New York Mellon and the holders from time to time of American Depositary Receiptsissued thereunder*
2(c) Description of Securities
8 Subsidiaries of the Company—see “Item 4.C. Information on the Company—OrganizationalStructure.”
11 MUFG Group Code of Conduct, Compliance Rules, Compliance Manual, and Rules ofEmployment of Mitsubishi UFJ Financial Group, Inc. applicable to its principal executiveofficer, principal financial officer, principal accounting officer and persons performing similarfunctions (English translation of relevant sections)
12 Certifications required by Rule 13a-14(a) (17 CFR 240.13a-14(a)) or Rule 15d-14(a)(17 CFR 240.15d-14(a))
13 Certifications required by Rule 13a-14(b) (17 CFR 240.13a-14(b)) or Rule 15d-14(b)(17 CFR 240.15d-14(b)) and Section 1350 of Chapter 63 of Title 18 of the United States Code(18 U.S.C. 1350)
15(a) Consent of independent registered public accounting firm (Deloitte Touche Tohmatsu LLC)
15(b) Consent of independent registered public accounting firm (Deloitte & Touche LLP)
99(a) Capitalization and Indebtedness of Mitsubishi UFJ Financial Group, Inc. as of March 31,2019***
99(b) Unaudited Reverse Reconciliation of Selected Financial Information of Mitsubishi UFJFinancial Group, Inc. as of and for the fiscal year ended March 31, 2019****
99(c) Financial Statements and Supplementary Data of Morgan Stanley*****
101.INS XBRL Instance Document

Exhibit Description
101.SCH XBRL Schema Document
101.CAL XBRL Calculation Linkbase Document
101.DEF XBRL Definition Linkbase Document
101.LAB XBRL Label Linkbase Document
101.PRE XBRL Presentation Linkbase Document
Notes:* Incorporated by reference to our annual report on Form 20-F (File No. 000-54189) filed on July 12, 2018.** Incorporated by reference to our registration statement on Form S-8 (File No. 333-230590) filed on March 29, 2019.*** Deemed to be incorporated by reference into the registration statement on Form F-3 (No. 333-229697) of Mitsubishi UFJ Financial
Group, Inc. and to be a part thereof.**** Deemed to be incorporated as Annex A to the registration statement on Form F-3 (No. 333-229697) of Mitsubishi UFJ Financial
Group, Inc. and to be a part thereof.***** Incorporated by reference to Morgan Stanley’s annual report on Form 10-K (File No. 001-11758) filed on February 26, 2019.
Signature
The registrant hereby certifies that it meets all of the requirements for filing on Form 20-F and that it hasduly caused and authorized the undersigned to sign this Annual Report on its behalf.
MITSUBISHI UFJ FINANCIAL GROUP, INC.
By: /s/ KANETSUGU MIKE
Name: Kanetsugu MikeTitle: President & Group Chief Executive Officer
Date: July 10, 2019

Exhibit 2(c)
DESCRIPTION OF SECURITIES
Common Stock
We summarize below the material provisions of our Articles of Incorporation, our share handlingregulations and the Companies Act as they relate to a type of joint stock company known as kabushiki kaisha,within which we fall. Because it is a summary, this discussion should be read together with our Articles ofIncorporation and share handling regulations, each attached as an exhibit to our annual report on Form 20-F.
General
A joint stock company is a legal entity incorporated under the Companies Act. The investment and rights ofthe shareholders of a joint stock company are represented by shares of stock in the company and shareholders’liability is limited to the amount of the subscription for the shares. Our authorized common share capital iscomprised of 33,000,000,000 shares of common stock with no par value.
We may issue shares from our authorized but unissued share capital following a resolution to that effect byour board of directors. An increase in our authorized share capital is only possible by amendment of our Articlesof Incorporation, which generally requires shareholders’ special approval.
In order to assert shareholder rights against us, a shareholder must have its name and address registered onour register of shareholders, in accordance with the Companies Act and our share handling regulations. Theregistered holder of deposited shares underlying the ADSs is the depositary for the ADSs, or its nominee.Accordingly, holders of ADSs will not be able to assert shareholder rights other than as provided in theagreement among us, the depositary and the holders of the ADSs.
Under the Act on Book-Entry Transfer of Company Bonds, Shares, etc., the shares of all Japanesecompanies listed on any Japanese stock exchange, including our shares, are traded without share certificatesthrough entry in the books maintained under a central clearing system.
Dividends
Dividends are distributed in proportion to the number of shares owned by each shareholder on the recorddate for the dividend. Dividends for each financial period may be distributed following shareholders’ approval ata general meeting of shareholders.
Payment of dividends on common stock is subject to the preferential dividend rights of holders of preferredstock.
Under the Banking Law and our Articles of Incorporation, our financial accounts are closed on March 31 ofeach year, and dividends, if any, are paid to shareholders of record as of March 31 following shareholders’approval at a general meeting of shareholders. In addition to year-end dividends, our board of directors may byresolution declare an interim cash dividend to shareholders of record as of September 30 of each year. Under theCompanies Act, distribution of dividends will take the form of distribution of surplus (as defined below). We willbe permitted to make distributions of surplus to our shareholders any number of times per fiscal year pursuant toresolutions of our general meetings of shareholders, subject to certain limitations described below. Distributionsof surplus are in principle required to be authorized by a resolution of a general meeting of shareholders.Distributions of surplus would, however, be permitted to be made pursuant to a resolution of our board ofdirectors if:
(a) our Articles of Incorporation so provide (our Articles of Incorporation currently contain no suchprovisions);
1

(b) the normal term of office of our directors is one year; and
(c) certain conditions concerning our non-consolidated annual financial statements and certain documentsfor the latest fiscal year as required by an ordinance of the Ministry of Justice are satisfied.
In an exception to the above rule, even if the requirements described in (a) through (c) are not met, we arepermitted to make distributions of surplus in cash to our shareholders by resolutions of the board of directorsonce per fiscal year as mentioned above concerning interim cash dividend.
Under the Companies Act, distributions of surplus may be made in cash or in kind in proportion to thenumber of shares of common stock held by each shareholder. A resolution of a general meeting of shareholdersor our board of directors authorizing a distribution of surplus must specify the kind and aggregate book value ofthe assets to be distributed, the manner of allocation of such assets to shareholders, and the effective date of thedistribution. If a distribution of surplus is to be made in kind, we may, pursuant to a resolution of a generalmeeting of shareholders or (as the case may be) our board of directors, grant to our shareholders the right torequire us to make such distribution in cash instead of in kind. If no such right is granted to shareholders, therelevant distribution of surplus must be approved by a special resolution of a general meeting of shareholders.See “Common Stock—Voting Rights” below.
Under the Companies Act, we may make distributions of surplus to the extent that the aggregate book valueof the assets to be distributed to shareholders does not exceed the distributable amount (as defined below) as ofthe effective date of such distributions of surplus. The amount of surplus (the “surplus”) at any given time shallbe the amount of our assets and the book value of our treasury stock after subtracting the amounts of items (1)through (5) below as they appear on our non-consolidated balance sheet as of the end of our last fiscal year, andafter reflecting the changes in our surplus after the end of our last fiscal year, by adding the amounts of items (6),(7) and (8) below and/or subtracting the amounts of items (9), (10) and (11) below:
(1) our liabilities;
(2) our stated capital;
(3) our additional paid-in capital;
(4) our accumulated legal reserve;
(5) other amounts as are set out in an ordinance of the Ministry of Justice;
(6) (if we transferred our treasury stock after the end of the last fiscal year) the transfer price of ourtreasury stock after subtracting the book value thereof;
(7) (if we decreased our stated capital after the end of the last fiscal year) the amount of decrease in ourstated capital (excluding the amount transferred to additional paid-in capital or legal reserve);
(8) (if we decreased our additional paid-in capital or legal reserve after the end of the last fiscal year) theamount of decrease in our additional paid-in capital or legal reserve (excluding the amount transferredto stated capital);
(9) (if we cancelled our treasury stock after the end of the last fiscal year) the book value of the cancelledtreasury stock;
(10) (if we distributed surplus to shareholders after the end of the last fiscal year) the amount of the assetsdistributed to shareholders by way of such distribution of surplus; and
(11) other amounts as are set out in an ordinance of the Ministry of Justice.
A distributable amount (the “distributable amount”) at any given time shall be the aggregate amount of(a) the surplus, (b) the amount of profit as recorded for the period after the end of our last fiscal year until thedate of an extraordinary settlement of account (if any) as is set out in an ordinance of the Ministry of Justice and
2

(c) the transfer price of our treasury stock in the same period, after subtracting the amounts of the followingitems:
(1) the book value of our treasury stock;
(2) (if we transferred our treasury stock after the end of the last fiscal year) the transfer price of ourtreasury stock;
(3) the losses recorded for the period after the end of our last fiscal year until the date of an extraordinarysettlement of account (if any) as set out in an ordinance of the Ministry of Justice; and
(4) other amounts as set out in an ordinance of the Ministry of Justice.
In Japan, the “ex-dividend” date and the record date for any dividends precede the date of determination ofthe amount of the dividend to be paid. The market price of shares generally becomes ex-dividend on the thirdbusiness day prior to the record date. Under our Articles of Incorporation, we are not obligated to pay anydividends which are left unclaimed for a period of five years after the date on which they first became payable.
Capital and Reserves
Under the Companies Act, we may reduce our additional paid-in capital or legal reserve (without limitationas to the amount of such reduction) as mentioned previously, generally by resolution of a general meeting ofshareholders and, if so resolved in the same resolution, may account for the whole or any part of the amount ofsuch reduction as stated capital. We may also reduce our stated capital generally by special resolution of ageneral meeting of shareholders and, if so resolved in the same resolution, such reduction may account for thewhole or any part of the amount of such reduction as additional paid-in capital or legal reserve. Conversely, wemay reduce our surplus and increase either (i) stated capital or (ii) additional paid-in capital and/or legal reserveby the same amount, in either case by resolution of a general meeting of shareholders.
Stock Splits
Stock splits of our outstanding stock may be effected at any time by resolution of the board of directors.When a stock split is to be effected, we may increase the authorized share capital to cover the number of sharesto be increased by the stock split by amending our Articles of Incorporation by resolution of the board ofdirectors without approval by special resolution of the general meeting of shareholders, unless more than oneclass of stock is issued and outstanding. We must give public notice of the stock split, specifying a record date atleast two weeks prior to the record date.
Unit Share (tan-gen kabu) System
We have adopted a unit share system, where 100 shares of either common or preferred stock shall eachconstitute a unit.
Under the unit share system, each unit is entitled to one voting right. A holder of less than one unit has novoting right. Our Articles of Incorporation provide that the holders of shares constituting less than a full unit willnot have shareholder rights except for those specified in the Companies Act or an ordinance of the Ministry ofJustice, including rights (i) to receive dividends, (ii) to receive cash or other assets in case of consolidation orsplit of shares, stock-for-stock exchange or stock-for-stock transfer, corporate split or merger or (iii) to beallotted rights to subscribe for free for new shares and stock acquisition rights when such rights are granted toshareholders. Shareholders may require us to purchase shares constituting less than a unit at the current marketprice. In addition, holders of shares constituting less than a unit may require us to sell them such number ofshares, which, when combined with the number of shares already held by such holder, shall constitute a wholeunit of share; provided that we will be obliged to comply with such request only when we own a sufficientnumber of shares to accommodate the desired sale and purchase. The board of directors may reduce the number
3
of shares constituting a unit or cease to use the unit share system by amendments to the Articles of Incorporationwithout shareholders’ approval even though amendments to the Articles of Incorporation generally require aspecial resolution of the general meeting of shareholders.
General Meeting of Shareholders
The ordinary general meeting of our shareholders is usually held in June of each year in Tokyo. In addition,we may hold an extraordinary general meeting of shareholders whenever necessary by giving at least two weeks’advance notice to shareholders who are entitled to vote at the relevant general meeting of shareholders. Therecord date for ordinary general meetings of our shareholders is March 31.
Any shareholder holding at least 300 voting rights or 1% of the total number of voting rights for sixconsecutive months or longer may propose a matter to be considered at a general meeting of shareholders bysubmitting a written request to a director at least eight weeks prior to the date of the meeting. The number ofminimum voting rights, minimum percentage and time period necessary for exercising the minority shareholderrights described above may be decreased or shortened if our Articles of Incorporation so provide. Our Articles ofIncorporation currently contain no such provisions.
Voting Rights
A holder of shares of our common stock is generally entitled to one voting right for each unit of commonstock held. The following shares of common stock are not entitled to voting rights even when such sharesconstitute a whole unit, and such shares of common stock are not considered when determining whether aquorum exists for a shareholders’ meeting:
‰ treasury stock;
‰ shares held by a company in which we and/or our subsidiaries own 25% or more of the total votingrights; and
‰ shares issued after the record date as a result of conversion of convertible stock, exercise of stockacquisition rights, and fractional shareholders becoming a shareholder of a whole unit share.
On the other hand, holders of certain class of preferred stock shall be entitled to a voting right for each unitof preferred stock held under certain conditions provided for by relevant laws or regulations and our Articles ofIncorporation, for example, when a proposal to pay the full amount of preferential dividends on any class ofpreferred stock in compliance with the terms of such preferred stock is not included in the agenda of the relevantshareholders meeting. See “Preferred Stock” below.
Under our Articles of Incorporation, except as otherwise provided by law or by other provisions of ourArticles of Incorporation, a resolution can be adopted at a shareholders’ meeting by the holders of a majority ofthe voting rights represented at the meeting. The Companies Act and our Articles of Incorporation require aquorum of not less than one-third of the total number of voting rights for election of our directors.
The Companies Act and our Articles of Incorporation provide that a quorum of not less than one-third ofoutstanding voting rights, excluding those owned by our subsidiaries and affiliates of which we own, directly orindirectly, 25 percent or more, must be present at a shareholders’ meeting to approve specified corporate actions,such as:
‰ the amendment of our Articles of Incorporation, except in some limited cases;
‰ the repurchase of our own stock from a specific shareholder other than our subsidiary;
‰ the consolidation of shares;
4
‰ the offering to persons other than shareholders of stock at a specially favorable price, or of stockacquisition rights or bonds or notes with stock acquisition rights with specially favorable conditions;
‰ the exemption from liability of a director or corporate auditor, with certain exceptions;
‰ a reduction in stated capital with certain exceptions in which a shareholders’ resolution is not required;
‰ a distribution of in-kind dividends which meets certain requirements;
‰ the transfer of the whole or an important part of our business, except in some limited circumstances;
‰ the acquisition of the whole business of another company, except in some limited circumstances;
‰ a dissolution, merger or consolidation, except for certain types of mergers;
‰ a stock-for-stock exchange (kabushiki-kokan) or stock-for-stock transfer (kabushiki-iten), except insome limited circumstances; and
‰ a corporate split, except in some limited circumstances.
A special resolution representing at least two-thirds of the voting rights represented at the meeting isrequired to approve these actions.
Our Articles of Incorporation do not include any provision that grants shareholders cumulative voting rightsat elections of directors.
Subscription Rights
Holders of our shares have no preemptive rights under our Articles of Incorporation. Under the CompaniesAct, however, our board of directors may determine that shareholders be given subscription rights in connectionwith a particular issue of new shares. In this case, these subscription rights must be given on uniform terms to allshareholders, and if a specified record date is set, it must be announced in a public notice at least two weeks priorto the record date. A notification to each individual shareholder must also be given at least two weeks prior to thesubscription date.
Under the Companies Act, rights to subscribe for new shares may not be transferred; however, we may allotstock acquisition rights to shareholders without consideration, and such rights will be transferable.
Stock Acquisition Rights
We may issue stock acquisition rights (shinkabu yoyakuken), which in the United States are often in theform of warrants, or bonds with stock acquisition rights that cannot be detached (shinkabu yoyakuken-tsukishasai), which in the United States are often in the form of convertible bonds or bonds with non-detachablewarrants. Except where the issuance would be on “specially favorable” conditions, the issuance of stockacquisition rights or bonds with stock acquisition rights may be authorized by a resolution of our board ofdirectors. Upon exercise of the stock acquisition rights, the holder of such rights may acquire shares by payingthe applicable exercise price or, if so determined by a resolution of our board of directors, by making a substitutepayment, such as having the convertible bonds redeemed for no cash in lieu of the exercise price.
Liquidation Rights
Upon our liquidation, the assets remaining after payment of all debts, liquidation expenses, taxes andpreferred distributions to holders of shares of our preferred stock will be distributed among the holders of sharesof our common stock in proportion to the number of shares they own.
5
Transfer Agent
Mitsubishi UFJ Trust and Banking is the transfer agent for our common stock. The office of Mitsubishi UFJTrust and Banking for this purpose is located at 4-5, Marunouchi 1-chome, Chiyoda-ku, Tokyo 100-8212, Japan.Mitsubishi UFJ Trust and Banking maintains our register of shareholders.
Reports to Shareholders
We furnish to our shareholders notices, in Japanese, of shareholders’ meetings, annual business reports,including our financial statements, and notices of resolutions adopted at our shareholders’ meetings.
Record Dates
As stated above, March 31 is the record date for the payment of annual dividends (if any), the determinationof shareholders entitled to vote at ordinary general meetings of our shareholders, and the determination of classshareholders entitled to vote at meetings of our class shareholders if any matter to be resolved at an ordinarygeneral meeting of our shareholders requires a resolution by our class shareholders in addition to a resolution byour shareholders. September 30 is the record date for the payment of interim dividends, if any. In addition, by aresolution of our board of directors and after giving at least two weeks’ prior public notice, we may at any timeset a record date in order to determine the shareholders who are entitled to the rights pertaining to our shares.
Repurchase of Our Shares
We may repurchase our own shares:
‰ through the Tokyo Stock Exchange or other stock exchanges on which our shares are listed, ifauthorized by a resolution of a general meeting of shareholders or our board of directors;
‰ by way of a tender offer, if authorized by a resolution of a general meeting of shareholders or our boardof directors;
‰ from a specific party, if authorized by a special resolution of a general meeting of shareholders and wegive notice thereof to shareholders prior to such general meeting, in general;
‰ from all shareholders of a specific class of shares offering to sell their shares, if authorized by aresolution of a general meeting of shareholders or our board of directors and we give a public notice ornotice thereof to all of the shareholders (if we repurchase any class of preferred stock, notices to allshareholders of the relevant class of preferred stock); or
‰ from our subsidiaries, if authorized by a resolution of the board of directors.
When the repurchase is made by us from a specific party, as authorized by a special resolution of a generalmeeting of shareholders, any shareholder may make a demand to a director, five days or more prior to therelevant shareholders’ meeting, that we also repurchase the shares held by that shareholder. However, no suchright will be available if the shares have a market price, and if the purchase price does not exceed the then marketprice calculated in a manner set forth in an ordinance of the Ministry of Justice.
Repurchase of our own shares described above must satisfy various specified requirements. In general, thesame restrictions on the distributable amount as described in the seventh paragraph under “—Common Stock—Dividends.” are applicable to the repurchase of our own shares, so the total amount of the repurchase price maynot exceed the distributable amount.
We may hold our own shares so repurchased without restrictions. In addition, we may cancel or dispose ofour repurchased shares by a resolution of our board of directors.
6

American Depositary Shares
The Bank of New York Mellon will issue ADRs. Each ADR will represent ownership interests in ADSs.Each ADS represents one share of our common stock. Each ADS is held by MUFG Bank, acting as custodian, atits principal office in Tokyo, on behalf of The Bank of New York Mellon, acting as depositary. Each ADS willalso represent securities, cash or other property deposited with The Bank of New York Mellon but not distributedto ADS holders. The Bank of New York Mellon’s corporate trust office is located at 240 Greenwich Street,New York, New York 10286 and its principal executive office is located at 225 Liberty Street, New York,New York 10286.
You may hold ADSs either directly or indirectly through your broker or other financial institution. If youhold ADSs directly, you are an ADS holder. This description assumes you hold your ADSs directly. If you holdthe ADSs indirectly, you must rely on the procedures of your broker or other financial institution to assert therights of ADS holders described herein. You should consult with your broker or financial institution to find outwhat those procedures are.
The Bank of New York Mellon will actually be the registered holder of the common stock, so you will haveto rely on it to exercise your rights as a shareholder. Our obligations and the obligations of The Bank ofNew York Mellon are set out in a deposit agreement among us, The Bank of New York Mellon and you, as anADS holder. The deposit agreement and the ADSs are governed by New York law.
The following is a summary of the material terms of the deposit agreement. Because it is a summary, it doesnot contain all the information that may be important to you. For more complete information, you should read theentire deposit agreement and the form of ADR. each attached as an exhibit to our annual report on Form 20-F.
Share Dividends and Other Distributions
The Bank of New York Mellon has agreed to pay to you the cash dividends or other distributions it or thecustodian receives on shares of common stock or other deposited securities, after deducting its fees and expenses.You will receive these distributions in proportion to the number of shares your ADSs represent.
Cash. The Bank of New York Mellon will convert any cash dividend or other cash distribution we pay onour common stock into U.S. dollars, if it can do so on a reasonable basis and can transfer the U.S. dollars to theUnited States. If that is not possible or if any approval from the Japanese government is needed and cannot beobtained, the deposit agreement allows The Bank of New York Mellon to distribute the Japanese yen only tothose ADS holders to whom it is possible to do so. The Bank of New York Mellon will hold the Japanese yen itcannot convert for the account of the ADS holders who have not been paid. It will not invest the Japanese yenand it will not be liable for any interest.
Before making a distribution, any withholding taxes that must be paid under Japanese law will be deducted.The Bank of New York Mellon will distribute only whole U.S. dollars and cents and will round fractional centsto the nearest whole cent. If the relevant exchange rates fluctuate during a time when The Bank of New YorkMellon cannot convert the Japanese currency, you may lose some or all of the value of the distribution.
Shares. The Bank of New York Mellon may distribute new ADSs representing any shares we may distributeas a dividend or free distribution, if we furnish The Bank of New York Mellon promptly with satisfactoryevidence that it is legal to do so. The Bank of New York Mellon will only distribute whole ADSs. It will sellshares which would require it to issue a fractional ADS and distribute the net proceeds in the same way as itdistributes cash dividends. If The Bank of New York Mellon does not distribute additional ADSs, each ADS willalso represent the new shares.
Rights to receive additional shares. If we offer holders of our common stock any rights to subscribe foradditional shares of common stock or any other rights, The Bank of New York Mellon may, after consultation
7

with us, make those rights available to you. We must first instruct The Bank of New York Mellon to do so andfurnish it with satisfactory evidence that it is legal to do so. If we do not furnish this evidence and/or do not givethese instructions, and The Bank of New York Mellon decides that it is practical to sell the rights, The Bank ofNew York Mellon will sell the rights and distribute the proceeds in the same way as it distributes cash dividends.The Bank of New York Mellon may allow rights that are not distributed or sold to lapse. In that case, you willreceive no value for them.
If The Bank of New York Mellon makes rights available to you, upon instruction from you it will exercisethe rights and purchase the shares on your behalf. The Bank of New York Mellon will then deposit the shares andissue ADSs to you. It will only exercise the rights if you pay it the exercise price and any other charges the rightsrequire you to pay.
U.S. securities laws may restrict the sale, deposit, cancellation and transfer of the ADSs issued after theexercise of the rights. For example, you may not be able to trade the ADSs freely in the United States. In thiscase, The Bank of New York Mellon may issue the ADSs under a separate restricted deposit agreement whichwill contain the same provisions as the deposit agreement, except for changes needed to put the restrictions inplace. The Bank of New York Mellon will not offer you rights unless those rights and the securities to which therights relate are either exempt from registration or have been registered under the U.S. Securities Act withrespect to a distribution to you. We will have no obligation to register under the Securities Act those rights or thesecurities to which they relate.
Other distributions. The Bank of New York Mellon will send to you anything else we distribute ondeposited securities by any means it thinks is legal, fair and practical. If it cannot make the distribution in thatway, The Bank of New York Mellon has a choice. It may decide to sell what we distributed and distribute the netproceeds, in the same way as it does with cash. Or, it may decide to hold what we distributed, in which caseADSs will also represent the newly distributed property.
The Bank of New York Mellon is not responsible if it decides that it is unlawful or impractical to make adistribution available to any ADS holders. We have no obligation to register ADSs, shares, rights or othersecurities under the Securities Act. We also have no obligation to take any other action to permit the distributionof ADSs, shares, rights or anything else to ADS holders. This means that you may not receive the distributionswe make on our shares or any value for them if it is illegal or impractical for us or The Bank of New YorkMellon to make them available to you.
Deposit, Withdrawal and Cancellation
The Bank of New York Mellon will issue ADSs if you or your broker deposits shares or evidence of rightsto receive shares with the custodian. Upon payment of its fees and expenses and of any taxes or charges, such asstamp taxes or stock transfer taxes or fees, The Bank of New York Mellon will register the appropriate number ofADSs in the names you request and will deliver the ADSs at its corporate trust office to the persons you request.
In certain circumstances, subject to the provisions of the deposit agreement, The Bank of New York Mellonmay issue ADSs before the deposit of the underlying shares. This is called a pre-release of ADSs. A pre-releaseis closed out as soon as the underlying shares are delivered to the depositary. The depositary may receive ADSsinstead of the shares to close out a pre-release. The depositary may pre-release ADSs only under the followingconditions:
‰ Before or at the time of the pre-release, the person to whom the pre-release is made must represent tothe depositary in writing that it or its customer, as the case may be, owns the shares to be deposited;
‰ The pre-release must be fully collateralized with cash or collateral that the depositary considersappropriate; and
‰ The depositary must be able to close out the pre-release on not more than five business days’ notice.
8

The pre-release will be subject to whatever indemnities and credit regulations that the depositary considersappropriate. In addition, the depositary will limit the number of ADSs that may be outstanding at any time as aresult of a pre-release.
You may turn in your ADSs at the Corporate Trust Office of The Bank of New York Mellon’s office. Uponpayment of its fees and expenses and of any taxes or charges, such as stamp taxes or stock transfer taxes or fees,The Bank of New York Mellon will deliver (1) the underlying shares to an account designated by you and(2) any other deposited securities underlying the ADS at the office of the custodian. Or, at your request, risk andexpense, The Bank of New York Mellon will deliver the deposited securities at its Corporate Trust Office.
The ADSs may only be presented for cancellation and release of the underlying shares of common stock orother deposited securities in multiples of 100 ADSs. Holders of ADRs evidencing less than 100 ADSs are notentitled to delivery of any underlying shares or other deposited securities unless ADRs, together with other ADRspresented by the same holder at the same time, represent in the aggregate at least 100 ADSs. If any ADSs aresurrendered but not cancelled pursuant to the preceding sentence, The Bank of New York Mellon will executeand deliver an ADR or ADRs evidencing the balance of ADSs not so cancelled to the person or personssurrendering the same.
Voting Rights
If you are an ADS holder on a record date fixed by The Bank of New York Mellon, you may instruct TheBank of New York Mellon to vote the shares underlying your ADSs at a meeting of our shareholders inaccordance with the procedures set forth in the deposit agreement.
The Bank of New York Mellon will notify you of the upcoming meeting and arrange to deliver our votingmaterials to you. The notice shall contain (a) such information as is contained in such notice of meeting, (b) astatement that as of the close of business on a specified record date you will be entitled, subject to any applicableprovision of Japanese law and our Articles of Incorporation, to instruct The Bank of New York Mellon as to theexercise of the voting rights, if any, pertaining to the amount of shares or other deposited securities representedby your ADSs, and (c) a brief statement as to the manner in which such instructions may be given, including anexpress indication that instructions may be given to The Bank of New York Mellon to give a discretionary proxyto a person designated by us. Upon your written request, received on or before the date established by The Bankof New York Mellon for such purpose, The Bank of New York Mellon shall endeavor in so far as practicable tovote or cause to be voted the amount of shares or other deposited securities represented by your ADSs inaccordance with the instructions set forth in your request. So long as Japanese law provides that votes may onlybe cast with respect to one or more whole shares or other deposited securities, The Bank of New York Mellonwill aggregate voting instructions to the extent such instructions are the same and vote such whole shares or otherdeposited securities in accordance with your instructions. If, after aggregation of all instructions to vote receivedby The Bank of New York Mellon, any portion of the aggregated instructions constitutes instructions withrespect to less than a whole share or other deposited securities, The Bank of New York Mellon will not vote orcause to be voted the shares or other deposited securities to which such portion of the instructions apply. TheBank of New York Mellon will not vote or attempt to exercise the right to vote that attaches to the shares or otherdeposited securities, other than in accordance with the instructions of the ADS holders. If no instructions arereceived by The Bank of New York Mellon from you with respect to any of the deposited securities representedby your ADSs on or before the date established by The Bank of New York Mellon for such purpose, The Bank ofNew York Mellon shall deem you to have instructed The Bank of New York Mellon to give a discretionaryproxy to a person designated by us with respect to such deposited securities and The Bank of New York Mellonshall give a discretionary proxy to a person designated by us to vote such deposited securities, provided that nosuch instruction shall be given with respect to any matter as to which we inform The Bank of New York Mellon(and we have agreed to provide such information as promptly as practicable in writing) that (1) we do not wishsuch proxy given, (2) substantial opposition exists or (3) such matter materially and adversely affects the rightsof holders of shares.
9

We cannot assure you that you will receive the voting materials in time to ensure that you can instruct TheBank of New York Mellon to vote your shares. In addition, The Bank of New York Mellon is not responsible forfailing to carry out voting instructions or for the manner of carrying out voting instructions as long as it has actedin good faith. This means that you may not be able to exercise your right to vote and there may be nothing youcan do if your shares are not voted as you requested.
Payment of Taxes
You will be responsible for any taxes or other governmental charges payable on your ADSs or on thedeposited securities underlying your ADSs. The Bank of New York Mellon may refuse to transfer your ADSs orallow you to withdraw the deposited securities underlying your ADSs until those taxes or other charges are paid.It may apply payments owed to you or sell deposited securities underlying your ADSs to pay any taxes owed andyou will remain liable for any deficiency. If it sells deposited securities, it will, if appropriate, reduce the numberof ADSs to reflect the sale and pay to you any property remaining after it has paid the taxes.
Reclassifications, Recapitalizations and Mergers
If we:
‰ reclassify, split up or consolidate any of our shares or the deposited securities;
‰ recapitalize, reorganize, merge, liquidate, consolidate or sell all or substantially all of our assets or takeany similar action; or
‰ distribute securities on the shares that are not distributed to you, then,
(1) the cash, shares or other securities received by The Bank of New York Mellon will become depositedsecurities and each ADS will automatically represent its equal share of the new deposited securitiesunless additional ADSs are issued; and
(2) The Bank of New York Mellon may, and will if we request, issue new ADSs or ask you to surrenderyour outstanding ADSs in exchange for new ADSs, identifying the new deposited securities.
Amendment and Termination
We may agree with The Bank of New York Mellon to amend the deposit agreement and the ADSs withoutyour consent for any reason. If the amendment adds or increases fees or charges, except for taxes and othergovernmental charges, registration fees, cable, telex or facsimile transmission costs, delivery costs or other suchexpenses, or prejudices an important right of ADS holders, it will only become effective three months after TheBank of New York Mellon notifies you of the amendment. At the time an amendment becomes effective, you areconsidered, by continuing to hold your ADS, to agree to the amendment and to be bound by the ADSs and thedeposit agreement as amended. However, no amendment will impair your right to receive the deposited securitiesin exchange for your ADSs.
The Bank of New York Mellon will terminate the deposit agreement if we ask it to do so, in which case itmust notify you at least 30 days before termination. The Bank of New York Mellon may also terminate thedeposit agreement if The Bank of New York Mellon has told us that it would like to resign and we have notappointed a new depositary bank within 60 days.
If any ADSs remain outstanding after termination, The Bank of New York Mellon will stop registering thetransfers of ADSs, will stop distributing dividends to ADS holders and will not give any further notices or doanything else under the deposit agreement other than:
(1) collect dividends and distributions on the deposited securities;
(2) sell rights and other property offered to holders of deposited securities; and
10

(3) deliver shares and other deposited securities in exchange for ADSs surrendered to The Bank of NewYork Mellon.
At any time after one year following termination, The Bank of New York Mellon may sell any remainingdeposited securities. After that, The Bank of New York Mellon will hold the money it received on the sale, aswell as any other cash it is holding under the deposit agreement for the pro rata benefit of the ADS holders thathave not surrendered their ADSs. It will not invest the money and has no liability for interest. The Bank ofNew York Mellon’s only obligations will be to account for the money and other cash and with respect toindemnification and to retain depositary documents. After termination, our only obligations will be with respectto indemnification and to pay certain amounts to The Bank of New York Mellon.
Limitations on Obligations and Liability to ADS Holders
The deposit agreement expressly limits our obligations and the obligations of The Bank of New YorkMellon. It also limits our liability and the liability of The Bank of New York Mellon. We and The Bank ofNew York Mellon:
‰ are only obligated to take the actions specifically set forth in the deposit agreement without negligenceor bad faith;
‰ are not liable if either is prevented or delayed by law, any provision of our Articles of Incorporation orcircumstances beyond our control from performing our obligations under the deposit agreement;
‰ are not liable if either exercises or fails to exercise discretion permitted under the deposit agreement;
‰ have no obligation to become involved in a lawsuit or other proceeding related to the ADSs or thedeposit agreement on your behalf or on behalf of any other party unless indemnified to their satisfaction;and
‰ may rely upon any advice of or information from legal counsel, accountants, any person depositingshares, any ADS holder or any other person believed in good faith to be competent to give them thatadvice or information.
In the deposit agreement, we and The Bank of New York Mellon agree to indemnify each other forliabilities arising out of acts performed or omitted by the other party in accordance with the deposit agreement.
Requirements for Depositary Actions
Before The Bank of New York Mellon will issue or register transfer of an ADS, make a distribution on anADS, or permit withdrawal of shares, it may require:
‰ payment of stock transfer or other taxes or other governmental charges and transfer or registration feescharged by third parties for the transfer of any shares or other deposited securities;
‰ production of satisfactory proof of the identity and genuineness of any signature or other information itdeems necessary; and
‰ compliance with regulations it may establish, from time to time, consistent with the deposit agreement,including presentation of transfer documents.
The Bank of New York Mellon may refuse to deliver, transfer, or register transfers of ADSs generally whenits transfer books are closed, when our transfer books are closed or at any time if it or we think it advisable to doso.
You have the right to cancel your ADSs and withdraw the underlying shares at any time except:
‰ when temporary delays arise because: (1) The Bank of New York Mellon has closed its transfer booksor we have closed our transfer books; (2) the transfer of shares is blocked to permit voting at ashareholders’ meeting; or (3) we are paying a dividend on the shares;
11
‰ when you or other ADS holders seeking to withdraw shares owe money to pay fees, taxes and similarcharges; or
‰ when it is necessary to prohibit withdrawals in order to comply with any laws or governmentalregulations that apply to ADSs or to the withdrawal of shares or other deposited securities.
This right of withdrawal may not be limited by any other provision of the deposit agreement.
Reports and Other Communications
The Bank of New York Mellon will make available for your inspection at its corporate trust office anyreports and communications, including any proxy soliciting material, that it receives from us, if those reports andcommunications are both (a) received by The Bank of New York Mellon as the holder of the deposited securitiesand (b) made generally available by us to the holders of the deposited securities. If we ask it to, The Bank ofNew York Mellon will also send you copies of those reports it receives from us.
Inspection of Transfer Books
The Bank of New York Mellon will keep books for the registration and transfer of ADSs, which will beopen for your inspection at all reasonable times. You will only have the right to inspect those books if theinspection is for the purpose of communicating with other owners of ADSs in connection with our business or amatter related to the deposit agreement or the ADSs.
Preferred Stock
The following is a summary of information concerning the shares of our preferred stock, including briefsummaries of the relevant provisions of our Articles of Incorporation, the share handling regulations and theCompanies Act as currently in effect. The detailed rights of our preferred stock are set out in our Articles ofIncorporation and the resolutions of our board of directors relating to the issuance of the relevant stock.
General
We are authorized under our Articles of Incorporation to issue four classes of preferred stock totaling800,000,000 shares of preferred stock, including 400,000,000 shares of each of the second to fourth series ofclass 5 preferred stock (provided the aggregate number of shares authorized to be issued with respect to the threeseries of class 5 preferred stock does not exceed 400,000,000 shares), 200,000,000 shares of each of the first tofourth series of class 6 preferred stock (provided the aggregate number of shares authorized to be issued withrespect to the four series of class 6 preferred stock does not exceed 200,000,000 shares), and 200,000,000 sharesof each of the first to fourth series of class 7 preferred stock (provided the aggregate number of shares authorizedto be issued with respect to the four series of class 7 preferred stock does not exceed 200,000,000 shares).
Our preferred stock has equal preference over our shares of common stock with respect to dividendentitlements and distribution of assets upon our liquidation. However, holders of shares of our preferred stock arenot entitled to vote at general meetings of shareholders, subject to the exceptions provided under our Articles ofIncorporation.
We may acquire shares of second to fourth series of class 5 and first to fourth series of class 6 preferredstock at our discretion pursuant to the terms and conditions provided by our Articles of Incorporation and theresolution of our board of directors. The provisions for acquisition of shares of second to fourth series of class 5and first to fourth series of class 6 preferred stock will be determined by the board of directors at the time ofissuance of such preferred stock. When issued, any holder of shares of first to fourth series of class 6 preferredstock or first to fourth series of class 7 preferred stock may request acquisition of shares of such preferred stockin exchange for shares of our common stock during the period determined by resolution of the board of directorsadopted at the time of issuance of such shares of preferred stock. Any shares of first to fourth series of class 6
12

preferred stock or first to fourth series of class 7 preferred stock for which no request for acquisition in exchangefor shares of our common stock is made during such period will be mandatorily acquired on the day immediatelyfollowing the last day of such period (the “Mandatory Acquisition Date”) in the number obtained by dividing anamount equivalent to the subscription price per each relevant share of preferred stock by the averagedaily closing price of our common stock as reported by the Tokyo Stock Exchange for the 30 trading dayscommencing on the 45th trading day prior to the Mandatory Acquisition Date.
Additionally, in order to enable the relevant preferred stock to meet the criteria for Additional Tier 1 capitalunder Basel III requirements as adopted by the Financial Services Agency of Japan, the terms of the second tofourth series of class 5 as well as all the series of class 6 and class 7 preferred stock have mandatory acquisitionprovisions. When newly issuing these preferred stock, the board of directors will determine events that willrequire us to acquire the relevant preferred stock pursuant to the capital adequacy requirements applicable to us.Upon the occurrence of such events, we will acquire all the relevant preferred stock on an acquisition date, whichis a date determined by the board of directors either at the time of the issuance or after the occurrence of suchevent. We shall acquire the relevant preferred stock in exchange for common stock or for no consideration asdetermined by the board of directors at the time of the issuance, considering certain factors including the marketconditions. The formula to be used in exchanging the preferred stock for common stock will also be determinedby the board of directors at the time of the issuance.
Preferred Dividends
In priority to the payment of dividends to holders of our common stock, the amount of preferred dividendspayable each fiscal year for each class of our preferred stock is set forth below:
‰ second to fourth series of class 5 preferred stock: to be set by resolution of our board of directors at thetime of issuance, up to a maximum of ¥250.00 per share;
‰ first to fourth series of class 6 preferred stock: to be set by resolution of our board of directors at thetime of issuance, up to a maximum of ¥125.00 per share; and
‰ first to fourth series of class 7 preferred stock: to be set by resolution of our board of directors at thetime of issuance, up to a maximum of ¥125.00 per share.
In the event that our board of directors decides to pay an interim dividend to holders of record of ourcommon stock as of September 30 of any year, we will, in priority to the payment of that interim dividend, pay apreferred interim dividend in the amount specified in our Articles of Incorporation to holders of record of ourpreferred stock as of September 30 of the same year. The amount of any preferred interim dividend will bededucted from the preferred dividend payable on the relevant class of our preferred stock for the same fiscal year.
No preferred dividend will be paid on any of our preferred stock converted into our common stock for theperiod from the date following the record date for the preferred dividend or preferred interim dividend lastpreceding the relevant conversion date to the relevant conversion date, but the common stock issued uponconversion will be entitled to receive any dividend payable to holders of record of common stock upon the nextsucceeding record date for common stock dividends.
No payment of dividends on our preferred stock or any other shares can be made unless we have a sufficientdistributable amount and a resolution to distribute such distributable amount is obtained at the relevant ordinarygeneral meeting of shareholders, in the case of annual preferred dividends, or at the board of directors, in the caseof preferred interim dividends.
Dividends on our preferred stock are non-cumulative. If the full amount of any dividend is not declared onour preferred stock in respect of any fiscal year, holders of our preferred stock do not have any right to receivedividends in respect of the deficiency in any subsequent fiscal year, and we will have no obligation to pay the
13
deficiency or to pay any interest regardless of whether or not dividends are paid in respect of any subsequentfiscal year. The holders of our preferred stock are not entitled to any further dividends or other participation in ordistribution of our profits.
Liquidation Rights
In the event of our voluntary or involuntary liquidation, record holders of our preferred stock are entitled,equally in rank as among themselves, to receive before any distribution out of our residual assets is made toholders of our common stock, a distribution out of our residual assets of:
‰ ¥2,500 per share of second to fourth series of class 5 preferred stock;
‰ ¥2,500 per share of first to fourth series of class 6 preferred stock; and
‰ ¥2,500 per share of first to fourth series of class 7 preferred stock.
The holders of our preferred stock are not entitled to any further dividends or other participation in ordistribution of our residual assets upon our liquidation.
Voting Rights
No holder of our preferred stock has the right to receive notice of, or to vote at, a general meeting ofshareholders, except as otherwise specifically provided under our Articles of Incorporation or other applicablelaw. Under our Articles of Incorporation, holders of our preferred stock will be entitled to receive notice of, andhave one voting right per unit of preferred stock at, our general meetings of shareholders:
‰ from the commencement of our ordinary general meeting of shareholders if an agenda for approval todeclare a preferred dividend is not submitted to such meeting; or
‰ from the close of any ordinary general meeting of shareholders if a proposed resolution to declare apreferred dividend is not approved at such meeting.
In each case, holders of our preferred stock will be entitled to receive notice of and vote at the relevantgeneral meetings of shareholders unless and until such time as a resolution of an ordinary general meeting ofshareholders declaring a preferred dividend is passed.
14
Exhibit 11
MUF G Group Code of Conduct 2019

01 If someone asked you wha t MUF G’s most precious asset is, what would you say? I w ould say t rust. Why? Bec ause banking is built on trust – it’s a s simple as that. Think about w ha t our c ustomers and societ y demand from fina nc ial institutions. They expect us to be strong enough to mai nta in a ste ady suppl y of funding e ve n w hen the e conomic c lima te is tre acherous. They expect us to provide reliable f inancial services after a cata strophic na tural disaster . They expe ct us to be a reliable source of he lp a nd advice in times of individual or institutiona l economic struggle . This is w hy MU FG has alw ays va lue d a rela tionship of trust with our custome rs above all else. Building on the princ iple s of those w ho ca me be fore us, we w ork to mainta in, improve, and prote ct our reputation by exemplifying stre ngth and dependability – the building blocks of reputation. They’re the qua lities people look for when choosing a n institution to safeguard one of their most prized posse ssi ons: financi al securi ty. Of course, re puta tion must be sustained by quality servic e. If w e let the customer down, our reputation will colla pse instantly. There’s a sa ying: If a clock ever str ikes thirte en, it w ill fore ve r be doubted, even when it show s the c orre ct time. Once a reputation ha s been damaged, it is not ea sily restored. The refore trust is a matte r of life-and-death for a compa ny like ours, with a massive impa ct on our business results – and even our survival . So: How do we prote ct it? Through a rigorous code of consist ent, trustworthy be ha vi or . The Corporate Vision a nd the Code of Conduct express the values we consider essential to be ing a strong and de pe ndable c ompany. The Corporat e Vision repre sents our basic sta nce and the guiding princ iple s be hind all our acti vitie s. The Code of Conduc t lays forth a set of standards that guide how w e should all make decisions and a ct in our day-to-day work. Together , they’re our guideposts help us do the right t hing at all times. Le ad with your hea rt Message from the G roup CEO

02 But the truest standards are within our ow n hea rts. When struggling to make a dec ision at w ork, w e should look to our c onsci ence and ask, “ Could I explain my c onduct to my fa mil y and fr iends w ith pride?” That answer should lead in t he r ight direction. Likew ise, if you notice anything around you that you suspe ct might contra vene the Code of Conduc t e ven slightly, ple ase do not he sitate. Report it to your supervisor or whistleblowing system right aw ay. Re porting these matte rs is pa rt of doing the r ight thing a nd is the responsibility of eve ry colleague who re presents MU FG. O ur Group entities will a pprecia te your c ourage and be responsible for ca rrying out an appropria te re sponse. No re pe rcussions w ill ever be ta ke n a ga inst a c olle ague who ma ke s a since re a nd hone st report to protect w hat’s r ight. If every one of us t horoughly unde rsta nds the Code of Conduc t, a nd w orks to put it into da ily practic e, we w ill be be tter-equippe d to be the strong a nd dependable financia l institution tha t soc iety and our customers c an trust. Be comi ng the worl d’s most trusted f ina nc ial group depends on ea ch of us – all of us – doing the r ight thing, every ste p of the w ay. April 2019 Ka ne tsugu Mike Member of the Boa rd of Directors, President & G roup CEO
03 Conte nts Message from t he G roup CEO 01 Introduction Corporate Vi sion and Code of Conduct 04 Corporate V ision 05 About the Code of Conduct 07 Fa ilure to Abide by the Code of Conduct 08 Role s a nd Responsibilitie s of Managers 09 Code of Conduct Struc ture of the Code of Conduct 10 Chapter 1. Custome r Focus 11 H onesty and Integri ty 12 Ensuring Q uality 13 Exc eeding Custome r Expe ctations 15 Chapter 2. Responsibility as a Corporate Ci tizen 17 A dherence to Laws and Rule s 18 Pre vention of Financia l Crime 19 Contri buting t o Socie ty 20 Cha pte r 3. Attitudes and Be ha viors in the Workplac e 21 Challenge Ourselves to G row 22 Colla borative and Professiona l W orking Environment 23 Protecting MU FG’s A ssets and P roperty 25 Re porting Proble m Sit ua tions and Seeking A dvic e 26

04 Introduction Code of Conduc t Cha pte r 1 Cha pte r 2 Cha pte r 3 Corporate V ision and Code of Conduc t The diagra m below illustrates the relationship betw een our Corporate V ision a nd Code of Conduct. Our V isi on Our Mission O ur Value s Custome r Focus Responsibility as a Corporate Citizen Attitudes in the Workpla ce A cting to ac hie ve the Corporate V ision Code of Conduct Corporate Vision Chapter 1 Chapter 2 Chapte r 3
05 Corporate Vision The corpora te vision serve s a s the basic policy in conducting our business activitie s, a nd provide s guidelines for all group a ctivities. The corporate vision a lso is the founda tion for management de cisions, including formulating manage me nt strategies and management plans, a nd serve s a s the c ore value for all staff. To be a foundation of strength, committed to me eting the nee ds of our customers, serving society, and fostering sha re d and susta ina ble growth for a be tter w orld. Be the world’s most trusted financia l group Work toge ther to exce ed the e xpec tations of our c ustomers Strive to understand a nd respond to the diverse ne eds of our cust omers. Mainta in and expect the highe st le vels of profe ssionalism and expe rtise, supported by our consolidate d strength. Provide reliable a nd constant support to our c ustomers Give the highest pri ority t o protec ting the interests of our custome rs. Promote healthy, sustaina ble e conomic grow th. Maintain a robust organization that is effecti ve , professiona l, a nd responsive. Expand and strengthe n our globa l presence Leverage our stre ngths and c apabilities to attract a loyal globa l c ustomer ba se. Adapt rapidly to c ha nges in the global e conomy and their impa ct on the needs of our customers. Our Mission O ur Vision

06 Introduction Code of Conduc t Cha pte r 1 Cha pte r 2 Cha pte r 3 Integrity a nd Responsibility Stri ve to be fa ir, transpa rent, and honest. Alw ays a ct re sponsibly in the best inte re sts of c ustomers a nd society, building long-t erm stakeholder relationships and giving back to our c ommuniti es. P rofe ssionalism and Tea mwork Respect the diversity of our fellow worke rs and foster a st rong spirit of te amwork. Expec t t he highest levels of professiona lism. Challenge Ourselves to G row A dopt a globa l pe rspective to anticipa te tre nds and opportunities for grow th. Create and sustain a re sponsive and dynamic workplac e where everyone c an focus on providing outsta nding cust omer servic e and e mbrace new challenges. Our V alues

07 About the Code of Conduct The Code of Conduc t encapsulates the standards that guide sta ff conduct and de cision-making in our day-to-da y busine ss a ctivities under the MU FG Corpora te Vision. I t is de signed to provi de guidance in times of doubt, or when we f ind it difficult to know if we are making the r ight c hoice . (In some cases, the Code of Conduct may be supplemented by additional entity or loc ation spec ific guidelines, which provide further spe cif ic guidance .) In situations w here you fee l unce rta in or f ind it difficult to rea ch a judgeme nt w ith respect to conduct or a conte mpla ted course of conduc t, you should c onsider the following: Is the conduct in line with the lette r, intent, a nd spirit of the la w and regulations a nd of the rule s, protocols, procedure s, a nd other guidelines de termine d by MUF G entities? Is the conduct al igned with the Corpora te Vision a nd the Code of Conduct? A m I telling myself “this i s for the good of the compa ny” merely as an excuse for the conduct? Is the conduct equivalent to “looking the other way”? Is there any possibili ty that others might regard t he c onduct as inappropriate or une thic al? Is the re any possibility tha t the conduct might dama ge or ne ga tive ly impac t my re puta tion or the reputa tion of the c ompany? Could I ta ke pride in the c onduct if it w as reporte d in the media, or othe rw ise made public, including on soci al me dia? All sta ff must undergo training on the Code of Conduc t once a ye ar, as a general rule . In a ddition, eac h member of sta ff must make an atte sta tion in a form det ermined by the relevant Group entity, tha t he or she w ill abide by the MUFG Code of Conduct . Phrases to Watch Out For Be c are ful if you c atch yourse lf or others using la nguage such as: “Just this once” “ Everyone e lse is doing it” “Don’t a rgue” “It’s urgent so we need to ma ke an exception” “It w ouldn’t be mature to rock the boat” D o not fa ll into the trap of failing to t hink cri tically. Ta ke t he ti me t o think c are fully, and do the r ight thing.

08 Introduction Code of Conduc t Cha pte r 1 Cha pte r 2 Cha pte r 3 Failure to A bide by the Code of Conduc t All staff must a bide by the Code of Conduc t, a s w ell as applica ble l aws and regulations, a nd rule s, protocols, and procedures, and othe r guidel ine s dete rmined by G roup MUFG entities. Any c onduct that fa ils to mee t t he se standa rds ma y result in disciplinary me asures, up to and inc luding termination of employment, in accorda nce with the employme nt regul ations and othe r rule s e stablishe d se pa rate ly by individual MU FG c ompanies. Staff may be held pe rsona lly responsible for conduc t that dama ge s the reputation a nd trust of a n MUFG company or damages the compa ny’s i nte rests. Staff may also be he ld responsible for the acti on or inaction of others if the y fail to take action despite knowing about inappropria te behavior or conduc t on the part of others tha t is likely to have a serious negative impact on the trust or inte rests of a ny Group entity, or if they ignore any such conduc t de spite bei ng in a position of responsibilit y requir ing them to know a bout it. In addit ion, staff conduc t may be re ported to the releva nt authoritie s, w hi ch c ould re sult in a f ine , loss of the qua lific ation to work in the financi al industry, and/or even imprisonme nt. What happens if I ca nnot exce ed c ustomer expe ctations or achieve grow th a nd new c ha llenges? Does that mea n I will be subje ct to disciplinary me asures for fai ling to abide by the Code of Conduct? The code of conduct contains a mixture of different guidelines. It ems like “ Acting with honesty and int egrity,” and “Prevention of f ina ncial cr ime” must be follow ed at all times. Others, inc luding “Exc eeding c ustomer e xpe ctations” and “growth and challenges” are more like ta rgets that you should aim toward. But no member of staff will be subj ect to disc ipli na ry me asure s merely for failing to mee t the se targe ts. Mee ting Growing S oc ial Expec tations Socie ty ma ke s increa singly high demands of c ompanies in our line of work. Even in cases w he re there is no cle ar infringement of the law , regulations, or rules, prot oc ols, and procedure s dec ide d by individual MU FG c ompanies, there ma y be serious consequences for conduct that goes against soc ial norms, c ontravenes the prac tices of fair trading or ma rket norms, or i s dee me d inappropria te in the light of the commonly ac cepted values of soc iety—this is pa rtic ula rly true in ca ses where the re has bee n a failure to c onsider the c ustomer’s point of view . We must be aw are of the expe ctations of soc iety at all times.

09 Roles and Re sponsibili ties of Ma na ge rs Managers have several additional roles and re sponsibi lities. (“Manager” here re fers primari ly to Ma na ging Directors, D ire ctors, and ge ne ral, chief and se nior ma na gers wit h responsibility for le ading a tea m.) 1 Lea d by e xample . Y ou should be acute ly a ware of the behavior expecte d of someone in your posi tion, and should be proa ctive about a cting e thic ally in a ccorda nc e with the Corporate Vision a nd the Code of Conduct. 2 Create a workplace environment and atmosphere in which all staff, re gardless of position or job title, can engage in frank a nd constructive discussion in line with the Corporate Vision a nd the Code of Conduct when they are struggling to reac h a w ork-relat ed dec ision. 3 Work t o ensure t ha t sta ff under your supervision understa nd the content of the MU FG Corporate Vision and the Code of Conduct, and ensure that they take responsibility for unde rstanding a nd ac ting in acc ordance wit h these sta ndards. 4 Stri ctly avoid any conduct that could be c onstrue d a s a misuse of your position or influence a s a ma nager. (For example, by plac ing inappropriate pressure on a subordinate for the sake of your own int ere sts or a ctivities.) P roperly overse e the conduct and activitie s of sta ff under your supervision to ensure tha t the y follow a ll applicable law s and regulations, as w ell as rules, protocols, procedure s, and othe r gui de line s de termined by MUFG entities. Ta ke a ppropriate, timely ac tion whe n a problem has arisen or the re a re grounds for concern, e ithe r addre ssing the issue directl y or e sc alating appropriat ely. The Importance of Liste ning As a supe rvisor, how do you respond when one of your tea m c ome s to you w ith a problem? D o you give them your attention, or simply ask w hat they w ant without e ve n looking up from your de sk? When someone c ome s to you for advice, it is importa nt to take the time to listen carefully a nd with an ope n mind t o w ha t t he y have to say. P artic ularly in the case of a proble m that might t ouch on the Code of Conduct, it is vit al to ta ke appropriate me asures promptly before the problem gets out of hand. Remembe r: the bette r you are as a listene r, the more effec tive you will be as a manage r.

10 Introduction Code of Conduc t Cha pte r 1 Cha pte r 2 Cha pte r 3 Structure of the Code of Conduct The Code of Conduct is organize d into three c ha pters. Chapter 1 deals w ith the at titude w e should adopt w ith our customers. Ac ting w ith honesty a nd integrit y and pursui ng the best inte re st s of our c ustomers is a c ore component of our busine ss pra ctice s. H one sty and Integrity Ensuring Q ua lity Excee ding Customer Expecta tions Chapter 2 prese nts a se t of st anda rds de signed to he lp us fulf ill our responsibilitie s a s a good corporate citize n. MUFG ’s re puta tion depends upon the trust a nd confidence of our c ustomers and other sta ke holders, inc luding loc al communities, and we are responsible to soc iety on a globa l level. Adhere nc e to Law s and Rules Prevention of Fi na nc ial Crime Contributing to Societ y Chapter 3 describes the actions and mindset that will crea te a stimula ting and supportive w orking environment as MU FG continues to grow . O ur success depends on building and maintaining a dynamic w orkplace w he re a ll staff can re ach their full potentia l i n w ays that support our cust omers and make a val ua ble contr ibuti on to soci ety a s a whole. Cha llenge Oursel ve s to Grow Collaborative a nd Professional Working Environment Prot ecting MU FG’s A ssets and Prope rty Reporting Problem Situations a nd Se eking Advice

11 Chapter 1. Customer Foc us O ur custome rs are at the ce nte r of everything we do, and should al ways be the focus of our thoughts. Our aim should be to win the trust and confidence of our c ustomers a t all times. MU FG exists toda y bec ause of the trust and c onfidence that customers have place d in us over ma ny years. Our role is to increase a nd stre ngthen this bedroc k of t rust and confide nc e. Our a ctivities are not drive n by t he prospec t of short-te rm ga ins. Inste ad, w e look to build ongoing relat ionships w ith our c ustomers to support their long-term grow th.

12 Introduction Code of Conduc t Cha pte r 1 Cha pte r 2 Cha pte r 3 Our customers a re a t the c enter of everything w e do. We c arry out fa ir and tra nsparent corpora te activitie s w ith honesty and integrity. We trea t c ustomer assets with care and re spe ct and str ive alw ays to ensure that our ac tions do not unjustly damage our custome rs’ interests. Act ing with Honesty and Integrity Eve ry single piec e of work that a ny one of us does is rela ted to our customers. We plac e our custome rs at the cente r of everything we do. Our thoughts are alwa ys of how best to he lp our customers, and we w ork fair ly and honestly to support our c ustomers’ long-term sustained growth. Safegua rding Customer A sse ts (Inc luding Informa tion) Our customers e ntrust us with important assets, such a s c ash and sec urities as w ell as informa tion. They place trust and c onfide nc e in us to safe gua rd the se important assets. The loss, le akage, or misuse of our c ustomers’ informa tion ca n not only ca use se rious damage to customer interests, but ca n a lso seriously unde rmine the trust and c onfidence that MUFG has built up over many ye ars. We treat our c ustomers’ assets wit h the utmost c are , a nd ensure that they are properly safeguarde d at a ll time s. Protecting Customer Interests Properly We act wi th hone sty a nd integrity to ensure that our conduct does not unjustly damage c ustomer inte rests. MUFG is an integra ted financia l group made up of diverse business entitie s. When conducti ng business wit h customers, we are se nsit ive t o the possibility of conflic ts of inte re st that may exist betwe en customers or betwe en a custome r and a Group entity. We act appropria tely at all times, in line with the guidelines on ma na ging conflicts of interest. About P erformance O bjectives H ave you ever felt a c onflict of interest betwe en achieving your targets and mai nta ining the custome r’s trust? As a company, w e ha ve a re sponsibi lity to ac hie ve our objec tive s. But these must be a chieved by doing the right thing and earning trust and reputation from our customers. If you ever fee l any c onflict betwe en achieving a n objecti ve and maintaining the c ustomer’s trust, alw ays prioritiz e the customer’s trust a bove everything else. Remind yourse lf that achie ving obje ctives is only meaningful if it is achieved by following the c orre ct procedure s. H one sty and Integrity
13 To build la sti ng re lationships of trust and confidence w ith our c ustomers, w e listen carefully to what our custome rs are telling us, and maintain thoroughgoing qual ity control of a ll our products and service s, from planning and de ve lopment to provision and subseque nt revisions, wit h a view to further e nha nc ing quality. Be st P ossible Products and Services for Customers O ur custome rs expect trustw orthiness and honesty in our conduc t. In orde r to earn trust from custome rs and build lasting positive busine ss relationships wi th them, it is importa nt to maintain thorough qua lity c ontrol a t all stages in t he deve lopment and de live ry of our produc ts a nd servi ces. Quality control means developi ng and providing the be st possible products a nd servic es for c ustomers, a nd ensuring accuracy and sa fe ty in all our business deali ngs. To this e nd, it is import ant to alw ays ke ep in mind the follow ing princ ipl es: 1 When planning and de ve loping product s a nd servic es, we cle arly define the custome rs for w hom they are inte nde d, and ascertain a cle ar se nse of c ustomer ne eds. 2 Ensure tha t the na ture of products and se rvices a re unde rstood by the customers and that a ny associat ed r isks a re w ithin a ccepta ble le vels for the customers. 3 Ensure that products and service s proposed and provided to customers ma tch their purposes, ne eds, know ledge, experie nc e, financia l capabilitie s, and othe r re levant conditi ons. 4 We should be equipped w ith t he knowledge and skil ls nec essary to propose a nd provide our products a nd servic es. Give cle ar a nd acc urate e xpla na tions that allow c ustomers to unde rstand the nature a nd risks of our produc ts a nd services as we ll as to understa nd and acc ept the r isks a ssoc iated with them. Be fair-minded, courteous, a nd sincere in all dealings w ith our c ustomers. Take customer c omments, wishes, and c omplaints seriously and share them appropriate ly w ith the rele va nt divisions wit hin MUFG to improve qua lity. Ensuring Quali ty
14 Introduction Code of Conduc t Cha pte r 1 Cha pte r 2 Cha pte r 3 Unending Work to Improve Quality We regularly confirm tha t our products and service s are me eting the nee ds of our customers, and work constantly to review a nd improve the qualit y of a ll our products and service s. What does qua lity c ontrol mea n in f ina nc ial servic es? Qua lity c ontrol is a te rm often used in manufac turing businesses, but w ha t does it. mean for us in the f inancial se rvices industry? The f inancial products and se rvice s w e provide are diffe rent from t angible products that ca n be inspe cted by e ye and held in the ha nd. But w e must a lways keep in mind the idea of qua lity c ontrol i n assessing our se rvice s the sa me w ay as physica l products. Do they meet customer nee ds, and are our se rvices ac cessible and easy to use ? Because our products and se rvice s c annot be chec ke d by the eye, it i s vital to monitor quality control through the “li fe cyc le ba se,” from the planning a nd developme nt sta ge to sale s a nd beyond to aft er-servic e care. If there is a problem, it will often be a ppa rent from our interact ions with the custome r. Often, staff at the compa ny wi ll be a ware of the problem before anyone e lse . I t is important alwa ys to be awa re of w hat custome rs are thinking in te rms of the ir perceptions of se rvice .
15 We aim to me et the dive rse nee ds of our customers w orldwide, and to provide servic es excee ding their e xpec tations through the highest standards of professiona lism, by le vera ging our global netw ork and the consolida ted strengths of the entire G roup. Improving Expertise Customer ne eds a re bec oming more dive rse a nd sophistica ted all the time. To provide our c ustomers with the best possibl e produc ts a nd servic es, every one of us w orks to improve our profe ssional know ledge and expe rtise. Levera ging the Consolidated Strengths of MUFG Our customers have high e xpec tations of the consolidated strengths of MUFG , a s a group that brings together dive rse busi ne ss e ntitie s. For our c ustomers, MUF G is a single c ompany. W e me et those expe ctations not by focusing on our c ontr ibutions as individua ls but through te amwork. We will c ontinue to provide services that exce ed customer expecta tions by bri nging our strengths and capabilitie s together and a cting a s a n inte grated group. U sing Our G loba l Netw ork As our custome rs become incre asingly globa l in their business act ivitie s, they choose financia l products and servic es ba sed on a ca reful comparison w ith those availa bl e around the w orld. We use MUF G’s global ne twork to provide outstanding products and se rvice s that a re truly w orld c lass. Exce eding Customer Expect ations

16 Introduction Code of Conduc t Cha pte r 1 Cha pte r 2 Cha pte r 3 Le ssons Lea rned Reports on c orporate sc anda ls a ppe ar in the media almost on a daily basis. Y ou must ne ve r think that these sca nda ls a re something that doesn’t concern us. What has ha ppe ne d a t other compa nie s c ould happe n here too. Sc andals ha ve affect ed MUF G compa ni es as well. We must analyze the reasons for these failure s, discuss ways of ensuring the y do not happen a gain, a nd then imple me nt these me asures thoroughly. Being humble enough t o lea rn from our own mistakes and t hose of others is a key part of w hat it takes to build a good, strong company.

17 Chapter 2. Responsibility as a Corporate Cit izen As we de ve lop our business globa lly, w e comply with all the domestic and inte rnational law s and rules tha t ma y a pply. We do all w e ca n to maintain stability a nd confidenc e in the global financia l syste m, and contribute to the sound and healthy growth of soc iety. Awa re of the responsibility eac h of us has as a member of MUFG , we ca rry out fa ir and transparent corporat e activitie s w ith honesty a nd integrity, in a manne r that supports a nd stre ngthens the trust and confidence MUFG ha s e arned from soci ety over ma ny years.

18 Introduction Code of Conduc t Cha pte r 1 Cha pte r 2 Cha pte r 3 In addition to adhering stric tly to all dome stic and i nte rnational law s a nd rule s, w e strive to do the r ight thing base d on our str ict code of et hic s. V iola tions of la ws or rules damage the vital social infrastructure of the f inancial system and lead to a loss of trust in MU FG. We str ictly abide by all la ws and rules re lating to our business, including the followi ng areas: Prohibition of Insider Tra ding Insider trading is ille ga l in many countr ies and i s str ictly re gulate d, regardle ss of the a mount of money involved. We manage material information r igorously and ha ve no involvement in activitie s that use mate rial nonpublic informa tion to gain illegal profits. Ban on U nfair Trading Practic es As a participant in a fair , transparent, a nd free compet itive ma rket, we ha ve no involvement with unfair tra ding prac tices ( inc luding cartels, abuse of dominant position, a nd marke t ma nipulati on). We a bi de str ictly with all the law s and rules in plac e to prot ect fair trading, including f irew all regula tions and the arm’s length rule . A nti-bribery and Corrupt ion Bribery is a se rious proble m a round the world, and ma ny countrie s have str ict law s prohibiting all forms of bribe ry. We ha ve zero tolerance for bribery of all kinds. Appropria te Disclosure To ensure that MUFG is properly understood and e va lua ted in the w ide r society, it is inc umbent on us to e nsure that compa ny informa tion is disclosed in a time ly and appropriat e ma nne r, including financi al re ports. Concea lme nt or nondisc losure of informa tion damages our trust and reputation. We will not be involved in any inaccurate or inappropria te disclosure of informa tion, or in any a ttempt to c once al informa tion. Adherence to La ws and Rules

19 We have ze ro tol era nc e for f inancial c rime or a ny atte mpt to circ umvent the rule s a nd proce dures aimed at preventing financia l crime . We ta ke all re asona ble steps possibl e to prevent our products and servic es be ing used by indi viduals or entitie s involve d in illegal or improper activitie s such as mone y laundering and terrorist f ina nc ing. Prevention of Mone y Launde ring and O the r Misuse of Financial Se rvices O ur custome rs place their trust in us beca use the y a re confi de nt that the f ina nc ial servi ces we provide contri bute to healthy soc ioe conomic development. We re ma in a lert to the possibility that the financia l se rvice s provided by MUFG on a globa l ba sis ma y be misuse d to fa cilita te financia l crime s such as money laundering, terrorist f inancing, investment fraud, and illegal w ithdrawa ls using counterfe it or stol en c ards, and do everything in our power to prevent illicit ac tivities involving our products and se rvices. No Rela tionships w ith Criminal Ele ments A ll rel ationships with any c riminal ele me nts a re str ictly forbidden. We work closely with the police, legal counsel, and other rele va nt e xte rnal orga niz ations to protec t the sa fety of all our staff. What Is F ina nc ial Crime ? In addition to money laundering, which aims to give an appearance of le git ima cy to income from ta x e va sion, smuggling, organiz ed c rime, ille ga l a rms dealing, a nd other c riminal ac tivitie s, f inancial c rime covers te rrorist financ ing, economic sanctions, bribery, a nd corruption, as we ll as fraud, counterfeiting, impe rsona tion, and ot he r atte mpts to illicitly obta in f inancial asse ts from a custome r or f inancial institution. Prevention of Fi na nc ial Crime
20 Introduction Code of Conduc t Cha pte r 1 Cha pte r 2 Cha pte r 3 We re spe ct the history, c ultures, a nd customs of diffe rent countrie s a nd re gions around the w orld, and w ork to contr ibute to the developme nt of loca l and global communities and the protecti on of the environment throughout our corporate ac tivities and t he socia l volunteer efforts of our staff. Giving Ba ck to Communitie s A s a good c orporate citize n, MUFG is proa ctively enga ge d w ith loc al communities and contributes to thei r developme nt. A s members of regional communities a nd the global c ommuni ty, we volunteer actively to take part in ac tivit ies tha t ma ke a meaningful contr ibut ion to soc iety. Commitment to the Environment We w ork to minimize the environmental impact of our corporate ac tivit ies, a s well as str iving to de ve lop and supply products and servic es tha t contr ibut e to e nvironmental c onservation a nd protec tion, thus contr ibuting to making a susta ina ble soc iety a rea lity. Sustaina ble G row th H ave you ever he ard of “ESG ” or “SD Gs”? ESG sta nds for “Environment, Soc ial and Governance ”; thre e essential ele ments for the long-term grow th of a company. SDG s (“Sustainable D evelopme nt G oals”) a re the bluepri nt for coope rati ve inte rac tions betw een na tiona l governments and private c ompanies to tackle social issues, such a s c lean energy a nd economic growth, to a chieve a better global future. Our c ustomers a nd investors now ha ve a strong te nde nc y to view companies from such perspec tives. Wi th the development of the ‘informa tion societ y’ , i nc luding the i ntroduction of social netw orking services, our soc iety ha s bec ome a pla ce whe re good and ba d c onduct can be qui ckly a nd easily reveale d to the public. Inc rea singly, a compa ny that engages in prope r conduc t as a corpora te citiz en c an win more trust from c ustomers a nd rece ive positive evaluations from investors. Howe ve r, the re ve rse is also true. With conside ra tion of the public na ture of f ina nc ial servi ces and our position in the industry, we must assume that soc ial expecta tions towa rds MU FG are very high and it is the refore e sse ntial that eac h member of staff and e xe cutive engages in proper conduct w ith a n understa nding of those e xpec tations. Contributing to Society

21 Chapter 3. Attitudes and Be haviors in the Workplac e We stri ve to respond and a da pt promptly to the diversifying and evolving needs of our customers and the rapidly c ha nging environme nt in which we w ork. The worki ng environment at MU FG foste rs mutual respect, ena ble s individua ls to make the most of the ir abilities a s professiona ls, a nd maximizes the power of teamw ork a cross regi ons and diffe rent areas of busine ss, e nc ouraging all sta ff to embra ce new c ha llenges. We work alw ays to prote ct and ma inta in the ta ngible and intangible a sse ts and property tha t MUF G has acc umulate d.

22 Introduction Code of Conduc t Cha pte r 1 Cha pte r 2 Cha pte r 3 We strive to enhance our know ledge, expe rtise, and pote nti al and maximize the powe r of te amwork. We believe that the cha nging business environme nt repre se nts opportunit y and are alwa ys ready to e mbrace new challenges in ne w fi elds. Pe rsonal Grow th A s the ne eds a nd busine sse s of our c ustomers continue to evolve , it is essentia l t ha t w e too c ontinue to grow profe ssi onally so as to provide the best possible products and se rvices for custome rs. We endeavor to improve our individua l skills, abilitie s, and pote ntia l, t hrough our work and by taking a dvanta ge of training and e duca tiona l opportunities both inside a nd outside of MU FG. We proac tively support the efforts of a ll MUF G staff toward pe rsonal growth. Tea mwork We share d information, skills, and e xpertise, working in te ams to a ccompl ish goals tha t individuals working a lone c ould not have a chieved. W e are committe d to maximizing the powe r of tea mw ork in pursuit of our business. Openness to New Chal lenge s We work to adapt adroitly to c ha nges in our customers and in society, taking on ne w challe nge s. Monitoring developme nt s in society and change s in the busine ss environment with ever greate r vigilance, w e embrac e new challe nge s in the belief that change re presents opportunity. G row th and Challenges Le arning and e xperience a re importa nt aspec ts of how w e grow as people. But sometimes chall enge s a re nec essary too. P artic ularly when major c ha nges a re happening, ac cepting a challenge without fea r of failure c an lead to ma jor growth. This applies not only to individuals but to entire organizat ions. There is no grow th w ithout challe nges, and no succe ss w ithout growth. Cha llenge Ourse lve s t o G row

23 We respe ct the huma n r ights and diversity of all MUFG sta ff . We do not e ngage in or tolerate any form of discrimina tion or harassment or any other be ha vior tha t infri nges these belie fs. Respect for Human Rights and Diversit y A s a global group, our workforc e is highly diverse in te rms of ra ce, national origin, bel ief, religion, disabilities, fa mily origin, ge nde r, sexua l orientation, ge nder identity, a ge , a nd health status. Diversity is one of MU FG’s st rengths. We do not tolerate discrimina tion or infringement of the rights of any individua l, a nd re spe ct a diversity of values. Open Communication We stri ve to creat e an open and vibrant workplace in w hic h sta ff dea l with one a nother with sinc erity a nd honesty, re ga rdless of posi tion, helping and re spec ting e ach ot he r. Prohibition of H arassme nt H arassment undermines the dignit y of the recipient and seriously da ma ge s t he smooth running of the organization. W e do not c ommit or tolerate a ny sexual hara ssme nt, power ha rassment, or other thre atening or hostile behavior , including harassment from exte rnal sources. Collaborat ive a nd Professional Working Environme nt

24 Introduction Code of Conduc t Cha pte r 1 Cha pte r 2 Cha pte r 3 Harassment in the Workplac e Workplace se xua l harassment is de fined as unw elcome sexual advance s or c onduct of a sexual nature ma de against a nother pe rson in the w orkpla ce, whether of the same or opposite sex. Sexual harassment ma y be “quid pro quo” hara ssme nt, in which there is a t hreat of dismissal, demotion, pa y reduction, or loss of othe r benefit if the advances are refused. In “hostile work environment” harassment, c onduct of a sexual nature unreasonably interfe res w ith the performa nc e of a person’s job or create s a hostile or offensive work environment. Power ha rassment is when a person abuses a position in the w orkpla ce hierarchy to cause mental or physical suffering to anot he r person in the w orkplace through c onduct that goe s be yond w hat is appropriate for work-related reasons, crea ting a negative w ork environme nt. MUFG c ompanies take str ict disciplinary mea sures to dea l with any a nd all a cts of incidents of ha rassment.
25 We protec t the tangible a nd intangibl e assets and prope rty of MU FG a nd individual Group entitie s, and do not tole rat e any behavior that might da ma ge the se assets. The ta ngible and intangible a sse ts tha t MU FG has acc umulate d through it s c orporate a ctivities play an importa nt role in our business operations. We c ontinue to cont ribute to the a ccumulation of c orporate assets, support their proper protecti on and ma na ge ment, a nd do not tolera te any pe rsonal misuse of these a ssets. Protec ting MUFG ’s Assets and Property

26 Introduction Code of Conduc t Cha pte r 1 Cha pte r 2 Cha pte r 3 If you be come awa re of c onduct that contra ve ne s the la w, compa ny regula tions, or the provisions of this Code of Conduc t, or any other proble m situations, you should promptly report the matte r and seek advice from a supervisor or issue a report via MUFG ’s w histle blow ing system. V iolations of la ws, re gulations and MUF G polic ies, protoc ol s a nd proce dures cannot only se riously damage the trust a nd confidenc e tha t we have built up among our customers a nd the wider soc iety, but may also c ause losse s to MUFG a s a whole. If you suspect there is any proble m w ithin the company, you should promptly report the matte r to an appropriate person, for example a supe rvisor or senior manager, or you should use the various w histle blow ing arra ngeme nts in pl ace a cross the Group or othe r means availa ble loc ally. Whe the r the whistle blowi ng arrangements are used or not, the person who rece ives the report or information a bout any proble m w ill tre at it in the str ictest confi de nc e and MUF G is committe d to ensuring tha t reporting staff do not suffe r re talia tion or other negative c onsequence s. Spea k U p If you have conce rns or questions about conduct that you think might c ontravene the law , c ompany regulations, or t his Code of Conduct, be sure to report the matte r promptly to the appropria te person or seek advice from a supervisor or person in c ha rge of compliance issues, or use the whistleblowing system esta blished wit hin ea ch MUF G compa ny. Ne ve r worry that you might be making a fuss a bout some thing minor. Trust your se nse tha t something i s w rong. The re w ill never be any re pe rcussions for re porting a matt er through the w histle blow ing system. Manage me nt w ill be responsible for ca rrying out full a nd proper i nvestigation into the matte r you have brought to our attention. By speaking up, you help t he c ompany to prevent scandals and violations be fore the y happen, and minimize the damage ca use d by infri ngements that have already taken pl ace. Reporting Problem Situations and Se eking A dvice
Mitsubishi U FJ F ina nc ial Group, Inc. Complia nce Division Corporate Pla nning Division A pril 2019 establishme nt

Excerpts from MUFG’s Compliance Rules
(English Translation)
(Objective)
Article 1.
These rules prescribe basic matters relating to compliance with laws and regulations.
(Revision and abolition)
Article 2.
These rules may be revised or abolished by decision of the Executive Committee; provided, however, thatany material revision or abolishment of rules relating to the duties and responsibilities of the Board of Directorsor Member of the Board of Directors shall be made pursuant to a resolution of the Board of Directors.
(Definitions)
Article 4.
(1) In these rules, “laws and regulations” mean laws and government ordinances to be strictly observed byMUFG personnel when carrying out business operations, as well as MUFG’s Articles of Incorporation,Code of Ethics, and other rules and regulations established according to the laws and governmentordinances above.
(2) In these rules, “compliance” means understanding the purpose and contents of laws and regulationsproperly, and behaving in an appropriate manner so as not to violate applicable laws and regulations.
(3) In these rules, “affiliates” is a general term for MUFG’s consolidated subsidiaries and affiliated companiesaccounted for by the equity-method.
(4) In these rules, “MUFG Group” means MUFG and its affiliates.
(Fundamental Policy)
Article 5.
The MUFG Ethical Framework and Code of Conduct are the foundations of compliance at MUFG.
(Responsibilities of Members of the Board of Directors, Corporate Executives (Shikko Yaku), Executive officers(Shikko Yakuin) and Board of Directors)
Article 6.
(1) In accordance with the “Ethical Framework and Code of Conduct”, MUFG Members of the Board ofDirectors, corporate executives (shikko yaku) and executive officers (shikko yakuin) must carry out theirresponsibilities with the recognition that compliance is one of the most important objectives of management.
(2) The board of directors must establish systems necessary for compliance and seek to achieve and maintaincompliance.
(Responsibility of MUFG Managing Directors)
Article 7.
Managing Directors must implement compliance within their division.

(Responsibility of MUFG Employees)
Article 8.
(1) MUFG employees must ensure compliance while performing their duties, and act in accordance with the“Ethical Framework and Code of Conduct”.
(2) MUFG employees must strive to acquire adequate knowledge of the laws and regulations which arenecessary to their business operations.
(Directors in charge of the Global Compliance Division and the Global Financial Crimes Division)
Article 10.
(1) The Directors in charge of the Global Compliance Division and the Global Financial Crimes Division mustreport matters concerning compliance to the Board of Directors or Executive Committee as necessary.
(2) When there is a risk of an unavoidable conflict of interest with a different division that the director in chargeof the Global Compliance Division is also in charge of, to insure the independence of the GlobalCompliance Division, the managing director of the Global Compliance Division shall report to the Presidentand CEO. The President and CEO will report to the Board of Directors or Executive Committee asnecessary. Appropriate action shall also be taken to avoid conflicts of interest in cases other than thosementioned above.
(Office in Charge of Compliance)
Article 11.
(1) The Global Compliance Division is in charge of overseeing the overall compliance framework.
* * *
(4) When the Global Compliance Division receives reports of problems or possible problems relating tocompliance, or when it discovers such problems itself, it must take necessary actions.
Article 11. ii
The Global Financial Crimes Division is in charge of overseeing the Group’s measures and managementsystems concerning global financial crimes, including money laundering prevention, economic sanctionsmeasures, and bribery and corruption prevention.
(Compliance Officers Responsible)
Article 12.
The head of each business group is the compliance officer responsible for that business group. Thecompliance officer responsible oversees their business group and is responsible for any compliance relatedplanning and supervision within their jurisdiction.
(Group Chief Compliance Officer)
Article 13.
(1) A Group Chief Compliance Officer (CCO) (primarily the responsibility of the Global Compliance Divisionand the Global Financial Crimes Division) will be appointed based on Article 19 Paragraph 2 of theOrganizational Regulations. When there is no appointed Group CCO, the director overseeing the GlobalCompliance Division will act as CCO.

(2) The Group CCO (or in cases where there is no Group CCO, the CCO) shall oversee the coordination ofdivision compliance officers (defined in Article 14), the chief compliance officer of each company in theMUFG Group, and any persons filling both those roles, as well as provide necessary guidance, advice andinstruction based on the management agreement.
(3) The Group CCO (or in cases where there is no Group CCO, the CCO) can request reports on compliancematters from the specified compliance officers responsible (defined in Article 12).
* * *
(Division Compliance Officers)
Article 14.
(1) A chief manager in each division will serve as division compliance officer. Each managing director mayappoint a person equivalent to a chief manager as division compliance officer. In such cases, the managingdirector should report to the Global Compliance Division in the Corporate Center, the compliance officerresponsible for each business group (defined in Article 12), or the Global Compliance Division.
(2) The division compliance officer is responsible for the strengthening of compliance in each division and forplanning and supervising compliance related issues regarding business matters under their jurisdiction.Furthermore, the compliance officer will carry out duties including the management and compliancechecking of documents, gathering information concerning the establishment and revision of laws relating tothe duties of each division, working to improve general compliance conditions, and will play a central rolein implementing compliance measures in each division.
(Responsibilities of Managing Directors)
Article 15.
When the managing director receives reports of problems or possible problems relating to compliance fromthe division compliance officer, or when they discover such problems themselves, they must consult with themanaging director of the Global Compliance Division as well as provide orders and instructions to the divisioncompliance officer. Furthermore, in each business group, they must report to the compliance officer responsible.
(Compliance Reporting System)
Article 16.
(1) When a MUFG employee discovers problems or possible problems relating to compliance, they must reportdirectly to their senior managers and the division compliance officer as stipulated in Article 14.
(2) A person receiving such report must treat the report with appropriate care in working towards a resolution.Furthermore, the information relating to any reporting person must be treated with appropriate caution.
(3) When the compliance officers receive reports of or otherwise detect violations of laws and regulations, orpossible violations, they must report directly to the Global Compliance Division or the Global FinancialCrimes Division and the managing director of their division. In cases where the managing director isinvolved in inappropriate conduct or behavior (including cases where such involvement is suspected orwhere a determination as to such involvement is difficult to make), such reports must be made to the GlobalCompliance Division or the Global Financial Crimes Division.
(4) When a MUFG employee does not wish to report to their senior managers and the division complianceofficer due to said officer being complicit in a violation of laws and regulations or the possibility thereof, orwhen no response or remediation is made despite an employee having made a report, the employee canreport directly to the Global Compliance Division. In each business group, reports can be made to necessaryparties other than those mentioned above, based on the instructions of the compliance officer responsible(defined in Article 12).
(5) When a report of a problem or possible problem relating to compliance are made, it shall be prohibited totake any action to seek or identify the person who made the report or take any adverse employment actionagainst such person for making the report.
Excerpts from MUFG’s Compliance Manual
(English Translation)
I. Legal issues regarding Management
(3) Board Director and Corporate Executive
(4) Transactions involving a conflict of interest
When a Board Member or a Corporate Executive engages in a transaction involving a conflict ofinterest, the Board Member or the Corporate Executive must receive the approval of the Board ofDirectors.
III. Specific issues
5. Conflicts of interest
When a conflict of interest arises in connection with an operation involving any of the MUFG Groupcompanies, Directors or employees, on one hand, and a customer or other third-party, the Director oremployee, the MUFG Group company to which such Director or employee belongs, or any otherMUFG Group company, on the other, the MUFG Group company, Director or employee must performthe operation in a proper manner.
Excerpts from MUFG’s Rules of Employment
(English Translation)
(Disciplinary Action)
Article 40.
The company will take disciplinary action when employees take the following prohibited actions:
(17) If an employee violated the rules of employment or any other applicable internal rules.

Exhibit 12
CERTIFICATION
I, Kanetsugu Mike, certify that:
1. I have reviewed this annual report on Form 20-F of Mitsubishi UFJ Financial Group, Inc.;
2. Based on my knowledge, this report does not contain any untrue statement of a material fact or omit to statea material fact necessary to make the statements made, in light of the circumstances under which suchstatements were made, not misleading with respect to the period covered by this report;
3. Based on my knowledge, the financial statements, and other financial information included in this report,fairly present in all material respects the financial condition, results of operations and cash flows of thecompany as of, and for, the periods presented in this report;
4. The company’s other certifying officer(s) and I are responsible for establishing and maintaining disclosurecontrols and procedures (as defined in Exchange Act Rules 13a-15(e) and 15d-15(e)) and internal controlover financial reporting (as defined in Exchange Act Rules 13a-15(f) and 15d-15(f)) for the company andhave:
(a) Designed such disclosure controls and procedures, or caused such disclosure controls and procedures tobe designed under our supervision, to ensure that material information relating to the company,including its consolidated subsidiaries, is made known to us by others within those entities, particularlyduring the period in which this report is being prepared;
(b) Designed such internal control over financial reporting, or caused such internal control over financialreporting to be designed under our supervision, to provide reasonable assurance regarding thereliability of financial reporting and the preparation of financial statements for external purposes inaccordance with generally accepted accounting principles;
(c) Evaluated the effectiveness of the company’s disclosure controls and procedures and presented in thisreport our conclusions about the effectiveness of the disclosure controls and procedures, as of the endof the period covered by this report based on such evaluation; and
(d) Disclosed in this report any change in the company’s internal control over financial reporting thatoccurred during the period covered by the annual report that has materially affected, or is reasonablylikely to materially affect, the company’s internal control over financial reporting; and
5. The company’s other certifying officer(s) and I have disclosed, based on our most recent evaluation ofinternal control over financial reporting, to the company’s auditors and the audit committee of thecompany’s board of directors (or persons performing the equivalent functions):
(a) All significant deficiencies and material weaknesses in the design or operation of internal control overfinancial reporting which are reasonably likely to adversely affect the company’s ability to record,process, summarize and report financial information; and
(b) Any fraud, whether or not material, that involves management or other employees who have asignificant role in the company’s internal control over financial reporting.
July 10, 2019
/s/ Kanetsugu Mike
Name: Kanetsugu MikeTitle: President & Group Chief Executive Officer

CERTIFICATION
I, Muneaki Tokunari, certify that:
1. I have reviewed this annual report on Form 20-F of Mitsubishi UFJ Financial Group, Inc.;
2. Based on my knowledge, this report does not contain any untrue statement of a material fact or omit to statea material fact necessary to make the statements made, in light of the circumstances under which suchstatements were made, not misleading with respect to the period covered by this report;
3. Based on my knowledge, the financial statements, and other financial information included in this report,fairly present in all material respects the financial condition, results of operations and cash flows of thecompany as of, and for, the periods presented in this report;
4. The company’s other certifying officer(s) and I are responsible for establishing and maintaining disclosurecontrols and procedures (as defined in Exchange Act Rules 13a-15(e) and 15d-15(e)) and internal controlover financial reporting (as defined in Exchange Act Rules 13a-15(f) and 15d-15(f)) for the company andhave:
(a) Designed such disclosure controls and procedures, or caused such disclosure controls and procedures tobe designed under our supervision, to ensure that material information relating to the company,including its consolidated subsidiaries, is made known to us by others within those entities, particularlyduring the period in which this report is being prepared;
(b) Designed such internal control over financial reporting, or caused such internal control over financialreporting to be designed under our supervision, to provide reasonable assurance regarding thereliability of financial reporting and the preparation of financial statements for external purposes inaccordance with generally accepted accounting principles;
(c) Evaluated the effectiveness of the company’s disclosure controls and procedures and presented in thisreport our conclusions about the effectiveness of the disclosure controls and procedures, as of the endof the period covered by this report based on such evaluation; and
(d) Disclosed in this report any change in the company’s internal control over financial reporting thatoccurred during the period covered by the annual report that has materially affected, or is reasonablylikely to materially affect, the company’s internal control over financial reporting; and
5. The company’s other certifying officer(s) and I have disclosed, based on our most recent evaluation ofinternal control over financial reporting, to the company’s auditors and the audit committee of thecompany’s board of directors (or persons performing the equivalent functions):
(a) All significant deficiencies and material weaknesses in the design or operation of internal control overfinancial reporting which are reasonably likely to adversely affect the company’s ability to record,process, summarize and report financial information; and
(b) Any fraud, whether or not material, that involves management or other employees who have asignificant role in the company’s internal control over financial reporting.
July 10, 2019
/s/ Muneaki Tokunari
Name: Muneaki TokunariTitle: Group Chief Financial Officer

Exhibit 13
MITSUBISHI UFJ FINANCIAL GROUP, INC.
CERTIFICATION REQUIRED BYRULE 13a-14(b) OR RULE 15d-14(b)
AND 18 U.S.C. Section 1350
In connection with the Annual Report of Mitsubishi UFJ Financial Group, Inc. (the “Company”) onForm 20-F for the fiscal year ended March 31, 2019 as filed with the US Securities and Exchange Commissionon the date hereof (the “Report”), I, Kanetsugu Mike, President & Group Chief Executive Officer of theCompany, hereby certify, pursuant to 18 U.S.C. Section 1350 that:
1. The Report fully complies with the requirements of Section 13(a) or 15(d) of the Securities Exchange Actof 1934; and
2. The information contained in the Report fairly presents, in all material respects, the financial conditionand results of operations of the Company.
Dated: July 10, 2019
/s/ Kanetsugu Mike
Name: Kanetsugu MikeTitle: President & Group Chief Executive Officer

MITSUBISHI UFJ FINANCIAL GROUP, INC.
CERTIFICATION REQUIRED BYRULE 13a-14(b) OR RULE 15d-14(b)
AND 18 U.S.C. Section 1350
In connection with the Annual Report of Mitsubishi UFJ Financial Group, Inc. (the “Company”) onForm 20-F for the fiscal year ended March 31, 2019 as filed with the US Securities and Exchange Commissionon the date hereof (the “Report”), I, Muneaki Tokunari, Group Chief Financial Officer of the Company, herebycertify, pursuant to 18 U.S.C. Section 1350 that:
1. The Report fully complies with the requirements of Section 13(a) or 15(d) of the Securities Exchange Actof 1934; and
2. The information contained in the Report fairly presents, in all material respects, the financial conditionand results of operations of the Company.
Dated: July 10, 2019
/s/ Muneaki Tokunari
Name: Muneaki TokunariTitle: Group Chief Financial Officer

Exhibit 15(a)
CONSENT OF INDEPENDENT REGISTERED PUBLIC ACCOUNTING FIRM
We consent to the incorporation by reference in the Registration Statement No. 333-230590 on Form S-8and the Registration Statement No. 333-229697 on Form F-3 of our reports dated July 10, 2019, relating to theconsolidated financial statements of Mitsubishi UFJ Financial Group, Inc. (“MUFG”) and subsidiaries (together,the “MUFG Group”) (which report expresses an unqualified opinion and includes an explanatory paragraphrelating to the change in accounting principle for its method of accounting for unrealized holding gains andlosses on equity investment securities due to the adoption of Financial Accounting Standards Board AccountingStandards Update 2016-01, Financial Instruments—Overall (Subtopic 825-10)—Recognition and Measurementof Financial Assets and Financial Liabilities as discussed in Note 1 to the consolidated financial statements), andthe effectiveness of the MUFG Group’s internal control over financial reporting, appearing in the Annual Reporton Form 20-F of the MUFG Group for the year ended March 31, 2019.
/s/Deloitte Touche Tohmatsu LLC
Tokyo, JapanJuly 10, 2019
Exhibit 15(b)
CONSENT OF INDEPENDENT REGISTERED PUBLIC ACCOUNTING FIRM
We consent to the incorporation by reference in Registration Statement No. 333-229697 on Form F-3 and inRegistration Statement No. 333-230590 on Form S-8 of Mitsubishi UFJ Financial Group, Inc. of our reportsdated February 26, 2019, relating to the consolidated financial statements of Morgan Stanley, and theeffectiveness of Morgan Stanley’s internal control over financial reporting, appearing in the Annual Report onForm 10-K of Morgan Stanley for the year ended December 31, 2018.
/s/ Deloitte & Touche LLP
New York, New YorkJuly 10, 2019

Exhibit 99(a)
CAPITALIZATION AND INDEBTEDNESS
The following table presents our capitalization and indebtedness at March 31, 2019:
At March 31,2019
(in millions)
Total short-term borrowings(1) . . . . . . . . . . . . . . . . . . . . . . . . . . . . . . . . . . . . . . . . . . . . . . . . . . . . . . ¥38,055,064
Long-term debt:Obligations under capital leases . . . . . . . . . . . . . . . . . . . . . . . . . . . . . . . . . . . . . . . . . . . . . . . . . 22,536Obligation under sale-and-leaseback transactions . . . . . . . . . . . . . . . . . . . . . . . . . . . . . . . . . . . 40,732Unsubordinated debt . . . . . . . . . . . . . . . . . . . . . . . . . . . . . . . . . . . . . . . . . . . . . . . . . . . . . . . . . . 22,468,006Subordinated debt . . . . . . . . . . . . . . . . . . . . . . . . . . . . . . . . . . . . . . . . . . . . . . . . . . . . . . . . . . . . 4,832,772Obligations under loan securitization transactions . . . . . . . . . . . . . . . . . . . . . . . . . . . . . . . . . . . 641,850Debt issuance costs . . . . . . . . . . . . . . . . . . . . . . . . . . . . . . . . . . . . . . . . . . . . . . . . . . . . . . . . . . . (15,353)
Total long-term debt . . . . . . . . . . . . . . . . . . . . . . . . . . . . . . . . . . . . . . . . . . . . . . . . . . . . . . 27,990,543
Shareholders’ equity:Capital stock, with no stated value (common stock authorized: 33,000,000,000 shares;
common stock issued: 13,667,770,520 shares) . . . . . . . . . . . . . . . . . . . . . . . . . . . . . . . . . . . . 2,090,270Capital surplus . . . . . . . . . . . . . . . . . . . . . . . . . . . . . . . . . . . . . . . . . . . . . . . . . . . . . . . . . . . . . . . 5,577,186Retained earnings:
Appropriated for legal reserve . . . . . . . . . . . . . . . . . . . . . . . . . . . . . . . . . . . . . . . . . . . . . . 239,571Unappropriated retained earnings . . . . . . . . . . . . . . . . . . . . . . . . . . . . . . . . . . . . . . . . . . . . 8,094,026
Accumulated other comprehensive income, net of taxes . . . . . . . . . . . . . . . . . . . . . . . . . . . . . . (284,269)Treasury stock, at cost: 745,921,774 common shares . . . . . . . . . . . . . . . . . . . . . . . . . . . . . . . . . (517,236)
Total shareholders’ equity . . . . . . . . . . . . . . . . . . . . . . . . . . . . . . . . . . . . . . . . . . . . . . . . . . 15,199,548
Noncontrolling interests . . . . . . . . . . . . . . . . . . . . . . . . . . . . . . . . . . . . . . . . . . . . . . . . . . . . . . . . . . . 785,200
Total equity . . . . . . . . . . . . . . . . . . . . . . . . . . . . . . . . . . . . . . . . . . . . . . . . . . . . . . . . . . . . . 15,984,748
Total capitalization and indebtedness . . . . . . . . . . . . . . . . . . . . . . . . . . . . . . . . . . . . . ¥43,975,291
Note:(1) Total short-term borrowings consist of call money and funds purchased, payables under repurchase agreements, payables under securities
lending transactions, due to trust account and other short-term borrowings.
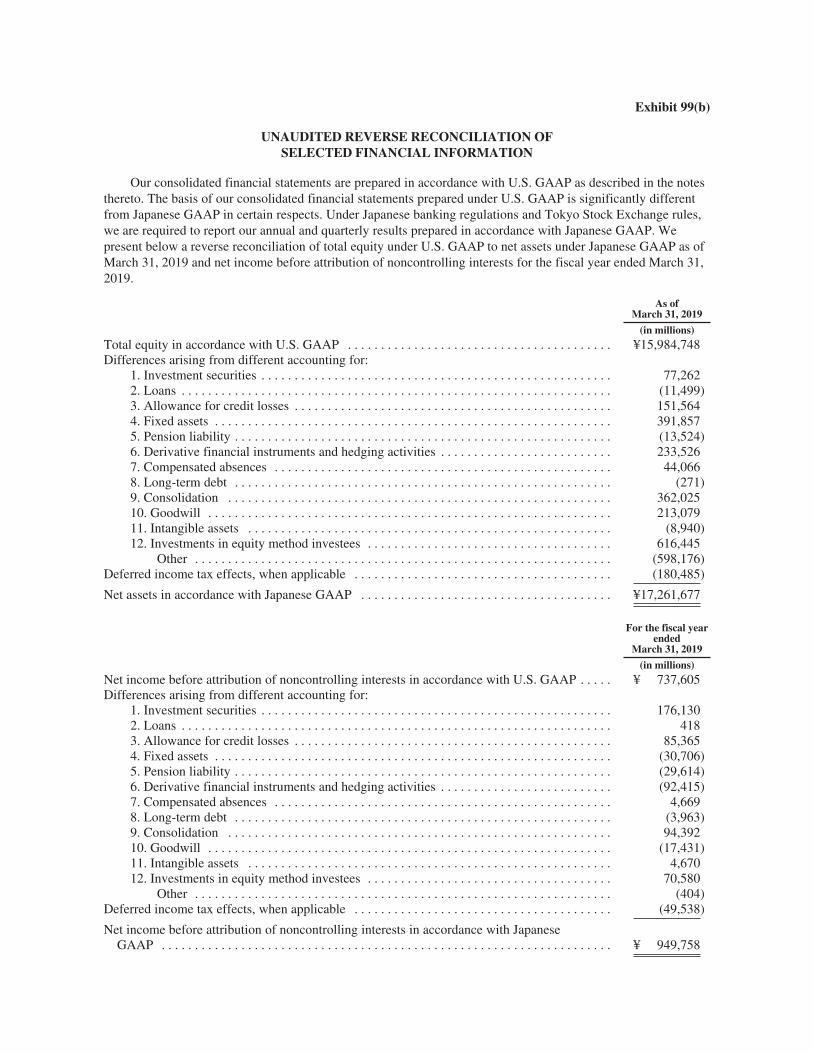
Exhibit 99(b)
UNAUDITED REVERSE RECONCILIATION OFSELECTED FINANCIAL INFORMATION
Our consolidated financial statements are prepared in accordance with U.S. GAAP as described in the notesthereto. The basis of our consolidated financial statements prepared under U.S. GAAP is significantly differentfrom Japanese GAAP in certain respects. Under Japanese banking regulations and Tokyo Stock Exchange rules,we are required to report our annual and quarterly results prepared in accordance with Japanese GAAP. Wepresent below a reverse reconciliation of total equity under U.S. GAAP to net assets under Japanese GAAP as ofMarch 31, 2019 and net income before attribution of noncontrolling interests for the fiscal year ended March 31,2019.
As ofMarch 31, 2019
(in millions)Total equity in accordance with U.S. GAAP . . . . . . . . . . . . . . . . . . . . . . . . . . . . . . . . . . . . . . . . ¥15,984,748Differences arising from different accounting for:
1. Investment securities . . . . . . . . . . . . . . . . . . . . . . . . . . . . . . . . . . . . . . . . . . . . . . . . . . . . . 77,2622. Loans . . . . . . . . . . . . . . . . . . . . . . . . . . . . . . . . . . . . . . . . . . . . . . . . . . . . . . . . . . . . . . . . . (11,499)3. Allowance for credit losses . . . . . . . . . . . . . . . . . . . . . . . . . . . . . . . . . . . . . . . . . . . . . . . . 151,5644. Fixed assets . . . . . . . . . . . . . . . . . . . . . . . . . . . . . . . . . . . . . . . . . . . . . . . . . . . . . . . . . . . . 391,8575. Pension liability . . . . . . . . . . . . . . . . . . . . . . . . . . . . . . . . . . . . . . . . . . . . . . . . . . . . . . . . . (13,524)6. Derivative financial instruments and hedging activities . . . . . . . . . . . . . . . . . . . . . . . . . . 233,5267. Compensated absences . . . . . . . . . . . . . . . . . . . . . . . . . . . . . . . . . . . . . . . . . . . . . . . . . . . 44,0668. Long-term debt . . . . . . . . . . . . . . . . . . . . . . . . . . . . . . . . . . . . . . . . . . . . . . . . . . . . . . . . . (271)9. Consolidation . . . . . . . . . . . . . . . . . . . . . . . . . . . . . . . . . . . . . . . . . . . . . . . . . . . . . . . . . . 362,02510. Goodwill . . . . . . . . . . . . . . . . . . . . . . . . . . . . . . . . . . . . . . . . . . . . . . . . . . . . . . . . . . . . . 213,07911. Intangible assets . . . . . . . . . . . . . . . . . . . . . . . . . . . . . . . . . . . . . . . . . . . . . . . . . . . . . . . (8,940)12. Investments in equity method investees . . . . . . . . . . . . . . . . . . . . . . . . . . . . . . . . . . . . . 616,445
Other . . . . . . . . . . . . . . . . . . . . . . . . . . . . . . . . . . . . . . . . . . . . . . . . . . . . . . . . . . . . . . . (598,176)Deferred income tax effects, when applicable . . . . . . . . . . . . . . . . . . . . . . . . . . . . . . . . . . . . . . . (180,485)
Net assets in accordance with Japanese GAAP . . . . . . . . . . . . . . . . . . . . . . . . . . . . . . . . . . . . . . ¥17,261,677
For the fiscal yearended
March 31, 2019
(in millions)Net income before attribution of noncontrolling interests in accordance with U.S. GAAP . . . . . ¥ 737,605Differences arising from different accounting for:
1. Investment securities . . . . . . . . . . . . . . . . . . . . . . . . . . . . . . . . . . . . . . . . . . . . . . . . . . . . . 176,1302. Loans . . . . . . . . . . . . . . . . . . . . . . . . . . . . . . . . . . . . . . . . . . . . . . . . . . . . . . . . . . . . . . . . . 4183. Allowance for credit losses . . . . . . . . . . . . . . . . . . . . . . . . . . . . . . . . . . . . . . . . . . . . . . . . 85,3654. Fixed assets . . . . . . . . . . . . . . . . . . . . . . . . . . . . . . . . . . . . . . . . . . . . . . . . . . . . . . . . . . . . (30,706)5. Pension liability . . . . . . . . . . . . . . . . . . . . . . . . . . . . . . . . . . . . . . . . . . . . . . . . . . . . . . . . . (29,614)6. Derivative financial instruments and hedging activities . . . . . . . . . . . . . . . . . . . . . . . . . . (92,415)7. Compensated absences . . . . . . . . . . . . . . . . . . . . . . . . . . . . . . . . . . . . . . . . . . . . . . . . . . . 4,6698. Long-term debt . . . . . . . . . . . . . . . . . . . . . . . . . . . . . . . . . . . . . . . . . . . . . . . . . . . . . . . . . (3,963)9. Consolidation . . . . . . . . . . . . . . . . . . . . . . . . . . . . . . . . . . . . . . . . . . . . . . . . . . . . . . . . . . 94,39210. Goodwill . . . . . . . . . . . . . . . . . . . . . . . . . . . . . . . . . . . . . . . . . . . . . . . . . . . . . . . . . . . . . (17,431)11. Intangible assets . . . . . . . . . . . . . . . . . . . . . . . . . . . . . . . . . . . . . . . . . . . . . . . . . . . . . . . 4,67012. Investments in equity method investees . . . . . . . . . . . . . . . . . . . . . . . . . . . . . . . . . . . . . 70,580
Other . . . . . . . . . . . . . . . . . . . . . . . . . . . . . . . . . . . . . . . . . . . . . . . . . . . . . . . . . . . . . . . (404)Deferred income tax effects, when applicable . . . . . . . . . . . . . . . . . . . . . . . . . . . . . . . . . . . . . . . (49,538)
Net income before attribution of noncontrolling interests in accordance with JapaneseGAAP . . . . . . . . . . . . . . . . . . . . . . . . . . . . . . . . . . . . . . . . . . . . . . . . . . . . . . . . . . . . . . . . . . . . ¥ 949,758

Explanation of Differences between U.S. GAAP and Japanese GAAP
Major factors which explain the differences shown in the above table are as follows:
1. Investment securities
The cost basis of certain securities is different under U.S. GAAP and Japanese GAAP due primarily to thefollowing:
‰ On October 1, 2005, Mitsubishi Tokyo Financial Group, Inc. (“MTFG”) merged with UFJ Holdings,Inc. (“UFJ Holdings”), with MTFG being the surviving entity, and was renamed “Mitsubishi UFJFinancial Group, Inc.” Under U.S. GAAP, in accordance with the guidance on accounting for businesscombinations, the assets and liabilities of companies acquired in purchase transactions are recorded atfair value at the date of acquisition. Therefore, the new cost basis of investment securities, includingavailable-for-sale and other investment securities, of UFJ Holdings was established and they wererecognized at fair value as of October 1, 2005. Under Japanese GAAP, which was effective as ofOctober 1, 2005, the new cost basis was not established for such investment securities and they werecarried over at their historical cost basis.
‰ Under U.S. GAAP, other-than-temporary impairment is recognized in earnings for a debt security if anentity has intent to sell such a debt security or if it is more likely than not that the entity will be requiredto sell such a debt security before recovery of its amortized cost basis. If not, the credit component ofother-than-temporary impairment on the debt security is recognized in earnings, but the noncreditcomponent is recognized in other comprehensive income. In determining whether a decline in fair valuebelow cost is other-than-temporary, in addition to the ability and positive intent to hold the investmentsfor a period sufficient to allow for any anticipated recovery in fair value, factors such as the extent ofdecline in fair value below cost and the length of time that the decline has continued are considered. Inaddition, marketable equity securities are measured at fair value with unrealized gains or losses reflectedin net income. Under Japanese GAAP, significant declines in the fair value of securities below cost arerecorded in earnings for both debt security and marketable equity security. In determining a significantdecline, the extent of the decline in fair value below cost and credit standing of the issuers areconsidered.
‰ Under U.S. GAAP, measurement alternative is elected for nonmarketable equity securities, and thesesecurities are primarily measured at cost minus impairment, if any, plus or minus changes resulting fromobservable price changes in orderly transactions for an identical or similar investment of the sameissuer. Under Japanese GAAP, these securities are measured at cost minus impairment, but changesresulting from observable price changes are not recognized.
‰ U.S. GAAP requires accounting for the transactions at fair value when investments in acquiredcompanies are exchanged for investments in the surviving companies in accordance with the guidanceon accounting for nonmonetary exchange of cost-method investments, while these transactions havebeen accounted for at cost under Japanese GAAP.
‰ Under U.S. GAAP, changes in the fair value of foreign securities held by MUFG Bank and MitsubishiUFJ Trust and Banking are recognized in earnings since the fair value option was elected for theseforeign securities in accordance with the guidance on accounting for fair value options for financialassets and financial liabilities. Under Japanese GAAP, only the changes attributable to movements inforeign currency exchange rates are recognized in earnings and the other changes in the fair value arerecognized in other comprehensive income.
2. Loans
Under U.S. GAAP, loan origination fees, net of certain direct origination costs, are deferred and recognizedas income over the contractual life of the loans, while under Japanese GAAP, they are primarily recognized inearnings at the time of origination.

3. Allowance for credit losses
Under U.S. GAAP, the credit loss allowance for impaired loans is calculated primarily based on the presentvalue of expected future cash flows discounted at the loan’s effective interest rate, the loan’s observable marketprice, or the fair value of the collateral if the loan is collateral dependent, in accordance with the guidance onaccounting by creditors for the impairment of a loan. Under Japanese GAAP, an allowance is provided for certaintypes of impaired loans based on historical loss experience. This difference between U.S. GAAP and JapaneseGAAP generally results in a larger amount of allowance for credit losses under U.S. GAAP.
4. Fixed assets
The differences between Japanese GAAP and U.S. GAAP principally consist of (1) Premises andequipment, and (2) Land revaluation.
(1) Premises and equipment
Under U.S. GAAP, a nonmonetary asset acquired in exchange for another nonmonetary asset is generallyrecorded at the fair value of the asset surrendered or that of the asset received, and a gain or loss is recognized onthe exchange. Under Japanese GAAP, the asset received is recorded at the cost of the asset surrendered inrelevant types of exchange transactions, resulting in no gain or loss.
(2) Land revaluation
U.S. GAAP does not allow revaluation of operating assets and requires land to be recorded at cost. UnderJapanese GAAP, land used for business operations of domestic subsidiaries was revalued as of March 31, 1998for Bank of Tokyo-Mitsubishi, as of March 31, 2002 for The Mitsubishi Trust and Banking Corporation and as ofDecember 31, 2001 for other domestic subsidiaries of MTFG with the corresponding impact recorded directly inequity as well as related deferred tax assets/liabilities, pursuant to the Law concerning Revaluation of Land.Accordingly, land held on the revaluation dates are recorded at different values.
5. Pension liability
Under both U.S. GAAP and Japanese GAAP, the funded status of defined benefit plans is recognized asassets or liabilities in a consolidated balance sheet, and actuarial gains or losses and prior service costs or benefitsthat have not yet been recognized through earnings as net periodic benefit cost are recognized in othercomprehensive income, net of tax, until they are amortized as a component of net periodic benefit cost. Actuarialgains or losses are amortized based on corridor approach under U.S. GAAP, while they are amortized over aspecified number of years under Japanese GAAP.
6. Derivative financial instruments and hedging activities
MUFG utilizes derivatives to manage its exposures to fluctuations in market factors such as interest ratesand foreign exchange rates arising from mismatches in the risk profiles of assets and liabilities. Under U.S.GAAP, most derivatives used by MUFG are accounted for as trading assets or liabilities because they do notqualify for hedge accounting under the criteria prescribed in the guidance on accounting for derivativeinstruments and hedging activities. Japanese GAAP permits hedge accounting for certain derivative hedgingactivities, including portfolio hedges, using less restrictive hedging criteria.
In addition, bifurcation requirements are different between U.S. GAAP and Japanese GAAP. Under U.S.GAAP, if the economic characteristics and risks of the embedded derivatives are deemed “clearly and closelyrelated” to the economic characteristics and risks of the host contracts, the embedded derivatives are notbifurcated from their host contracts. Under Japanese GAAP, the embedded derivatives may be bifurcated fromtheir host contracts if the risk of the embedded derivatives and host contracts are managed separately.
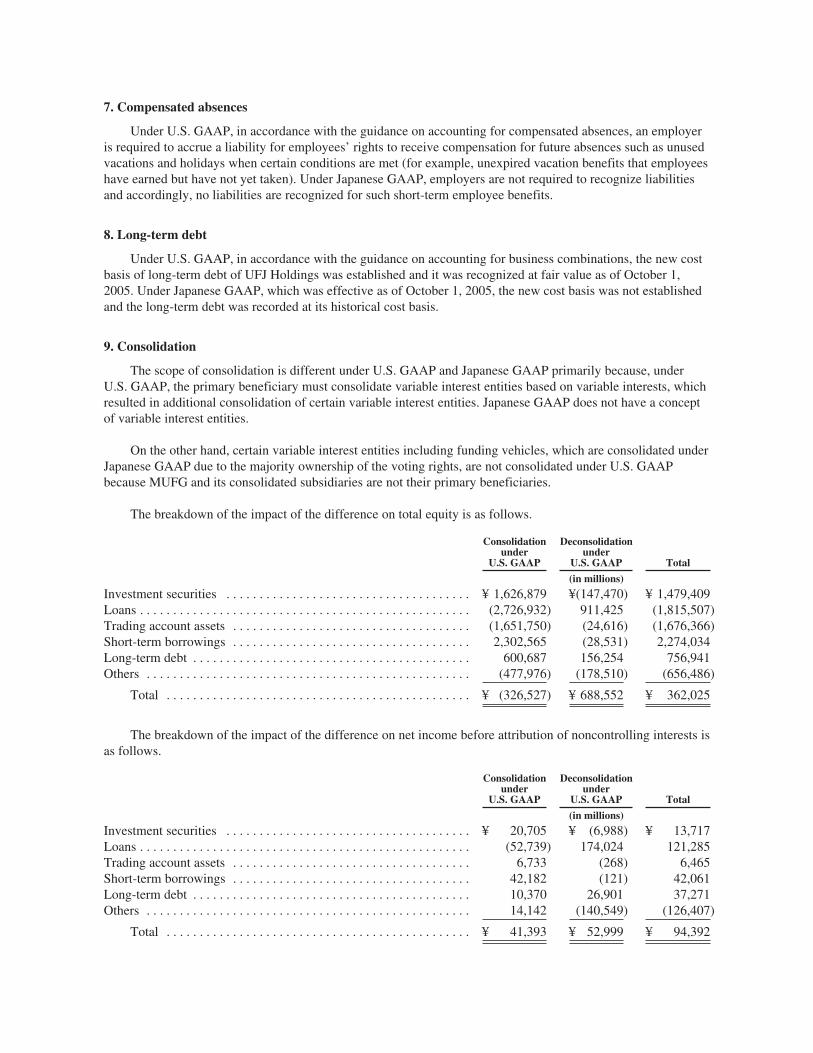
7. Compensated absences
Under U.S. GAAP, in accordance with the guidance on accounting for compensated absences, an employeris required to accrue a liability for employees’ rights to receive compensation for future absences such as unusedvacations and holidays when certain conditions are met (for example, unexpired vacation benefits that employeeshave earned but have not yet taken). Under Japanese GAAP, employers are not required to recognize liabilitiesand accordingly, no liabilities are recognized for such short-term employee benefits.
8. Long-term debt
Under U.S. GAAP, in accordance with the guidance on accounting for business combinations, the new costbasis of long-term debt of UFJ Holdings was established and it was recognized at fair value as of October 1,2005. Under Japanese GAAP, which was effective as of October 1, 2005, the new cost basis was not establishedand the long-term debt was recorded at its historical cost basis.
9. Consolidation
The scope of consolidation is different under U.S. GAAP and Japanese GAAP primarily because, underU.S. GAAP, the primary beneficiary must consolidate variable interest entities based on variable interests, whichresulted in additional consolidation of certain variable interest entities. Japanese GAAP does not have a conceptof variable interest entities.
On the other hand, certain variable interest entities including funding vehicles, which are consolidated underJapanese GAAP due to the majority ownership of the voting rights, are not consolidated under U.S. GAAPbecause MUFG and its consolidated subsidiaries are not their primary beneficiaries.
The breakdown of the impact of the difference on total equity is as follows.
Consolidationunder
U.S. GAAP
Deconsolidationunder
U.S. GAAP Total
(in millions)
Investment securities . . . . . . . . . . . . . . . . . . . . . . . . . . . . . . . . . . . . . ¥ 1,626,879 ¥(147,470) ¥ 1,479,409Loans . . . . . . . . . . . . . . . . . . . . . . . . . . . . . . . . . . . . . . . . . . . . . . . . . . (2,726,932) 911,425 (1,815,507)Trading account assets . . . . . . . . . . . . . . . . . . . . . . . . . . . . . . . . . . . . (1,651,750) (24,616) (1,676,366)Short-term borrowings . . . . . . . . . . . . . . . . . . . . . . . . . . . . . . . . . . . . 2,302,565 (28,531) 2,274,034Long-term debt . . . . . . . . . . . . . . . . . . . . . . . . . . . . . . . . . . . . . . . . . . 600,687 156,254 756,941Others . . . . . . . . . . . . . . . . . . . . . . . . . . . . . . . . . . . . . . . . . . . . . . . . . (477,976) (178,510) (656,486)
Total . . . . . . . . . . . . . . . . . . . . . . . . . . . . . . . . . . . . . . . . . . . . . . ¥ (326,527) ¥ 688,552 ¥ 362,025
The breakdown of the impact of the difference on net income before attribution of noncontrolling interests isas follows.
Consolidationunder
U.S. GAAP
Deconsolidationunder
U.S. GAAP Total
(in millions)
Investment securities . . . . . . . . . . . . . . . . . . . . . . . . . . . . . . . . . . . . . ¥ 20,705 ¥ (6,988) ¥ 13,717Loans . . . . . . . . . . . . . . . . . . . . . . . . . . . . . . . . . . . . . . . . . . . . . . . . . . (52,739) 174,024 121,285Trading account assets . . . . . . . . . . . . . . . . . . . . . . . . . . . . . . . . . . . . 6,733 (268) 6,465Short-term borrowings . . . . . . . . . . . . . . . . . . . . . . . . . . . . . . . . . . . . 42,182 (121) 42,061Long-term debt . . . . . . . . . . . . . . . . . . . . . . . . . . . . . . . . . . . . . . . . . . 10,370 26,901 37,271Others . . . . . . . . . . . . . . . . . . . . . . . . . . . . . . . . . . . . . . . . . . . . . . . . . 14,142 (140,549) (126,407)
Total . . . . . . . . . . . . . . . . . . . . . . . . . . . . . . . . . . . . . . . . . . . . . . ¥ 41,393 ¥ 52,999 ¥ 94,392
10. Goodwill
Under U.S. GAAP, in accordance with the guidance on accounting for business combinations, identifiableassets acquired, liabilities assumed, and any noncontrolling interest in an acquired company are recorded at fairvalue at the date of acquisition. Goodwill is the excess of the fair value of noncontrolling interest andconsideration transferred, over the fair value of identifiable assets acquired and liabilities assumed. Goodwill isnot amortized, but is subject to an annual impairment test at the reporting unit level, and also reviewed morefrequently if events or changes in circumstance indicate that the goodwill might be impaired. Under JapaneseGAAP, goodwill is the difference between the purchase price consideration and the acquirer’s share of fair valueof the net assets acquired. Goodwill is amortized by straight-line method over the estimated period not exceeding20 years, and an impairment test is required only if indication of impairment is identified.
In addition, the acquisition of UFJ Holdings has been accounted for by a method similar topooling-of-interests, and consequently goodwill has not been recognized in accordance with Japanese GAAP,which was effective as of October 1, 2005.
11. Intangible assets
Under U.S. GAAP, in accordance with the guidance on accounting for business combinations, allidentifiable intangible assets acquired in purchase transactions are recorded at fair value at the date ofacquisition. Intangible assets with definite useful lives are amortized over their estimated useful life and reviewedfor impairment whenever events or changes in circumstance indicate that their carrying amount may not berecoverable. Intangible assets with indefinite useful lives are tested for impairment at least annually, and alsoreviewed more frequently if events or changes in circumstance indicate that the assets might be impaired. UnderJapanese GAAP, which was effective as of October 1, 2005, intangible assets have not been recognized inconnection with the acquisition of UFJ Holdings.
12. Investments in equity method investees
Under U.S. GAAP, a portion of a difference between the cost of an investment and the amount ofunderlying equity in net assets of an investee is not amortized. A loss in value of an investment that is other thana temporary decline is recognized as an impairment loss. Under Japanese GAAP, goodwill which is included ininvestments in equity method investees is amortized by straight-line method. If a decline in the market valuebelow the cost is substantial, based on the extent of decline in market value and the credit standing of the issuers,an impairment loss is recognized within the limit of the amount of unamortized goodwill.