as if we cared - analysis and action on living standards
TRANSCRIPT

resolutionfoundation.org [email protected] +44 (0)203 372 2960 @resfoundation
REPORT
As if we caredThe costs and benefits of a living wage for social care workers
Laura Gardiner & Dr Shereen HusseinMarch 2015

This publication is available in the Childcare & Families section of our website @resfoundation
As if we cared: the costs and benefits of a living wage for social care workers Acknowledgements 2
Acknowledgements
We would especially like to thank Skills for Care, particularly Will Fenton and Dave Griffiths, for sharing the National Minimum Dataset for Social Care with us and for helpful guidance on its use. We would also like to thank the Social Care Workforce Research Unit at King’s College London for sharing information from the Longitudinal Care
Work Study, and the Department of Health for funding this study.
We have received advice, help and comments from a number of people over the course of this project and we are grateful to all of them. In particular, we wish to thank all those who took part in a seminar launching the project in September 2014, and roundtable events in London (November 2014) and Nottingham (January 2015). We would like to thank Citizens UK for its help in organising these roundtables. We are particularly grateful to Colin Angel at the United Kingdom Homecare Association, Will Fenton at Skills for Care and Richard Humphries at the King’s Fund for providing invaluable comments on earlier versions of this report. All remaining errors are of course our
own.
Finally, we are grateful for the support of Unbound Philanthropy, without which this report would not be possible.
About the authors
Laura Gardiner is a Senior Research and Policy Analyst at the Resolution Foundation.
Dr Shereen Hussein is Principal Research Fellow (Chair) at the Social Care Workforce Research Unit, King’s College London.
3As if we cared: the costs and benefits of a living wage for social care workers Contents
This publication is available in the Childcare & Families section of our website @resfoundation
Contents
Executive Summary ���������������������������������������������������������������������������������4
Section 1
Introduction ������������������������������������������������������������������������������������������10
Section 2
Care worker pay and conditions �����������������������������������������������������������14
Section 3
The costs and savings associated with paying the living wage �������������19
Section 4
The bigger picture – Improving conditions, quality & associated benefits ���32
Section 5
Getting there – Practical steps to delivering a living wage in care �������41
Section 6
Conclusion ��������������������������������������������������������������������������������������������45
Annex 1: The UK’s adult social care sector �������������������������������������������46
Annex 2: Data and scope for our analysis ���������������������������������������������48
Annex 3: Modelling methodology ��������������������������������������������������������52

This publication is available in the Childcare & Families section of our website @resfoundation
As if we cared: the costs and benefits of a living wage for social care workers Executive Summary 4
Executive Summary
Adult social care touches the lives of millions of Britons every year. Just under one-in-ten adults are limited ‘a lot’ in their day-to-day activities by illness, disability and old age. The majority cope by drawing on informal help, but an estimated 1.3 million use formal services in England alone. Across the UK, there are close to 2 million jobs in the sector, around 1.4 million of which are on the frontline of care provision. And demand is set to rise by as much as 60 per cent in the next two decades.
Yet, despite playing such a vital and growing role, the social care sector is beset by concerns over the quality and sustainability of provision. As part of this, a consensus is emerging that conditions for the workforce need to improve.
Most fundamentally, as a sector characterised by pervasive low pay, raising wages is a priority. It’s argued that higher pay would not only be a fairer reflection of the key role that care workers play in society, but might also be an essential pre-requisite to meeting future demand. On this basis, there is growing support for the idea of a living wage in care. This has been a central recommendation of multiple enquiries into the sector.
However, while calls for better pay and conditions in care are gaining traction, we have so far lacked any realistic idea of what improvements would mean in terms of potential costs and benefits. The risk is that higher pay for care workers becomes a casual aspiration that is not rooted in a clear under-standing of what it would take to get there. Therefore, the purpose of this report is to shed light in this area by providing a robust assessment of the additional costs associated with raising care worker pay to the living wage, and the savings and benefits that would result.
The challenge: low pay and unattractive terms for care workers
Typical pay in the 1.4 million frontline care jobs in the UK was £7.20 in 2013-14 – set against an adult minimum wage of £6.19 (rising to £6.31 half-way through the year), a UK (outside London) living wage of £7.45 (rising to £7.65), and a London living wage of £8.55 (rising to £8.80). While they

This publication is available in the Childcare & Families section of our website @resfoundation
As if we cared: the costs and benefits of a living wage for social care workers Executive Summary 5
have always been low, pay levels in social care are being squeezed by the perfect storm of rising demand (driven by the rising care needs of our ageing population) coupled with falling public funding. Typical pay in the sector is moving closer to the minimum wage every year.
In addition, a worryingly large minority of care jobs – around one-in-ten – in fact pay below the minimum wage, caused in part by the practice of only paying ‘contact’ hours which doesn’t always adequately cover all working time.
And pay is not just – sometimes illegally – low; it tends to stay low too. Opportunities to move up the pay scale are limited and training is infrequent and basic. In addition, working conditions are often poor.
As well as potentially hampering care workers’ ability to deliver high-quality care at all times, this situation makes recruiting and retaining a suitable workforce a major challenge for care providers. Labour turnover is already high, creating a constant replacement demand. Looking to the future, up to 1 million additional care jobs will need filling in the next decade in England alone.
The case for change in pay and conditions increasingly rests not just on social justice, but also on concerns that the sector will simply not be able to recruit sufficient workers possessing appropriate skills and attributes with such an unattractive offer.
The costs and benefits of a living wage in care
So what would it take to put the workforce on a surer footing? More specifi-cally, what are the potential costs and benefits for workers, employers and the state associated with raising pay to at least the living wage?
We bring together information from a number of sources to estimate the costs and savings associated with improving pay for the UK’s frontline care workforce. Our aim is to provide a real-world figure, though clearly the results rest on the quality of both the data we use and the assumptions that we make. So, while we try to ensure that our estimates are as robust as possible, they should nonetheless be considered best approximations on the basis of the information currently available.
Before any consideration of broader improvements to pay, there is a fundamental need to ensure that pay levels at least comply with statutory

This publication is available in the Childcare & Families section of our website @resfoundation
As if we cared: the costs and benefits of a living wage for social care workers Executive Summary 6
minimums. We estimate that the total cost of eradicating non-compliance
with the minimum wage across frontline care jobs in the UK was £142
million in 2013-14� Despite the fact that care providers face significant financial constraints and that calculating rates for the purpose of the minimum wage can be complex, there is no excuse for illegal pay. Therefore we argue that care providers are fully liable for the costs of non-compliance and that ensuring this hole in labour costs is filled is an immediate priority.
Beyond this minimum starting point, we assess the costs and savings associated with paying the living wage across the frontline care workforce. Such a move would certainly have a wide-reaching impact: we estimate that two-thirds of frontline care jobs (930,000 jobs) currently pay below the
living wage, and that the average worker’s net annual income would increase by £780 if it were paid.
The reliance of the sector on public procurement implies that any efforts to make overarching improvements to pay will require some injection of public funds. This is particularly the case given that labour costs already account for a very high share of turnover in the sector, meaning little headroom for increasing wages within the current funding envelope. Therefore as well as assessing the total cost of raising pay to the living wage, we consider the implications for public spending. We find that:
» Paying the living wage across the UK’s frontline care workforce would have increased the gross total cost of care services (public and private)
by £2�3 billion in 2013-14�
» Gross public costs – the share of total costs associated with publicly-funded services procured by local authorities – would have increased by
£1�4 billion�
» However, if public money were used to fund a living wage for care workers, just under half (47 per cent) of public costs would be returned to the
Exchequer through higher personal tax receipts and lower benefit
payments� Therefore we estimate a net public cost of £726 million in
2013-14. This only accounts for the most directly ‘cashable’ public savings – it’s probable that the positive fiscal impacts from raising pay for a large, low-paid workforce would be greater than our assessment captures.
This publication is available in the Childcare & Families section of our website @resfoundation
As if we cared: the costs and benefits of a living wage for social care workers Executive Summary 7
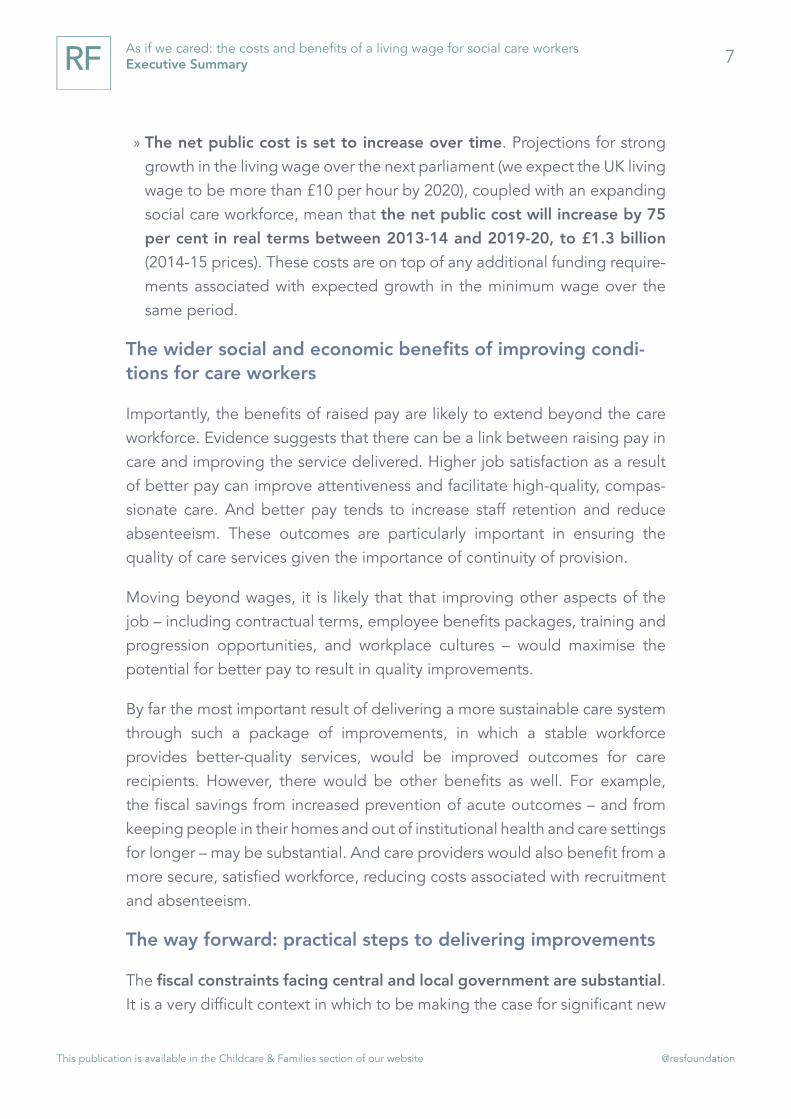
» The net public cost is set to increase over time. Projections for strong growth in the living wage over the next parliament (we expect the UK living wage to be more than £10 per hour by 2020), coupled with an expanding social care workforce, mean that the net public cost will increase by 75
per cent in real terms between 2013-14 and 2019-20, to £1�3 billion (2014-15 prices). These costs are on top of any additional funding require-ments associated with expected growth in the minimum wage over the same period.
The wider social and economic benefits of improving condi-tions for care workers
Importantly, the benefits of raised pay are likely to extend beyond the care workforce. Evidence suggests that there can be a link between raising pay in care and improving the service delivered. Higher job satisfaction as a result of better pay can improve attentiveness and facilitate high-quality, compas-sionate care. And better pay tends to increase staff retention and reduce absenteeism. These outcomes are particularly important in ensuring the quality of care services given the importance of continuity of provision.
Moving beyond wages, it is likely that that improving other aspects of the job – including contractual terms, employee benefits packages, training and progression opportunities, and workplace cultures – would maximise the potential for better pay to result in quality improvements.
By far the most important result of delivering a more sustainable care system through such a package of improvements, in which a stable workforce provides better-quality services, would be improved outcomes for care recipients. However, there would be other benefits as well. For example, the fiscal savings from increased prevention of acute outcomes – and from keeping people in their homes and out of institutional health and care settings for longer – may be substantial. And care providers would also benefit from a more secure, satisfied workforce, reducing costs associated with recruitment and absenteeism.
The way forward: practical steps to delivering improvements
The fiscal constraints facing central and local government are substantial. It is a very difficult context in which to be making the case for significant new

This publication is available in the Childcare & Families section of our website @resfoundation
As if we cared: the costs and benefits of a living wage for social care workers Executive Summary 8
resources. Nonetheless, it seems unrealistic to expect providers to find the money to pay the living wage in the current funding and provision landscape. We are clear that public funding for care would therefore need to rise for
this purpose.
We make no attempt in this report to identify where in the public finances the money might come from. Nor do we underestimate the size of the challenge or the trade-offs involved in directing any additional funding that is identified towards wages. However, with costs just a fraction of a per cent of GDP, and the benefits evident (and potentially amounting to more than we have set out here), we think that finding the money over time would be possible if the resolve was there. There are two possible courses of action:
» Local authorities could redirect resources from other areas of
spending into care funding, as a handful are already doing. Crucially, the huge majority of the ‘cashable’ savings we identify accrue to national government, rather than being felt locally. By passing these savings down to those local authorities who take action, the government could provide clear incentives, without any net cost to national finances. But even with such incentives, given the wider funding context for local authorities, we have to be realistic about how many will choose to make this a priority.
» The overall UK funding settlement for care could increase, flowing down to constituent nations and local authorities. While it is perhaps unrealistic to expect such funding to be identified and passed down immediately, a staged approach could be taken with the goal of the living wage being paid in full by the end of the next parliament. As an example, we set out a stylised route at a net cost of £250 million in 2015-16, rising to an estimated £1.3 billion by 2019-20 (both in 2014-15 prices).
Whatever approach is taken, if additional resources are directed towards the care sector then it would be crucial to ensure that such funds are actually used for their intended purpose. To support this, we’d need to see:
» An immediate and ongoing focus on more effective enforcement of the
minimum wage, as a precursor to any efforts to increase public funding for care to support a living wage.

This publication is available in the Childcare & Families section of our website @resfoundation
As if we cared: the costs and benefits of a living wage for social care workers Executive Summary 9
» Payment of the living wage being made a condition of contract, or at least
a key criterion of contract assessment, in local authority procurement
exercises.
» Industry-wide agreement on the quid pro quo from providers in return
for any extra public resources to support the living wage, reflecting the fact that some of the benefits of higher pay will be felt by employers themselves. This might include more investment in training and career development, or standardised employee benefits packages.
There will be many other practical considerations and challenges that we have not touched on here. We hope that by shedding light on the cost impli-cations, this report provides more clarity in the debate around improving pay and conditions in social care. We also hope that it serves as an impetus for national government, local authorities and care providers to work together to consider whether and how improvements including a living wage for care workers can be achieved.

This publication is available in the Childcare & Families section of our website @resfoundation
10As if we cared: the costs and benefits of a living wage for social care workers Section 1: Introduction
Section 1
Introduction
Frontline care workers are under pressure
More so than other sectors, adult social care relies on its workforce, spending a greater share of turnover on wages than almost any other sector.[1] And this workforce is large – there were an estimated 1.4 million frontline care jobs in the UK in 2013-14.[2] Care work is a demanding and intimate profession, but employees require few formal qualifications and there is a ready avail-ability of low-skilled workers willing to do the job. This combined with the low status society attaches to caring work has led to pay and conditions universally regarded as poor. Hourly pay rates hover not far above the minimum wage, and sometimes below it. Employment is casualised, irregular and low-status with prevalent use of zero-hours contracts, little training and low employee benefits. From a social justice perspective, many argue that the way we treat and reward care workers undervalues the public service they provide.
Despite the fact that most care workers are highly committed to the work they do and many find their job rewarding, it is evident that such conditions are putting the workforce under strain and hampering its ability to deliver high-quality care. From Cavendish, to Kingsmill, to Burstow, a series of recent public enquiries and reviews have underlined the threat that undervaluing this workforce is posing.[3] It’s becoming clear that if we want a social care system that can grow to meet the needs of our ageing population and treat those receiving care with dignity, then we need to invest in the workers who provide it.
Reflecting rising demand but falling funding
Demographic trends are set to increase the need for formal care by as much as 60 per cent in the next two decades,[4] and the nature of that support is becoming more complex as the incidence of advanced health conditions increases. However, far from evolving to meet this demand, public funding for care has been falling since the downturn. As well as driving up the levels of unmet need absorbed through informal support or private spending, the result has been cuts to the price councils pay for care and the time considered necessary for tasks to be performed.
A series of independent reviews, including those by the National Audit Office and the Dilnot Commission on care funding, have issued stark warnings on the significant pressure that such constraints are creating. These reviews suggest we may be reaching the limits of the capacity of [1] Resolution Foundation, ‘More than a minimum: The Resolution Foundation Review of the Future of the National Minimum
Wage’, March 2014
[2] Estimate based on: Skills for Care, ‘The size and structure of the adult social care sector and workforce in England, 2014’,
September 2014; Labour Force Survey, ONS. See Annex 2 for details.
[3] ‘The Cavendish Review: An Independent Review into Healthcare Assistants and Support Workers in the NHS and social care
settings’, July 2013; D Kingsmill, ‘The Kingsmill Review: Taking Care: An independent report into working conditions in the Care
Sector’, May 2014; I Koehler, ‘Key to Care: Report of the Burstow Commission on the future of the home care workforce’, LGiU,
December 2014
[4] R Wittenberg et al, ‘Projections of Demand for and Costs of Social Care for Older People in England, 2010 to 2030, under
Current and Alternative Funding Systems’, Personal Social Services Research Unit, December 2011

This publication is available in the Childcare & Families section of our website @resfoundation
11As if we cared: the costs and benefits of a living wage for social care workers Section 1: Introduction
the system to deliver ‘more with less’.[5] Box 1 provides a summary of the current landscape in the social care sector, with a fuller exploration in Annex 1.
Meanwhile, rising expectations for a service that we, or our loved ones, may require at some point,[6] coupled with high-profile enquiries and media focus on care standards, have raised concerns about the quality of provision. Ensuring that we have a sustainable care sector able to deliver to the high standards we expect is a growing priority in public discourse on care.
What will it take to fix the problem?
The idea that a better deal for workers is not just an appropriate recognition of the valuable work they do, but is also essential to the quality and sustainability of the social care sector, is the starting point for this report. While there is a growing consensus around this argument, there has been relatively little discussion of the scale of investment needed to put the workforce on a surer footing,
[5] National Audit Office, ‘Adult social care in England: Overview’, March 2014; ‘Fairer Care Funding: The Report of the Com-
mission on Funding of Care and Support’, July 2011
[6] S Carr, ‘Pay, conditions and care quality in residential, nursing and domiciliary services’, Joseph Rowntree Foundation, April
2014
i Box 1: What is adult social care?
Social care refers to the provision of long-term or rehabili-tative care to elderly or disabled adults who need help with personal and domestic tasks. Formal care services include those that take place in the community and in people’s own homes, as well as institutional care that takes place in residential and nursing homes. Here we describe some key features of the sector that provides these services, with a fuller exploration in Annex 1. Much of the information we present about the sector throughout this report relates to England only, however we refer to trends across the UK wherever possible (see Annex 2 for details).
Formal social care services:
» Are dwarfed by informal care provided by family and friends. Estimates suggest 3.2 million adults in England receive informal care compared to 1.3 million using formal services.[1]
» Cost around £30 billion each year in England alone.[2]
» Are mainly, but not wholly, publicly-funded. While the majority of funding in England comes from local
[1] T Burchardt, P Obolenskaya & P Vizard, ‘The Coalition’s Record on
Adult Social Care: Policy, Spending and Outcomes 2010-2015’, London
School of Economics, January 2015
[2] Figure refers to 2010-11. Source: Skills for Care, ‘The economic value
of the adult social care sector in England’, February 2013
authorities, approximately one third is private spending by self-funders.[3]
» Constitute a devolved policy area that is needs-tested and also means-tested (fully in England, Wales and Northern Ireland – only partially in Scotland).
» Are predominantly delivered by third-party providers in the private and voluntary sectors. More than 17,000 organisations provide or arrange services in England, the majority of which provide non-residential services.[4]
» Have experienced falling public funding since the downturn. Real expenditure in England fell by at least 7 per cent between 2009-10 and 2013-14, with smaller but still significant reductions in Scotland and Wales.[5]
» Are likely to be shaped by greater flexibility and personalisation in coming years, as well as efforts towards better integration with health services.
[3] Skills for Care, ‘The economic value of the adult social care sector in
England’, February 2013
[4] Skills for Care, ‘The size and structure of the adult social care sector
and workforce in England, 2014’, September 2014
[5] T Burchardt, P Obolenskaya & P Vizard, ‘The Coalition’s Record on
Adult Social Care: Policy, Spending and Outcomes 2010-2015’, London
School of Economics, January 2015

This publication is available in the Childcare & Families section of our website @resfoundation
12As if we cared: the costs and benefits of a living wage for social care workers Section 1: Introduction
and the Exchequer savings and wider public benefits such investment would bring. At present, there is an aspiration towards improvements with no realistic understanding of what progress entails.
Therefore the central contribution of this analysis is to provide a robust assessment of the costs and savings associated with improving care worker conditions over the short- to medium-term, as a provocation to think about how and when progress can be made.
We recognise that a relatively broad set of improvements to working conditions may be necessary to create the professionalised, sustainable workforce that this sector needs. These might include more investment in training; more generous employee benefits; stronger progression structures; new uses of technology; and improvements to workplace cultures and practices that create an environment in which staff feel valued and able to do their jobs well.
However, the particular focus of our analysis is on raising pay. First, and most fundamentally, we consider eradication of minimum wage non-compliance. Having lifted pay at least to the legal minimum we then look at the costs and benefits associated with taking pay to the living wage. The living wage is highly popular with the public,[7] making it an appropriate focus for our analysis given that the social care sector is largely funded with public money.
Raising wage floors will never be a catch-all fix to the challenges facing this sector, but pay is symbolic of status and the value of work, so addressing this is an appropriate priority. Indeed, making care a living wage sector has been a key recommendation in many of the recent enquiries mentioned above.[8] In addition, raising wage floors may be a stimulus to more wholesale changes, or may generate some compensatory savings that can be invested in other improvements. Finally, pay is the area in which costs and savings are most easily calculated, so the improvement for which we can introduce hard facts into the debate.
Although the focus of our central calculation is on raising pay to the living wage, this report also discusses other improvements to care worker conditions that warrant consideration, and provides indicative costs and savings estimates where possible.
We also recognise that some of the challenges facing care workers go beyond workforce conditions in isolation. For example, a driving factor behind the fragmented and irregular nature of much of social care work may be the time-and-task commissioning approach of many local authorities. In addition, a growing emphasis on personalisation in care services has wide-reaching implica-tions for the role of workers. And while conditions for the workforce may be an important driver of standards, for many a high-quality, joined-up care system will involve substantial integration with health services.
Considerations such as these are central to the future of social care provision. However, in making pay an immediate priority, our central estimates consider the costs and savings of raising wages within today’s commissioning and delivery environment. Moreover, our emphasis on pay goes with the grain of wider developments many would like to see, and we think that our estimates are informative to these debates.
We are, of course, realistic about the fiscal constraints facing central and local government. It is a very difficult context in which to be making the case for new resources. But this issue is of vital importance, and calls for improvements to pay and conditions in care are gaining traction. Therefore we think it is appropriate to analyse the costs and benefits of higher pay, in order to understand what it would take and avoid this becoming just a casual aspiration. In addition to
[7] For example, see: G Eaton, ‘The public support a universal living wage - even if it costs jobs’, New Statesman, 22 February
2013; P Kellner, ‘Immigration welfare curb wins policy knock-out – again’, YouGov, 5 January 2015
[8] The Kingsmill review into working conditions across care and the Burstow commission on the home care workforce both
called for a living wage in care, as has the Demos Commission on Residential Care: Demos, ‘Commission on Residential Care’,
September 2014
This publication is available in the Childcare & Families section of our website @resfoundation
13As if we cared: the costs and benefits of a living wage for social care workers Section 1: Introduction
shedding light on the scale of the challenge, we give a sense of some of the practical steps that might be needed to get there.
Outline of this report
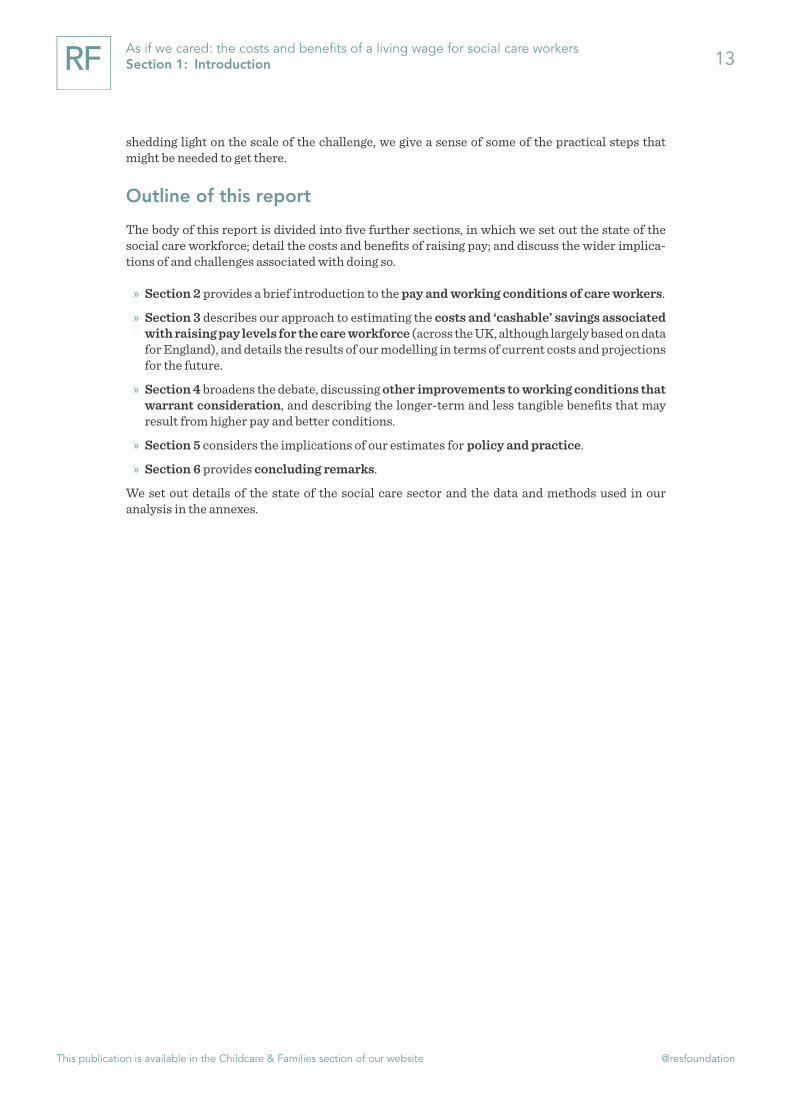
The body of this report is divided into five further sections, in which we set out the state of the social care workforce; detail the costs and benefits of raising pay; and discuss the wider implica-tions of and challenges associated with doing so.
» Section 2 provides a brief introduction to the pay and working conditions of care workers.
» Section 3 describes our approach to estimating the costs and ‘cashable’ savings associated with raising pay levels for the care workforce (across the UK, although largely based on data for England), and details the results of our modelling in terms of current costs and projections for the future.
» Section 4 broadens the debate, discussing other improvements to working conditions that warrant consideration, and describing the longer-term and less tangible benefits that may result from higher pay and better conditions.
» Section 5 considers the implications of our estimates for policy and practice.
» Section 6 provides concluding remarks.
We set out details of the state of the social care sector and the data and methods used in our analysis in the annexes.

This publication is available in the Childcare & Families section of our website @resfoundation
14As if we cared: the costs and benefits of a living wage for social care workers Section 2: Care worker pay and conditions
Section 2
Care worker pay and conditions
The state of the care workforce is a reflection of competing forces in social care. Demographic trends mean that the job is becoming more complex, at the same time as falling state spending puts downward pressure on already-low pay levels. As well as pay, wider terms and conditions are poor, reflecting the low social status of caring work. Meanwhile the workforce is getting larger and will need to continue to grow in coming years. In this section, we briefly describe the care workforce, care worker pay and conditions, and the recruitment challenge facing the sector.
Sizing the care workforce
The workforce is central to adult social care. Alongside childcare, social care has the highest share of turnover spent on labour costs of low-paying sectors, at 61 per cent.[9] Across the UK we estimate that there were 1.9 million jobs in care at the end of 2013, with the sector therefore accounting for around 6 per cent of UK employment. Much of the information we present about the workforce in this report relates to England only – as the largest jurisdiction with the most readily available data – however we refer to trends across the UK wherever possible.[10]
1.4 million of the jobs in social care involve the hands-on provision of care (‘frontline’ jobs), spanning domiciliary (49 per cent), residential (38 per cent) and day and community (13 per cent) service types. These figures include around 180,000 personal assistant jobs in domiciliary care employed by direct payment recipients (service users who receive payments from their local authority to organise their own care). This is a part of the care workforce about which much less is known in terms of pay and working conditions and therefore one that is generally not covered specifically in the statistics presented in this section.[11]
Reflecting rising demand, the workforce has grown even in the post-crisis period. That is, even as funding has fallen, the number of social care jobs in England grew by roughly 3 per cent per year between 2009 and 2013.[12]
As demand increases, so the job becomes more complex. The Cavendish Review, for example, found that care workers are increasingly being expected to perform difficult tasks previously the domain of registered nurses, usually with minimal training, supervision and support.[13] This review and other studies have highlighted that despite care services being of vital social importance and requiring a high level of maturity and resilience, social care work is low-status and badly rewarded. This reflects academic studies that have demonstrated that work involving helping and caring for others carries wage penalties when compared to roles [9] Low Pay Commission, ‘National Minimum Wage: Low Pay Commission Report 2014’, March 2014
[10] See Annex 2 for details of the extrapolation from England to other nations of the UK in our cost calculations.
[11] Estimates based on: Skills for Care, ‘The size and structure of the adult social care sector and workforce in England, 2014’,
September 2014; Labour Force Survey, ONS. See Annex 2 for details, including the limited information that is available on per-
sonal assistant pay levels.
[12] Skills for Care, ‘The size and structure of the adult social care sector and workforce in England, 2014’, September 2014
[13] ‘The Cavendish Review: An Independent Review into Healthcare Assistants and Support Workers in the NHS and social care
settings’, July 2013

This publication is available in the Childcare & Families section of our website @resfoundation
15As if we cared: the costs and benefits of a living wage for social care workers Section 2: Care worker pay and conditions
with otherwise similar attributes.[14]
A low-paying ‘sector of concern’
On this basis, and reflecting the broader pressures within social care discussed in the previous section, it is perhaps no surprise that pay and conditions in the UK care sector rank poorly. Social care has been flagged by the Low Pay Commission as a sector of concern.[15] We estimate that hourly pay for a typical frontline job was £7.20 in 2013-14, slightly higher in domiciliary services (£7.60) than in residential care homes (£6.80).[16] That compares with an adult minimum wage of £6.19 rising to £6.31 half way through the year, and living wages of £7.45 rising to £7.65 (outside London), and £8.55 rising to £8.80 (inside London).
The Low Pay Commission also highlights that wages have been harder-squeezed in social care than in other low-paying sectors in recent years, meaning that the ‘bite’ of the minimum wage (its ratio to median pay in a sector) has increased from 66 per cent in 2007 to 78 per cent in 2013. The overall ‘bite’ over the same period has shifted only slightly from 51 per cent to 52 per cent.[17] Although the situation has worsened recently, pay in social care has been poor for a long time, reflecting the low status of the job and the economic penalties attached to caring work described above.
Beneath the surface of already-low hourly rates, it is estimated that a significant minority of care jobs – around one-in-ten – in fact pay below the national minimum wage (NMW). This is due to the practice of only paying for ‘contact’ hours which doesn’t always adequately cover all working time.[18] This includes time spent travelling between clients in domiciliary care, and unpaid training and ‘on-call’ hours across domiciliary and residential care service types. While calculating total working time can be complex, the law is clear that these activities are in scope for the purposes of the NMW and that pay rates should be sufficient to cover them. Targeted efforts within the social care sector by HM Revenue & Customs (HMRC), reflecting growing concerns around non-compliance, have highlighted that inappropriate deductions from pay and accommo-dation offsets are further drivers of NMW underpayment. Nearly half of care employers investi-gated in these recent HMRC efforts were found to be non-compliant.[19]
With limited opportunities for progression
As well as pay in entry-level roles being low, sometimes illegally so, the care sector stands out as offering very limited opportunities to progress to higher pay levels. This reflects an increasingly ‘flat’ workforce hierarchy in which financial pressures and standardisation of services have led to little differentiation of frontline care roles or opportunity for specialisation. A reflection of this is the decline in the ratio of ‘senior care workers’ (who tend to have higher qualifications or more
[14] For example, see: B Hirsch & J Manzella, ‘Who Cares – and Does It Matter?: Measuring Wage Penalties for Caring Work’,
IZA, August 2014
[15] Low Pay Commission, ‘National Minimum Wage: Low Pay Commission Report 2014’, March 2014
[16] Estimate based on care workers in England using the National Minimum Dataset for Social Care (NMDS-SC), Skills for Care.
See Annex 2 for details.
[17] Low Pay Commission, ‘National Minimum Wage: Low Pay Commission Report 2014’, March 2014
[18] S Hussein, ‘Estimating Probabilities and Numbers of Direct Care Workers Paid under the National Minimum Wage in the
UK: A Bayesian Approach’, King’s College London, December 2011
[19] The results of recent HMRC investigations into NMW non-compliance in the social care sector are summarised in: HMRC,
‘National Minimum Wage compliance in the social care sector’, November 2013. For a fuller discussion of issues around NMW
compliance see: L Gardiner, ‘The scale of minimum wage underpayment in social care’, Resolution Foundation, January 2015

This publication is available in the Childcare & Families section of our website @resfoundation
16As if we cared: the costs and benefits of a living wage for social care workers Section 2: Care worker pay and conditions
specialised skills) to ‘care workers’ in domiciliary services from 7 per cent to 4 per cent between 2008 and 2012.[20]
Figure 1 provides an illustrative representation of how these kinds of developments lead to limited progression opportunities in social care, by comparing it to the healthcare sector. Each bubble represents an occupation, organised from left to right by the Office for National Statistics’ (ONS’s) standard occupation classification system, which roughly reflects increasing responsi-bilities and skills requirements. The size of each bubble represents its share of total employment within the sector, and its position on the y-axis represents median pay at that occupation level.
[20] However, unpublished Skills for Care data for the sector as a whole, as opposed to just domiciliary care, suggests the ratio
of senior care workers to care workers has held roughly constant between 2009 and 2013. Source: I Bessa et al, ‘The National
Minimum Wage, earnings and hours in the domiciliary care sector’, University of Leeds, February 2013
Figure 1: Stylised ‘occupational pay ladders’ in health and social care in the UK, 2013-14
Median hourly pay in occupations in the health and social care sectors
Notes: Occupations ranked roughly according to skill level using two-digit SOC2010 codes. Bubble size represents the proportion of jobs within a sector at each occupation level. Occupa-tions that account for less than 2 per cent of jobs within a sector have been omitted – this still leaves more than 90 per cent of each sector displayed on the chart. Roles at the same occupa-tion level in each sector are not necessarily equivalent in terms of responsibilities and skills requirements, meaning that this figure is a general and stylised illustration of patterns rather than a like-for-like comparison of sectors.
Source: Resolution Foundation analysis of Labour Force Survey, ONS
£5
£10
£15
£20
Lowest skill <--------------------- Occupations ---------------------> Highest skill
Health
Social care

This publication is available in the Childcare & Families section of our website @resfoundation
17As if we cared: the costs and benefits of a living wage for social care workers Section 2: Care worker pay and conditions
This comparison is stylised to a degree as roles in the two sectors are not directly equivalent and the sectors clearly have different functions, but what stands out is that:
» Social care has a greater concentration of employment at lower occupations than health;
» Social care pays less on average at similar occupation levels; and,
» Social care provides smaller pay increases upon moving up the occupational hierarchy.
It is therefore perhaps no surprise that many care workers seeking to progress view moving out of the sector and into other related sectors such as healthcare as the most viable route.[21]
And frequently poor conditions
Low pay and limited progression opportunities can be compounded by poor employment conditions in the social care sector:
» The irregular and task-based nature of the job leads to: anti-social hours; short visits in domiciliary care that do not always give workers the time to do their job adequately;[22] and uncertain contractual arrangements. For example, an estimated three-in-ten care workers are employed on zero-hours contracts.[23]
» As discussed above, travel time is often not covered in hourly pay rates, in addition to which few providers pay supplements for weekend or night shifts, and many do not fully reimburse travel and other expenses.[24]
» The casualised and low-status nature of the work also means that the incidence and coverage of employee benefits like pension contributions and occupational sickness policies is often low.[25]
» Partly reflecting the lack of progression opportunities, training standards are poor. Nearly one third of domiciliary care workers receive no regular ongoing training,[26] and across service types the training which does take place is neither sufficiently consistent nor sufficiently well-supervised, lacking a focus on day-to-day practice and clients’ specific needs.[27]
[21] This is particularly the case for migrant workers with qualifications in their home countries, who often accept employment in
the UK care sector as a foothold in the labour market and to provide a stepping stone into higher-paid nursing roles. See: S Hus-
sein, M Stevens & J Manthorpe, ‘Migrants’ motivations to work in the care sector: experiences from England within the context of
EU enlargement’, European Journal of Ageing 10:2, July 2013
[22] In 2012 one-in-ten domiciliary care visits lasted 15 minutes or less. Source: Leonard Cheshire Disability, ‘Ending 15-minute
care’, October 2013
[23] Skills for Care, ‘The state of the adult social care sector and workforce in England, 2012’, October 2012. It should be noted
that zero-hours contracts do not always represent ‘poor’ conditions – some workers favour the flexibility of this type of working
arrangement. See: V Alakeson & C D’Arcy, ‘Zeroing In: Balancing protection and flexibility in the reform of zero-hours contracts’,
Resolution Foundation, March 2014
[24] J Rubery et al, ‘The Recruitment and Retention of a Care Workforce for Older People’, University of Manchester Business
School, February 2011
[25] Evidence from providers and unions at roundtable discussions conducted as part of this research.
[26] UNISON, ‘Time to care: A UNISON report into homecare’, October 2012
[27] ‘The Cavendish Review: An Independent Review into Healthcare Assistants and Support Workers in the NHS and social care
settings’, July 2013

This publication is available in the Childcare & Families section of our website @resfoundation
18As if we cared: the costs and benefits of a living wage for social care workers Section 2: Care worker pay and conditions
Labour supply is high but recruitment pressures exist
In the context of such employment conditions it is reasonable to question how the social care sector manages to recruit into these roles. Studies have highlighted the intrinsic rewards that workers derive from caring roles which partly makes up for low pay and status – an important ‘pull factor’ into the social care sector that needs to be nurtured and emphasised.[28]But perhaps more significantly, the ability of the sector to maintain relatively low pay levels and poor working conditions is likely to reflect the combination of very low entry requirements and flexible work patterns that social care offers. The theory goes that this creates a ‘buyers’ market’ for people with mainly soft skills who lack access to higher-paying occupations; and those who require part-time roles close to home that they can fit around their own caring responsibilities. And the evidence appears to support this theory. Workers are primarily female (women account for more than 80 per cent of total employment) and aged over 30, with growing numbers of migrants, low levels of formal qualifications, a high incidence of part-time working and very limited union membership.[29]
Despite certain ‘pull factors’, recruitment into social care is a challenge. Perhaps reflecting poor pay and terms, turnover in the sector is high at 22 per cent each year, rising to 30 per cent in domiciliary care.[30] As well as meeting this constant replacement demand, projections suggest that social care in England will have to add up to 1 million additional jobs in the next decade to meet the needs of an ageing population.[31]
Low pay and poor terms are likely to hamper the ability of the sector to fill these roles in coming years. Increasingly fragmented working patterns leading to limited social support in the workplace, plus changes to the migrant labour population, may exacerbate the challenge. As well as the need to ensure quality and give a workforce providing a vital public service the status it deserves, the case for change therefore stems from concerns that the pool of prospective workers may diminish. Pay will inevitably prove critical to ensuring a continued supply. Therefore in the next section we consider the costs and benefits associated with raising pay in all frontline care jobs to at least the living wage.
[28] D Devins et al, ‘Improving progression in low-paid, low-skilled retail, catering and care jobs’, Joseph Rowntree Foundation,
February 2014
[29] J Philpott, ‘Rewarding work for low-paid workers’, Joseph Rowntree Foundation, April 2014; B Franklin, ‘The Future Care
Workforce’, International Longevity Centre, February 2014
[30] Skills for Care, ‘The state of the adult social care sector and workforce in England, 2012’, October 2012
[31] The projection of up to 1 million additional jobs is based solely on expected changes in demand. See: B Franklin, ‘The
Future Care Workforce’, International Longevity Centre, February 2014. Alternative projections by Skills for Care, based on a
range of funding and provision scenarios, forecast increases in the number of jobs in England of 15 to 55 per cent (up to 825,000
additional jobs) between 2013 and 2025. See: Skills for Care, ‘The size and structure of the adult social care sector and workforce
in England, 2014’, September 2014

This publication is available in the Childcare & Families section of our website @resfoundation
19As if we cared: the costs and benefits of a living wage for social care workers Section 3: The costs and savings associated with paying the living wage
Section 3
The costs and savings associated with paying the living wage
In previous sections we have discussed some of the drivers of poor workforce conditions in social care and the pervasive challenge of low pay in the sector. In addition, we have set out the case for improving pay and the consensus that is building around this priority. As we have highlighted, so far the debate has lacked any sense of the scale of the challenge if improvements are to be achieved. Therefore, in this section we provide estimates of the extra costs associated with raising pay. First, we describe the costs that relate to eradicating illegal underpayment of the minimum wage; and second, we assess the costs involved in raising pay to at least the living wage. We describe the total costs of paying the living wage across the sector, both today and in the medium-term future. In addition, we isolate the share of costs that relate to publicly-funded services and the ‘cashable’ savings these would generate, in order to estimate the ‘net’ cost should local or national government fund improvements. We also review the net benefit to workers and their families of higher pay levels.
Our approach
Our approach to calculating the costs and savings associated with raising pay follows a multi-stage process that brings together data from a number of sources and makes reasonable assumptions where necessary. Therefore, while we make every effort to ensure our calculations are as robust as possible, they should nonetheless be considered best approximations given the information available at the time.
A full description of the methods used in our analysis, the rationale behind our approach, the sources of our data and our assumptions is provided in Annexes 2 and 3. Rather than rehearse the methodology in detail here, we instead provide a conceptual outline of the approach taken. Our approach comprises five stages, which are summarised in Table 1.

This publication is available in the Childcare & Families section of our website @resfoundation
20As if we cared: the costs and benefits of a living wage for social care workers Section 3: The costs and savings associated with paying the living wage
Table 1: Stages in calculating the costs of raising care worker pay[32]
17
Table 1: Stages in calculating the costs of raising care worker pay
↓
↓
↓
↓
[32] Strictly speaking, this is also true for public spending on higher wages in care, which would need to be offset by tax
increases or spending cuts elsewhere. However, it is common to look at spending implications in isolation from funding in public
accounting.

This publication is available in the Childcare & Families section of our website @resfoundation
21As if we cared: the costs and benefits of a living wage for social care workers Section 3: The costs and savings associated with paying the living wage
We follow this process first in relation to eradicating underpayment of the minimum wage; second in relation to raising pay to the living wage; and finally in relation to paying the living wage against a future funding backdrop.
Eradicating underpayment of the minimum wage
As described in the previous section, social care has emerged as a sector of concern when it comes to minimum wage non-compliance. Low prima facie hourly rates, deductions from payand incidences where pay doesn’t cover all working hours combine to create a high risk of under-payment within the sector.
Here we estimate the costs associated with such illegal behaviour, on the basis that ensuring that this hole in care worker labour costs is filled is a necessary first step to thinking about wider pay improvements. The approach and findings presented here are discussed in more detail in our previous publication: The scale of minimum wage underpayment in social care.[33] What follows is a summary of the findings, with further details of the methods and assumptions provided in Annexes 2 and 3.
Capturing illegal pay practices in care is difficult as our best knowledge of care workers’ hours and wages comes from employers, who will generally not record deductions from pay, or unpaid time. The most robust estimate to date of non-compliance in the social care sector added conservative unpaid time estimates from a separate survey of workers to pay data to identify an estimated 11 per cent of frontline jobs paying below the NMW (now equivalent to 160,000 jobs).[34] There is too much uncertainty to be definitive, but this figure is accepted as the current best estimate of the prevalence of non-compliance in social care. We carry this estimate forward and follow the approach of this previous research to including unpaid hours in working time, in order to estimate the average underpayment for those whose wages fall short of the NMW.[35]
Our results are summarised in Table 2. We estimate that the total cost of eradicating minimum wage non-compliance across the UK would have amounted to £142 million
[33] L Gardiner, ‘The scale of minimum wage underpayment in social care’, Resolution Foundation, January 2015
[34] S Hussein, ‘Estimating Probabilities and Numbers of Direct Care Workers Paid under the National Minimum Wage in the
UK: A Bayesian Approach’, King’s College London, December 2011
[35] In terms of our staged calculation approach described above, this means that we estimate the average increase in wages
when pay is raised to at least the NMW only for jobs that pay under the NMW in Stage 1 (after adjusting rates for unpaid hours).
And then in Stage 3 we gross only to the total number of jobs estimated to pay below the NMW.
i Box 2: The jobs in scope for our calculations of the cost of improving pay
Our analysis covers the 1.4 million frontline care jobs in the UK – those that involve providing hands-on care for people across domiciliary, residential, day and community services. We do not include managerial, professional or ancillary jobs (see Annex 2 for details of our rationale and the implications of this choice). As much as our under-standing of this part of the workforce allows, our analysis covers jobs in which personal assistants are employed directly by a direct payment recipient, and jobs where work is purchased from care-providing agencies by direct
payment recipients.[1] A lack of data means we are not able to include people who are self-employed and delivering services for direct payment recipients or those personal assistants directly employed by private self-funders. Nonetheless, our estimates are likely to capture the great majority of publicly-funded frontline care services, as well as the majority of privately-funded services.
[1] Direct payments involve local authorities giving care recipients money
to pay for (and sometimes organise) their own care, rather than commission-
ing care services on their behalf.

This publication is available in the Childcare & Families section of our website @resfoundation
22As if we cared: the costs and benefits of a living wage for social care workers Section 3: The costs and savings associated with paying the living wage
in 2013-14. This comprises £129 million of direct underpayment and £13 million of associated employer National Insurance and pension contributions. This is our estimate of the amount of money that needs to be invested in labour costs to eradicate underpayment due to prima facie hourly rates below the NMW, and unpaid time. While these figures are significantly higher than the level of non-compliance uncovered in recent HMRC investigations, they may still be conserv-ative given that we rely on employer-provided data to capture initial pay rates, and have accounted for possible overestimation of unpaid hours. In addition, our estimate does not attempt to capture the impact of deductions from pay or accommodation offsets, common drivers of non-compliance in HMRC’s investigations.[36]
Table 2: Summary of costs and benefits associated with eradicating minimum wage non-compliance for frontline care workers in the UK, 2013-14
19
of non-compliance in social care. We carry this estimate forward and follow the approach of this previous research to including unpaid hours in working time, in order to estimate the average underpayment for those whose wages fall short of the NMW.41
Our results are summarised in Table 2. We estimate that the total cost of eradicating minimum wage non-compliance across the UK would have amounted to £142 million in 2013-14. This comprises £129 million of direct underpayment and £13 million of associated employer National Insurance and pension contributions. This is our estimate of the amount of money that needs to be invested in labour costs to eradicate underpayment due to prima facie hourly rates below the NMW, and unpaid time. While these figures are significantly higher than the level of non-compliance uncovered in recent HMRC investigations, they may still be conservative given that we rely on employer-provided data to capture initial pay rates, and have accounted for possible overestimation of unpaid hours. In addition, our estimate does not attempt to capture the impact of deductions from pay or accommodation offsets, common drivers of non-compliance in HMRC’s investigations.42
Table 2: Summary of costs and benefits associated with eradicating minimum wage non-compliance for frontline care workers in the UK, 2013-14
Average annual increase in wages per job paid under NMW £815 Average annual increase in total employer costs per job paid under NMW £895 Average increase in net annual income for workers paid under NMW £490 Gross total costs (for all jobs paid under NMW, 11% of jobs) £142 million Of which: gross wage costs £129 million Of which: gross employer NICs costs £9 million Of which: gross pension costs £4 million Tax and benefit savings from eradicating NMW underpayment £61 million
Notes: Wage increases include costs associated with statutory holiday, sickness and parental leave policies; and conservative estimates of training time. Total employer costs include employer NICs and modest pension contributions. Tax and benefit savings are estimated using the RF microsimulation model. See Annex 3 for further details of the methods and assumptions used.
Source: Resolution Foundation analysis of: NMDS-SC, Skills for Care; Longitudinal Care Work Study, King’s College London; Skills for Care workforce estimates in ‘The size and structure of the adult social care sector and workforce in England, 2014’, September 2014; Labour Force Survey, ONS
We continue to make the case that despite the financial constraints care providers face, and the greater complexities of calculating rates for the purpose of the NMW in social care than in other sectors, there is no excuse for illegal pay. On this basis, we argue that care providers are fully liable for the costs of fixing this problem – even when non-compliance is not deliberate or wilful but rather
41 In terms of our staged calculation approach described above, this means that we estimate the average increase in wages when pay is raised to at least the NMW only for jobs that pay under the NMW in Stage 1 (after adjusting rates for unpaid hours). And then in Stage 3 we gross only to the total number of jobs estimated to pay below the NMW. 42 Comparison of our estimate and the level of non-compliance uncovered in recent HMRC investigations is difficult due to the different reasons for non-compliance captured by each, in addition to which the time period that the HMRC arrears figures cover is not clear. See: HMRC, ‘National Minimum Wage compliance in the social care sector’, November 2013
Notes: Wage increases include costs associated with statutory holiday, sickness and parental leave policies; and conservative estimates of training time. Total employer costs include employer NICs and modest pension contributions. Tax and benefit savings are estimated using the RF microsimulation model. See Annex 3 for further details of the methods and assumptions used.
Source: Resolution Foundation analysis of: NMDS-SC, Skills for Care; Longitudinal Care Work Study, King’s College London; Skills for Care workforce estimates in ‘The size and structure of the adult social care sector and workforce in England, 2014’, September 2014; Labour Force Survey, ONS
We continue to make the case that despite the financial constraints care providers face, and the greater complexities of calculating rates for the purpose of the NMW in social care than in other sectors, there is no excuse for illegal pay. On this basis, we argue that care providers are fully liable for the costs of fixing this problem – even when non-compliance is not deliberate or wilful but rather stems from a misunderstanding of regulation or financial pressures, as is often the case.[37] It is for this reason that we have not isolated the public costs of eradicating NMW underpayment. We turn to the steps needed to ensure that action is taken to stamp out non-compliance in Section 5.
If employers were to plug this gap in labour costs, we estimate that the public purse would have gained though additional tax receipts and lower benefit spending to the tune of £61 million in 2013-14. However, this estimate should be treated with a high degree of caution as it doesn’t account for possible losses in other areas, For example, corporation tax receipts may be lower if
[36] Comparison of our estimate and the level of non-compliance uncovered in recent HMRC investigations is difficult due to
the different reasons for non-compliance captured by each, in addition to which the time period that the HMRC arrears figures
cover is not clear. See: HMRC, ‘National Minimum Wage compliance in the social care sector’, November 2013
[37] By contrast, some have argued that local authorities are complicit in the practice of non-compliance in instances when
they commission care at prices that are not sufficient for providers to both pay the NMW and cover other costs. The recent Local
Government Information Unit (LGiU) / Burstow commission on home care reported that few councils pay above the rate that
the United Kingdom Homecare Association (UKHCA) judges to be sufficient for meeting minimum wage obligations. This is an
important concern and one that we return to in Section 5 when thinking about the steps that need to be taken to eradicate NMW
non-compliance. However, our assertion remains that employers in all sectors have a legal responsibility to pay the minimum
wage (and should be aware of the precise regulations around this, and should not enter into contracts that prevent them from
doing so). Therefore we argue that the costs of eradicating non-compliance ought to fall on care providers. See: I Koehler, ‘Key to
Care: Report of the Burstow Commission on the future of the home care workforce’, LGiU, December 2014; C Angel, ‘A Minimum
Price for Homecare: Version 2.1’, UKHCA, November 2014

This publication is available in the Childcare & Families section of our website @resfoundation
23As if we cared: the costs and benefits of a living wage for social care workers Section 3: The costs and savings associated with paying the living wage
providers fund labour cost increases through lower profits.[38]
Even after these higher taxes and lower benefits are taken into account, we estimate that the average care worker paid under the NMW would have been £490 better off in 2013-14 if non-compliance had been eradicated.
[38] For example, in recent submissions to the Low Pay Commission on the impact of higher minimum wage rates on the fiscal
position, HM Treasury has estimated that corporation tax falls roughly one third as much as the cumulative gains from higher
personal tax receipts and lower in-work benefit spending. Job losses as a result of efforts to eradicate NMW underpayment
could cause further Exchequer costs. See: Department for Business, Innovation & Skills, ‘National Minimum Wage: Government
Evidence for the Low Pay Commission on the Additional Assessment’, January 2014
i Box 3: Why the living wage?
In the context of improving pay within the sector, few would argue with our first priority of eradicating illegal minimum wage non-compliance. However, our choice of the living wage as a floor in more wide-reaching improve-ments to pay may be less clear-cut.
For example, there are alternative approaches to raising pay than just pushing up the minimum rate, such as proportional increases across the workforce. However, given the increasingly ‘flat’ structure and undifferentiated nature of frontline care jobs (79 per cent are ‘care workers’ as opposed to ‘senior care workers’ and other roles), raising floor levels of pay appears an effective and much more straightforward course of action. That said, we do make small adjustments in our calculation for the ‘spillover’ effects on higher-paid jobs when minimum pay rates rise (see Annex 3 for details).
In the context of raising wage floors, the living wage is a reasonable and non-arbitrary target (as opposed to a percentage uplift on the minimum wage, for example). It is calculated to roughly reflect the cost of living across different types of family, and as such the rate is higher in London. It is a sizable but not enormous step up from the minimum wage – the current rates are £7.85 nationally and £9.15 in London, 21 per cent and 41 per cent higher respectively than the current adult minimum wage of £6.50. And it would represent a pay rise in most (65 per cent) but not all frontline care jobs if implemented – materially improving living standards for the majority while still leaving some room for differentiation.
Finally, the non-arbitrariness of the living wage and the campaign behind it mean it is widely recognised and has
traction with both politicians and employers. The living wage is very popular with the public,[1] which, given the social care sector is mainly publicly-funded, provides some justification for sector-wide efforts to achieve it. Reflecting this, making care a living wage sector has been a central recommendation of recent high-profile enquiries, including the Kingsmill review, the Burstow commission on the home care workforce and the Demos commission on residential care.[2] Our choice of the living wage in our cost calcula-tions is intended to build on these recommendations.
The calculations here, as well as the future projections that follow, are a further iteration on those on NMW non-compliance above. In other words, our costs of paying the living wage assume that underpayment of the minimum wage has been eradicated. That is, employers already pay the applicable minimum wage rate or higher for all working hours. In the same vein, as best as current data and knowledge allows us, we evaluate the cost of paying at least the living wage for all working hours, and not just a subset such as ‘contact’ hours.[3]
[1] For example, see: G Eaton, ‘The public support a universal living wage
- even if it costs jobs’, New Statesman, 22 February 2013; P Kellner, ‘Immi-
gration welfare curb wins policy knock-out – again’, YouGov, 5 January 2015
[2] D Kingsmill, ‘The Kingsmill Review: Taking Care: An independent
report into working conditions in the Care Sector’, May 2014; I Koehler, ‘Key
to Care: Report of the Burstow Commission on the future of the home care
workforce’, LGiU, December 2014; Demos, ‘Commission on Residential
Care’, September 2014
[3] In other words, we continue to include the conservative estimates of
unpaid time we added in the NMW underpayment calculations above.

This publication is available in the Childcare & Families section of our website @resfoundation
24As if we cared: the costs and benefits of a living wage for social care workers Section 3: The costs and savings associated with paying the living wage
Raising pay to at least the living wage
We now consider the extra costs associated with broader improvements to care worker pay than just ensuring compliance with statutory minimums – namely, raising pay to the living wage. We estimate that nearly 1 million frontline care jobs (930,000, 65 per cent of all frontline jobs) paid below the applicable living wage in 2013-14, meaning that such a change would have wide-reaching implications across the sector. Our rationale for targeting the living wage and more details on its relationship to the current pay distribution of care jobs is provided in Box 3.
Table 3: Summary of costs and benefits associated with a living wage for frontline care workers in the UK, 2013-14
21
For example, there are alternative approaches to raising pay than just pushing up the minimum rate, such as proportional increases across the workforce. However, given the increasingly ‘flat’ structure and undifferentiated nature of frontline care jobs (79 per cent are ‘care workers’ as opposed to ‘senior care workers’ and other roles), raising floor levels of pay appears an effective and much more straightforward course of action. That said, we do make small adjustments in our calculation for the ‘spillover’ effects on higher-paid jobs when minimum pay rates rise (see Annex 3 for details).
In the context of raising wage floors, the living wage is a reasonable and non-arbitrary target (as opposed to a percentage uplift on the minimum wage, for example). It is calculated to roughly reflect the cost of living across different types of family, and as such the rate is higher in London. It is a sizable but not enormous step up from the minimum wage – the current rates are £7.85 nationally and £9.15 in London, 21 per cent and 41 per cent higher respectively than the current adult minimum wage of £6.50. And it would represent a pay rise in most (65 per cent) but not all frontline care jobs if implemented – materially improving living standards for the majority while still leaving some room for differentiation.
Finally, the non-arbitrariness of the living wage and the campaign behind it mean it is widely recognised and has traction with both politicians and employers. The living wage is very popular with the public,45 which, given the social care sector is mainly publicly-funded, provides some justification for sector-wide efforts to achieve it. Reflecting this, making care a living wage sector has been a central recommendation of recent high-profile enquiries, including the Kingsmill review, the Burstow commission on the home care workforce and the Demos commission on residential care.46 Our choice of the living wage in our cost calculations is intended to build on these recommendations.
Table 3: Summary of costs and benefits associated with a living wage for frontline care workers in the UK, 2013-14
45 For example, see: G Eaton, ‘The public support a universal living wage - even if it costs jobs’, New Statesman, 22 February 2013; P Kellner, ‘Immigration welfare curb wins policy knock-out – again’, YouGov, 5 January 2015 46 D Kingsmill, ‘The Kingsmill Review: Taking Care: An independent report into working conditions in the Care Sector’, May 2014; I Koehler, ‘Key to Care: Report of the Burstow Commission on the future of the home care workforce’, LGiU, December 2014; Demos, ‘Commission on Residential Care’, September 2014
Notes: Baseline scenario assumes that jobs are paid at least the applicable minimum wage rate for all working hours. Wage increases include costs as-sociated with statutory holiday, sickness and parental leave policies; and conservative estimates of training time. Total employer costs include employer NICs and modest pension contributions. Gross public costs are estimated at 60.7 per cent of gross total costs. Tax and benefit savings are estimated using the RF microsimulation model and applied to public costs only. See Annex 3 for further details of the methods and assumptions used.
Source: Resolution Foundation analysis of: NMDS-SC, Skills for Care; Longitudinal Care Work Study, King’s College London; Skills for Care workforce estimates in ‘The size and structure of the adult social care sector and workforce in England, 2014’, September 2014; Labour Force Survey, ONS
Table 3 summarises our results. We estimate that a living wage for all frontline care jobs in the UK would have increased labour costs by £2.3 billion in 2013-14. Of this, we estimate gross public costs of £1.4 billion (these are the costs associated with publicly-funded services procured by local authorities). We estimate that 47 per cent of this £1.4 billion would accrue to the public purse in the form of higher personal tax receipts and lower benefit spending. Therefore, if public money were used to fund a living wage for care workers, we estimate a net cost across the public finances of £726 million in 2013-14.
In line with the above, we estimate that a living wage across the frontline care workforce would have raised the average worker’s net annual income by £780 in 2013-14.
As the previous section highlighted, we recognise that although low pay and poor terms are an issue across domiciliary and residential care, the drivers are somewhat different in each service type. In addition, each service type has a separate public voice in terms of employer and worker representation.
Therefore Table 4 provides a summary of the incidence of costs across the main service types. It shows that workers stand to gain more on average in residential care (due to lower pay rates in this service type). However, the slightly larger domiciliary workforce, and greater incidence of public funding for domiciliary services (see Annex 3), means public costs are slightly higher in domiciliary than in residential care. Although the approach is very different, our figure for the gross public cost of paying the living wage in domiciliary care is in line with recent indicative

This publication is available in the Childcare & Families section of our website @resfoundation
25As if we cared: the costs and benefits of a living wage for social care workers Section 3: The costs and savings associated with paying the living wage
estimates from the Burstow commission on the future of the home care workforce.[39] The much smaller day and community workforce and their higher initial pay means only a small proportion of costs would fall on this service type.
Table 4: Summary of costs and benefits associated with a living wage for frontline care workers in the UK, disaggregated by service type, 2013-14
Domiciliary Residential
Average annual increase in wages per job £1,250 £1,960
Average annual increase in total employer costs per job £1,425 £2,260
Average increase in net annual income per worker £705 £1,105
Gross total costs £1,005 million £1,225 million
Gross public costs £732 million £618 million
% of public costs saved in taxes and benefits 47% 48%
Net public costs £386 million £323 million
Notes: Baseline scenario assumes that jobs are paid at least the applicable minimum wage rate for all working hours. Wage increases include costs as-sociated with statutory holiday, sickness and parental leave policies; and conservative estimates of training time. Total employer costs include employer NICs and modest pension contributions. Gross public costs are estimated separately for each service type. Tax and benefit savings are estimated using the RF microsimulation model and applied to public costs only. See Annex 3 for further details of the methods and assumptions used.
Source: Resolution Foundation analysis of: NMDS-SC, Skills for Care; Longitudinal Care Work Study, King’s College London; Skills for Care workforce estimates in ‘The size and structure of the adult social care sector and workforce in England, 2014’, September 2014; Labour Force Survey, ONS
Finally, as stated in the previous section, care is a devolved policy area, meaning that were public money used to fund a living wage it would be divided between different jurisdictions (even if originating from the national public purse). Therefore Table 5 provides an estimate of the incidence of costs in the different nations of the UK based on the size of the frontline care workforce in each nation. Estimates are indicative for nations other than England due to the coverage of the data underpinning this analysis (see Annex 2 for details).
Table 5: Summary of costs and benefits associated with a living wage for frontline care workers in the UK, disaggregated by nation, 2013-14
23
community workforce and their higher initial pay means only a small proportion of costs would fall on this service type.
Table 4: Summary of costs and benefits associated with a living wage for frontline care workers in the UK, disaggregated by service type, 2013-14
Notes: Baseline scenario assumes that jobs are paid at least the applicable minimum wage rate for all working hours. Wage increases include costs associated with statutory holiday, sickness and parental leave policies; and conservative estimates of training time. Total employer costs include employer NICs and modest pension contributions. Gross public costs are estimated separately for each service type. Tax and benefit savings are estimated using the RF microsimulation model and applied to public costs only. See Annex 3 for further details of the methods and assumptions used.
Source: Resolution Foundation analysis of: NMDS-SC, Skills for Care; Longitudinal Care Work Study, King’s College London; Skills for Care workforce estimates in ‘The size and structure of the adult social care sector and workforce in England, 2014’, September 2014; Labour Force Survey, ONS
Finally, as stated in the previous section, care is a devolved policy area, meaning that were public money used to fund a living wage it would be divided between different jurisdictions (even if originating from the national public purse). Therefore Table 5 provides an estimate of the incidence of costs in the different nations of the UK based on the size of the frontline care workforce in each nation. Estimates are indicative for nations other than England due to the coverage of the data underpinning this analysis (see Annex 2 for details).
Table 5: Summary of costs and benefits associated with a living wage for frontline care workers in the UK, disaggregated by nation, 2013-14
Notes: See Table 3. These estimates are based only on the relative size of the frontline workforce in each nation and data on pay and job characteristics for England only – we do not use information on different pay patterns within different parts of the UK. This means that estimates are indicative for nations other than England.
Source: Resolution Foundation analysis of: NMDS-SC, Skills for Care; Longitudinal Care Work Study, King’s College London; Skills for Care workforce estimates in ‘The size and structure of the adult social care sector and workforce in England, 2014’, September 2014; Labour Force Survey, ONS
[39] The Burstow commission took an expenditure-driven approach to calculating the public cost of raising pay to the living wage
across third-party-provided domiciliary care in England (i.e. excluding the small proportion of services provided by local authori-
ties in-house). It combined Health & Social Care Information Centre data on average unit costs and the volume of care purchased
by local authorities in England with UKHCA estimates on the minimum unit cost that would allow providers to pay the living wage.
This produced an estimate of £529 million for England in 2013-14, which, given it excludes a small proportion of in-house services,
appears to be in line with our estimate for the UK as a whole of £732 million. See: I Koehler, ‘Key to Care: Report of the Burstow
Commission on the future of the home care workforce’, LGiU, December 2014

This publication is available in the Childcare & Families section of our website @resfoundation
26As if we cared: the costs and benefits of a living wage for social care workers Section 3: The costs and savings associated with paying the living wage
Who pays? Some implications of our living wage cost calculations
Stages 4 and 5 of our calculations – those that isolate gross and net public costs – reflect a common acceptance that any efforts to make overarching improvements to pay in the sector will require some injection of public funds.
Local authorities have a largely monopsonistic purchasing power in care markets, meaning that price-setting is mainly in their hands. Profits are thought to be low already, limiting providers’ ability to redirect these to wages, and wages account for a large proportion of the overall cost of services.[40] In addition, the scope to fund higher wages via productivity gains appears minimal given the limited role for technology in the sector and statutory requirements that confine delivery models.[41] And while improvements in commissioner and provider practices may free up existing funds, it is felt that we may be reaching saturation point in terms of the current approach of demanding more for less (particularly as our estimates are predicated on providers already having plugged the hole in wages due to NMW non-compliance using existing resources).
We turn to the practical and policy implications of increased public funding for a living wage in care in Section 5. Here, we briefly discuss some of the key assumptions underpinning our cost calculations in terms of who pays, and how much:
» First, our separation of total costs and public costs implies that if public funding were to rise to support a living wage, so too would self- and co-funded expenditure increase. Our estimates suggest that private funding would have needed to rise by around £900 million in 2013-14 (the difference between gross total costs and gross public costs).[42] Importantly, our approach to isolating public costs is based on the public share of services, rather than of expenditure. What this means is that we do not assume that the oft-cited self-funder ‘premium’ – where private purchasers pay more than local authorities for the same services – means costs fall disproportionately on the private market (see Annex 3 for further details). Therefore relative price increases for self-funders may be more limited than in other instances of rising costs. Nonetheless, with widespread concern about the cost to individuals of funding their own care in later life, the implications of a living wage in care for self-funded expenditure merit further careful consideration.
» Second, as indicated in the outline of our approach, we consider only increases in personal tax revenue and decreased in-work benefit spending resulting from publicly-funded social care services. But these may not constitute the total fiscal impacts of raising wages for a large, low-paid workforce. For example, higher wages for low earners may drive consumption and therefore increase VAT receipts as well as personal tax receipts. Higher wages also imply higher pension contributions, which would increase tax revenue in years to come when these pensions are drawn down. And, depending on how higher wages are funded, there might be ‘multiplier’ effects from an improved Exchequer position, for example healthier public finances may result in reduced government borrowing.[43]
[40] For example, see: Skills for Care, ‘The economic value of the adult social care sector in England’, February 2013
[41] Low Pay Commission, ‘National Minimum Wage: Low Pay Commission Report 2014’, March 2014
[42] One implication of this additional cost for private funders that our estimate does not capture is that more private spending
could push self-funders below the means-tested threshold for public support, or bring them above the lifetime expenditure cap
brought in by the Care Act (2014) more quickly. This would increase the demand for public funding and therefore may drive up
the public cost of paying the living wage.
[43] For a discussion of the possible multiplier effects of increasing pay to the living wage, see: H Reed, ‘The Economic Impact
of Extending the Living Wage to all Employees in the UK’, Landman Economics, October 2013

This publication is available in the Childcare & Families section of our website @resfoundation
27As if we cared: the costs and benefits of a living wage for social care workers Section 3: The costs and savings associated with paying the living wage
The transfer of resources from private funders to care workers – if self- and co-funder fees increase to meet the costs associated with privately-funded services – may also result in higher tax revenue that we have not captured. For example, the tax revenue from the privately-funded part of wage increases may be greater than that which would have resulted were the money spent by self-funders elsewhere in the economy. Higher private expenditure on care may bring consumption spending forward in time if care recipients release equity to pay for services. And such a transfer of resources from self- and co-funders to workers may also generate distributional gains if care workers are less wealthy on average.[44] On the other hand there may be downside fiscal effects from a living wage in care. For example higher wages for a sizable number of workers may create inflationary pressure, which would imply higher benefit spending and higher index-linked debt interest.[45] These wider and dynamic Exchequer impacts of paying the living wage to care workers are complex and difficult to predict, hence our choice to keep our estimation of savings limited to the most directly ‘cashable’. Overall, our judgement is that the sum of what we do not capture is more likely to be a positive fiscal effect than a negative one, meaning we produce a conserv-ative – but robust – estimate of the total savings that would result.
» Third, not featuring in our estimate of savings are the potential wider social and economic benefits of paying the living wage. For example, if better pay leads to service quality improve-ments. However, these are an important consideration when making the case. Therefore we evaluate the evidence in favour of these wider improvements in the following section, Section 4.
In terms of the savings we do consider, Figure 2 disaggregates these into the component parts. It shows that nearly three-quarters of savings come from higher tax receipts, the rest relates to lower in-work benefit expenditure. In addition, it highlights that the vast majority of savings would accrue to national budgets. Only 1 per cent – the savings in Council Tax Support expenditure – would be felt in local authority budgets.
[44] Such distributional gains are often estimated in the ‘business case’ for policy interventions to support those on low
incomes. For example see the Universal Credit business case in: National Audit Office, ‘Universal Credit: Progress update’, No-
vember 2014
[45] Inflationary pressure, an increase in unemployment and lower corporation tax receipts are the key negative fiscal effects
captured by HM Treasury in its estimation that raising wage floors across the economy (via the minimum wage) has little overall
fiscal benefit. If we assume that the funding for higher wages across the current (and future) workforce will be met by public
funds and higher self-funder prices, we judge that the unemployment and corporation tax implications are likely to be minimal
if they exist at all (as providers would not need to dip into profits or lay off staff). Because we are only raising pay in one sector,
we judge that inflationary pressure, while still possible, would be lower than in the case of raising minimum pay levels across the
economy. There may also be some downward pressure on indirect taxes due to higher self-funded expenditure on care in lieu of
expenditure on items for which VAT is chargeable. Overall, we think the downside fiscal effects of paying care workers the living
wage in this way are likely to be much more limited than in Treasury calculations relating to the minimum wage. See: Department
for Business, Innovation & Skills, ‘National Minimum Wage: Government Evidence for the Low Pay Commission on the Additional
Assessment’, January 2014

This publication is available in the Childcare & Families section of our website @resfoundation
28As if we cared: the costs and benefits of a living wage for social care workers Section 3: The costs and savings associated with paying the living wage
Paying the living wage over the course of the next parliament
While data availability means that the last complete financial year (2013-14) has to be the basis for our calculations, the more relevant question for policy and practice is how much paying care workers the living wage will cost in future years. In this section we describe our general approach to projecting future costs and our results, with full methodological details provided in Annex 3.
A key factor driving future costs will be the size of the frontline care workforce, which is expected to grow significantly, reflecting rising demand. In this analysis we use Skills for Care’s projections for the future size of the workforce in England (which we extrapolate to the UK as a whole). We use the base case projection for our central forecast, which holds the current relationship between funding and provision, and current service patterns, constant. We also evaluate the alternative scenarios to provide upper and lower bounds on our central case.[46]
We choose not to simply uprate the costs we have calculated for 2013-14 in line with earnings or inflation projections and the future size of the workforce, for two reasons:
» First, we expect the wage floor to rise more quickly than typical or average pay. The NMW is set to rise by 3 per cent in October 2015 and both major political parties have indicated a preference for it to regain some of the ground lost over the course of the downturn. The Labour Party has specified a target of £8 for the end of the next
[46] Skills for Care, ‘The size and structure of the adult social care sector and workforce in England, 2014’, September 2014
Figure 2: A breakdown of tax and benefit savings associated with a living wage for frontline care workers in the UK, 2013-14
This is the line that explains the chart below
Notes: See Table 3.
Source: Resolution Foundation analysis of: NMDS-SC, Skills for Care; Longitudinal Care Work Study, King’s College London; Skills for Care workforce estimates in ‘The size and structure of the adult social care sector and workforce in England, 2014’, September 2014; Labour Force Survey, ONS
National Insurance contributions (both
employer and employee)
40%
Income tax 30%
Tax Credits 21%
Housing Benefit
8%
Council Tax Support,1%
Personal tax and benefit savings
associated with a living wage for frontline care
workers

This publication is available in the Childcare & Families section of our website @resfoundation
29As if we cared: the costs and benefits of a living wage for social care workers Section 3: The costs and savings associated with paying the living wage
parliament, a figure that matches the current HM Treasury forecasts for 2019-20.[47] The minimum wage is a key driver of wages in care jobs – around 40 per cent earn within 5 pence of it – and therefore has implications for the future cost of improving pay. As the Low Pay Commission has highlighted, in sectors like care that are largely publicly-funded and offer limited opportunities to raise productivity, strong minimum wage increases necessitate commensurate increases in public funding.[48] Such increases would be necessary before even thinking about moving to the living wage. For example, we estimate that at least £320 million additional gross public funding will be required by 2019-20 to support an £8 minimum wage in UK frontline care, relative to one that rises in line with expected earnings growth. Relative to inflation – often the benchmark for annual increases in local authority fees – the additional funding required rises to at least £870 million.[49] To be clear, while a higher minimum wage reduces the cost of raising pay to the living wage (because the gap between the two is smaller), it implies that more has been spent to support this higher minimum wage in the first place. Our central projection assumes that funding is already rising in line with minimum wage obligations and presents additional costs for paying the living wage on top. However, we also present alternative scenarios in which funding pressures cause further clustering around the NMW.
» Second, we expect the living wage to also outpace average earnings growth (and even NMW growth), reflecting the way it is calculated. We expect the UK (outside London) living wage to increase to over £10 per hour by 2020.
The combination of these trends – producing fast-growing pay and a widening gap between the minimum and living wage – means costs are likely to rise quicker than just uprating current estimates in line with earnings or inflation would imply.
Therefore, to estimate future costs we repeat our ‘bottom up’ costings approach described at the beginning of this section, but we separately uprate earnings, minimum wage rates, living wage rates, tax and benefit rules, and other inputs.
For our central forecast we assume that the minimum wage grows to reach £8 by 2019-20. Given the importance of the NMW to social care workers, we assume pay in the sector follows the same trajectory. This implies that the distribution of pay around the NMW remains constant. We project living wage rates based on future increases implied by the UK living wage methodology, and assume the London rate grows at the same pace. Where data is available we uprate other assumptions, otherwise we hold them constant (see Annex 3 for full details).
Table 6 shows the results of our central forecast. Whether looking at total costs, gross public costs or net public costs, we estimate that the nominal cost of paying the living wage would almost double over the period – with net public costs increasing by 95 per cent between 2013-14 and 2019-20.
[47] C D’Arcy, ‘A £6.70 minimum wage – how ambitious a rise is it?’, Resolution Foundation blog, 24 February 2015
[48] Low Pay Commission, ‘National Minimum Wage: Low Pay Commission Report 2014’, March 2014
[49] See Annex 3 for details, including estimates of gross total costs and net public costs.

This publication is available in the Childcare & Families section of our website @resfoundation
30As if we cared: the costs and benefits of a living wage for social care workers Section 3: The costs and savings associated with paying the living wage
Table 6: Summary of costs and benefits associated with a living wage for frontline care workers in the UK, future projections according to central forecast
28
The combination of these trends – producing fast-growing pay and a widening gap between the minimum and living wage – means costs are likely to rise quicker than just uprating current estimates in line with earnings or inflation would imply.
Therefore, to estimate future costs we repeat our ‘bottom up’ costings approach described at the beginning of this section, but we separately uprate earnings, minimum wage rates, living wage rates, tax and benefit rules, and other inputs.
For our central forecast we assume that the minimum wage grows to reach £8 by 2019-20. Given the importance of the NMW to social care workers, we assume pay in the sector follows the same trajectory. This implies that the distribution of pay around the NMW remains constant. We project living wage rates based on future increases implied by the UK living wage methodology, and assume the London rate grows at the same pace. Where data is available we uprate other assumptions, otherwise we hold them constant (see Annex 3 for full details).
Table 6 shows the results of our central forecast. Whether looking at total costs, gross public costs or net public costs, we estimate that the nominal cost of paying the living wage would almost double over the period – with net public costs increasing by 95 per cent between 2013-14 and 2019-20.
Table 6: Summary of costs and benefits associated with a living wage for frontline care workers in the UK, future projections according to central forecast
Notes: See Table 3. Real costs are estimated using CPI inflation projections.
Source: Resolution Foundation analysis of: NMDS-SC, Skills for Care; Longitudinal Care Work Study, King’s College London; Skills for Care workforce estimates in ‘The size and structure of the adult social care sector and workforce in England, 2014’, September 2014; Labour Force Survey, ONS; Office for Budget Responsibility, ‘Economic and Fiscal Outlook’, December 2014
While nominal costs are important, a more helpful assessment of the relative increase in the cost of a living wage for care workers may be gained by assessing costs in real terms or as a proportion of GDP, also shown in Table 6 for net public costs. We find that:
Expressing net public costs in 2014-15 prices rather than in nominal terms, our central forecast suggests an increase of 75 per cent between 2013-14 and 2019-20 – from £736 million to £1.3 billion.
Notes: See Table 3. Real costs are estimated using CPI inflation projections.
Source: Resolution Foundation analysis of: NMDS-SC, Skills for Care; Longitudinal Care Work Study, King’s College London; Skills for Care workforce estimates in ‘The size and structure of the adult social care sector and workforce in England, 2014’, September 2014; Labour Force Survey, ONS; Office for Budget Responsibility, ‘Economic and Fiscal Outlook’, December 2014
While nominal costs are important, a more helpful assessment of the relative increase in the cost of a living wage for care workers may be gained by assessing costs in real terms or as a proportion of GDP, also shown in Table 6 for net public costs. We find that:
» Expressing net public costs in 2014-15 prices rather than in nominal terms, our central forecast suggests an increase of 75 per cent between 2013-14 and 2019-20 – from £736 million to £1.3 billion.
» Expressing net public costs as a proportion of forecasted GDP, our central forecast suggests an increase of 52 per cent between 2013-14 and 2019-20 – from 0.04 per cent to 0.06 per cent.
Given our expectations for growth in the minimum wage and living wage, the increase over time in the cost of a living wage for care workers is substantial. But to be clear, the argument here is not that to raise pay to the living wage sooner would be cheaper overall. These future cost implica-tions remain regardless of the exact timing of the required pay increases, and any commitment to the living wage on an ongoing basis will have to consider these implications.
Finally, given the range of assumptions and projections involved, it’s important to highlight that there is a considerable degree of uncertainty around our central forecast. For example, smaller increases in the minimum wage (such as in line with median earnings forecasts) or further flattening of the care worker pay distribution around the minimum wage (for example reflecting funding not keeping pace with minimum wage increases), would imply higher costs than in our central forecast. On balance we judge that our central forecast is realistic, reflecting a probable scenario for the growth of minimum and living wages, holding other factors constant.
As a demonstration of potential variability around this forecast however, Figure 3 shows forecast net public costs alongside alternative scenarios in which some combination of the factors described above drives costs higher. These alternative scenarios include lower minimum wage uprating, further concentration of wages around the NMW, and upper and lower bound workforce projections. The range of projections shown in Figure 3 gives a real-terms increase in net public costs of anywhere between 61 per cent and 165 per cent by 2019-20.
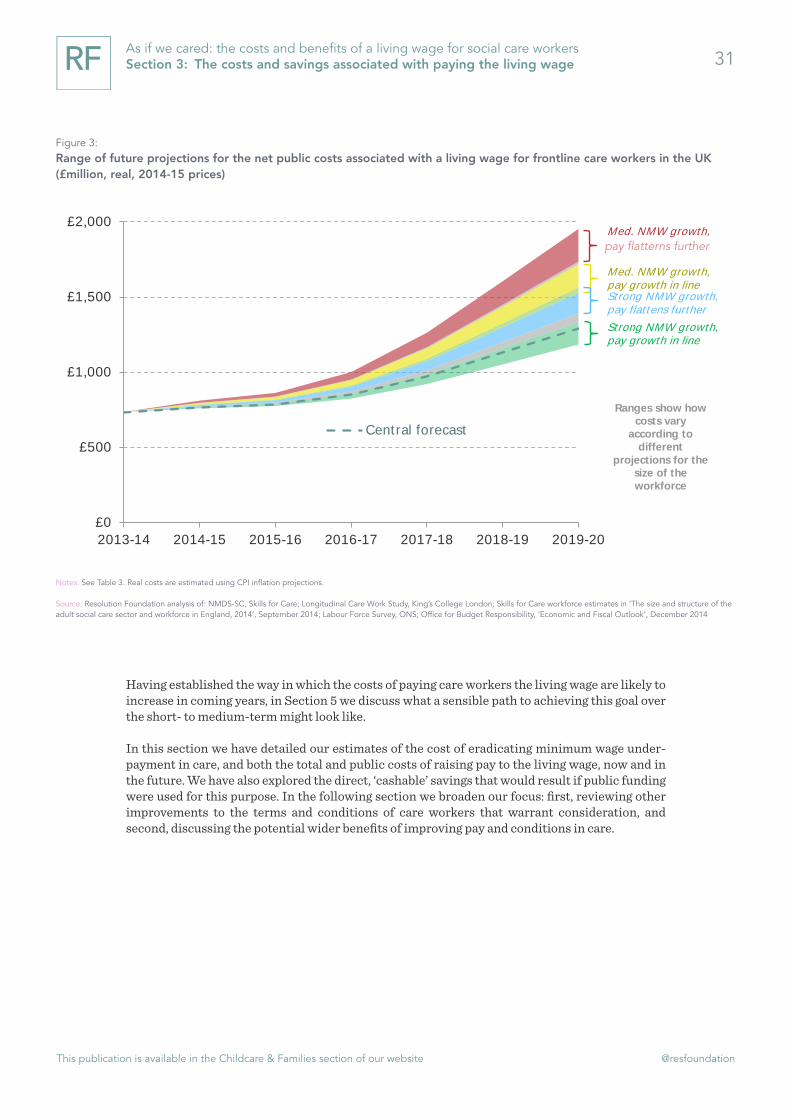
This publication is available in the Childcare & Families section of our website @resfoundation
31As if we cared: the costs and benefits of a living wage for social care workers Section 3: The costs and savings associated with paying the living wage
Having established the way in which the costs of paying care workers the living wage are likely to increase in coming years, in Section 5 we discuss what a sensible path to achieving this goal over the short- to medium-term might look like.
In this section we have detailed our estimates of the cost of eradicating minimum wage under-payment in care, and both the total and public costs of raising pay to the living wage, now and in the future. We have also explored the direct, ‘cashable’ savings that would result if public funding were used for this purpose. In the following section we broaden our focus: first, reviewing other improvements to the terms and conditions of care workers that warrant consideration, and second, discussing the potential wider benefits of improving pay and conditions in care.
Figure 3: Range of future projections for the net public costs associated with a living wage for frontline care workers in the UK (£million, real, 2014-15 prices)
This is the line that explains the chart below
Notes: See Table 3. Real costs are estimated using CPI inflation projections.
Source: Resolution Foundation analysis of: NMDS-SC, Skills for Care; Longitudinal Care Work Study, King’s College London; Skills for Care workforce estimates in ‘The size and structure of the adult social care sector and workforce in England, 2014’, September 2014; Labour Force Survey, ONS; Office for Budget Responsibility, ‘Economic and Fiscal Outlook’, December 2014
£0
£500
£1,000
£1,500
£2,000
2013-14 2014-15 2015-16 2016-17 2017-18 2018-19 2019-20
Central forecast
Med. NMW growth,
Med. NMW growth, pay growth in line Strong NMW growth, pay flattens further
Strong NMW growth, pay growth in line
Ranges show how costs vary
according to different
projections for the size of the workforce
pay flatterns further

This publication is available in the Childcare & Families section of our website @resfoundation
32As if we cared: the costs and benefits of a living wage for social care workers Section 4: The bigger picture – Improving conditions, quality & associated benefits
Section 4
The bigger picture – Improving conditions, quality & associated benefits
The previous section focused on our central priority of raising pay levels as a route to a better deal for the frontline care workforce. It detailed the costs of raising pay to the living wage, as well as a relatively narrow assessment of the direct Exchequer savings that would result if public money were used to support such pay improvements. In this section we take a step back from the particular focus on pay increases and the most ‘cashable’ savings they might generate. In the first part we evaluate other improvements to working conditions that may be necessary or helpful alongside better pay, in order to fully recognise the social value of care as a profession. In the second part we return to our starting assertion – that as well as properly valuing the vital role that care workers play, better pay and conditions are a route to ensuring quality and sustainability. Therefore we move away from direct fiscal implications and evaluate the wider impact on the economy and on care providers of a better deal for care workers.
Care as a profession: broader improvements to workforce conditions
In Section 2 we highlighted concerns about conditions for care workers that went beyond pay levels. Here we discuss ways in which these conditions could be improved, building on the recom-mendations of recent enquiries into the care workforce and other analyses. We do this because there’s evidence that broader improvements geared towards stabilising and professionalising the workforce would complement better pay and maximise its impact.
These improvements don’t form part of our central costings because it’s often less clear what the cost implications are. In addition, in some cases the issue seems to be less about funding per se and more about other features of the sector such as local authority commissioning practices. That said, we point to the cost implications of improvements where we can, with a view that local and national government and care providers will need to work together to secure progress on these, alongside pay.
We look at three areas for improvement:
» Insecure contracts;
» Employee terms and benefits; and,
» Training and progression.[50]
[50] Another improvement would relate to reducing fragmentation of work especially in relation to eradicating very short visits
in domiciliary care. As we highlighted in Section 2, depending on the main purpose of such visits, short visits can put pressure on
care workers and constrain their ability to do their job adequately and compassionately. We don’t rehearse these arguments here
because, although short visits affect workers and are associated with workforce issues such as minimum wage non-compliance and
zero-hours contract usage, they relate to commissioner-provider relationships rather than the relationships between employers
and their staff. Changing practices around short visits is therefore largely a procurement issue. In addition, improvements we do
focus on, such as ensuring workers are paid for all working time, can mitigate some of the negative impacts of short visits. For a
fuller description of the implications of short visits, see: Leonard Cheshire Disability, ‘Ending 15-minute care’, October 2013

This publication is available in the Childcare & Families section of our website @resfoundation
33As if we cared: the costs and benefits of a living wage for social care workers Section 4: The bigger picture – Improving conditions, quality & associated benefits
Insecure contracts
Insecure contracts, in particular zero-hours contracts, are prevalent among care workers, particularly in domiciliary care.[51] A key driver of this is the widespread use of frameworks and spot-purchasing in local authority commissioning, creating risks for providers which they then share with staff (see Annex 1 for details of commissioning practices).
Reviews of zero-hours contracts in general, and their use in the care sector in particular, have highlighted that while the flexibility they offer suits some workers, too often they are a burden that offers little security of work or income.[52] They may also make capturing total working time more complex in terms of minimum wage compliance. Therefore both the Kingsmill review and the Burstow commission on the home care workforce have called for banning or at least greater challenge of their exploitative use.[53]
In a similar vein, our own review of zero-hours contracts across the economy offered recom-mendations for ways to strike a better balance between workers and employers. These included a right to a fixed-hours contract after a year of employment, a ban on exclusivity clauses, and the development of good practice guidance for employers (but we rejected as ill-conceived an outright ban as favoured by some). We also offered specific recommendations for largely publicly-funded sectors like care. These included more focus on outcomes rather than tasks in commissioning, and consideration of workforce terms and conditions when assessing the social value of public contracts (a theme we return to in Section 5).[54]
Developments such as these are likely to be beneficial alongside efforts to improve pay in care. As well as providing more protection for workers, it’s probable that they would improve staff retention and continuity in worker-recipient relationships – a key aspect of the quality of the care experience.
It’s likely that some of these developments towards a fairer balance in the use of zero-hours contracts would carry costs (although it’s difficult to estimate the scale of these), or require broader changes such as a new approach to commissioning. However others, for example a sector-specific good practice guide, may be easier to achieve and still make a difference.
Employee benefits and other terms
The low status of care work is reflected not just in pay itself, but also in other terms of the job and limited packages of employee benefits. Pension, sickness, holiday and parental leave policies often go no further than minimum or statutory requirements. In addition, many employers do not fully recompense expenses associated with work such as travel costs and uniforms.[55]
Addressing the non-pay-related aspects of the employer offer for workers would be a strong complement to pay increases. For example, there is evidence that providers with better packages
[51] B Franklin, ‘The Future Care Workforce’, International Longevity Centre, February 2014
[52] For a summary of the issues around zero-hours contracts, see: V Alakeson & C D’Arcy, ‘Zeroing In: Balancing protection and
flexibility in the reform of zero-hours contracts’, Resolution Foundation, March 2014
[53] D Kingsmill, ‘The Kingsmill Review: Taking Care: An independent report into working conditions in the Care Sector’, May
2014; I Koehler, ‘Key to Care: Report of the Burstow Commission on the future of the home care workforce’, LGiU, December
2014
[54] V Alakeson & C D’Arcy, ‘Zeroing In: Balancing protection and flexibility in the reform of zero-hours contracts’, Resolution
Foundation, March 2014
[55] J Rubery et al, ‘The Recruitment and Retention of a Care Workforce for Older People’, University of Manchester Business
School, February 2011

This publication is available in the Childcare & Families section of our website @resfoundation
34As if we cared: the costs and benefits of a living wage for social care workers Section 4: The bigger picture – Improving conditions, quality & associated benefits
of non-financial incentives in addition to basic pay are more successful at retaining staff.[56]
The cost implications of enhancing the employee benefits package are more evident than in the other areas for improvement discussed in this section. As an illustrative demonstration of these across the frontline workforce, we have evaluated the costs of improving the pension, sickness and parental leave offers to staff. This builds on the previous section of this report – in other words, it assumes a living wage for care workers has already been achieved. And it assumes that policies are improved from roughly the minimum or statutory requirement on employers, to a more competitive package that reflects what employers in better-paying sectors offer (see Annex 3 for details).
Table 7: Summary of indicative costs and benefits associated with a stronger employee benefits package for frontline care workers in the UK, 2013-14
33
The low status of care work is reflected not just in pay itself, but also in other terms of the job and limited packages of employee benefits. Pension, sickness, holiday and parental leave policies often go no further than minimum or statutory requirements. In addition, many employers do not fully recompense expenses associated with work such as travel costs and uniforms.64
Addressing the non-pay-related aspects of the employer offer for workers would be a strong complement to pay increases. For example, there is evidence that providers with better packages of non-financial incentives in addition to basic pay are more successful at retaining staff.65
The cost implications of enhancing the employee benefits package are more evident than in the other areas for improvement discussed in this section. As an illustrative demonstration of these across the frontline workforce, we have evaluated the costs of improving the pension, sickness and parental leave offers to staff. This builds on the previous section of this report – in other words, it assumes a living wage for care workers has already been achieved. And it assumes that policies are improved from roughly the minimum or statutory requirement on employers, to a more competitive package that reflects what employers in better-paying sectors offer (see Annex 3 for details).
Table 7: Summary of indicative costs and benefits associated with a stronger employee benefits package for frontline care workers in the UK, 2013-14
Notes: Baseline scenario assumes that jobs are paid at least the applicable living wage rate for all working hours. Gross public costs are estimated at 60.7 per cent of gross total costs. Tax and benefit savings are estimated using the RF microsimulation model and applied to public costs only. See Annex 3 for further details of the methods and assumptions used.
Source: Resolution Foundation analysis of: NMDS-SC, Skills for Care; Longitudinal Care Work Study, King’s College London; Skills for Care workforce estimates in ‘The size and structure of the adult social care sector and workforce in England, 2014’, September 2014; Labour Force Survey, ONS
Table 7 summarises the results. These are to some extent tentative given our limited knowledge of current packages across the frontline workforce. However, they provide a starting point for thinking about the scale of investment that might be needed, and the potential savings if public money were to support this.66 Through the narrow lens of ‘cashable’ public savings, the case for investment is weaker here than when thinking about the living wage (17 per cent of gross public costs are saved,
64 J Rubery et al, ‘The Recruitment and Retention of a Care Workforce for Older People’, University of Manchester Business School, February 2011 65 Skills for Care, ‘Why are some employers more successful than others in retaining their workforce?’, January 2013 66 The proportion of public costs saved in ‘cashable’ taxes and benefits is much more limited than when improving pay, because a large part of the cost covers increased pension contributions, which are not taxed. However, this money will be taxed when it is drawn down by workers in future, meaning that the long-term Exchequer gains from investing public money in the benefits package for care workers are likely to be greater than those presented here.
Notes: Baseline scenario assumes that jobs are paid at least the applicable living wage rate for all working hours. Gross public costs are estimated at 60.7 per cent of gross total costs. Tax and benefit savings are estimated using the RF microsimulation model and applied to public costs only. See An-nex 3 for further details of the methods and assumptions used.
Source: Resolution Foundation analysis of: NMDS-SC, Skills for Care; Longitudinal Care Work Study, King’s College London; Skills for Care workforce estimates in ‘The size and structure of the adult social care sector and workforce in England, 2014’, September 2014; Labour Force Survey, ONS
Table 7 summarises the results. These are to some extent tentative given our limited knowledge of current packages across the frontline workforce. However, they provide a starting point for thinking about the scale of investment that might be needed, and the potential savings if public money were to support this.[57] Through the narrow lens of ‘cashable’ public savings, the case for investment is weaker here than when thinking about the living wage (17 per cent of gross public costs are saved, compared to 47 per cent when raising pay to the living wage). However, the limited savings that do result (plus the longer-term public benefits of improving the retirement prospects of a large, low-paid workforce) mean that it may be worth considering at least some government support for enhancements to the care worker benefits package such as these.
Training and progression
The Cavendish review and other enquiries have made clear the gap that exists in terms of care worker training. Care workers require few or no qualifications to enter the sector, and, once in, the only specific requirement is basic induction standards which some never complete.[58] Beyond these, the training that does take place can be inconsistent and lacks a focus on the increasingly
[56] Skills for Care, ‘Why are some employers more successful than others in retaining their workforce?’, January 2013
[57] The proportion of public costs saved in ‘cashable’ taxes and benefits is much more limited than when improving pay,
because a large part of the cost covers increased pension contributions, which are not taxed. However, this money will be taxed
when it is drawn down by workers in future, meaning that the long-term Exchequer gains from investing public money in the
benefits package for care workers are likely to be greater than those presented here.
[58] The forthcoming introduction of the Care Certificate is likely to represent an improvement in induction standards, although
some have criticised it as not going far enough. See: D Kingsmill, ‘The Kingsmill Review: Taking Care: An independent report into
working conditions in the Care Sector’, May 2014; I Koehler, ‘Key to Care: Report of the Burstow Commission on the future of the
home care workforce’, LGiU, December 2014
This publication is available in the Childcare & Families section of our website @resfoundation
35As if we cared: the costs and benefits of a living wage for social care workers Section 4: The bigger picture – Improving conditions, quality & associated benefits
complex requirements of the job.[59]
A related challenge is the common conception of care as ‘just a job’ rather than a ‘career’. The sector offers few opportunities for care workers to progress from often-low starting wages to higher pay levels, or to specialise in certain aspects of the role.[60] The variable size of care providers and the lack of any wage hierarchy within increasingly ‘flat’ organisational structures combine in this respect.[61]
A wide body of research demonstrates the benefits of good training and progression structures to employers across the economy.[62] However, the incentives for care providers to invest more in training, or formally reward it in pay packets, do not seem to be sufficiently strong. Funding pressures and uncertainties within care markets have led to low-investment employer strategies, and high labour turnover means providers fear losing the benefit of any investments they do make before they have enough return.[63] In addition, a highly scheduled way of working means the potential for productivity gains from investing in training and progression may be limited. Becoming more qualified frequently does not spell any increase in pay or autonomy for care workers, and economy-wide studies have failed to make the link between training and pay advancement.[64] Therefore it is no surprise that workers feel little incentive to invest in their own skills either.
While the structure of the sector does not easily support training-induced career advancement, and the incentives for investment in training appear weak, there are likely to be material benefits of a better approach. Studies have made the link between good provider training and progression practices and staff retention – of benefit to employers, employees and those receiving care in terms of continuity of staff.[65] In line with this finding, the sector is unlikely to be able to fill the hundreds of thousands of roles it needs to in coming years without a more coherent workforce development offer. And the Cavendish review highlighted the link between investment in substantive training and the quality of the service delivered in the best-performing organisations.[66]
Perhaps most importantly, improvements to care worker training and progression opportu-nities would represent an important signal, alongside better pay, of the status of care work as a profession. The most recent report of the Low Pay Commission encapsulates this, arguing that:
“In social care in particular there is an issue not so much of productivity as of the value society attaches to providing care, and of a failure to reward the skills that are required. A policy objective of funding higher wages for the lowest-paid care roles might need to be accompanied by other measures, formally recognising the skills involved, and requiring carers to demonstrate possession of them, for such a policy objective to be attained.”[67]
[59] ‘The Cavendish Review: An Independent Review into Healthcare Assistants and Support Workers in the NHS and social care
settings’, July 2013
[60] Even within ‘flat’ organisational structures, specialist training may be beneficial if it allows workers’ skills to be more easily trans-
ferred from one workplace to another as well as across health and social care, thus creating further opportunities for development.
[61] S Carr, ‘Pay, conditions and care quality in residential, nursing and domiciliary services’, Joseph Rowntree Foundation, April 2014
[62] For a summary, see: R Garrett & M Campbell, ‘The Value of Skills: An Evidence Review’, UK Commission for Employment
and Skills, July 2010
[63] D Devins et al, ‘Improving progression in low-paid, low-skilled retail, catering and care jobs’, Joseph Rowntree Foundation, February 2014
[64] C D’Arcy & A Hurrell, ‘Escape Plan: Understanding who progresses from low pay and who gets stuck’, Resolution Founda-
tion, November 2014
[65] D Devins et al, ‘Improving progression in low-paid, low-skilled retail, catering and care jobs’, Joseph Rowntree Foundation, February 2014
[66] ‘The Cavendish Review: An Independent Review into Healthcare Assistants and Support Workers in the NHS and social care
settings’, July 2013
[67] Low Pay Commission, ‘National Minimum Wage: Low Pay Commission Report 2014’, March 2014
This publication is available in the Childcare & Families section of our website @resfoundation
36As if we cared: the costs and benefits of a living wage for social care workers Section 4: The bigger picture – Improving conditions, quality & associated benefits
Therefore considering how national government, local government and care providers can work together to improve training and progression within care appears an important accompaniment to our focus on pay. The answers are not simple. For example, simply ‘costing’ the creation of higher-paid jobs for workers to progress into within our modelling would be artificial, ignoring the reality of current workforce structures. And it is not clear what the respective roles for government, providers and workers should be in meeting the costs of enhanced training activities.
The solutions to the training and progression challenge in care go beyond the scope of this study, and we make no attempt to rehearse all the options and challenges here. Instead Box 4 provides a summary of others’ recommendations and ideas. While we do not offer firm conclusions on what the best package might look like and what it might cost, what we do think is clear is that any focus on raising pay within the sector provides an ideal opportunity for both government and providers to explore avenues such as these.
i Box 4: A summary of ideas for strengthening the training and progression offer to social care workers
In the short term, further reform of common induction standards into a framework that is more consistently applied and is meaningful to both employers and the public is a priority of recent enquiries into the sector. For, example, the Cavendish review called for a ‘Certificate of Fundamental Care’ as a requirement before care workers can work unsupervised.[1] The forthcoming introduction of the ‘Care Certificate’ is a response to this recommendation and is likely to drive progress on induction standards, although some have argued that this reform does not go far enough.[2]
Beyond induction standards, the Kingsmill review called for a renewed focus on the quality of the apprenticeship route into care, and recommended more sector-level control of the apprenticeship budget on the proviso that the number of high-quality apprenticeships is increased. It also recommended standardising the range of qualifications, and more evaluation of the quality of the training offer.[3]
Ensuring that employers meet the full costs of training and pay for training time may also be necessary to underpin broader improvements to the training offer. And while organisational hierarchies might preclude strong financial returns from the achievement of qualifications, studies have emphasised the benefits of even small pay increases as an incentive for workers to learn.[4] The Extended Care Career Ladder Initiative in the USA, for example,
[1] ‘The Cavendish Review: An Independent Review into Healthcare As-
sistants and Support Workers in the NHS and social care settings’, July 2013
[2] I Koehler, ‘Key to Care: Report of the Burstow Commission on the
future of the home care workforce’, LGiU, December 2014
[3] D Kingsmill, ‘The Kingsmill Review: Taking Care: An independent
report into working conditions in the Care Sector’, May 2014
[4] S Carr, ‘Pay, conditions and care quality in residential, nursing and
domiciliary services’, Joseph Rowntree Foundation, April 2014
demonstrates how modest increments linked to training can establish ‘cultures of learning’ within organisations and improve care outcomes.[5]
With regards longer-term improvements, a key focus has been a licence to practise for care workers, linked to training and qualifications, with independent adjudi-cation and a register.[6] It is argued that licensing would be an important step to recognising the professional status of care workers, and the experience of the security sector suggests licensing can drive up starting wages and underpin pay progression via continuous professional development.[7]
Going with the grain of integration and recognising the limited opportunities to progress in the care sector itself, the Cavendish review called for a robust ‘Career Development Framework’ linking occupations in health and care.[8] And given the apparent disincentives for employers to invest, it may be worth exploring the role for ‘learning accounts’ via which the government match-funds individuals’ investments in their own training and career development.[9]
[5] M Washko et al, ‘Extended Care Career Ladder Initiative (ECCLI) Quali-
tative Evaluation Project’, Commonwealth Corporation, June 2007
[6] For, example, see: D Kingsmill, ‘The Kingsmill Review: Taking Care: An
independent report into working conditions in the Care Sector’, May 2014;
I Koehler, ‘Key to Care: Report of the Burstow Commission on the future of
the home care workforce’, LGiU, December 2014
[7] Low Pay Commission, ‘National Minimum Wage: Low Pay Commission
Report 2014’, March 2014
[8] ‘The Cavendish Review: An Independent Review into Healthcare As-
sistants and Support Workers in the NHS and social care settings’, July 2013
[9] For a description of how learning accounts might operate, see: A Wolf,
‘An Adult Approach to Further Education’, Institute for Economic Affairs,
2009

This publication is available in the Childcare & Families section of our website @resfoundation
37As if we cared: the costs and benefits of a living wage for social care workers Section 4: The bigger picture – Improving conditions, quality & associated benefits
The reference in Box 4 to the necessity of establishing ‘cultures’ that are supportive of progression brings us to a final observation. As well as pay, and as well as employment terms and career development opportunities, there are less tangible ways in which the conditions of care work might need to improve. Evidence suggests that pay and conditions are a useful but not sufficient mechanism to provide job satisfaction for care workers.[68] A culture of supporting staff to perform well, efforts to combat the effects of lone working and isolation, and the communication of organisational values that build on primary motivations towards caring are equally necessary to cementing the status of care as a profession.
Care and society: the wider benefits of better pay and conditions
Improving the quality of care
We now turn to the wider social and economic impacts that might result from a living wage (and associated improvements), beyond the immediate fiscal effects of higher wages discussed in Section 3. We discuss what these impacts mean for employers and the economy. First, however, it’s worth evaluating the evidence for the relationship between higher pay and improved conditions, and better outcomes for care recipients.
It is fair to say that, while the intuitive argument seems clear, in terms of hard evidence the case remains open on the relationship between pay, conditions and care quality. A recent review judged that the evidence for a direct causal link between increased pay and improved performance and quality was inconclusive. The experts consulted generally felt that pay was important, but wouldn’t automatically lead to better quality care. Improving working conditions and making staff feel valued were necessary preconditions.[69]
One of the reasons to doubt the ability of wage increases in and of themselves to drive quality is the sector’s limited potential for productivity improvements, given minimal scope for technological advances and statutory requirements that confine delivery models. But while productivity effects as traditionally conceived may be limited, there are other ways in which pay could affect service quality.
Better financial rewards for workers, particularly if they are secured alongside training improve-ments, may lead to higher job satisfaction which in turn may improve attentiveness and facilitate high-quality, compassionate care. Higher pay may help to attract workers with more of a vocational commitment to caring. In addition, higher pay could improve staff retention and reduce absenteeism. Given the importance of relationships in care work and a growing focus on continuity of care, such outcomes would likely have implications for the quality of services.
Although some studies have failed to find a clear relationship between pay and retention or staff absence,[70] others find a measurable impact. An evaluation of the benefits of the London living wage (across sectors) captured reduced employer costs associated with staff turnover and absence.[71] A recent review of the care sector in particular concluded that low pay is recognised by employers as a contributory factor to labour turnover.[72] And analysis of rising turnover rates within care
[68] S Carr, ‘Pay, conditions and care quality in residential, nursing and domiciliary services’, Joseph Rowntree Foundation, April
2014
[69] S Carr, ‘Pay, conditions and care quality in residential, nursing and domiciliary services’, Joseph Rowntree Foundation, April
2014
[70] J Rubery et al, ‘The Recruitment and Retention of a Care Workforce for Older People’, University of Manchester Business
School, February 2011
[71] J Wills & B Linneker, ‘The costs and benefits of the London living wage’, Queen Mary, University of London, October 2012
[72] D Devins et al, ‘Improving progression in low-paid, low-skilled retail, catering and care jobs’, Joseph Rowntree Foundation,
February 2014

This publication is available in the Childcare & Families section of our website @resfoundation
38As if we cared: the costs and benefits of a living wage for social care workers Section 4: The bigger picture – Improving conditions, quality & associated benefits
providers has made tentative connections to falling pay and worsening terms.[73] Finally, our own analysis, shown in Figure 4, suggests a weak but noticeable and significant relationship between pay levels within organisations and their annual staff turnover rate.
We find that lower-paying providers are slightly more likely to experience very high levels of staff turnover. This relationship endures when we control for other factors such as whether the provider is in the public or private sector, service type and organisational size.
In addition, a review of retention in social care has suggested that non-financial enhancements to basic pay such as uplifts for antisocial hours and payment for travel time in domiciliary care can have an effect on staff turnover.[74] And other studies have linked good training and progression structures within organisations to better retention outcomes.[75] This suggests that securing such improvements alongside pay would be likely to maximise the knock-on effects on staff retention and absence.
[73] S Hussein, M Ismail & J Manthorpe, ‘Changes in turnover and vacancy rates of care workers in England from 2008 to 2010:
panel analysis of national workforce data’, Health and Social Care in the Community (forthcoming)
[74] Skills for Care, ‘Why are some employers more successful than others in retaining their workforce?’, January 2013
[75] D Devins et al, ‘Improving progression in low-paid, low-skilled retail, catering and care jobs’, Joseph Rowntree Foundation,
February 2014
Figure 4: Relationship between pay and staff turnover within care providers in England, 2013-14
This is the line that explains the chart below
Notes: Analysis conducted by linking job records in the NMDS-SC to provider data on turnover rates. Analysis limited to providers with more than 30 staff, because a very low number of staff leaving in a year within small providers can drive high turnover rates.
Source: Resolution Foundation analysis of: NMDS-SC, Skills for Care
R² = 0.0633
0%
10%
20%
30%
40%
50%
60%
70%
80%
£6 £7 £8 £9 £10 £11 £12 £13 £14
Annual st
aff
turn
over
wit
hin
pro
vid
er
Average hourly pay of frontline care workers within provider

This publication is available in the Childcare & Families section of our website @resfoundation
39As if we cared: the costs and benefits of a living wage for social care workers Section 4: The bigger picture – Improving conditions, quality & associated benefits
Finally, if the current relationship between pay and quality is not wholly proven, we would argue that it is likely to be more evident in future. The sector is already facing recruitment difficulties in many areas of the country.[76] As demand rises social care will increasingly need to compete for workers with other sectors in which pay growth is likely to gain pace following a prolonged wage squeeze. Put simply, if wages are held down in care relative to other sectors (and other conditions remain poor), then care quality may be affected by a lack of people with the appropriate skills and qualities willing to do the growing number of jobs in the sector at all.
Taking the available evidence together, our view is that there is the potential for a strong link between improving care worker pay and the quality of care, particularly in respect of recruitment, retention and absenteeism. However it is by no means a given. Securing quality improvements alongside pay increases, not least by targeting other improvements to care worker conditions discussed in the first part of this section, should be an essential focus of any policy objective around raising care worker pay.
Assessing the benefits to wider society
By far the most important result of a more sustainable care system in which a more stable workforce provides better-quality services, if this can be achieved, is a better experience and improved outcomes for care recipients. However on top of this, there are implications for care providers and the wider economy.
As well as the fiscal benefits of paying the living wage to a large, low-paid workforce, there is the potential for other economy-wide savings if better outcomes result. Two are worth highlighting:
» First, better-quality care may lead to savings in wider health and care budgets. Insufficient or inadequate care services can cause delays to hospital discharges and ‘bed blocking’, and research suggests that poor-quality social care services lead to increased emergency hospital admissions.[77] While very difficult to capture, the ‘ripple’ effects of a more sustainable care system in preventing acute outcomes – and keeping people in their homes and out of institu-tional settings for longer –may be substantial. Efforts towards further integration of health and social care services would complement these potential benefits.
» Second, a better-quality care system could ultimately relieve pressure on informal carers. Estimates suggest that the economic value of informal care outweighs spending on formal care services.[78] While many informal carers are already retired, others are prime-age adults at the peak of their earnings potential, who may take short or long periods of time out of the labour market to deal with patchy or inadequate formal care services. Research comparing the value of this informal care work to the value of what the individuals contribute when engaged in ‘market’ work demonstrates that considerable economic losses may result.[79]
Focusing specifically on care providers, the principal potential benefit would be savings associated with lower staff turnover, and less money spent dealing with staff absence. There may be further recruitment savings if higher pay makes the process of recruiting itself easier (as well as reducing the volume of recruitment activities). These savings may be substantial, for example, recruitment costs for each new staff member in care are reportedly as high as £3,500.[80] In addition, during roundtable discussions as part of our research, care providers have indicated that the costs of hiring workers from agencies at the last minute to cover periods of absence are up to four times as [76] I Koehler, ‘Key to Care: Report of the Burstow Commission on the future of the home care workforce’, LGiU, December
2014
[77] National Audit Office, ‘Adult social care in England: Overview’, March 2014
[78] National Audit Office, ‘Adult social care in England: Overview’, March 2014
[79] B Casey, ‘The Value and Costs of Informal care’, University of Warwick, January 2011
[80] D Kingsmill, ‘The Kingsmill Review: Taking Care: An independent report into working conditions in the Care Sector’, May
2014

This publication is available in the Childcare & Families section of our website @resfoundation
40As if we cared: the costs and benefits of a living wage for social care workers Section 4: The bigger picture – Improving conditions, quality & associated benefits
high as regular labour costs.
Furthermore, while the potential for wage-driven productivity gains is likely to be limited in care, as we have highlighted, there may still be some knock-on productivity effects for employers of a more secure, satisfied workforce. Any move towards less prescriptive commissioning practices and more of a focus on outcomes in procurement would broaden the scope for such impacts.
In the previous section we argued that care providers’ ability to fund pay and other improvements appears limited within current funding constraints, but here we’ve highlighted that they are likely to be in line for a share of the benefits. This has implications for any initiative to fund a living wage in care, in terms of what is expected of providers. We consider these in the following section, along with other practical and policy implications of our analysis.

This publication is available in the Childcare & Families section of our website @resfoundation
41As if we cared: the costs and benefits of a living wage for social care workers Section 5: Getting there – Practical steps to delivering a living wage in care
Section 5
Getting there – Practical steps to delivering a living wage in care
In previous sections of this report we have made the case for improving pay in care via ensuring minimum wage compliance and then raising pay to the living wage, alongside other improvements to workforce conditions. We have assessed the costs of paying the living wage both across the sector and for publicly-funded services. In the latter case we have quantified the direct fiscal savings that would result if public money were to support improvements, and we have also discussed the potential for wider-reaching social and economic effects. In this section, we turn to the practical and policy implications of a living wage in care. We do not make firm recommendations – rather we set out what a path to achieving this goal might look like and highlight other steps that warrant consid-eration alongside increased funds.
Establishing a level playing field: eradicating non-compliance with the minimum wage
We have argued that before any move to a living wage in care, ensuring that providers are at least paying at statutory minimum levels is an urgent priority. While care budgets are extremely tight, working patterns complex, and non-compliance often not deliberate or wilful, we have argued that employers are fully liable for any costs associated with a failure to pay the minimum wage. We would not accept financial pressures as an excuse for employers not to comply with legal require-ments in other sectors. Thus, we have concluded that this hole in labour costs should be filled by employers using existing funds. The policy priority is therefore to ensure that this happens as a precursor to broader improvements to pay.
In terms of achieving this priority, our previous report on underpayment of the minimum wage in domiciliary care in particular offered directions that are equally applicable to the sector as a whole.[81] A key focus will be a more effective enforcement system. A recent concentration of efforts in the care sector by HMRC and new powers to ‘name and shame’ non-compliant employers and charge higher fines are welcome,[82] but there is more that could be done given the likely scale of underpayment. Our previous report on underpayment of the minimum wage in domiciliary care suggested:
» Increased resources for HMRC’s compliance unit;
» More information and guidance specifically directed at ‘high risk’ sectors such as care;
» Less reliance on pro-active reporting, and more collaborative working (and potentially sharing of powers) with other organisations that are well-placed to identify breaches of the law, such as local authorities; and,
[81] M Pennycook, ‘Does it pay to care?: Under-payment of the National Minimum Wage in the social care sector’, Resolution
Foundation, August 2013
[82] For a summary of the outcomes of recent HMRC investigations in the care sector, see: HMRC, ‘National Minimum Wage
compliance in the social care sector’, November 2013

This publication is available in the Childcare & Families section of our website @resfoundation
42As if we cared: the costs and benefits of a living wage for social care workers Section 5: Getting there – Practical steps to delivering a living wage in care
» Higher penalties and a sanctions regime that acts as a more effective deterrent.
Alongside a more effective system of enforcement and redress, we have highlighted the role for local authorities to take more responsibility for illegal practices within their markets. This might include demonstrating that the fees they pay are sufficient for providers to meet various statutory obligations; requiring more transparency in markets and playing a more active oversight role; and potentially stipulating in contracts that travel and on-call time should be paid.
In this report our estimates of the current and future costs of raising pay in care to the living wage assume that the hole in labour costs due to minimum wage non-compliance has been filled. An immediate and ongoing policy focus on enforcement of the minimum wage in care is therefore essential to underpin the other practical and policy considerations in this section.
A roadmap to the living wage
While we view the cost of minimum wage non-compliance as one that care providers should bear fully, throughout this report we have made the case that it is unrealistic to expect them to meet the greater costs of paying the living wage within the current funding envelope and provision landscape.
We judge that there is likely to be insufficient headroom for providers to fund pay increases by reducing profits or introducing more efficient models, particularly given a highly prescribed approach to commissioning services. Nor is expecting wage increases to naturally fund themselves through higher prices realistic given the largely monopsonistic purchasing power of local authorities in care markets. And although they will likely feel some benefit from higher wages, the incentives for employers in care to increase pay to the living wage appear too weak at present. Many of the benefits of paying a living wage would be felt across the economy and the public finances.
By contrast, we hope that we have made evident the incentives for public money to be used to support a living wage in care. Direct Exchequer savings almost halve the gross costs of funding the living wage with public money, and the wider social and economic benefits not quantified in our calculations are likely to be substantial.
One approach to supporting a living wage in care via increased public funding would be for local authorities to redirect resources from other areas of spending into care funding. Finding the money would likely be tough in the current environment, though some local authorities are taking steps in this direction.[83]
Importantly, the huge majority of the ‘cashable’ savings we identify accrue to national government, meaning that local authorities would need to consider the gross public cost of supporting a living wage within their care markets, not the net cost. If national government were to redirect the tax and benefit savings resulting from a living wage in publicly-funded care services to local authorities, however, this would substantially reduce the burden of costs with no worsening of the national financial position.
Another approach to public support for a living wage for care workers would be for the overall UK funding settlement for care to increase, and for this money to flow down to constituent nations and local authorities. With estimated costs amounting to hundreds of millions and potentially billions of pounds in coming years, and further fiscal tightening expected in at least the short term, decisions to increase public spending for this purpose would of course be difficult.
We make no attempt in this report to identify where in the public finances the money might come from. There are competing demands for additional funding across the public finances and within the care sector itself. For example, many want to see care funding rise to widen access to publicly-funded services, independent of any progress on pay. Future governments will reach a [83] For example, Islington council is reported to have increased funding to providers to support a living wage. See: J Burgess,
‘Why Islington introduced the living wage for all homecare workers’, The Guardian, 29 January 2014
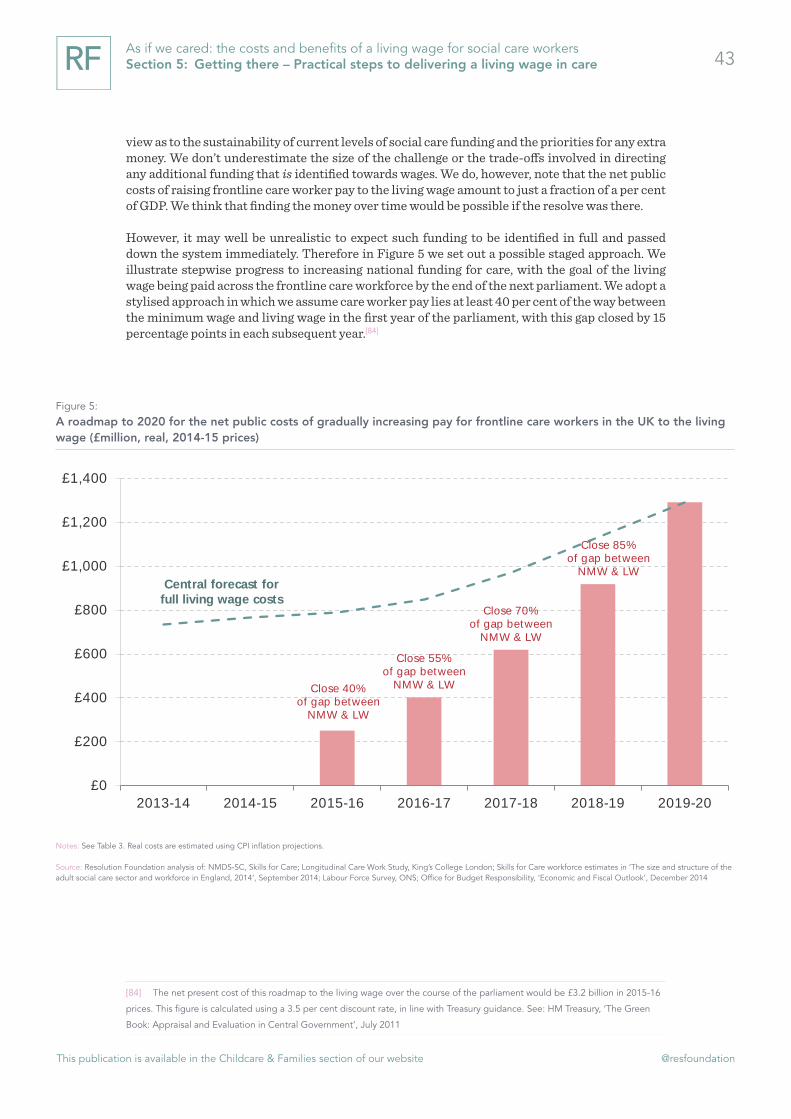
This publication is available in the Childcare & Families section of our website @resfoundation
43As if we cared: the costs and benefits of a living wage for social care workers Section 5: Getting there – Practical steps to delivering a living wage in care
view as to the sustainability of current levels of social care funding and the priorities for any extra money. We don’t underestimate the size of the challenge or the trade-offs involved in directing any additional funding that is identified towards wages. We do, however, note that the net public costs of raising frontline care worker pay to the living wage amount to just a fraction of a per cent of GDP. We think that finding the money over time would be possible if the resolve was there.
However, it may well be unrealistic to expect such funding to be identified in full and passed down the system immediately. Therefore in Figure 5 we set out a possible staged approach. We illustrate stepwise progress to increasing national funding for care, with the goal of the living wage being paid across the frontline care workforce by the end of the next parliament. We adopt a stylised approach in which we assume care worker pay lies at least 40 per cent of the way between the minimum wage and living wage in the first year of the parliament, with this gap closed by 15 percentage points in each subsequent year.[84]
[84] The net present cost of this roadmap to the living wage over the course of the parliament would be £3.2 billion in 2015-16
prices. This figure is calculated using a 3.5 per cent discount rate, in line with Treasury guidance. See: HM Treasury, ‘The Green
Book: Appraisal and Evaluation in Central Government’, July 2011
Figure 5: A roadmap to 2020 for the net public costs of gradually increasing pay for frontline care workers in the UK to the living wage (£million, real, 2014-15 prices)
This is the line that explains the chart below
Notes: See Table 3. Real costs are estimated using CPI inflation projections.
Source: Resolution Foundation analysis of: NMDS-SC, Skills for Care; Longitudinal Care Work Study, King’s College London; Skills for Care workforce estimates in ‘The size and structure of the adult social care sector and workforce in England, 2014’, September 2014; Labour Force Survey, ONS; Office for Budget Responsibility, ‘Economic and Fiscal Outlook’, December 2014
Close 40% of gap between
NMW & LW
Close 55% of gap between
NMW & LW
Close 70% of gap between
NMW & LW
Close 85% of gap between
NMW & LW Central forecast for
full living wage costs
£0
£200
£400
£600
£800
£1,000
£1,200
£1,400
2013-14 2014-15 2015-16 2016-17 2017-18 2018-19 2019-20

This publication is available in the Childcare & Families section of our website @resfoundation
44As if we cared: the costs and benefits of a living wage for social care workers Section 5: Getting there – Practical steps to delivering a living wage in care
Ensuring funding increases reach workers’ pockets
Of course, if either national funding were raised or local authority budgets redirected to support a living wage in care, it would be crucial to ensure that such funds are actually used for this purpose. The financial constraints both local authorities and care providers face increase the risk that additional money for pay might be diluted as it flows down the system if conditions are not attached. There are various ways in which to ensure that funding is used to raise wages to the living wage, but our view is that at least two courses of action are likely to be necessary:
» First, payment of the living wage for all working time (and the steps towards it if implemented via a staged approach) should be made a condition of contract, or at least a key criterion of contract assessment, in local authority procurement exercises.[85] The Social Value Act (2012) gives commissioners an impetus to consider the wider social impact of procurement decisions, and not just focus on value for money. Given the range of beneficial impacts of higher pay for care workers that we have outlined in this report, the living wage as a key contractual requirement sits well with the idea of social value in public procurement. As well as stipulating that the living wage is paid and covers all working hours, local authorities would likely need to play a greater oversight role in order to ensure that this is the case. Such a role would sit well within the increased responsibilities they will have for whole market stewardship from 2015-16 under the Care Act (2014).
» Second, local, national or UK governments would need to agree with employers a set of other outcomes alongside the living wage. Given that some of the benefits of higher pay in care are likely to be felt by providers, sector-level agreements could stipulate what else care providers would do as a ‘quid pro quo’ for increased public funding. Progress on improve-ments to working conditions and training discussed in the previous section could form part of such agreements. For example, the sector could commit to investing in career development frameworks, or implement standardised sickness and parental leave schemes. Stipulations such as these in sector-level agreements would be particularly important given our assertion that other improvements alongside increased pay would be likely to enhance and maximise its beneficial impacts.
There will be many other practical implications and challenges that we have not touched on here. However, it is hoped that these brief thoughts provide a starting point for thinking about the shape of policies to support a living wage in care.
[85] We acknowledge that there may be complexities with such stipulations in terms of current EU procurement law. More
proactive exploration of the boundaries and implications of procurement regulation, or approaches that fall short of mandation,
are likely to be necessary.

This publication is available in the Childcare & Families section of our website @resfoundation
45As if we cared: the costs and benefits of a living wage for social care workers Section 6: Conclusion
Section 6
Conclusion
We rely on care workers to be there for some of the most vulnerable members of society on a daily basis – to perform intimate, often demanding and increasingly complex tasks with compassion and respect. Yet we pay them very little to do so, and we expect them to put up with poor – sometimes illegal – working conditions alongside low pay. And it is ‘we’ who do this – the care sector is largely publicly funded and reductions in public expenditure, coupled with the rising needs of our ageing population, have exacerbated these problems in recent years. As a society we ascribe a low status to a workforce playing a vital role, and systematically undervalue the work that it does as a result.
A series of enquiries into the sector have made clear that while many workers find their jobs rewarding, these conditions may be hampering their ability to deliver high-quality care at all times. In addition, there are concerns about the ability of the sector to meet recruitment demand with such an unattractive offer to new starters. Put simply, the case for improving pay and conditions rests not only on social justice but also on the need to ensure the quality, availability and sustainability of social care provision.
Ensuring that care worker pay meets statutory minimums is an obvious place to start. We estimate that care providers are failing to pay the minimum wage at significant scale. There is no excuse for illegal pay levels even when funding in constrained, and ensuring employers fill this hole in the wages of care workers is an immediate priority.
Beyond this priority, there is growing consensus around the need for a living wage in care. However, up to this point we have had little idea of what it would take to achieve this. The main purpose of this report has therefore been to shed light in this area by estimating the extra costs of paying a living wage to frontline workers across the UK.
Given little headroom for increasing pay within the current funding envelope, we judge that public funding would likely need to rise for this purpose. The cost implications are significant, but we have shown that a sizable portion would be returned to the Exchequer in direct savings. Moreover, mounting evidence suggests that there can be a link between raising pay in care and improving the quality of services delivered, spelling wider social and economic benefits. It is very likely that improvements to other aspects of the job – including contractual terms, employee benefits and training and development opportunities – would maximise the beneficial impacts of raising pay to the living wage.
In times of austerity finding the money to support a living wage in care would not be an easy task, particularly as costs are set to increase rapidly in coming years. And there are other purposes for which many would like to see social care funding rise – directing money towards wages would represent a trade-off. While we make no attempt to identify where in the public finances the money might come from, we have set out some of the steps that might need to be taken alongside more funding if the intent was there. However, there will be many other practical considerations and challenges that we have not touched on here. We hope that by making the case and shedding light on the cost implications, this report provides an impetus for national government, local government and care providers to work together to consider whether and how a living wage for care workers can be achieved.
This publication is available in the Childcare & Families section of our website @resfoundation
46As if we cared: the costs and benefits of a living wage for social care workers Section 6: Annex 1: The UK’s adult social care sector
Annex 1: The UK’s adult social care sector
Social care refers to the provision of long-term or rehabilitative care to elderly or disabled adults who need help with essential activities including personal care and domestic tasks. Just under one-in-ten adults are limited ‘a lot’ in their day to day activities by illness, disability and old age.[86] The majority of care needs have always been and continue to be met informally by family and friends – estimates suggest 3.2 million adults in England receive informal care compared to 1.3 million using formal services.[87] Expenditure on formal services totals almost £30 billion each year in England alone – this is predominantly public spending in the form of local authority-commis-sioned care packages, although approximately one third is private spending by self-funders.[88]
Formal care services include those that take place in the community and in people’s own homes, as well as institutional care that takes place in residential and nursing homes. Social care is a devolved policy area that is both means-tested and needs-tested in England, Wales and Northern Ireland, and partially means-tested in Scotland. Much of the information we present about the sector relates to England only – as the largest jurisdiction with the most readily available data – however we refer to trends across the UK wherever possible.[89]
Concerns about the equity and sustainability of the means-tested funding system led to the 2011 Dilnot Commission on care funding, which recommended raising the level at which means-tested support is withdrawn and capping the lifetime care costs that people face.[90] These principles underpin the Care Act (2014) (although the lifetime care cap was set at a higher level than recommended), which placed new duties on English councils from 2015-16 in terms of meeting the costs of care, advocacy and stewardship of markets.
The provision of publicly-funded social care has evolved from the early 1990s, when local authorities were usually the exclusive care service provider, to the current system in which over three-quarters of care is commissioned from a range of providers in the private and voluntary sectors.[91] More than 17,000 organisations provide or arrange services in England, slightly more than half (55 per cent) of which provide non-residential services. In addition, more than 200,000 people receive direct payments from local authorities to organise their own care, which they use to purchase services from organisations or directly employ their own support staff.
[86] National Audit Office, ‘Adult social care in England: Overview’, March 2014
[87] T Burchardt, P Obolenskaya & P Vizard, ‘The Coalition’s Record on Adult Social Care: Policy, Spending and Outcomes 2010-
2015’, London School of Economics, January 2015
[88] Total expenditure was calculated for 2010-11 by Skills for Care, which combined information on public and co-funded
expenditure with other data to estimate the size of the self-funded market. More recent estimates from the Health & Social Care
Information Centre show publicly-funded expenditure was at similar levels to 2010-11 in 2013-14, suggesting the self-funded and
total market expenditure estimates are still valid. Sources: Skills for Care, ‘The economic value of the adult social care sector in
England’, February 2013; Health & Social Care Information Centre, ‘Personal Social Services: Expenditure and Unit Costs, England
– 2013-14, Final release’, December 2014
[89] See Annex 2 for details of the extrapolation from England to other nations of the UK in our cost calculations.
[90] ‘Fairer Care Funding: The Report of the Commission on Funding of Care and Support’, July 2011
[91] National Audit Office, ‘Adult social care in England: Overview’, March 2014

This publication is available in the Childcare & Families section of our website @resfoundation
47As if we cared: the costs and benefits of a living wage for social care workers Section 6: Annex 1: The UK’s adult social care sector
The trajectory that care markets have taken in recent years reflects a continuing move away from public-sector provision; strong growth in domiciliary services reflecting an emphasis on keeping people in their homes and out of residential settings for longer; and greater personalisation via direct payments and personal budgets.[92] These trends are likely to continue to shape social care markets in years to come.
Demographic trends are set to increase the need for long-term care services by as much as 60 per cent in the next two decades.[93] However, expenditure within these mixed markets has been falling in recent years, reflecting severe reductions in local authority budgets. The Coalition government’s intention in the 2010 spending review was to protect social care spending,[94] but it is not ring-fenced and has suffered as a result. Real expenditure in England fell by at least 7 per cent between 2009-10 and 2013-14, with smaller but still significant reductions in Scotland and Wales.[95] Around three-quarters of the fall in spending has been achieved by reducing the amount of care provided (for example by raising eligibility thresholds and shortening visits) – the remaining quarter by reducing the price local authorities pay.[96] In other words, part of the way local authorities have dealt with reduced funding has been by passing the squeeze on to care providers.
Care providers vary hugely in size, with local markets typically dominated by a handful of large organisations operating alongside a number of smaller ones. The recent National Audit Office overview of social care in England highlighted the challenges that providers in the market face, including the falling fees mentioned above, and moves away from ‘block’ contracts to framework agreements and spot-purchasing. These types of arrangement give providers less certainty of income and service patterns, and reportedly inhibit long-term planning and investment in staff. On the other hand, they have helped councils reduce inefficient spend on under-used contracts.[97]
In terms of achieving longer-term savings without (further) destabilising providers and the market, recent debates across the UK have centred on moving away from time-and-task commis-sioning and towards an outcomes-based approach. Proponents argue that services can be improved if providers and workers have greater flexibility regarding how and when they provide care, and that the current system does not incentivise them to rehabilitate or promote user independence which would potentially generate wider savings.[98]
The goal of savings across health and social care is also one of the drivers behind the longer-term strategy of fuller integration of these services. Recent initiatives, such as the pooling of NHS and social care budgets in the Better Care Fund, are a step in this direction in terms of joint working and a focus on common outcomes. However, according to the recent Barker Commission on the future of health and social care, for integration to be achieved it is essential that all health and care services are jointly commissioned. Alongside and underpinning joint commissioning, a significant increase in resources would be required to meet rising care needs in the older population.[99]
[92] Skills for Care, ‘The size and structure of the adult social care sector and workforce in England, 2014’, September 2014
[93] R Wittenberg et al, ‘Projections of Demand for and Costs of Social Care for Older People in England, 2010 to 2030, under
Current and Alternative Funding Systems’, Personal Social Services Research Unit, December 2011
[94] E Stone, ‘Spending Review and Social Care’, Joseph Rowntree Foundation blog, 22 October 2010
[95] T Burchardt, P Obolenskaya & P Vizard, ‘The Coalition’s Record on Adult Social Care: Policy, Spending and Outcomes 2010-
2015’, London School of Economics, January 2015
[96] National Audit Office, ‘Adult social care in England: Overview’, March 2014
[97] National Audit Office, ‘Adult social care in England: Overview’, March 2014
[98] L Lucas & J Carr-West, ‘Outcomes Matter: Effective Commissioning in Domiciliary Care’, LGiU, October 2012
[99] The King’s Fund, ‘A new settlement for health and social care: Final report’, September 2014

This publication is available in the Childcare & Families section of our website @resfoundation
48As if we cared: the costs and benefits of a living wage for social care workers Section 6: Annex 2: Data and scope for our analysis
Annex 2: Data and scope for our analysis
Pay in care: The National Minimum Dataset for Social Care
Our primary source on care job pay used in this analysis is the National Minimum Dataset for Social Care (NMDS-SC), which is recognised as the leading source of workforce intelligence for the adult social care sector in England.[100] Funded by the Department of Health, it is collected by Skills for Care from employers, and provides details on job roles, pay, hours, and worker character-istics. There is no sampling frame for the data, rather Skills for Care aims to collect information from all providers and offers incentives for completion. Therefore, as previous research has, we assume the sample is random for the most part. The only exception is that we find under-repre-sentation of domiciliary jobs in comparison to residential when comparing the data to published workforce estimates. For this reason, we split our sample into its service type components (domiciliary, residential, day and community), generate all estimates separately within these, and then sum them together.
NMDS-SC data has to be treated with some caution, for example, pay information is provided by employers but not backed up by PAYE records, and there is no indication of whether hourly pay rates reflect only basic pay or other elements as well. Due to the possibility of outliers and errors, we follow a multi-stage cleaning process agreed with Skills for Care. This leaves only up-to-date records and produces a sample of 270,000 jobs (160,000 of which involve hands-on provision of care) for which records were updated during the 2013-14 financial year. Table 8 summarises the job characteristics of the frontline care workforce within our sample.
Table 8: Median pay and hours in frontline care jobs in England according to the NMDS-SC, 2013-14
50
are jointly commissioned. Alongside and underpinning joint commissioning, a significant increase in resources would be required to meet rising care needs in the older population.117
Annex 2: Data and scope for our analysis
Pay in care: The National Minimum Dataset for Social Care
Our primary source on care job pay used in this analysis is the National Minimum Dataset for Social Care (NMDS-SC), which is recognised as the leading source of workforce intelligence for the adult social care sector in England.118 Funded by the Department of Health, it is collected by Skills for Care from employers, and provides details on job roles, pay, hours, and worker characteristics. There is no sampling frame for the data, rather Skills for Care aims to collect information from all providers and offers incentives for completion. Therefore, as previous research has, we assume the sample is random for the most part. The only exception is that we find under-representation of domiciliary jobs in comparison to residential when comparing the data to published workforce estimates. For this reason, we split our sample into its service type components (domiciliary, residential, day and community), generate all estimates separately within these, and then sum them together.
NMDS-SC data has to be treated with some caution, for example, pay information is provided by employers but not backed up by PAYE records, and there is no indication of whether hourly pay rates reflect only basic pay or other elements as well. Due to the possibility of outliers and errors, we follow a multi-stage cleaning process agreed with Skills for Care. This leaves only up-to-date records and produces a sample of 270,000 jobs (160,000 of which involve hands-on provision of care) for which records were updated during the 2013-14 financial year. Table 8 summarises the job characteristics of the frontline care workforce within our sample.
Table 8: Median pay and hours in frontline care jobs in England according to the NMDS-SC, 2013-14
Source: Resolution Foundation analysis of NMDS-SC, Skills for Care
The NMDS-SC is not without its problems, but is felt to be the most accurate source for analysing the pay and job characteristics of care workers. Its main advantage, in contrast to major ONS surveys such as the Labour Force Survey (LFS) and Annual Survey of Hours and Earnings (ASHE), is the vastly larger sample size it offers (hundreds of thousands of care jobs compared to a few hundred). In
117 The King’s Fund, ‘A new settlement for health and social care: Final report’, September 2014 118 S Hussein, ‘Estimating Probabilities and Numbers of Direct Care Workers Paid under the National Minimum Wage in the UK: A Bayesian Approach’, King’s College London, December 2011
Source: Resolution Foundation analysis of NMDS-SC, Skills for Care
The NMDS-SC is not without its problems, but is felt to be the most accurate source for analysing the pay and job characteristics of care workers. Its main advantage, in contrast to major ONS surveys such as the Labour Force Survey (LFS) and Annual Survey of Hours and Earnings (ASHE), is the vastly larger sample size it offers (hundreds of thousands of care jobs compared to a few hundred). In addition, standard ONS occupation and industry classification systems do not distinguish the social care sector wholly accurately. In particular, they have been shown to under-represent workers at the bottom of the pay distribution.[101]
[100] S Hussein, ‘Estimating Probabilities and Numbers of Direct Care Workers Paid under the National Minimum Wage in the
UK: A Bayesian Approach’, King’s College London, December 2011
[101] A Cangiano et al, ‘Migrant Care Workers in Ageing Societies: Research Findings in the United Kingdom’, University of
Oxford, June 2009

This publication is available in the Childcare & Families section of our website @resfoundation
49As if we cared: the costs and benefits of a living wage for social care workers Section 6: Annex 2: Data and scope for our analysis
One disadvantage of the NMDS-SC is that it only covers England. The little comparative research that exists on the structure of the workforce across UK nations does not suggest dramatic variation.[102] Therefore we assume that the sample is representative of all UK jobs, and gross our NMDS-SC estimates to UK totals. In addition, the NMDS-SC does not capture the pay and characteristics of jobs where personal assistants are directly employed by direct payment recipients (although it will include work where direct payment recipients purchase services from an agency). Very little data exists on this group – that which does suggests they may be higher paid on average than other domiciliary care jobs.[103] However in the absence of sufficient information, we assume the characteristics of personal assistant jobs also match those of our domiciliary care job sample at the aggregate level, and include them in the workforce totals that we gross to.
The size of the workforce: Skills for Care estimates and the Labour Force Survey
The NMDS-SC does not contain population weights, meaning we also require information on the total number of frontline jobs in care, now and in the future. Our primary source for this information is Skills for Care’s published estimates of the size of the workforce in England.[104] Skills for Care provides estimates disaggregated by main job role, service type, and other key characteristics, and also a range of projections for the future, reflecting different funding and provision scenarios. These estimates combine NMDS-SC data with a number of other sources and are the most accurate attempt to capture the sector’s workforce – particularly given that ONS industry and occupation classifications don’t capture the sector wholly accurately, as discussed above.
To expand the coverage of our analysis to the UK as a whole, we replicate previous research which used LFS estimates of the frontline care workforce in the different nations of the UK (as best captured by standard occupation codes[105]) to gross upwards Skills for Care’s estimates for England.[106] The adjustment factor is a 25 per cent increase in the size of the workforce when moving from England to UK totals. We apply the same adjustment factor to workforce projections when considering how the number of jobs will grow in the coming years. In other words, we assume that the relative size of the workforce across nations is held constant over time.
This approach gives an estimated 1.4 million frontline care jobs in the UK in 2013-14 – which include those that involve providing hands-on care for people across domiciliary, residential, day and community service types. The group includes ‘care workers’, ‘senior care workers’ and other care-providing roles including community support and outreach work. It includes an estimate of jobs in which the worker is employed directly by a direct payment recipient, and work purchased from care-providing agencies by direct payment recipients. A lack of data means we are not able to include people who are self-employed and delivering services for direct payment recipients or those directly employed by private self-funders.
Isolating frontline jobs captures the majority (76 per cent) of the social care workforce, and reflects our focus on care quality and the real value to society of a job that involves intimate tasks and close relationships with others. We exclude ‘other’ ancillary and administrative staff; managerial and supervisory jobs; and ‘professional’ social work roles. Such exclusion is justifiable [102] S Hussein, ‘Estimating Probabilities and Numbers of Direct Care Workers Paid under the National Minimum Wage in the
UK: A Bayesian Approach’, King’s College London, December 2011
[103] Comparative information on pay based on a very small number of personal assistants (less than 200) is available on Skills
for Care’s data dashboards. See: Skills for Care, ‘Open Access NMDS-SC Dashboards’, Data as at 23 February 2015
[104] Skills for Care, ‘The size and structure of the adult social care sector and workforce in England, 2014’, September 2014
[105] We use a definition similar to the Low Pay Commission’s, but also including ‘senior care workers’: SOC 2010 codes 6145,
6146 and 6147. See: Low Pay Commission, ‘National Minimum Wage: Low Pay Commission Report 2014’, March 2014
[106] A Cangiano et al, ‘Migrant Care Workers in Ageing Societies: Research Findings in the United Kingdom’, University of
Oxford, June 2009

This publication is available in the Childcare & Families section of our website @resfoundation
50As if we cared: the costs and benefits of a living wage for social care workers Section 6: Annex 2: Data and scope for our analysis
because in the main we think the challenges affecting these groups are different and can be viewed separately. Managerial and professional jobs pay significantly higher wages than frontline care jobs. And ‘other’ roles (including cooks, drivers, gardeners and administrative roles), although also relatively low paid, are more transferable across sectors and require different skills and working patterns.[107] Nonetheless it’s possible that improvements to frontline care worker pay would have knock-on effects on other jobs in the sector that our calculations don’t capture.
Other key sources: family characteristics and unpaid hours
The NMDS-SC provides most of the information we require on pay, job and worker character-istics. However, it does not contain information on the family and housing characteristics of care workers, which is needed to calculate the welfare savings that accrue from raising pay. This information is, however, available for care workers (as best captured by standard occupation codes) in the ONS’s LFS household data. Figure 6 summarises the family characteristics of care workers as represented in the LFS (we further disaggregate these by whether the household lives in the private rented sector or not, which is important for Housing Benefit eligibility, and by the number of children in the household).
In order to connect this information on family and housing characteristics with the NMDS-SC data on pay and job characteristics, we use a probabilistic matching process on the basis of the age, gender and contract hours of the worker. In other words, we estimate family and housing characteristics separately for each age-gender-hours cluster in the LFS data, and randomly assign the results proportionally within the same age-gender-hours clusters in the NMDS-SC data. One assumption we have to make in this process is that care workers are not part of the same family units. The LFS data suggests only a tiny proportion of families contain more than one care
[107] For a discussion of pay distributions across the main job roles in care, see: S Hussein, ‘Pay in Adult Social Care in Eng-
land’, King’s College London, May 2010
Figure 6: Family characteristics of frontline care workers in the UK, 2012-14
This is the line that explains the chart below
Notes: Data covers 2012-14 to ensure a robust sample (LFS household dataset are only available for the second and fourth quarter of each year); frontline care workers defined using SOC 2010 codes 6145, 6146 and 6147.
Source: Resolution Foundation analysis of Labour Force Survey household datasets, ONS
6%
10%
24%
11%
22%
19%
5%
3%
0% 10% 20% 30%
Male: single
Male: all other household types
Female: single
Female: single parent
Female: couple without children
Female: couple with children
Partner inwork
Partner notworking

This publication is available in the Childcare & Families section of our website @resfoundation
51As if we cared: the costs and benefits of a living wage for social care workers Section 6: Annex 2: Data and scope for our analysis
worker, so this appears acceptable.[108]
This approach is likely to produce a representative estimate of in-work benefit incidence in care workers’ households at the aggregate level.
Some required information on family and housing characteristics is not available even in the LFS household datasets. In these instances we use sensible national averages, for example median pay and hours estimates from ASHE for partners’ earnings.
Finally, previous research has highlighted that employer surveys such as the NMDS-SC have systematically failed to capture all working time.[109] Therefore we add to the NMDS-SC estimates of unpaid hours and unpaid travel time captured in a separate survey of workers: the Longitudinal Care Work Study (LoCS) undertaken by King’s College London.
We replicate the methodology for adding unpaid time, and recalculating hourly rates to include it, set out in previous work which estimated the prevalence of minimum wage underpayment across the frontline care workforce.[110] We use updated (but similar) unpaid time estimates disaggregated by employer type and service type. The only adjustment we make to the previous methodology is that we use a less conservative factor to adjust down the results of LoCS. We reduce LoCS estimates by 50 per cent, which is still felt to be conservative and likely to capture bias, over-estimation and any misunderstanding of what hours ought to be paid by workers responding to the survey. On average, we add 3 hours per week to those frontline care jobs that meet the criteria for adjustment (paid hourly rather than salaried).
This approach of including conservative unpaid time estimates allows us to come to a more comprehensive view of the scale of NMW non-compliance, and as far as possible ensure that our calculations for the cost of a living wage in care account for all working time.
[108] A slightly higher number of households contain more than one care worker, usually due to an adult child still living with their
parents and working in the same occupation as a parent. However, these adult children will be treated as separate family units for
the purposes of benefit entitlement, so this does not affect our analysis.
[109] J Rubery et al, ‘The Recruitment and Retention of a Care Workforce for Older People’, University of Manchester Business
School, February 2011
[110] S Hussein, ‘Estimating Probabilities and Numbers of Direct Care Workers Paid under the National Minimum Wage in the
UK: A Bayesian Approach’, King’s College London, December 2011

This publication is available in the Childcare & Families section of our website @resfoundation
52As if we cared: the costs and benefits of a living wage for social care workers Section 6: Annex 3: Modelling methodology
Annex 3: Modelling methodology
Our approach – Key stages and the assumptions used in our calculations
In Section 3 of this report we describe the methodological steps we take to calculate the cost of raising pay. Here we provide further detail on each stage – in particular any assumptions it has been necessary to make and the sources of these. By way of reminder, Table 1 in Section 3 summarises the five stages.
Stage 1: Estimate the average increase in wages per job
At this stage we raise pay levels to new minimums in cases where pay lies below them, and apply both the old (actual) and new (minimum / living wage) rates to working hours to evaluate the average pay change per job.
As well as the hours recorded in the NMDS-SC (and the unpaid time estimates we add), we apply hourly rates to estimates of holiday time and pay; time spent off sick and on maternity or paternity leave (and the pay for these periods); and time spent undertaking (paid) training. We include conservative estimates for each of these elements on the basis that they would not normally be considered ‘working’ hours and are therefore unlikely to be included in the hours recorded in the NMDS-SC. However, they are considered part of pay from the perspective of HMRC, and employer expenditure on these elements will increase as wages rise. We calculate each of these additional elements as follows:
» Holidays: 12.07 per cent of working hours paid at the usual hourly rate, based on statutory holiday entitlement.[111]
» Sickness: 2.2 per cent of working hours spent on Statutory Sick Pay for those eligible.[112]
» Maternity and paternity: 2.54 per cent of working hours spent on Statutory Maternity and Paternity Pay for those eligible.[113]
» Training: 1.73 per cent of working hours spent undertaking paid training.[114]
Overall, these estimates are judged to be relatively conservative, in most cases reflecting only employers’ minimum legal responsibilities. In reality some care providers will offer more generous holiday, sickness, maternity, paternity and training packages than those we have modelled, but conversations with industry and workforce representatives, as well as evidence from a particular
[111] As calculated by UKHCA based on statutory holiday entitlement policies. See: C Angel, ‘A Minimum Price for Homecare:
Version 2.1’, UKHCA, November 2014
[112] The proportion of time spent on sick leave is calculated based on estimates for the workforce as a whole in the recent
Black-Frost review of sickness absence. Statutory Sick Pay regulations are then modelled in the RF microsimulation model. See:
C Black & D Frost, ‘Health at work – an independent review of sickness absence’, Department for Work and Pensions, November
2011
[113] The proportion of time spent on maternity and paternity leave is based on the incidence of parental leave among direct
care workers in 2013-14 as measured in the Labour Force Survey, ONS. Maternity and Paternity Pay regulations are then modelled
in the RF microsimulation model.
[114] The proportion of time spent undertaking paid training is based on conservative assessments in the UKHCA’s minimum
price for home care model. See: C Angel, ‘A Minimum Price for Homecare: Version 2.1’, UKHCA, November 2014

This publication is available in the Childcare & Families section of our website @resfoundation
53As if we cared: the costs and benefits of a living wage for social care workers Section 6: Annex 3: Modelling methodology
care market,[115] suggest that a fairly minimal package is the norm.
On average, these additional elements of employer expenditure on wages make up 11 per cent of total costs.
Stage 2: Estimate the average total cost per job of raising pay
In Stage 2 we add the change in non-wage employer costs – employer National Insurance contri-butions and pension payments – which also rise as wages increase.
There is no robust source for the level of pension contributions that care providers make for their frontline workforce. Conversations with industry and workforce representatives, and evidence from a particular care market,[116] suggest they are minimal at least in the private sector (which accounts for around two-thirds of all jobs). On this basis, for jobs in the private sector we have modelled pension contributions consistent with employers’ minimum obligations once auto-enrolment is fully rolled out in 2018. This equates to an employer contribution of 3 per cent of the employee’s salary for jobs paid above the Personal Tax Allowance (nothing below).
Evidence suggests that pension contributions in public sector-provided care may be more in line with the economy-wide public sector average.[117] Therefore in this sector we have modelled a contribution of 13.5 per cent for all jobs based on national estimates.[118]
For jobs in the voluntary sector (which accounts for around one fifth of all jobs) we model a policy roughly in the middle of the private and public offers: a contribution of 8 per cent for all jobs.
On average, employer National Insurance contributions make up 9 per cent of total costs, and pension contributions 3 per cent.
Stage 3: Estimate the gross total cost of raising pay
At this stage we move from the per-job figures of Stages 1 and 2 to an aggregate total. We sum the averages produced in the first two stages to produce an overall cost per job and then multiply by the number of jobs. We undertake this process separately across the separate service types (domiciliary, residential, day and community) before combing to produce a sector-wide estimate.
Stage 4: Isolate the gross public cost of raising pay
In Stage 4 we calculate the proportion of costs attributable to publicly-funded services, based on an estimate of the proportion of services that are paid for with public money.
There is no universally-accepted figure for the proportion of services consumed, or costs borne, by self-funders and co-funders. A recent review of the evidence judged that 20 to 25 per cent of domiciliary service users are self-funders, while a quarter of publicly-funded users in domiciliary care buy additional services with their own money. This review estimated that 35 to 45 per cent of residential service users in England are self-funders, while an additional 10 to 15 per cent co-fund. Finally, the review cited the view of the Care Quality Commission that 36 per cent of funding across social care comes from self-funders, while an additional 10 per cent comes from
[115] J Wills, ‘On the front line of care: A research report to explore home care employment and service provision in Tower
Hamlets’, Queen Mary, University of London, April 2003
[116] J Wills, ‘On the front line of care: A research report to explore home care employment and service provision in Tower
Hamlets’, Queen Mary, University of London, April 2003
[117] K McGregor, ‘Higher pension contributions likely for social care workforce’, Community Care, 7 October 2010
[118] ONS, ‘2013 Annual Survey of Hours and Earnings: Summary of Pension Results’, March 2014

This publication is available in the Childcare & Families section of our website @resfoundation
54As if we cared: the costs and benefits of a living wage for social care workers Section 6: Annex 3: Modelling methodology
local authority-funded care with co-funded top-ups.[119]
An assessment of the economic value of the care sector by Skills for Care used percentages within the ranges above to estimate that, based on public funding, expenditure on self-funded services in England stood at £10.2 billion in 2010-11.[120] This included a 20 per cent self-funder premium, whereby self-funder fees are higher than the fees local authorities pay for the same resources. This assessment also detailed the proportion of public expenditure that was met by co-funded top-ups by care recipients.
The Skills for Care economic value assessment appears to be the most thorough and robust analysis of the relative size of public and private care expenditure. Importantly, it is based on the same workforce for which we calculate pay improvements (i.e. excluding self-employed care workers and personal assistants directly employed by self-funders). Therefore, we feel comfortable using it for our central estimate of the proportion of services paid for with public money.
To arrive at this estimate we divide public funding by the total of public, co- and self-funding. We make one adjustment – removing the self-funder premium from the self-funding figure. In other words, we attempt to capture the proportion of services consumed with public funds rather than the proportion of money spent. This means that we do not assume that the self-funder premium remains in place as we raise pay levels. As such, the burden of additional costs is shared across the public and private markets, rather than there being any cross-subsidy from private to public. Clearly, if a cross-subsidy did exist in practice then our findings would understate the cost impli-cations for self-funders of raising pay, but over-state the costs to the public purse.
This produces an estimate of 60.7 per cent of services paid for out of public budgets, as opposed to those that are self-funded or co-funded via payments to local authorities by care recipients.
Further assumptions are required to accurately estimate the public-private split in this way within different service types.[121] Therefore, in the main we opt to use the 60.7 per cent figure as an average across the sector and apply it to gross total costs (Stage 3). We are comfortable with this because although the public-private split is reportedly different in domiciliary and residential service types, the two workforces are relatively similar sizes. For obvious reasons, the only exception we make is when calculating public costs separately for domiciliary, residential and day and community service types. In this instance we use a figure of 73 per cent of services publicly-funded in domiciliary care, 51 per cent in residential settings, and 70 per cent in day and community services.[122]
It could be argued that our figure of 60.7 per cent might produce an underestimate of the public costs of raising pay, if publicly-funded services are provided by lower-paid workers due to funding constraints, for example. However, we have found no data to evidence this claim. Furthermore, research suggests that the majority of residential care homes provide services to both local authority-funded recipients and self-funders,[123] and anecdotal evidence suggests the domiciliary market is similar. Mixed income streams within most organisations make it less likely that pay will vary substantially by funding source.
[119] K Baxter & C Glendinning, ‘People who fund their own social care’, School for Social Care Research, 2014
[120] Skills for Care, ‘The economic value of the adult social care sector in England’, February 2013
[121] Because the Skills for Care economic value assessment does not provide information on the incidence of co-funded ser-
vices in different service types, and makes a number of assumptions about day and community services.
[122] These figures are calculated via the same approach as described for the whole sector. We assume that co-funding
accounts for the same share of public expenditure in each service type, and replicate the assumptions in the economic value as-
sessment regarding day and community services. We use our estimate of public costs across service types as a ‘control total’, to
ensure that the sum of our estimates for each service type individually matches the whole sector estimate.
[123] K Baxter & C Glendinning, ‘People who fund their own social care’, School for Social Care Research, 2014

This publication is available in the Childcare & Families section of our website @resfoundation
55As if we cared: the costs and benefits of a living wage for social care workers Section 6: Annex 3: Modelling methodology
Our estimate of the proportion of costs attributable to publicly-funded services has been reviewed by industry and academic experts and is perceived as a sensible figure in the absence of any better data on the service split. Despite being the best judgement we can come to it carries a degree of uncertainty, which is worth highlighting as it plays a central role in our calculations of the public costs of improving pay. More understanding of the split between publicly-funded and privately-funded services is a fruitful area for further analysis.
Stage 5: Estimate the average proportion of costs saved taxes and benefits
To estimate the average proportion of costs saved in taxes and benefits, we run our sample of frontline care jobs (with family and housing characteristics matched from LFS data, as described in Annex 2) through our in-house tax and benefit microsimulation model. We do this before and after raising pay. Our microsimulation model evaluates earnings, hours and family and housing characteristics against the tax and welfare system to calculate the household’s personal tax bill and entitlement to tax credits, Housing Benefit, Child Benefit and Council Tax Support. It assumes full benefit take up, which may overestimate savings somewhat. However, given that the majority of savings accrue in personal tax revenue, and our approach to identifying ‘cashable’ savings excludes other possible fiscal gains, we are comfortable with this assumption.
We then evaluate the average change in tax and benefit receipt. We express this as a proportion of the total cost of raising pay.
One limitation at this stage is that the NMDS-SC data is on a per-job rather than per-worker basis, and a small proportion of care workers do more than one care job (we estimate that there were 1.43 million frontline care jobs in the UK in 2013-14, filled by 1.35 million workers). Other care workers may have additional jobs in other sectors. However, personal taxes and in-work benefits are assessed at the worker or household level, not at the job level. Nonetheless, we assume a one-to-one relationship between workers and jobs in our analysis. This approach may result in an underestimate of increased tax revenue (as workers with multiple sources of earnings may be in higher tax bands than we assume). However, it may also result in an overestimate of benefit savings (as workers with higher incomes from multiple jobs may not be entitled to the in-work benefits we assume they are, meaning that savings when their wages rise would not be realised). Because these possible errors pull in opposite directions, the transition from jobs to workers appears justifiable.
In projecting costs forwards to 2019-20, we update the rules and rates of the tax and welfare system in our microsimulation model according to current policy projections. However we continue to evaluate tax and benefit receipt within a tax credit system, rather than switching to a Universal Credit system. We do this because of uncertainty about when Universal Credit will be fully implemented. Furthermore, the tax and benefit incidence on in-work households is unlikely to change substantially at the aggregate level following the transition to Universal Credit.
We only apply tax and benefit savings to public costs. This is because the wage increases relating to self- and co-funded services, on the assumption that they are funded via higher fees for this group, involve a transfer of money from one group of citizens to another. This means that the savings resulting from these wage increases will likely be offset by lower spending by self-funders in other areas of the economy, driving lower tax revenue.[124] However, while they do not feature in our central cost estimates, there are reasons to believe that there may still be fiscal gains from privately-funded wage increases. We discuss what these might be in Section 3 of this report.
At this stage we also calculate the average increase in net annual income per worker (i.e. after taxes have increased and benefits been withdrawn), to understand the net benefit to workers and [124] Strictly speaking, this is also true for public spending on higher wages in care, which would need to be offset by tax
increases or spending cuts elsewhere. However, it is common to look at spending implications in isolation from funding in public
accounting.

This publication is available in the Childcare & Families section of our website @resfoundation
56As if we cared: the costs and benefits of a living wage for social care workers Section 6: Annex 3: Modelling methodology
their families of higher pay levels.
Improving care worker pay and terms
Here we provide further details on how we have used this staged methodology to calculate the current and future costs of improving care worker pay discussed in Section 3 of this report, and the improvements to employee benefits discussed in Section 4.
Eradicating underpayment of the minimum wage
To estimate the cost of minimum wage non-compliance in social care we replicate the methods of previous analysis by Dr Shereen Hussein, which estimated the prevalence of underpayment across the frontline care workforce. This previous analysis is what guided our approach to adding unpaid hours to NMDS-SC data, and recalculating hourly rates to include this time, described in Annex 2.
Having adjusted NMDS-SC data for unpaid hours, Dr Hussein used a complex modelling process which also incorporated prior estimates of the prevalence of underpayment by the Low Pay Commission and the ONS.[125] This resulted in an estimated 9.2 to 12.9 per cent of frontline care jobs paying below the NMW. This reflects the current best estimate of the prevalence of non-compliance in social care due to prima facie low hourly rates and unpaid working time.
The complexity of the model means we are not able to replicate it in its entirety and reproduce estimates for the prevalence of non-compliance. Therefore, we have replicated the approach to adding unpaid hours to the NMDS-SC in order to estimate the average underpayment for those whose wages fall short of the NMW. We do this by comparing hourly rates (after adjusting for unpaid hours) to the NMW rates (including lower rates for young people and apprentices) that applied at the time NMDS-SC data was entered.
In terms of our staged calculation approach described above, this means that we estimate the average increase in wages when pay is raised to at least the NMW only for jobs that pay under the NMW in Stage 1 (after adjusting rates for unpaid hours). And then in Stage 3 we gross only to the total number of jobs estimated to pay below the NMW. To derive this number we take 11.05 per cent (the midpoint of the above range for the prevalence of non-compliance) and apply it to the number of frontline care jobs in the UK. This gives an estimate of 160,000 jobs paid below the NMW in 2013-14. This is at the lower end of Dr Hussein’s original range (155,000 – 220,000) due to improvements in Skills for Care’s methodology for estimating the number of jobs in the sector that have resulted in a lower total.[126] It does not reflect a shrinking workforce or any reduction in NMW non-compliance in recent years.
Raising pay to at least the living wage
In calculating the cost of raising pay to at least the living wage we assume that NMW non-compliance has been eradicated. This means that our baseline pay estimates are fixed to at least the NMW rates that applied at the time NMDS-SC data was entered. We compare these estimates to living wage rates specific to where the job is (within London or not) and the date
[125] The analysis used Bayesian modelling techniques that factored in previous estimates of NMW underpayment in social
care, such as those by the Low Pay Commission and ONS. These estimates were based on non-sector-specific datasets and did
not account for unpaid time, and therefore resulted in lower rates of non-compliance than the selected approach. This process
therefore produced a view on the prevalence of underpayment that accounted for all prior knowledge to date.
[126] For details see: Skills for Care, ‘The size and structure of the adult social care sector and workforce in England, 2014’,
September 2014

This publication is available in the Childcare & Families section of our website @resfoundation
57As if we cared: the costs and benefits of a living wage for social care workers Section 6: Annex 3: Modelling methodology
NMDS-SC data was entered. We exclude apprentices and volunteers from our costings.
In addition to raising pay to at least the relevant living wage, we apply modest ‘spillover’ effects, following the approach of academic research into the spillovers arising from higher wage floors.[127] This accounts for the fact that pay in some jobs, particularly those already close to living wage rates, is likely to ‘bump up’ when a cohort of lower-paid jobs are raised to that level.[128] This increases the total cost of paying the living wage by approximately 3 per cent in our estimates.
Our approach to calculating ‘spillover’ effects is relatively modest in terms of the impacts on the frontline care workforce. In addition, we make no attempt to estimate spillover effects on other parts of the care workforce (principally ‘other’ ancillary and administrative roles – pay in managerial and professional jobs is already well above living wage rates, meaning that they are unlikely to be affected). Nor do we estimate any spillover effects on other sectors of the economy.
Paying the living wage over the course of the next parliament
We project the cost of paying frontline care workers the living wage in future years using our staged approach described above, casting forward earnings, minimum wage rates, living wage rates, tax and benefit rules, workforce totals, and other inputs. We take this ‘bottom up’ approach to projecting future costs because simply uprating our estimate of 2013-14 costs (for example, in line with earnings or inflation projections and the future size of the workforce) would fail to capture the impact of an expected fast-growing NMW and a widening gap between the NMW and living wage rates. For example, uprating 2013-14 costs by Office for Budget Responsibility (OBR) earnings projections plus projected workforce growth suggests a nominal increase in costs of 45 per cent between 2013-14 and 2019-20. By contrast, the lower bound of our ‘bottom up’ approach implies a nominal increase of 78 per cent.
We use Skills for Care’s projections for the future size of the workforce in England, which we extrapolate to the UK as a whole, as described in Annex 2.[129] Skills for Care provides a ‘base case’ projection in which the current relationship between funding and provision and current service patterns hold constant. Skills for Care also produces projections for alternative funding and provision scenarios. We use the base case for our central forecast, but we also evaluate the alternative scenarios to provide upper and lower bounds on our central case.[130]
The projections apply to the social care workforce as a whole, therefore we assume that the current ratio of frontline care jobs to total jobs, and the distribution of the frontline workforce across service types, both hold constant in future years in all of the scenarios. Many predict faster growth in domiciliary services than in residential services in coming years, as has been the trend of late. However, unfortunately the projections do not provide sufficient detail for us to reflect this in our modelling. Because the public costs of raising pay are similar across the two main service types (reflecting lower pay in residential services but a greater incidence of publicly-funded
[127] R Dickens & A Manning, ‘Spikes and Spill-overs: The Impact of the National Minimum Wage on the Wage Distribution in a
Low-Wage Sector’, The Economic Journal 114:494, March 2004
[128] The formula we use assumes that the ‘spillover’ is highest for jobs just at the new minimum – it declines as the initial wage
increases above this and asymptotes to zero for wages high enough above. Jobs just below the new minimum also get a spillover
effect. This again declines with distance from the new minimum. The maximum size of the spillover effect is equal to a quarter of
the percentage difference between the old and new wage floors.
[129] Skills for Care, ‘The size and structure of the adult social care sector and workforce in England, 2014’, September 2014
[130] Given that the alternative scenarios reflect different funding and provision landscapes, it is possible that they might inter-
act with policy decisions driving our different earnings and NMW scenarios, described below. However, understanding the nature
of such interactions is beyond the scope of this research, therefore we treat workforce scenarios and pay scenarios as independent
of one another.

This publication is available in the Childcare & Families section of our website @resfoundation
58As if we cared: the costs and benefits of a living wage for social care workers Section 6: Annex 3: Modelling methodology
services in domiciliary), we are comfortable with these assumptions.
We project living wage rates based on future increases implied by the UK living wage methodology. Specifically, the current gap between the ‘applied’ and ‘reference’ living wage – and the cap on single-year increases in the ‘applied’ living wage towards the ‘reference’ level – means the UK living wage is very likely to increase by average earnings growth plus 2 percentage points each year for the medium term.[131] We therefore apply this rate of increase using OBR earnings projections (implying a national rate of over £10 per hour by 2019-20), and assume the London rate follows the same path. In all instances, this means that living wage growth outpaces NMW growth, meaning the gap between the lowest paid and our ‘target’ of the living wage grows over time.
The implication is that funding a living wage in care with public money gets more expensive over time. This will not be the case for ever. If the living wage methodology remains as it is then at some point the ‘applied’ and ‘reference’ rates will converge. However, we judge that the gap between the two is unlikely to close over the course of the next parliament.
In deriving, public costs (Stage 3) we hold constant the proportion of services that are publicly funded, at 60.7 per cent. Some argue that a continuation of the constrained funding environment in the face of rising demand for care might increase the share of costs borne privately. On the other hand, the Care Act (2014) is set to increase public liability for care costs from 2015-16. Given these competing pressures and the uncertainty around the share of care services funded publicly in the first place, holding this proportion constant seems sensible.
Our central forecast is based on certain assumptions about care job pay and the national minimum wage, but we also evaluate alternative scenarios in which each takes a different path (see Figure 3 in Section 3). Each of these scenarios is calculated as follows:
» Central forecast: Strong NMW growth, sector pay growth in line: the NMW increases steadily to around £8 by 2019-20, which is both the target wage established by Labour at its party conference, and the current projection for the end of the next parliament published by HM Treasury.[132] Care job pay is uprated in line with the NMW, meaning that the distribution of pay around statutory minimums remains as it was in 2013-14.
» Strong NMW growth, sector pay flattens further: the NMW increases as above. Care job pay is uprated at a slower rate (our projection for median earnings, which is based on OBR mean earnings projections[133]). Because our living wage costings are predicated on all jobs being paid at least the NMW, this implies further flattening of the pay distribution around the NMW and therefore a greater cost of achieving the living wage.
» Median NMW growth, sector pay growth in line: The NMW increases in line with median earnings projections, and care job pay is uprated at the same rate. This means the distribution of pay around the NMW remains as it was in 2013-14 (as in our central forecast), but slower NMW growth in comparison to our central forecast implies a bigger gap between that and the living wage.
» Median NMW growth, sector pay flattens further: The NMW increases in line with median earnings. Care job pay is uprated at a slower rate still (OBR projections for CPI inflation). This implies a bigger gap between the minimum and living wage than in our central forecast, as well as further flattening of the pay distribution around the NMW (for example,
[131] For more information on the methodology for calculating the UK living wage, see: D Hirsch, ‘Uprating the out of London
Living Wage in 2014’, Loughborough University, November 2013
[132] C D’Arcy, ‘A £6.70 minimum wage – how ambitious a rise is it?’, Resolution Foundation blog, 24 February 2015
[133] For more information on this projection, see Figure 10 in: K Blacklock & M Whittaker, ‘Hangover Cure: Dealing with the
household debt overhang as interest rates rise,’ Resolution Foundation, July 2014
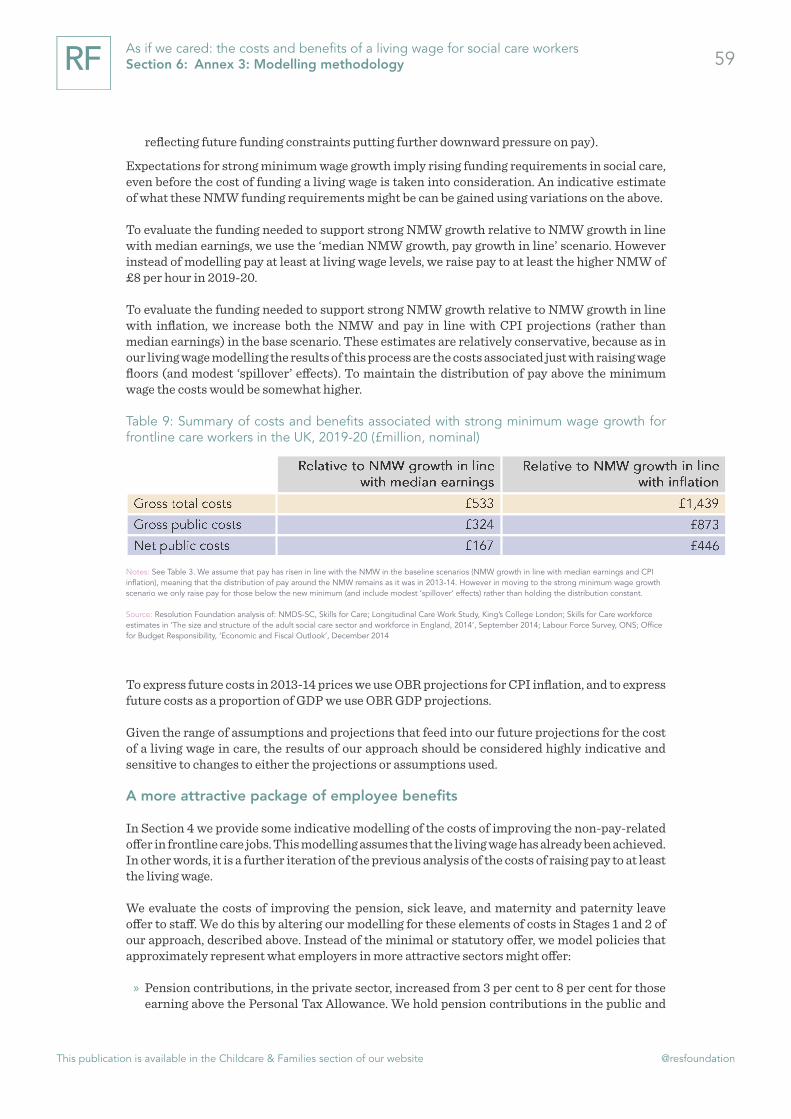
This publication is available in the Childcare & Families section of our website @resfoundation
59As if we cared: the costs and benefits of a living wage for social care workers Section 6: Annex 3: Modelling methodology
reflecting future funding constraints putting further downward pressure on pay).
Expectations for strong minimum wage growth imply rising funding requirements in social care, even before the cost of funding a living wage is taken into consideration. An indicative estimate of what these NMW funding requirements might be can be gained using variations on the above.
To evaluate the funding needed to support strong NMW growth relative to NMW growth in line with median earnings, we use the ‘median NMW growth, pay growth in line’ scenario. However instead of modelling pay at least at living wage levels, we raise pay to at least the higher NMW of £8 per hour in 2019-20.
To evaluate the funding needed to support strong NMW growth relative to NMW growth in line with inflation, we increase both the NMW and pay in line with CPI projections (rather than median earnings) in the base scenario. These estimates are relatively conservative, because as in our living wage modelling the results of this process are the costs associated just with raising wage floors (and modest ‘spillover’ effects). To maintain the distribution of pay above the minimum wage the costs would be somewhat higher.
Table 9: Summary of costs and benefits associated with strong minimum wage growth for frontline care workers in the UK, 2019-20 (£million, nominal)
62
Median NMW growth, sector pay flattens further: The NMW increases in line with median earnings. Care job pay is uprated at a slower rate still (OBR projections for CPI inflation). This implies a bigger gap between the minimum and living wage than in our central forecast, as well as further flattening of the pay distribution around the NMW (for example, reflecting future funding constraints putting further downward pressure on pay).
Expectations for strong minimum wage growth imply rising funding requirements in social care, even before the cost of funding a living wage is taken into consideration. An indicative estimate of what these NMW funding requirements might be can be gained using variations on the above.
To evaluate the funding needed to support strong NMW growth relative to NMW growth in line with median earnings, we use the ‘median NMW growth, pay growth in line’ scenario. However instead of modelling pay at least at living wage levels, we raise pay to at least the higher NMW of £8 per hour in 2019-20.
To evaluate the funding needed to support strong NMW growth relative to NMW growth in line with inflation, we increase both the NMW and pay in line with CPI projections (rather than median earnings) in the base scenario. These estimates are relatively conservative, because as in our living wage modelling the results of this process are the costs associated just with raising wage floors (and modest ‘spillover’ effects). To maintain the distribution of pay above the minimum wage the costs would be somewhat higher.
Table 9: Summary of costs and benefits associated with strong minimum wage growth for frontline care workers in the UK, 2019-20 (£million, nominal)
Notes: See Table 3. We assume that pay has risen in line with the NMW in the baseline scenarios (NMW growth in line with median earnings and CPI inflation), meaning that the distribution of pay around the NMW remains as it was in 2013-14. However in moving to the strong minimum wage growth scenario we only raise pay for those below the new minimum (and include modest ‘spillover’ effects) rather than holding the distribution constant.
Source: Resolution Foundation analysis of: NMDS-SC, Skills for Care; Longitudinal Care Work Study, King’s College London; Skills for Care workforce estimates in ‘The size and structure of the adult social care sector and workforce in England, 2014’, September 2014; Labour Force Survey, ONS; Office for Budget Responsibility, ‘Economic and Fiscal Outlook’, December 2014
To express future costs in 2013-14 prices we use OBR projections for CPI inflation, and to express future costs as a proportion of GDP we use OBR GDP projections.
Given the range of assumptions and projections that feed into our future projections for the cost of a living wage in care, the results of our approach should be considered highly indicative and sensitive to changes to either the projections or assumptions used.
A more attractive package of employee benefits
In Section 4 we provide some indicative modelling of the costs of improving the non-pay-related offer in frontline care jobs. This modelling assumes that the living wage has already been achieved.
Notes: See Table 3. We assume that pay has risen in line with the NMW in the baseline scenarios (NMW growth in line with median earnings and CPI inflation), meaning that the distribution of pay around the NMW remains as it was in 2013-14. However in moving to the strong minimum wage growth scenario we only raise pay for those below the new minimum (and include modest ‘spillover’ effects) rather than holding the distribution constant.
Source: Resolution Foundation analysis of: NMDS-SC, Skills for Care; Longitudinal Care Work Study, King’s College London; Skills for Care workforce estimates in ‘The size and structure of the adult social care sector and workforce in England, 2014’, September 2014; Labour Force Survey, ONS; Office for Budget Responsibility, ‘Economic and Fiscal Outlook’, December 2014
To express future costs in 2013-14 prices we use OBR projections for CPI inflation, and to express future costs as a proportion of GDP we use OBR GDP projections.
Given the range of assumptions and projections that feed into our future projections for the cost of a living wage in care, the results of our approach should be considered highly indicative and sensitive to changes to either the projections or assumptions used.
A more attractive package of employee benefits
In Section 4 we provide some indicative modelling of the costs of improving the non-pay-related offer in frontline care jobs. This modelling assumes that the living wage has already been achieved. In other words, it is a further iteration of the previous analysis of the costs of raising pay to at least the living wage.
We evaluate the costs of improving the pension, sick leave, and maternity and paternity leave offer to staff. We do this by altering our modelling for these elements of costs in Stages 1 and 2 of our approach, described above. Instead of the minimal or statutory offer, we model policies that approximately represent what employers in more attractive sectors might offer:
» Pension contributions, in the private sector, increased from 3 per cent to 8 per cent for those earning above the Personal Tax Allowance. We hold pension contributions in the public and

This publication is available in the Childcare & Families section of our website @resfoundation
60As if we cared: the costs and benefits of a living wage for social care workers Section 6: Annex 3: Modelling methodology
voluntary sectors constant.
» Paid time off sick for all staff, rather than just those above the statutory threshold, at full pay, rather than statutory levels.
» Paid maternity and paternity leave for all staff, rather than just those above statutory thresholds. And rather than statutory levels, staff on maternity leave are paid their full salary for 13 weeks, followed by half their salary for 13 weeks, followed by statutory rates for 13 weeks.

This publication is available in the Childcare & Families section of our website @resfoundation
61As if we cared: the costs and benefits of a living wage for social care workers Contents

resolutionfoundation.org [email protected] +44 (0)203 372 2960 @resfoundation
Resolution Foundation is an independent research and policy organisation. Our goal is to improve the lives of people with low to middle incomes by delivering change in areas where they are currently disadvantaged. We do this by:
» undertaking research and economic analysis to understand the challenges facing people on a low to middle income;
» developing practical and effective policy proposals; and » engaging with policy makers and stakeholders to influence
decision-making and bring about change.
For more information on this report, contact:
Laura Gardiner Senior Research and Policy [email protected] 020 3372 2954