asa template training - national institutes of health€¦ · ppt file · web view ·...
TRANSCRIPT

1
FY02 ASA Presentation
Ensure Integrity of NIH Facilities
Presented by: Mehryar Ebrahimi
Office of Research ServicesNational Institutes of Health
18 November 2002
2
Table of ContentsMain Presentation
ASA Template ……………………………….……………………………….4Customer Perspective……………………….……………………………….6
Customer Segmentation …………………….……………………………………8Customer Satisfaction……………………….…………………………………….10
Internal Business Process Perspective…………………………………….12Service Group Block Diagram…………………………………………………….13Conclusions from Discrete Services Deployment Flowcharts…………………14Process Measures………………………………………………………………….15
Learning and Growth Perspective…………………………………………...21Conclusions from Turnover, Sick Leave, Awards, EEO/ER/ADR Data……….23Analysis of Readiness Conclusions………………………………………………24
Financial Perspective………………………………………………………...25Unit Cost……………………………………………………………………………..26Asset Utilization……………………………………………………………………..28Conclusions and Recommendations……………………………………………..34Conclusions from FY02 ASA..…………………………………………………….35Recommendations………………………………………………………………….37

3
Table of Contents
AppendicesPage 2 of your ASA TemplateCustomer survey results and graphsProcess mapsLearning and Growth graphs

4
ASA Template - 2002
Customer Value Proposition
Team Leader
Ensure Integrity of NIH Facilities
DS5:
Discrete Services
Service Group
DS3:
Customer Intimacy Sustain
X Operational Excellence Growth
Service Strategy
Provide planning, design and construction management services within allotted budget and schedule to install reliable and maintainable building utility infrastructure that meets immediate needs of the building occupants and is flexible for adopting future growth, meeting codes, guidelines, and critical accreditation requirements. Also install a reliable and maintainable campus utility infrastructure that meets the short and long term utility needs of the campus.
DS1: Ensure Integrity of Campus Utility Infrastrucutre
DS2: Ensure Integrity of Campus Building Utility Infrastructure
DS6:
DS4:
Team Members
Jim Lewis - Team 3 DCAB/DES
Paul Hawver - Team 7 DCAB/DES
Product Leadership Harvest
Mehryar Ebrahimi
X

5
Discrete Services• We propose some slight changes in wording
of the Discrete Services as follows:
• Old DS1: Ensure campus infrastructure integrity• New DS1: Ensure Integrity of Campus Utility
Infrastructure
• Old DS2: Ensure building and building system integrity
• New DS2: Ensure Integrity of Buildings Utility Infrastructure

6
Customer Perspective

7
WHO IS THE CUSTOMER?• A key point to be made is that the team
concluded that our primary customer is PWB for both of these discrete services.
• Of course PWB’s primary customers are the IC’s who are the ultimate recipient of the utility services.

8
Customer Segmentation• DS1 Ensure Integrity of Campus Utility Infrastructure
• Our customers represent the majority of supervisors and managers and employees working within Central Utilities Section of PWB
Cusomers- Ensure Integrity of Campus Utility Infrastructure as a percentage of all PWB Employees
within Central Utilities Section
Customers Surveyed
(Supervisors)23%
Customers Not Surveyed
77%
Customers Surveyed(Supervisors)Customers Not Surveyed
Total Population= 64Total Customers= 15

9
Customer Segmentation• DS2 Ensure Integrity of Campus Building Utility Infrastructure
• Our customers represent a portion of supervisors, managers, and other employees within Building Maintenance Sections of PWB
Customers- Ensure Integrity of Campus Building Utility Infrastructure as a Percentage of all PWB
Employees within Building Maintenance Sections
Customers Surveyed
(Supervisors)5%
Customers Not Surveyed
95%
Customers Surveyed(Supervisors)Customers Not Surveyed
Total Population= 222Total Customers= 12

10
• We sent out 27 customer surveys to our customer target population, however we did not receive a very high response rate.
• At this time, due to low response, we cannot make any objective conclusions regarding our survey on DS-2 dealing with the Building Utilities Integrity.
• We have looked at the comments and the Scatter Diagram for Discrete Service 1: Ensure the Integrity of Campus Utility Infrastructure, and we will be focusing on those areas that rated high on “level of importance” and low on “satisfaction”.
• We plan to monitor customer satisfaction and participation rates throughout the year during FY03.
Customer Satisfaction

11
Scatter Diagram For DS-2Insure Campus Integrity
FY02 Customer Importance and Satisfaction Ratings: A Closer Look
Note: A smaller portion of the chart is shown so that the individual data points can be labeled.
4.00
4.50
5.00
5.50
6.00
6.50
7.00
7.50
8.00
8.50
9.00
9.50
10.00
4.00 4.50 5.00 5.50 6.00 6.50 7.00 7.50 8.00 8.50 9.00 9.50 10.00
Satisfaction
Impo
rtan
ce
SATISFIED,IMPORTANT
Cost
Convenience
Responsiveness
Availability
Handling of Problems
Competence
Quality
Timeliness
Reliability
Data based on 8 respondents
12
Internal Business Process Perspective

13
Service Group Block Diagram• Ensure Integrity of Campus Utilities Infrastructure and Ensure Integrity of Campus
Building Infrastructure consumes approximately 25% of the project officer’s time in DCAB. Our primary interface points are with “Perform Facilities Maintenance and Operations” and “Provide Facilities Management Services”
IC identifiesspace/
equipmentneeds
DCAB/PWBIdentify
infrastructureneeds
Secure funding Plan and design Constructinfrastructure
Hand off to PWB
Block Diagram: Ensure Integrity of FacilitiesDate: 11/05/02 Participants: ASA Team

14
• Our Service Group completed 2 deployment flowcharts for 2 discrete services
• Based on the deployment flow charts that we created and analyzed, we believe that we need to increase the involvement of our customers (PWB) and ensure that we receive, and utilize their comments during Planning, Design, Construction and Closeout.
Conclusions from Discrete Services Deployment Flowcharts
15
Process Measures• Process measures for each discrete service:
• DS1: Percent of Projects impacting Campus Utilities vs. the number submitted to PWB for review at different stages.
• DS1: Percent of Projects submitted for review to PWB vs. the number of reviews returned to DCAB and their timeliness
• DS2: Percent of Projects impacting Building Utilities vs. the number submitted to PWB for review at different stages.
• DS2: Percent of Projects submitted for review to PWB vs. the the number of reviews returned to DCAB and their timeliness
• DS-2: Building 10 utility infrastructure team (DCAB Team 7) has established process measures that includes tracking of activities performed by this team. It is important to note that this team takes the lead in coordinating projects with PWB and incorporating their comments specially during pre-design and design activities.

16
Service Group: Ensure Integrity of NIH FacilitiesDiscrete Service: DS2: Ensure integrity of campus building utility infrastructure Page 1 of 2Date: Revised 10/15/02 Participants: ASA Team
OF
P/O
CL
PWB
A/E
Con
trac
tors
Pro
cure
men
tD
CA
B T
eam
sIC Identif y need
Identif yinf rastructure
need
Plan BuildingInf rastructureImprov ement
Inf rastructureimprov ement
needed?
No f urther actionneeded
Review
Money inbudget?
Con
tinue
don
p. 2
Seek f unding f romCongress
No
Yesy es
no
Is improv ementf or Building
10?
Dev elopPlan f orBlg 10
y es
EstimateAssociated
Costs
Process Map for Ensuring Building Utility Integrity

17
Discrete Service: DS1: Ensure integrity of campus building utility infrastructure, (continued) Page 2 of 2Date: Revised 10/30/02 Participants: ASA Team
OF
P/O
CL
PWB
Con
trac
tors
Pro
cure
men
tD
CA
B T
eam
Conitnued
from p. 1
A/E ContractorPrepare Design
Packages &Transmit to PO
Prepare designcontracting
package
Award DesignContract
DesignApprov ed
Prepareconstruction
contractDocuments
Award contract
ConstructionContractorSubmittals
ConstructionApprov ed by
PO and IC
Yes Yes
No
Shut Down
y esNo
ConstructionComplete
Input from clinicalcenter Infrastructure
Team for Bldg 10Projects
DesignReview
PO Coordinatewith NIH Div isionsand prov ides all
aspects of projectmanagement
SubmittalsApprov ed
PO Transmitsdocument toappropriate
parties &CoordinateComments
No
Phy sicalConstruction
No
Process Map for Ensuring Building Utility Integrity Cont …
Note there is little to no involvement from PWB after completion of the design

18
Process Measures
Other than Building 10 utility infrastructure tracking which is done by Team 7 of DCAB, we did not implement any of these proposed unique process measures for FY02 however, we will be implementing the above measures for FY03 in cooperation with PWB.

19
Process MeasuresBuilding 10 Utilities Infrastructure Group (DCAB Team 7)
10 Year Project Action TrendDES/DCAB Infrastructure Team 7
0
20
40
60
80
100
120
140
160
92' 93' 94' 95' 96' 97' 98' 99' 00' 01' 02'Fiscal Year
Num
ber
of A
ctio
ns
Post Construction
Prescreen
Managerial
Design
Correct Existing
Construction

20
Process MeasuresBuilding 10 Utilities Infrastructure Group (DCAB Team 7)
Project Action Distribution
0
100
200
300
400
500
600
700
800
900
1000
Project Action Type
Num
ber o
f Act
ions
DCAB
OTHER
PWB

21
Learning and Growth Perspective

22
Summary of L & G Datafor Service Group 34
• Services provided by this service group is a part of a greater function performed by DCAB. Therefore, the L&G for the DCAB is presented here.
• 3% employee turnover• Over 1 award per employee• About 4 days of sick leave per employee• 0 EEO complaints, 2 ER and 5 ADR cases out of 111
employees

23
• Based on the feedback from the Learning and growth data provided, we found that our turnover rate, sick leave rate, and EEO/ER/ADR rates were below average when compared to other discrete services. We were a little above average on the number of awards received by our employees. Since this is the first year we have examined this data in this way, we will have better comparative data at the end of FY03.
• In general, data indicates DCAB is good place to work.
Conclusions from Turnover, Sick Leave, Awards, EEO/ER/ADR Data

24
• We feel that our staff is fully qualified to perform the work related to our discrete services now and into the foreseeable future. We do, however, need to monitor the early planning process and forecasts for new construction and alterations. A sudden increase in work load in these areas will have an immediate impact on our ability to spend sufficient time investigating condition of the existing utilities infrastructure and their future planning.
Analysis of Readiness Conclusions
25
Financial Perspective

26
• Unit cost for DS1: Ensure Integrity of Campus Utility Infrastructure
• Per square foot cost of providing this discrete service was calculated using the budget included in the rent model divided by the total gross square feet of the campus buildings.
Unit Cost Measures
Fiscal Year
Total Campus Gross SF
Total Budget Cost of DS-1/GSF
2001 9,405,937 $713,000 .076
2002 9,405,937 $ 743,000 .079

27
Unit Cost Measures Cont …
•Unit cost for DS2: Ensure Integrity of Building Utilities Infrastructure
•Per square foot cost of providing this discrete service was calculated using the budget included in the rent model divided by the total gross square feet of campus buildings.
Fiscal Year
Total Campus Gross SF
Total Budget Cost of DS-1/GSF
2001 9,405,937 $ 3,124,000 .33
2002 9,405,937 $ 3,200,000 .34

28
• There are two separate ORS accounts for Campus and Building Integrity services as follows:
• Campus Utility Infrastructure (HQF10017)• Building Utility Infrastructure (HQF10000)
• Asset utilization was evaluated using the time cards from DCAB and comparing it with the allotted budget for each Discrete Service.
Asset Utilization Measures

29
Utilization of PO's Time for "Ensure Integrity of Campus Utilities"
$-
$100,000
$200,000
$300,000
$400,000
$500,000
$600,000
$700,000
$800,000
Fiscal Year
Ann
ual A
mou
nts
$
ORS Budget $713,000 $743,000 Obligated $409,000 $743,000 Billing for PO's Time $266,000 $373,000
FY01 FY02
Budget increase of 4% in 02 vs. 01DCAB charges increased by 40% in 02 vs. 01
30
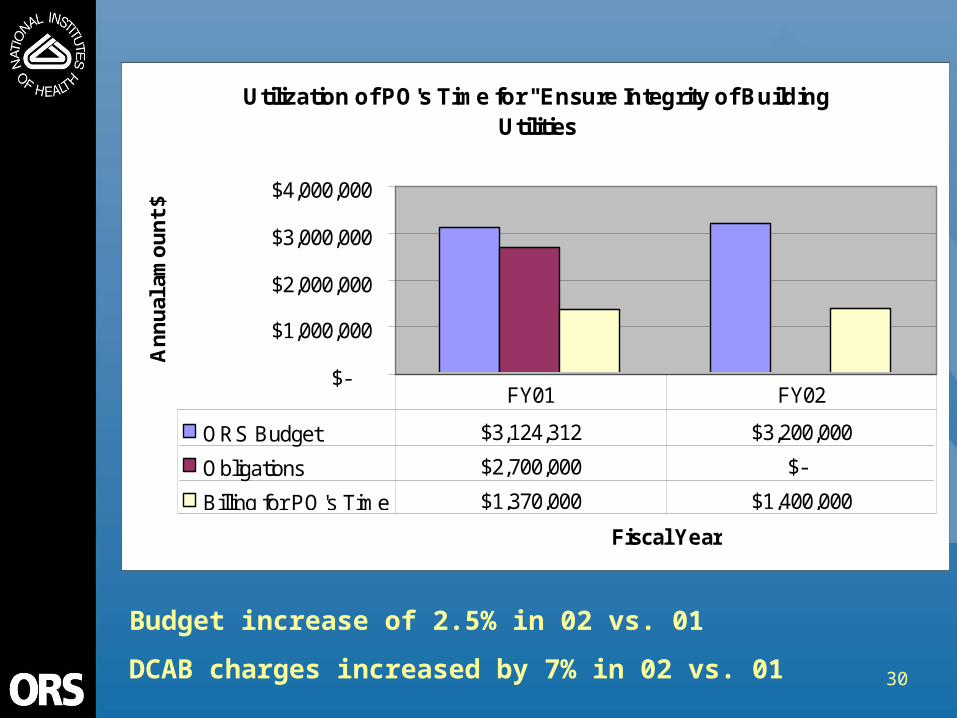
Budget increase of 2.5% in 02 vs. 01
DCAB charges increased by 7% in 02 vs. 01
Utilization of PO's Time for "Ensure Integrity of Building Utilities
$-
$1,000,000
$2,000,000
$3,000,000
$4,000,000
Fiscal Year
Ann
ual a
mou
nt $
ORS Budget $3,124,312 $3,200,000
Obligations $2,700,000 $-
Billing for PO's Time $1,370,000 $1,400,000
FY01 FY02

31
Project Officers Utilization of Time for "Ensure Campus Integrity"
0%
10%
20%
30%
40%
50%
60%
70%
Percentage of Time Charged
Perc
ent o
f PO
's
FY'01 FY'02
FY'01 56% 15% 4% 4% 1% 0% 0% 0% 1% 0%FY'02 61% 27% 10% 1% 1% 3% 1% 0% 0% 0%
0 1<=5% 5%<=10% 10%<=15%
15%<=20%
20%<=25%
25%<=30%
30%<=35%
35%<=80% >80%
32
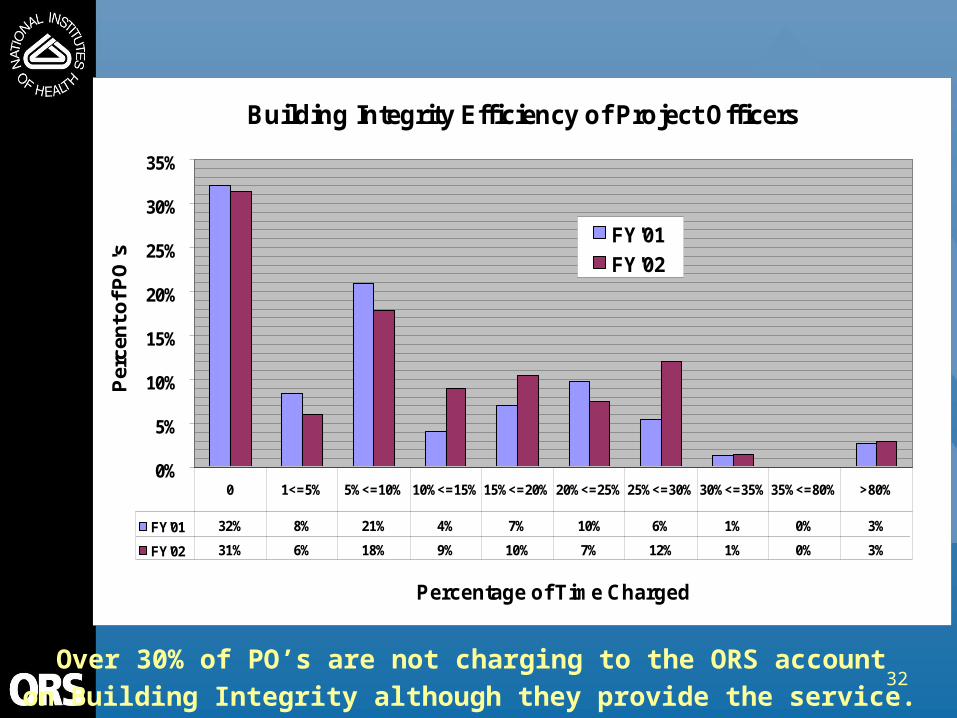
Building Integrity Efficiency of Project Officers
0%
5%
10%
15%
20%
25%
30%
35%
Percentage of Time Charged
Perc
ent o
f PO
's
FY'01 FY'02
FY'01 32% 8% 21% 4% 7% 10% 6% 1% 0% 3%
FY'02 31% 6% 18% 9% 10% 7% 12% 1% 0% 3%
0 1<=5% 5%<=10% 10%<=15% 15%<=20% 20%<=25% 25%<=30% 30%<=35% 35%<=80% >80%
Over 30% of PO’s are not charging to the ORS account on Building Integrity although they provide the service.

33
Conclusion for Asset Utilization• Based on the study of the actual time charged against the ORS account for Ensure Integrity of Campus and Building Utilities, it is clear that there is a need for additional training regarding use of the ORS account for these discrete services as there are many PO’s who do not charge any time to these accounts and provide the service.
• Considering deficient utility infrastructure of Building 10, we anticipated higher than average PO’s time to be charged against the ORS account. Evaluating the time charged by DCAB Teams 1, 6, & 7 revealed that approx 20% of the total time on the ORS building infrastructure account was charged for building 10 whereas this building constitutes 30% of the campus total square feet. Paul Hawver who leads the Building 10 infrastructure group, indicated there are services provided by consultants that have not been captured but are being considered for inclusion in FY03 and will be charged against the Building Integrity account.
34
Conclusions and Recommendations

35
Conclusions from FY02 ASA
1. The following are observations from of the Radar Charts and the comments from surveys (PWB) for the “Ensure Campus Integrity” discrete service:
a. Quality, Cost, Competence, Reliability, and Availability were rated above average with Quality and Competence being the highest ranked.
b. Timeliness, Responsiveness, Handling of Problems and Convenience were rated below average with Timeliness being the lowest ranked.

36
Conclusions from FY02 ASA2. The following are conclusions from the comments provided in the
surveys:a. What was done particularly well:
i. Communicationii. Construction of Tunnel (Reliability, Safety, maintenance)
b. What needs to be improved:i. Timelinessii. Trainingiii. Coordinationiv. Closeoutv. More involvement during Inspection, Commissioning and
Acceptancevi. Involvement in all levels of discussions affecting the utilitiesvii. PWB is the customerviii. Beneficial occupancy dates should be agreed to by customers
(PWB)

37
Recommendations
1. Identify PWB as a customer in DCAB’s ISO 9000 procedure manual. This would require PWB’s involvement in all aspects of the project specifically sign off requirement at 35% Design and Construction closeout. (Action by DCAB)

38
Recommendations Cont …2. Establish a tracking system to monitor projects that impact the
campus or building utilities infrastructure and include the following as a minimum (Action by DCAB and PWB management):
a. For each project identify if there is impact on the utilities, both campus and building utilities, during planning (Existing system - PIN).
b. Provide automatic Notification to the PWB central point of contact of the utility impacts and the design / construction schedule.
c. PWB and/or DCAB monitoring system needs to be established to assure projects that are identified for utility impact are submitted for PWB reviews at planning, design, construction and closeout. Also PWB’s reviews are done in a timely manner and returned to DCAB.
39
Recommendations Cont …
3. DCAB Project Officers need to better track their time spent on the utilities infrastructure for both campus and building utility categories in their time cards. Additional training is needed. (Action by DCAB management)
40
Recommendations Cont …4. Building 10 complex utility infrastructure team (DCAB
Team 7) led by Paul Hawver is currently providing review and coordination services to DCAB project officers on all projects that have utility impact in Building 10. Continue with the service and assure all associated costs are charged against the ORS Building Utilities Infrastructure account. Recommend adding same type of service for all other buildings on the campus either by PWB or DCAB. (Decision by DES management as to which branch should provide this service as this will require dedicated manpower).
5. The two Discrete Services studied under this service group category, should become a part of the larger DCAB service group. (Decision by DCAB management).
41
Appendices
42
Appendices
Page 2 of ASA Template Customer segments graphs Customer satisfaction graphs Block diagram Process maps Process measure graphs Learning and Growth graphs Analysis of Readiness Information Unit cost graphs Asset utilization graphs
43
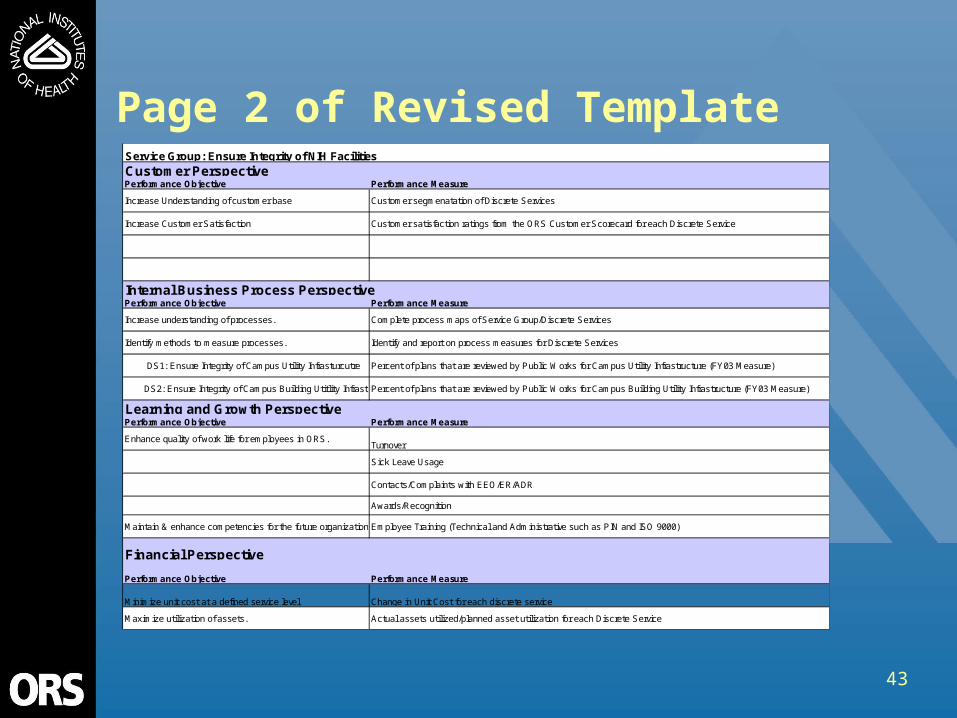
Page 2 of Revised Template
Sick Leave Usage
Percent of plans that are reviewed by Public Works for Campus Utility Infrastructure (FY03 Measure)
Increase Understanding of customer base
Service Group: Ensure Integrity of NIH Facilities
Performance Objective
Enhance quality of work life for employees in ORS.
Identify methods to measure processes.
DS2: Ensure Integrity of Campus Building Utitlity Infrastructure
Learning and Growth Perspective
Performance Measure
Financial Perspective
Performance MeasureInternal Business Process Perspective
Complete process maps of Service Group/Discrete Services
Identify and report on process measures for Discrete Services
Performance Objective
Increase understanding of processes.
Performance Measure
DS1: Ensure Integrity of Campus Utility Infrasturcutre
Percent of plans that are reviewed by Public Works for Campus Building Utility Infrastructure (FY03 Measure)
Turnover
Performance Objective
Customer PerspectivePerformance Measure
Customer satisfaction ratings from the ORS Customer Scorecard for each Discrete ServiceIncrease Customer Satisfaction
Customer segmenatation of Discrete Services
Performance Objective
Awards/Recognition
Actual assets utilized/planned asset utilization for each Discrete ServiceMaximize utilization of assets.
Maintain & enhance competencies for the future organization.Employee Training (Technical and Administrative such as PIN and ISO 9000)
Contacts/Complaints with EEO/ER/ADR
Minimize unit cost at a defined service level Change in Unit Cost for each discrete service
44
Customer Survey Results
DS1: Ensure Integrity of Campus Utility Infrastructure
45
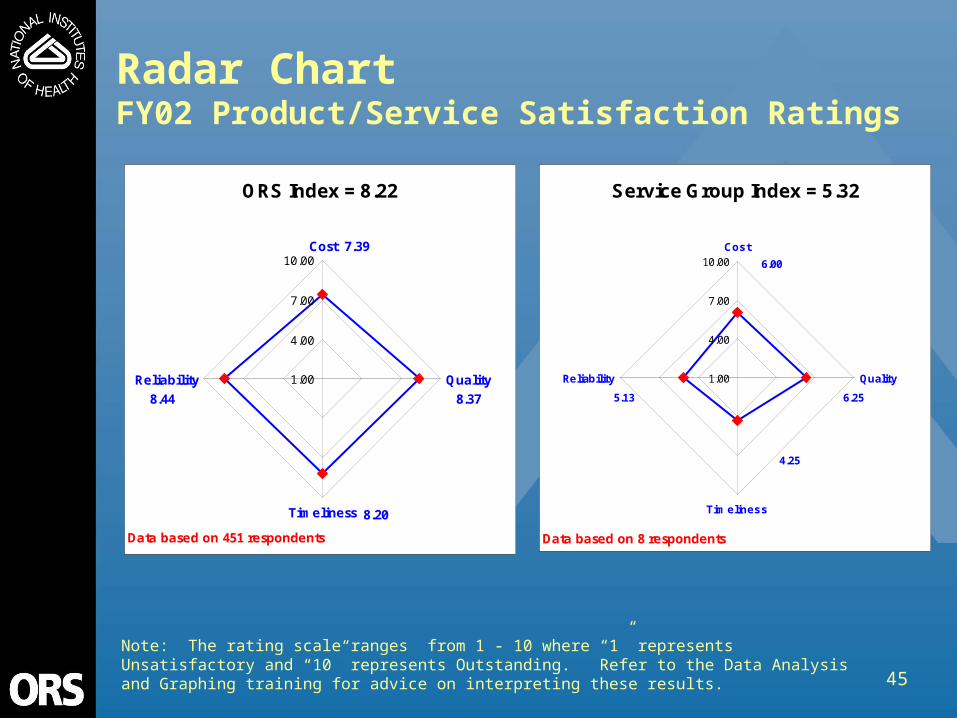
Radar ChartFY02 Product/Service Satisfaction Ratings
Note: The rating scale ranges from 1 - 10 where “1” represents Unsatisfactory and “10” represents Outstanding. Refer to the Data Analysis and Graphing training for advice on interpreting these results.
Service Group Index = 5.32
6.00
5.13
4.25
6.251.00
4.00
7.00
10.00Cost
Quality
Timeliness
Reliability
Data based on 8 respondents
ORS Index = 8.22
8.37
8.20
8.44
7.39
1.00
4.00
7.00
10.00Cost
Quality
Timeliness
Reliability
Data based on 451 respondents
46
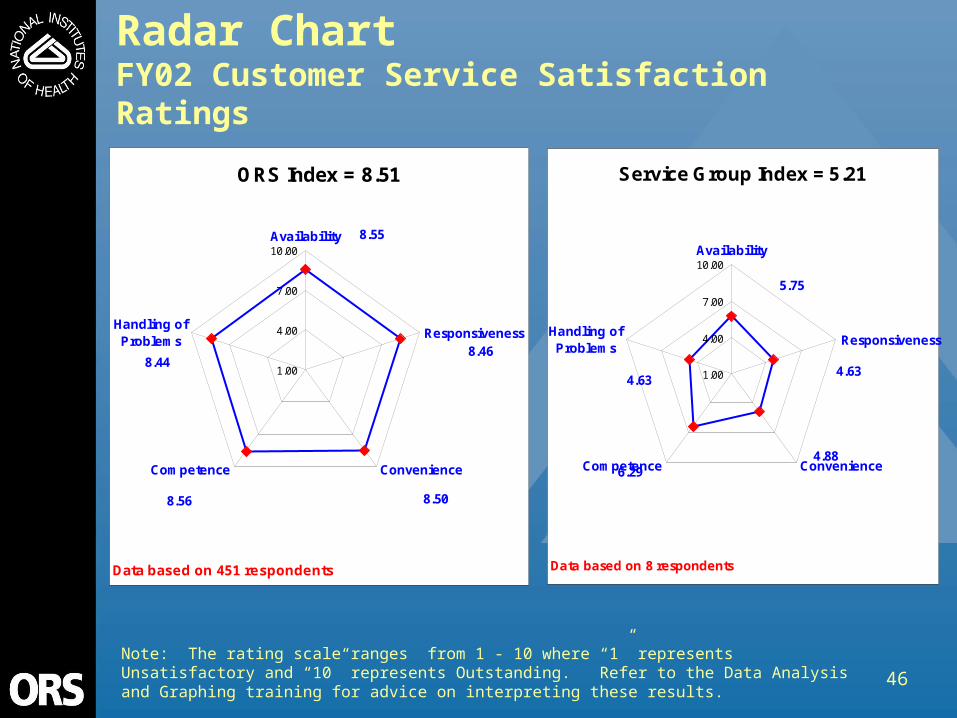
Radar ChartFY02 Customer Service Satisfaction Ratings
Note: The rating scale ranges from 1 - 10 where “1” represents Unsatisfactory and “10” represents Outstanding. Refer to the Data Analysis and Graphing training for advice on interpreting these results.
Service Group Index = 5.21
4.63 4.63
4.886.29
5.75
1.00
4.00
7.00
10.00Availability
Responsiveness
ConvenienceCompetence
Handling ofProblems
Data based on 8 respondents
ORS Index = 8.51
8.55
8.56 8.50
8.468.44
1.00
4.00
7.00
10.00Availability
Responsiveness
ConvenienceCompetence
Handling ofProblems
Data based on 451 respondents

47
Scatter DiagramFY02 Customer Importance and Satisfaction Ratings
Note: The Importance rating scale ranges from 1 - 10 where “1” represents Unimportant and “10” represents Important. The Satisfaction rating scale ranges from 1 - 10 where “1” represents Unsatisfactory and “10” represents Outstanding.
1.00
2.00
3.00
4.00
5.00
6.00
7.00
8.00
9.00
10.00
1.00 2.00 3.00 4.00 5.00 6.00 7.00 8.00 9.00 10.00
Satisfaction
Impo
rtan
ce
NOT SATISFIED, IMPORTANT
NOT SATISIFIED, NOT IMPORTANT
SATISFIED,IMPORTANT
SATISFIED, NOT IMPORTANT
Data based on 8 respondents

48
Scatter DiagramFY02 Customer Importance and Satisfaction Ratings: A Closer Look
Note: A smaller portion of the chart is shown so that the individual data points can be labeled.
4.00
4.50
5.00
5.50
6.00
6.50
7.00
7.50
8.00
8.50
9.00
9.50
10.00
4.00 4.50 5.00 5.50 6.00 6.50 7.00 7.50 8.00 8.50 9.00 9.50 10.00
Satisfaction
Impo
rtan
ce
SATISFIED,IMPORTANT
Cost
Convenience
Responsiveness
Availability
Handling of Problems
Competence
Quality
Timeliness
Reliability
Data based on 8 respondents

49
Reviewing Comments• Realize comments are qualitative data and are not
meant to be counted and tallied• Comments provide a different type of information
from your customers regarding their satisfaction• Comments are NOT representative of the
perceptions of all your customers• Review them but don’t over react to an individual comment
• Comments are a great source for ideas on how to improve
50
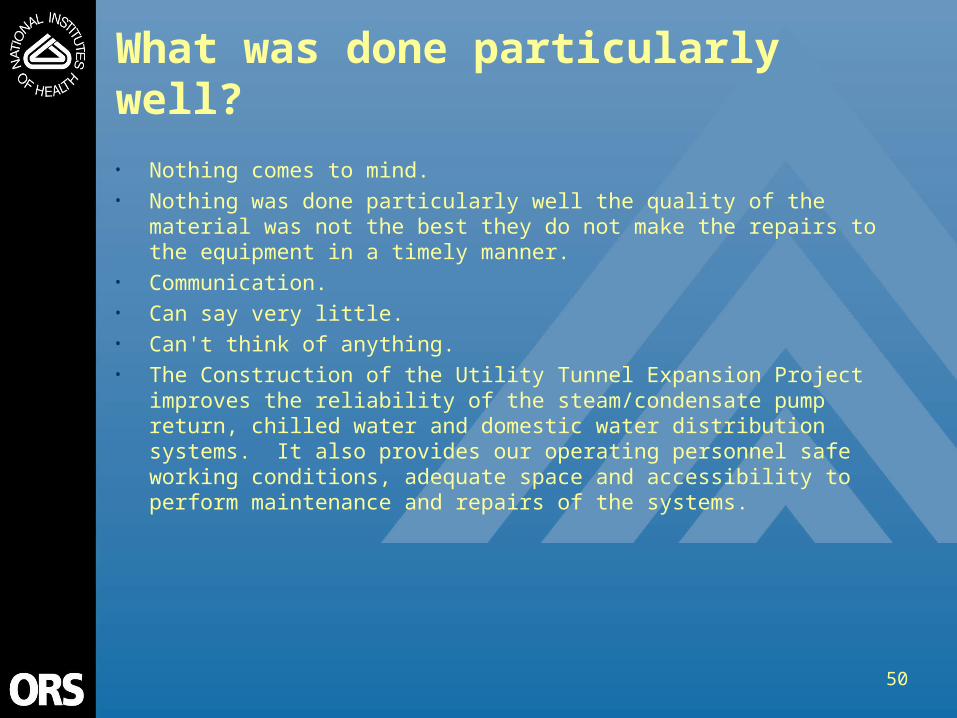
What was done particularly well?• Nothing comes to mind.• Nothing was done particularly well the quality of the material was not the best
they do not make the repairs to the equipment in a timely manner.• Communication.• Can say very little.• Can't think of anything.• The Construction of the Utility Tunnel Expansion Project improves the reliability
of the steam/condensate pump return, chilled water and domestic water distribution systems. It also provides our operating personnel safe working conditions, adequate space and accessibility to perform maintenance and repairs of the systems.

51
What needs to be improved?• Operator and maintenance training, fixing deficiencies, follow up on warranty
work, customer concurrence on change orders/deletions/addition to contract.• They need to fix the things that are leaking and finish the punch list that they
started on but stopped it seams that they are just waiting to see if we will do the work ourselves.
• Attention to detail, alternative solutions, fiscal responsibility, timeliness, bring project to closure.
• Working relationship between DCAB and PWB. PWB is also DCAB's customer (internal).
• All of the above.• Training, O & M Manuals, dust control, monitoring contractor activities, close out
of contract, warranty items, final acceptance.• Improvements are needed in the areas of coordination, inspection,
commissioning and acceptance of the project involving new construction or repair of utility distribution systems. Personnel from Central Utilities Section (CUS) should be involved and included in all level of discussion affecting the Utilities.

52
Other Comments• DCAB needs to get costumer concurrence on changes to contract. Beneficial
occupancy date should be agreed to by costumer.• I THINK YOU NEED TO GET MORE INPUT FROM THE PEOPLE IN CHARGE
OF THE PLANT TO SEE WHAT THEY NEED IN HERE NOT JUST WHAT THE DESIGNERS WANT TO PUT IN HERE THE MEN THAT RUN THE PLANT KNOWS WHAT THEY NEED TO DO THE JOB
• Please give me a call if this survey is for real then would give comments. Jim Powers 451-4478 Asst Chief Cup
• Central Utilities Section should have the signatory authority in the commissioning and final acceptance on all the projects relating to Utility Distribution Systems.
53
Customer Survey Results
DS2: Ensure Integrity of Campus Building Utility Infrastructure
54
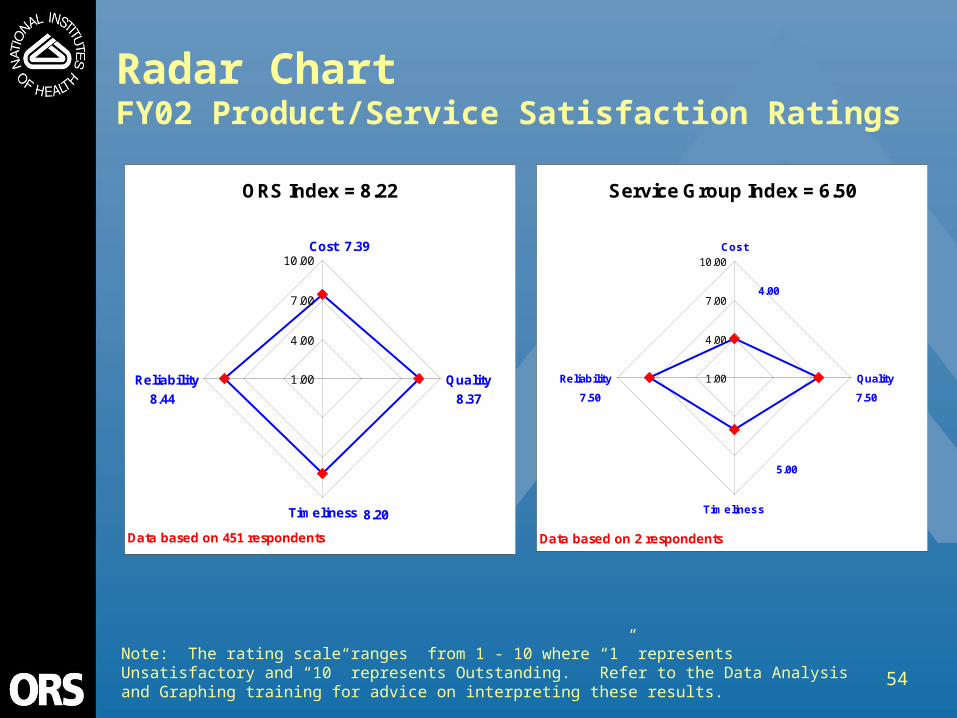
Radar ChartFY02 Product/Service Satisfaction Ratings
Note: The rating scale ranges from 1 - 10 where “1” represents Unsatisfactory and “10” represents Outstanding. Refer to the Data Analysis and Graphing training for advice on interpreting these results.
ORS Index = 8.22
8.37
8.20
8.44
7.39
1.00
4.00
7.00
10.00Cost
Quality
Timeliness
Reliability
Data based on 451 respondents
Service Group Index = 6.50
4.00
7.50
5.00
7.501.00
4.00
7.00
10.00Cost
Quality
Timeliness
Reliability
Data based on 2 respondents

55
Radar ChartFY02 Customer Service Satisfaction Ratings
Note: The rating scale ranges from 1 - 10 where “1” represents Unsatisfactory and “10” represents Outstanding. Refer to the Data Analysis and Graphing training for advice on interpreting these results.
ORS Index = 8.51
8.55
8.56 8.50
8.468.44
1.00
4.00
7.00
10.00Availability
Responsiveness
ConvenienceCompetence
Handling ofProblems
Data based on 451 respondents
Service Group Index = 6.50
7.00 6.00
6.507.00
5.00
1.00
4.00
7.00
10.00Availability
Responsiveness
ConvenienceCompetence
Handling ofProblems
Data based on 2 respondents

56
Scatter DiagramFY02 Customer Importance and Satisfaction Ratings
Note: The Importance rating scale ranges from 1 - 10 where “1” represents Unimportant and “10” represents Important. The Satisfaction rating scale ranges from 1 - 10 where “1” represents Unsatisfactory and “10” represents Outstanding.
1.00
2.00
3.00
4.00
5.00
6.00
7.00
8.00
9.00
10.00
1.00 2.00 3.00 4.00 5.00 6.00 7.00 8.00 9.00 10.00
Satisfaction
Impo
rtan
ce
NOT SATISFIED, IMPORTANT
NOT SATISIFIED, NOT IMPORTANT
SATISFIED,IMPORTANT
SATISFIED, NOT IMPORTANT
Data based on 2 respondents

57
Scatter DiagramFY02 Customer Importance and Satisfaction Ratings: A Closer Look
Note: A smaller portion of the chart is shown so that the individual data points can be labeled.
4.00
4.50
5.00
5.50
6.00
6.50
7.00
7.50
8.00
8.50
9.00
9.50
10.00
4.00 4.50 5.00 5.50 6.00 6.50 7.00 7.50 8.00 8.50 9.00 9.50 10.00
Satisfaction
Impo
rtan
ce
SATISFIED,IMPORTANT
CostConvenience
ResponsivenessAvailability Handling of Problems
Competence
Quality
Timeliness
Reliability
Data based on 2 respondents

58
What needs to be improved?• Differential pressure of around 10 to 12 psig should be maintained all the time.
There are still many bldg. Groups that don't have the tertiary pumping system installed are dependent on the differential pressure being maintained.
• The fee for service associated with the planning needs to be reduced and the time it takes to complete projects needs to be shortened.

59
Other Comments• I don't know that the high pressure air has been included in this project but there
are some existing problems with this utility. Most buildings do not receive the 100 psig air from the plant as they did in the past. A minimum of 100 psig air is needed for lab and cage wash equipment. Bldg 37 is having a compressor installed just for this equipment. Bldg 36 researchers have also inquired about the lower pressure being supplied to the bldg.
60
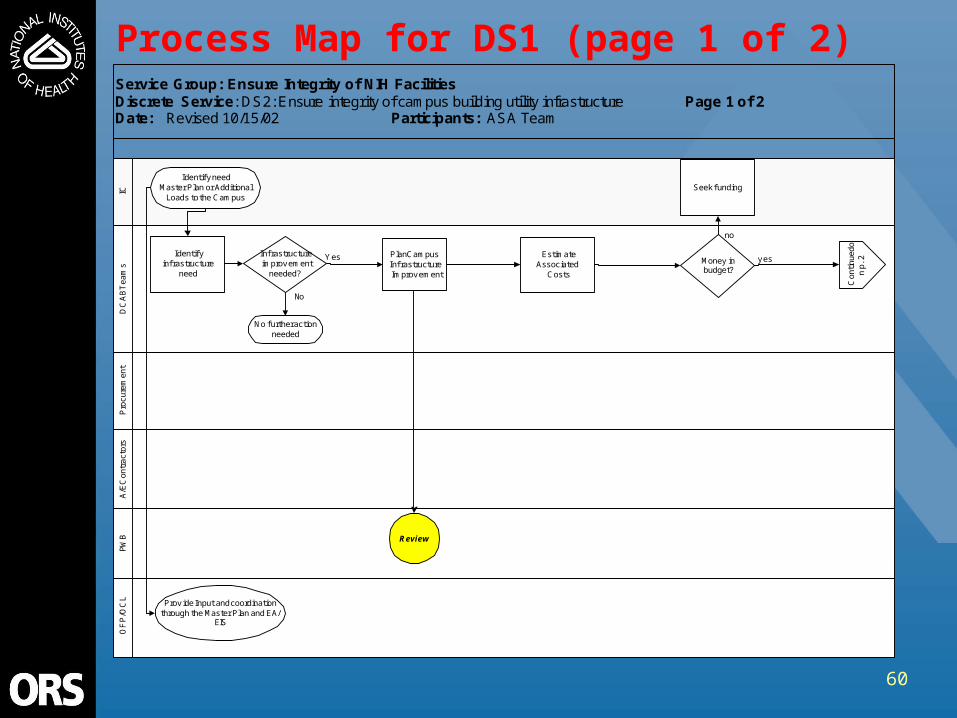
Process Map for DS1 (page 1 of 2)Service Group: Ensure Integrity of NIH FacilitiesDiscrete Service: DS2: Ensure integrity of campus building utility infrastructure Page 1 of 2Date: Revised 10/15/02 Participants: ASA Team
OF
P/O
CL
PWB
A/E
Con
trac
tors
Pro
cure
men
tD
CA
B T
eam
sIC
Identif y needMaster Plan or Additional
Loads to the Campus
Identif yinf rastructure
need
Plan CampusInf rastructureImprov ement
Inf rastructureimprov ement
needed?
No f urther actionneeded
Review
Money inbudget?
Con
tinue
don
p. 2
Seek f unding
No
Yes y es
no
EstimateAssociated
Costs
Prov ide Input and coordinationthrough the Master Plan and EA/
EIS

61
Process Map for DS1 (page 2 of 2)Discrete Service: DS1: Ensure integrity of campus building utility infrastructure, (continued) Page 2 of 2Date: Revised 10/30/02 Participants: ASA Team
OF
P/O
CL
PWB
Con
trac
tors
Pro
cure
men
tD
CA
B T
eam
Conitnued
from p. 1
A/E ContractorPrepare Design
Packages &Transmit to PO
Prepare designcontracting
package
Award DesignContract
DesignApprov ed
Prepareconstruction
contractDocuments
Award contract
ConstructionContractorSubmittals
ConstructionApprov ed by
PO and IC
Yes Yes
No
Shut Down
y esNo
ConstructionComplete
DesignReview
PO Coordinatewith NIH Div isions
and prov ides allaspects of project
management
SubmittalsApprov ed
PO Transmitsdocument toappropriate
parties &CoordinateComments
No
Phy sicalConstruction
No
Coordinate EA / EIS / NCPC

62
Process Map for DS2: (Page 1 of 2)Service Group: Ensure Integrity of NIH FacilitiesDiscrete Service: DS2: Ensure integrity of campus building utility infrastructure Page 1 of 2Date: Revised 10/15/02 Participants: ASA Team
OF
P/O
CL
PWB
A/E
Con
trac
tors
Pro
cure
men
tD
CA
B T
eam
sIC Identif y need
Identif yinf rastructure
need
Plan BuildingInf rastructureImprov ement
Inf rastructureimprov ement
needed?
No f urther actionneeded
Review
Money inbudget?
Con
tinue
don
p. 2
Seek f unding f romCongress
No
Yesy es
no
Is improv ementf or Building
10?
Dev elopPlan f orBlg 10
y es
EstimateAssociated
Costs

63
Process Map for DS2 (Page 2 of 2)Discrete Service: DS1: Ensure integrity of campus building utility infrastructure, (continued) Page 2 of 2Date: Revised 10/30/02 Participants: ASA Team
OF
P/O
CL
PWB
Con
trac
tors
Pro
cure
men
tD
CA
B T
eam
Conitnued
from p. 1
A/E ContractorPrepare Design
Packages &Transmit to PO
Prepare designcontracting
package
Award DesignContract
DesignApprov ed
Prepareconstruction
contractDocuments
Award contract
ConstructionContractorSubmittals
ConstructionApprov ed by
PO and IC
Yes Yes
No
Shut Down
y esNo
ConstructionComplete
Input from clinicalcenter Infrastructure
Team for Bldg 10Projects
DesignReview
PO Coordinatewith NIH Div isions
and prov ides allaspects of project
management
SubmittalsApprov ed
PO Transmitsdocument toappropriate
parties &CoordinateComments
No
Phy sicalConstruction
No
64
FY02 Learning and Growth (L&G) Data for the Annual Self Assessments
Service Group 34:
Ensure Integrity of NIH Facilities
10 October 2002
Summary Prepared by the Office of Quality Management

65
Methodology• All data represent occurrences from Oct 2001 - June
2002• Data analyzed covered period between October 1st and end
of June to provide time to analyze and present the data• ORS Human Resources (HR) provided data on:
• Turnover• Sick leave• Awards
• HR data stored in NIH databases by Standard Administrative Codes (SACs)
• Developed cross-reference of ORS Service Groups to SACs• Almost all SACs assigned to Service Groups • Some Service Groups have identical SACs
• In this case, two Service Groups will receive same set of data

66
Methodology (cont.)
• Also obtained data from: • Equal Employment Opportunity (EEO)
• Number of EEO complaints• Employee Relations (ER)
• Number of ER cases• Alternative Dispute Resolution (ADR)
• ADR cases
67
Interpreting Your Data• FY02 is the first time L&G data were collected and analyzed
• Compare your Service Group relative to the other ORS Service Groups
• What are all the L&G indicators telling you?• In the future your group should compare itself to its own Service
Group data over time • Interpret data in terms of other ASA data
• Customer satisfaction ratings• Process measures• Financial measures
• Does the L&G data, when compared to data in other perspectives, show potential relationship (could L&G be contributing to customer satisfaction results)?
• From reviewing your Service Group’s L&G data, what could be done to improve Quality of Work Life (QOWL)?

68
Service Group Turnover Rate
• Calculated as the number of separations for a Service Group / Population of Service Group• Separations defined as:
• Retirements (separation codes 3010, 3020, 3022)• Resignations (separation codes 3120, 3170)• Removals (separation codes 3300)• Terminations (separation codes 3520, 3550, 3570)• Promotions to new organization (separation codes 7020)• Reassignments (separation code 7210)
• Note that transfers/promotions within ORS Divisions/Offices are not captured by the NIH database

69
Service Group Turnover Rate (cont.)
• Calculation of Service Group population was needed since number of employees changes over time • Population for Service Group was estimated
based on average of employee count at three snapshots in time (Nov 2001, Feb 2002, June 2002)

70
0.00
0.05
0.10
0.15
0.20
0.25
0.30
0.35
12 16 21 30 27 20 42 13 41 3 23 11 7 18 25 1 2 10 17 31 40 26 28 37 29 33 39 5 32 34 36 38 4 8 9 14 15 19 35 43
Service Group Turnover Rate (Oct 2001 - June 2002)
Service Group Number
Turn
over
Rat
e

71
Average Hours of Sick Leave Used
• Calculated as the total number of sick leave hours used for a Service Group / Population of Service Group

72
0
10
20
30
40
50
60
70
80
14 3 9 31 8 17 43 38 36 33 41 12 30 28 18 29 21 39 20 16 11 27 40 35 5 32 34 26 42 19 4 15 37 23 1 2 10 13 7 25
Average Hours of Sick Leave Used(Oct 2001 - June 2002)
Service Group Number
Ave
rage
Hou
rs
73
Average Number of Awards Received
• Calculated as the total number of awards received / Population of Service Group
• Includes both monetary and non-monetary awards• Cash awards• QSIs• Time-off • Honorary• Customer Service

74
0.00
0.50
1.00
1.50
2.00
2.50
3.00
3.50
4.00
4.50
9 43 1 2 10 40 42 7 11 41 12 4 5 32 34 28 39 35 33 8 15 36 38 37 29 17 14 31 16 30 19 18 13 20 21 3 26 25 27 23
Average Number of Awards Received(Oct 2001 - June 2002)
Service Group Number
Ave
rage
num
ber

75
Average Number of EEO Complaints
• Calculated the total number of EEO complaints for a Service Group / Population of Service Group

76
0.00
0.01
0.02
0.03
0.04
0.05
0.06
0.07
20 7 26 38 36 1 2 3 4 5 8 9 10 11 12 13 14 15 16 17 18 19 21 23 25 27 28 29 30 31 32 33 34 35 37 39 40 41 42 43
Average Number of EEO Complaints (Oct 2001 - June 2002)
Service Group Number
Ave
rage
Num
ber
77
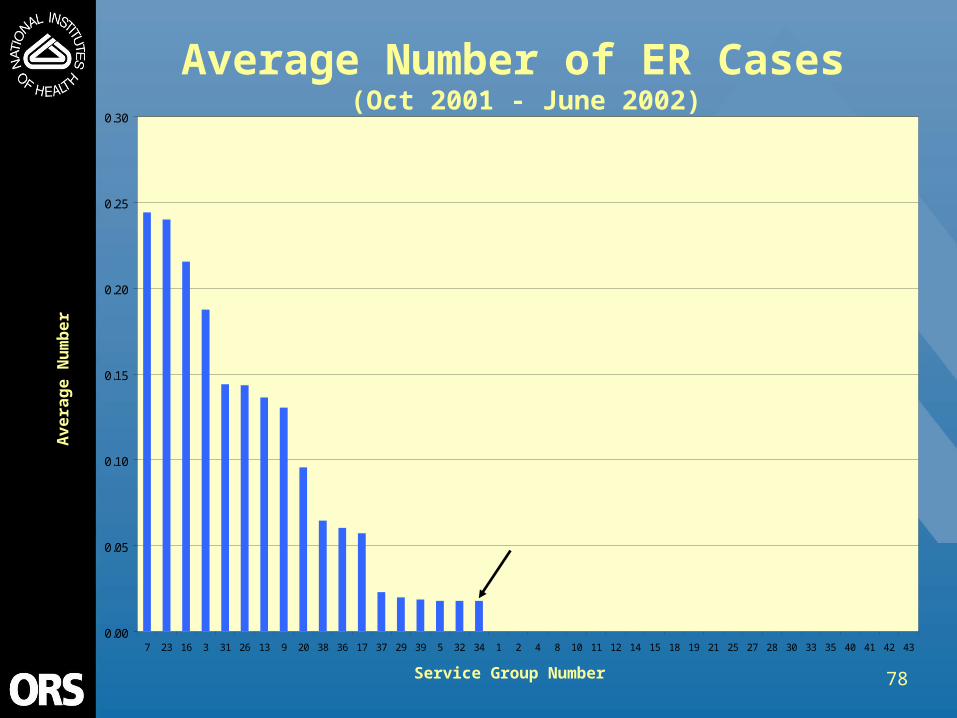
Average Number of ER Cases• Calculated the total number of ER cases for a
Service Group / Population of Service Group• Case is defined as any contact with ER Office
where an action occurs (e.g., Letter is prepared)
78
0.00
0.05
0.10
0.15
0.20
0.25
0.30
7 23 16 3 31 26 13 9 20 38 36 17 37 29 39 5 32 34 1 2 4 8 10 11 12 14 15 18 19 21 25 27 28 30 33 35 40 41 42 43
Average Number of ER Cases (Oct 2001 - June 2002)
Service Group Number
Ave
rage
Nu m
b er

79
Average Number of ADR Cases
• Calculated the number of ADR cases for a Service Group / Population of Service Group
• Case is initiated when person contacts ADR

80
0.00
0.05
0.10
0.15
0.20
0.25
7 9 30 26 33 3 5 32 34 20 21 31 29 39 28 36 16 38 1 2 4 8 10 11 12 13 14 15 17 18 19 23 25 27 35 37 40 41 42 43
Average Number of ADR Cases (Oct 2001 - June 2002)
Service Group Number
Ave
rage
Num
ber

81
Learning and Growth Data Table
3% Employee Turnover
About 4 days of sick leave per employee
Over 1 award per employee
0 EEO complaints, 2 ER and 5 ADR cases out of 111 employees
Popu
latio
n Es
timat
e
No. o
f Sep
arat
ions
Turn
over
Rat
eTo
tal H
ours
of S
ick
Leav
e Us
edAv
erag
e Ho
urs
of
Sick
Lea
ve U
sed
Num
ber o
f Awa
rds
Rece
ived
Aver
age
Num
ber o
f
Awar
ds R
ecei
ved
Num
ber o
f EEO
Co
mpl
aint
sAv
erag
e Nu
mbe
r of
EEO
Com
plai
nts
Num
ber o
f ER
Case
s
Aver
age
Num
ber o
f
ER C
ases
Num
ber o
f ADR
Ca
ses
Aver
age
Num
ber o
f
ADR
Case
s
522 12 1 0.08 363 29 11 0.89 0 0.00 0 0.00 1 0.085214 2 0 0.00 106 53 0 0.00 0 0.00 0 0.00 0 0.005215 6 0 0.00 308 51 6 1.00 0 0.00 0 0.00 2 0.335222 10 0 0.00 376 38 11 1.10 0 0.00 0 0.00 0 0.005223 14 0 0.00 384 28 15 1.10 0 0.00 1 0.07 0 0.005224 12 0 0.00 283 24 11 0.92 0 0.00 0 0.00 0 0.005225 8 0 0.00 350 44 13 1.63 0 0.00 0 0.00 0 0.005226 14 0 0.00 328 23 18 1.29 0 0.00 0 0.00 0 0.005227 6 0 0.00 192 32 7 1.17 0 0.00 0 0.00 0 0.005228 2 0 0.00 0 0 2 1.00 0 0.00 0 0.00 0 0.005229 4 0 0.00 135 34 5 1.25 0 0.00 0 0.00 0 0.00522B 5 0 0.00 39 8 4 0.86 0 0.00 0 0.00 0 0.00522D 17 2 0.12 436 26 19 1.14 0 0.00 1 0.06 2 0.12
Service Group 34
Total111 3 0.03 3298 30 122 1.10 0 0.00 2 0.02 5 0.04

82
Summary of Service Group 34 Learning and Growth Data
• 3% employee turnover• Over 1 award per employee• About 4 days of sick leave per employee• 0 EEO complaints, 2 ER and 5 ADR cases
out of 111 employees