asae d384.2 mar2005 manure production and ......manure production and characteristics american...
TRANSCRIPT

ASAE D384.2 MAR2005Manure Production and Characteristics
American Society of Agricultural Engineers
ASAE is a professional and technical organization, of members worldwide, who are dedicated to advancement of engineering applicable to agricultural, food, and biological systems. ASAE Standards are consensus documents developed and adopted by the American Society of Agricultural Engineers to meet standardization needs within the scope of the Society; principally agricultural field equipment, farmstead equipment, structures, soil and water resource management, turf and landscape equipment, forest engineering, food and process engineering, electric power applications, plant and animal environment, and waste management. NOTE: ASAE Standards, Engineering Practices, and Data are informational and advisory only. Their use by anyone engaged in industry or trade is entirely voluntary. The ASAE assumes no responsibility for results attributable to the application of these ASAE Standards, Engineering Practices, and Data. Conformity does not ensure compliance with applicable ordinances, laws and regulations. Prospective users are responsible for protecting themselves against liability for infringement of patents. This standard may be designated ANSI/ASAE. If so, this standard is an American National Standard. Approval of an American National Standard requires verification by ANSI that the requirements for due process, consensus, and other criteria for approval have been met by the standards developer. Consensus is established when, in the judgment of the ANSI Board of Standards Review, substantial agreement has been reached by directly and materially affected interests. Substantial agreement means much more than a simple majority, but not necessarily unanimity. Consensus requires that all views and objections be considered, and that a concerted effort be made toward their resolution. CAUTION NOTICE: In the case that this standard is an ANSI/ASAE standard, this American National Standard may be revised or withdrawn at any time. The procedures of the American National Standards Institute require that action be taken periodically to reaffirm, revise, or withdraw this standard. Purchasers of American National Standards may receive current information on all standards by calling or writing the American National Standards Institute. Copyright American Society of Agricultural Engineers. All rights reserved. ASAE-The Society for engineering in agricultural, food, and biological systems 2950 Niles Rd., St. Joseph, MI 49085-9659, USA ph. 269-429-0300, fax 269-429-3852, [email protected]

ASAE D384.2 MAR2005
Manure Production and Characteristics
Developed by the Engineering Practices Subcommittee of the ASAEAgricultural Sanitation and Waste Management Committee; approved bythe Structures and Environment Division Standards Committee; adoptedby ASAE December 1976; reconfirmed December 1981, December1982, December 1983, December 1984, December 1985, December1986, December 1987; revised June 1988; revised editorially andreaffirmed December 1993; revised editorially March 1995; reaffirmedDecember 1998, December 1999, December 2001, February 2003;revised March 2005 by a joint committee of ASAE and Federation ofAnimal Science Societies members.
1.0 Purpose1.1 This standard provides three types of information for estimatingcharacteristics of livestock and poultry manure:
• Typical characteristics for manure ‘‘as-excreted’’ by livestock andpoultry based on typical diets and animal performance levels in2002 (Section 3);
• Equations for estimating manure excretion characteristics based onanimal performance and dietary feed and nutrient intake specific toan individual situation (Sections 4 through 9);
• Typical characteristics for manure ‘‘as-removed’’ from manurestorage or animal housing (Section 10).
1.2 Typical or average estimates of manure excreted become obsoletedue to changes in animal genetics, performance potential, feedingprogram strategies, and available feeds. To minimize future concerns, aset of equations for predicting nutrient excretion (primarily nitrogen andphosphorus), dry matter, and, depending upon species, other potentialcharacteristics have been assembled for beef, dairy, swine, horses andpoultry. The Equation Estimates sections (Sections 4 through 9) allow anestimate of manure characteristics that is relevant to a wide range ofdietary options and animal performance levels commonly observed incommercial production.
1.3 It is more appropriate to use the equations in Sections 4 through 9for the following situations:
• When comprehensive nutrient management plans are beingdeveloped specific to an individual animal feeding operation (AFO);
• When farm specific data is available for an AFO’s feeding programand animal performance;
• When feed intake, feed nutrient concentration, feed digestibility, oranimal performance varies from the assumptions used to estimatethe typical values in Table 1.
• When Table 1 has not been updated to address industry trends.1.4 It may be more appropriate to use the typical values found inTable 1 for the following situations:
• When planning estimates are being made on a scale larger than asingle farm (e.g. county or regional estimate of nutrient excretion)
• When a rough approximation is needed for farm planning;• When farm-specific information of animal performance and feed
intake is not available.
2.0 Caution2.1 Section 3. Typical As-Excreted Manure Production and Characteris-tics. The user of these data should recognize that the reported typicalvalues may become obsolete with time due to changes in animalgenetics, feeding programs, alternative feeding technologies, andavailable feeds. In addition, users should also recognize that undercurrent conditions, excretion of nutrients and other related characteristicswill vary for individual situations from the currently listed values due tovariations in animal feed nutrient intake, animal performance, andindividual farm management. Sections 4 – 9 provide an alternative, andoften more accurate, methodology for estimating nutrient excretion forindividual production systems.
Table 1. Sectio n 3 – Estimated typical manure (urine and feces combined) characteristics as excreted 1 by:Table 1.a – Meat-producing livestock and poultry. Diet based numbers are in BOLD. See footnotes 2 and 3 for source of non-bold values.
ASAE D384.2 MAR2005ASAE STANDARDS 2005 1

Tabl
e1.
b–
Sect
ion
3–
Allo
ther
lives
tock
and
poul
try.D
ietb
ased
num
bers
are
inBO
LD.
See
foot
note
s2
and
3fo
rso
urce
ofno
n-bo
ldva
lues
.
1Pr
ior
toan
ych
ange
sdu
eto
dilu
tion
wat
erad
ditio
n,dr
ying
,vol
atiliz
atio
nor
othe
rph
ysic
al,c
hem
ical
orbi
olog
ical
proc
esse
s.2
Non
-bol
dta
ble
num
bers
indi
cate
that
pred
ictiv
eeq
uatio
nsw
ere
nota
vaila
ble
from
Sect
ions
4–
9fo
rest
imat
ing
this
char
acte
ristic
.The
senu
mbe
rsar
eav
erag
eva
lues
take
nfro
mM
WPS
-18
Sect
ion
1,N
RC
SAg
ricul
tura
lWas
teM
anag
emen
tFie
ldH
andb
ook,
and
the
prev
ious
vers
ion
ASAE
D38
4.1
orca
lcul
ated
base
dup
onpr
oced
ures
used
info
otno
te3.
3To
talS
olid
s(T
S)is
estim
ated
form
osta
nim
algr
oups
byeq
uatio
nsin
Sect
ions
4–
9.Fo
rbee
fcat
tle,v
olat
ileso
lids
isal
soba
sed
upon
equa
tions
.For
allo
ther
spec
ies,
vola
tile
solid
sar
eca
lcul
ated
from
TSan
dlit
erat
ure
valu
esof
the
ratio
ofVS
toTS
.Sim
ilarly
,BO
Dan
dC
OD
valu
esar
eca
lcul
ated
usin
gVS
and
the
liter
atur
eva
lues
ofth
era
tioof
BOD
and
CO
Dto
VS.L
itera
ture
valu
esar
eta
ken
from
MW
PS-1
8Se
ctio
n1,
NR
CS
Agric
ultu
ralW
aste
Man
agem
entF
ield
Han
dboo
k,an
dth
epr
evio
usve
rsio
nAS
AED
384.
1.4
BOD
–Bi
oche
mic
alox
ygen
dem
and,
5-da
y,C
OD
–C
hem
ical
oxyg
ende
man
d.5
Tota
lman
ure
isca
lcul
ated
from
Tota
lSol
ids
and
man
ure
moi
stur
eco
nten
t.6
As-e
xcre
ted
man
ure
moi
stur
eco
nten
tsra
nge
from
75to
90pe
rcen
t.At
thes
em
oist
ure
leve
lsas
-exc
rete
dm
anur
eha
sa
dens
ityne
arly
equa
lto
that
ofw
ater
,and
asp
ecifi
cgr
avity
of1.
0w
asas
sum
edin
calc
ulat
ion
ofm
anur
evo
lum
e.7
Solid
ses
timat
es(T
S,VS
,CO
D,a
ndBO
D)
dono
tinc
lude
solid
sin
urin
e.8
Thes
eva
lues
appl
yto
hors
es18
mon
ths
ofag
eor
olde
rth
atar
eno
tpre
gnan
tor
lact
atin
g.Th
ere
pres
enta
tive
num
ber
appl
ies
to50
0kg
hors
esan
dth
era
nge
repr
esen
tsho
rses
from
400
to60
0kg
.‘‘S
eden
tary
’’w
ould
appl
yto
hors
esno
trec
eivi
ngan
yim
pose
dex
erci
se.D
ieta
ryin
puts
are
base
don
min
imum
nutri
entr
equi
rem
ents
spec
ified
in9N
utrie
ntR
equi
rem
ents
ofH
orse
s9(N
RC
,198
9).9
Inte
nse9
repr
esen
tsho
rses
used
forc
ompe
titiv
eac
tiviti
essu
chas
raci
ng.D
ieta
ryin
puts
are
base
don
asu
rvey
ofra
ceho
rse
feed
ing
prac
tices
(Gal
lagh
eret
al,1
992)
and
typi
calf
eed
com
posi
tions
(fora
ge=
50%
alfa
lfa,5
0%tim
othy
;con
cent
rate
=30
%oa
ts,7
0%m
ixed
perfo
rman
ceho
rse
conc
entra
te).
9Bo
ldva
lues
incl
ude
cont
ribut
ion
ofnu
rsin
gpi
gs.
10Be
efco
ws
valu
esar
ere
pres
enta
tive
ofan
imal
sdu
ring
non-
lact
atin
gpe
riod
and
first
six
mon
ths
ofge
stat
ion.
ASAE D384.2 MAR20052 ASAE STANDARDS 2005
2.2 Sections 4 – 9. Equations for As-Excreted Manure CharacteristicsEstimates for Individual Species. These sections demonstrate the impactof dietary changes on nutrient excretion. However, this is not intended tobe used as a ration-balancing tool, nor is this the appropriate tool forestimating the nutrient needs of the animal. Nutrient needs are bestdefined in the National Research Council’s publication series or by usingUniversity recommendations. Both sources of information can provideestimates that reflect biological inefficiencies and digestibility limitations.2.3 In using Sections 4 – 9 to evaluate the impact of alternative rations,it is important to recognize that these equations accurately estimateexcretion only when animals are fed diets that meet or exceed theanimal’s minimum nutrient requirements. Estimates of excretion basedon dietary options that do not meet an animal’s minimum needs will notbe accurate. Sections 4 – 9 are to be used following ration developmentby an animal nutrition professional.2.4 New research data on excretion will be of value for confirming orimproving the accuracy of the equations estimating excreting. The
authors of this standard are very interested in comparing new researchdata with these equations. Authors can be contacted through the ASAEStandards staff.
2.5 Section 10. Typical As-Removed Manure Production andCharacteristics. Many physical, chemical, and biological processes canalter manure characteristics from its original as-excreted form. The as-removed manure production and characteristics values reported in thistable allow for common modifications to excreted manure (Section 3)resulting from water addition or removal, bedding addition, and/ortreatment processes. These values represent typical values based onavailable data sources (see end of Section 10). These estimates may behelpful for individual farm long-term planning prior to any samples beingavailable and for planning estimates addressing regional issues.Whenever possible, site-specific samples or other more localizedestimates should be used in lieu of national tabular estimates. This tableshould not be used to develop individual year nutrient managementplans for defining field specific application rates, unless absolutely
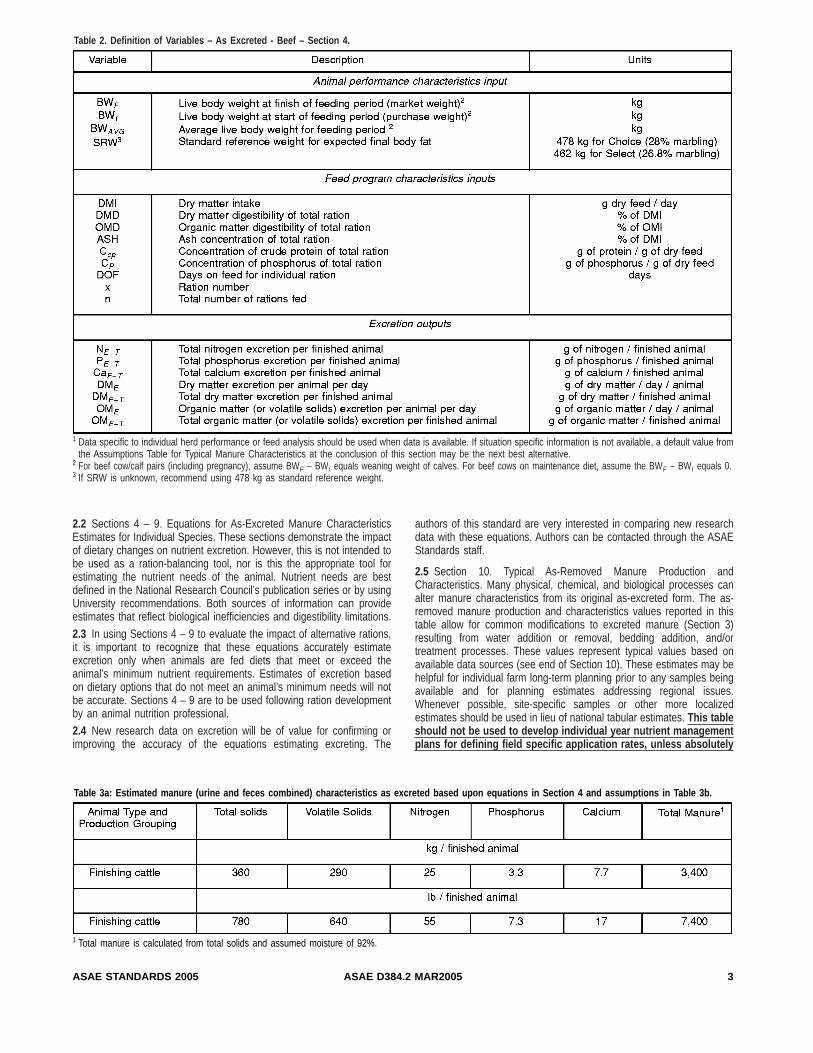
Table 2. Definition of Variables – As Excreted - Beef – Section 4.
1 Data specific to individual herd performance or feed analysis should be used when data is available. If situation specific information is not available, a default value fromthe Assumptions Table for Typical Manure Characteristics at the conclusion of this section may be the next best alternative.
2 For beef cow/calf pairs (including pregnancy), assume BWF – BWI equals weaning weight of calves. For beef cows on maintenance diet, assume the BWF – BWI equals 0.3 If SRW is unknown, recommend using 478 kg as standard reference weight.
Table 3a: Estimated manure (urine and feces combined) characteristics as excreted based upon equations in Section 4 and assumptions in Table 3b.
1 Total manure is calculated from total solids and assumed moisture of 92%.
ASAE D384.2 MAR2005ASAE STANDARDS 2005 3

no site-specific manure analysis data are available. However, wheresite-specific data are unavailable, this table may provide initial estimatesfor planning purposes until those site-specific values are available.
3.0 Typical As-Excreted Manure Production andCharacteristics3.1 Two approaches were used for estimating typical characteristicssummarized in Table 1.1) Manure characteristics listed in BOLD are estimated for dietary intake
and animal performance levels common for livestock and poultrymanagement in 2003 using the equations listed in Sections 4 through9. Beef, poultry and swine excretion characteristics are based on acalculation of dietary nutrient intake minus animal nutrient retentionusing dietary and performance measurements typical for the industryat the time these data were published. Nutrient retention estimatesfollowed common industry methodologies used for recommendingfeeding programs. Dry matter excretion is estimated to be a functionof dry matter intake minus dry matter digestibility (see equations inSections 4 and 9).For estimating dairy and equine manure characteristics, existingresearch data and regression analysis were used to identifyrelationship between feeding programs, animal performance, andexcretion.Total nitrogen, total phosphorus, and dry matter excretion wereestimated by these methods for all species. Available research dataor models allowed additional excretion estimates for some species.All data in Table 1 based upon animal dietary intake and performancemeasure is illustrated in BOLD with supporting assumptions fordietary intake and performance assumptions and references listed inSections 4 through 9.
2) Where dietary intake and animal performance level based excretionestimates could not be made, a review of current references includingthe USDA Agricultural Waste Management Field Handbook, previousASAE D384 standard, and Manure Characteristics (MWPS-18,Section 1). Those values in Table 1 that are not bold are based uponthese references.
3.2 Caution3.2.1 Manure and nutrient production characteristics for meat producinganimals are reported on a unit mass excreted per finished animal.Manure excretion by meat producing animals varies with stage of growth.This format was selected to minimize misuse of a daily average valuesto represent an entire production phase. Sizing of treatment systemsbased upon instantaneous loading rates should use the equations inSections 4 through 9 with appropriate feeding program and performanceinputs typical of the later stages of growth. Manure excretion rates forother animals are more constant and thus reported on a daily basis.3.2.2 In addition, facilities for meat producing animals are rarely in fullproduction 365 days per year due to uneven growth rates of animals,time required for facility cleaning after a group, and availability of animals
for restocking a facility. Planning based on number of finished animalsprovides a more realistic planning estimate for annual manure volumeand nutrient production.3.2.3 It should also be noted that Table 1 estimates and predictiveequations in Sections 4 through 9 provide an as-excreted estimate ofmanure production, excluding any additions of waste feed or dilutionwater, biochemical degradation of solids, or volatilization of nitrogen andcarbon. Manure characteristics after storage and/or treatment of manuresare better estimated by site-specific manure samples or, when farmspecific information is not available, by the typical as-removed valueslisted in Section 10.3.3 References3.3.1 Fulhage, C. D., 2003. Proposed Revision to ASAE D384.1 forRepresentative Values of ‘‘As-Excreted’’ Manure Production. Proceedingsof the International Symposium for Animal, Agricultural, and FoodProcessing Wastes IX. ASAE. St. Joseph, MI. 269–276.
4.0 Equations for As-Excreted Manure CharacteristicsEstimates for Beef4.1 Fundamental ModelNutrient Excretion = Feed Nutrient Intake – Nutrient RetentionDry Matter Excretion = Feed Dry Matter Intake X (1 – Dry MatterDigestibility)*
* Same relationship for organic matter or volatile solids excretion4.2 See 2.0 CautionSee Table 2, Definitions of Variables – As Excreted – Beef.4.3 Equations for Estimating ExcretionsEquations from the 1996 NRC Nutrient Requirements of Beef Cattle forretained protein and energy equations provide the basis for estimatingnitrogen retention. Supplemental information referenced by thispublication provides background information on validation of thisapproach for estimating retained nitrogen.Retained phosphorus is generally recognized as 3.9 g of retained P per100 g of retained protein. Retained calcium is generally recognized as7.1 g per 100 g of retained protein. Therefore, P and Ca retention arecalculated as a function of retained protein. Both assumptions originatefrom the 1996 NRC Nutrient Requirements of Beef Cattle. Additionalsupporting information is sited by this publication.4.3.1 Dry Matter Excretion Equation for Calves and Finishers1
DME 5 @DMI * ~12DMD / 100 !#1 20.3* ~0.06* BWAVG! (1)
DME –T 5 Sn
x51 DMIx * DOFx * ~12DMDx / 100 !
1Sn
x51DOFx* 20.3* ~0.06* BWAVG! (2)
1 Estimates dry matter for 1) feces baed upon indigestibility of feed and for 2) urinebased upon regression equation from 300 observations of urine excretion by beefcattle finishers ranging in weight from 100 to 620 kg and urine solids content of6%.
Table 3b – Dietary and performance assumptions – Section 4.
ASAE D384.2 MAR20054 ASAE STANDARDS 2005

4.3.2 Organic Matter (or volatile solids) Excretion Equation
OME 5 @DMI* ~12ASH / 100 !#* ~12OMD / 100 !
1 17* ~0.06* BWAVG! (3)
OME –T 5 Sn
x51 @DMIx* DOFx* ~12ASHx / 100 !#* ~12OMDx
/ 100 ! 1Sn
x51DOFx* 17* ~0.06* BWAVG! (4)
4.3.3 Nitrogen Excretion Equation
NE –T 5 Sn
x51~DMIx* Ccp –x* DOFx* /6.25 !–@41.2* ~BWF
2BWI!# 1 @0.243* DOFTt* @~BWF
1BWI!/2#0.75* ~SRW/~BWF* 0.96 !!0.75* @~BWF
2BWI!/DOFT#1.097# (5)
4.3.4 Phosphorus Excretion Equation
PE –T 5 Sn
x51~DMIx* CP –x* DOFx!–@10.0* ~BWF2BWI!#
1$5.92* 1022* DOFT* @~BWF
1BWI!/2#0.75* ~SRW/BWF* 0.96 !0.75* @~BWF
2BWI!/DOFT#1.097% (6)
4.3.5 Calcium Excretion Equation
CaE –T 5 Sn
x51~DMIx* CCa2x* DOFx!–@18.33* ~BWF2BWI!#
10.445* $0.243* DOFT* @~BWF
1BWI!/2#0.75* ~SRW/~BWF* 0.96 !!0.75* @~BWF
2BWI!/DOFT#1.097% (7)
4.4 Manure Characteristics Based Upon Typical Performance andDiets – See Tables 3a and 3b.
4.5 References
4.5.1 Anrique, R. G., M. L. Thonney, and H. J. Ayala. 1990. Dietaryenergy losses of cattle influenced by body type, size, sex, and intake.Anim. Prod. 50:467–474.
4.5.2 Danner, M. L., D. G. Fox, and J. R. Black. 1980. Effect of feedingsystem on performance and carcass characteristics of yearling steers,steer calves and heifer calves. J. Anim. Sci. 50:394–404.
4.5.3 Ellenberger, H. G., J. A. Newlander, and C. H. Jones. 1950.Composition of the bodies of dairy cattle. Vt. Agric. Exp. Sta. Bull. 558.
4.5.4 Erickson, G. E., B. Auvermann, R. Eigenberg, L.W. Greene, T.Klopfenstein, R. Koelsch. 2003. Proposed Beef Cattle Manure Excretionand Characteristics Standard for ASAE. Proceedings of the InternationalSymposium for Animal, Agricultural, and Food Processing Wastes IX.ASAE. St. Joseph, MI. 269–276.
Table 4 – Definition of Variables – As Excreted – Dairy Cattle – Section 5.
ASAE D384.2 MAR2005ASAE STANDARDS 2005 5

4.5.5 Fortin, A., S. Simpfendorfer, J. T. Reid, H. J. Ayala, R. Anrique, andA. F. Kertz. 1980. Effect of level of energy intake and influence of breedand sex on the chemical composition of cattle. J. Anim. Sci. 51:604–614.4.5.6 Garrett, W. N. 1980. Energy utilization by growing cattle asdetermined in 72 comparative slaughter experiments. Energy Metab.Proc. Symp. 26:3–7.4.5.7 Harpster, H. W. 1978. Energy requirements of cows and the effectof sex, selection, frame size, and energy level on performance of calvesof four genetic types. Ph.D. dissertation. Michigan State University, EastLansing, MI.4.5.8 Lomas, L. W., D. G. Fox, and J. R. Black. 1982. Ammoniatreatment of corn silage. I. Feedlot performance of growing and finishingcattle. J. Anim. Sci. 55:909–923.4.5.9 NRC. 1996 (2000 update). Nutrient Requirements for Beef Cattle.Seventh Revised Edition. National Academy Press. 242 pages.4.5.10 Tylutki, T. P., D. G. Fox, and R. G. Anrique. 1994. Predicting netenergy and protein requirements for growth of implanted andnonimplanted heifers and steers and nonimplanted bulls varying in bodysize. J. Anim. Sci. 72:1806–1813.4.5.11 Woody, H. D., D. G. Fox, and J. R. Black. 1983. Effect of dietgrain content on performance of growing and finishing cattle. J. Anim.Sci. 57:717–728.
5.0 Equations for As-Excreted Manure CharacteristicsEstimates for Dairy Cattle5.1 Fundamental Model5.1.1 The estimates for manure and nutrient excretion were derivedfrom the combination of multiple data sets from Washington StateUniversity, University of California – Davis, The Ohio State University,and Pennsylvania State University. The data sets contain records fromHolstein cattle and include a wide variety of animal ages, ranging fromcalves to multiparous lactating cows.5.1.2 The data for the calves and heifers were divided according toanimal body weight and includes four groups, milk fed calves, weanedcalves weighing less than 204 kg, heifers weighing between 274 to 613kg, and veal calves. Excretion estimates for veal calves were adaptedfrom Sutton et al., 1989. Additional classifications of animals includenon-lactating and lactating cows.5.1.3 Lactating cow excretion estimates were derived from regressionequations developed using lactating Holstein cows regardless of bodyweight or milk production. The data set for lactating cows was evaluatedto compare the amount of metabolizable protein (MP) required to the MPsupplied to the cow using the 2001 Dairy NRC Model. Only cows fed lessthan 112% of MP requirements were included in the data set. Theaverage values reported for lactating cows were determined using theregression equation for a cow producing 40 kg of milk. The regressionequations were developed using PROC MIXED of SAS, with studyincluded as a random variable (St-Pierre, 2001).
5.2 See 2.0 CautionSee Table 4, Definitions of Variables – As Excreted – Dairy Cattle.5.3 Equations for Estimating Excretion
In many cases, multiple prediction equations are presented. Note, thatwhile the more simplistic equation requires fewer inputs, the result couldbe less precise due to the influence of dietary intake of nutrients (moredeveloped equation). Regression equations developed using the data setinclude both residual errors and errors from the variation between theresearch trials (inter-study errors). Equations with the lowest residualerror should be used whenever the input variables are available.
Assumptions:1) Urine dry matter, estimated at 4.5%, was used for total solids and
moisture calculations. The urine volume was calculated by using aspecific gravity of 1.038 g/ml.
2) Milk crude protein was converted to milk true protein using aconversion factor for the Holstein breed of 0.940 (http://www.aipl.arsusda.gov/reference/trueprot.htm).
5.3.1 Total Manure – Lactating cow regression equations:1
ME 5~Milk 3 0.172 !1~DMI 3 2.207 !1~MF 3 171.830 !
1~MTP 3 505.310 !–8.170 (1)
Inter-study error 5 8.50Residual error 5 7.00
ME 5 ~Milk 3 0.954 !1~BW 3 0.037 !1~DIM 3 0.017 !
1~MF 3 186.720 !1~MTP 3 1141.480 !–33.06 (2)
Inter-study error 5 5.08Residual error 5 8.33
ME 5 ~Milk 3 0.647 !143.212 (3)
Inter-study error 5 6.94Residual error 5 9.19
5.3.2 Total Manure – Dry cow regression equation:1
ME 5 ~BW 3 0.022 !121.844 (4)
Inter-study error 5 5.93Residual error 5 5.71
5.3.3 Total Manure – Heifer regression equations:1
ME 5 ~DMI 3 3.886 !–~BW 3 0.029 !15.641 (5)
Inter-study error 5 5.34Residual error 5 2.61
ME 5 ~BW 3 0.018 !117.817 (6)
Inter-study error 5 4.02Residual error 5 3.55
5.3.4 Total Solids – Lactating cow regression equations: 2
DME 5 ~DMI 3 0.350 !11.017 (7)
Inter-study error 5 1.13Residual error 5 0.76
DME 5 ~Milk 3 0.135 !1~BW 3 0.004 ! 1~DIM 3 0.004 !
1~MTP 3 118.370 !–2.456 (8)
Inter-study error 5 0.63Residual error 5 1.03
DME 5 ~Milk 3 0.096 !15.073 (9)
Inter-study error 5 0.78Residual error 5 1.13
1 Total manure equals actual fecal excretion plus actual urine excretion fromindividual cows collected and weighted on a daily basis.
2 DME = actual fecal dry matter + urine dry matter.
ASAE D384.2 MAR20056 ASAE STANDARDS 2005

Table 5a – Estimated typical manure (urine and feces combined) characteristics as excreted based upon equations in Section 5 and assumptions in Table 5c.
1 Total manure is calculated from total solids and assumed moisture.
Table 5b – Estimated typical manure (urine and feces combined) characteristics as excreted based upon sources cited in Table 5c.
Table 5c – Dietary and performance assumptions.
ASAE D384.2 MAR2005ASAE STANDARDS 2005 7

5.3.5 Total Solids – Dry cow regression equation:1
DME 5 ~DMI 3 0.178 !12.733 (10)
Inter-study error 5 0.74Residual error 5 0.45
DME 5 ~BW 3 0.004 !11.863 (11)
Inter-study error 5 0.42Residual error 5 0.59
5.3.6 Urine Volume – Lactating cow regression equations:
UE 5 ~Milk 3 0.114 !1~BW 3 0.016 !1~MF 3 97.709 !
1~MTP 3 353.280 !1~CCP 3 62.036 !–16.389 (12)
Inter-study error 5 3.87Residual error 5 5.56
UE 5 ~BW 3 0.017 !111.704 (13)
Inter-study error 5 4.67Residual error 5 5.68
(Note: Urine volume could be considerably different, depending on rationmineral content. Insufficient data were available to derive regressionequations based on intake of minerals)
5.3.7 Nitrogen Excretion – Lactating cow regression equations: 2
NE 5 ~Milk 3 2.303 !1~DIM 3 0.159 !1~DMI 3 CCP
3 70.138 !1~BW30.193 !–56.632 (14)
Inter-study error 5 53.07Residual error 5 102.71
NE 5 ~Milk 3 5.959 !1~DIM 3 0.237 !1~BW 3 0.347 !
1~MTP 3 4547.910 !1~CCP 3 1793.730 !2476.530
(15)Inter-study error 5 42.48Residual error 5 107.01
NE 5 ~Milk 3 4.204 !1283.300 (16)
Inter-study error 5 57.8Residual error 5 110.8
5.3.8 Nitrogen Excretion – Dry cow regression equation: 2
NE 5 ~DMI 3 12.747 !1~CCP 3 1606.290 !–117.500 (17)
Residual error 5 45.51
5.3.9 Nitrogen Excretion – Heifer regression equations: 2
NE 5 ~~DMI 3 1000 ! 3 ~CCP / 6.25 ! (18)
NE 5 ~DMI 3 CCP 3 78.390 !151.350 (19)
Inter-study error 5 24.47Residual error 5 10.76
5.3.10 Phosphorus Excretion – Lactating cow regression equations:1
If diets contain less than 0.004 g P/g dry feed1:
PE 5 ~~DMI31000 !3CP!–~Milk30.9 ! (20)
If diets contain 0.004 g P/g dry feed or greater:
PE 5 ~Milk30.565 !1~MTP3816.260 !
1~DMI3CP3421.410 !–9.697 (21)
Inter-study error 5 10.81Residual error 5 11.47
PE 5 ~Milk30.773 !146.015 (22)
Inter-study error 5 10.83Residual error 5 14.48
5.3.11 Phosphorus Excretion – Dry cow regression equation:1,2
PE 5 ~~~DMI31000 !3CP3DP!–264.386 !/DP (23)
5.3.12 Phosphorus Excretion – Heifer regression equation:1
PE 5 ~~DMI31000 !3CP! (24)
5.3.13 Potassium – Lactating cow regression equations: 3
KE 5 ~Milk31.822 !1~MTP32688.880 !
1~DMI3CK3156.930 !–91.755 (25)
Inter-study error 5 16.77Residual error 5 25.27
KE 5 ~Milk31.800 !131.154 (26)
Inter-study error 5 18.89Residual error 5 26.94
5.3.14 Potassium – Dry cow and heifer regression equation:3
KE 5 ~~DMI31000 !3CK! (27)
5.4 Manure Characteristics Based Upon Typical Performance andDiets – See Tables 5a, 5b, and 5c.
5.5 Reference5.5.1 Nennich, T., J Harrison, D. Meyer, W. Weiss, A. Heinrichs, R.Kincaid, W. Powers, R. Koelsch, P. Wright. 2003. Development ofStandards Method to Estimate Manure Production and NutrientCharacteristics from Dairy Cattle. Proceedings of the InternationalSymposium for Animal, Agricultural, and Food Processing Wastes IX.ASAE. St. Joseph, MI. 263–268.
6.0 Equations for As-Excreted Manure CharacteristicsEstimates for Horses6.1 Fundamental ModelEquations for as-excreted manure characteristics are based uponregression analysis from available data sets for N, P, K, Ca and Mg.Other estimates are based on survey data or dietary recommendations(NRC, 1989). The nitrogen data set contained 46-paired values (intakeand excretion), with intakes ranging from 130 to 530 mg/kg BW/day(median = 250 g N/kg BW). For P, 128 paired values were used (range= 19–121 mg/kg BW/day; median = 42.8 mg P/kg BW). For K, 28 pairedvalues were used (range 50–404 mg/kg BW/day; median = 193.3 mgK/kg Bw). For Ca, 106 paired values were used (range 9.1 to 247 mg/kgBW/d; median 69.7 mg Ca/kg BW). For Mg, 50 paired values were used(range 18.6 to 131.6 mg Mg/kg BW/d; median 28.2 mg Mg/kg BW).
1 DME = actual fecal dry matter + urine dry matter.2 Nitrogen excretion = actual fecal N + actual urine N.
1 Phosphorus excretion = actual fecal P + actual urine P.2 The constant was derived from the 2001 Dairy NRC equation (p. 112) for
absorbed phosphorus and assumes a 60 day dry period.3 Potassium excretion = actual fecal K + actual urine K.
ASAE D384.2 MAR20058 ASAE STANDARDS 2005

6.2 See 2.0 CautionSee Table 6, Definition of Variables – As Excreted - Horses.
6.3 Equations for Estimating Excretions6.3.1 Nitrogen Excretion
#1: Sedentary horses: NE 5 ~55.4* BW* 10 –3!
1~0.586* DMI* Ccp!/6.25
~R2 5 0.76 !
#2: Exercised horses: NE 5 ~42.9* BW* 10 –3!
1~0.492* DMI* Ccp!/6.25
~R2 = 0.94)
6.3.2 Phosphorus Excretion
#3: Sedentary or exercised horses: PE 5 ~4.56* BW* 10 –3!
1~0.793* DMI* Cp! (1)
~R2 5 0.85 !
6.3.3 Potassium Excretion
#4: Sedentary or exercised horses: KE 5 ~19.4* BW* 10 –3!
1~0.673* DMI* Ck! (2)
~R2 5 0.62 !
6.3.4 Calcium Excretion
#5: Sedentary horses: CaE 5 ~26.6* BW* 10 –3!
1~0.497* DMI* CCa! (3)
~R2 5 0.65 !
#6: Exercised horses: CaE 5 ~ –5.98* BW* 10 –3!
1~0.804* DMI* CCa! (4)
~R2 5 0.73 !
6.3.5 Magnesium Excretion
#7: Sedentary or exercised horses: MgE 5 ~9.08* BW* 10 –3!
1~0.545* DMI* CMg! (5)
~R2 5 0.68 !
6.3.6 Dry Matter Excretion (feces)
#8: Sedentary: DMF 5 @~0.03* BW 11.4 !/2.0#* 425 (6)
#9: Exercised: DMF 5 [email protected]* ~0.03* BW 11.4 !# /2.85%* 310(7)
6.3.7 Dry Matter Excretion (combined urine and feces):1
#10: Sedentary: DME 5 7.2* BW 1220 (8)
#11: Exercised: DME 5 7.3* BW 1230 (9)
6.3.8 Optional estimate of dry matter excretion (feces) for all horses:
#12: DMF 5 DMI* ~1 –DMD/100 ! (10)
6.3.9 Optional estimate of dry matter excretion (combined urine andfeces) for all horses: 2
#13: DME 5 @DMI* ~1 –DMD/100 !#10.64* BW (11)
1 Sum of total feces and total urine (equations 12 and 13) and multiplied by anassumed moisture content of 15%.
2 Alternate approach: Sum of total urine (equation 13) multiplied by assumed urinesolids content of 4% and dry matter excretion (equaiton 10).
Table 6 – Definition of Variables – As Excreted - Horses – Section 6.
ASAE D384.2 MAR2005ASAE STANDARDS 2005 9

6.3.10 Total Feces
Sedentary or exercised horses: FE 5 DME/0.20 (12)
6.3.11 Total Urine
Sedentary or exercised horses: UE 5 16* BW (13)
6.4 Manure Characteristics Based Upon Typical Performance andDiets – See Tables 7a and 7b.
6.5 References6.5.1 Lawrence, L., J. Bicudo, E. Wheeler. 2003. Horse ManureCharacteristics Literature and Database Review. Proceedings of theInternational Symposium for Animal, Agricultural, and Food ProcessingWastes IX. ASAE. St. Joseph, MI. 277–284.6.5.2 Gallagher, K., J. Leech and H. Stowe. 1992. Protein, energy anddry matter consumption by racing thoroughbreds: A field survey. J.Equine Vet Sci. 12:43–48.6.5.3 NRC. 1989. Nutrient Requirements of Horses. National AcademyPress, Washington DC.
Table 7a – Estimated typical manure (urine and feces combined) characteristics as excreted based upon equations in Section 6 and assumptions in Table7b.
1 These values apply to horses 18 months of age or older that are not pregnant or lactating. The representative number applies to 500 kg horses. Under type of horse,classifications are made on amount of regular exercise imposed on horses.
Table 7b – Dietary and performance assumptions.
1 These values apply to horses 18 months of age or older that are not pregnant or lactating. The representative number applies to 500 kg horses and the range representshorses from 400 to 600 kg.
2 ‘‘Sedentary’’ would apply to horses not receiving any imposed exercise. Dietary inputs are based on minimum nutrient requirements specified in ‘‘Nutrient Requirementsof Horses’’ (NRC, 1989).
3 ‘‘Intense’’ represents horses used for competitive activities such as racing. Dietary inputs are based on a survey of race horse feeding practices (Gallagher et al, 1992)and typical feed compositions (forage = 50% alfalfa, 50% timothy; concentrate = 30% oats, 70% mixed performance horse concentrate).
ASAE D384.2 MAR200510 ASAE STANDARDS 2005

7.0 Equations for As-Excreted Manure CharacteristicsEstimates for Poultry (Broilers, Turkeys, and Ducks)7.1 Fundamental ModelNutrient Excretion = Feed Nutrient Intake 2 Nutrient Retention7.2 See 2.0 CautionSee Table 8, Definition of Input Variables – As excreted – Poultry(Broilers, Turkeys, and Ducks).
7.3 Equations for Estimating Excretions – See Table 9 – RetentionFactors for Broilers, Turkeys, and Ducks.7.3.1 Dry Matter Excretion Equation
DME–PH 5 FIPH * 0.88 * (1 – DMRF) (1)
DME–T 5 Sn
x51 FIx * 0.88 * ~1 – DMRF! (2)
7.3.2 Nitrogen Excretion Equation
NE–PH 5 [FIPH * (Ccp / 6.25)] * (1 – NRF) (3)
NE–T 5 Sn
x51[FIx * (Ccp–x / 6.25)] * (1 – NRF) (4)
7.3.3 Phosphorus Excretion Equation
PE–PH 5 (FIPH * Cp) * (1 – PRF) (5)
PE–T 5 Sn
x51~Fx * Cp! * ~1 – PRF! (6)
Note that PRF varies for broilers less than and greater than 32 days ofage.7.3.4 Potassium Excretion Equation
KE–PH 5 (FIPH * CK) * (1 – KRF) (7)
KE–T 5 Sn
x51(Fx * CK) * (1 – KRF) (8)
7.4 Manure Characteristics Based Upon Typical Performance andDiets – See Tables 10a and 10b.7.5 References7.5.1 Applegate,T., L. Potturi, R. Angel. 2003. Model for EstimatingPoultry Manure Nutrient Excretion: A Mass Balance Approach.Proceedings of the International Symposium for Animal, Agricultural, andFood Processing Wastes IX. ASAE. St. Joseph, MI. 296–302.7.5.2 Angel, R., T. Applegate, S. Bastyr. 2003. Comparison of Twomethods for Estimating Broiler Manure Nutrient Excretion: BiologicalMass Balance Versus Model Based on Mass Balance Approach.Proceedings of the International Symposium for Animal, Agricultural, andFood Processing Wastes IX. ASAE. St. Joseph, MI. 303–309.
Table 8 – Definition of Input Variables – As Excreted – Poultry (Broilers, Turkeys, and Ducks) – Section 7.
7.3.5 Table 9 – Retention Factors for Broilers, Turkeys, and Ducks.
ASAE D384.2 MAR2005ASAE STANDARDS 2005 11

8.0 Equations for As-Excreted Manure CharacteristicsEstimates for Poultry (Laying Hens)8.1 Fundamental Model
Nutrient Excretion 5 Feed Nutrient Intake 2 Nutrient Retention
The laying hen model varies from other poultry specie to account for eggproduction. As such, the model assumes dry matter retention by the henis equivalent to the sum of energy expenditure for maintenance, heatincrement, and egg production as well as solids content within the egg,as is described below.
8.2 See 2.0 CautionSee Table 11, Definition of Input Variables – As Excreted – Poultry(Laying Hens).
8.3 Equations for Estimating Excretions
8.3.1 Dry Matter Excretion
DME 5 [FI * 0.88] 2$(FI * 0.88 * 0.85)
* [1–($KCALI 2[KCALm 1 KCALh1~KCALe* Eggprod)]%
/KCALi!]1~0.3319 * Eggwt * Eggprod!%
OR (1)
DME 5 [FI * 0.88] 2$(FI * 0.88 * 0.85)
* [1–($KCALI 2@1401~53 * Eggprod!#% / KCALi) ]
1~0.3319 * Eggwt * Eggprod)%
8.3.2 Nitrogen Excretion
NE 5 (FI * Ccp / 6.25) 2(0.0182 * Eggwt * Eggprod) (2)
Table 10a – Estimated typical manure (urine and feces combined) characteristics as excreted based upon equations in Section 7 and assumptions inTable 10b.
1 Total manure is calculated from total solids and assumed moisture of 74%.
Table 10b – Dietary and performance assumptions.
Assumptions: Feed is 88% dry matter.
ASAE D384.2 MAR200512 ASAE STANDARDS 2005

8.3.3 Phosphorus Excretion
PE 5 (FI * CP) 2(0.0024 * Eggwt * Eggprod) (3)
8.3.4 Calcium Excretion
CaE 5 (FI * CCa) 2(0.00383 * Eggwt * Eggprod) (4)
8.4 Assumptions: Diet contains 15% ash content and corrects dietenergy retention to an ash-free, dry matter basis. Egg contains 33.19%solids, 1.82% N, 0.24% P, & 3.83% Ca. DM retention by hen is equivalent
to energy expenditure for maintenance (100 kcal/hen, NRC, 1994;Lasiewski and Dawson, 1967), heat increment (40 kcal; NRC, 1994;MacLeod and Jewitt, 1988), and egg production (53 kcal/egg; NRC,1994).8.5 Manure Characteristics Based Upon Typical Performance andDiets – See Tables 12a and 12b.8.6 References8.6.1 Applegate, T., L. Potturi, R. Angel. 2003. Model for EstimatingPoultry Manure Nutrient Excretion: A Mass Balance Approach.
Table 11 – Definition of Input Variables – As Excreted – Poultry (Laying Hens) – Section 8.
Table 12a – Estimated typical manure (urine and feces combined) characteristics as excreted based upon equations in Section 8 and assumptions inTable 12b.
1 Total manure is calculated from total solids and assumed moisture of 75%.
Table 12b – Dietary and performance assumptions.
ASAE D384.2 MAR2005ASAE STANDARDS 2005 13

Proceedings of the International Symposium for Animal, Agricultural, andFood Processing Wastes IX. ASAE. St. Joseph, MI. 296–302.
9.0 Equations for As-Excreted Manure CharacteristicsEstimates for Swine9.1 Fundamental Model
Nutrient Excretion 5 Nutrient Feed Intake 2Nutrient Retention
9.2 See 2.0 CautionSee Table 13, Definition of Output Variables (using all swinegroups).
9.3 Equations for Estimating Excretions– See Table 14, InputVariables—Grow-finish Pigs (20 to 120kg).
9.3.1 Nutrient and Solids Excretion—Grow-finish Pigs (20 to 120 kg)
NE–T 5 NI2T 2 NR–T (1)
PE–T 5 PI–T 2PR–T (2)
DME–T 5 [CDM * FIG * (100–DMD) / 10,000]
[email protected] * DOFG * ~20 * BWAVG12,100 !# (3)
9.3.2 Nutrient Intake – Grow-finish Pigs (20 to 120 kg)
NI–T 5 ADFIG * CCP * DOFG / 625 OR FIG * CCP / 625 (4)
PI–T 5 ADFIG * CP * DOFG / 100 OR FIG * CP / 100 (5)
Table 14 – Input Variables—Grow-finish Pigs (20 to 120 kg) – Section 9.3.
Table 13 – Definition of Output Variables (used for all swine groups) – Section 9.
ASAE D384.2 MAR200514 ASAE STANDARDS 2005

9.3.3 Nutrient Retention – Grow-finish Pigs (20 to 120 kg)1
NR–T 5 [(BWF * DPF * FFLPF) / 159.4]
2$BWI * [DPF 20.05 * (BWF 2BWI)]
* @FFLPF 1 0.07 * ~BWF 2BWI!#% / 159.4 (6)
PR–T 5 (0.2256 * NRT) 2 [8.0 * 10 26 * NRT * (WBNI 1 WBNF)](7)
WBNF 5 (BWF * DPF * FFLPF) / 159.4 (8)
WBNI 5 BWI * $DPF 2[0.05 * (BWF 2BWI)]%
* $FFLPF 1 @0.07 * ~BWF 2BWI!#% /159.4 (9)
Daily excretion of solids, nitrogen and phosphorus can be estimated bydividing total excretion estimated above by days on feed for the grow-finish phase (DOFG).9.4 Equations for Estimating Excretions – See Table 15, Definitionof Input Variables – Weanling Pigs (5 to 20kg).
9.4.1 Nutrient and Solids Excretion—Weanling Pigs (5 to 20 kg)1
NE–T 5 NI–T 2NR–T (1)
PE–T 5 PI–T 2PR–T (2)
DME–T 5 CDM * ADFIN * DOFN * (100–DMD) / 10,000 1 (3)
9.4.2 Nutrient Intake – Weanling Pigs (5 to 20 kg)
NI–T 5 ADFIN * CCP * DOFN / 625 OR FIN * CCP / 625 (4)
PI–T 5 ADFIN * CP * DOFN / 100 OR FIN * CP / 100 (5)
9.4.3 Nutrient Retention – Weanling Pigs (5 to 20 kg) 2
NR–T 5 DOFN * FFLGG * [email protected] * ~BWF–N
1 BWI–N!#% / 125.8 (6)
PR–T 5 4.7494 * (BWF–N 2BWI–N) (7)
1 P retention based on relation to N (Jongbloed, 1987).
1 Dry matter excretion in feces only.2 P retention based on relation to N (Jongbloed, 1987).
Table 15 – Definition of Input Variables - Weanling Pigs (5 to 20 kg) – Section 9.4.
Table 16 – Input Variables - Gestating Sows – Section 9.5.
ASAE D384.2 MAR2005ASAE STANDARDS 2005 15
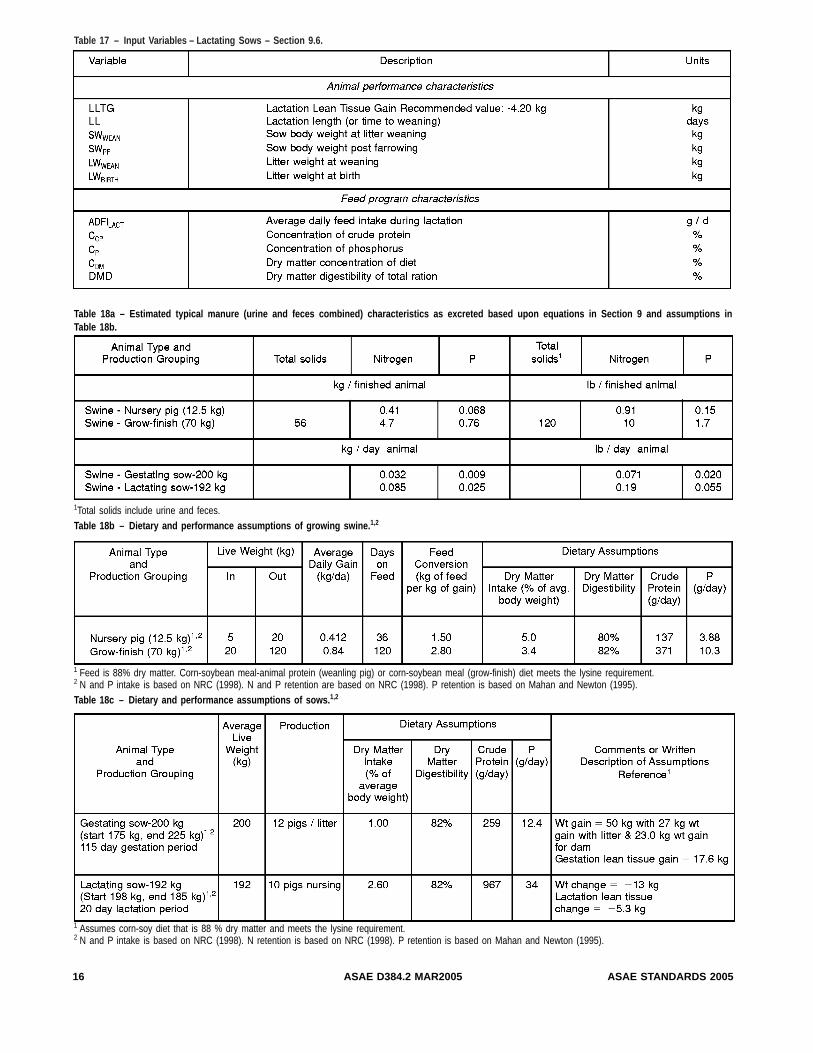
Table 17 – Input Variables – Lactating Sows – Section 9.6.
Table 18a – Estimated typical manure (urine and feces combined) characteristics as excreted based upon equations in Section 9 and assumptions inTable 18b.
1Total solids include urine and feces.Table 18b – Dietary and performance assumptions of growing swine. 1,2
1 Feed is 88% dry matter. Corn-soybean meal-animal protein (weanling pig) or corn-soybean meal (grow-finish) diet meets the lysine requirement.2 N and P intake is based on NRC (1998). N and P retention are based on NRC (1998). P retention is based on Mahan and Newton (1995).Table 18c – Dietary and performance assumptions of sows. 1,2
1 Assumes corn-soy diet that is 88 % dry matter and meets the lysine requirement.2 N and P intake is based on NRC (1998). N retention is based on NRC (1998). P retention is based on Mahan and Newton (1995).
ASAE D384.2 MAR200516 ASAE STANDARDS 2005

Tabl
e19
–As
-Rem
oved
Man
ure
Prod
uctio
nan
dCh
arac
teris
tics.
The
num
bers
inpa
rent
hesi
sar
eco
effic
ient
sof
varia
tion.
ASAE D384.2 MAR2005ASAE STANDARDS 2005 17

Daily excretion of solids, nitrogen and phosphorus can be estimated bydividing total excretion estimated above by days on feed for nurseryphase (DOFN).9.5 Equations for Estimating Excretions – See Table 16, InputVariables – Gestating Sows.9.5.1 Nutrient and Solids Excretion – Gestating Sows1
NE–T 5 NI–T 2NR–T (1)
PE–T 5 PI–T 2PR–T (2)
DME–T 5 CDM * ADFIS * GL * ~100 – DMD! / 10,000
5 CDM * ADFIS * 0.0115 * (100 – DMD)1 (3)
9.5.2 Nutrient Intake – Gestating Sows1
NI–T 5 ADFIS * CCP * GL / 625 5 ADFIS * CCP * 0.184 (4)
PI–T 5 ADFIS * CP * GL / 100 5 ADFIS * CP * 1.15 (5)
9.5.3 Nitrogen Retention – Gestating Sows2
NR–T 5 (GLTG 3 36.8) 1 ~LITTER 3 39.1 ! (6)
PR–T 5 93.039 1 $3.9717 3 @~SWPF 2SWB!
2~2.277 * LITTER!#%
1~LWBirth 3 5.7 ! 1 $@~2.277 3 LITTER!
2LWBirth# 3 0.80% (7)
Note: NR–T accounts for nitrogen retention in maternal weight gain andthe developing litter. PR–T considers phosphorus retention in maternalweight gain, developing litter and placenta tissue.Daily excretion of solids, nitrogen and phosphorus can be estimated bydividing total excretion estimated above by gestation length (GL) in days.9.6 Equations for Estimating Excretions – See Table 17, InputVariables – Lactating Sows.9.6.1 Nutrient and Solids Excretion – Lactating Sows
NE–T 5 NI–T 2NR–T (1)
PE–T 5 PI–T 2PR–T (2)
DME–T 5 CDM * ADFIL * LL * (100–DMD) / 10,00 (3)
9.6.2 Nutrient Intake – Lactating Sows
NI–T 5 ADFILACT * CCP * LL/625 (4)1 Dry matter excretion in feces only.2 Assumes gestation period length of 115 days. 1 Dry matter excretion in feces only.
Table 20 – ReferencesThe numbers in the table are rounded averages gathered from across the U.S. They are best estimate interpretations based on the research data collected.
ASAE D384.2 MAR200518 ASAE STANDARDS 2005

PI–T 5 ADFILACT * CP * LL/100 (5)
9.6.3 Nutrient Retention – Lactating Sows
NR–T 5 [36.83LLTG]1~LWWEAN 3 32 ! 2~LWBIRTH 3 36.8 ! (6)
PR–T 5 [(SWWEAN 3 4.84) 2(SWPF 3 5.28)]
1@~LWWEAN 3 6.4) 2(LWBIRTH 3 5.7)] (7)
Daily excretion of solids, nitrogen and phosphorus can be estimated bydividing total excretion estimated above by lactation length (LL) in days.9.7 Manure Characteristics Based Upon Typical Performance andDiets – See Tables 18a, 18b, and 18c.9.8 References9.8.1 Carter, S., G. Cromwell, P. Westerman, J. Park, and L. Pettey.2003. Prediction of Nitrogen, Phosphorus, and Dry Matter Excretion bySwine Based on Diet Chemical Composition, Feed Intake, and NutrientRetention. Proceedings of the International Symposium for Animal,Agricultural, and Food Processing Wastes IX. ASAE. St. Joseph, MI.285–295.
10.0 As-Removed Manure Production andCharacteristics10.1 Many physical, chemical, and biological processes can altermanure characteristics from its original as-excreted form. Theas-removed manure production and characteristics values reported inthis table allow for common modifications to excreted manure (Section 3)resulting from water addition or removal, bedding addition, and/ortreatment processes. These values represent typical values based onavailable data sources (see end of Section 10). The variances on thedata presented in Section 10, As-Removed Manure Production andCharacteristics, are significantly high, and strongly correlated to thegeographic location and the type of manure management system in use.These estimates may be helpful for individual farm long-term planningprior to any samples being available and for planning estimatesaddressing regional issues. Whenever possible, site-specific samples orother more localized estimates should be used in lieu of national tabularestimates. This table should not be used to develop individual yearnutrient management plans for defining field specific applicationrates, unless absolutely no site-specific manure analysis data areavailable.
Where site-specific data are unavailable, this table may provide initialestimates for planning purposes until site-specific values are available.See Tables 19 and 20.10.2 References (continued)10.2.1 Barker, J.C., J.P. Zublena, C.R. Campbell. 1994. Unpublishedcompilation of manure samples of all species and facilities. NorthCarolina State Univ. Raleigh, N.C.10.2.2 Stram, T.D., J.P. Harner, D.V. Key, and J.P. Murphy. 2000.Nutrients available from dairy lagoons and sand-laden manure.Presented at Mid Central Meeting of ASAE. ASAE paper MC00-12010.2.3 Collins, E.R., T.A. Dillaha, and H.W. Roller. 1989. Dairy manuremanagement. NRAES-3110.2.4 Lorimor, J.C., and H. Xin. 1999. Manure production and nutrientconcentrations from high-rise layer houses. ASAE Trans. 15(4): 337-34010.2.5 Patterson, P.H. and E.S. Lorenz. 1996. Manure nutrientproduction from commercial white leghorn hens. Applied Poultry ScienceResearch report.10.2.6 Lorimor, J.C., W. Powers, A. Sutton. 2000. Manurecharacteristics. MWPS18-Section 1. Midwest Plan Service. Ames, IA.10.2.7 Lorimor, J.C., 1999. Managing manure nutrients for cropproduction. ISU Extension publication Pm-1811. Ames, IA.10.2.8 Chastain, J.P. 2002. Nutrient content of swine manure asremoved. Unpublished data compiled by the author.10.2.9 Erickson, G.A., T. Klopfensteein, D. Walters, and G. Lesoing.1998. Nutrient balance of nitrogen, organic matter, phosphorus and sulfurin the feedlot. Nebraska Beef Report, Univ. of Neb. Lincoln, NB.10.2.10 Ward Lab. 2003 data accumulated from commercial lab. (603samples)10.2.11 Lorimor, J.C. 2003. Unpublished data compiled by author onearthen beef feedlots in IA.10.2.12 Jaranilla-Sanchez, P.A., J.C. Lorimor, and J. Boeding. 2003.Manure Accumulation in a Deep Pit Finishing Building. Presented at MidCentral Meeting of ASAE. ASAE paper MC03-403.10.2.13 Bicudo, J. 2003. Compilation of unpublished data. Numberswere based on analyses of stall waste made in KY, TX, CO, Alberta(Canada), OK, and WA.10.2.14 Ye, W. 2003. Application of near-infrared spectroscopy fordetermination of nutrient contents in manure. Ph.D. dissertation, IowaState University.
ASAE D384.2 MAR2005ASAE STANDARDS 2005 19