asas-sn search for optical counterparts of gravitational
TRANSCRIPT

MNRAS 000, 1–11 (2021) Preprint 22 August 2021 Compiled using MNRAS LATEX style file v3.0
ASAS-SN search for optical counterparts of gravitational-waveevents from the third observing run of Advanced LIGO/Virgo
T. de Jaeger1★, B. J. Shappee1, C. S. Kochanek2,3, K. Z. Stanek2,3, J. F. Beacom4,2,3,T. W.-S. Holoien5†, Todd A. Thompson2,3, A. Franckowiak6, S. Holmbo71 Institute for Astronomy, University of Hawaii, 2680 Woodlawn Drive, Honolulu, HI 96822, USA.2 Department of Astronomy, The Ohio State University, 140 W. 18th Avenue, Columbus, OH 43210, USA.3 Center for Cosmology and AstroParticle Physics (CCAPP), The Ohio State University, 191 W. Woodruff Avenue, Columbus, OH 43210, USA.4 Department of Physics, The Ohio State University, 191 W. Woodruff Ave., Columbus, OH 43210, USA.5 The Observatories of the Carnegie Institution for Science, 813 Santa Barbara St., Pasadena, CA 91101, USA.6 Fakultät für Physik & Astronomie, Ruhr-Universität Bochum, D-44780 Bochum, Germany.7Department of Physics and Astronomy, Aarhus University, Ny Munkegade 120, DK-8000 Aarhus C, Denmark.
ABSTRACTWe report on the search for electromagnetic counterparts to the nine gravitational-wave eventswith a >60% probability of containing a neutron star during the third (O3) LIGO-Virgo Collab-oration (LVC) observing run with the All-Sky Automated Survey for SuperNovae (ASAS-SN).No optical counterparts associated with a gravitational wave event was found. However, thanksto its network of telescopes, the average area visible to at least one ASAS-SN site during thefirst 10 hours after the trigger contained ∼30% of the integrated source location probability.Through a combination of normal operations and target-of-opportunity observations, ASAS-SN observations of the highest probability fields began within one hour of the trigger for fourof the events. After 24 hours, ASAS-SN observed >60% of total probability for three eventsand >40% for all but one of the events. This is the largest area coverage to a depth of 𝑔 = 18.5mag from any survey with published coverage statistics for seven of the nine events. With itsobserving strategy, five sites around the world, and a large field of view, ASAS-SN will be oneof the leading surveys to optically search for nearby neutron star mergers during LVC O4.
Key words: galaxies: survey — gravitational waves — merger: black holes, neutron stars
1 INTRODUCTION
Since the beginning of astronomy, we have used electromagnetic(EM) radiation to explore and understand our Universe. Gravita-tional waves (GW) opened a new window for astronomy with thefirst-ever direct observation of GW on September 14, 2015 by twodetectors of the Laser Interferometer Gravitational-Wave Observa-tory (LIGO; Aasi et al. 2015; Abbott et al. 2016a). Since this firstGW detection, ∼70 events have been observed, with a majority dueto merging black holes (BH-BH; Abbott et al. 2019, 2020a). In clas-sical general relativity, BH-BH mergers are generally not expectedto have EM counterparts (Abbott et al. 2016b). No confirmed coun-terparts have been detected for any of BH-BH mergers seen to date(but see Graham et al. 2020 for a possibility), although several the-oretical studies have suggested possible EM emission mechanisms(e.g., Palenzuela et al. 2010; Moesta et al. 2012).
Unlike BH-BH mergers, binary neutron star merger (BNS)
★ E-mail: [email protected]† NHFP Einstein Fellow
mechanisms are expected to yield an optical counterparts pow-ered by the radioactive decay of rapid neutron capture process (r-process) elements synthesised in the merger ejecta (Li & Paczyński1998; Metzger et al. 2010) or by the cooling of shock-heated ma-terial around the neutron star (Piro & Kollmeier 2018). On August17, 2017, the LVC detected the first and best example of a BNSmerger: GW170817 (Abbott et al. 2017a). Only two seconds afterits detection, a short gamma-ray burst (GRB170817A) was detected(Connaughton et al. 2017; Goldstein et al. 2017). GRB170817Awas followed by the discovery of the optical counterpart SSS17a(AT2017gfo) ∼11 hours later in the galaxy NGC 4993 (Coulteret al. 2017) and later confirmed by others teams (Smartt et al. 2017;Arcavi et al. 2017; Soares-Santos et al. 2017; Valenti et al. 2017).
The combination of EM and GW information on the BNScan be used to constrain the mass and the radii of NS (Margalit &Metzger 2017) or their equation of state (Bauswein & Janka 2012;Annala et al. 2018). Also, observations of the optical-IR “kilonova”counterpart (Chornock et al. 2017; Cowperthwaite et al. 2017;Droutet al. 2017; Kilpatrick et al. 2017; Nicholl et al. 2017; Shappee et al.2017; Valenti et al. 2017; Villar et al. 2017), provided the firstobservational confirmation that NS mergers produce the majority
© 2021 The Authors
arX
iv:2
108.
0483
9v1
[as
tro-
ph.H
E]
10
Aug
202
1

2 de Jaeger et al.
of the r-process elements heavier than iron (Burbidge et al. 1957;Cameron 1957; Kasen et al. 2017; Pian et al. 2017; Metzger 2019).They also permit tests of theoretical kilonova models. For example,Drout et al. (2017) showed that the temperatures cooled from 10,000K to 5,100 K in between 12 and 36 hours after the event, confirmingmodel predictions. Also, Shappee et al. (2017) used spectra taken11.76 and 12.72 hours after the merger to show that the photospherewas expanding at ∼0.3 c.
Mergers with optical counterparts can also be used as stan-dard sirens, allowing source distances to be measured directly(Schutz 1986). From only a single EM GW counterpart detection(GW170817), Abbott et al. (2017b) derived a Hubble constant of70+12−8 km s
−1Mpc−1. Finally, any arrival time differences betweenthe EM and GW signals test for propagation velocity differencesthat probe the nature of dark energy and can rule out theoreticalmodels (Ezquiaga & Zumalacárregui 2017; Sakstein & Jain 2017;Rubin et al. 2020).
Advanced LIGO (Aasi et al. 2015) and Advanced Virgo (Ac-ernese et al. 2015) started their third observing run (O3) to searchfor GW sources in April 2019. Even though the hunt was stoppeda month early due to the COVID-19 pandemic, an increase in sen-sitivity during O3 (Buikema et al. 2020) allowed the discoveryof more than 56 events in 330 days, including nine with a highprobability of having at least one NS. Unlike O1 and O2, LVC O3had a public alert system that automatically sent alerts within min-utes of the GW detections, allowing all astronomers to search forEM counterparts. Following the successful observations of SSS17a(GW170817), many surveys participated in the searches for GWoptical counterparts during the LVC O3 run. These surveys in-clude: the All-Sky Automated Survey for Supernovae (ASAS-SN;Shappee et al. 2014), the Asteroid Terrestrial-impact Last AlertSystem (ATLAS; Tonry et al. 2018), the Dark Energy Camera(DECam; Flaugher et al. 2015), the Electromagnetic counterpartsof gravitational wave sources at the Very Large Telescope (EN-GRAVE; Levan & Jonker 2020), the Gravitational-wave OpticalTransient Observer (GOTO; Dyer et al. 2018), the Global RapidAdvanced Network Devoted to the Multi-messenger Addicts survey(GRANDMA; Antier et al. 2020), the Katzman Automatic ImagingTelescope (KAIT; Filippenko et al. 2001), the Panoramic SurveyTelescope and Rapid Response System (Pan-STARRS; Chamberset al. 2016), the Searches After Gravitational-waves Using ARi-zona Observatories (SAGUARO; Lundquist et al. 2019), SkyMap-per (Chang et al. 2021), and the Zwicky Transient Facility (ZTF;Bellm et al. 2019).
During the LVC O3, more than 1,500 Gamma-ray CoordinatesNetwork circulars (GCN) were published to report EM counter-part searches and potential candidates. Approximately sixty ob-servatories were involved in the optical follow-ups, yielding ∼388candidate counterparts (Coughlin 2020). Unfortunately, no opticalcounterparts were linked to a GW event. This shows the unique-ness of SSS17a (GW170817; Abbott et al. 2017a): a near perfectcombination of a small 28 square degrees high probability local-isation region and a distance of only 40+14−8 Mpc. In comparison,the events with a > 60% probability of containing a NS in LVCO3 had an average 90% confidence localisation of ∼4,700 squaredegrees and an average distance of ∼330 Mpc (see Table 1). Thisexplains why searches for EM counterparts in O3 were challengingand unsuccessful.
Several groups participating in searches for GW optical coun-terparts during LVC O3 run have already published an overview oftheir strategy: GOTO (Gompertz et al. 2020), GRANDMA (Antieret al. 2020), SAGURO (Paterson et al. 2021), and ZTF (Coughlin
et al. 2020a,b; Kasliwal et al. 2020a). These studies describe bothindividual events and the lessons learned from LVC O3 to preparefor LVCO4 (starting in ∼June 2022). For example, one concern thatshould be addressed by the GW community is the lack of follow-upfor a large number of candidates even as several candidates wereclassifiedmultiple times by different groups (Coughlin et al. 2020b).
In this paper, we present a summary of the ASAS-SN obser-vational strategy during the LVC O3 run and show that, thanks toour five sites spread over the world, the majority of the events wereobservable from at least one ASAS-SN site soon after their dis-covery. In section 2, we describe ASAS-SN characteristics and ourobservational strategy. In section 3, we present all the LVC eventsfor which ASAS-SN obtained data during the O3 run, and finally,we discuss our results in section 4 and conclude in Section 5.
2 THE ASAS-SN STRATEGY
ASAS-SN is the first and still the only ground-based survey tomap the entire visible sky daily to a depth of 𝑔 = 18.5 mag(Shappee et al. 2014; Kochanek et al. 2017). Currently, ASAS-SNis composed of five stations: Brutus, the original ASAS-SN unit,located on Haleakala in Hawaii (USA); Cassius and Paczynski,both situated at Cerro Tololo International Observatory (CTIO) inChile; Leavitt atMcDonald Observatory in Texas (USA), and finallyPayne-Gaposchkin at the South African Astrophysical Observatory(SAAO) in Sutherland, South Africa. All units are hosted by the LasCumbres Observatory Global Telescope network (LCOGT; Brownet al. 2013) and consist of four 14-cm aperture Nikon telephotolenses, each with a 4.47 by 4.47-degree field-of-view. ASAS-SNsurvey operations are composed of three dithered 90 second ex-posures using a 𝑔-band filter (all five units) with ∼15 seconds ofoverheads between each image, for a total of 315 seconds per field.Thanks to the five stations, the instantaneous field of view is roughly360 square degrees. Note that we will refer to the estimated loca-tion of a GW event as the search region. In practice, the searchregion is defined by probabilities, and unless otherwise specified,we are considering the region enclosing 90% of the probability forthe event location. We try to observe fields in order of their averageprobability of containing the event.
In Figure 1, we show the fraction of the search region visibleto ASAS-SN as a function of time for all the LVC O3 events witha > 60% probability that at least one of the compact objects is aNS. For all events, a large percentage of the search region (∼30%)is visible at least once within the first 24 hours. For example, lessthan one hour after the LVC alert, over 35% of the search regionwas visible for five events while only three were under 15% andone region was not visible at all. This allows ASAS-SN to respondpromptly to almost all the LVC alerts independent of the time orlocalisation.
To maximise our chance of observing an optical counterpart ofGW sources, ASAS-SN has a Target-of-Opportunity mode (ToO)to enable rapid imaging follow-up. Our automated system receivesall LVC alerts using the GCN protocol along with the IceCube real-time alerts (Aartsen et al. 2017). For all the GW events with either a(HasNS)> 60% probability of containing a NS or a distance smallerthan 100 Mpc and a < 40% probability of being terrestrial, a list ofthe 30 pointings (each pointing corresponds to four cameras/fields,so 70 square degrees) with the highest localisation probability isautomatically generated and the ToO observations start. After thefirst hour in ToO mode, the routine survey is optimised to increasethe cadence of the fields in the search region. For example, during
MNRAS 000, 1–11 (2021)

Searching for electromagnetic counterparts of gravitational-wave events with ASAS-SN 3
0 1 2 4 8 12 16 20 24Time since LIGO event [hours]
0%
20%
40%
60%
80%
100%
Pro
ba
bili
tyo
bse
rva
ble
wit
hA
SA
S-S
N
S190425z
S190426c
S190901ap
S190910d
S190923y
S191205ah
S191213g
S200115j
S200213t
Figure 1. Instantaneous probability observable byASAS-SN versus the timein hours since the LVC alert.
the LVCO3 run, pointingswithin the highest probability regionwereobserved 4–5 times in 24 hours. All the images obtained from theToO or the normal survey are processed and analysed in real-time,and the interesting optical counterpart candidates are reported toGCN. As described in Section 3, no good candidates were detectedand reported for the LVC O3. A schematic summary of the strategyis displayed in Figure 2.
Finally, as a galaxy-targeted strategy is more suitable for tele-scopes with a small field-of-view, a list of nearby galaxies (< 100Mpc) is sent simultaneously to a group of dedicated amateur as-tronomers with whom ASAS-SN collaborates during normal oper-ation to confirmASAS-SNdiscoveries. Nearby galaxies are selectedfrom the Gravitational Wave Galaxy Catalog (White et al. 2011), acatalogue of 53,255 galaxies with high completeness to 100 Mpcand ranked by the probability that a particular galaxy hosts a GWevent (𝑃gal). The final probability is taken from Coulter et al. (2017)and depends on the search region (𝑃2D), the galaxy and event dis-tances (𝐷gal and 𝐷LVC respectively), the galaxy luminosity (��𝐵),and a normalisation factor (𝑘):
𝑃gal = 𝑘−1 × ��𝐵 × 𝑃2D × ©«1 − erf ©«|Dgal − DLVC |
𝜎2D, gal + 𝜎2D, LVC
ª®¬ª®¬ (1)
Given the completeness of the Gravitational Wave Galaxy Catalogand the large distance estimates for all of the LVC O3 events, it isunsurprising that the amateur astronomers did not find anything thiscycle. They will continue to search in future observing runs.
3 EW FOLLOW-UP
In this section, we describe each of the nine events announced forthe LVC O3 run that passed our selection criterion as described inSection 2. For the nine events, all having a (HasNS)> 60% proba-bility of containing a NS, we obtained data from a combination ofnormal operations and an optimisation of our observational strategyto observe the search region with a higher cadence. For all the eventspresented in this section, we use the initial localisation map fromthe BAYESian TriAngulation and Rapid localization (BAYESTAR;Singer & Price 2016). A list of those events together with theirprincipal characteristics is given in Table 1.
3.1 S190425z
S190425z was the first BNS detection of the LVC O3 run. It wasdetected on 2019April 25 at 08:18:05 UTC by the Advanced LIGO-Livingston detector (LIGO Scientific Collaboration & Virgo Col-laboration 2019a) with a false alarm rate of 1 in ∼70,000 yr anda > 99% probability of being a BNS. The first search region wasan extended area spanning 10,183 square degrees and the estimateddistance was 155 ± 45 Mpc. Due to the success of the GW170817optical counterpart hunt and because S190425z was the first eventwith a high probability of having an optical counterpart, an intensefollow-up campaign started a few seconds after the LVC alert, lead-ing to a total of 120 GCN circulars, including two from ASAS-SN(Shappee et al. 2019a,b).
In Figure 3, we show the search region covered by ASAS-SNfrom its five sites. The ASAS-SN response was fast and in less thanone hour after the alert, 10% of the total search region was alreadymapped through triggered observations to a 5𝜎 𝑔-band limitingmagnitude of ∼18.5 mag. After 24 hours, ∼70% of the integratedLVC localisation probability was covered through a combinationof normal operations and triggered observations. For comparison,ATLAS covered a sky region totalling of 37.2% of the event’slocalisation likelihood in ∼6 hours (McBrien et al. 2019), GOTOcovered 29.6% in 9 hours (Steeghs et al. 2019a), Pan-STARRScovered 28% in ∼19 hours (Smith et al. 2019), and ZTF covered21% in ∼28 hours (Coughlin et al. 2020a). Figure 4 shows theASAS-SN coverage for the 24 hours. As we can see, the normalASAS-SN observation mode was optimised to increase the cadencefor the fields within the search region and we were able to observethose fields 5–6 times over the next day. Finally, in all the searchregion images taken during the first 24 hours, we flagged 421 starsthat had varied, 9 asteroids, and 0 transients.
3.2 S190426c
S190426c was detected by LVC on 2019 April 26 at 15:21:55 UTCwith a false alarm rate of 1 in∼1.6 yr (LIGOScientificCollaboration& Virgo Collaboration 2019b). The classification of the GW sig-nal, in order of descending probability, was BNS (49%), MassGap(24%), terrestrial (14%), NSBH (13%), or BBH (<1%). MassGaprefers to a binary system with at least one compact object whosemass is in the range between NS and BHs, defined as 3–5M� . Thefirst search region spanned∼1,262 square degrees and the estimateddistance was 375 ± 108 Mpc. Due to the nature of the event, a largenumber of teams searched for an optical counterpart and ∼70 GCNcirculars were sent, including one from ASAS-SN (Shappee et al.2019c). As seen in Figure 3 and Figure 5, ASAS-SN mapped ∼90%of the search region in 24 hours. Unlike S190425z, the first fieldswere observed 1.5 hours after the GW detection due to Sun con-straints. Of the nine events presented in this paper, S190426c is theone with the most ASAS-SN observations, with up to 13 epochsover less than 24 hours for the fields within the search region. Thisdemonstrates howwe can change theASAS-SN strategy in real-timeand go deeper to discover fainter candidates. For the high cadencefields, we reached a 𝑔-band limiting magnitude of ∼19.8 mag. Aswith S190425z, ASAS-SN covered one of the largest areas in 24hours with respect to other major surveys: GOTO covered 54% ofthe source location probability in 9 hours but started ∼ 6 hours afterthe discovery (Steeghs et al. 2019b) while ZTF covered 75% of thesky localisation but in 31 hours and starting 13 hours after the alert(Coughlin et al. 2020a). In all the search region images taken during
MNRAS 000, 1–11 (2021)

4 de Jaeger et al.
Classification ProbabilityEvent Date 90% sky area Distance FAR HasNS BH-BH NSBH BNS MassGap Terrestrial Prob. cov GCN
UTC deg2 Mpc yr−1 [%] [%] [%] [%] [%] [%] [%]
S190425z April 25, 2019, 08:18:05 10183 155 (45) 1.43 × 10⁻⁵ >99 <1 <1 >99 <1 0 67 24168S190426c April 26, 2019, 15:21:55 1262 375 (108) 0.61 >99 <1 13 49 24 14 85 24237S190901ap Sept. 1, 2019, 23:31:01 13613 242 (81) 0.22 >99 <1 <1 86 <1 14 58 25606S190910d Sept. 10, 2019, 01:26:19 3829 606 (197) 0.12 >99 <1 98 <1 <1 2 52 25695S190923y Sept. 23, 2019, 12:55:59 2107 438 (133) 1.51 >99 <1 68 <1 <1 32 44 25814S191205ah Dec. 5, 2019, 21:52:08 6378 385 (164) 0.39 >99 <1 93 <1 <1 7 42 26350S191213g Dec. 13, 2019, 04:34:08 1393 195 (59) 1.12 >99 <1 <1 77 <1 23 1 26402S200115j Jan. 15, 2020, 04:23:09 908 331 (97) 6.61 × 10⁻⁴ >99 <1 <1 <1 >99 <1 63 26759S200213t Feb. 13, 2020, 04:10:40 2587 224 (90) 0.56 >99 <1 <1 63 <1 37 42 27042
Table 1. Characteristics of the LVC events triggered by ASAS-SN during the O3 run. In the first column the event name, followed by its discovery date inUTC are listed. In column 3 we list the sky area in square degrees of the search region. In columns 4 and 5 we list the distance in Mpc together with itsuncertainty and their False Alarm Rate (FAR) in year−1. In column 6, we list the probability that the lighter compact object has a mass < 3 solar masses whilein columns 7, 8, 9, 10, and 11 give the classification probabilities of the GW signal. Column 12 is the fraction of the probability that ASAS-SN covered in24 hours. Finally, GCN circular reference is given in the last column. All the parameters were taken from the Gravitational-Wave Candidate Event Database(https://gracedb.ligo.org/superevents/public/O3/).
ALERTLIGO/Virgo
ASAS-SNToO
mode
NormalASAS-SN
mode
< 1h
Trigger fields with highest probability
Send list of nearby galaxies to amateurs
(up to 100 Mpc)
Increase the cadence for fields in 90 % probability region
Process/analyseimages in real
time
REPORT CANDIDATES
TO GCNHas NS> 0.6
NO
No follow-up
YES
Has Terrestrial< 0.6 &
distance < 100 Mpc
NO
> 1h
YES
Figure 2. ASAS-SN strategy diagram. Our automated system receives a GCN LVC alert and updates the plan of observations to search for optical counterpartsin only a few seconds. If the alert properties meet the triggering criteria, the list of fields/pointings to observe is automatically created and prioritised and allthe images are analysed in real-time. Finally, good candidates are manually reported to GCN.
MNRAS 000, 1–11 (2021)

Searching for electromagnetic counterparts of gravitational-wave events with ASAS-SN 5
0 1 2 4 8 12 16 20 24Time since LIGO event [hours]
0%
20%
40%
60%
80%
100%
Cu
mu
lati
vep
rob
ab
ility
reg
ion
cove
red
by
AS
AS
-SN
S190425z
S190426c
S190901ap
S190910d
S190923y
S191205ah
S191213g
S200115j
S200213t
Figure 3. Cumulative probability covered by ASAS-SN (all sites) versus the time in hours since the LVC alert for the nine events. The white crosses indicatewhen a search region is not visible from any ASAS-SN sites due to the restrictions that (1) the Sun is at least 12 degrees below the horizon, (2) the airmass isat most two, (3) the Hour Angle is at most five hours, and (4) that the minimum distance to the Moon is larger than 20◦.
the first 24 hours, we flagged 1931 variable stars, 79 asteroids, and1 transient, a cataclysmic variable.
3.3 S190901ap
S190901ap was detected on 2019 September 1 at 23:31:01 UTCwith a probability of 86% to be a BNS and 14% to be terres-trial (LIGO Scientific Collaboration & Virgo Collaboration 2019c).However, its large search region of 13,613 square degrees and dis-tance of 242 ± 81 Mpc appears to have discouraged groups fromsearching for an EM counterpart and only ∼40 GCN circulars weresent. For this event, the majority of the observed fields within thesearch region were observed in normal operations, as seen in Figure6, with a median coadded 𝑔-band depth of ∼19.1 mag and somefields reaching ∼19.3 mag. Mostly using normal operations, ASAS-SN covered ∼60% of the search region in 24 hours starting < 1 hourafter the LVC alert (see Figure 3). Compared to other teams thatreported their observations, ASAS-SN covered one of the largestintegrated search probabilities in the first 24 hours. For example,GOTO covered 28% of the search region in 54 hours starting ∼ 0.1
hours after the discovery (Ackley et al. 2019) while ZTF covered73% of the sky localisation but over ∼73 hours and beginning 3.6hours after the detection (Stein et al. 2019; Coughlin et al. 2020a).In all the search region images taken during the first 24 hours, weflagged 106 variable stars, 3 asteroids, and 0 transients.
3.4 S190910d
S190910d was discovered on 2019 September 10 at 01:26:19 UTC(LIGOScientific Collaboration&Virgo Collaboration 2019d). Thisevent was classified as NSBHwith a probability of 98% (terrestrial:2%) and a false alert rate of one in eight years. Only a few teams(∼20 GCN circulars) participated in the follow-up of this objectsituated at 606 ± 197 Mpc with a search region of 3,829 squaredegrees. ASAS-SN covered 50% of the search region in 24 hours(see Figure 3). For the same object, GRANDMA covered 37% in65 hours (Crisp et al. 2019) while ZTF covered 34% in 1.5 hours(Anand et al. 2019). As seen in Figure 7, ASAS-SN obtained amaximum of three epochs for some fields within the search regionand reached a median 𝑔-band depth of ∼17.7 mag with a maximum
MNRAS 000, 1–11 (2021)

6 de Jaeger et al.
0
0
30
30
60
60
90
90
120
120
150
150
210
210
240
240
270
270
300
300
330
330
Right Ascension [deg]
60
30
0
30
60
Dec
linat
ion
[deg
]
0 1 2 3 4 5 6
Number of Epochs
Figure 4. Plate-Carree projection of the ASAS-SN data obtained in thefirst 24 hours for S190425z. The black shaded area corresponds to thelocalisation area and the red ASAS-SN boundaries are the fields selected tobe observed immediately after the event detection. Red filled circle and �markers represent the position of theMoon and Sun respectively. The colourof the field shows the number of epochs observed.
0
0
30
30
60
60
90
90
120
120
150
150
210
210
240
240
270
270
300
300
330
330
Right Ascension [deg]
60
30
0
30
60
Dec
linat
ion
[deg
]
0 1 2 3 4 5 6 7 8 9 10 11 12 13
Number of Epochs
Figure 5. Same as Figure 4, excepted for LVC event S190426c.
0
0
30
30
60
60
90
90
120
120
150
150
210
210
240
240
270
270
300
300
330
330
Right Ascension [deg]
60
30
0
30
60
Dec
linat
ion
[deg
]
0 1 2 3 4
Number of Epochs
Figure 6. Same as Figure 4, excepted for LVC event S190901ap.
0
0
30
30
60
60
90
90
120
120
150
150
210
210
240
240
270
270
300
300
330
330
Right Ascension [deg]
60
30
0
30
60
Dec
linat
ion
[deg
]
0 1 2 3
Number of Epochs
Figure 7. Same as Figure 4, excepted for LVC event S190910d.
0
0
30
30
60
60
90
90
120
120
150
150
210
210
240
240
270
270
300
300
330
330
Right Ascension [deg]
60
30
0
30
60
Dec
linat
ion
[deg
]
0 1 2 3
Number of Epochs
Figure 8. Same as Figure 4, excepted for LVC event S190923y.
of ∼18.4 mag. In all the search region images taken during the first24 hours, we flagged 369 variable stars, 0 asteroid, and 0 transients.
3.5 S190923y
S190923y was detected on 2019 September 23 at 12:55:59 UTC(LIGO Scientific Collaboration & Virgo Collaboration 2019e). Theclassification for this event was 68% NSBH, but with a high prob-ability of being terrestrial (32%). Due to a non-negligible falsepositive rate of one per seven months, a distance of 438 ± 151 Mpc,and a search region of 2,107 square degrees, half of which was closeto the Moon, only ∼ 15 GNC circulars were sent. As seen in Figure8, ASAS-SN increased the cadence for the fields within the searchregion and obtained a maximum of three epochs for those fields anda median 𝑔-band depth of 18.3 mag. As seen in Figure 3, ASAS-SNcovered ∼40% of the search region in 24 hours with the first fieldsobserved starting ∼4 hours after the discovery due to observabilityconstraints. As ASAS-SN only targets fields more than 20◦ fromthe Moon, only half of the search region was observable. In com-parison, GRANDMA, covered 26% in 55 hours starting ∼4 hoursafter the alert (Turpin et al. 2019). In all the search region imagestaken during the first 24 hours, we flagged 2084 variable stars, 47asteroids, and 0 transients.
MNRAS 000, 1–11 (2021)
Searching for electromagnetic counterparts of gravitational-wave events with ASAS-SN 7
0
0
30
30
60
60
90
90
120
120
150
150
210
210
240
240
270
270
300
300
330
330
Right Ascension [deg]
60
30
0
30
60
Dec
linat
ion
[deg
]
0 1 2 3 4
Number of Epochs
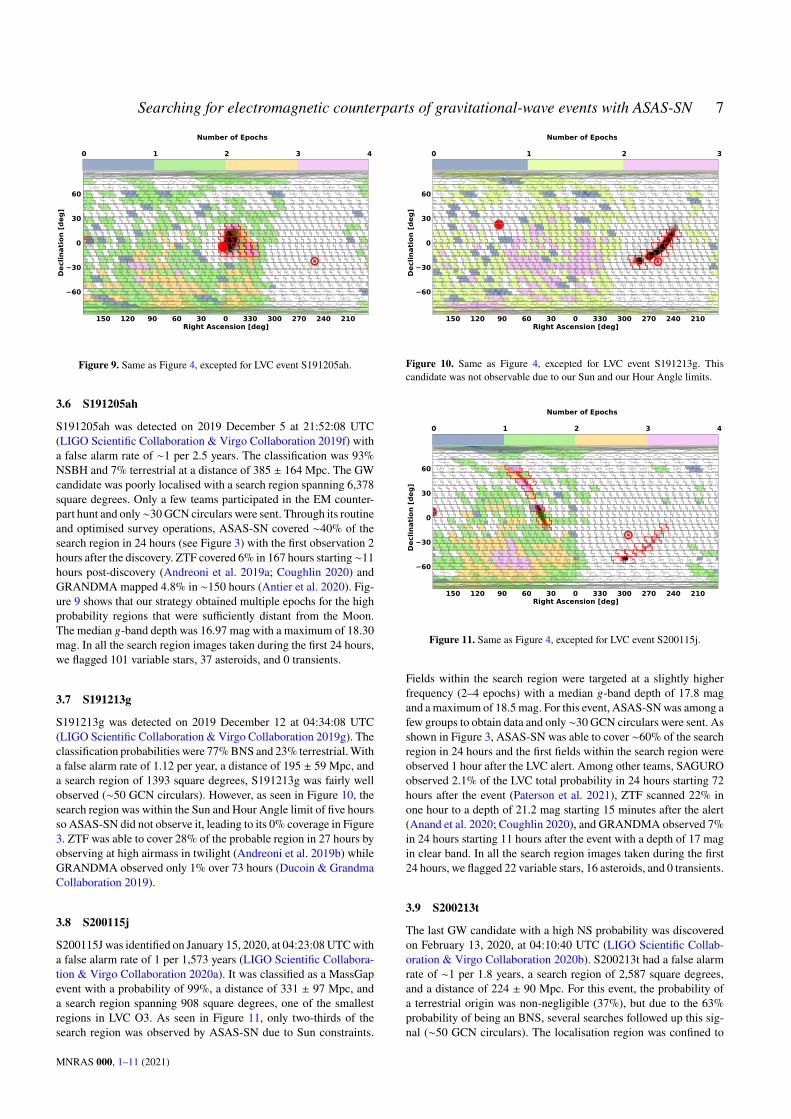
Figure 9. Same as Figure 4, excepted for LVC event S191205ah.
3.6 S191205ah
S191205ah was detected on 2019 December 5 at 21:52:08 UTC(LIGO Scientific Collaboration & Virgo Collaboration 2019f) witha false alarm rate of ∼1 per 2.5 years. The classification was 93%NSBH and 7% terrestrial at a distance of 385 ± 164 Mpc. The GWcandidate was poorly localised with a search region spanning 6,378square degrees. Only a few teams participated in the EM counter-part hunt and only∼30GCN circulars were sent. Through its routineand optimised survey operations, ASAS-SN covered ∼40% of thesearch region in 24 hours (see Figure 3) with the first observation 2hours after the discovery. ZTF covered 6% in 167 hours starting∼11hours post-discovery (Andreoni et al. 2019a; Coughlin 2020) andGRANDMAmapped 4.8% in ∼150 hours (Antier et al. 2020). Fig-ure 9 shows that our strategy obtained multiple epochs for the highprobability regions that were sufficiently distant from the Moon.The median 𝑔-band depth was 16.97 mag with a maximum of 18.30mag. In all the search region images taken during the first 24 hours,we flagged 101 variable stars, 37 asteroids, and 0 transients.
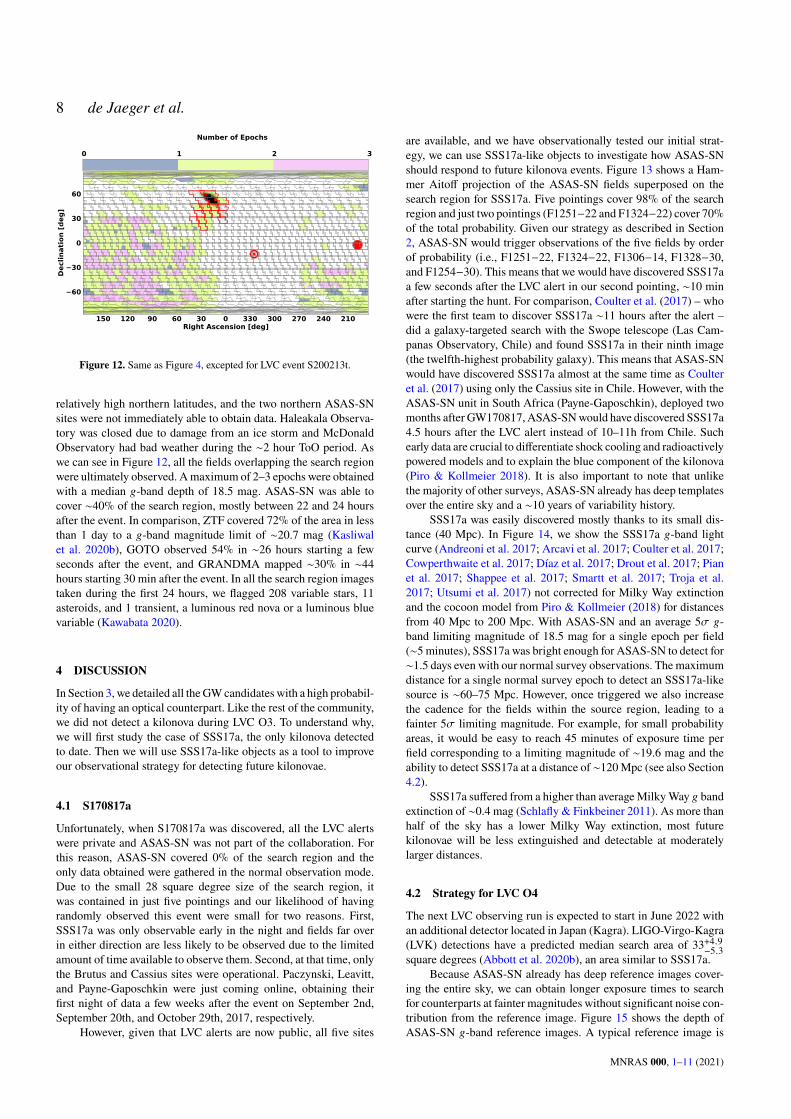
3.7 S191213g
S191213g was detected on 2019 December 12 at 04:34:08 UTC(LIGO Scientific Collaboration & Virgo Collaboration 2019g). Theclassification probabilities were 77%BNS and 23% terrestrial.Witha false alarm rate of 1.12 per year, a distance of 195 ± 59 Mpc, anda search region of 1393 square degrees, S191213g was fairly wellobserved (∼50 GCN circulars). However, as seen in Figure 10, thesearch region was within the Sun and Hour Angle limit of five hoursso ASAS-SN did not observe it, leading to its 0% coverage in Figure3. ZTF was able to cover 28% of the probable region in 27 hours byobserving at high airmass in twilight (Andreoni et al. 2019b) whileGRANDMA observed only 1% over 73 hours (Ducoin & GrandmaCollaboration 2019).
3.8 S200115j
S200115Jwas identified on January 15, 2020, at 04:23:08UTCwitha false alarm rate of 1 per 1,573 years (LIGO Scientific Collabora-tion & Virgo Collaboration 2020a). It was classified as a MassGapevent with a probability of 99%, a distance of 331 ± 97 Mpc, anda search region spanning 908 square degrees, one of the smallestregions in LVC O3. As seen in Figure 11, only two-thirds of thesearch region was observed by ASAS-SN due to Sun constraints.
0
0
30
30
60
60
90
90
120
120
150
150
210
210
240
240
270
270
300
300
330
330
Right Ascension [deg]
60
30
0
30
60
Dec
linat
ion
[deg
]
0 1 2 3
Number of Epochs
Figure 10. Same as Figure 4, excepted for LVC event S191213g. Thiscandidate was not observable due to our Sun and our Hour Angle limits.
0
0
30
30
60
60
90
90
120
120
150
150
210
210
240
240
270
270
300
300
330
330
Right Ascension [deg]
60
30
0
30
60
Dec
linat
ion
[deg
]
0 1 2 3 4
Number of Epochs
Figure 11. Same as Figure 4, excepted for LVC event S200115j.
Fields within the search region were targeted at a slightly higherfrequency (2–4 epochs) with a median 𝑔-band depth of 17.8 magand amaximum of 18.5mag. For this event, ASAS-SNwas among afew groups to obtain data and only∼30 GCN circulars were sent. Asshown in Figure 3, ASAS-SN was able to cover ∼60% of the searchregion in 24 hours and the first fields within the search region wereobserved 1 hour after the LVC alert. Among other teams, SAGUROobserved 2.1% of the LVC total probability in 24 hours starting 72hours after the event (Paterson et al. 2021), ZTF scanned 22% inone hour to a depth of 21.2 mag starting 15 minutes after the alert(Anand et al. 2020; Coughlin 2020), and GRANDMA observed 7%in 24 hours starting 11 hours after the event with a depth of 17 magin clear band. In all the search region images taken during the first24 hours, we flagged 22 variable stars, 16 asteroids, and 0 transients.
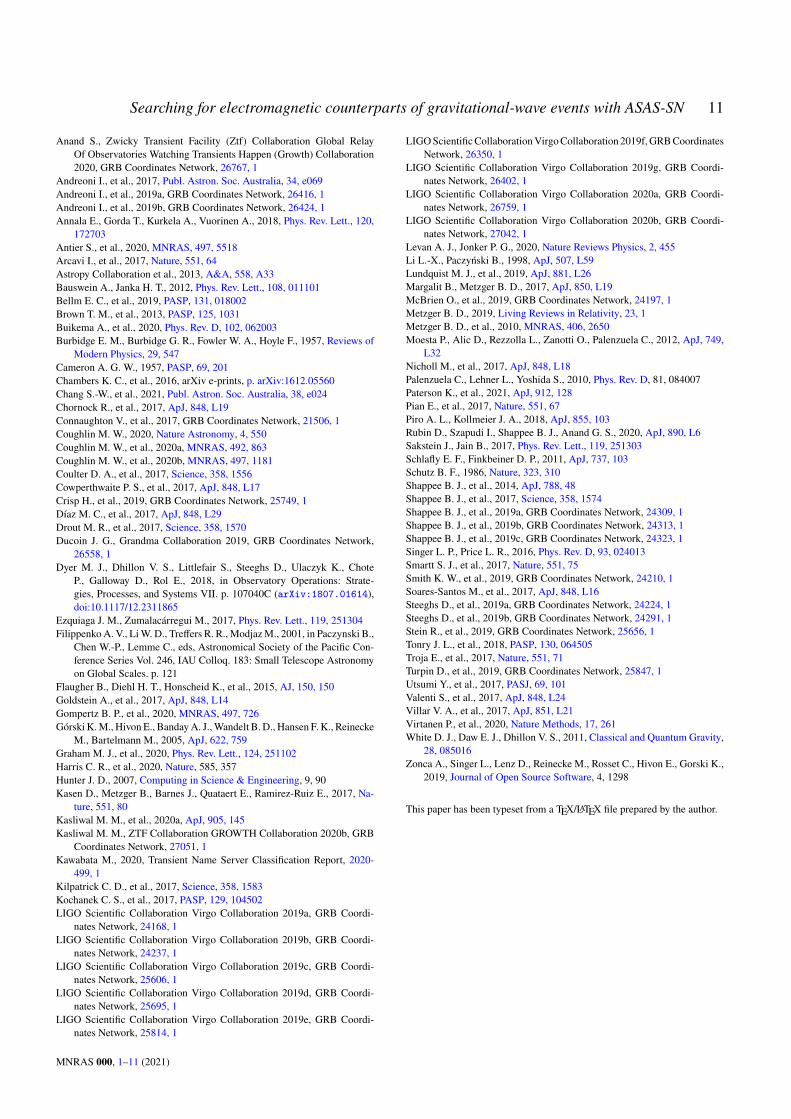
3.9 S200213t
The last GW candidate with a high NS probability was discoveredon February 13, 2020, at 04:10:40 UTC (LIGO Scientific Collab-oration & Virgo Collaboration 2020b). S200213t had a false alarmrate of ∼1 per 1.8 years, a search region of 2,587 square degrees,and a distance of 224 ± 90 Mpc. For this event, the probability ofa terrestrial origin was non-negligible (37%), but due to the 63%probability of being an BNS, several searches followed up this sig-nal (∼50 GCN circulars). The localisation region was confined to
MNRAS 000, 1–11 (2021)
8 de Jaeger et al.
0306090120150 210240270300330Right Ascension [deg]
60
30
0
30
60
Dec
linat
ion
[deg
]
0 1 2 3
Number of Epochs
Figure 12. Same as Figure 4, excepted for LVC event S200213t.
relatively high northern latitudes, and the two northern ASAS-SNsites were not immediately able to obtain data. Haleakala Observa-tory was closed due to damage from an ice storm and McDonaldObservatory had bad weather during the ∼2 hour ToO period. Aswe can see in Figure 12, all the fields overlapping the search regionwere ultimately observed. Amaximum of 2–3 epochs were obtainedwith a median 𝑔-band depth of 18.5 mag. ASAS-SN was able tocover ∼40% of the search region, mostly between 22 and 24 hoursafter the event. In comparison, ZTF covered 72% of the area in lessthan 1 day to a 𝑔-band magnitude limit of ∼20.7 mag (Kasliwalet al. 2020b), GOTO observed 54% in ∼26 hours starting a fewseconds after the event, and GRANDMA mapped ∼30% in ∼44hours starting 30 min after the event. In all the search region imagestaken during the first 24 hours, we flagged 208 variable stars, 11asteroids, and 1 transient, a luminous red nova or a luminous bluevariable (Kawabata 2020).
4 DISCUSSION
In Section 3, we detailed all theGWcandidates with a high probabil-ity of having an optical counterpart. Like the rest of the community,we did not detect a kilonova during LVC O3. To understand why,we will first study the case of SSS17a, the only kilonova detectedto date. Then we will use SSS17a-like objects as a tool to improveour observational strategy for detecting future kilonovae.
4.1 S170817a
Unfortunately, when S170817a was discovered, all the LVC alertswere private and ASAS-SN was not part of the collaboration. Forthis reason, ASAS-SN covered 0% of the search region and theonly data obtained were gathered in the normal observation mode.Due to the small 28 square degree size of the search region, itwas contained in just five pointings and our likelihood of havingrandomly observed this event were small for two reasons. First,SSS17a was only observable early in the night and fields far overin either direction are less likely to be observed due to the limitedamount of time available to observe them. Second, at that time, onlythe Brutus and Cassius sites were operational. Paczynski, Leavitt,and Payne-Gaposchkin were just coming online, obtaining theirfirst night of data a few weeks after the event on September 2nd,September 20th, and October 29th, 2017, respectively.
However, given that LVC alerts are now public, all five sites
are available, and we have observationally tested our initial strat-egy, we can use SSS17a-like objects to investigate how ASAS-SNshould respond to future kilonova events. Figure 13 shows a Ham-mer Aitoff projection of the ASAS-SN fields superposed on thesearch region for SSS17a. Five pointings cover 98% of the searchregion and just two pointings (F1251−22 and F1324−22) cover 70%of the total probability. Given our strategy as described in Section2, ASAS-SN would trigger observations of the five fields by orderof probability (i.e., F1251−22, F1324−22, F1306−14, F1328−30,and F1254−30). This means that we would have discovered SSS17aa few seconds after the LVC alert in our second pointing, ∼10 minafter starting the hunt. For comparison, Coulter et al. (2017) – whowere the first team to discover SSS17a ∼11 hours after the alert –did a galaxy-targeted search with the Swope telescope (Las Cam-panas Observatory, Chile) and found SSS17a in their ninth image(the twelfth-highest probability galaxy). This means that ASAS-SNwould have discovered SSS17a almost at the same time as Coulteret al. (2017) using only the Cassius site in Chile. However, with theASAS-SN unit in South Africa (Payne-Gaposchkin), deployed twomonths after GW170817, ASAS-SNwould have discovered SSS17a4.5 hours after the LVC alert instead of 10–11h from Chile. Suchearly data are crucial to differentiate shock cooling and radioactivelypowered models and to explain the blue component of the kilonova(Piro & Kollmeier 2018). It is also important to note that unlikethe majority of other surveys, ASAS-SN already has deep templatesover the entire sky and a ∼10 years of variability history.
SSS17a was easily discovered mostly thanks to its small dis-tance (40 Mpc). In Figure 14, we show the SSS17a 𝑔-band lightcurve (Andreoni et al. 2017; Arcavi et al. 2017; Coulter et al. 2017;Cowperthwaite et al. 2017; Díaz et al. 2017; Drout et al. 2017; Pianet al. 2017; Shappee et al. 2017; Smartt et al. 2017; Troja et al.2017; Utsumi et al. 2017) not corrected for Milky Way extinctionand the cocoon model from Piro & Kollmeier (2018) for distancesfrom 40 Mpc to 200 Mpc. With ASAS-SN and an average 5𝜎 𝑔-band limiting magnitude of 18.5 mag for a single epoch per field(∼5minutes), SSS17a was bright enough for ASAS-SN to detect for∼1.5 days even with our normal survey observations. The maximumdistance for a single normal survey epoch to detect an SSS17a-likesource is ∼60–75 Mpc. However, once triggered we also increasethe cadence for the fields within the source region, leading to afainter 5𝜎 limiting magnitude. For example, for small probabilityareas, it would be easy to reach 45 minutes of exposure time perfield corresponding to a limiting magnitude of ∼19.6 mag and theability to detect SSS17a at a distance of ∼120Mpc (see also Section4.2).
SSS17a suffered from a higher than averageMilkyWay 𝑔 bandextinction of ∼0.4 mag (Schlafly & Finkbeiner 2011). As more thanhalf of the sky has a lower Milky Way extinction, most futurekilonovae will be less extinguished and detectable at moderatelylarger distances.
4.2 Strategy for LVC O4
The next LVC observing run is expected to start in June 2022 withan additional detector located in Japan (Kagra). LIGO-Virgo-Kagra(LVK) detections have a predicted median search area of 33+4.9−5.3square degrees (Abbott et al. 2020b), an area similar to SSS17a.
Because ASAS-SN already has deep reference images cover-ing the entire sky, we can obtain longer exposure times to searchfor counterparts at fainter magnitudes without significant noise con-tribution from the reference image. Figure 15 shows the depth ofASAS-SN 𝑔-band reference images. A typical reference image is
MNRAS 000, 1–11 (2021)

Searching for electromagnetic counterparts of gravitational-wave events with ASAS-SN 9
205° 200° 195° 190° 185°
-10°
-15°
-20°
-25°
-30°
Right Ascension (2000.0)
Dec
linat
ion
(200
0.0)
F1234-14F1306-14F1338-14
F1219-22F1251-22F1324-22
F1220-30F1254-30F1328-30
SSS17A
Figure 13.Hammer Aitoff projection of the ASAS-SN fields (cyan) with theblack shaded area corresponding to the search region of SSS17a. The redstar represents the position of SSS17a. The names of the ASAS-SN fieldsare also written in black.
100 101
Time since explosion [days]
18
20
22
24
26
Ap
par
ent
ma
gn
itu
de
[ma
g]
ASAS-SN 5σ lim mag: 5 min
ASAS-SN 5σ lim mag: 15 min
ASAS-SN 5σ lim mag: 45 min
SSS17a, 40Mpc 50
75
100
125
150
175
200
Dista
nce
(Mp
c)
Figure 14. SSS17a 𝑔-band apparent magnitude evolution for different dis-tances. The original light curve is displayed in black (40 Mpc) while thelines corresponds to the cocoon model (Piro & Kollmeier 2018) for differ-ent distances in Mpc defined by the colour bar. The three brown horizontalbands are the 5𝜎 𝑔-band limiting magnitude from ASAS-SN for exposurestime per field of 5, 15, and 45 minutes respectively (see Section 4.2 for moredetails). The 𝑔-band data were taken from the compilation in Villar et al.(2017) and were originally published in Andreoni et al. (2017), Arcavi et al.(2017), Coulter et al. (2017), Cowperthwaite et al. (2017), Díaz et al. (2017),Drout et al. (2017), Pian et al. (2017), Shappee et al. (2017), Smartt et al.(2017), Troja et al. (2017), and Utsumi et al. (2017).
0306090120150 210240270300330Right Ascension [deg]
60
30
0
30
60
Dec
linat
ion
[deg
]
16.50 16.85 17.19 17.54 17.88 18.23 18.58 18.92 19.27 19.62 19.96 20.31 20.65 21.005 g band limiting magnitude
Figure 15. Plate-Carree projection of the depth of ASAS-SN 𝑔-band refer-ence images over the sky. The colour of the different ASAS-SN field showsthe 5𝜎 𝑔-band limiting magnitude of the reference images. The mediandepth over all the sky is 20.3 mag.
comprised of images totalling several hours of exposure time, witha median 5𝜎 𝑔-band limiting magnitude of 20.3 mag. Figure 16illustrates which events ASAS-SN should follow given its distanceand search area, assuming a peak absolute magnitude like SSS17a.We assume the event is visible for five hours from three of our fivesites and that SSS17a stayed near its peak for 300 minutes (seeFigure 14).
For simplicity, we ignore edge effects and assume that thetotal field of view of ASAS-SN is entirely contained within thesearch region, so that each pointing covers 70 square degrees of thesearch region. For the largest search areas, we can only dedicate ∼5minutes to each field to cover ∼12,600 square degrees in one nightat a depth of 18.5 mag. This would detect a SSS17a out to ∼70Mpc. If we observe only one field, we can reach a total exposuretime of 900 minutes (3 sites × 5 hours) in one night. For these verylong exposures, the sensitivity will be limited by the depth of thereference images and we can reach a 5𝜎 𝑔-band limiting magnitudeof 20.3mag to detect SSS17a-lke object out to∼160Mpc.Of course,by the start of the next LVC run, the reference images will be deeperthan shown in Figure 15.
These restrictions mean we should only follow GW candidateswith a distance ≤1.5 × 102.87−0.5log10 (
√A) Mpc for a search region
of 𝐴 square degrees. This limit is conservatively 50% deeper thanthe one represented by the black line in Figures 16, as SSS17a is onlyone example of a kilonova. With this new strategy, the majority ofthe events from LVCO3 would not have been triggered as they weretoo distant or their skymap areas were too large. Only three events,S190415z, S191213g, and S200213t, with minimum distances of110, 136, and 134 Mpc, respectively, would have been observed byASAS-SN under this strategy.
5 CONCLUSIONS
We described the ASAS-SN searches for EM counterparts of GWcandidates detected by the Advanced LIGO/Virgo during the thirdscience run (April 2019–February 2020). We observed a total ofnine events, all with a >60% probability of having at least one NScomponent. Unfortunately, like the rest of the community, ASAS-SN did not detect an optical counterpart. However, thanks to itslarge field of view and its five units located at four sites in bothhemispheres, ASAS-SN covered an average of 50% of the LVC
MNRAS 000, 1–11 (2021)

10 de Jaeger et al.
3 10 30 100 300Exposure time per field [min]
16
17
18
19
20
21
22
Appa
rent
mag
nitu
de [
mag
]
18.5+2.5*np.log10( 60T [min]315 )
Quarter MoonFull MoonTypical ASAS-SN exposure
20
35
55
90
140
220
350
Dis
tanc
e fo
r SS
S17a
-like
obj
ects
[M
pc]
21000 6300 2100 630 210Area [deg2]
Figure 16.Apparent magnitude limits versus total exposure time in minutes.The black, red, and blue lines represent are 5𝜎 𝑔-band limiting magnitudefor different moon phases: New, Quarter, and FullMoon. The right axis is thedistance at which SSS17a would be detected given an apparent magnitude.The top axis is the search area that ASAS-SN can cover for a given exposuretime per field using 3 of the 5 ASAS-SN sites and assuming fields arevisible five hours per night. If a candidate lies in the hatched region, ASAS-SN should not trigger based on SSS17a. The vertical cyan dashed line is theASAS-SN exposure time in normal operations.
search region in less than 24 hours, starting a few minutes after thealert for some events. For seven events, ASAS-SN is the survey thatcovered the most area in 24 hours with a 𝑔-band limiting magnitudeof 18.5 mag. We were also able to trigger and observe the fields inthe search region at a higher cadence, obtaining up to a dozen epochswithin 24 hours even for some of the larger search region. For LVCO4, we will only trigger on closer or well-localised sources: eventswhere the distance D is smaller than ∼1.5 × 102.87−0.5log10 (
√A)
Mpc for a given search region spanning 𝐴 square degrees. With ournew observational strategy, we will triggeron fewer objects but witha higher cadence and deeper observations.
With the additional Kagra detector and the LVC detector up-grades, the predicted rate of BNS merger detections will increaseto 10+52−10 per year from 1
+12−1 for O3 (Abbott et al. 2020b) and the
median search area will decrease to 33+4.9−5.3 square degrees (Abbottet al. 2020b), roughly the same search area as for SSS17a. Even foran elongated shape, ASAS-SN should be able to map the full searchregion in only 2–5 pointings to a 𝑔-band depth of ∼18.5 mag, takingonly five minutes per field. With more epochs/exposure time, wewill be able to reach a limiting magnitude of ∼20.3 mag and detectcandidates at distances up to ∼160 Mpc assuming an SSS17a-likelight curve. With LVK and our new observational strategy, ASAS-SN will play a key role in searching bright optical counterpartsduring the LVC O4 run and one of the few able to observe bothhemispheres.
ACKNOWLEDGEMENTS
Support for T.d.J has been provided by NSF grants AST-1908952andAST-1911074.B.J.S. is supported byNSFgrantsAST-1907570,AST-1908952, AST-1920392, and AST-1911074. CSK and KZSare supported by NSF grants AST-1814440 and AST-1908570.Support for TW-SH was provided by NASA through the NASAHubble Fellowship grant HST-HF2-51458.001-A awarded by theSpace Telescope Science Institute, which is operated by the Asso-ciation of Universities for Research in Astronomy, Inc., for NASA,under contract NAS5-265. J .F.B. is supported by National ScienceFoundation grant No. PHY-2012955.
ASAS-SN is funded in part by the Gordon and Betty MooreFoundation through grants GBMF5490 and GBMF10501 to theOhio State University, NSF grant AST-1908570, the Mt. Cuba As-tronomical Foundation, the Center for Cosmology and AstroParti-cle Physics (CCAPP) at OSU, the Chinese Academy of SciencesSouth America Center for Astronomy (CAS-SACA), and the Vil-lum Fonden (Denmark). Development of ASAS-SN has been sup-ported by NSF grant AST-0908816, the Center for Cosmology andAstroParticle Physics at the Ohio State University, the Mt. CubaAstronomical Foundation, and by George Skestos. Some of the re-sults in this paper have been derived using the healpy and HEALPixpackages.
This work is based on observations made by ASAS-SN. Wewish to extend our special thanks to those of Hawaiian ancestryon whose sacred mountains of Maunakea and Haleakala, we areprivileged to be guests. Without their generous hospitality, theobservations presented herein would not have been possible.
Facilities: Laser Interferometer Gravitational-Wave Observa-tory (USA), Virgo (Italy), Haleakala Observatories (USA), CerroTololo International Observatory (Chile), McDonald Observatory(USA), South African Astrophysical Observatory (South Africa).
Software: astropy (Astropy Collaboration et al. 2013),HEALPix (Górski et al. 2005), Healpy (Zonca et al. 2019), Mat-plotlib (Hunter 2007), Numpy (Harris et al. 2020), Scipy (Virtanenet al. 2020)
DATA AVAILABILITY STATEMENTS
All the BAYESTAR maps used in this work to produce the fig-ures are public and available on the Gravitational-Wave CandidateEvent Database (GraceDB) which is a service operated by theLIGO Scientific Collaboration (https://gracedb.ligo.org/superevents/public/O3/).
REFERENCES
Aartsen M. G., et al., 2017, Astroparticle Physics, 92, 30Aasi J., et al., 2015, Classical and Quantum Gravity, 32, 115012Abbott B. P., et al., 2016a, Phys. Rev. Lett., 116, 061102Abbott B. P., et al., 2016b, Phys. Rev. Lett., 116, 061102Abbott B. P., et al., 2017a, Phys. Rev. Lett., 119, 161101Abbott B. P., Abbott R., Abbott T. D., et al., 2017b, Nature, 551, 85Abbott B. P., et al., 2019, Physical Review X, 9, 031040Abbott R., et al., 2020a, arXiv e-prints, p. arXiv:2010.14527Abbott B. P., et al., 2020b, Living Reviews in Relativity, 23, 3Acernese F., et al., 2015, Classical and Quantum Gravity, 32, 024001Ackley K., et al., 2019, GRB Coordinates Network, 25654, 1Anand S., et al., 2019, GRB Coordinates Network, 25706, 1
MNRAS 000, 1–11 (2021)
Searching for electromagnetic counterparts of gravitational-wave events with ASAS-SN 11
Anand S., Zwicky Transient Facility (Ztf) Collaboration Global RelayOf Observatories Watching Transients Happen (Growth) Collaboration2020, GRB Coordinates Network, 26767, 1
Andreoni I., et al., 2017, Publ. Astron. Soc. Australia, 34, e069Andreoni I., et al., 2019a, GRB Coordinates Network, 26416, 1Andreoni I., et al., 2019b, GRB Coordinates Network, 26424, 1Annala E., Gorda T., Kurkela A., Vuorinen A., 2018, Phys. Rev. Lett., 120,172703
Antier S., et al., 2020, MNRAS, 497, 5518Arcavi I., et al., 2017, Nature, 551, 64Astropy Collaboration et al., 2013, A&A, 558, A33Bauswein A., Janka H. T., 2012, Phys. Rev. Lett., 108, 011101Bellm E. C., et al., 2019, PASP, 131, 018002Brown T. M., et al., 2013, PASP, 125, 1031Buikema A., et al., 2020, Phys. Rev. D, 102, 062003Burbidge E. M., Burbidge G. R., Fowler W. A., Hoyle F., 1957, Reviews ofModern Physics, 29, 547
Cameron A. G. W., 1957, PASP, 69, 201Chambers K. C., et al., 2016, arXiv e-prints, p. arXiv:1612.05560Chang S.-W., et al., 2021, Publ. Astron. Soc. Australia, 38, e024Chornock R., et al., 2017, ApJ, 848, L19Connaughton V., et al., 2017, GRB Coordinates Network, 21506, 1Coughlin M. W., 2020, Nature Astronomy, 4, 550Coughlin M. W., et al., 2020a, MNRAS, 492, 863Coughlin M. W., et al., 2020b, MNRAS, 497, 1181Coulter D. A., et al., 2017, Science, 358, 1556Cowperthwaite P. S., et al., 2017, ApJ, 848, L17Crisp H., et al., 2019, GRB Coordinates Network, 25749, 1Díaz M. C., et al., 2017, ApJ, 848, L29Drout M. R., et al., 2017, Science, 358, 1570Ducoin J. G., Grandma Collaboration 2019, GRB Coordinates Network,26558, 1
Dyer M. J., Dhillon V. S., Littlefair S., Steeghs D., Ulaczyk K., ChoteP., Galloway D., Rol E., 2018, in Observatory Operations: Strate-gies, Processes, and Systems VII. p. 107040C (arXiv:1807.01614),doi:10.1117/12.2311865
Ezquiaga J. M., Zumalacárregui M., 2017, Phys. Rev. Lett., 119, 251304Filippenko A. V., LiW. D., Treffers R. R., ModjazM., 2001, in Paczynski B.,Chen W.-P., Lemme C., eds, Astronomical Society of the Pacific Con-ference Series Vol. 246, IAU Colloq. 183: Small Telescope Astronomyon Global Scales. p. 121
Flaugher B., Diehl H. T., Honscheid K., et al., 2015, AJ, 150, 150Goldstein A., et al., 2017, ApJ, 848, L14Gompertz B. P., et al., 2020, MNRAS, 497, 726Górski K.M., Hivon E., BandayA. J.,Wandelt B. D., Hansen F. K., ReineckeM., Bartelmann M., 2005, ApJ, 622, 759
Graham M. J., et al., 2020, Phys. Rev. Lett., 124, 251102Harris C. R., et al., 2020, Nature, 585, 357Hunter J. D., 2007, Computing in Science & Engineering, 9, 90Kasen D., Metzger B., Barnes J., Quataert E., Ramirez-Ruiz E., 2017, Na-ture, 551, 80
Kasliwal M. M., et al., 2020a, ApJ, 905, 145Kasliwal M. M., ZTF Collaboration GROWTH Collaboration 2020b, GRBCoordinates Network, 27051, 1
Kawabata M., 2020, Transient Name Server Classification Report, 2020-499, 1
Kilpatrick C. D., et al., 2017, Science, 358, 1583Kochanek C. S., et al., 2017, PASP, 129, 104502LIGO Scientific Collaboration Virgo Collaboration 2019a, GRB Coordi-nates Network, 24168, 1
LIGO Scientific Collaboration Virgo Collaboration 2019b, GRB Coordi-nates Network, 24237, 1
LIGO Scientific Collaboration Virgo Collaboration 2019c, GRB Coordi-nates Network, 25606, 1
LIGO Scientific Collaboration Virgo Collaboration 2019d, GRB Coordi-nates Network, 25695, 1
LIGO Scientific Collaboration Virgo Collaboration 2019e, GRB Coordi-nates Network, 25814, 1
LIGOScientificCollaborationVirgoCollaboration 2019f,GRBCoordinatesNetwork, 26350, 1
LIGO Scientific Collaboration Virgo Collaboration 2019g, GRB Coordi-nates Network, 26402, 1
LIGO Scientific Collaboration Virgo Collaboration 2020a, GRB Coordi-nates Network, 26759, 1
LIGO Scientific Collaboration Virgo Collaboration 2020b, GRB Coordi-nates Network, 27042, 1
Levan A. J., Jonker P. G., 2020, Nature Reviews Physics, 2, 455Li L.-X., Paczyński B., 1998, ApJ, 507, L59Lundquist M. J., et al., 2019, ApJ, 881, L26Margalit B., Metzger B. D., 2017, ApJ, 850, L19McBrien O., et al., 2019, GRB Coordinates Network, 24197, 1Metzger B. D., 2019, Living Reviews in Relativity, 23, 1Metzger B. D., et al., 2010, MNRAS, 406, 2650Moesta P., Alic D., Rezzolla L., Zanotti O., Palenzuela C., 2012, ApJ, 749,L32
Nicholl M., et al., 2017, ApJ, 848, L18Palenzuela C., Lehner L., Yoshida S., 2010, Phys. Rev. D, 81, 084007Paterson K., et al., 2021, ApJ, 912, 128Pian E., et al., 2017, Nature, 551, 67Piro A. L., Kollmeier J. A., 2018, ApJ, 855, 103Rubin D., Szapudi I., Shappee B. J., Anand G. S., 2020, ApJ, 890, L6Sakstein J., Jain B., 2017, Phys. Rev. Lett., 119, 251303Schlafly E. F., Finkbeiner D. P., 2011, ApJ, 737, 103Schutz B. F., 1986, Nature, 323, 310Shappee B. J., et al., 2014, ApJ, 788, 48Shappee B. J., et al., 2017, Science, 358, 1574Shappee B. J., et al., 2019a, GRB Coordinates Network, 24309, 1Shappee B. J., et al., 2019b, GRB Coordinates Network, 24313, 1Shappee B. J., et al., 2019c, GRB Coordinates Network, 24323, 1Singer L. P., Price L. R., 2016, Phys. Rev. D, 93, 024013Smartt S. J., et al., 2017, Nature, 551, 75Smith K. W., et al., 2019, GRB Coordinates Network, 24210, 1Soares-Santos M., et al., 2017, ApJ, 848, L16Steeghs D., et al., 2019a, GRB Coordinates Network, 24224, 1Steeghs D., et al., 2019b, GRB Coordinates Network, 24291, 1Stein R., et al., 2019, GRB Coordinates Network, 25656, 1Tonry J. L., et al., 2018, PASP, 130, 064505Troja E., et al., 2017, Nature, 551, 71Turpin D., et al., 2019, GRB Coordinates Network, 25847, 1Utsumi Y., et al., 2017, PASJ, 69, 101Valenti S., et al., 2017, ApJ, 848, L24Villar V. A., et al., 2017, ApJ, 851, L21Virtanen P., et al., 2020, Nature Methods, 17, 261White D. J., Daw E. J., Dhillon V. S., 2011, Classical and Quantum Gravity,28, 085016
Zonca A., Singer L., Lenz D., Reinecke M., Rosset C., Hivon E., Gorski K.,2019, Journal of Open Source Software, 4, 1298
This paper has been typeset from a TEX/LATEX file prepared by the author.
MNRAS 000, 1–11 (2021)