asean and global rice situation and outlook, 2011–2022
DESCRIPTION
This paper documents the current and projected status until 2022 of ASEAN rice economies as well as other neighboring Asian countries by assessing their potential rice supply and demand paths over the next decade. Despite aggressive campaigns for rice self-sufficiency, Indonesia and the Philippines are expected to remain important rice importers.TRANSCRIPT

ASEAN and Global Rice Situation and Outlook, 2011–2022
Eric J. Wailes
and Eddie C. Chavez
The lead author, Eric J. Wailes, is Distinguished Professor at the Department of Agricultural Economics and Agribusiness, University of Arkansas
Contents
Abbreviations .............................................................................................................................. v
Executive Summary ................................................................................................................... 1
1. Overview ............................................................................................................................... 2
1.1 Purpose of this Outlook and its Significance for ASEAN ................................................. 2 1.2 The Arkansas Global Rice Model Framework ................................................................. 2
2. ASEAN Rice Outlook ............................................................................................................ 4
2.1 Rice Harvested Area and Production .............................................................................. 4 2.2 Rice Consumption .......................................................................................................... 5 2.3 Rice Exports ................................................................................................................... 5 2.4 Rice Imports ................................................................................................................... 7 2.5 Rice Stocks .................................................................................................................... 7
3. ASEAN Country Rice Outlook ............................................................................................... 7
3.1 Brunei Darussalam .......................................................................................................... 7 Economy ...................................................................................................................... 7 Rice Supply and Demand ............................................................................................ 8
3.2 Cambodia ........................................................................................................................ 8 Economy ...................................................................................................................... 8 Rice Supply and Demand ............................................................................................ 8
3.3 Indonesia ......................................................................................................................... 9 Economy ...................................................................................................................... 9 Rice Supply and Demand ............................................................................................ 9
3.4 Lao People’s Democratic Republic .................................................................................10 Economy .....................................................................................................................10 Rice Supply and Demand ...........................................................................................10
3.5 Malaysia .........................................................................................................................10 Economy .....................................................................................................................10 Rice Supply and Demand ...........................................................................................10
3.6 Myanmar ........................................................................................................................11 Economy .....................................................................................................................11 Rice Supply and Demand ...........................................................................................11
3.7 Philippines ......................................................................................................................12 Economy .....................................................................................................................12 Rice Supply and Demand ...........................................................................................12
3.8 Singapore .......................................................................................................................12 Economy .....................................................................................................................12 Rice Supply and Demand ...........................................................................................13
3.9 Thailand .........................................................................................................................13 Economy .....................................................................................................................13 Rice Supply and Demand ...........................................................................................13
3.10 Viet Nam ......................................................................................................................14 Economy .....................................................................................................................14 Rice Supply and Demand ...........................................................................................14
4. Global Rice Outlook .............................................................................................................14
4.1 International Rice Prices .................................................................................................14 4.2 Global Rice Supply and Demand ....................................................................................15

4.3 Key Global Policy Assumptions ......................................................................................16 4.4 Global Rice Trade...........................................................................................................17 4.5 Key Non-ASEAN Rice Countries ....................................................................................17 4.6 People’s Republic of China .............................................................................................18
Economy .....................................................................................................................18 Rice Supply and Demand ...........................................................................................18
4.7 Japan .............................................................................................................................18 Economy .....................................................................................................................18 Rice Supply and Demand ...........................................................................................19
4.8 Republic of Korea ...........................................................................................................19 Economy .....................................................................................................................19 Rice Supply and Demand ...........................................................................................19
4.9 India ...............................................................................................................................20 Economy .....................................................................................................................20 Rice Supply and Demand ...........................................................................................20
4.10 Pakistan .......................................................................................................................20 Economy .....................................................................................................................20 Rice Supply and Demand ...........................................................................................21
5. Stochastic Analysis ...............................................................................................................21
5.1 Baseline Results .............................................................................................................21 5.2 Use of the Baseline for Assessing Self-Sufficiency and Trade Impacts ...........................23
6. Conclusion ............................................................................................................................25
References ...............................................................................................................................27
Appendixes
1. Rice Models of the Arkansas Global Rice Economics Program ............................................29
Arkansas Global Rice Model ................................................................................................29 Riceflow Model .....................................................................................................................30
2. Aggregate Rice Supply and Utilization Tables for ASEAN Countries .....................................32
3. ASEAN Rice Supply and Utilization Tables by Country .........................................................37
4. Other Non-ASEAN Country Rice Supply and Utilization Tables from 2011–2012 to 2022–2023 ........................................................................................................................42
5. World Net Rice Trade, Per Capita Use, and Average Yield Tables by Country ...............................45
Tables
Table 1: World Rice Supply and Utilization, 2011–2022 .............................................................. 16 Table 2: Impact of Self-Sufficiency in Indonesia and the Philippines on Baseline Rice Exports from Viet Nam ................................................................................ 25 Table 3: Impact of Self-Sufficiency in Indonesia and the Philippines on Baseline World Long-Grain Rice Reference Price ............................................................. 25
Appendix 2 Table A2.1: ASEAN Rice Supply and Utilization .......................................................................... 32 Table A2.2: ASEAN Rice Trade .................................................................................................. 33 Table A2.3: ASEAN Rice Area Harvested ................................................................................... 34 Table A2.4: ASEAN Rice Yield per Hectare ................................................................................ 34 Table A2.5: ASEAN Rice Production ........................................................................................... 35 Table A2.6: ASEAN Rice Consumption ....................................................................................... 35

Table A2.7: ASEAN Per Capita Rice Consumption ..................................................................... 36 Table A2.8: ASEAN Rice Ending Stocks ..................................................................................... 36
Appendix 3 Table A3.1: Brunei Darussalam Rice Supply and Utilization ........................................................ 37 Table A3.2: Cambodia Rice Supply and Utilization ..................................................................... 37 Table A3.3: Indonesia Rice Supply and Utilization ...................................................................... 38 Table A3.4: Lao PDR Rice Supply and Utilization ....................................................................... 38 Table A3.5: Malaysia Rice Supply and Utilization ........................................................................ 39 Table A3.6: Myanmar Rice Supply and Utilization ....................................................................... 39 Table A3.7: Philippines Rice Supply and Utilization .................................................................... 40 Table A3.8: Singapore Rice Supply and Utilization ..................................................................... 40 Table A3.9: Thailand Rice Supply and Utilization ........................................................................ 41 Table A3.10: Viet Nam Rice Supply and Utilization ..................................................................... 41
Appendix 4 Table A4.1: People’s Republic of China Rice Supply and Utilization ........................................... 42 Table A4.2: Japan Rice Supply and Utilization ............................................................................ 43 Table A4.3: Republic of Korea Rice Supply and Utilization.......................................................... 43 Table A4.4: India Rice Supply and Utilization .............................................................................. 44 Table A4.5: Pakistan Rice Supply and Utilization ........................................................................ 44
Appendix 5 Table A5.1: World Net Rice Trade by Selected Countries and Prices ......................................... 45 Table A5.2: Per Capita Rice Consumption, World and Selected Countries ................................. 46 Table A5.3: Rice Yield per Hectare, World and Selected Countries ............................................ 47
Figures
Figure 1: Projections of Population Growth and Gross Domestic Product ..................................... 4 Figure 2: ASEAN Rice Area Harvested, Yield, Supply and Utilization ........................................... 5 Figure 3: ASEAN Rice Trade ........................................................................................................ 6 Figure 4: World Rice Prices, 1995–2022 ..................................................................................... 15 Figure 5: World Rice Area Harvested, Yield, Supply and Utilization ............................................ 16 Figure 6: Regional Shares of World Net Rice Trade, 2011–2022 ................................................ 17 Figure 7: Long-Grain Rice International Reference Prices (Stochastic Projection) ...................... 22 Figure 8: ASEAN Rice Ending Stocks (Stochastic Projection) ..................................................... 22 Figure 9: Indonesia’s Baseline Yield Gap to Achieve Self-Sufficiency ......................................... 23 Figure 10: Philippines’ Baseline Yield Gap to Achieve Self-Sufficiency ....................................... 23 Figure 11: Baseline Probability of Achieving Self-Sufficiency in Indonesia .................................. 24 Figure 12: Baseline Probability of Achieving Self-Sufficiency in the Philippines........................... 24
Appendix 6 Figure A6.1: Medium-Grain Rice Prices, FOB California (Stochastic Projection) ......................... 48 Figure A6.2: World Net Rice Trade (Stochastic Projection) ......................................................... 48 Figure A6.3: ASEAN Total Rice Area Harvested (Stochastic Projection) ..................................... 49 Figure A6.4: ASEAN Total Rice Production (Stochastic Projection) ............................................ 49 Figure A6.5: ASEAN Total Rice Consumption (Stochastic Projection) ........................................ 50 Figure A6.6: ASEAN Net Rice Exports (Stochastic Projection) .................................................... 50 Figure A6.7: ASEAN Net Rice Imports (Stochastic Projection) .................................................... 51 Figure A6.8: ASEAN Rice Stocks-to-Use Ratio (Stochastic Projection) ....................................... 51

Abbreviations ADB AGRM ASEAN FAPRI GDP kg Lao PDR PRC US USDA USDA FAS WTO
Asian Development Bank Arkansas Global Rice Model Association of Southeast Asian Nations Food and Agricultural Policy Research Institute gross domestic product kilograms Lao People's Democratic Republic People's Republic of China United States United States Department of Agriculture United States Department of Agriculture Foreign Agricultural Service World Trade Organization
Unless otherwise noted, “$” refers to US dollars.

Executive Summary Member states of the Association of Southeast Asian Nations (ASEAN) play a major role in the global rice market. Over the next decade, the ASEAN region is projected to account for 53% of net rice exports, 18% of net rice imports, 29% of harvested area, 25% of total rice production, and 22% of total rice consumption. Rice is the major food staple in ASEAN countries and thus plays a significant role in the food security concerns of the region. The rice price crisis that occurred in 2007–2008 has created a widespread sense of urgency among policy makers and other rice stakeholders to coordinate domestic policies and rice trade. This paper documents the current and projected status until 2022 of the rice economies in ASEAN countries by assessing their potential supply and demand paths over the next decade.1 Other Asian nations that have a significant role in the behavior and performance of the global rice economy are also discussed—the People’s Republic of China (PRC), Japan, the Republic of Korea, as well as India and Pakistan. While the ASEAN and global rice economies are always subject to uncertainties in weather and policies, abundant rice supplies and slow growth in rice consumption have resulted in downward pressure on prices. Driven by the use of higher-yielding rice varieties and other improved production technologies, the outlook for the rice economies is expected to follow this trend. The focus on self-sufficiency by major rice-consuming countries is expected to restrain rice trade and dampen international rice prices over the next decade. Domestic price policy supports, coupled with good weather, have resulted in strong rice harvests in India and Thailand and large stock inventories. Import demand growth in other ASEAN countries is limited for similar reasons. Much of the projected growth in rice trade is expected to come from other regions, particularly Africa. Despite the desire for self-sufficiency and a trend for production to grow faster than demand, major ASEAN rice importers—the Philippines and Indonesia—are expected to remain important importers. Expected expansion in rice exports from Cambodia and Myanmar will add to competitive price pressures that will result in lower international prices over time. Results of stochastic analysis, based on uncertainties associated with production, show that international long-grain rice reference prices are expected to range from $368 per ton to as high as $506 per ton, a gap of $138. Volatility in prices as a result of uncertain weather and policies thus remains a persistent food security concern with the ASEAN and global rice economies.
1 This report was prepared for the Second ASEAN Rice Trade Forum on 4–5 June 2013 in Yogyakarta, Indonesia. The
Asian Development Bank (ADB) provided technical assistance under TA-REG 7495: Support for the Association of Southeast Asian Nations Plus Three Integrated Food Security Framework, with financing from the Japan Fund for Poverty Reduction. The lead author, Eric J. Wailes, is Distinguished Professor and L. C. Carter Endowed Chair at the Department of Agricultural Economics and Agribusiness, Division of Agriculture, University of Arkansas, Fayetteville. Eddie C. Chavez is Senior Program Associate and a member of Dr. Wailes’ team that developed and maintains the Arkansas Global Rice Model and Riceflow model. This report does not necessarily reflect the views of ADB or the Government concerned, or the institutions at which the consultant works, and ADB and the Government and these institutions cannot be held liable for its contents.

2 | Second ASEAN Rice Trade Forum 2013
1. Overview 1.1 Purpose of this Outlook and its Significance for ASEAN Member nations of the Association of Southeast Asian Nations (ASEAN) play a major role in the global rice market. Over the next decade, the region’s rice output is projected to account for 53% of net exports, 18% of net imports, 29% of harvested area, 25% of total production, and 22% of total consumption of world rice. Rice is the major food staple in ASEAN and thus plays a very important role in the food security concerns of the region. The rice price crisis that occurred in 2007–2008 has catalyzed renewed interest and a widespread sense of urgency among policy makers and other rice stakeholders to forge more coordinated efforts to avoid a repeat of such an occurrence. The purpose of this outlook is to document the current state and the expected directions of the rice economies in ASEAN countries by assessing their potential supply and demand paths over the next decade. As the ASEAN region is a net rice exporter to the world, the region is influenced by factors prevailing in the global rice economy and cannot be looked at in isolation. An overview of the global rice sector is hence included in this report. It is important to note that over the last couple of years, the international rice market has been dominated by twin events. First is India’s official lifting of its ban on non-basmati rice exports as of September 2011. Second is Thailand’s implementation of its paddy pledging scheme in October 2011, a price-floor support policy for Thai farmers. The outlook is not a prediction but rather a framework to be used to discuss the management of risks of rice price volatility and their causes, including policies, supply distortions, and climate change. The Arkansas Global Rice Model (AGRM) framework provides the ASEAN region with functional structural models that can be used to assess intermediate and longer-term challenges faced by the region, which meet the goal of designing a set of coherent and coordinated policy actions to address emerging issues proactively. 1.2 The Arkansas Global Rice Model Framework The 10-year baseline deterministic and stochastic estimates presented in this report are generated using the AGRM. The AGRM is one of the two global rice modeling frameworks maintained by the University of Arkansas Global Rice Economics Program. The AGRM is a partial, nonspatial, multicountry statistical simulation, and econometric analytical framework. The other model, Riceflow, is a spatial equilibrium framework that tracks bilateral trade flows and rice value chain adjustments (Appendix 1). These models are updated on a regular basis and have been used to provide analyses for the Asian Development Bank, Food and Agriculture Organization of the United Nations, International Rice Research Institute (IRRI), Organisation for Economic Co-operation and Development, United States Department of Agriculture, the World Bank as well as many national governments and research institutes. All ASEAN member nations are modeled individually in AGRM. This model links all countries through rice prices and trade (Wailes 2012). The AGRM is disaggregated into 45 of the major rice-producing, -consuming and -trading countries; and five rest-of-the-world regional aggregations: Africa, the Americas, Asia, Europe, and Oceania. Each country and regional model includes a supply sector, a demand sector, trade, stocks, and price linkage equations.

ASEAN and Global Rice Situation and Outlook, 2011–2022 | 3
The AGRM and Riceflow are research application tools that provide frameworks of the global rice economy and ASEAN countries as a system. They can thus address a wide range of issues and questions regarding price risks, policies, and supply and demand distortions (Wailes 2012). The 10-year baseline deterministic and stochastic estimates presented in this report are generated using the AGRM. The baseline assumes the following:
a continuation of existing rice sector policies;
macroeconomic projections from Global Insight, a global information company that provides economic forecasts, industry analysis, and market intelligence for over 200 countries and 170 industries;
no Doha Development Round of World Trade Organization (WTO) trade reforms; and
average weather conditions.
The stochastic component of the analysis provides a range of possible outcomes (confidence intervals) as opposed to the deterministic analysis that generates average point estimates. The stochastic framework is generated using multivariate empirical distributions of the rice yield for each of the 50 countries/regions in the model. Yield is used because it is the variable that not only varies by year and by country but is also very sensitive to changes in weather conditions and water availability—factors that are critical for rice production. A total of 200 random draws for each year are implemented using a 28-year empirical distribution of historical yields generated by the software Simulation and Econometrics to Analyze Risk (SIMETAR) developed by Richardson et al. (2008). Stochastic estimates are useful because underlying assumptions in the deterministic baseline usually do not hold true in reality, i.e., actual market outcomes deviate from average estimates. The theoretical structure, general equations, and other details of the AGRM can be found in the online documentation by Wailes and Chavez (2011). The AGRM has benefited from working closely with the Food and Agricultural Policy Research Institute (FAPRI) based at the University of Missouri, Columbia, which maintains United States (US) agricultural and other commodity models. FAPRI provided data on commodity prices and net returns projections, which are transmitted into the different AGRM country models. In particular, the prices and net returns for corn, soybeans, and wheat are relevant, considering that these commodities are substitute crops for rice in the US and other countries. Rice area competes with a number of crops, including soybeans, corn, and cotton in the rice-producing states in the US (Arkansas, California, Louisiana, Mississippi, Missouri, and Texas). In the People’s Republic of China (PRC), rice competes with corn in the provinces of Guangxi, Heilongjiang, Jilin, and Liaoning; with wheat in the province of Jiangsu; and with both corn and wheat in the provinces of Anhui, Chongqing, Guizhou, Hubei, Ningxia, Sichuan, and Yunnan. In India, rice competes with wheat, particularly in the northern states (Carriquiry et al. 2012 as cited by Wailes and Chavez 2013). The historical rice data are obtained from the Production, Supply, and Distribution report (Rice Outlook) of the United States Department of Agriculture (USDA) Foreign Agricultural Service (FAS) and Economic Research Service as of March 2013. The AGRM rice marketing years by country generally follow the USDA system. For example, the year 2012 or marketing year 2012–2013 in the model refers to January 2013–December 2013 for Indonesia, Thailand, and Viet Nam; October 2012–September 2013 for India; July 2012–June 2013 for the Philippines; and April 2012–March 2013 for South American countries. Hence, supply values for 2012 are fixed for some countries

4 | Second ASEAN Rice Trade Forum 2013
while still dynamic for a number of countries.2 As such, the annual cumulative growth rates as well as the total growth presented in this document are reckoned from 2011 and cover the 11-year period of 2011–2022. For the most part, the data on the economies of individual countries came from the online Central Intelligence Agency World Fact Book (2013).
2. ASEAN Rice Outlook3 2.1 Rice Harvested Area and Production The conditioning macroeconomic environment for the rice outlook is based on projections of population growth and economic growth (gross domestic product [GDP]) for the region. While the ASEAN population growth has historically exceeded world averages, it is expected to converge to the global average of approximately 1% until 2022. Projections for ASEAN and the ASEAN Plus Three,4 and for India and Pakistan, have slightly declining GDP growth but are clearly more robust than for the rest of the world (Figure 1). Appendix 2 provides the estimates for the ASEAN region, Appendix 3 for the 10 ASEAN member nations, Appendix 4 for the non-ASEAN countries (PRC, Japan, Republic of Korea, as well as India and Pakistan), and Appendix 5 for the world net rice trade, per capita use, and average rice yield tables by country.
Figure 1: Projections of Population Growth and Gross Domestic Product
ASEAN = Association of Southeast Asian Nations; Plus3 = People's Republic of China, Japan, Republic of Korea;
IN = India; PK = Pakistan. Source: Wailes and Chavez.
Total ASEAN rice output is projected to expand by a total of 15.9 million tons over the baseline period, growing at 1.2% annually, from nearly 114.6 million tons in 2011 to 128.8 million tons in 2022—with the growth coming mainly from yields as area harvested gains only marginally (Figure 2 and Table A2.1). The ASEAN region contributes just under 25.0% of global rice production. The ASEAN rice harvested area accounts for 29.0% of the global total. The region’s rice area harvested is projected to expand by a total of 414,000 hectares over the next decade, reaching 46.66 million hectares in
2 For details, see the USDA Foreign Agricultural Service site: http://www.fas.usda.gov/psdonline/psdAvailability.aspx 3 An extended version of the AGRM baseline is available upon request. The extended version, World Rice Situation and
Outlook 2012-2022, provides detailed tables and projections for all key individual rice-importing and rice-exporting countries for all regions of the world.
4 The ASEAN Plus Three is composed of the 10 member nations of ASEAN—Brunei Darussalam, Cambodia, Indonesia, the Lao People’s Democratic Republic, Malaysia, Myanmar, the Philippines, Singapore, Thailand and Viet Nam—plus the three East Asian nations of the People’s Republic of China, Japan, and the Republic of Korea.

ASEAN and Global Rice Situation and Outlook, 2011–2022 | 5
2022. This is equivalent to a marginal growth of 0.08% per year. The average rice yield of the region is projected to improve from 2.47 tons per hectare in 2011 to 2.76 tons per hectare in 2022—a total increase of 319 kilograms (kg) per hectare, equivalent to an annual growth of 1.12% (Appendix 2).
Figure 2: ASEAN Rice Area Harvested, Yield, Supply and Utilization
Source: Wailes and Chavez.
The region’s average rice yield level is lower than the world average by about 15%. However, the yield gap is projected to narrow down to 403 kg per hectare in 2022 from 493 kg per hectare in 2011, primarily as more countries in the region expand the use of hybrid rice varieties. Thus, improving farm productivity is the most promising direction that countries in the region need to focus on, which entails expanding the use of high-yielding hybrids and improved production technologies. This should be the priority both of countries aiming for rice self -sufficiency and those that are trying to expand exports in the face of limited land and other production resources. Challenges for rice expansion in the region include constraints on land and water resources; competition from other crops and uses; high input prices; farm demographics; climate change; and the emerging issue on rice carbon and water footprints. Another concern that has implications for the future of rice farming is the migration of people from rural areas to urban centers in search of alternative non-farm income opportunities. In conjunction with aging farmers, this situation can aggravate labor scarcity in the agricultural sector of the region. 2.2 Rice Consumption Rice consumption is driven by income, population, and other demographics. Rising incomes dampen rice demand in some Asian countries where rice is considered an inferior good. Other factors include aging populations and increasing health consciousness that shift diet preferences away from carbohydrates and toward protein-based foods. The ASEAN rice total consumption accounts for 22.1% of the world total. Over the next decade, ASEAN rice total use will expand from 100.7 million tons in 2011 to 113.5 million tons in 2022, attaining a growth of 1.10 % annually (Figure 2). The average ASEAN rice per capita use has been 2.5 times the world average (164 kg versus 65 kg over the last decade). The growth in the region’s total rice consumption over the baseline period is driven by a population growth of 1.06% annually (Table A2.6) as the average per capita use of rice is projected to be flat (Table A2.7). 2.3 Rice Exports ASEAN net rice exports declined 16.9% in 2011 from the 2010 level of 18.6 million tons, largely due to the 4.1-million ton or 39.3% drop in Thai exports as a result of the country’s paddy pledging

6 | Second ASEAN Rice Trade Forum 2013
program that made its quoted export prices much higher than its competitors’ prices. The region’s net rice exports went up 4.6% in 2012 as Thailand’s export shipments gained 19.8%, mainly through government-to-government sales. Reflecting the same historical average share, the total ASEAN net rice exports are expected to account for 52.6% of the total global volume over the projection period (2011–2022). The combined net rice exports of ASEAN are projected to grow at 3.0% per year, from 15.4 million tons in 2011 to 21.4 million tons in 2022 over the same period. Two of the top five world rice exporters, Thailand and Viet Nam, are both ASEAN members, which are projected to jointly account for about 47% of the growth of global net exports during the same period (Figure 3 and Table A2.2).
Figure 3: ASEAN Rice Trade
Lao PDR = Lao People's Democratic Republic. Source: Wailes and Chavez.
Despite Thailand’s unpopular and controversial paddy pledging program, the country is expected to reestablish its strong presence in the global rice market over the next decade. Recent government pronouncements indicate that the country has decided to sell its mounting rice stockpile both into the open market and through government-to-government sales. The Thai government is expected to incur substantial financial losses in the short term as it sells its high-priced rice at competitively lower prices. Cambodia and Myanmar are projected to increase their rice exports steadily as production continues to exceed consumption. Good availability of land and water resources in these two countries offers opportunities to expand rice production and rice exports. This, however, is subject to their ability to build the necessary infrastructure and institutional support to export larger volumes on a sustained basis. Over the last few years of the baseline, both countries are projected to reach a similar magnitude of rice exports of approximately 1.6 million tons. The Lao People's Democratic Republic (Lao PDR) also has the potential to become an important rice exporter in the region, subject likewise to its ability to successfully undertake infrastructure capacity and institutional building. Over the last half of the baseline period, the country is projected to shift from being a net rice importer to a net rice exporter, reaching nearly 200,000 tons of net rice exports by 2022. The issue of unofficial cross-border trade of rice in the ASEAN region remains unresolved. The total elimination of this problem is challenging. However, minimizing it will improve transparency in rice trade and prices, and will contribute to generating more reliable market information for better decision-making purposes.

ASEAN and Global Rice Situation and Outlook, 2011–2022 | 7
2.4 Rice Imports The average share of ASEAN net rice imports to total world trade is projected to expand from 16.5% over the last decade to 18.3% over the next decade—growing from just under 5.0 million tons in 2011 to 6.8 million tons in 2022 (Figure 3 and Table A2.2). The combined ASEAN net rice imports declined 15.9% in 2011 from the 2010 level as a result of a 36.7% reduction in Indonesia’s imports, as the country supplies its domestic rice needs from expanded production and withdrawal from its stocks. The region’s net rice imports recovered by 4.9%, from 4.96 million tons in 2011 to 5.2 million tons in 2012, as the projected increase in Philippine imports for stock replenishment more than compensates for the decline in Indonesia’s imports—as the latter opts to continue withdrawing from its stocks. Over the last few years, the Indonesian and Philippine governments have focused on their goal of rice self-sufficiency and their efforts should be commended. As a result, the two countries are projected to make gains in productivity, raising output mostly from increased yields with the expanded use of high-yielding hybrids as area harvested remains relatively flat. Over the projection period, the average rice yields are projected to grow annually by 1.1% for Indonesia, and by 1.8% for the Philippines. However, attaining rice self-sufficiency presents a daunting challenge for the two countries, considering that the historical average annual production gap for Indonesia stands at 7% (equivalent to 2.9 million tons) of annual consumption, and that of the Philippines is 16% (about 2.2 million tons). Estimates indicate that if Indonesia and the Philippines were to prioritize maintaining relatively safe stock levels over the baseline period—even lower than the historical path—chances are they will remain the top rice importers in ASEAN: Indonesia will rank second, and the Philippines, third, with a combined share of 13.6% of global net rice import volume. The region’s growth in rice demand is driven mainly by population growth, as per capita use in most countries is on the decline, with per capita use in a few countries either flat or with marginal gains over the projection period. 2.5 Rice Stocks The ASEAN average rice stocks-to-use ratio is projected to increase from 16.9% during the last decade to 24.4% over the next decade due to the paddy pledging-related buildup in Thai stocks. The annual stocks-to-use ratio will increase steadily from 19.3% in 2011 to 28.1% in 2022. The average share of ASEAN rice stocks to the global total is estimated to go up from 17.2% during the last decade to 21.1% over the baseline period. For the projection period, the annual share of the region’s rice stocks in the global total would expand from 18.3% in 2011 to 22.2% in 2022 (Table A2.8).
3. ASEAN Country Rice Outlook5 3.1 Brunei Darussalam
Economy Brunei Darussalam’s economy is projected to grow at 2.7% per year in real terms. It is heavily
5 See Appendix 2 for individual ASEAN country rice situation and outlook supply and utilization estimates.

8 | Second ASEAN Rice Trade Forum 2013
dependent on revenues from crude oil and natural gas, which account for 60% of GDP and 90% of exports. The country is the third largest oil producer in Southeast Asia and the fourth largest producer of liquefied natural gas in the world. By sector, the country’s GDP is composed of 0.6% agriculture, 71.7% industry, and 27.7% services. The country’s population is 415,717 and grows at 1.69% per year; 89% is under 55 years old. Per capita income, at $50,500 in 2012, is one of the highest in the world. The labor force totals 205,800, with 4.2% in agriculture, 62.8% in industry, and 33.0% in services. The local currency, the Brunei dollar (BND or B$), had an exchange rate of B$1.25 in 2012 and is projected to appreciate relative to the US dollar over the baseline period.
Rice Supply and Demand The country consumed 53,000 tons of milled rice in 2011, with about 97% coming from imports. Rice per capita use generally ranges from 120 kg to 123 kg per year over the projection period. Given the population growth, this translates to an annual increase of about 2.0% in total rice consumption. To meet this demand, net rice imports are seen to grow by just under 1.0% per year (Table A3.1). Only 2.1% of the country’s 5,765-square kilometer land area is considered arable. The USDA reports that the country produces 1,000 tons of milled rice from 1,000 harvested hectares. Eventually, the government plans to increase the area planted to rice to 5,000 hectares, depending on the availability of suitable land that can be developed without damaging the ecological balance. To improve food security, the country has a goal of 60% self-sufficiency in rice by 2015 despite its limited land. The government has been seriously exploring ways to increase rice output since 1978, and indications are that it will continue to do so. Recent efforts are focused on availing of rice technical assistance and training from neighboring countries. Another option mentioned is entering into joint venture agreements with neighboring rice-producing countries to own and operate rice farms. 3.2 Cambodia
Economy Garments, construction, agriculture, and tourism have been driving Cambodia’s economic growth since 2004, causing real GDP to grow over 6% per year in 2010–2012, among the strongest in Southeast Asia. The garment industry accounts for 70% of the country’s total exports. The economy is composed of 34.7% agriculture, 24.3% industry, and 41% services. The population is 15.2 million and grows at 1.69% per year; 91% is below 55 years old. Per capita income is $2,400. Out of its labor force of 7.9 million, 55.8% is in agriculture, 16.9% in industry, and 27.3% in services. The local currency, the riel (KHR or KR), had an exchange rate of KR4,075 in 2012 and is projected to depreciate relative to the US dollar over the baseline, which will improve the country’s export competitiveness
Rice Supply and Demand The country harvested 2.77 million hectares of rice in 2011, yielding an average of 1.54 tons per hectare. Total milled rice production stands at 4.27 million tons, growing at 3.0% per year, mainly from yield growth (2.9%) as area is up only marginally (0.1%). Total rice consumption (3.45 million tons in 2011) grows at 2.1% annually and is projected to reach 4.34 million tons in 2022, mainly as a result of 1.5% population growth as per capita use increases only 0.60% per year. The country’s
ASEAN and Global Rice Situation and Outlook, 2011–2022 | 9
rice exports expand at 6.6% per year, which are estimated to double from 795,000 tons in 2011 to 1.6 million tons in 2022. The USDA’s rice export figures for Cambodia are much higher than those quoted or reported elsewhere because the USDA includes both the estimated cross-border trade and the official trade for rice. This reportedly involves some information gathering and verification from the ground. The USDA believes this approach makes the supply and demand data more realistic. As Cambodia attains improvements in yields and continues to have production surplus, rice exports are projected to expand steadily, doubling from 800,000 tons in 2011 to 1.61 million tons by 2022 (Table A3.2). However, to accelerate official rice exports at a sustained level, Cambodia needs to accomplish two things: to invest in infrastructure development, and to control and manage the reportedly rampant unofficial cross-border trade of unmilled rice into its neighboring countries. In so doing, the country’s farmers can benefit from improved value-added revenues by directly exporting milled rice. The settlement of the cross-border trade issue will require strong political will from top-level officials of the countries involved in formulating well-coordinated and implementable diplomatic solutions. 3.3 Indonesia
Economy During the global financial crisis, Indonesia outperformed its regional neighbors and joined the PRC and India as the only Group of 20 members that posted growth in 2009. Introducing a number of significant financial reforms and conservative fiscal policies, the country’s economy grew over 6% in 2010 and 2011. Estimated real GDP growth in 2012 is 6%. By sector, the country’s economy is composed of 15.4% agriculture, 46.5% industry, and 38.1% services. The country’s population is 251.2 million and projected to grow at 1.03% annually; 86% is under 55 years old. Per capita income is $5,000. Its labor force stands at 118 million, with 38.9% in agriculture, 22.2% in industry, and 47.9% in services. The local currency, the rupiah (IDR or Rp), had an exchange rate of Rp9,670 in 2012 and is projected to depreciate relative to the US dollar over the baseline period.
Rice Supply and Demand The country’s 12.16 million hectares of harvested rice produced 36.50 million tons of milled rice in 2011 at an average yield of 3.0 tons per hectare. Total rice production is projected to grow at 1.1% annually, solely from yield gain. The rate of land conversion to non-agricultural uses near urban areas in Java is at a reported high rate of 100,000 hectares per year. This has made it difficult to expand the rice area, which does not augur well for the country’s rice self-sufficiency goal. Total rice consumption (39.55 million tons in 2011) grows at 0.95% per year, mainly as a result of population growth as per capita consumption gains under 0.1% annually (Table A3.3). Indonesia sources about 6% of its domestic rice requirement from imports and its government has been constantly trying to limit importation. Recently, however, the country signed a 5-year agreement with Viet Nam to import 1.5 million tons of rice annually starting in 2013. The country’s rice imports recently declined dramatically, from 3.1 million tons in 2010 to under 2.0 million tons in 2011, due to the combination of increased domestic production and withdrawal from its stocks. During the same period, while the total area harvested increased by 85,000 hectares and the average yield improved by 60 kg per hectare, there was also a substantial decline of 18% (or 1.1 million tons) in its stocks. Rice imports are estimated to further contract to 1.8 million tons in 2012 as the country continues to resort to withdrawing from its stocks. Assuming a stock level equivalent to 26 days of

10 | Second ASEAN Rice Trade Forum 2013
consumption, annual rice imports are projected to remain around 2.8 million tons. This estimate is relatively low compared to the historical level of about 49 days during the last decade, but this is consistent with the stock management style shown recently by the Indonesian government. 3.4 Lao People’s Democratic Republic
Economy Still a one-party communist state, the country began decentralizing control and encouraging private enterprise in 1986, causing its economy to attain a robust growth north of 7% from 2008–2012, albeit from a low base. The Lao PDR, however, is heavily dependent on capital-intensive natural resource exports and is constrained by underdeveloped infrastructure especially in rural areas. By sector, the country’s economy is composed of 26.0% agriculture, 34.0% industry, and 40.0% services. The country’s population is 6.70 million and projected to grow at 1.65% per year; 91% is under 55 years old. Per capita income is $3,000. Out of its labor force of 3.7 million, 75.1% is in agriculture, and the rest in industry and services. Agriculture labor is dominated by rice cultivation in lowland areas. The local currency, the kip (LAK or KN), had an exchange rate of KN8,018 in 2012 and is expected to depreciate relative to the US dollar over the projection period.
Rice Supply and Demand The country has 817,000 hectares of rice, producing 1.4 million tons of milled rice in 2011 at an average yield of 1.71 tons per hectare. Total rice production is estimated at 3.4% per year, of which 2.1% comes from yield and 1.3% from the annual gain in area harvested. Total rice consumption (1.44 million tons in 2011) grows at 1.63% per year, resulting mainly from population growth as per capita rice consumption grows only 0.09% annually over the baseline period. With production growing faster than consumption, the country is expected to become a minor rice exporter over the next decade, with shipments projected to grow from 9,000 tons in 2016 to 295,000 tons by 2022 (Table A3.4). 3.5 Malaysia
Economy Malaysia’s economy is driven by exports, mainly electronics, oil and gas, palm oil, and rubber. However, the current government is reportedly trying to boost domestic demand and reduce dependence on exports. The country’s economy grew by 4.5% in 2012. By sector, the country’s economy is composed of 11.9% agriculture, 41.2% industry, and 46.8% services. The population is 29.63 million and projected to grow at 1.54% per year; 87% is under 55 years old. Per capita income is $16,900. The labor force stands at 12.92 million, with 11.1% in agriculture, 36.0% in industry, and 53.5% in services. The local currency, the ringgit (MYR or RM), is projected to have a stable exchange rate of around RM3.07 to the US dollar over the baseline period.
Rice Supply and Demand The country harvested 675,000 hectares of rice in 2011, producing 1.69 million tons of milled rice at an average yield of 2.50 tons per hectare. Total rice production grows at 1.33% annually, coming from yield improvement of 0.98% and an increase in area harvested of 0.34%. For the longer term, the government is reportedly encouraging large-scale private-sector commercial paddy production, especially in the states of Sabah and Sarawak where land is still abundant.

ASEAN and Global Rice Situation and Outlook, 2011–2022 | 11
The government has reportedly reduced the rice self-sufficiency target to 70% from the original goal of 90%. Under the new food security policy, the government’s strategies are designed to ensure a sufficient supply of rice that include maintaining a government rice stockpile equivalent to 45 days of consumption, entering into long-term contract agreements to import rice, and increasing the productivity of existing rice areas through infrastructure upgrade, without developing new areas. Total rice consumption (2.71 million tons in 2011) grows at 1.90% per year, which is largely due to population growth as per capita consumption is up only 0.50% annually. Rice self-sufficiency is currently around 60%. The balance of Malaysia’s rice needs is sourced mainly from Viet Nam, Thailand, and Pakistan, in that order. The country’s net rice imports are estimated to grow by 2.3% per year, from 1.08 million tons in 2011 to 1.39 million tons by 2022 (Table A3.5). 3.6 Myanmar
Economy Myanmar is a resource-rich country but its economy is reportedly constrained by pervasive government controls, inefficient economic policies, and rural poverty. While the government has good economic relations with neighboring countries, significant improvements are needed in the business climate and the political situation to attract serious foreign investments. Despite the constraints, however, the country’s economy attained real growth of 5.5% in 2011 and 6.2% in 2012. By sector, the country’s economy is composed of 38.8% agriculture, 19.3% industry, and 41.8% services. The country’s population is 55.17 million and grows at 1.07% per year; 88% is under 55 years old. Per capita income is $1,400. The labor force totals 33.41 million, with 70.0% in agriculture, 7.0% in industry, and 23.0% in services. The local currency, the kyat (MMK or MK), had an exchange rate of MK868 in 2012 and is projected to have a relatively stable exchange rate with the US dollar over the baseline.
Rice Supply and Demand The country’s harvested rice area is projected to expand at 0.65% per year, from 6.5 million hectares in 2011 to nearly 7.0 million hectares in 2022. Total milled rice production reached 10.82 million tons in 2011 and is growing at 1.94% per year, 1.29% of which comes from yield growth. Average yield is forecasted to improve from 1.66 tons per hectare in 2011 to 1.92 tons per hectare in 2022. Total rice consumption will increase from 10.2 million tons in 2011 to 11.7 million tons in 2022, equivalent to a growth of 1.25% annually, with nearly 1.0% resulting from population growth and 0.26% from per capita consumption (Table A3.6). As Myanmar’s yield-based growth in domestic rice output continues to exceed that of domestic consumption, rice exports are projected to expand steadily over the baseline, from 690,000 tons in 2011 to 1.59 million tons by 2022. As in the case of Cambodia, adequate investments in infrastructure development will be required to achieve this level of growth. The country has promising opportunities to expand its rice exports due to substantial improvements in milling facilities. Since 1990, the number of rice mills reportedly increased from 225 to 1,230, rice polishers from 10 to 28, and color sorters from 1 to 9. These improvements should support postharvest quality and loss reduction, which would augur well for expanding the country’s presence in the global rice market.

12 | Second ASEAN Rice Trade Forum 2013
3.7 Philippines
Economy Driven by consumer demand, exports, investments, and election-related spending, the Philippine economy expanded by 7.6% in 2010. Growth slowed to 3.9% in 2011 but recovered and grew by 6.6% in 2012. The country weathered the recent global recession better than most of its Asian neighbors due to its minimal exposure to troubled international investments, lower dependence on exports, relatively resilient domestic consumption, a growing outsourcing industry on business processing, and strong support from the dollar remittances of overseas workers. By sector, the country’s GDP is composed of 11.9% agriculture, 31.1% industry, and 57.0% services. The country’s population is 105.72 million and grows at 1.87% per year; 90% is under 55 years old. Per capita income stands at $4,300. The country has a labor force of 40.36 million, with 32.0% in agriculture, 15.0% in industry, and 53.0% in services. The exchange rate of the Philippine peso (PHP or P), the local currency, was P42.23 in 2012 and is projected to depreciate slightly relative to the US dollar over the baseline
Rice Supply and Demand The country produced 10.70 million tons of milled rice from 4.58 million hectares in 2011, based on an average yield of 2.34 tons per hectare. Total rice production is projected to grow at 1.91% annually, largely from yield improvements (1.80%) by using more hybrids, as potential expansion in harvested area is limited. Rice faces land use competition from industrialization and the growth of the real estate sector in the country (Oryza 2013). This makes rice area expansion and the attainment of the country’s rice self-sufficiency goal much more challenging. Total rice consumption is estimated to grow at 1.71% per year, from 12.85 million tons in 2011 to 15.48 million tons in 2022, solely as a result of population growth as per capita consumption declines marginally (Table A3.7). The Philippines imports about 14% of its domestic rice requirement, and the government tries to limit importation in line with its self-sufficiency target in 2013. The government planned to reduce rice imports from 1.5 million tons in 2011 to 0.5 million tons in 2012 by increasing support to farmers and encouraging the use of hybrids. However, to maintain a reasonable stock level, it is assessed that the country has to import an estimated 1.9 million tons in 2012. Assuming that a stock level equivalent to 50 days of consumption is maintained, annual rice imports are projected to remain around 2.2 million tons. This amount is below the country’s historical stock level of about 126 days during the last decade—or even the Philippine government’s 90-day buffer stock policy. However, this is in line with the recent practice of the government to minimize rice importation in support of the country’s self-sufficiency goal. 3.8 Singapore
Economy Singapore has a very successful free market economy that depends heavily on the exportation of consumer electronics, information technology products, pharmaceuticals, and financial services. The country’s average real GDP grew above 8% in the 4 years preceding the global financial crisis, but contracted as exports weakened during the crisis, then recovered in 2010 and 2011, before declining again to 1.3% in 2012 as a result of the recession in Europe. Singapore’s economy is composed of 26.8% industry, 73.2% services, and marginal agriculture. The country’s per capita

ASEAN and Global Rice Situation and Outlook, 2011–2022 | 13
income is $60,900, the seventh highest in the world. In Asia, only Qatar has a higher level of income at $102,800, which is also the highest in the world. The country’s population is 5.46 million and grows at 1.99% per year; 82% is under 55 years old. Out of its labor force of 3.62 million, 0.1% is in agriculture, 19.6% in industry, and 80.3% in services. The local currency, the Singapore dollar (SGD or S$), had an exchange rate of S$1.25 in 2012 and is projected to appreciate slightly relative to the US dollar over the next decade.
Rice Supply and Demand The country does not produce rice, depending entirely on the international market for its domestic rice needs. The USDA does not show any rice stocks for the country, so imports are assumed to simply match total consumption. The country’s imports are projected to grow at 0.83% annually, from 350,000 in 2011 to 383,000 by 2022 (Table A3.8). To ensure food security, the country is reportedly aiming to transform itself from being a passive food importer to a more active contributor to the regional and global food system through urban agribusiness, realizing that it has little land to grow its own food. The strategy has four prongs: (i) to accelerate research and development; (ii) to turn Singapore into an agribusiness hub where the private sector will play a key role; (iii) to develop Singapore’s own domestic market into a “test lab” for urban agriculture (e.g., “rooftop farming”); and (iv) to shift toward greater local production of three key food items—eggs, leafy vegetables, and fish (Kassim 2011). 3.9 Thailand
Economy Growth in Thailand’s economy is driven by industrial and agricultural exports, consisting mainly of electronics, agricultural commodities, automobiles and parts, and processed foods. Thailand’s economy expanded 7.8% in 2010, but growth was interrupted in the last quarter of 2011 by historic flooding in the industrial areas of Bangkok and the surrounding provinces. The economy recovered in 2012, with the GDP growing at 5.5%. The economy is composed of 8.6% agriculture, 39.0% industry, and 52.4% services. The population is 67.45 million and growing at 0.54% per year; 80% is under 55 years old. Per capita income is $10,000. The country has a labor force of 39.77 million, with 38.2% in agriculture, 13.6% in industry, and 48.2% in services. The local currency, the baht (THB or B), had an exchange rate of B31.09 in 2012 and is projected to be stable relative to the US dollar over the baseline.
Rice Supply and Demand The country harvested 11.0 million hectares of rice in 2011, yielding 1.86 tons per hectare on average. Total milled rice production is 20.46 million tons, growing at 0.89% per year, which solely comes from yield growth as area harvested is flat over the projection period. Total rice consumption (10.40 million tons in 2011) is projected to grow at 0.41% annually, solely due to population growth as per capita use declines marginally over the same period (Table A3.9). The rice pledging scheme implemented by the government starting in October 2011 has constrained Thai rice exports, causing a substantial decline in shipments and a consequent excessive buildup in stocks. The government announced recently that a portion of the rice stocks, especially the old crop, will be sold through the open market and government-to-government
14 | Second ASEAN Rice Trade Forum 2013
arrangements—even at a loss. The country has to do this not only to get rid of the deteriorating old rice crops in storage but also to recoup its top position in global rice trade, which it has recently lost to India. The country’s chances are favorable, given its good infrastructure resources and concerted focus on developing a strong presence in branded high-quality rice (Wailes and Chavez 2013b). The baseline thus projects that Thailand will eventually regain its leading market share in the international rice market. 3.10 Viet Nam
Economy In recent years, the Vietnamese government has reaffirmed its commitment to economic modernization. Membership in the WTO in January 2007 has promoted export-driven industries. Vietnam also became an official negotiating partner in the Trans-Pacific Partnership trade agreement in 2010. The global recession hurt Viet Nam's export-oriented economy, with the GDP growing at only 5%, its slowest rate of growth since 1999. In 2012, however, annual exports recovered and expanded more than 18%. The country’s economy is projected to have a robust growth of about 6.5% over the projection period—one of the strongest among the ASEAN economies. Viet Nam’s economy is composed of 21.5% agriculture, 40.7% industry, and 37.7% services. The country’s population is 92.48 million and growing at 1.05% annually; 87% is under 55 years old. Per capita income is $3,500. The labor force of 39.77 million constitutes 48.0% in agriculture, 21.0% in industry, and 31.0% in services. The local currency, the dong (VND or D), had an exchange rate of D20,828 in 2012 and is projected to depreciate relative to the US dollar over the baseline.
Rice Supply and Demand The country harvested 7.74 million hectares and produced 27.08 million tons of milled rice in 2011, or an average yield of 3.50 tons per hectare, which grows at 0.83% annually. Total milled rice production grows at 0.57% per year, all of which comes from yield growth as area harvested contracts by 0.26% annually. Total rice consumption (19.65 million tons in 2011) grows at 0.90% per year, solely due to population growth as per capita consumption declines by 0.04% per year (Table A3.10). Taking advantage of reduced rice exports from Thailand as a result of the paddy pledging scheme, Viet Nam (along with India and Pakistan) has expanded its rice exports and pegged its price at very competitive world reference levels. As a result, Viet Nam’s net rice exports in 2011 exceeded that of Thailand’s by 1.3 million tons. The country aims to strengthen its presence in the international market by focusing on improved rice quality and by expanding export opportunities to new markets such as the PRC. An issue that the country may have to address is the reported unofficial cross-border rice trade coming from its neighboring countries. As growth in Viet Nam’s total domestic rice consumption exceeds domestic output, the country’s exports are projected to be relatively flat, around 7.0 million tons over the baseline.
4. Global Rice Outlook 4.1 International Rice Prices The international rice prices are highly volatile due to a number of reasons. Rice has inelastic supply

ASEAN and Global Rice Situation and Outlook, 2011–2022 | 15
and demand throughout much of Asia, where it is the dominant food staple. While rice is the primary staple for half of the world’s population, it is thinly traded. Only about 7% of rice production is traded as opposed to 10% for coarse grains and 16% for wheat (Wailes and Chavez 2012). The international rice trade is highly concentrated, with five dominant players—Thailand, India, Viet Nam, Pakistan, and the US, in that order—accounting for 89% of global net trade. Despite slow growth in rice consumption, increased rice output, driven by the use of higher-yielding varieties and hybrids and other improved production technologies as well as the more focused self-sufficiency programs of major rice-consuming countries, is expected to expand supply. This will dampen international rice prices over the next decade. The situation is beneficial for food-deficit rice-importing countries in the developing world but could have uncertain response from rice producers and exporters (Wailes and Chavez 2013b). The average international long-grain rice reference price is projected to decline steadily from $477 per ton in 2011 to $430 per ton in 2022. The average medium-grain rice price, however, would be generally stable above $800 per ton over the same period (Figure 4).
Figure 4: World Rice Prices, 1995–2022
LG = long-grain (rice), MG = medium-grain (rice), FOB = freight on board, CA = California. Source: Wailes and Chavez.
4.2 Global Rice Supply and Demand Rice is the most important food crop of the developing world and the staple food of more than half of the world's population, accounting for more than 20% of daily caloric requirement (IRRI 2013). World rice production, rice consumption, rice stocks, and rice trade projections are shown in Table 1. The stocks-to-use ratio is projected to increase to more than 28% over the projection period, providing a potential improvement in global rice and food security. Over the baseline period (2011–2022), the world rice output grows at 0.8% per year, with 0.7% coming from yield improvement and 0.1% from slight growth in area harvested (Figure 5 and Table 1). Driven solely by population growth, the total global rice consumption gains 0.9% annually as the average world per capita rice use declines slightly (Figure 5 and Table A5.2).

16 | Second ASEAN Rice Trade Forum 2013
Table 1: World Rice Supply and Utilization, 2011–2022
11/12 12/13 13/14 14/15 15/16 16/17 17/18 18/19 19/20 20/21 21/22 22/23
(Thousand Hectares)
Area Harvested 159,173 159,036 160,083 160,188 160,435 160,913 160,848 160,981 161,007 160,976 160,888 160,720
(Tons per Hectare)
Yield 2.93 2.95 2.97 3.00 3.03 3.04 3.06 3.08 3.10 3.12 3.14 3.16
(Thousand Tons)
Production 467,043 469,431 475,486 481,114 485,700 489,882 492,108 495,391 498,816 502,278 505,734 508,407
Beginning Stocks 98,821 106,100 105,798 108,486 112,694 117,169 122,489 126,835 130,941 134,467 138,124 141,160
Domestic Supply 565,863 575,531 581,285 589,599 598,394 607,051 614,597 622,225 629,757 636,745 643,858 649,567
Consumption 458,248 470,038 473,070 477,129 481,434 484,761 487,984 491,526 495,525 498,834 502,922 506,084
Ending Stocks 106,100 105,798 108,486 112,694 117,169 122,489 126,835 130,941 134,467 138,124 141,160 143,695
Domestic Use 564,349 575,837 581,555 589,823 598,603 607,250 614,818 622,467 629,991 636,958 644,082 649,778
Total Trade 39,335 36,496 37,883 39,146 39,893 40,449 40,779 41,189 41,649 42,039 42,872 43,371
(Percent)
Stocks-to-Use Ratio 23.15 22.51 22.93 23.62 24.34 25.27 25.99 26.64 27.14 27.69 28.07 28.39
Source: Wailes and Chavez.
Figure 5: World Rice Area Harvested, Yield, Supply and Utilization
Source: Wailes and Chavez.
4.3 Key Global Policy Assumptions Two recent events have had significant impacts on the dynamics of the global rice market: one is India’s official lifting of its ban on non-basmati rice exports on September 2011, and the other is Thailand’s implementation of its paddy pledging scheme in October 2011. India’s return as a major rice exporter was motivated by the need to reduce excessive rice stocks that accumulated as a result of the export ban and by good weather conditions in 2009 and 2010. The Thai price-floor support policy for Thai farmers guarantees minimum prices for paddy rice that results in a long-grain milled rice price. Since the policy’s initial implementation, the paddy pledging price continues to be 30%–50% higher than trading prices offered by other export competitors such as Viet Nam as well as India and Pakistan. While Thailand’s intervention program is market distorting because producers are paid higher than world market prices, the policy has not adversely affected international rice trade as much as initially anticipated. This is because of abundant exportable rice stocks and increased price competition from the other major rice-exporting countries—India, Pakistan, Viet Nam, and

ASEAN and Global Rice Situation and Outlook, 2011–2022 | 17
increasingly, Cambodia and Myanmar. Consequently, Thailand’s rice export volumes in 2011 declined dramatically by 44% while rice export supplies from the other major exporters dominated international trade (Figure 3). Thailand’s share of global net rice exports declined to 19% in 2011 compared to a historical average of 34% during the 5-year period of 2006–2010 (Wailes and Chavez 2013b). 4.4 Global Rice Trade While criticism and opposition to the Thai pledging scheme abound, the government of Thailand has reauthorized the extension of the program for marketing years 2012–2013 and 2013–2014. As expected, with Thailand’s mounting rice stocks, burdensome costs of storage, and limited export shipments because of non-competitive high prices, Thailand recently announced a plan to release a portion of its stocks from previous seasons to the international market at a loss (The New York Times 2013). The baseline assumes a continuation of this policy and the willingness of the Thai government to export at a loss. As depicted in Figure 6, the baseline projects a return to a larger export share for Thailand and to a consequent increase in the global share of ASEAN net rice exports from 47% in 2011–2012 to 55% by 2021–2022 (Table A2.2 and Table A5.1).
Figure 6: Regional Shares of World Net Rice Trade, 2011–2022
Source: Wailes and Chavez.
The bulk of the world net rice imports are shipped to countries in Africa, ASEAN, and other Asian regions (Table A5.1). Figure 6 also shows the projected shifts in regional rice import shares. The projections suggest that ASEAN net rice import shares will increase slightly from 15% in 2011–2012 to 17% by 2021–2022 as efforts to attain self-sufficiency are offset by population growth in Indonesia, Malaysia, and the Philippines (Table A2.5). The dominant rice-importing region, Africa, will maintain an import share of 40% over the projection period. Significant growth is projected for other Asian regions (Bangladesh, the PRC, and the Middle Eastern countries), increasing from 27% in 2011–2012 to 32% by 2021–2022. Accessing other markets in Africa and Asia will thus provide a growth opportunity for ASEAN rice-exporting countries. 4.5 Key Non-ASEAN Rice Countries There is no doubt that the resumption of India’s long-grain rice exports, which began in September 2011, has had substantial effects on international rice trade and prices. To a large extent, it has neutralized the potential upward price impact of Thailand’s paddy pledging scheme. As a result, global rice prices have remained stable at relatively lower levels—benefiting consumers especially in food-deficit countries. A relatively recent development in global trade is the emergence of the
18 | Second ASEAN Rice Trade Forum 2013
PRC as a major rice importer, which has been taking advantage of attractive lower rice prices over the last couple of years. Hence, a baseline outlook for other key Asian countries is useful. 4.6 People’s Republic of China
Economy Since the PRC has restructured its economy from a closed, centrally-planned system to greater market orientation in the late 1970s, the efficiency gains have caused its GDP to expand over tenfold since 1978. The country became the world’s largest merchandise exporter in 2010. The economy grew by 7.8% in 2012, albeit lower than the 9.3% growth registered in 2011 and 10.4% in 2010. The economy is projected to have robust growth over the next decade, although at a pace slightly lower than in previous years. The economy is composed of 10.1% agriculture, 45.3% industry, and 44.6% services. The PRC is the world’s most populous country, with a population of 1,349,600, which is only growing at 0.48% per year; 79% of the population is under 55 years. Per capita income is $9,100. The country has a massive labor force of 795.4 million, with 34.8% in agriculture, 29.5% in industry, and 35.7% in services. The local currency, the renminbi (RMB) or yuan (CNY), had an exchange rate of CNY6.31 in 2012 and is projected to appreciate relative to the US dollar over the baseline.
Rice Supply and Demand The PRC harvested 30.06 million hectares of rice and produced 140.7 million tons of milled rice in 2011 at an average yield of 4.68 tons per hectare. Yields are expected to grow at 0.66% annually. Total milled rice production declines at 0.17% per year, as a 0.82% annual contraction in area exceeds gains in average yield. The total rice area is projected to contract by 2.6 million hectares over the next decade as the country’s agricultural economy diversifies. Total rice consumption is estimated to decline by 0.17% per year, as the population growth of 0.36% per year is not enough to compensate for the annual decline in per capita use of 0.53%. The country was a net rice exporter of about 633,000 tons per year during 2005–2009. But in reaction to lower international rice prices, it became a significant net rice importer in 2011 (with 1.79 million tons of rice imports and 0.44 million tons of rice exports) and in 2012 (with 2.42 million tons of rice imports and 0.50 million tons of rice exports). Over the baseline, the country is projected to remain a net rice importer by an average of 1.0 million tons. The PRC maintains a relatively high stocks-to-use ratio of 0.32 to 0.50, which augurs well for its food security (Table A4.1). 4.7 Japan
Economy Government stimulus spending helped the economy recover in late 2009 and 2010 from the recession in 2008. However, the economy contracted again in 2011 as the massive 9.0 magnitude earthquake and subsequent tsunami hit Japan’s northeast Pacific coastal region on 11 March 2011, disrupting the manufacturing sector. The USDA reported that the disaster took the lives of over 24,000 people, and damaged about 23,600 hectares of arable land. Estimates of physical and infrastructural damages to the agriculture, fishery, and forestry sectors have reached $30 billion. According to the USDA, “During this unprecedented crisis, Japan’s food supply system demonstrated remarkable resilience and strength in its ability to secure ample, undisrupted supplies of food for people in the affected regions and feed for livestock animals—attesting to the robustness of Japan’s food security system, which relies on both domestic production and the availability of

ASEAN and Global Rice Situation and Outlook, 2011–2022 | 19
reliable imports” (USDA FAS 2012). Japan’s real GDP contracted by 0.8% in 2011 from a growth of 4.5% in 2010, and is estimated to be relatively flat at 0.2% in 2012. By sector, the economy is composed of 1.2% agriculture, 27.5% industry, and 71.4% services. The country’s population is 127.25 million, which is declining at 0.08% per year; 61% is under 55 years old. Per capita income stands at $36,200. The labor force is 65.02 million, 3.9% of which is in agriculture, 26.2% in industry, and 69.8% in services. The local currency, the yen (JPY or ¥), had an exchange rate of ¥79.42 in 2012 and is projected to appreciate relative to the US dollar over the next decade.
Rice Supply and Demand The country harvested 1.58 million hectares of rice in 2011, producing 7.65 million tons of milled rice at an average yield of 4.85 tons per hectare. The model assumes the country to be an entirely medium-grain rice market. Total rice production is estimated to decline by 0.94% annually, as the area harvested contracts by 0.89% and the yield declines marginally. Total rice consumption declines by 0.76% per year due to the combined effects of contraction in both the population level (0.20%) and per capita use (0.56%). Bread consumption has taken dietary share from rice as a main source of carbohydrates as Japanese tastes have increasingly shifted to more Western diets. As a result of the sharp rise in US corn prices since the summer of 2012, the ratio of corn used in compound feeds in the country decreased in favor of nonconventional grains such as rice, wheat, and sorghum (USDA FAS 2012b). The country’s net rice imports remain generally stable at the WTO minimum access level of 482,000 tons over the projection period (Table A4.2). 4.8 Republic of Korea
Economy High-tech and industrialized, the economy of the Republic of Korea is the 12th largest in the world.The country has adopted a number of economic policies and reforms, including the promotion of importation of raw materials and technology at the expense of consumer goods; the encouragement of savings and investments over consumption; and greater openness to foreign investments and imports. However, real GDP growth slowed from 6.3% in 2010 to 3.6% in 2011, and was estimated to further weaken to 2.0% in 2012, as the country relies heavily on exports that have contracted in recent years due to the financial crisis. By sector, the economy is composed of 2.7% agriculture, 39.8% industry, and 57.5% services. The population is 48.95 million and growing at 0.2% per year; 76% is under 55 years old. Per capita income is $32,400. Out of the labor force of 25.5 million, 6.2% is in agriculture, 23.8% in industry, and 70.0 % in services. The local currency, the won (KRW or W) has an exchange rate of W1,127 and is projected to appreciate relative to the US dollar over the baseline period.
Rice Supply and Demand The country harvested 854,000 hectares of rice in 2011, producing 4.22 million tons of milled rice at an average yield of 4.95 tons per hectare. As in the case of Japan, the Republic of Korea’s rice market is assumed to be all medium grain. Total rice production is projected to decline at 0.24% annually, as the yield growth of 0.47% is not enough to compensate for an annual decline of 0.71% in area harvested. The government is reportedly encouraging rice farmers to plant other crops due to bumper rice crops in recent years. Total rice consumption is calculated to decline by 1.03% per

20 | Second ASEAN Rice Trade Forum 2013
year, from 4.98 million tons in 2011 to 4.44 million tons in 2022, as the slight population growth of 0.12% partially offsets the decline in per capita consumption of 1.15% per year. The country’s annual rice imports are generally stable based on the preset WTO minimum access level (Table A4.3). 4.9 India
Economy India is developing into an open market economy and is projected to have one of the highest real GDP growth rates in Asia over the next decade. The country has a diverse economy that includes village farming, modern agriculture, handicrafts, and a wide range of modern industries and services. By sector, the economy is composed of 17.0% agriculture, 18.0% industry, and 65.0% services. The population is projected to grow to 1,220,800, increasing at 1.31% annually; nearly 88% is under 55 years old. Per capita income is $3,900. India has a big labor force of 498.4 million, second only to China, with 53.0% in agriculture, 19.0% in industry, and 28.0% in services. The local currency, the Indian rupee (INR or Re/Rs), had an exchange rate of Rs53.17 in 2012 and is projected to appreciate slightly relative to the US dollar over the next decade.
Rice Supply and Demand India harvested 44.1 million hectares of rice in 2011, producing 105.3 million tons of milled rice at an average yield of 2.39 tons per hectare. Total milled rice production grows at 0.84% per year, of which 0.70% comes from yield growth and 0.14% from a gain in area harvested. Despite strong government promotion, the area planted to hybrid rice was only about 1.5 million hectares in 2011–2012, mostly in eastern India. There are 26 popular hybrids in the market but several challenges reportedly remain, such as the inability to cater to the very diverse consumer preferences for rice, low incremental yields, higher irrigation and chemical input requirements, low milling rates, and the poor cooking quality of hybrid rice compared to traditional varieties. Total rice consumption is calculated to grow at 1.22% annually, from 93.3 million tons in 2011 to 106.7 million tons in 2022, solely due to population growth as per capita use is flat (Table A4.4). Due to its mounting rice stocks, India officially lifted its ban on non-basmati rice exports on 9 September 2011, putting downward pressure on both the domestic rice prices and international reference prices. Recently, the country has embarked on an ambitious plan to create a legal entitlement to subsidized food grains for 63.5% of its population. However, funding and the implementation logistics of this program remain a big challenge. 4.10 Pakistan
Economy A combination of internal political conflicts and low levels of foreign investments have led to the country’s relatively slow economic growth. The economy grew around 3.0% in 2010–2011 and 3.7% in 2012. The economy is composed of 20.1% agriculture, 25.5% industry, and 54.4% services. The population is 193.24 million and growing at 1.55% per year; nearly 91% is under 55 years old. Per capita income is $2,900. Out of the labor force of 60.36 million, 45.1% is in agriculture, 20.7% in industry, and 34.2 % in services. The local currency, the Pakistani rupee (PKR or PRe/PRs), had an exchange rate of PRs95.1 in 2012 and is projected to depreciate relative to the US dollar over the next decade.

ASEAN and Global Rice Situation and Outlook, 2011–2022 | 21
Rice Supply and Demand Pakistan harvested 2.75 million hectares of rice in 2011, producing 6.50 million tons of milled rice for an average yield of 2.36 tons per hectare. Total milled rice production grows at 1.06% per year, of which 0.52% comes from yield growth and 0.54% from the expansion in harvested area. The area planted to basmati rice has reportedly declined by 27% over the last 3 years. Farmers are gradually shifting from basmati rice to non-basmati hybrid varieties due to better yields and a shorter growing cycle that allows the earlier planting of wheat. The country’s rice sector has recovered well from 2 consecutive years of floods. Damaged infrastructure, especially rice mills in Sindh, have largely been restored. Total rice consumption (2.56 million tons in 2011) grows at 2.44% annually due to a population growth of 1.47% and a gain in per capita use of 0.97% (Table A4.5). The country is projected to be a relatively reliable rice exporter over the baseline period, with annual shipments increasing steadily from 3.44 million tons in 2011 to 3.94 million tons in 2022. Rice trade in Pakistan was liberalized in the 1990s and rice traders have responded well by taking a leading role in the rice market. Exporters have made huge investments in rice processing equipment, installing state-of-the-art imported machinery to improve the quality of rice, thus enhancing the competitiveness of Pakistan’s rice in the world market (USDA FAS 2012).
5. Stochastic Analysis 5.1 Baseline Results In light of the structural characteristics of the global rice economy, this section presents a stochastic analysis to provide a better understanding of the likely upper and lower bounds for selected variables. The results of the stochastic analyses for ASEAN regional rice prices and international rice prices are further illustrated in the charts in Appendix 6. To show the direction and spread of the stochastic outcome distribution, three outcome items for selected variables are presented—the stochastic average, the 10th percentile, and the 90th percentile. Intuitively, the gap between the two percentiles (10th and 90th) indicates the magnitude of price volatility. Widening indicates increased price volatility while narrowing indicates decreased price volatility. Another measure of dispersion of a probability distribution is the coefficient of variation, which is defined as the standard deviation divided by the mean. For purposes of brevity, only two representative charts (the long-grain rice international reference price and the ASEAN rice ending stocks) are discussed in this section, which can then be used as patterns in explaining the rest of the charts in Appendix 6. The information projected in each of the charts is similar in principle. Figure 7 shows the long-grain rice international reference prices. For 2013, while the mean price is $422 per ton, the stochastic distribution indicates that 10% of the time, the average price will be higher than $506 per ton and lower than $368 per ton. That is, the gap between the two percentiles is $138 per ton. This gap varies across the estimation period. The computed coefficient of variation for 2013 is 0.127.

22 | Second ASEAN Rice Trade Forum 2013
Figure 7: Long-Grain Rice International Reference Prices (Stochastic Projection)
Source: Wailes and Chavez.
Figure 8 traces the path of the ASEAN’s ending stocks of rice. While in 2013, the mean is 21.9 million tons, the stochastic distribution shows that 10% of the time, the average ending stocks will be higher than 22.5 million tons and lower than 20.2 million tons 10% of the time. Note that the volatility as indicated by the gap is milder for rice stocks. In this case, the coefficient of variation for 2013 is 0.041.
Figure 8: ASEAN Rice Ending Stocks (Stochastic Projection)
Source: Wailes and Chavez.
Again, a similar analysis can be made for the rest of the stochastic charts in Appendix 6. The same principle holds, with the difference lying only with varying units and absolute numbers. This feature of the stochastic analysis provides an advantage as it indicates how the outcomes are distributed by providing information on risk and uncertainty, which is an important characteristic of agricultural commodity enterprises and markets, such as that of rice. Thus, the stochastic analysis

ASEAN and Global Rice Situation and Outlook, 2011–2022 | 23
complements the basic information generated by the deterministic analysis—i.e., it provides a better understanding of the dynamics of the global rice market. 5.2 Use of the Baseline for Assessing Self-Sufficiency and Trade Impacts This AGRM baseline and the stochastic model provide an analytical framework that lends itself to assessing what level of an increased productivity would be necessary to achieve self-sufficiency. Figures 9 and 10 depict the baseline yield projection for Indonesia and the Philippines, and the implied yield gap to achieve self-sufficiency while holding area harvested constant. For Indonesia, the baseline gap is in the range of 7% to 9%, and for the Philippines, the gap is 17.5% to 19%.
Figure 9: Indonesia’s Baseline Yield Gap to Achieve Self-Sufficiency
mt = metric ton, ha = hectare. Source: Wailes and Chavez.
Figure 10: Philippines’ Baseline Yield Gap to Achieve Self-Sufficiency
mt = metric ton, ha = hectare. Source: Wailes and Chavez.
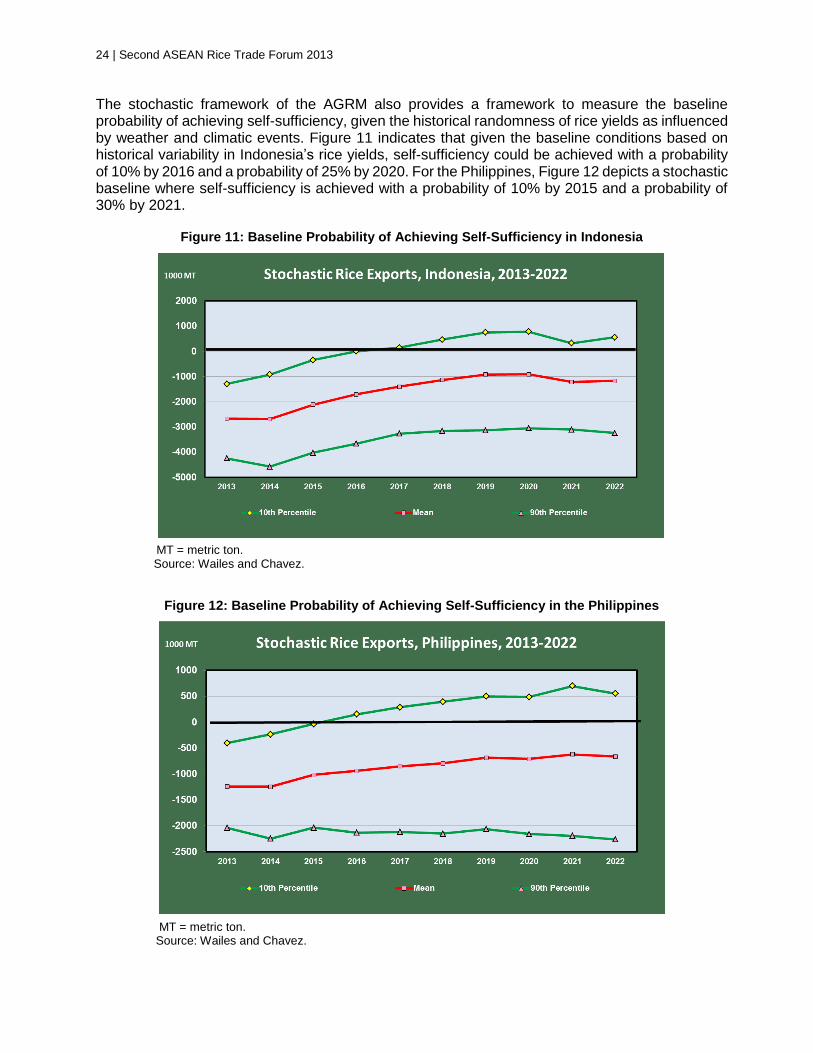
24 | Second ASEAN Rice Trade Forum 2013
The stochastic framework of the AGRM also provides a framework to measure the baseline probability of achieving self-sufficiency, given the historical randomness of rice yields as influenced by weather and climatic events. Figure 11 indicates that given the baseline conditions based on historical variability in Indonesia’s rice yields, self-sufficiency could be achieved with a probability of 10% by 2016 and a probability of 25% by 2020. For the Philippines, Figure 12 depicts a stochastic baseline where self-sufficiency is achieved with a probability of 10% by 2015 and a probability of 30% by 2021.
Figure 11: Baseline Probability of Achieving Self-Sufficiency in Indonesia
MT = metric ton. Source: Wailes and Chavez.
Figure 12: Baseline Probability of Achieving Self-Sufficiency in the Philippines
MT = metric ton. Source: Wailes and Chavez.

ASEAN and Global Rice Situation and Outlook, 2011–2022 | 25
Finally, an assessment of the externality effects of achieving self-sufficiency by a major rice- importing country can be made using the model to show impacts for specific rice exporters and world rice prices. Table 2 shows that achieving self-sufficiency in Indonesia and the Philippines over the baseline beginning in 2013 would reduce exports from Viet Nam initially by 19% and after adjustment over time by 7%.
Table 2: Impact of Self-Sufficiency in Indonesia and the Philippines
on Baseline Rice Exports from Viet Nam
Source: Wailes and Chavez.
As relatively large rice importers, achieving self-sufficiency in the Philippines and Indonesia would have effects on world prices, lowering the baseline projected price by 18% initially and by 9% by 2022 (Table 3).
Table 3: Impact of Self-Sufficiency in Indonesia and the Philippines on Baseline World Long-Grain Rice Reference Price
Source: Wailes and Chavez.
6. Conclusion While the ASEAN and global rice economies are always subject to uncertainties in weather and policies, abundant supplies and slow growth in consumption have resulted in downward pressure on prices. Driven by the use of higher-yielding rice varieties and other improved production technologies, the outlook is expected to follow this trend. The focus on self-sufficiency by major rice-consuming countries is expected to restrain rice trade and dampen international rice prices over the next decade. Domestic price policy supports, coupled with good weather, have resulted in strong rice harvests in India and Thailand and large stock inventories. Import demand growth in other ASEAN countries is limited for similar reasons. Much of the projected growth in rice trade is expected to come from other regions, particularly Africa and the Middle East. Despite the desire for self-sufficiency and a trend for production to grow faster than demand, the major ASEAN rice importers—Indonesia and the Philippines—are expected to remain important importers. The expected expansion in rice exports from Cambodia and Myanmar will add to competitive price pressures that will result in lower international rice prices over time. Results of stochastic analysis, based on uncertainties associated with production, show that international long-grain rice reference prices are expected to range from $368 per metric ton to as
2013 2014 2015 2016 2017 2018 2019 2020 2021 2022
Self-sufficiency 5700 6046 6342 6123 6129 6142 6203 6511 6503 6663
Baseline 6998 7108 7190 6944 6901 6925 6966 7022 7009 7154
Change -1298 -1062 -848 -821 -772 -783 -763 -511 -507 -491
% Change -19% -15% -12% -12% -11% -11% -11% -7% -7% -7%
2013 2014 2015 2016 2017 2018 2019 2020 2021 2022
Self-sufficiency 347 328 356 360 355 358 378 368 371 392
Baseline 422 386 401 401 391 393 412 406 410 430
Change -75 -59 -46 -41 -36 -35 -34 -37 -39 -38
% Change -18% -15% -11% -10% -9% -9% -8% -9% -10% -9%

26 | Second ASEAN Rice Trade Forum 2013
high as $506 per metric ton, a gap of $138. Volatility in prices as a result of uncertain weather and policies therefore remains a persistent food security concern with the ASEAN and global rice economies. The baseline is shown to be useful as a framework to assess the yield gaps that exist to achieve country-level rice self-sufficiency. When simulated in a stochastic framework, the baseline can also generate probability estimates of achieving self-sufficiency under the baseline assumptions. Finally, the baseline is shown to be useful in estimating the impacts on world prices and exports from achieving self-sufficiency in traditionally large rice-importing nations such as Indonesia and the Philippines. Thus, not only are domestic costs important to consider but the external effects and broader costs also must be included, particularly with regard to a regional food security strategy that evaluates the trade-offs of rice trade and self-sufficiency.

ASEAN and Global Rice Situation and Outlook, 2011–2022 | 27
References
Association of Southeast Asian Nations (ASEAN). 1980. Joint Press Statement of the Meeting at Official Level between ASEAN and India. Kuala Lumpur, 16 May. http://www.aseansec.org/5733.htm (accessed 25 May 2012).
———. 1997. Joint Press Statement on the Inaugural Meeting on the Establishment of ASEAN
Pakistan Sectoral Dialogue Relations. Islamabad, Pakistan, 5–7 November. http://www.aseansec.org/5850.htm (accessed 25 May 2012).
Asian Development Bank (ADB). 2012. Asian Development Outlook 2012: Confronting rising
inequality in Asia. Mandaluyong City, Philippines: ADB. Central Intelligence Agency. 2013. The World Fact Book. https://www.cia.gov/library/
publications/the-world-factbook/
Food and Agricultural Policy Research Institute (FAPRI). 2012. U.S. Baseline Briefing Book:
Projections for Agricultural and Biofuel Markets. FAPRI-MU Report No. 01-12. March. http://www.fapri.missouri.edu/outreach/publications/2012/FAPRI_MU_Report_01_12.pdf
International Rice Research Institute (IRRI). 2013. Rice and poverty.
http://www.irri.org/index.php?option=com_k2&view=item&layout=item&id=9081&lang=en (accessed 4 April 2013).
Kassim, Y. R. 2011. Singapore’s Growing Role in Asian Food Security. East Asia Forum. 7
September. http://www.eastasiaforum.org/2011/09/07/singapore-s-growing-role-in-asian-food-security/ (accessed 4 April 2013).
Oryza. 2013. Philippines Focuses on Hybrid Rice Cultivation; Seed Companies Focus on
Philippines. 8 April. http://oryza.com/content/philippines-focuses-hybrid-rice-cultivation-seed-companies-focus-philippines (accessed 9 April 2013).
Penh Pal. 2012. Cambodian rice smuggling apparently driven by Thai government subsidy scheme.
1 May. http://penhpal.com/2012/04/cambodian-rice-smuggling-apparently-driven-by-thai-government-subsidy-scheme/ (accessed 5 April 2013).
Richardson, J. W., K. D. Schumann, and P. A. Feldman. 2008. Simulation and Econometrics to
Analyze Risk. College Station, Texas. The New York Times. 2013. Thailand Set to Sell Off Huge Stockpile of Rice. 28 March. United States Department of Agriculture Foreign Agricultural Service (USDA FAS). 2012a. Attaché
Reports. Global Agriculture Information Network Reports, Nos. JA 1007, 15 March 2012. ———. 2012b. Attaché Reports. Global Agriculture Information Network Reports, Nos. JA 1007,
15 March 2012. ———. 2013a. Attaché Reports. Global Agriculture Information Network Reports, Nos. KS 1202
and KS 1230.

28 | Second ASEAN Rice Trade Forum 2013
———. 2013b. Attaché Report. Global Agriculture Information Network Reports, Nos. ID 1237, 20 November 2012.
———. 2013c. Attaché Reports on Grain and Feed. Various issues. Wailes, E. J. 2012. Trade Scenarios in 2012 and Policy Options for Managing Price Volatility.
Presented at the Technical Workshop on Price Volatility and Trade cum Informal Meeting of AFSRB, ASEC, and ADB. Bangkok, Thailand, 26–27 January 2012.
Wailes, E. J., and E. C. Chavez. 2011. 2011 Updated Arkansas Global Rice Model. University of
Arkansas Department of Agricultural Economics and Agribusiness, Division of Agriculture Staff Paper 2011-01. http://ageconsearch.umn.edu/handle/102650
———. 2012. World Rice Outlook with Deterministic and Stochastic Components, 2012–2021.
University of Arkansas Department of Agricultural Economics and Agribusiness, Division of Agriculture Staff Paper 2012-01. http://ageconsearch.umn.edu/handle/123203
———. 2013a. US Drought Impacts on the US and International Rice Economies. In B. R. Wells
Rice Research Studies 2012, ed. R. J. Norman and K. A. K. Moldenhauer. University of Arkansas Agricultural Experiment Station Research Series.
———. 2013b. World Rice Outlook: International Rice Baseline Projections, 2012–2022. In B. R.
Wells Rice Research Studies 2012, ed. R. J. Norman and K. A. K. Moldenhauer. University of Arkansas Agricultural Experiment Station Research Series

Appendix 1 | 29
Rice Models of the Arkansas Global Rice Economics Program
Arkansas Global Rice Model The Arkansas Global Rice Model (AGRM) is a nonspatial, multicountry statistical simulation, and econometric analytical framework developed and maintained for 20 years by the University of Arkansas Global Rice Economics Program in Fayetteville, United States of America. The model is disaggregated into five world regions: Africa, the Americas, Asia, Europe, and Oceania. There are 45 key countries or regions explicitly included in the model, and all other countries not individually modeled, are included in one of the five rest-of-region models:6
Africa: Cameroon, Cote D’Ivoire, Egypt, Ghana, Guinea, Kenya, Liberia, Mali, Mozambique, Nigeria, Senegal, Sierra Leone, South Africa, Tanzania, and Rest-of-Africa
Americas: Argentina, Brazil, Canada, Colombia, Mexico, United States, Uruguay, and Rest-of-Americas
Asia: Bangladesh; Brunei Darussalam; Cambodia; People’s Republic of China; Hong Kong, China; India; Indonesia; Iran; Iraq; Japan; Republic of Korea; Lao People’s Democratic Republic; Malaysia; Myanmar; Pakistan; Philippines; Saudi Arabia; Singapore; Taipei,China; Thailand; Turkey; Viet Nam; and Rest-of-Asia
Europe: European Union (27 member countries) and Rest-of-Europe
Oceania: Australia and Rest-of-Oceania The AGRM can be used to generate annual projections of the world rice economy for a 10-year period and up to 2035. Simulation is conducted for the purpose of the baseline projection, scenarios on technology, trade, production shocks, consumption shocks, and policy analyses. The model can be used to generate both deterministic average outcomes and stochastic distribution of outcomes. The major components of a country or regional model in the AGRM include a supply sector, a demand sector, trade, stocks, and price linkage equations. As a system of equations, the model links countries through prices and trade to obtain global and national estimates that add up consistently using United States Department of Agriculture data. The model makes assumptions about key macroeconomic variables and links to other crop and livestock models. A key component is government-determined policy variables that reflect the various mechanisms by which countries intervene in their rice sector economy. Computationally, the simulation model solves for the set of farm-level, retail-level, and export (import) prices that simultaneously balances all markets (long- and medium-grain rice) in a given year. An international reference price (for long-grain rice) and California No. 2 medium-grain rice ex-mill price are used to balance the international rice markets, by equating net rice exports and net rice imports. Projections include national levels of rice production (area harvested and yields), rice consumption (per capita use multiplied by given population), net rice trade, rice stocks, and rice prices. The international rice market is unique because it is differentiated between long- and medium-grain rice markets and is also heavily distorted by respective government policies on taxes, subsidies, tariffs, etc. These policies are incorporated in the model's equations for supply, demand, export (or import),
6 The names of some countries or areas in this list have been adjusted in line with the official names under Asian
Development Bank guidelines.

30 | Appendix 1
stocks, and price transmission, and are thus implicitly reflected in the model solution.7 Riceflow Model Riceflow is a spatial partial equilibrium model of the global rice sector, with detailed specifications of the basic components of the rice supply chain:
(i) factors of production (land, labor, and capital) and intermediate inputs (fertilizer, pest control, fuel, etc.);
(ii) paddy production, area harvested, and yield per hectare; (iii) rice storage and drying costs and quantities; (iv) rice milling, costs of milling, and degree of milling; (v) rice wholesale and import/export shipments by country source or destination; and (vi) rice consumption.
The model builds from national or subnational models to generate disaggregated bilateral trade flow volumes subject to trade policies and import/export fees. It disaggregates rice by type depending on the availability of data (e.g., long grain, medium grain, fragrant, percent broken, and the degree of milling [white, brown, and paddy]). By treating sectors and products separately, the model allows for a detailed disaggregation by production systems, rice types, and household types, conditional on the existence of reliable data. Rice production in Riceflow is disaggregated into primary production, primary milling (paddy to brown), and secondary milling (brown to milled). The model is flexible to specify alternative production systems. Furthermore, a number of technology-related variables are defined to deal with technological changes affecting production at any stage. Riceflow also accounts for rice stocks, and allows the user to specify alternative behaviors regarding stock management, such as for food security programs and policies at the national, regional or international level.8 The latest Riceflow database corresponds to calendar year 2009, and is disaggregated into 60 regions (including all ASEAN countries), three rice types (long grain, medium grain and short grain, and fragrant rice), and three milling degrees (paddy, brown, and milled), for a total of nine rice commodities. Riceflow has been used extensively to assess different rice market scenarios:
(i) technological changes (e.g., adoption of hybrid rice); (ii) policy changes (e.g., impact of trade integration in Asia, the Western Hemisphere, or
changes in domestic support policies); (iii) consumption changes (e.g., impact of changes in population growth and income); and (iv) weather-related events (e.g., impact of calamities and other weather events).
Furthermore, Riceflow can be used to help in the design of new rice policy and investment. The model’s framework can contribute to the design of the program and investment by simulating alternative scenarios and providing insights into the potential costs and market-related impacts of the policy and investment. Sensitivity analysis on supply- and demand-related variables are
7 Other details of the AGRM, including the theoretical structure and the general equations, can be found in the online
documentation by Wailes and Chavez (2011) at http://ageconsearch.umn.edu/handle/102650 8 Other details of the model can be found in the online documentation by Wailes and Durand-Morat (2010) at
http://ageconsearch.umn.edu/handle/92010

Appendix 1 | 31
feasible, and can generate stochastic assessments. Riceflow can complement the Arkansas Global Rice Model and can be used for forecasting purposes, thus generating baseline projections against which the medium- and long-term impacts of alternative scenarios can be assessed.

32 | Appendix 2
Aggregate Rice Supply and Utilization Tables for ASEAN Countries
Table A2.1: ASEAN Rice Supply and Utilization
11/12 12/13 13/14 14/15 15/16 16/17 17/18 18/19 19/20 20/21 21/22 22/23
(Thousand Hectares)
Area Harvested 46,243 46,490 46,430 46,478 46,498 46,512 46,535 46,534 46,541 46,604 46,657 46,657
(Tons per Hectare)
Yield 2.44 2.47 2.49 2.53 2.56 2.60 2.62 2.65 2.68 2.71 2.73 2.76
(Thousand Tons)
Production 112,905 114,610 115,786 117,517 119,135 120,727 121,993 123,246 124,646 126,237 127,590 128,806
Beginning Stocks 17,663 19,426 20,027 21,850 23,339 24,731 26,216 27,418 28,456 29,544 30,497 31,231
Domestic Supply 130,568 134,036 135,813 139,366 142,474 145,458 148,209 150,664 153,101 155,781 158,087 160,036
Consumption 100,653 103,052 103,719 104,980 106,185 107,751 108,693 109,710 110,432 111,476 112,654 113,471
Ending Stocks 19,426 20,027 21,850 23,339 24,731 26,216 27,418 28,456 29,544 30,497 31,231 31,940
Domestic Use 120,079 123,079 125,569 128,319 130,916 133,967 136,111 138,166 139,976 141,973 143,884 145,411
Net Trade 10,489 10,957 10,244 11,047 11,557 11,491 12,098 12,498 13,125 13,808 14,202 14,626
(Percent)
Stocks-to-Use Ratio 19.30 19.43 21.07 22.23 23.29 24.33 25.23 25.94 26.75 27.36 27.72 28.15
Source: Wailes and Chavez.
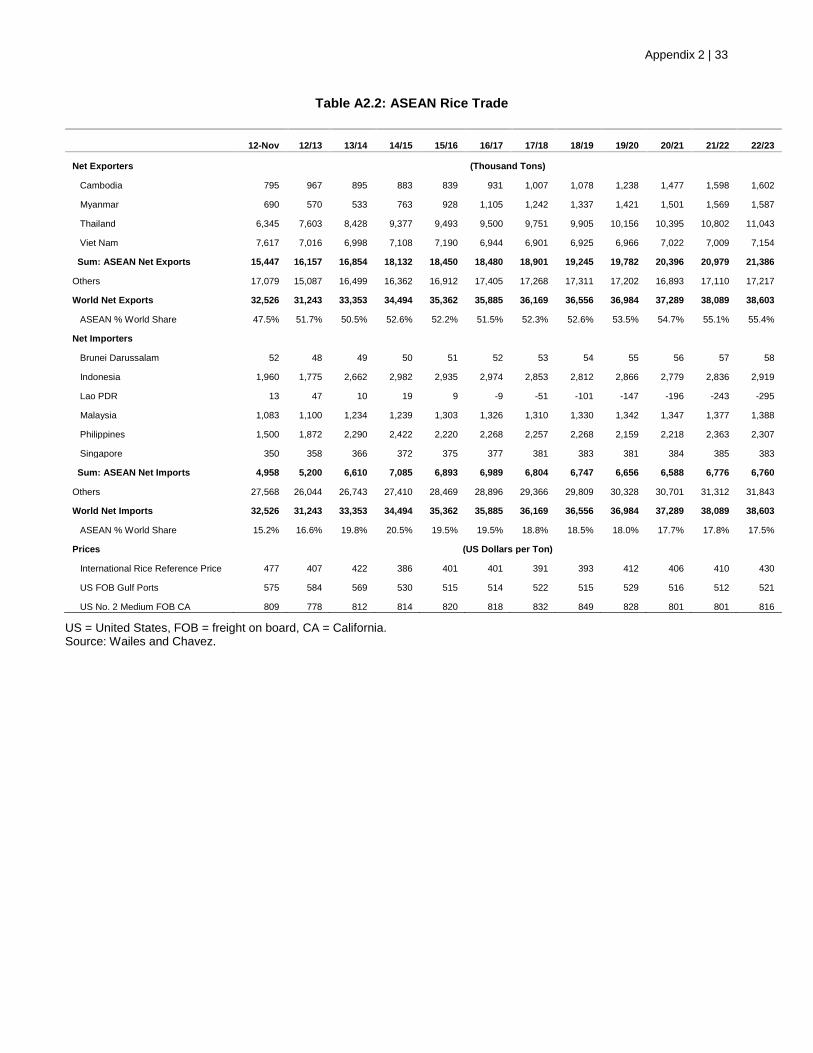
Appendix 2 | 33
Table A2.2: ASEAN Rice Trade
12-Nov 12/13 13/14 14/15 15/16 16/17 17/18 18/19 19/20 20/21 21/22 22/23
Net Exporters (Thousand Tons)
Cambodia 795 967 895 883 839 931 1,007 1,078 1,238 1,477 1,598 1,602
Myanmar 690 570 533 763 928 1,105 1,242 1,337 1,421 1,501 1,569 1,587
Thailand 6,345 7,603 8,428 9,377 9,493 9,500 9,751 9,905 10,156 10,395 10,802 11,043
Viet Nam 7,617 7,016 6,998 7,108 7,190 6,944 6,901 6,925 6,966 7,022 7,009 7,154
Sum: ASEAN Net Exports 15,447 16,157 16,854 18,132 18,450 18,480 18,901 19,245 19,782 20,396 20,979 21,386
Others 17,079 15,087 16,499 16,362 16,912 17,405 17,268 17,311 17,202 16,893 17,110 17,217
World Net Exports 32,526 31,243 33,353 34,494 35,362 35,885 36,169 36,556 36,984 37,289 38,089 38,603
ASEAN % World Share 47.5% 51.7% 50.5% 52.6% 52.2% 51.5% 52.3% 52.6% 53.5% 54.7% 55.1% 55.4%
Net Importers
Brunei Darussalam 52 48 49 50 51 52 53 54 55 56 57 58
Indonesia 1,960 1,775 2,662 2,982 2,935 2,974 2,853 2,812 2,866 2,779 2,836 2,919
Lao PDR 13 47 10 19 9 -9 -51 -101 -147 -196 -243 -295
Malaysia 1,083 1,100 1,234 1,239 1,303 1,326 1,310 1,330 1,342 1,347 1,377 1,388
Philippines 1,500 1,872 2,290 2,422 2,220 2,268 2,257 2,268 2,159 2,218 2,363 2,307
Singapore 350 358 366 372 375 377 381 383 381 384 385 383
Sum: ASEAN Net Imports 4,958 5,200 6,610 7,085 6,893 6,989 6,804 6,747 6,656 6,588 6,776 6,760
Others 27,568 26,044 26,743 27,410 28,469 28,896 29,366 29,809 30,328 30,701 31,312 31,843
World Net Imports 32,526 31,243 33,353 34,494 35,362 35,885 36,169 36,556 36,984 37,289 38,089 38,603
ASEAN % World Share 15.2% 16.6% 19.8% 20.5% 19.5% 19.5% 18.8% 18.5% 18.0% 17.7% 17.8% 17.5%
Prices (US Dollars per Ton)
International Rice Reference Price 477 407 422 386 401 401 391 393 412 406 410 430
US FOB Gulf Ports 575 584 569 530 515 514 522 515 529 516 512 521
US No. 2 Medium FOB CA 809 778 812 814 820 818 832 849 828 801 801 816
US = United States, FOB = freight on board, CA = California. Source: Wailes and Chavez.

34 | Appendix 2
11/12 12/13 13/14 14/15 15/16 16/17 17/18 18/19 19/20 20/21 21/22 22/23
(Thousand Hectares)
Brunei Darussalam 5 5 5 5 5 5 5 5 5 5 5 5
Cambodia 2,767 2,903 2,829 2,802 2,738 2,733 2,740 2,738 2,749 2,790 2,816 2,803
Indonesia 12,160 12,150 12,044 12,055 12,045 12,061 12,055 12,068 12,081 12,096 12,104 12,097
Lao PDR 817 859 863 860 863 866 871 883 895 910 923 937
Malaysia 675 678 685 691 695 699 700 700 701 701 701 701
Myanmar 6,500 6,502 6,639 6,723 6,817 6,863 6,933 6,950 6,954 6,965 6,972 6,977
Philippines 4,579 4,630 4,624 4,621 4,619 4,606 4,600 4,600 4,615 4,623 4,630 4,637
Singapore 0 0 0 0 0 0 0 0 0 0 0 0
Thailand 11,000 10,942 10,967 10,989 10,995 10,997 10,993 10,982 10,971 10,970 10,975 10,977
Viet Nam 7,740 7,821 7,774 7,732 7,720 7,684 7,636 7,609 7,570 7,545 7,532 7,522
ASEAN 10 Total 46,243 46,490 46,430 46,478 46,498 46,512 46,535 46,534 46,541 46,604 46,657 46,657
Others 112,930 112,545 113,653 113,710 113,937 114,401 114,313 114,447 114,467 114,371 114,232 114,064
World Total 159,173 159,036 160,083 160,188 160,435 160,913 160,848 160,981 161,007 160,976 160,888 160,720
ASEAN % World Share 29.1% 29.2% 29.0% 29.0% 29.0% 28.9% 28.9% 28.9% 28.9% 29.0% 29.0% 29.0%
Source: Wailes and Chavez.
Table A2.3: ASEAN Rice Area Harvested
Table A2.4: ASEAN Rice Yield per Hectare
11/12 12/13 13/14 14/15 15/16 16/17 17/18 18/19 19/20 20/21 21/22 22/23
(Tons per Hectare)
Brunei Darussalam 0.21 0.21 0.21 0.21 0.21 0.21 0.21 0.21 0.21 0.21 0.21 0.21
Cambodia 1.54 1.58 1.61 1.66 1.71 1.77 1.82 1.87 1.95 2.03 2.09 2.12
Indonesia 3.00 3.03 3.08 3.14 3.20 3.25 3.28 3.30 3.32 3.35 3.37 3.39
Lao PDR 1.71 1.75 1.77 1.80 1.83 1.87 1.93 1.98 2.02 2.07 2.11 2.15
Malaysia 2.50 2.51 2.52 2.53 2.56 2.59 2.63 2.66 2.69 2.73 2.75 2.79
Myanmar 1.66 1.65 1.68 1.71 1.73 1.76 1.78 1.81 1.84 1.86 1.89 1.92
Philippines 2.34 2.37 2.43 2.48 2.51 2.56 2.61 2.66 2.70 2.75 2.80 2.84
Singapore 0.00 0.00 0.00 0.00 0.00 0.00 0.00 0.00 0.00 0.00 0.00 0.00
Thailand 1.86 1.88 1.91 1.93 1.94 1.96 1.96 1.97 2.00 2.01 2.03 2.05
Viet Nam 3.50 3.53 3.54 3.57 3.60 3.63 3.66 3.70 3.74 3.77 3.80 3.83
ASEAN 10 Average 2.44 2.47 2.49 2.53 2.56 2.60 2.62 2.65 2.68 2.71 2.73 2.76
Others 3.14 3.15 3.16 3.20 3.22 3.23 3.24 3.25 3.27 3.29 3.31 3.33
World Average 2.93 2.95 2.97 3.00 3.03 3.04 3.06 3.08 3.10 3.12 3.14 3.16
ASEAN % World 83.2% 83.5% 84.0% 84.2% 84.6% 85.3% 85.7% 86.1% 86.4% 86.8% 87.0% 87.3%
Source: Wailes and Chavez.

Appendix 2 | 35
Table A2.5: ASEAN Rice Production
Table A2.6: ASEAN Rice Consumption
11/12 12/13 13/14 14/15 15/16 16/17 17/18 18/19 19/20 20/21 21/22 22/23
(Thousand Tons)
Brunei Darussalam 1 1 1 1 1 1 1 1 1 1 1 1
Cambodia 4,268 4,589 4,566 4,638 4,674 4,832 4,976 5,123 5,356 5,671 5,877 5,946
Indonesia 36,500 36,837 37,151 37,874 38,505 39,179 39,536 39,882 40,107 40,517 40,783 40,987
Lao PDR 1,395 1,504 1,531 1,545 1,578 1,618 1,681 1,749 1,811 1,880 1,946 2,016
Malaysia 1,690 1,700 1,728 1,750 1,779 1,811 1,837 1,862 1,887 1,912 1,930 1,953
Myanmar 10,816 10,752 11,152 11,471 11,810 12,069 12,375 12,587 12,777 12,979 13,176 13,368
Philippines 10,700 10,990 11,224 11,446 11,602 11,791 12,010 12,215 12,475 12,731 12,962 13,180
Singapore 0 0 0 0 0 0 0 0 0 0 0 0
Thailand 20,460 20,594 20,930 21,169 21,376 21,546 21,592 21,672 21,943 22,089 22,305 22,543
Viet Nam 27,075 27,641 27,504 27,623 27,809 27,880 27,985 28,156 28,286 28,458 28,610 28,811
ASEAN 10 Total 112,905 114,610 115,786 117,517 119,135 120,727 121,993 123,246 124,646 126,237 127,590 128,806
Others 354,138 354,821 359,700 363,597 366,565 369,156 370,115 372,144 374,170 376,041 378,144 379,602
World Total 467,043 469,431 475,486 481,114 485,700 489,882 492,108 495,391 498,816 502,278 505,734 508,407
ASEAN % World Share 24.2% 24.4% 24.4% 24.4% 24.5% 24.6% 24.8% 24.9% 25.0% 25.1% 25.2% 25.3%
Source: Wailes and Chavez.
11/12 12/13 13/14 14/15 15/16 16/17 17/18 18/19 19/20 20/21 21/22 22/23
(Thousand Tons)
Brunei Darussalam 53 49 50 51 52 53 54 55 56 57 58 59
Cambodia 3,450 3,614 3,670 3,753 3,832 3,898 3,966 4,042 4,115 4,190 4,276 4,341
Indonesia 39,550 40,276 40,478 40,794 41,317 42,063 42,338 42,669 42,962 43,291 43,617 43,906
Lao PDR 1,440 1,509 1,539 1,563 1,586 1,608 1,630 1,648 1,664 1,683 1,703 1,720
Malaysia 2,710 2,869 2,901 2,989 3,067 3,126 3,138 3,191 3,220 3,255 3,302 3,334
Myanmar 10,200 10,420 10,486 10,684 10,863 10,992 11,139 11,253 11,363 11,471 11,586 11,697
Philippines 12,850 13,197 13,246 13,640 13,757 14,054 14,267 14,482 14,643 14,955 15,315 15,479
Singapore 350 358 366 372 375 377 381 383 381 384 385 383
Thailand 10,400 10,568 10,588 10,607 10,641 10,684 10,713 10,746 10,777 10,814 10,850 10,877
Viet Nam 19,650 20,193 20,396 20,528 20,696 20,896 21,067 21,242 21,251 21,377 21,562 21,675
ASEAN 10 Total 100,653 103,052 103,719 104,980 106,185 107,751 108,693 109,710 110,432 111,476 112,654 113,471
Others 357,595 366,986 369,351 372,148 375,249 377,010 379,291 381,816 385,092 387,357 390,269 392,613
World Total 458,248 470,038 473,070 477,129 481,434 484,761 487,984 491,526 495,525 498,834 502,922 506,084
ASEAN % World Share 22.0% 21.9% 21.9% 22.0% 22.1% 22.2% 22.3% 22.3% 22.3% 22.3% 22.4% 22.4%
Source: Wailes and Chavez.

36 | Appendix 2
Table A2.7: ASEAN Per Capita Rice Consumption
Table A2.8: ASEAN Rice Ending Stocks
11/12 12/13 13/14 14/15 15/16 16/17 17/18 18/19 19/20 20/21 21/22 22/23
(Thousand Tons)
Brunei Darussalam 0 0 0 0 0 0 0 0 0 0 0 0
Cambodia 181 189 191 194 197 200 203 205 208 211 214 217
Indonesia 5,085 3,422 2,757 2,819 2,942 3,032 3,084 3,109 3,120 3,125 3,127 3,127
Lao PDR 45 88 89 90 91 92 93 93 94 95 95 96
Malaysia 796 727 787 787 802 813 822 823 832 836 842 849
Myanmar 431 193 326 350 369 341 336 333 326 334 355 439
Philippines 1,809 1,474 1,741 1,970 2,035 2,040 2,040 2,042 2,034 2,028 2,038 2,046
Singapore 0 0 0 0 0 0 0 0 0 0 0 0
Thailand 9,330 11,753 13,667 14,852 16,095 17,457 18,584 19,605 20,614 21,494 22,147 22,770
Viet Nam 1,749 2,181 2,291 2,278 2,200 2,240 2,257 2,245 2,315 2,374 2,413 2,395
ASEAN 10 Total 19,426 20,027 21,850 23,339 24,731 26,216 27,418 28,456 29,544 30,497 31,231 31,940
Others 86,674 85,772 86,636 89,355 92,438 96,273 99,417 102,485 104,923 107,627 109,929 111,755
World Total 106,100 105,798 108,486 112,694 117,169 122,489 126,835 130,941 134,467 138,124 141,160 143,695
ASEAN % World Share 18.3% 18.9% 20.1% 20.7% 21.1% 21.4% 21.6% 21.7% 22.0% 22.1% 22.1% 22.2%
Source: Wailes and Chavez.
11/12 12/13 13/14 14/15 15/16 16/17 17/18 18/19 19/20 20/21 21/22 22/23
(Kilograms)
Brunei Darussalam 131.9 119.8 120.8 120.8 121.0 121.1 122.5 122.8 122.9 122.8 123.0 122.7
Cambodia 234.7 241.7 241.3 242.8 243.9 244.3 244.8 245.7 246.6 247.6 249.2 249.7
Indonesia 160.7 162.0 161.2 160.9 161.4 162.8 162.5 162.4 162.2 162.1 162.1 162.0
Lao PDR 222.3 229.1 229.9 229.7 229.5 229.2 228.7 227.8 226.7 225.9 225.4 224.6
Malaysia 94.3 98.3 97.9 99.4 100.5 101.0 100.0 100.3 99.9 99.7 99.9 99.6
Myanmar 188.9 190.9 190.1 191.7 192.9 193.2 193.9 193.9 194.0 194.0 194.2 194.3
Philippines 126.2 127.2 125.3 126.7 125.5 126.0 125.7 125.4 124.7 125.3 126.3 125.7
Singapore 66.7 66.8 67.0 66.9 66.0 65.1 64.7 63.8 62.4 61.9 61.0 59.7
Thailand 155.9 157.5 157.0 156.5 156.2 156.1 155.9 155.7 155.5 155.5 155.4 155.3
Viet Nam 217.0 220.6 220.5 219.7 219.4 219.4 219.1 218.9 217.1 216.5 216.7 216.1
ASEAN 10 Average 163.7 165.7 164.8 164.9 165.0 165.6 165.3 165.2 164.6 164.6 164.7 164.4
Others 55.8 56.7 56.4 56.2 56.1 55.8 55.5 55.3 55.3 55.0 54.9 54.7
World Average 66.0 66.9 66.6 66.5 66.4 66.1 65.9 65.7 65.6 65.4 65.3 65.1
ASEAN % World 248.2% 247.5% 247.3% 248.1% 248.6% 250.5% 250.9% 251.4% 251.1% 251.8% 252.4% 252.7%
Source: Wailes and Chavez.
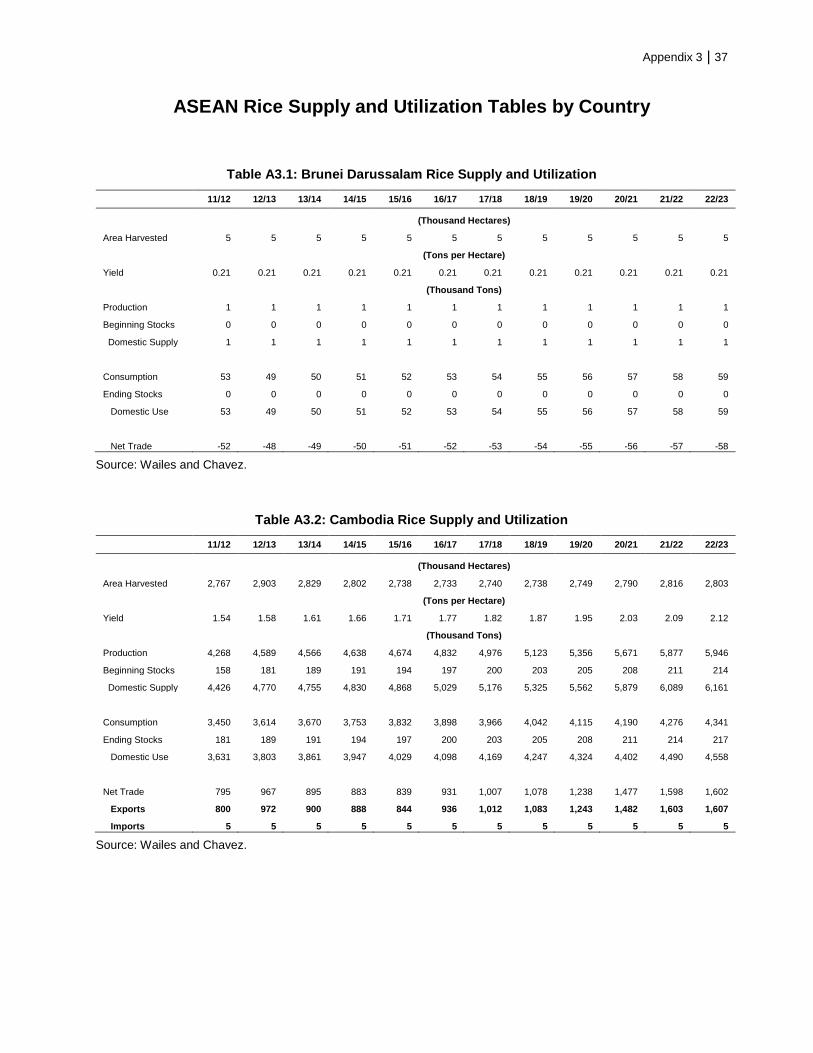
Appendix 3 | 37
ASEAN Rice Supply and Utilization Tables by Country
Table A3.1: Brunei Darussalam Rice Supply and Utilization
11/12 12/13 13/14 14/15 15/16 16/17 17/18 18/19 19/20 20/21 21/22 22/23
(Thousand Hectares)
Area Harvested 5 5 5 5 5 5 5 5 5 5 5 5
(Tons per Hectare)
Yield 0.21 0.21 0.21 0.21 0.21 0.21 0.21 0.21 0.21 0.21 0.21 0.21
(Thousand Tons)
Production 1 1 1 1 1 1 1 1 1 1 1 1
Beginning Stocks 0 0 0 0 0 0 0 0 0 0 0 0
Domestic Supply 1 1 1 1 1 1 1 1 1 1 1 1
Consumption 53 49 50 51 52 53 54 55 56 57 58 59
Ending Stocks 0 0 0 0 0 0 0 0 0 0 0 0
Domestic Use 53 49 50 51 52 53 54 55 56 57 58 59
Net Trade -52 -48 -49 -50 -51 -52 -53 -54 -55 -56 -57 -58
Source: Wailes and Chavez.
Table A3.2: Cambodia Rice Supply and Utilization
11/12 12/13 13/14 14/15 15/16 16/17 17/18 18/19 19/20 20/21 21/22 22/23
(Thousand Hectares)
Area Harvested 2,767 2,903 2,829 2,802 2,738 2,733 2,740 2,738 2,749 2,790 2,816 2,803
(Tons per Hectare)
Yield 1.54 1.58 1.61 1.66 1.71 1.77 1.82 1.87 1.95 2.03 2.09 2.12
(Thousand Tons)
Production 4,268 4,589 4,566 4,638 4,674 4,832 4,976 5,123 5,356 5,671 5,877 5,946
Beginning Stocks 158 181 189 191 194 197 200 203 205 208 211 214
Domestic Supply 4,426 4,770 4,755 4,830 4,868 5,029 5,176 5,325 5,562 5,879 6,089 6,161
Consumption 3,450 3,614 3,670 3,753 3,832 3,898 3,966 4,042 4,115 4,190 4,276 4,341
Ending Stocks 181 189 191 194 197 200 203 205 208 211 214 217
Domestic Use 3,631 3,803 3,861 3,947 4,029 4,098 4,169 4,247 4,324 4,402 4,490 4,558
Net Trade 795 967 895 883 839 931 1,007 1,078 1,238 1,477 1,598 1,602
Exports 800 972 900 888 844 936 1,012 1,083 1,243 1,482 1,603 1,607
Imports 5 5 5 5 5 5 5 5 5 5 5 5
Source: Wailes and Chavez.
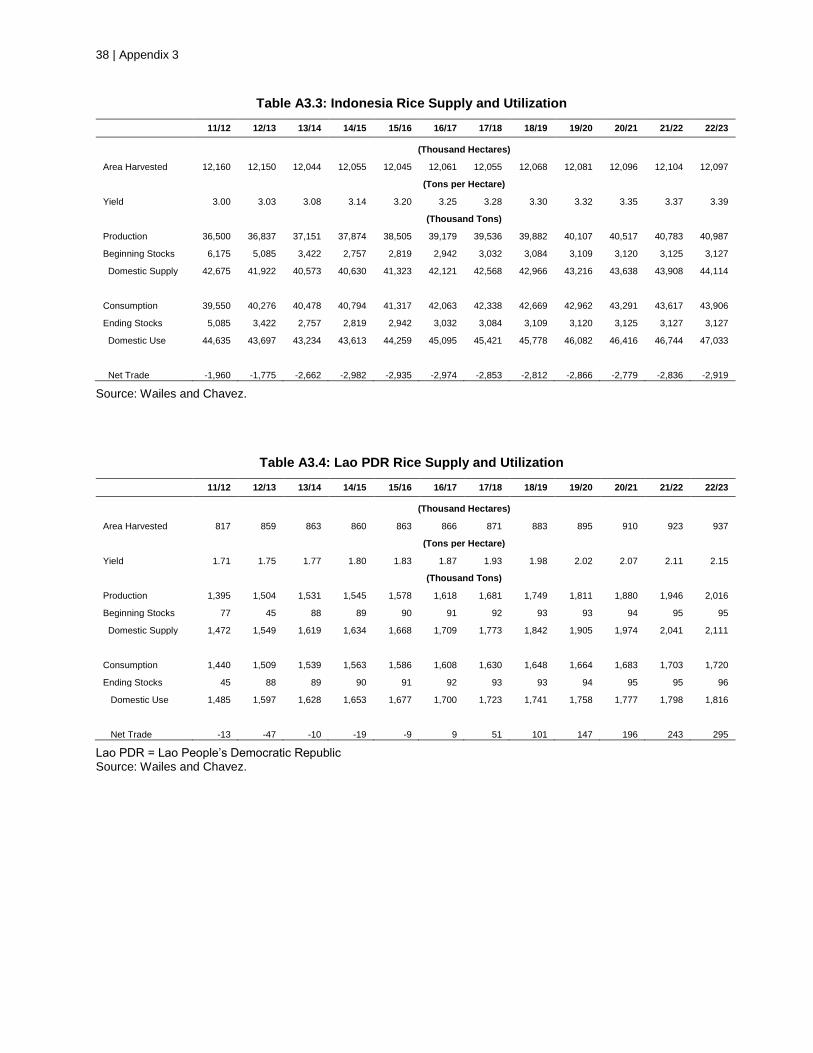
38 | Appendix 3
Table A3.3: Indonesia Rice Supply and Utilization
11/12 12/13 13/14 14/15 15/16 16/17 17/18 18/19 19/20 20/21 21/22 22/23
(Thousand Hectares)
Area Harvested 12,160 12,150 12,044 12,055 12,045 12,061 12,055 12,068 12,081 12,096 12,104 12,097
(Tons per Hectare)
Yield 3.00 3.03 3.08 3.14 3.20 3.25 3.28 3.30 3.32 3.35 3.37 3.39
(Thousand Tons)
Production 36,500 36,837 37,151 37,874 38,505 39,179 39,536 39,882 40,107 40,517 40,783 40,987
Beginning Stocks 6,175 5,085 3,422 2,757 2,819 2,942 3,032 3,084 3,109 3,120 3,125 3,127
Domestic Supply 42,675 41,922 40,573 40,630 41,323 42,121 42,568 42,966 43,216 43,638 43,908 44,114
Consumption 39,550 40,276 40,478 40,794 41,317 42,063 42,338 42,669 42,962 43,291 43,617 43,906
Ending Stocks 5,085 3,422 2,757 2,819 2,942 3,032 3,084 3,109 3,120 3,125 3,127 3,127
Domestic Use 44,635 43,697 43,234 43,613 44,259 45,095 45,421 45,778 46,082 46,416 46,744 47,033
Net Trade -1,960 -1,775 -2,662 -2,982 -2,935 -2,974 -2,853 -2,812 -2,866 -2,779 -2,836 -2,919
Source: Wailes and Chavez.
Table A3.4: Lao PDR Rice Supply and Utilization
11/12 12/13 13/14 14/15 15/16 16/17 17/18 18/19 19/20 20/21 21/22 22/23
(Thousand Hectares)
Area Harvested 817 859 863 860 863 866 871 883 895 910 923 937
(Tons per Hectare)
Yield 1.71 1.75 1.77 1.80 1.83 1.87 1.93 1.98 2.02 2.07 2.11 2.15
(Thousand Tons)
Production 1,395 1,504 1,531 1,545 1,578 1,618 1,681 1,749 1,811 1,880 1,946 2,016
Beginning Stocks 77 45 88 89 90 91 92 93 93 94 95 95
Domestic Supply 1,472 1,549 1,619 1,634 1,668 1,709 1,773 1,842 1,905 1,974 2,041 2,111
Consumption 1,440 1,509 1,539 1,563 1,586 1,608 1,630 1,648 1,664 1,683 1,703 1,720
Ending Stocks 45 88 89 90 91 92 93 93 94 95 95 96
Domestic Use 1,485 1,597 1,628 1,653 1,677 1,700 1,723 1,741 1,758 1,777 1,798 1,816
Net Trade -13 -47 -10 -19 -9 9 51 101 147 196 243 295
Lao PDR = Lao People’s Democratic Republic Source: Wailes and Chavez.

Appendix 3 | 39
Table A3.5: Malaysia Rice Supply and Utilization
11/12 12/13 13/14 14/15 15/16 16/17 17/18 18/19 19/20 20/21 21/22 22/23
(Thousand Hectares)
Area Harvested 675 678 685 691 695 699 700 700 701 701 701 701
(Tons per Hectare)
Yield 2.50 2.51 2.52 2.53 2.56 2.59 2.63 2.66 2.69 2.73 2.75 2.79
(Thousand Tons)
Production 1,690 1,700 1,728 1,750 1,779 1,811 1,837 1,862 1,887 1,912 1,930 1,953
Beginning Stocks 733 796 727 787 787 802 813 822 823 832 836 842
Domestic Supply 2,423 2,496 2,455 2,537 2,566 2,613 2,650 2,684 2,711 2,744 2,766 2,795
Consumption 2,710 2,869 2,901 2,989 3,067 3,126 3,138 3,191 3,220 3,255 3,302 3,334
Ending Stocks 796 727 787 787 802 813 822 823 832 836 842 849
Domestic Use 3,506 3,596 3,688 3,776 3,869 3,939 3,960 4,014 4,053 4,091 4,144 4,183
Net Trade -1,083 -1,100 -1,234 -1,239 -1,303 -1,326 -1,310 -1,330 -1,342 -1,347 -1,377 -1,388
Exports 2 2 2 2 2 2 2 2 2 2 2 2
Imports 1,085 1,102 1,236 1,241 1,305 1,328 1,312 1,332 1,344 1,349 1,379 1,390
Source: Wailes and Chavez.
Table A3.6: Myanmar Rice Supply and Utilization
11/12 12/13 13/14 14/15 15/16 16/17 17/18 18/19 19/20 20/21 21/22 22/23
(Thousand Hectares)
Area Harvested 6,500 6,502 6,639 6,723 6,817 6,863 6,933 6,950 6,954 6,965 6,972 6,977
(Tons per Hectare)
Yield 1.66 1.65 1.68 1.71 1.73 1.76 1.78 1.81 1.84 1.86 1.89 1.92
(Thousand Tons)
Production 10,816 10,752 11,152 11,471 11,810 12,069 12,375 12,587 12,777 12,979 13,176 13,368
Beginning Stocks 505 431 193 326 350 369 341 336 333 326 334 355
Domestic Supply 11,321 11,183 11,345 11,797 12,160 12,438 12,717 12,923 13,110 13,305 13,509 13,723
Consumption 10,200 10,420 10,486 10,684 10,863 10,992 11,139 11,253 11,363 11,471 11,586 11,697
Ending Stocks 431 193 326 350 369 341 336 333 326 334 355 439
Domestic Use 10,631 10,613 10,812 11,033 11,232 11,333 11,474 11,586 11,689 11,804 11,941 12,136
Net Trade 690 570 533 763 928 1,105 1,242 1,337 1,421 1,501 1,569 1,587
Source: Wailes and Chavez.

40 | Appendix 3
Table A3.7: Philippines Rice Supply and Utilization
11/12 12/13 13/14 14/15 15/16 16/17 17/18 18/19 19/20 20/21 21/22 22/23
(Thousand Hectares)
Area Harvested 4,579 4,630 4,624 4,621 4,619 4,606 4,600 4,600 4,615 4,623 4,630 4,637
(Tons per Hectare)
Yield 2.34 2.37 2.43 2.48 2.51 2.56 2.61 2.66 2.70 2.75 2.80 2.84
(Thousand Tons)
Production 10,700 10,990 11,224 11,446 11,602 11,791 12,010 12,215 12,475 12,731 12,962 13,180
Beginning Stocks 2,459 1,809 1,474 1,741 1,970 2,035 2,040 2,040 2,042 2,034 2,028 2,038
Domestic Supply 13,159 12,799 12,698 13,188 13,572 13,826 14,050 14,255 14,517 14,765 14,990 15,218
Consumption 12,850 13,197 13,246 13,640 13,757 14,054 14,267 14,482 14,643 14,955 15,315 15,479
Ending Stocks 1,809 1,474 1,741 1,970 2,035 2,040 2,040 2,042 2,034 2,028 2,038 2,046
Domestic Use 14,659 14,671 14,987 15,609 15,792 16,094 16,307 16,523 16,676 16,983 17,353 17,525
Net Trade -1,500 -1,872 -2,290 -2,422 -2,220 -2,268 -2,257 -2,268 -2,159 -2,218 -2,363 -2,307
Source: Wailes and Chavez.
Table A3.8: Singapore Rice Supply and Utilization
11/12 12/13 13/14 14/15 15/16 16/17 17/18 18/19 19/20 20/21 21/22 22/23
(Thousand Tons)
Production 0 0 0 0 0 0 0 0 0 0 0 0
Beginning Stocks 0 0 0 0 0 0 0 0 0 0 0 0
Domestic Supply 0 0 0 0 0 0 0 0 0 0 0 0
Consumption 350 358 366 372 375 377 381 383 381 384 385 383
Ending Stocks 0 0 0 0 0 0 0 0 0 0 0 0
Domestic Use 350 358 366 372 375 377 381 383 381 384 385 383
Net Trade -350 -358 -366 -372 -375 -377 -381 -383 -381 -384 -385 -383
Source: Wailes and Chavez.

Appendix 3 | 41
Table A3.9: Thailand Rice Supply and Utilization
11/12 12/13 13/14 14/15 15/16 16/17 17/18 18/19 19/20 20/21 21/22 22/23
(Thousand Hectares)
Area Harvested 11,000 10,942 10,967 10,989 10,995 10,997 10,993 10,982 10,971 10,970 10,975 10,977
(Tons per Hectare)
Yield 1.86 1.88 1.91 1.93 1.94 1.96 1.96 1.97 2.00 2.01 2.03 2.05
(Thousand Tons)
Production 20,460 20,594 20,930 21,169 21,376 21,546 21,592 21,672 21,943 22,089 22,305 22,543
Beginning Stocks 5,615 9,330 11,753 13,667 14,852 16,095 17,457 18,584 19,605 20,614 21,494 22,147
Domestic Supply 26,075 29,924 32,683 34,836 36,228 37,641 39,048 40,256 41,548 42,703 43,800 44,690
Consumption 10,400 10,568 10,588 10,607 10,641 10,684 10,713 10,746 10,777 10,814 10,850 10,877
Ending Stocks 9,330 11,753 13,667 14,852 16,095 17,457 18,584 19,605 20,614 21,494 22,147 22,770
Domestic Use 19,730 22,321 24,255 25,459 26,735 28,141 29,297 30,350 31,392 32,308 32,997 33,647
Net Trade 6,345 7,603 8,428 9,377 9,493 9,500 9,751 9,905 10,156 10,395 10,802 11,043
Exports 6,945 7,970 8,817 9,829 9,895 9,915 10,174 10,318 10,573 10,813 11,218 11,460
Imports 600 367 389 452 402 414 423 413 417 418 416 417
Source: Wailes and Chavez.
Table A3.10: Viet Nam Rice Supply and Utilization
11/12 12/13 13/14 14/15 15/16 16/17 17/18 18/19 19/20 20/21 21/22 22/23
(Thousand Hectares)
Area Harvested 7,740 7,821 7,774 7,732 7,720 7,684 7,636 7,609 7,570 7,545 7,532 7,522
(Tons per Hectare)
Yield 3.50 3.53 3.54 3.57 3.60 3.63 3.66 3.70 3.74 3.77 3.80 3.83
(Thousand Tons)
Production 27,075 27,641 27,504 27,623 27,809 27,880 27,985 28,156 28,286 28,458 28,610 28,811
Beginning Stocks 1,941 1,749 2,181 2,291 2,278 2,200 2,240 2,257 2,245 2,315 2,374 2,413
Domestic Supply 29,016 29,390 29,685 29,914 30,087 30,081 30,225 30,413 30,532 30,773 30,984 31,224
Consumption 19,650 20,193 20,396 20,528 20,696 20,896 21,067 21,242 21,251 21,377 21,562 21,675
Ending Stocks 1,749 2,181 2,291 2,278 2,200 2,240 2,257 2,245 2,315 2,374 2,413 2,395
Domestic Use 21,399 22,374 22,687 22,806 22,896 23,137 23,324 23,487 23,566 23,751 23,974 24,070
Net Trade 7,617 7,016 6,998 7,108 7,190 6,944 6,901 6,925 6,966 7,022 7,009 7,154
Exports 7,717 7,116 7,098 7,208 7,290 7,044 7,001 7,025 7,066 7,122 7,109 7,254
Imports 100 100 100 100 100 100 100 100 100 100 100 100
Source: Wailes and Chavez.

42 | Appendix 4
Other Non-ASEAN Country Rice Supply and Utilization Tables from 2011–2012 to 2022–2023
Table A4.1: People’s Republic of China Rice Supply and Utilization
11/12 12/13 13/14 14/15 15/16 16/17 17/18 18/19 19/20 20/21 21/22 22/23
(Thousand Hectares)
Area Harvested 30,057 30,300 29,999 29,703 29,408 29,100 28,803 28,598 28,351 28,048 27,744 27,441
(Tons per Hectare)
Yield 4.68 4.72 4.75 4.78 4.81 4.84 4.87 4.91 4.94 4.97 5.00 5.03
(Thousand Tons)
Production 140,700 143,000 142,430 141,986 141,506 140,851 140,332 140,279 139,994 139,315 138,644 138,030
Beginning Stocks 42,574 45,023 46,710 47,949 49,783 51,372 53,623 56,229 59,269 61,682 64,213 66,233
Domestic Supply 183,274 188,023 189,140 189,935 191,289 192,223 193,955 196,508 199,263 200,998 202,857 204,263
Consumption 139,600 143,232 142,208 141,152 140,810 139,506 138,612 138,129 138,443 137,653 137,544 136,944
Ending Stocks 45,023 46,710 47,949 49,783 51,372 53,623 56,229 59,269 61,682 64,213 66,233 68,184
Domestic Use 184,623 189,942 190,157 190,934 192,182 193,129 194,840 197,398 200,125 201,865 203,777 205,128
Net Trade -1,349 -1,919 -1,018 -999 -894 -907 -885 -890 -862 -868 -921 -865
Exports 441 499 655 707 726 725 764 770 810 816 775 792
Imports 1,790 2,418 1,673 1,706 1,619 1,632 1,649 1,661 1,672 1,684 1,696 1,657
Source: Wailes and Chavez.

Appendix 4 | 43
Table A4.2: Japan Rice Supply and Utilization
Table A4.3: Republic of Korea Rice Supply and Utilization
11/12 12/13 13/14 14/15 15/16 16/17 17/18 18/19 19/20 20/21 21/22 22/23
(Thousand Hectares)
Area Harvested 1,576 1,581 1,534 1,507 1,497 1,484 1,478 1,466 1,440 1,435 1,429 1,429
(Tons per Hectare)
Yield 4.85 4.88 4.86 4.87 4.88 4.88 4.88 4.88 4.86 4.83 4.82 4.82
(Thousand Tons)
Production 7,646 7,711 7,451 7,342 7,304 7,241 7,212 7,148 6,993 6,937 6,891 6,888
Beginning Stocks 2,712 2,743 2,774 2,659 2,594 2,516 2,406 2,297 2,229 2,089 2,048 1,984
Domestic Supply 10,358 10,454 10,225 10,001 9,898 9,757 9,618 9,446 9,222 9,026 8,939 8,872
Consumption 8,050 8,180 8,048 7,889 7,864 7,832 7,803 7,699 7,615 7,460 7,437 7,406
Ending Stocks 2,743 2,774 2,659 2,594 2,516 2,406 2,297 2,229 2,089 2,048 1,984 1,948
Domestic Use 10,793 10,954 10,707 10,483 10,380 10,239 10,100 9,928 9,704 9,508 9,421 9,354
Net Trade -435 -500 -482 -482 -482 -482 -482 -482 -482 -482 -482 -482
Exports 200 200 200 200 200 200 200 200 200 200 200 200
Imports 635 700 682 682 682 682 682 682 682 682 682 682
Source: Wailes and Chavez.
11/12 12/13 13/14 14/15 15/16 16/17 17/18 18/19 19/20 20/21 21/22 22/23
(Thousand Hectares)
Area Harvested 854 849 844 849 843 837 826 816 811 804 796 790
(Tons per Hectare)
Yield 4.95 4.96 5.10 5.12 5.13 5.15 5.16 5.17 5.18 5.19 5.20 5.21
(Thousand Tons)
Production 4,224 4,208 4,309 4,351 4,327 4,312 4,261 4,219 4,198 4,175 4,138 4,112
Beginning Stocks 1,034 658 594 535 645 780 905 981 1,073 1,156 1,251 1,349
Domestic Supply 5,258 4,866 4,904 4,886 4,972 5,092 5,166 5,200 5,270 5,331 5,389 5,460
Consumption 4,977 4,872 4,769 4,649 4,601 4,595 4,594 4,536 4,523 4,489 4,449 4,441
Ending Stocks 658 594 535 645 780 905 981 1,073 1,156 1,251 1,349 1,428
Domestic Use 5,635 5,467 5,304 5,294 5,381 5,500 5,575 5,609 5,679 5,739 5,797 5,869
Net Trade -377 -601 -400 -409 -409 -409 -409 -409 -409 -409 -409 -409
Exports 3 0 0 0 0 0 0 0 0 0 0 0
Imports 380 601 400 409 409 409 409 409 409 409 409 409
Source: Wailes and Chavez.
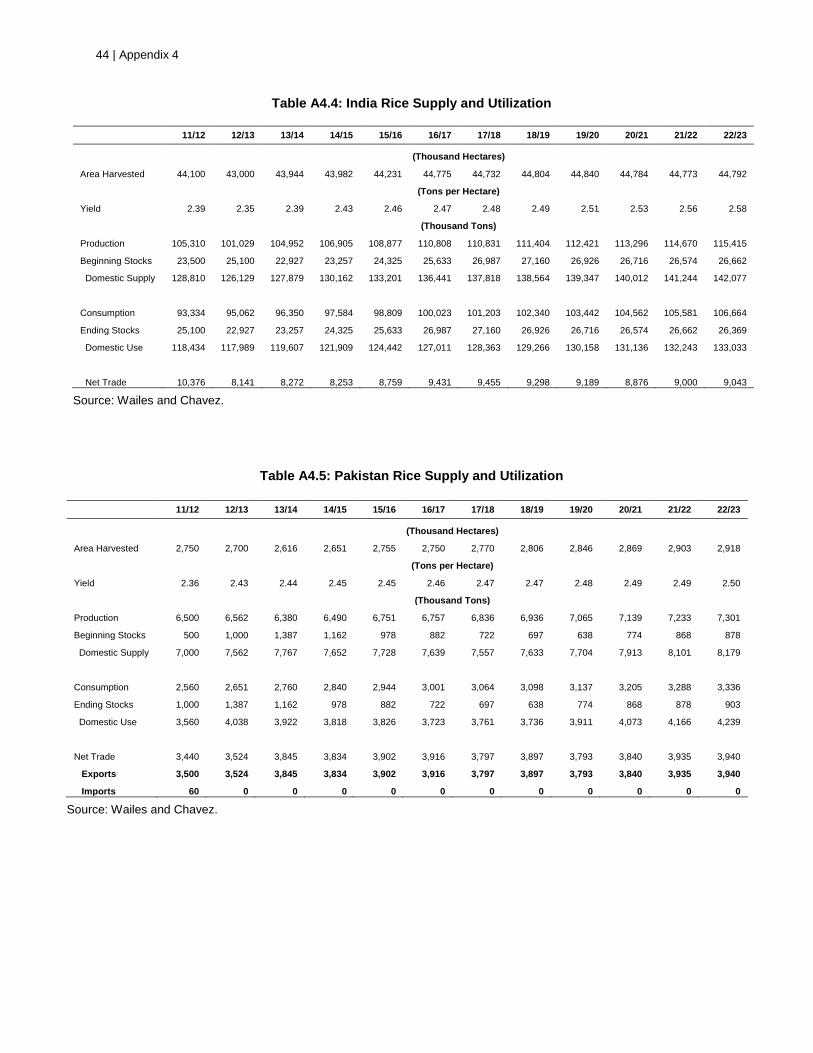
44 | Appendix 4
Table A4.4: India Rice Supply and Utilization
Table A4.5: Pakistan Rice Supply and Utilization
11/12 12/13 13/14 14/15 15/16 16/17 17/18 18/19 19/20 20/21 21/22 22/23
(Thousand Hectares)
Area Harvested 44,100 43,000 43,944 43,982 44,231 44,775 44,732 44,804 44,840 44,784 44,773 44,792
(Tons per Hectare)
Yield 2.39 2.35 2.39 2.43 2.46 2.47 2.48 2.49 2.51 2.53 2.56 2.58
(Thousand Tons)
Production 105,310 101,029 104,952 106,905 108,877 110,808 110,831 111,404 112,421 113,296 114,670 115,415
Beginning Stocks 23,500 25,100 22,927 23,257 24,325 25,633 26,987 27,160 26,926 26,716 26,574 26,662
Domestic Supply 128,810 126,129 127,879 130,162 133,201 136,441 137,818 138,564 139,347 140,012 141,244 142,077
Consumption 93,334 95,062 96,350 97,584 98,809 100,023 101,203 102,340 103,442 104,562 105,581 106,664
Ending Stocks 25,100 22,927 23,257 24,325 25,633 26,987 27,160 26,926 26,716 26,574 26,662 26,369
Domestic Use 118,434 117,989 119,607 121,909 124,442 127,011 128,363 129,266 130,158 131,136 132,243 133,033
Net Trade 10,376 8,141 8,272 8,253 8,759 9,431 9,455 9,298 9,189 8,876 9,000 9,043
Source: Wailes and Chavez.
11/12 12/13 13/14 14/15 15/16 16/17 17/18 18/19 19/20 20/21 21/22 22/23
(Thousand Hectares)
Area Harvested 2,750 2,700 2,616 2,651 2,755 2,750 2,770 2,806 2,846 2,869 2,903 2,918
(Tons per Hectare)
Yield 2.36 2.43 2.44 2.45 2.45 2.46 2.47 2.47 2.48 2.49 2.49 2.50
(Thousand Tons)
Production 6,500 6,562 6,380 6,490 6,751 6,757 6,836 6,936 7,065 7,139 7,233 7,301
Beginning Stocks 500 1,000 1,387 1,162 978 882 722 697 638 774 868 878
Domestic Supply 7,000 7,562 7,767 7,652 7,728 7,639 7,557 7,633 7,704 7,913 8,101 8,179
Consumption 2,560 2,651 2,760 2,840 2,944 3,001 3,064 3,098 3,137 3,205 3,288 3,336
Ending Stocks 1,000 1,387 1,162 978 882 722 697 638 774 868 878 903
Domestic Use 3,560 4,038 3,922 3,818 3,826 3,723 3,761 3,736 3,911 4,073 4,166 4,239
Net Trade 3,440 3,524 3,845 3,834 3,902 3,916 3,797 3,897 3,793 3,840 3,935 3,940
Exports 3,500 3,524 3,845 3,834 3,902 3,916 3,797 3,897 3,793 3,840 3,935 3,940
Imports 60 0 0 0 0 0 0 0 0 0 0 0
Source: Wailes and Chavez.

Appendix 5 | 45
World Net Rice Trade, Per Capita Use, and Average Yield Tables by Country
Table A5.1: World Net Rice Trade by Selected Countries and Prices
11/12 12/13 13/14 14/15 15/16 16/17 17/18 18/19 19/20 20/21 21/22 22/23
Net Exporters (Thousand Tons)
Argentina 670 625 636 623 646 646 653 669 693 696 702 715
Australia 320 442 414 373 362 357 379 398 393 377 394 384
Cambodia 795 967 895 883 839 931 1,007 1,078 1,238 1,477 1,598 1,602
People's Republic of China -1,349 -1,919 -1,018 -999 -894 -907 -885 -890 -862 -868 -921 -865
Egypt 265 776 696 711 604 571 573 575 609 603 611 624
India 10,376 8,141 8,272 8,253 8,759 9,431 9,455 9,298 9,189 8,876 9,000 9,043
Myanmar 690 570 533 763 928 1,105 1,242 1,337 1,421 1,501 1,569 1,587
Pakistan 3,440 3,524 3,845 3,834 3,902 3,916 3,797 3,897 3,793 3,840 3,935 3,940
Thailand 6,345 7,603 8,428 9,377 9,493 9,500 9,751 9,905 10,156 10,395 10,802 11,043
United States 2,607 2,644 2,676 2,586 2,566 2,419 2,328 2,371 2,379 2,330 2,341 2,329
Uruguay 750 854 978 981 968 973 970 994 1,009 1,036 1,048 1,047
Viet Nam 7,617 7,016 6,998 7,108 7,190 6,944 6,901 6,925 6,966 7,022 7,009 7,154
Total Net Exports* 32,526 31,243 33,353 34,494 35,362 35,885 36,169 36,556 36,984 37,289 38,089 38,603
Net Importers Bangladesh 563 254 915 522 798 916 1,077 1,057 1,275 1,320 1,352 1,581
Brazil -250 240 168 256 229 26 -83 -125 -272 -327 -379 -306
Brunei Darussalam 52 48 49 50 51 52 53 54 55 56 57 58
Cameroon 375 424 437 454 487 498 518 525 532 556 555 567
Canada 351 359 374 394 426 440 454 467 472 482 488 496
Hong Kong, China 415 427 437 443 443 446 450 452 451 453 453 454
Colombia 155 160 189 204 199 185 173 165 163 160 166 167
Cote d'Ivoire 1,373 1,059 1,107 1,072 1,126 1,147 1,161 1,229 1,280 1,325 1,379 1,422
European Union–27 1,083 1,126 1,176 1,176 1,151 1,147 1,125 1,100 1,078 1,055 1,021 986
Ghana 610 680 694 716 735 753 771 783 841 860 880 902
Guinea 260 295 378 406 411 394 372 371 393 421 449 471
Indonesia 1,960 1,775 2,662 2,982 2,935 2,974 2,853 2,812 2,866 2,779 2,836 2,919
Iran 1,750 1,838 1,937 1,959 2,021 2,070 2,105 2,150 2,180 2,201 2,231 2,247
Iraq 1,240 1,410 1,383 1,383 1,411 1,437 1,476 1,537 1,577 1,615 1,663 1,691
Japan 435 500 482 482 482 482 482 482 482 482 482 482
Kenya 430 433 414 458 442 469 444 453 486 515 548 544
Republic of Korea 377 601 400 409 409 409 409 409 409 409 409 409
Lao PDR 13 47 10 19 9 -9 -51 -101 -147 -196 -243 -295
Liberia 220 251 253 273 280 276 276 276 286 299 307 313
Malaysia 1,083 1,100 1,234 1,239 1,303 1,326 1,310 1,330 1,342 1,347 1,377 1,388
Mali 150 132 134 89 51 31 -62 -76 -95 -119 -102 -129
Mexico 644 718 776 791 792 791 795 807 836 863 877 883
Mozambique 375 442 464 486 511 507 540 552 570 581 612 626
Nigeria 3,200 2,640 2,541 2,614 2,703 2,787 2,832 2,889 2,943 3,018 3,086 3,144
Philippines 1,500 1,872 2,290 2,422 2,220 2,268 2,257 2,268 2,159 2,218 2,363 2,307
Saudi Arabia 1,130 1,208 1,211 1,237 1,260 1,293 1,328 1,359 1,386 1,408 1,422 1,439
Senegal 1,190 976 949 1,004 1,053 1,081 1,115 1,163 1,196 1,228 1,265 1,300
Sierra Leone 210 140 151 152 167 168 164 174 189 202 215 224
Singapore 350 358 366 372 375 377 381 383 381 384 385 383
South Africa 912 977 1,034 947 951 955 945 975 991 1,016 1,037 1,043
Taipei,China 140 128 128 128 128 128 128 128 128 128 128 128
Tanzania 100 166 89 93 99 43 21 39 35 46 46 20
Turkey 226 186 275 280 287 295 302 306 311 315 331 334
Other Africa 3,594 3,633 3,658 3,948 4,138 4,275 4,398 4,434 4,437 4,392 4,516 4,597
Other Americas 1,615 2,289 1,839 1,880 1,929 1,941 1,962 1,973 1,905 1,883 1,807 1,695
Other Asia 2,441 2,351 2,394 2,796 2,996 3,145 3,323 3,406 3,517 3,542 3,710 3,741
Other Europe 816 -5 324 282 264 265 291 297 285 289 285 284
Other Oceania 244 306 301 299 297 296 295 295 296 297 298 299
Residual 1,193 -299 -271 -224 -209 -199 -221 -242 -235 -213 -224 -211
Total Net Imports 32,526 31,243 33,353 34,494 35,362 35,885 36,169 36,556 36,984 37,289 38,089 38,603
Prices (US Dollars per Ton)
International Rice Reference Price 477 407 422 386 401 401 391 393 412 406 410 430
U.S. FOB Gulf Ports 575 584 569 530 515 514 522 515 529 516 512 521
U.S. No. 2 Medium FOB CA 809 778 812 814 820 818 832 849 828 801 801 816
* Total net exports are the sum of all positive net exports and negative net imports. Source: Wailes and Chavez.

46 | Appendix 5
Table A5.2: Per Capita Rice Consumption, World and Selected Countries
11/12 12/13 13/14 14/15 15/16 16/17 17/18 18/19 19/20 20/21 21/22 22/23
(Kilograms)
Argentina 8.9 8.8 8.8 8.8 8.8 8.8 8.9 9.1 9.1 9.1 9.2 9.3
Australia 14.9 15.9 15.9 16.8 17.6 17.9 17.5 17.8 18.3 18.6 18.5 18.5
Bangladesh 216.3 214.2 214.8 214.9 214.9 213.8 213.4 212.8 212.2 211.5 210.7 210.9
Brazil 39.6 39.5 39.9 40.8 41.3 41.4 41.7 42.0 41.8 41.9 41.9 41.9
Brunei Darussalam 131.9 119.8 120.8 120.8 121.0 121.1 122.5 122.8 122.9 122.8 123.0 122.7
Cambodia 234.7 241.7 241.3 242.8 243.9 244.3 244.8 245.7 246.6 247.6 249.2 249.7
Cameroon 22.3 23.3 24.5 25.1 26.1 26.1 26.5 26.4 26.3 26.9 26.4 26.5
Canada 10.3 10.5 10.8 11.3 12.1 12.4 12.8 13.0 13.1 13.2 13.3 13.4
People's Republic of China 95.8 98.0 96.8 95.6 95.0 93.7 92.7 92.0 92.0 91.2 91.0 90.4
Colombia 35.8 35.4 37.9 38.6 39.0 38.9 38.4 38.3 38.6 38.9 39.0 39.0
Cote d'Ivoire 71.1 73.2 72.9 71.8 70.9 69.8 69.1 69.6 70.0 70.7 71.3 71.5
Egypt 44.1 46.7 47.3 48.0 47.3 46.6 46.4 46.0 46.1 46.0 45.9 45.7
European Union–27 6.5 6.6 6.6 6.7 6.7 6.7 6.8 6.8 6.8 6.9 6.9 7.0
Ghana 36.3 38.5 38.6 38.6 38.6 38.7 38.7 38.6 39.8 39.9 39.9 39.9
Guinea 128.0 131.2 136.1 137.7 137.9 136.0 133.3 133.1 134.5 136.0 137.1 137.2
Hong Kong, China 58.3 59.6 60.9 61.4 61.2 61.4 61.8 61.9 61.7 61.8 61.7 61.8
India 78.5 78.9 78.9 78.9 78.9 79.0 78.9 78.9 78.9 78.8 78.8 78.7
Indonesia 160.7 162.0 161.2 160.9 161.4 162.8 162.5 162.4 162.2 162.1 162.1 162.0
Iran 42.4 43.0 43.9 44.1 44.6 44.8 44.9 45.1 45.2 45.2 45.3 45.3
Iraq 45.2 45.4 45.3 45.4 45.8 45.7 46.1 46.9 47.2 47.6 48.0 47.8
Japan 63.2 64.2 63.2 62.1 62.0 61.8 61.7 61.0 60.5 59.4 59.4 59.4
Kenya 10.7 11.8 11.1 11.7 11.3 11.6 11.1 11.1 11.5 12.0 12.5 12.4
Republic of Korea 102.1 99.7 97.4 94.8 93.7 93.4 93.3 92.0 91.7 90.9 90.1 89.9
Lao PDR 222.3 229.1 229.9 229.7 229.5 229.2 228.7 227.8 226.7 225.9 225.4 224.6
Liberia 108.0 109.6 111.8 114.7 114.6 112.2 110.8 109.7 111.0 112.8 113.8 114.5
Malaysia 94.3 98.3 97.9 99.4 100.5 101.0 100.0 100.3 99.9 99.7 99.9 99.6
Mali 94.5 103.2 103.0 104.3 104.2 104.2 101.8 101.8 102.1 102.1 103.3 103.2
Mexico 7.3 7.4 7.7 8.0 8.1 8.1 8.1 8.2 8.4 8.5 8.5 8.5
Mozambique 24.0 25.8 26.8 27.6 28.1 27.4 28.1 28.0 28.1 27.9 28.4 28.3
Myanmar 188.9 190.9 190.1 191.7 192.9 193.2 193.9 193.9 194.0 194.0 194.2 194.3
Nigeria 31.4 33.1 32.3 32.4 32.4 32.5 32.4 32.5 32.5 32.6 32.6 32.6
Pakistan 13.7 13.9 14.3 14.5 14.8 14.9 15.0 14.9 14.9 15.0 15.2 15.2
Philippines 126.2 127.2 125.3 126.7 125.5 126.0 125.7 125.4 124.7 125.3 126.3 125.7
Saudi Arabia 44.0 44.4 44.9 45.1 45.3 45.8 46.4 46.8 47.0 47.1 47.0 46.9
Senegal 102.8 104.1 103.5 104.3 104.8 105.3 105.7 106.1 106.3 106.6 107.0 107.2
Sierra Leone 178.2 149.7 153.3 151.8 152.6 151.2 149.2 149.4 150.5 151.3 152.0 152.0
Singapore 66.7 66.8 67.0 66.9 66.0 65.1 64.7 63.8 62.4 61.9 61.0 59.7
South Africa 18.0 20.3 20.3 19.7 19.7 19.7 19.6 20.0 20.4 20.8 21.3 21.4
Taipei,China 55.2 55.9 54.5 53.7 53.1 52.2 51.5 50.9 50.7 50.5 50.3 50.0
Tanzania 23.9 24.4 25.0 25.6 26.1 25.6 25.4 25.9 26.0 26.2 26.2 25.8
Thailand 155.9 157.5 157.0 156.5 156.2 156.1 155.9 155.7 155.5 155.5 155.4 155.3
Turkey 9.5 9.6 9.7 9.7 9.7 9.7 9.7 9.8 9.8 9.8 9.9 9.9
United States 11.1 12.7 12.8 13.2 13.5 13.7 13.7 13.9 14.0 14.1 14.3 14.4
Uruguay 19.6 21.7 21.9 21.7 21.6 21.3 21.0 20.8 20.8 20.8 20.7 20.4
Viet Nam 217.0 220.6 220.5 219.7 219.4 219.4 219.1 218.9 217.1 216.5 216.7 216.1
Rest of World 21.5 22.2 22.2 22.5 22.5 22.6 22.8 22.7 22.7 22.7 22.6 37.9
World 66.0 66.9 66.6 66.5 66.4 66.1 65.9 65.7 65.6 65.4 65.3 65.1
Source: Wailes and Chavez.

Appendix 5 | 47
Table A5.3: Rice Yield per Hectare, World and Selected Countries
11/12 12/13 13/14 14/15 15/16 16/17 17/18 18/19 19/20 20/21 21/22 22/23
(Tons per Hectare)
Argentina 4.3 4.4 4.4 4.4 4.5 4.5 4.6 4.6 4.6 4.7 4.7 4.7
Australia 6.3 6.6 6.7 6.8 6.9 6.9 7.0 7.1 7.1 7.2 7.2 7.2
Bangladesh 2.9 2.9 2.9 3.0 3.0 3.0 3.0 3.0 3.1 3.1 3.1 3.2
Brazil 3.3 3.3 3.3 3.3 3.3 3.3 3.4 3.4 3.4 3.4 3.5 3.5
Brunei Darussalam 0.2 0.2 0.2 0.2 0.2 0.2 0.2 0.2 0.2 0.2 0.2 0.2
Cambodia 1.5 1.6 1.6 1.7 1.7 1.8 1.8 1.9 1.9 2.0 2.1 2.1
Cameroon 1.0 1.0 1.1 1.2 1.2 1.2 1.2 1.2 1.3 1.3 1.3 1.3
Canada 0.0 0.0 0.0 0.0 0.0 0.0 0.0 0.0 0.0 0.0 0.0 0.0
People's Republic of China 4.7 4.7 4.7 4.8 4.8 4.8 4.9 4.9 4.9 5.0 5.0 5.0
Egypt 6.1 6.3 6.5 6.7 6.8 6.8 6.8 6.9 6.9 6.9 7.0 7.1
European Union–27 4.3 4.4 4.6 4.7 4.7 4.8 4.9 4.9 5.0 5.1 5.2 5.2
Ghana 1.6 1.6 1.7 1.7 1.7 1.8 1.8 1.8 1.9 1.9 1.9 2.0
Guinea 1.3 1.3 1.4 1.4 1.4 1.4 1.4 1.4 1.4 1.4 1.4 1.4
Hong Kong, China 0.0 0.0 0.0 0.0 0.0 0.0 0.0 0.0 0.0 0.0 0.0 0.0
India 2.4 2.3 2.4 2.4 2.5 2.5 2.5 2.5 2.5 2.5 2.6 2.6
Indonesia 3.0 3.0 3.1 3.1 3.2 3.2 3.3 3.3 3.3 3.3 3.4 3.4
Iran 2.8 2.8 2.8 2.9 2.9 2.9 3.0 3.0 3.0 3.0 3.1 3.1
Iraq 2.1 2.2 2.1 2.2 2.2 2.2 2.2 2.2 2.2 2.2 2.2 2.2
Cote d'Ivoire 1.4 1.4 1.5 1.5 1.5 1.5 1.5 1.5 1.5 1.5 1.5 1.5
Japan 4.9 4.9 4.9 4.9 4.9 4.9 4.9 4.9 4.9 4.8 4.8 4.8
Kenya 1.9 2.0 2.1 2.2 2.2 2.2 2.2 2.3 2.3 2.3 2.4 2.4
Republic of Korea 4.9 5.0 5.1 5.1 5.1 5.2 5.2 5.2 5.2 5.2 5.2 5.2
Lao PDR 1.7 1.8 1.8 1.8 1.8 1.9 1.9 2.0 2.0 2.1 2.1 2.2
Malaysia 2.5 2.5 2.5 2.5 2.6 2.6 2.6 2.7 2.7 2.7 2.8 2.8
Mali 2.3 2.2 2.3 2.4 2.4 2.5 2.5 2.6 2.6 2.7 2.7 2.8
Mexico 3.6 3.5 3.5 3.6 3.6 3.6 3.7 3.6 3.7 3.6 3.6 3.7
Mozambique 0.8 0.8 0.8 0.9 0.9 0.9 0.9 0.9 0.9 0.9 0.9 0.9
Myanmar 1.7 1.7 1.7 1.7 1.7 1.8 1.8 1.8 1.8 1.9 1.9 1.9
Nigeria 1.2 1.3 1.3 1.4 1.4 1.4 1.5 1.5 1.5 1.6 1.6 1.6
Pakistan 2.4 2.4 2.4 2.4 2.5 2.5 2.5 2.5 2.5 2.5 2.5 2.5
Philippines 2.3 2.4 2.4 2.5 2.5 2.6 2.6 2.7 2.7 2.8 2.8 2.8
Saudi Arabia 0.0 0.0 0.0 0.0 0.0 0.0 0.0 0.0 0.0 0.0 0.0 0.0
Senegal 2.7 2.8 2.8 2.8 2.8 2.9 2.9 2.9 3.0 3.0 3.0 3.1
Sierra Leone 1.1 1.0 1.1 1.1 1.1 1.1 1.1 1.1 1.1 1.1 1.1 1.2
Singapore 0.0 0.0 0.0 0.0 0.0 0.0 0.0 0.0 0.0 0.0 0.0 0.0
South Africa 0.0 0.0 0.0 0.0 0.0 0.0 0.0 0.0 0.0 0.0 0.0 0.0
Taipei,China 4.2 4.1 4.1 4.1 4.1 4.1 4.1 4.1 4.1 4.1 4.2 4.2
Tanzania 1.1 1.0 1.1 1.2 1.2 1.2 1.2 1.2 1.2 1.2 1.3 1.3
Thailand 1.9 1.9 1.9 1.9 1.9 2.0 2.0 2.0 2.0 2.0 2.0 2.1
Turkey 4.8 4.8 4.9 4.9 5.0 5.1 5.1 5.2 5.2 5.3 5.3 5.4
United States 5.5 5.9 5.8 5.8 5.8 5.8 5.8 5.8 5.9 5.9 5.9 5.9
Uruguay 5.5 5.6 5.7 5.8 5.8 5.9 5.9 6.0 6.0 6.0 6.1 6.2
Viet Nam 3.5 3.5 3.5 3.6 3.6 3.6 3.7 3.7 3.7 3.8 3.8 3.8
Rest of World 2.2 2.3 2.3 2.3 2.3 2.3 2.3 2.4 2.4 2.4 2.4 2.5
World 2.9 3.0 3.0 3.0 3.0 3.0 3.1 3.1 3.1 3.1 3.1 3.2
Source: Wailes and Chavez.

48 | Appendix 6
Results of Stochastic Analyses for ASEAN Regional
Rice Supply and Utilization and International Rice Prices
Figure A6.1: Medium-Grain Rice Prices, FOB California (Stochastic Projection)
FOB = freight on board. Source: Wailes and Chavez.
Figure A6.2: World Net Rice Trade (Stochastic Projection)
Source: Wailes and Chavez.

Appendix 6 | 49
Figure A6.3: ASEAN Total Rice Area Harvested (Stochastic Projection)
Source: Wailes and Chavez.
Figure A6.4: ASEAN Total Rice Production (Stochastic Projection)
Source: Wailes and Chavez.

50 | Appendix 6
Figure A6.5: ASEAN Total Rice Consumption (Stochastic Projection)
Source: Wailes and Chavez.
Figure A6.6: ASEAN Net Rice Exports (Stochastic Projection)
Source: Wailes and Chavez.

Appendix 6 | 51
Figure A6.7: ASEAN Net Rice Imports (Stochastic Projection)
Source: Wailes and Chavez.
Figure A6.8: ASEAN Rice Stocks-to-Use Ratio (Stochastic Projection)
Source: Wailes and Chavez.
0.18
0.22
0.26
0.3
2012 2013 2014 2015 2016 2017 2018 2019 2020 2021 2022
10th Percentile Mean 90th Percentile
Ratio