ashaolu_resource use 1
TRANSCRIPT

7/31/2019 Ashaolu_Resource Use 1
http://slidepdf.com/reader/full/ashaoluresource-use-1 1/18
Journal of Rural Res. & Information (Vol.6; No.1:2011) Asholu
RESOURCE-USE EFFICIENCY AND PROFITABILITY OF OFADA RICE
FARMING IN OGUN STATE, NIGERIA.
O.F. ASHAOLU
Department of Agricultural Economics and Farm Management
University of Agriculture,PMB 2240, Abeokuta, NigeriaE-mail: [email protected]: +2348034306676
ABSTRACT
This study focused on the resource-use efficiency and profitability of ofada rice farming inOgun State, Nigeria, Primary data were collected from a cross-section of 240 farmhouseholds involved in ofada rice production. A multi-stage sampling technique using acombination of purposive and simple random sampling method was adopted to select therespondents for interview using a well-structured, pre-tested and modified questionnaire.Tools of analysis include descriptive, cost and returns, gross margin and regression
analyses. It was observed that literacy level was low among the farmers and majority of them were youths (73%). Most of them (59%) utilized their personal savings for farmoperations. Also, about 79% of the farmers operated less than 2 hectares of farmland, andthe mean farm size was 1.52 hectares. Average number of parcels operated however decreased as farm size increased. The mean yield of rice increased as farm size increased.Average costs on variable resources constituted about 59% of the total cost of production.The Average Return on Investment (AROI) was estimated at 9.84 while the Rate of Returnon Investment (RORI) was 884 per cent, thus suggesting that ofada rice production in thestudy area is quite profitable. AROI and RORI were higher on sole-cropped rice farms thanon rice farms inter-cropped with maize. An average of 66%, 47% and 36% of farmers weretechnically, allocatively and economically efficient, respectively, in the study area. In other
words, a significant allocative and economic inefficiencies exist in ofada rice production inthe study area (p ≤ 0.05 ). This suggests considerable room for productivity gains for thefarms through better use of available resources, given the state of technology. Theinefficient small scale farmers (about 79 percent) still dominate in the production of foodfor the teeming population. Significant structural changes must be made in the process of modernization & getting agriculture moving. To carry out successfully such structuralchanges major policy variables are needed to formalize & tinker with current laissez faireoperations. From the foregoing, there is need for the various governments to gradually de-emphasize the fact that the inefficient small farmers should be the center piece of food production in the state and in Nigeria in general. Adequate land should be made availableto farmers, majority of who do not own the farmland. They should be encouraged and
empowered by enhancing their status on land being cultivated; this could be by contractualarrangement whereby government, rather than individual land owners provide the land.
Keywords: Resource-use, efficiency, profitability, ofada rice, Ogun State.
INTRODUCTION
1

7/31/2019 Ashaolu_Resource Use 1
http://slidepdf.com/reader/full/ashaoluresource-use-1 2/18
Journal of Rural Res. & Information (Vol.6; No.1:2011) Asholu
Rice Production Trends in Nigeria
Rice, (Oryza spp.), is the most important staple food for about half of the human
race. After wheat, it is the most widely cultivated cereal in the world. It is also the most
rapidly growing food source in Nigeria and it has a major influence on human nutrition and
food security all over the world.
As well banning rice imports in Nigeria, other government policies since 1974
were aimed at encouraging and boosting local rice production. In spite of these
programmes, local rice production has not kept up with the domestic consumption demands
of the Nigerian populace and, consequently, rice is still imported. The production increase
has not been enough to meet the consumption demand of the rapidly growing urban
population, who has a great preference for parboiled rice (Singh et al, 1997). This situationled to acute demand for parboiled rice in the 1990’s, which contrasted with Nigeria’s self
sufficiency in rice during the 1960’s.
However, rice production is limited by many constraints. The low turn out and
instability in rice output, and a consequent rise in its importation to meet the skyrocketing
demand, created a serious drain on Nigeria’s foreign exchange reserve, which stood at
US$407.5 million in the 1960s but dropped to US$58 million in the 1990s (IRRI, 1991).
The local rice, called ofada (OS 6 variety), whose consumption has long been
abandoned by the elites for imported rice brands, is now widely preferred by many guests
at parties, restaurants and so on. The local rice was relied upon by the down-trodden, poor
citizens, looking for where the next meal would come from. However, output of local rice
in Ogun State with respect to national output, has not been encouraging over the years
(Table 2).
Table 2: Percentage Contribution of Ogun State to Nigerian Rice Output, 1996-2005.
2

7/31/2019 Ashaolu_Resource Use 1
http://slidepdf.com/reader/full/ashaoluresource-use-1 3/18
Journal of Rural Res. & Information (Vol.6; No.1:2011) Asholu
Year Output for Ogun
State(MT)
% of National Output
1996 16,706 0.541997 15,940 0.49
1998 17,290 0.531999 13,801 0.422000 12,372 0.382001 10,500 0.382002 7,855 0.252003 7,932 0.242004 9,250 0.262005 13,413 0.38
Sources: Computed from Data in:(i) CBN, (2005)(ii) OGADEP, CAYS 1996-2005 Report
Source: OGADEP STATISTICS, 2005
The erstwhile lowly priced ofada rice is now a status symbol among the privileged
class. The elites’ change to ofada rice brand has some implications on the poor masses of
this country. The ofada price is now spiraling beyond the reach of the common man.The
rising import bills of imported rice brands necessitated the Federal Government’s ban on
them and also with the need to encourage local production. With various surveys done on
the scope of consumption of ofada rice, yet there has not been adequate arrangement for
sufficient planting and harvest of the local substitute to supposedly banned imported rice
brands.
A study into the production of ofada rice as well as steps to boost local production
and yield of this rice variety becomes important. The study will facilitate insight into the
economic and technical efficiencies of key productive inputs in order to know areas of
possible adjustments to augment farm incomes.In view of this scenario, issues and
questions relating to the existing production status and economic prospects of the
expansion of ofada rice production in terms of income generation, resource allocation, production techniques and profitability, were raised and addressed.
The study therefore examines the existing farm-size patterns and fragmentation levels;
determines the technical, allocative, and economic efficiency of input use; and assessing
the costs and returns structure, hence, economic viability of ofada rice farming.
3

7/31/2019 Ashaolu_Resource Use 1
http://slidepdf.com/reader/full/ashaoluresource-use-1 4/18
Journal of Rural Res. & Information (Vol.6; No.1:2011) Asholu
Research Hypotheses
The null hypotheses for the study are that
(i) there is no significant difference in the mean of technical efficiency between the
smallest and the largest farm-size groups
(ii) there is no significant difference in the absolute values of returns-to-management
between the smallest and the largest farm-size groups.
(iii) all the key productive inputs are economically inefficient.
RESEARCH METHODOLOGY
The Study Area
The study area was Ogun State. The State is located within the rain forest belt of
the tropical region (situated between Latitude 6.2o N and 7.8o N and Longitude 3.0oE and
5.0oE). It covers an estimated land area of 16,409.29 sq. km, seventy (70) percent of which
is suitable for arable crop production (FGN, 2009). The state shares boundaries with Oyo
and Osun states to the North, Lagos state and Atlantic Ocean to the South, Republic of
Benin to the west and Ondo State to the East. The annual rainfall ranges between 1,000mm
to 2,000mm, having bimodal pattern with the peaks at May/June and September/October.
The temperature range is between 20oC and 30oC, highest in March and lowest in July.
The major rice-producing areas of the State were mapped out for the study.
Agriculture remains the mainstay of the economy of the State. It has a fertile soil that
supports the growth of rice, cowpeas, yams, cassava, oil palm, citrus, vegetables and many
other food and cash crops. In addition, a number of farmers in the state engage in livestock
production such as poultry, cattle, goat and sheep.
Data Collection and Sampling Techniques
The study utilized primary data obtained from a cross-sectional survey of 240 farm
households involved in ofada rice production in the rice producing areas of Ogun State for
the 2006 farming season. A multi-stage sampling technique using a combination of
purposive and simple random sampling method was adopted to select 240 respondents for
interview using a well-structured, pretested and modified questionnaire. Smallholder rice
farmers selected from ten (10) villages of Ikenne zone of the Ogun State Agricultural
Development Project (OGADEP) agricultural zones were interviewed. The villages chosen
4

7/31/2019 Ashaolu_Resource Use 1
http://slidepdf.com/reader/full/ashaoluresource-use-1 5/18
Journal of Rural Res. & Information (Vol.6; No.1:2011) Asholu
were Mokoloki, Obafemi, Someke, Orile-Imo, Itori Oke, Efuro, Isiun, Ayiwere, Oluwo
Oke, and the popular Ofada village. Farmers were categorized into three (3) groups based
on farm sizes cultivated. The farm size groups designed for the study are as follows :
● Group I……………………………………Relatively farms under 0.10 to 1.99 hectares● Group II…………………………………...Relatively medium farms from 2.00 to 3.99hectares● Group III…………………………………..Relatively large farms ≥ 4.00 hectares
Analytical Framework .
To achieve the study objectives, the analytical tools used include descriptive, costand returns (gross margin) and regression analyses.
Cost and Returns Structure Analysis: The gross margin approach for the economicviability objective is expressed as
Gross Margin (GM) = Total Rev – Total Variable Cost………………………(1)where:Total Rev = rice output/ha x Market price = P x Q……………………………(2)GM = TR – TVC
GM = P.Q – TVC ………………………………...……………………(3)TR = Total RevenueTVC = Total Variable Cost = ΣPixi = P 1 x1 P 2 x2 ….. P n xn……………………..(4) P = Price / kg of rice (N)Q = Quantity of rice (kg)
Cost Structure Analysis
Cost structure = Cost of variable inputs of interest x 100% ………………(5)Total Cost
TVC x 100%TC
Cost structure = Fixed cost of interest x 100% ………………………(6)Total cost
= TFC x 100%TC
Where
TVC = Total variable costTFC = Total Fixed costTC = Total cost
Regression Analysis (Stochastic Production Frontier): Following Battese and Coelli
(1992) and Chavas et al (2005) in a two stage estimation approach, the specification of the
5

7/31/2019 Ashaolu_Resource Use 1
http://slidepdf.com/reader/full/ashaoluresource-use-1 6/18
Journal of Rural Res. & Information (Vol.6; No.1:2011) Asholu
linearized double-logarithmic form of the stochastic production frontier equation adopted
for technical efficiency is expressed as:
In Y i = β 0 + β 1 lnX 1 + β 2 lnX 2 + β 3 lnX 3 + β 4 lnX 4 + β 5 lnX 5 + β 6 lnX 6 + β 7 lnX 7 + β 8 lnX 8+U 1 – V 1 ………………(7)
Wherei = refers to the ith farm in the sample.Y = rice output in kg X 1 = Farm size in ha X 2 = hired labour in mandays X 3 = family labour in mandays X 4 = quantity of fertilizer used in kg X 5 = cost of other intermediate materials including herbicides insecticides etc. (N). X 6 = No. of extension visits/contacts. X 7 = seed variety, dummy variable: 1 if improved variety, 0 if local variety. X 8 = quantity of seeds used in kg.
vi = random variables which are assumed to be iid. N(0,2
vσ ) and cannot be influenced bythe farmer.
ui = non-negative random variables which are assumed to account for technical inefficiency
in production and are often assumed to be iid /N (0,2
uσ ).
β = vector of production function parameters to be estimated.i = 1, 2, 3.........................................n farms.
This equation was estimated using frontier 4.1. econometric software which also provides estimates of the technical (TE) efficiency for each farmer. The allocative and economic efficiency estimates were obtained for each farmer andexpressed as AE i = (P x Y i / R*) ………………………………………………….(8)
TE iWherei = 1, 2, 3 ………………………n farm P = price of rice /Kg.₦
Y = output of the ith farming household kg/haTE = estimate of technical efficiency of the ith farmer R* = highest revenue recorded per hectare among farmer in the sample.
The overall economic efficiency was obtained as EE = TE x AE ……………………………………………..(9)Where
EE = Economic efficiencyTE = technical efficiency AE = allocative efficiency.Also, the effect of socio-economic variables on production efficiency was analyzed via theinefficiency equation stated asU = f(δ0 + δ1 Z 1+ δ2 Z 2+ δ3 Z 3 + δ4 Z 4 + δ5 Z 5 + δ6 Z 6 + δ7 Z 7 + Z 8 Z 8 + δ9 Z 9 + δ10 Z 10+ δ11 Z 11+ ei )
………………………………………………………………………………………(10) Where
6

7/31/2019 Ashaolu_Resource Use 1
http://slidepdf.com/reader/full/ashaoluresource-use-1 7/18
Journal of Rural Res. & Information (Vol.6; No.1:2011) Asholu
U = estimate of overall economic efficiency of the farmers Z 1 = Age (years) Z 2 = Gender (male = 0, female 1) Z 3 = Educational background (years of formal education) Z 4 = Farm size in hectares
Z 5 = Household size Z 6 = Cropping pattern Z 7 = availability of improved seeds, 0 if available, 1 if not available Z 8 = Tenancy status Z 9 = availability of fertilizer – 0 if available, 1 otherwise Z 10 = Credit measured in N
Fragmentation/Simpson index
Simpson index is defined as
SIM = 1 - ( Σ i Ai2 /A2 ) ( Blarel et al., 1992). ………………………………………………(11)
where, Ai = area of the ith parcel; A = ∑ iAi, is the total farm area. The index ranges
between 0 and 1. A value of zero indicates complete land consolidation (one parcel only),while the value of one is approached by farms of numerous parcels of equal size.
Test of Hypothesis
In testing hypotheses (i) and (ii), a method of the 'difference between two means' of theindependent populations was used.The null hypothesis, Ho, is stated as:
Ho: µ L = µ s , or µ L - µ s = 0 .................................................................................(12)and the alternative hypothesis, Ha is,
Ha : µ L - µ s ≠ 0, or µ L ≠ µ s ,...........................................................................................(13)
The test statistic is,
(x L-xS ) - ( µ L- µ s )
tc = σ 2 L + σ 2S
n L n s ....................................................................(14)
where x L = sample mean of large farms (Grp I) x s = sample mean of small farms (Grp III)
σ 2 L =variance of sample of large farms
σ 2 s = variance of sample of small farmsn L = sample size of large farmsn s = sample size of small farms
t c = computed value of t- statisticThe decision rule is, accept Ho if /t c /<t T , where t T is t-tabulated of the student's t-distribution with V degree of freedom .
In testing hypothesis (iii), the signs of the farm size regression coefficients wereobserved, and appropriate tests carried out. Here a test of significance approach was usedto verify the truth or falsity of the stated Ho.The test criterion is stated thus:
Ho:β i = 0 .......................................................................................................... (15)
7

7/31/2019 Ashaolu_Resource Use 1
http://slidepdf.com/reader/full/ashaoluresource-use-1 8/18
Journal of Rural Res. & Information (Vol.6; No.1:2011) Asholu
Ha: β i ≠ 0 .................................................................................................... (16)
The test statistic
tc = β i -0 β i
S. E ( β i ) = S.E.( β i )- ........................................................................... (17)
where β i = estimated farm size regression parameter.S.E . = standard error of regressionThe decision rule is to reject Ho if /tc/>t T , or, accept Ho if /tc/< t T
If ‘Ho’ is rejected, it means that β i is statistically different from zero. That is, arelationship exists between the output per net cropped hectare for the total value of crop production and farm size.
RESULTS AND DISCUSSION
Socio-Economic Characteristics of Farmers
The socio-economic and cultural characteristics affecting farmers generally in the
study area have influence, not only on the magnitude of output or incomes of farmers, but
also on their ability to improve on the size of cultivable farmlands. The socio-economic
and cultural features considered in this study include age, household size, sex, level of
education, farming experience, marital status and average farm size cultivated (Table 3).
Age is an important factor influencing the productivity and innovative ability of
farmers. It is believed to have an inverse relationship with productivity and innovativeness,
all things being equal. Results showed that about 71 percent of farmers fell within the 31-
50 years age bracket and this implies that farmers belong to the economically active
category of the population. The overall size of the farmers’ households is made up of the
children, the wives, and the dependent relatives. This has implications on family labour
usage and availability. Majority of the respondents (about 96 percent) had between 3 and 8
persons per household. The modal household size-range is however 5-6 persons (about 56
percent).The level of education of a farmer is assumed to influence his level of awareness
and ability to adopt innovation. About 44 percent of the farmers had no former education
while the rest had one form of education or the other. In this study area, the farmers count
more on their experience to increase productivity than their educational attainment.
Interestingly, more than 60 percent of farmers had between 11 and 30 years of farming
8

7/31/2019 Ashaolu_Resource Use 1
http://slidepdf.com/reader/full/ashaoluresource-use-1 9/18
Journal of Rural Res. & Information (Vol.6; No.1:2011) Asholu
experience. Majority of ofada rice farmers (about 79 percent) operated small size of farms
of less than 2.0 hectares. The mean farm size was 1.52 hectares.
On gender, majority (85percent) of farmers were males since women were
generally not allowed to own land and as such did not have secured independent access toland except in cases when they help their husbands in the areas of harvesting and
processing. Even the mode of land acquisition among the male respondents was by lease
arrangement (about 63percent) while the rest either inherited (about 34percent) or
purchased (about 3percent) the cultivated land. Almost all the respondents (about
76percent) did not use fertilizer for rice production.
Table 3: Description of Socio-Economic Variables and Summary Statistics
Characteristics Frequency Percent Cumulative %
Age (years)
≤ 30 3 1.3 1.3
31-40 48 20 21.3
41-50 123 51.3 72.5
51-60 60 25 97.5
>60 6 2.5 100.0
Total
Mean
240
46.2
100.0
Sex
Male 204 85 85
Female 36 15 100.0
Total 240 100.0
Marital Status
Single 14 5.8 5.8
Married 192 80 85.8
Divorced 4 1.7 87.5
Widowed 30 12.5 100.0
Total 240 100.0
Household Size
≤ 2 persons 3 1.3 1.3
9

7/31/2019 Ashaolu_Resource Use 1
http://slidepdf.com/reader/full/ashaoluresource-use-1 10/18
Journal of Rural Res. & Information (Vol.6; No.1:2011) Asholu
3-4 persons 33 13.8 15.1
5-6 persons 135 56.3 71.4
7-8 persons 63 26.3 97.7
≥ 9 persons 6 2.5 100.0
Total 240 100.0
Mean 6
Farming exp, yrs
≤ 10 54 22.5 22.5
11-20 90 37.5 60
21-30 54 22.5 82.5
31-40
≥ 40
36
6
15
2.5
97.5
100.0
Total 240
Mean 20.13
Avg farm size, Ha
≤ 1.00 117 48.75 48.75
1.00-1.99 72 30.00 78.75
2.00-2.99 41 17.08 95.83
3.00-3.99 6 2.50 98.33
≥ 4.00Total
Mean
4240
1.52
1.67100.0
100.0
Educational level
No formal education 105 43.8 43.8
Attended elem. Schl 9 3.8 47.6
Completed elem.Schl
117 48.8 96.4
Completed sec. schlPost secondary schl
63
2.51.1
98.9100.0
Total 240 100.0
Source: Field Survey, 2006
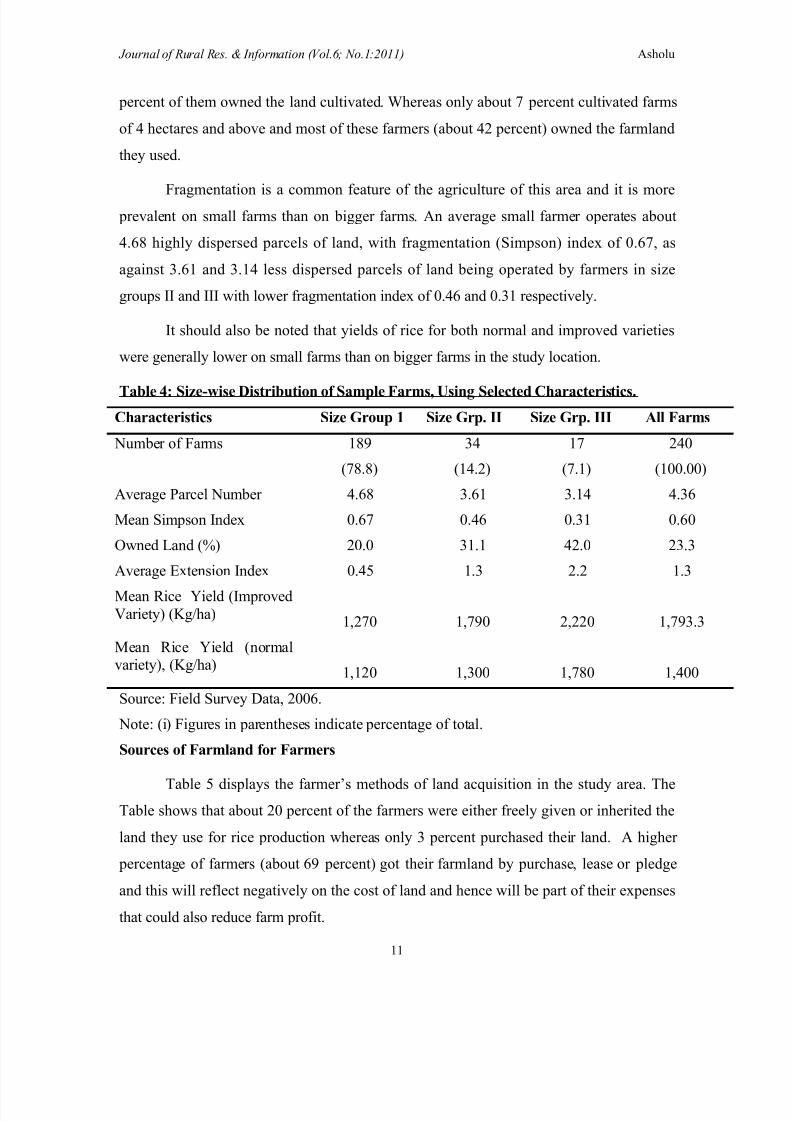
Size-wise Distribution of Sample Farms: Table 4 shows the size-wise distribution of
sample farms. About 79 percent of farmers cultivated farms of less than 2 hectares and 20
10
7/31/2019 Ashaolu_Resource Use 1
http://slidepdf.com/reader/full/ashaoluresource-use-1 11/18
Journal of Rural Res. & Information (Vol.6; No.1:2011) Asholu
percent of them owned the land cultivated. Whereas only about 7 percent cultivated farms
of 4 hectares and above and most of these farmers (about 42 percent) owned the farmland
they used.
Fragmentation is a common feature of the agriculture of this area and it is more prevalent on small farms than on bigger farms. An average small farmer operates about
4.68 highly dispersed parcels of land, with fragmentation (Simpson) index of 0.67, as
against 3.61 and 3.14 less dispersed parcels of land being operated by farmers in size
groups II and III with lower fragmentation index of 0.46 and 0.31 respectively.
It should also be noted that yields of rice for both normal and improved varieties
were generally lower on small farms than on bigger farms in the study location.
Table 4: Size-wise Distribution of Sample Farms, Using Selected Characteristics.
Characteristics Size Group 1 Size Grp. II Size Grp. III All Farms
Number of Farms 189
(78.8)
34
(14.2)
17
(7.1)
240
(100.00)
Average Parcel Number 4.68 3.61 3.14 4.36
Mean Simpson Index 0.67 0.46 0.31 0.60
Owned Land (%) 20.0 31.1 42.0 23.3
Average Extension Index 0.45 1.3 2.2 1.3
Mean Rice Yield (ImprovedVariety) (Kg/ha)
1,270 1,790 2,220 1,793.3
Mean Rice Yield (normalvariety), (Kg/ha)
1,120 1,300 1,780 1,400
Source: Field Survey Data, 2006.
Note: (i) Figures in parentheses indicate percentage of total.
Sources of Farmland for Farmers
Table 5 displays the farmer’s methods of land acquisition in the study area. The
Table shows that about 20 percent of the farmers were either freely given or inherited the
land they use for rice production whereas only 3 percent purchased their land. A higher
percentage of farmers (about 69 percent) got their farmland by purchase, lease or pledge
and this will reflect negatively on the cost of land and hence will be part of their expenses
that could also reduce farm profit.
11

7/31/2019 Ashaolu_Resource Use 1
http://slidepdf.com/reader/full/ashaoluresource-use-1 12/18
Journal of Rural Res. & Information (Vol.6; No.1:2011) Asholu
Table 5: Farmer’s Methods of Land Acquisition
Land Acquisition Percentage
Purchase
Inheritance
Lease
Gift
Pledge
No answer
3.3
20.0
63.0
3.3
2.9
7.5Total 100.00
Source: Field Survey, 2006
Costs and Returns Structure in Ofada Rice Production
This analysis was undertaken by budgetary technique in which various components
of costs and returns of an average ofada rice farm planted sole was determined on per
hectare basis and compared with costs and returns when intercropped with maize as was
common in the study area. The results are as given in Table 6.
The study found out that an average ofada rice farmer, planting only rice, recorded
a mean output of 1793.3 kg per hectare (for improved variety). Selling the improved
processed rice variety at an average price of N210.00 per kg, an average farmer in the
sample realised a gross value of output estimated at N376,593 per hectare. Total variable
cost of production was estimated at N17,058.80 per hectare leaving a gross margin of
N359,534.20 per hectare and a net income (profit) to the tune of N347,421.40 per hectare,
for ofada rice planted sole during the 2006 production season. The average return on
investment was estimated at 9.84 while the rate of returns on investment was 884 per cent,
thus suggesting that ofada rice production in the study area is quite profitable.
Table 6: Per Hectare Costs and Returns Structure (N)
Description Sole-
cropping
Inter-
cropping
Total Revenue (N / Ha)Value of rice output at harvest N376,593.00 -
Value of rice inter-cropped with maize - 143,000.00Value of harvests consumed at home 26,000.00 13,000.00Less: Total variable costGross Margin (N / Ha)Less: Total fixed cost (N / Ha)Total cost (N / Ha)
17,058.80269,869.2012,112.8029,171.60
14,240.00128,760.0010,002.0024,242.00
12

7/31/2019 Ashaolu_Resource Use 1
http://slidepdf.com/reader/full/ashaoluresource-use-1 13/18
Journal of Rural Res. & Information (Vol.6; No.1:2011) Asholu
Net farm income (NFI or net margin) (N /Ha)
347,421.40 118,758.00
Profitability indicators
Average Return on Invt (AROI) i.e. BCR 12.91 5.90Rate of Return on Invt (RORI) i.e.
NFI/TC (%)
1191 490
Source: Field Survey Data (2006).
Table 7: Average Cost Structure of Ofada Rice Farmers (Sole Cropping).
Cost items Amount N/ha % of Total cost
Variable Costs
Seed cost 3984.66 13.7Fertilizer 2223.68 7.62Pesticide cost 1125 3.86Fertilizer application 439.583 1.51
Weeding cost 1703.03 5.84Clearing cost 3013.68 10.30Planting cost 2655.56 9.10Bird scaring cost 3131.636 1.08Harvesting cost 1115.69 3..82Processing cost 484. 285 1.66Total Variable Cost 17058.80 58.50
Fixed Costs
HoeCutlass cost
Hand trowel costShovel costAxes cost
1346.978089.1493.33
1110.351473.02
4.6227.700.32
3.815.05
Total Fixed Cost 12112.80 41.50
Total Cost 29171.60 100
Source: Field Survey, 2006.
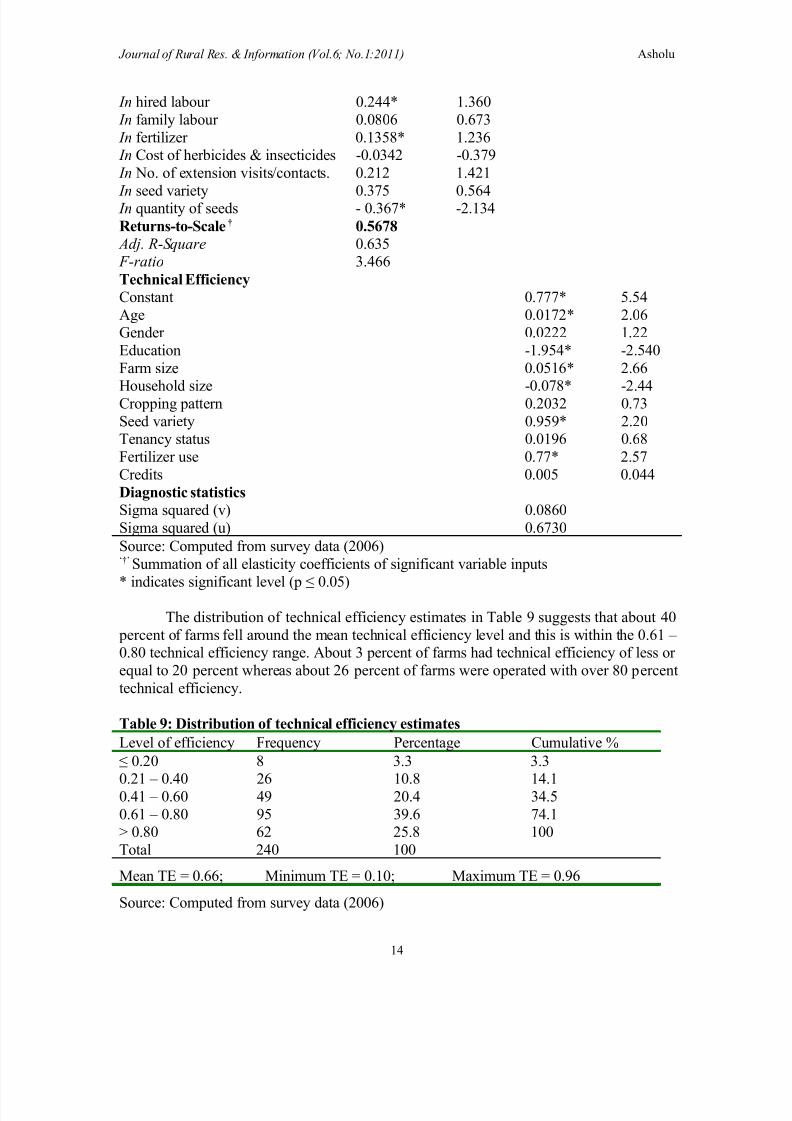
Technical Efficiency of Resource Use
The results of technical efficiency were shown in Table 8. The decline in technicalefficiency with reference to farm size however, contradicts a-priori expectation since itwas expected that increase in farm size would reduce farm fragmentation and hence
increase the efficiency of tractor use.
Table 8: Technical Efficiency Estimates
Variables OLS estimates MLE estimates
Coefficients t-value Coefficients t-value
Stochastic Production Frontier
Constant 7.648* 14.884 In Farm size 0.555* 2.673
13
7/31/2019 Ashaolu_Resource Use 1
http://slidepdf.com/reader/full/ashaoluresource-use-1 14/18
Journal of Rural Res. & Information (Vol.6; No.1:2011) Asholu
In hired labour 0.244* 1.360 In family labour 0.0806 0.673 In fertilizer 0.1358* 1.236 In Cost of herbicides & insecticides -0.0342 -0.379 In No. of extension visits/contacts.
In seed variety In quantity of seeds
0.212
0.375- 0.367*
1.421
0.564-2.134Returns-to-Scale†
Adj. R-Square F-ratio
0.5678
0.6353.466
Technical Efficiency
Constant 0.777* 5.54Age 0.0172* 2.06Gender 0.0222 1.22Education -1.954* -2.540Farm size 0.0516* 2.66
Household size -0.078* -2.44Cropping pattern 0.2032 0.73Seed variety 0.959* 2.20Tenancy status 0.0196 0.68Fertilizer use 0.77* 2.57Credits 0.005 0.044Diagnostic statistics
Sigma squared (v) 0.0860Sigma squared (u) 0.6730
Source: Computed from survey data (2006)‘†’ Summation of all elasticity coefficients of significant variable inputs
* indicates significant level (p ≤ 0.05)
The distribution of technical efficiency estimates in Table 9 suggests that about 40 percent of farms fell around the mean technical efficiency level and this is within the 0.61 – 0.80 technical efficiency range. About 3 percent of farms had technical efficiency of less or equal to 20 percent whereas about 26 percent of farms were operated with over 80 percenttechnical efficiency.
Table 9: Distribution of technical efficiency estimates
Level of efficiency Frequency Percentage Cumulative %
≤ 0.20 8 3.3 3.3
0.21 – 0.40 26 10.8 14.10.41 – 0.60 49 20.4 34.50.61 – 0.80 95 39.6 74.1> 0.80 62 25.8 100Total 240 100
Mean TE = 0.66; Minimum TE = 0.10; Maximum TE = 0.96
Source: Computed from survey data (2006)
14
7/31/2019 Ashaolu_Resource Use 1
http://slidepdf.com/reader/full/ashaoluresource-use-1 15/18
Journal of Rural Res. & Information (Vol.6; No.1:2011) Asholu
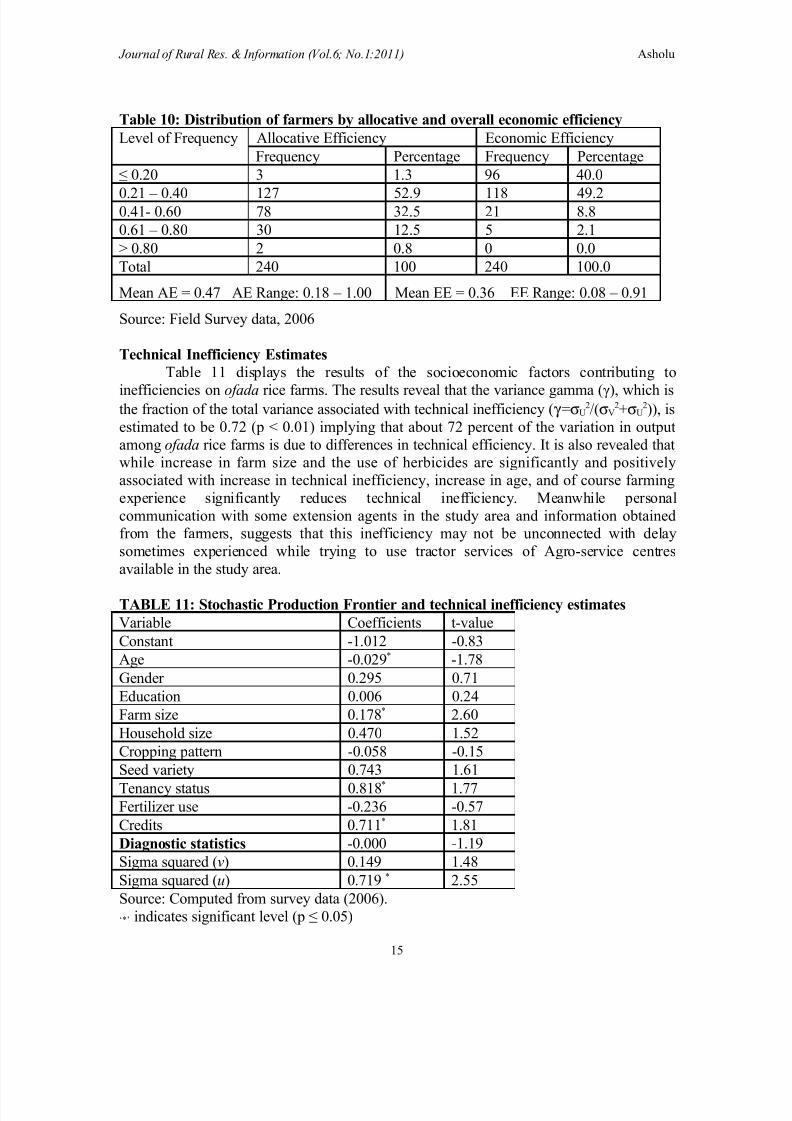
Table 10: Distribution of farmers by allocative and overall economic efficiency
Level of Frequency Allocative Efficiency Economic Efficiency
Frequency Percentage Frequency Percentage
≤ 0.20 3 1.3 96 40.0
0.21 – 0.40 127 52.9 118 49.20.41- 0.60 78 32.5 21 8.8
0.61 – 0.80 30 12.5 5 2.1
> 0.80 2 0.8 0 0.0
Total 240 100 240 100.0
Mean AE = 0.47 AE Range: 0.18 – 1.00 Mean EE = 0.36 EE Range: 0.08 – 0.91
Source: Field Survey data, 2006
Technical Inefficiency Estimates
Table 11 displays the results of the socioeconomic factors contributing to
inefficiencies on ofada rice farms. The results reveal that the variance gamma (γ), which isthe fraction of the total variance associated with technical inefficiency (γ =σU
2/(σV2+σU
2)), isestimated to be 0.72 (p < 0.01) implying that about 72 percent of the variation in outputamong ofada rice farms is due to differences in technical efficiency. It is also revealed thatwhile increase in farm size and the use of herbicides are significantly and positivelyassociated with increase in technical inefficiency, increase in age, and of course farmingexperience significantly reduces technical inefficiency. Meanwhile personalcommunication with some extension agents in the study area and information obtainedfrom the farmers, suggests that this inefficiency may not be unconnected with delaysometimes experienced while trying to use tractor services of Agro-service centresavailable in the study area.
TABLE 11: Stochastic Production Frontier and technical inefficiency estimates
Variable Coefficients t-value
Constant -1.012 -0.83
Age -0.029* -1.78
Gender 0.295 0.71
Education 0.006 0.24
Farm size 0.178* 2.60
Household size 0.470 1.52
Cropping pattern -0.058 -0.15
Seed variety 0.743 1.61
Tenancy status 0.818* 1.77Fertilizer use -0.236 -0.57
Credits 0.711* 1.81
Diagnostic statistics -0.000 -1.19
Sigma squared (v) 0.149 1.48
Sigma squared (u) 0.719 * 2.55
Source: Computed from survey data (2006).
‘*’ indicates significant level (p ≤ 0.05)
15
7/31/2019 Ashaolu_Resource Use 1
http://slidepdf.com/reader/full/ashaoluresource-use-1 16/18
Journal of Rural Res. & Information (Vol.6; No.1:2011) Asholu
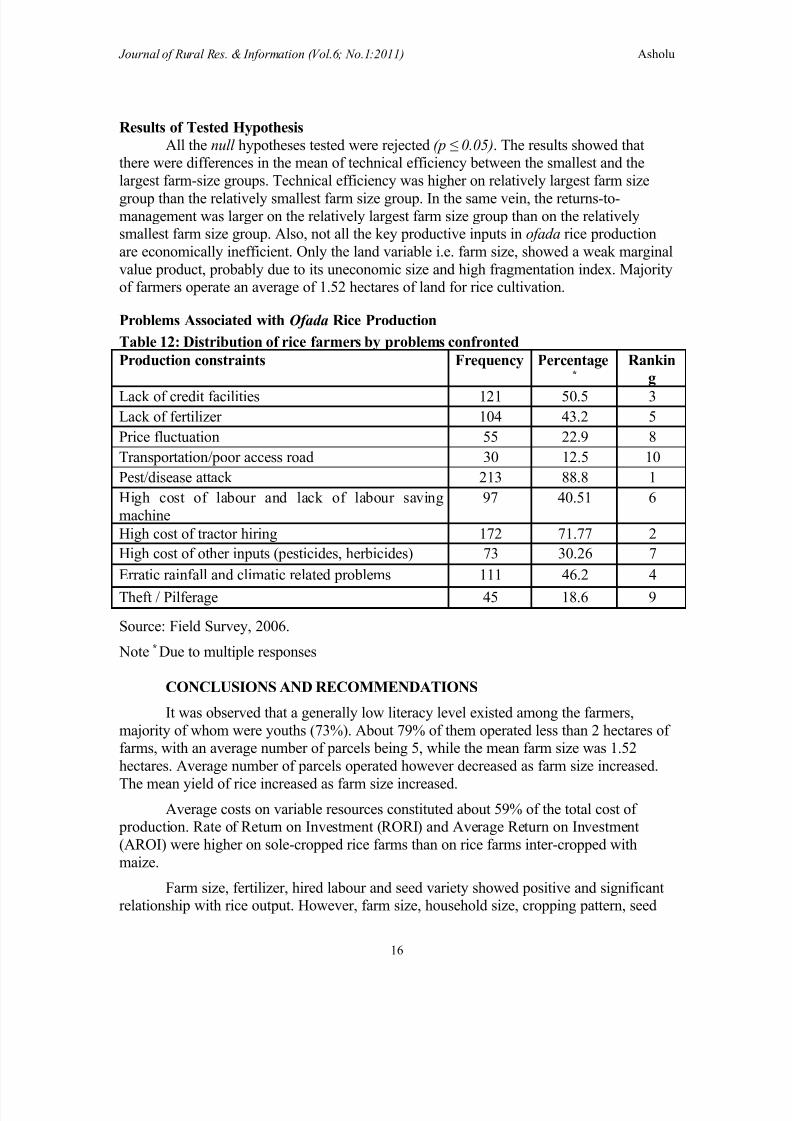
Results of Tested Hypothesis
All the null hypotheses tested were rejected (p ≤ 0.05). The results showed thatthere were differences in the mean of technical efficiency between the smallest and thelargest farm-size groups. Technical efficiency was higher on relatively largest farm size
group than the relatively smallest farm size group. In the same vein, the returns-to-management was larger on the relatively largest farm size group than on the relativelysmallest farm size group. Also, not all the key productive inputs in ofada rice productionare economically inefficient. Only the land variable i.e. farm size, showed a weak marginalvalue product, probably due to its uneconomic size and high fragmentation index. Majorityof farmers operate an average of 1.52 hectares of land for rice cultivation.
Problems Associated with Ofada Rice Production
Table 12: Distribution of rice farmers by problems confronted
Production constraints Frequency Percentage*
Rankin
g
Lack of credit facilities 121 50.5 3Lack of fertilizer 104 43.2 5
Price fluctuation 55 22.9 8
Transportation/poor access road 30 12.5 10
Pest/disease attack 213 88.8 1
High cost of labour and lack of labour savingmachine
97 40.51 6
High cost of tractor hiring 172 71.77 2
High cost of other inputs (pesticides, herbicides) 73 30.26 7
Erratic rainfall and climatic related problems 111 46.2 4
Theft / Pilferage 45 18.6 9
Source: Field Survey, 2006.
Note * Due to multiple responses
CONCLUSIONS AND RECOMMENDATIONS
It was observed that a generally low literacy level existed among the farmers,majority of whom were youths (73%). About 79% of them operated less than 2 hectares of farms, with an average number of parcels being 5, while the mean farm size was 1.52hectares. Average number of parcels operated however decreased as farm size increased.
The mean yield of rice increased as farm size increased.Average costs on variable resources constituted about 59% of the total cost of
production. Rate of Return on Investment (RORI) and Average Return on Investment(AROI) were higher on sole-cropped rice farms than on rice farms inter-cropped withmaize.
Farm size, fertilizer, hired labour and seed variety showed positive and significantrelationship with rice output. However, farm size, household size, cropping pattern, seed
16

7/31/2019 Ashaolu_Resource Use 1
http://slidepdf.com/reader/full/ashaoluresource-use-1 17/18
Journal of Rural Res. & Information (Vol.6; No.1:2011) Asholu
variety and credit use contribute positively to technical inefficiencies of input use amongfarmers
(p ≤ 0.05).
An average of 66%, 47% and 36% of farmers were technically, allocatively and
economically efficient, respectively, in the study area. In other words, significant allocativeand economic inefficiencies exist in ofada rice production in the study area. This suggestsconsiderable room for productivity gains for the farms through better use of availableresources, given the state of technology.
Since positive relationship exists between farm-size and rice output, adequate landshould be made available to farmers, majority of who do not own the farmland beingcultivated. They should be encouraged and empowered by enhancing their tenancy status;this could be by contractual arrangement whereby government, rather than individual landowners provide the land.
The inefficient small scale farmers (about 79 percent) still dominate in the production of food for the teeming population. The current state of traditional agric & its
structural characteristics show quite clearly that a continuation of this traditional structureis incapable of meeting the future food & fibre needs of the country. Significant structuralchanges must be made in the process of modernization & getting agric moving. To carryout successfully such structural changes major policy variables are needed to formalize &tinker with current laissez faire operations.
From the foregoing, there is need for the various governments to gradually de-emphasize the fact that the inefficient small farmers should be the center piece of food production in the state and in Nigeria in general. These farmers refuse to grow whereas the population keeps growing at an alarming rate. This view was shared by Aromolaran (2008)when he said that the small farmers do not have what it takes to take any State or the nationin particular, to the promised land. We need to re-focus our efforts and scarce national
resources on the recreation of a new generation of Nigerian farmers.
REFERENCES
Aromolaran, A.B. 2008 “Removing Bottlenecks to Internal Trade and Investment inAgricultural Commodities”. Invited Paper Presented at the 6 th Nigerian Agricultural Summit , Hilton Hotel, and Abuja, Nigeria. December 6-7, Organized by the NigerianEconomic Summit Group (NESG).
Battese, G.E. and T. Coelli. 1992. “Frontier Production Function and TechnicalEfficiency: A Survey of Empirical Applications in Agricultural Economics”. Agricultural
Economics 7:185-208.
Blarel, B.P., Hazell, P., Place, F. and J. Quiggin. 1992 "The Economics of Farm-Fragmentation: Evidence from Ghana and Rwanda" The World Bank Economic Review 6(2): 233-234.
17
7/31/2019 Ashaolu_Resource Use 1
http://slidepdf.com/reader/full/ashaoluresource-use-1 18/18
Journal of Rural Res. & Information (Vol.6; No.1:2011) Asholu
C. B. N. 2005. Central Bank of Nigeria: Annual Report and Statement of Accounts for the
Year Ended 31st December, 2005.
Chavas, J.P. and M. Roln. 2005. “Farm Household Production Efficiency: Evidence fromGambia”. American Journal of Agricultural Economics. 87(1)160-179.
FGN, 2009. Federal Government of Nigeria, Federal Republic of Nigeria Official Gazette, No. 2, Vol. 96, 2nd Feb., 2009.
IRRI, 1991. International Rice Research Institute. World Statistics, pp. 34-42
OGADEP 2005. Ogun State Agricultural Development Programme. CAYS Report, 1996-2005. OGADEP, Abeokuta, Nigeria.
OGADEP Statistics 2005. Ogun State Agro-Statistics Report, 2005. Planning, Research &Statistics, Min. of Agric., Abeokuta.
Singh et al , 1997. Rice growing environments and biophysical constraints in differentagro-ecological ones of Nigeria. Met. Journal , 2(1): 35-44.
18