ashok ley nomura
TRANSCRIPT

8/12/2019 Ashok Ley Nomura
http://slidepdf.com/reader/full/ashok-ley-nomura 1/12
RatingUp from Reduce BuyTarget priceIncreased from 13 INR 38
Closing price 26 May 2014 INR 32
Potential upside +19.3%
Anchor themesWith a stable and reform-orientedgovernment, we expect a sharprevival in MHCV industry volumesover the next 2-3 years. Thisshould lead to improved pricingpower which augurs well for thecompany's profitability.
Nomura vs consensusOur FY15/16F EBITDA estimatesare 12%/22% ahead ofconsensus. We expectconsensus to upgrade estimatesto build in a strong 4Q andpotential recovery in industryvolumes.
Research analyst s
India Autos & Auto Parts
Kapil Sing h - [email protected]+91 22 4037 4199
Nishit Jalan - [email protected]+91 22 4037 4362
Key company data: See page 2 for company data and detailed price/index chart
Ashok Leyland ASOK.NS AL IN
EQUITY: AUTOS & AUTO PARTS
Building in sharp revival over FY16-17F
Operating leverage, lower discounts to aid margins
Action: Upgrade to Buy; TP raised to INR38 Ashok Leyland (AL) reported 4QFY14 EBITDA margin of 6% vs. consensus of2.2% (NMR 4.4%). The key reason for the positive surprise was animprovement in gross margins, as product mix improved and discountsdeclined. With the formation of a new strong and stable government, webelieve the growth outlook for CVs has improved substantially. We thus raise
our MHCV industry volume growth estimates to 15%/30% y-y for FY15/16F,up from 0%/30% earlier, and introduce FY17F estimates with 20% y-y growth.Note that, given a low base, these are not very aggressive estimates. OurFY17F volume estimates are close to the volumes achieved in FY12. Thus, swifter implementation of government initiatives to kickstart theinvestment cycle could easily lead to upside to our estimates. With a sharprecovery in volumes, we estimate discounts will come off rapidly. Also, betterutilisation of its Pantnagar plant in a tax-free zone and benefits of costreduction initiatives undertaken during the downcycle should further aidmargin expansion, we believe. Thus, we expect margins to improve to itshistorical up-cycle average of ~10% in FY16F.Catalysts: Volume and margin recovery We believe monthly MHCV industry volumes should grow strongly over thenext three years, aided by the new government’s policy to kickstart reforms.
AL has very high financial and operating leverage. Therefore, we estimateits earnings to rise multi-fold over the next three years, as volumes jump by~70% over the period.
Valuation: TP of INR38 offers 19% potential ups ideWe value AL at 8x FY17F EV/ EBITDA which is discounted back to June-16.While our earlier TP was based on implied EV/EBITDA of 8.5x on FY16FEBITDA, we now believe that FY17 is a better year to base the valuationmultiple, as it fully captures recovery of the CV cycle. Also, we value itsinvestments in IndusInd Bank and Hinduja Leyland Finance at INR1/share andINR1.5/share, respectively, as AL plans to monetise its non-core assets.
Year-end 31 Mar FY13 FY14F FY15F FY16FCurrency (INR) Actual Old New Old New Old New
Revenue (mn) 124,812 95,134 99,434 101,427 116,438 128,226 148,122
Reported net profit (mn) 4,337 -4,488 294 932 268 1,223 5,596
Normalised net profi t (mn) 1,442 -6,184 -4,763 -3,068 268 1,223 5,596
FD normalised EPS 54.18c -2.32 -1.79 -1.15 10.08c 45.95c 2.10
FD norm. EPS growth (%) -74.5 -529.0 -430.4 na na na 1,987.0
FD normalised P/E (x) 58.8 N/A na N/A 316.0 N/A 15.1
EV/EBITDA (x) 14.5 N/A 78.4 N/A 16.2 N/A 8.6
Price/book (x) 1.9 N/A 1.9 N/A 1.9 N/A 1.7
Dividend yi eld (%) 1.9 N/A na N/A na N/A 2.4
ROE (%) 10.0 -10.6 0.7 2.3 0.6 2.9 11.8
Net debt/equity (%) 95.2 132.8 102.9 121.7 103.9 116.8 83.8Source: Company data, Nomura estimates
Global Markets Research
27 May 2014
See Appendix A-1 for analyst certification, important disclosures and the status of non-US analysts.
8/12/2019 Ashok Ley Nomura
http://slidepdf.com/reader/full/ashok-ley-nomura 2/12
Nomura | Ashok Leyland 27 May 2014
2
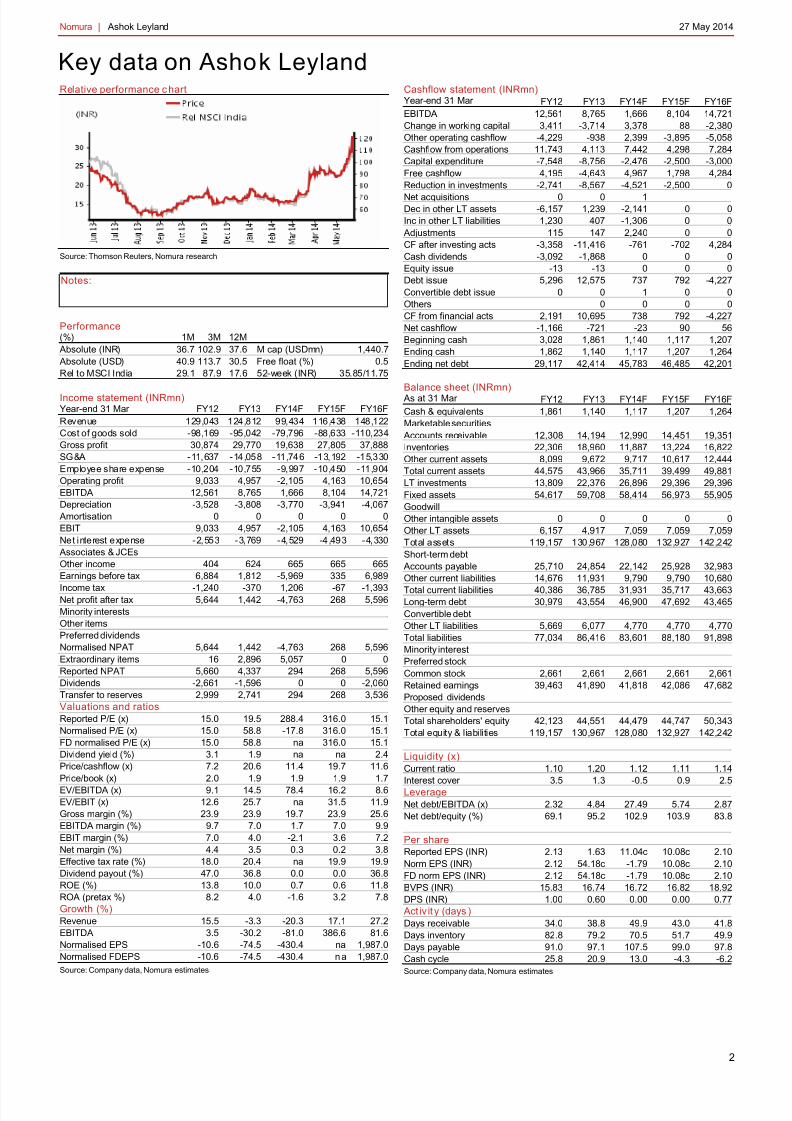
Key data on Ashok LeylandRelative performance c hart
Source: Thomson Reuters, Nomura research
Notes:
Performance(%) 1M 3M 12M
Absolute (INR) 36.7 102.9 37.6 M cap (USDmn) 1,440.7 Absolute (USD) 40.9 113.7 30.5 Free float (%) 0.5Rel to MSCI India 29.1 87.9 17.6 52-week (INR) 35.85/11.75 Income statement (INRmn)Year-end 31 Mar FY12 FY13 FY14F FY15F FY16FRevenue 129,043 124,812 99,434 116,438 148,122Cost of goods sold -98,169 -95,042 -79,796 -88,633 -110,234Gross profit 30,874 29,770 19,638 27,805 37,888SG&A -11,637 -14,058 -11,746 -13,192 -15,330Employee share expense -10,204 -10,755 -9,997 -10,450 -11,904Operating profit 9,033 4,957 -2,105 4,163 10,654EBITDA 12,561 8,765 1,666 8,104 14,721Depreciation -3,528 -3,808 -3,770 -3,941 -4,067
Amortisation 0 0 0 0 0EBIT 9,033 4,957 -2,105 4,163 10,654Net interest expense -2,553 -3,769 -4,529 -4,493 -4,330
Associates & JCEsOther income 404 624 665 665 665Earnings before tax 6,884 1,812 -5,969 335 6,989
Income tax -1,240 -370 1,206 -67 -1,393Net profit after tax 5,644 1,442 -4,763 268 5,596Minority interestsOther itemsPreferred dividendsNormalised NPAT 5,644 1,442 -4,763 268 5,596Extraordinary items 16 2,896 5,057 0 0Reported NPAT 5,660 4,337 294 268 5,596Dividends -2,661 -1,596 0 0 -2,060Transfer to reserves 2,999 2,741 294 268 3,536Valuations and ratiosReported P/E (x) 15.0 19.5 288.4 316.0 15.1Normalised P/E (x) 15.0 58.8 -17.8 316.0 15.1FD normalised P/E (x) 15.0 58.8 na 316.0 15.1Dividend yield (%) 3.1 1.9 na na 2.4Price/cashflow (x) 7.2 20.6 11.4 19.7 11.6Price/book (x) 2.0 1.9 1.9 1.9 1.7EV/EBITDA (x) 9.1 14.5 78.4 16.2 8.6EV/EBIT (x) 12.6 25.7 na 31.5 11.9Gross margin (%) 23.9 23.9 19.7 23.9 25.6EBITDA margin (%) 9.7 7.0 1.7 7.0 9.9EBIT margin (%) 7.0 4.0 -2.1 3.6 7.2Net margin (%) 4.4 3.5 0.3 0.2 3.8Effective tax rate (%) 18.0 20.4 na 19.9 19.9Dividend payout (%) 47.0 36.8 0.0 0.0 36.8ROE (%) 13.8 10.0 0.7 0.6 11.8ROA (pretax %) 8.2 4.0 -1.6 3.2 7.8Growth (%)Revenue 15.5 -3.3 -20.3 17.1 27.2EBITDA 3.5 -30.2 -81.0 386.6 81.6Normalised EPS -10.6 -74.5 -430.4 na 1,987.0Normalised FDEPS -10.6 -74.5 -430.4 n a 1,987.0Source: Company data, Nomura estimates
Cashflow statement (INRmn)Year-end 31 Mar FY12 FY13 FY14F FY15F FY16FEBITDA 12,561 8,765 1,666 8,104 14,721Change in working capital 3,411 -3,714 3,378 88 -2,380Other operating cashflow -4,229 -938 2,399 -3,895 -5,058Cashflow from operations 11,743 4,113 7,442 4,298 7,284Capital expenditure -7,548 -8,756 -2,476 -2,500 -3,000Free cashflow 4,195 -4,643 4,967 1,798 4,284Reduction in investments -2,741 -8,567 -4,521 -2,500 0Net acquisitions 0 0 1Dec in other LT assets -6,157 1,239 -2,141 0 0Inc in other LT liabilities 1,230 407 -1,306 0 0
Adjustments 115 147 2,240 0 0CF after investing acts -3,358 -11,416 -761 -702 4,284Cash dividends -3,092 -1,868 0 0 0Equity issue -13 -13 0 0 0Debt issue 5,296 12,575 737 792 -4,227Convertible debt issue 0 0 1 0 0Others 0 0 0 0CF from financial acts 2,191 10,695 738 792 -4,227Net cashflow -1,166 -721 -23 90 56Beginning cash 3,028 1,861 1,140 1,117 1,207Ending cash 1,862 1,140 1,117 1,207 1,264Ending net debt 29,117 42,414 45,783 46,485 42,201 Balance sheet (INRmn)
As at 31 Mar FY12 FY13 FY14F FY15F FY16FCash & equivalents 1,861 1,140 1,117 1,207 1,264Marketable securities
Accounts receivable 12,308 14,194 12,990 14,451 19,351Inventories 22,306 18,960 11,887 13,224 16,822Other current assets 8,099 9,672 9,717 10,617 12,444Total current assets 44,575 43,966 35,711 39,499 49,881LT investments 13,809 22,376 26,896 29,396 29,396Fixed assets 54,617 59,708 58,414 56,973 55,905GoodwillOther intangible assets 0 0 0 0 0Other LT assets 6,157 4,917 7,059 7,059 7,059Total assets 119,157 130,967 128,080 132,927 142,242Short-term debt
Accounts payable 25,710 24,854 22,142 25,928 32,983Other current liabilities 14,676 11,931 9,790 9,790 10,680Total current liabilities 40,386 36,785 31,931 35,717 43,663Long-term debt 30,979 43,554 46,900 47,692 43,465Convertible debtOther LT liabilities 5,669 6,077 4,770 4,770 4,770Total liabilities 77,034 86,416 83,601 88,180 91,898Minority interestPreferred stockCommon stock 2,661 2,661 2,661 2,661 2,661Retained earnings 39,463 41,890 41,818 42,086 47,682Proposed dividendsOther equity and reservesTotal shareholders' equity 42,123 44,551 44,479 44,747 50,343Total equity & liabilities 119,157 130,967 128,080 132,927 142,242
Liquidity (x)Current ratio 1.10 1.20 1.12 1.11 1.14
Interest cover 3.5 1.3 -0.5 0.9 2.5LeverageNet debt/EBITDA (x) 2.32 4.84 27.49 5.74 2.87Net debt/equity (%) 69.1 95.2 102.9 103.9 83.8
Per shareReported EPS (INR) 2.13 1.63 11.04c 10.08c 2.10Norm EPS (INR) 2.12 54.18c -1.79 10.08c 2.10FD norm EPS (INR) 2.12 54.18c -1.79 10.08c 2.10BVPS (INR) 15.83 16.74 16.72 16.82 18.92DPS (INR) 1.00 0.60 0.00 0.00 0.77
Act iv it y (days )Days receivable 34.0 38.8 49.9 43.0 41.8Days inventory 82.8 79.2 70.5 51.7 49.9Days payable 91.0 97.1 107.5 99.0 97.8Cash cycle 25.8 20.9 13.0 -4.3 -6.2Source: Company data, Nomura estimates

8/12/2019 Ashok Ley Nomura
http://slidepdf.com/reader/full/ashok-ley-nomura 3/12
Nomura | Ashok Leyland 27 May 2014
3
MHCV industry – Even after build ing in a steep recovery;FY17F volumes are close to FY12 peak levels
Volumes of the MHCV (medium and heavy commercial vehicles) industry have declinedquite sharply over the past two years – overall volumes are down ~43% from the peakvolumes of FY12. However, with a stable and reform-oriented government and strongpolicy actions, we believe that the recovery in industry volumes can be equally steep.Overall, we expect strong recovery in industry volumes over the next three years – 15%y-y in FY15F, 30% in FY16F and another 20% in FY17F. Note that even after building insuch a strong recovery, FY17F industry volumes will only come close to the peakvolumes of FY12. We believe that, in a bull case scenario, if economic growth reboundssharply, then MHCV industry volumes should surpass previous peak volumes by FY17F.
Fig. 1: Domestic MHCV industry volumes
Source: SIAM Auto, Nomura estimates
The SAAR of domestic MHCV volumes has already improved somewhat over the past 3-4 months, and currently indicates 10-12% volume growth in FY15F.
Fig. 2: SAAR of domestic MHCV industry volumes
Source: SIAM Auto, Nomura research
-40%
-30%
-20%
-10%
0%
10%
20%
30%
40%
100,000
150,000
200,000
250,000
300,000
350,000
400,000
F Y 0 5
F Y 0 6
F Y 0 7
F Y 0 8
F Y 0 9
F Y 1 0
F Y 1 1
F Y 1 2
F Y 1 3
F Y 1 4
F Y 1 5 F
F Y 1 6 F
F Y 1 7 F
MHCVs (Units) - LHS YoY (%) - RHS
160,000185,000210,000235,000260,000285,000
310,000335,000360,000385,000410,000
J u n - 1
0
A u g - 1
0
O c t - 1 0
D e c - 1
0
F e b
- 1 1
A p r - 1 1
J u n - 1
1
A u g - 1
1
O c t - 1 1
D e c - 1
1
F e b
- 1 2
A p r - 1 2
J u n - 1
2
A u g - 1
2
O c t - 1 2
D e c - 1
2
F e b
- 1 3
A p r - 1 3
J u n - 1
3
A u g - 1
3
O c t - 1 3
D e c - 1
3
F e b
- 1 4
A p r - 1 4
(Nos)
8/12/2019 Ashok Ley Nomura
http://slidepdf.com/reader/full/ashok-ley-nomura 4/12
Nomura | Ashok Leyland 27 May 2014
4
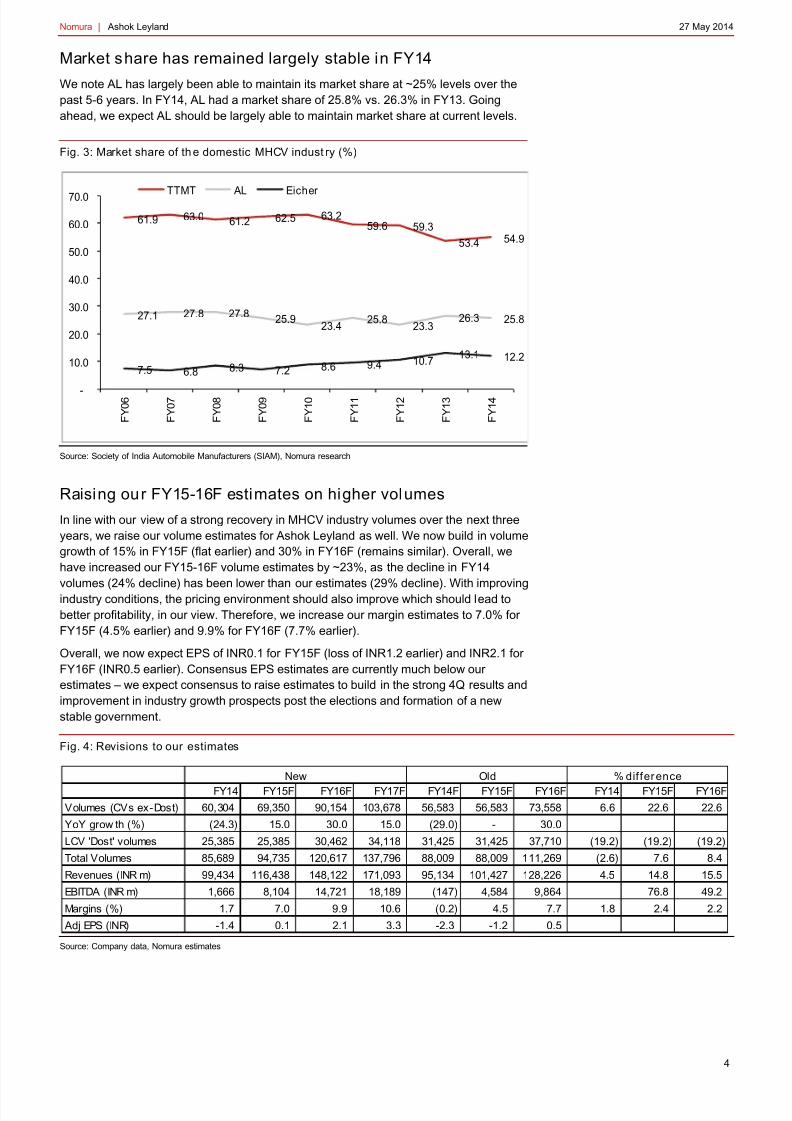
Market share has remained largely stable in FY14
We note AL has largely been able to maintain its market share at ~25% levels over thepast 5-6 years. In FY14, AL had a market share of 25.8% vs. 26.3% in FY13. Goingahead, we expect AL should be largely able to maintain market share at current levels.
Fig. 3: Market share of th e domestic MHCV indust ry (%)
Source: Society of India Automobile Manufacturers (SIAM), Nomura research
Raising our FY15-16F estimates on higher volumes
In line with our view of a strong recovery in MHCV industry volumes over the next threeyears, we raise our volume estimates for Ashok Leyland as well. We now build in volumegrowth of 15% in FY15F (flat earlier) and 30% in FY16F (remains similar). Overall, wehave increased our FY15-16F volume estimates by ~23%, as the decline in FY14
volumes (24% decline) has been lower than our estimates (29% decline). With improvingindustry conditions, the pricing environment should also improve which should lead tobetter profitability, in our view. Therefore, we increase our margin estimates to 7.0% forFY15F (4.5% earlier) and 9.9% for FY16F (7.7% earlier).
Overall, we now expect EPS of INR0.1 for FY15F (loss of INR1.2 earlier) and INR2.1 forFY16F (INR0.5 earlier). Consensus EPS estimates are currently much below ourestimates – we expect consensus to raise estimates to build in the strong 4Q results andimprovement in industry growth prospects post the elections and formation of a newstable government.
Fig. 4: Revisions to our estimates
Source: Company data, Nomura estimates
61.9 63.0 61.2 62.5 63.259.6 59.3
53.4 54.9
27.1 27.8 27.8 25.923.4 25.8
23.326.3 25.8
7.5 6.8 8.3 7.2 8.6 9.4 10.7 13.1 12.2
-
10.0
20.0
30.0
40.0
50.0
60.0
70.0
F Y 0 6
F Y 0 7
F Y 0 8
F Y 0 9
F Y 1 0
F Y 1 1
F Y 1 2
F Y 1 3
F Y 1 4
TTMT AL Eicher
FY14 FY15F FY16F FY17F FY14F FY15F FY16F FY14 FY15F FY16F
Volumes (CVs ex-Dost) 60,304 69,350 90,154 103,678 56,583 56,583 73,558 6.6 22.6 22.6
YoY grow th (%) (24.3) 15.0 30.0 15.0 (29.0) - 30.0
LCV 'Dost' volumes 25,385 25,385 30,462 34,118 31,425 31,425 37,710 (19.2) (19.2) (19.2)
Total Volumes 85,689 94,735 120,617 137,796 88,009 88,009 111,269 (2.6) 7.6 8.4
Revenues (INR m) 99,434 116,438 148,122 171,093 95,134 101,427 128,226 4.5 14.8 15.5
EBITDA (INR m) 1,666 8,104 14,721 18,189 (147) 4,584 9,864 76.8 49.2
Margins (%) 1.7 7.0 9.9 10.6 (0.2) 4.5 7.7 1.8 2.4 2.2
Adj EPS (INR) -1.4 0.1 2.1 3.3 -2.3 -1.2 0.5
Old % differ enceNew

8/12/2019 Ashok Ley Nomura
http://slidepdf.com/reader/full/ashok-ley-nomura 5/12
Nomura | Ashok Leyland 27 May 2014
5
Fig. 5: Nomura vs. consensus
Source: Bloomberg, Nomura estimates
Upgrade to Buy; TP raised to INR38
We use SOTP methodology to arrive at our TP of INR38. We value the standalonebusiness at INR35.4/share based on 8x FY17F EBITDA (middle of historical tradingrange) of INR18.2bn which is discounted back to June-14 @ 13% cost of equity. Wevalue AL’s holdings in IndusInd Bank shares at INR1/share based on the current stockprice of INR547. We value AL’s holding (~67% stake) in Hinduja Leyland Finance atINR2/share based on 1.5x FY13 book value of INR5.26bn.
Our TP moves up to INR38 (from INR13), following the sharp increase in our earningsestimates and corresponding reduction in net debt estimates.
While our earlier TP was based on implied EV/EBITDA of 8.5x on FY16F EBITDA, wenow believe that FY17 is a better year to base the valuation multiple as it fully capturesthe full recovery of the CV cycle. Also, we now value its investments in IndusInd andHinduja Leyland Finance as the company plans to monetise its non-core assets.
Fig. 6: AL – Target price calculation
Source: Bloomberg, Nomura estimates
Fig. 7: India Autos – Comp sh eet
Note: * EPS and P/E Adjusted for subsidiary valuesPrices as of 26-May 2014.Source: Bloomberg, Nomura estimates
(INR m )
FY15F FY16F FY15F FY16F FY15F FY16FSales 116,438 148,122 118,382 143,803 (1.6) 3.0
EBITDA 8,104 14,721 7,214 12,037 12.3 22.3
EBITDA margin (%) 7.0 9.9 6.1 8.4 0.9 1.6
Adj PAT 268 5,596 31 3,867 44.7
EPS 0.1 2.1 0.0 1.5 44.7
ConsensusNom ura Differ ence(%)
Standalone bus ines s INR m nFY17F EBITDA 18,189
EV at 8x FY17F EBITDA 145,516
Net debt - FY16F 42,201
Equity value 103,315
Equity value/sh 38.8
Equity value/sh - June-16 - A 35.4
Investments
Holding in IndusInd Bank - B 1.0
Hinduja Leyland Finance (@ 1.5x FY13 book) - C 2.0
Targe t Price - A+B+C 38.0
Mk t Cap Pr ice EPS CAGRCompany Ticker ($mn) Rating INR FY14-16F FY14F FY15F FY16F FY15FFY16F FY15FFY16F FY15F FY16F FY15F FY16FFY15F FY16F As hok Leyland AL IN 1,443 Buy 31.9 n.a. (1.8) 0.1 2.1 n.a 15.1 16.2 8.6 0.6 11.8 7.0% 9.9% -0.8% 5.1%Bajaj Auto BJAUT IN 9,665 Neutral 1,961.2 7% 114.3 122.2 131.1 16.0 15.0 10.7 9.7 33.8 30.9 19.7% 19.0% 5.9% 6.6%Hero MotoCorp HMCL IN 7,824 Neutral 2,300.5 21% 102.6 135.0 151.3 17.0 15.2 10.7 9.7 40.2 37.1 14.3% 14.3% 3.8% 6.0%M&M* MM IN 12,893 Buy 1,229.2 9% 62.2 65.5 74.3 13.0 11.4 8.4 7.2 20.9 20.5 13.6% 13.8% 3.1% 4.1%Maruti Suz uki MSIL IN 12,046 Buy 2,341.3 27% 94.5 118.3 152.4 19.8 15.4 9.5 7.2 15.2 17.1 12.9% 13.6% 4.1% 6.8%Tata Motors TTMT IN 22,536 Buy 444.1 5% 46.9 46.6 51.7 9.5 8.6 4.2 3.7 25.2 22.4 14.6% 14.9% - 5.0% -0.9%Exide EXID IN 1,967 Neutral 135.9 13% 5.7 6.4 7.3 21.2 18.5 12.4 10.8 13.9 14.6 13.6% 13.9% 3.3% 3.8%Bharat Forge BHFC IN 1,875 Buy 473.0 30% 17.8 24.5 30.2 19.3 15.7 9.5 8.1 21.7 22.8 19.8% 20.0% 3.5% 5.6%
Amara Raja AMRJ IN 1,152 Buy 396.1 9% 22.2 22.9 26.2 17.3 15.1 10.4 8.5 25.4 23.8 16.0% 16.1% -0.6% 6.1%
EPS P/ E EV / EBITDA EBITDA m argin FCF YieldROE (%)
8/12/2019 Ashok Ley Nomura
http://slidepdf.com/reader/full/ashok-ley-nomura 6/12
Nomura | Ashok Leyland 27 May 2014
6
Key risksWeaker -than -expected MHCV industry volumes: We expect strong revival in domesticMHCV volumes over the next three years. However, if volumes are weaker thanexpected, there could be downside risks to our estimates.
Market share loss for AL due to high competition : If AL loses significant marketshare or discounting does not come down meaningfully due to high competition, therecould be downside risks to our estimates.
4QFY14 results: Signi ficantly above our expectations Above or below expectations? Ashok Leyland’s 4QFY14 EBITDA came in at INR1.8bn, significantly higher than ourestimate of INR1.35bn and consensus of INR0.65bn. Margins came in at 6% vs. ourexpectation of 4.4% and consensus of 2.2%. RM/sales declined by 440bp q-q to 75.3%,as against our expectation of 77%.
Adjusted net profit was ~INR625mn vs. consensus estimate of a loss of INR741mn andour loss estimate of INR366mn. There was a net one-off gain of INR3.76bn on: 1) thesale of long-term investments of INR2.2bn; 2) the sale of immovable property ofINR1.6bn, and; 3) a one-time loss of INR32mn on its VRS scheme. Our numbers areadjusted for the same. As per our calculations, standalone net debt is around INR46.6bn.
Fig. 8: 4QFY14 results - comparison w ith o ur forecasts and consensus
Source: Company data, Bloomberg, Nomura estimates
Key consolidated financials
For the first time, the company reported consolidated financials for FY14. ConsolidatedEBITDA was ~INR4.22bn, implying EBITDA of INR2.56bn for subsidiaries/JVs. Theconsolidated loss was INR1.65bn while standalone PAT was INR0.3bn, implying aINR1.9bn loss for other subs/JVs (INR0.73/share). As per our estimates, consolidatednet debt was around INR75-80bn.
Fig. 9: FY14 results – standalone and consolidated numbers
Source: Company data, Bloomberg, Nomura estimates
Key takeaways from the conference call• Industry outlook – AL believes that demand has bottomed and things can improve over
the next 1-2 quarters. Utilisation for fleet operators is ~60% currently.
• Over the next 2-3 years, depending on reforms undertaken by the new government,there can be a strong recovery in industry volumes, in our view.
• In 4Q, discounts declined by ~INR20,000/vehicle q-q to INR180,000/vehicle. Thecompany has consistently taken price increases: 1% in Feb, 1% in March and 2% in
Apr-14.
Actual Consensus Nomura Consensus Nomura
Net Sales 30,768 29,643 30,744 3.8% 0.1%
EBITDA 1,839 655 1,349 180.8% 36.4%
Margin 6.0% 2.2% 4.4%
Adj Net Prof it 625 (741) (366)
INR mn % difference f rom
INR m n Cons ol Standalone Other s
Revenue 114,867 99,434 15,433
EBITDA 4,220 1,666 2,555
PBT befor exceptionals (8,210) (5,969) (2,241)
Reported PAT (1,641) 294 (1,935)

8/12/2019 Ashok Ley Nomura
http://slidepdf.com/reader/full/ashok-ley-nomura 7/12
Nomura | Ashok Leyland 27 May 2014
7
• In 4Q, margins were helped by a better product mix – increased share of highertonnage vehicles.
• Over the past one year, the company has undertaken cost reduction program andtaken steps to reduce overheads and manpower costs. The company believes thisshould yield 100-150bp improvement in margins from current levels.
• Standalone net debt is ~INR47bn; around INR15bn lower from the peak levels seen in Aug-13. AL has reduced working capital to 8 days from 40 days earlier – led particularlyby lower inventory levels (both raw material and finished goods). FY15F target net
debt/equity for the company is 1:1.• As of Mar-14, consolidated debt is INR85bn but INR30bn is due to its financing
subsidiary, Hinduja Leyland Finance.
• The company has completed the reorganisation of Ashley Holdings and AshleyInvestments – these entities are now merged with Ashley Project Services which is asubsidiary of Ashok Leyland.
• The company guides for capex of INR1-1.5bn in FY15F, and investment of INR2-2.5bnin JVs/subs for FY15F.
• Exports continue to do well and the company expects strong growth in FY15F. Over themedium-term, the company believes that exports can account for 20-25% of totalvolumes
• Under the Jawaharlal Nehru National Urban Renewal Mission (JNNURM) scheme, ALwill have around 60% market share of the new orders. The company believes thatorders under this scheme will give sales volume of ~3,000 units in FY15F
Key numbers• Net sales at INR30.8bn vs. our estimate of INR30.7bn.
• EBITDA margin of 6%, compared with our estimate of 4.4%.
• RM/sales at 75.3% vs. our estimate of 77%.
• Employee cost/sales at 8% vs. our estimate of 8.3%.
• Other expenses/sales at 10.7% vs. our estimate of 10.3%.
• Interest expenses of INR1.13bn vs. our estimate of INR1.15bn.
• Other income was in line at INR157mn.
Fig. 10: 4QFY14 results
Source: Company data, Nomura estimates
INR m n 4QFY13A 3QFY14A 4QFY14A YoY QoQ 4QFY14F
Net Sales 37,285 19,532 30,768 -17.5% 57.5% 30,744 Net Raw Materials 28,245 15,568 23,164 -18.0% 48.8% 23,673
Staff Welfare 2,821 2,396 2,473 -12.4% 3.2% 2,546
Adjusted Other Expenditure 4,235 2,537 3,292 -22.3% 29.8% 3,176
Total Cost 35,302 20,501 28,928 -18.1% 41.1% 29,395
Oper at ing Pr of it 1,983 (969) 1,839 1,349
OPM (%) 5.3 -5.0 6.0 0.7 10.9 4.4
Non-Operating Income 115 154 157 154
Ex traordinary Income/(Exp) 1,344 923 3,761 2,025
Interest 828 1,153 1,126 1,153
Depreciation 1,000 883 1,034 900
PBT 1,614 (1,928) 3,598 1,475
Tax 114 (256) (36) 221
Effective Tax Rate (%) 7.1 13.3 -1.0
Repor ted PAT 1,500 (1,672) 3,634 1,254
Ad j PAT 157 (2,595) 625 (366)
Adj EPS 0.06 -0.98 0.23 -0.14
8/12/2019 Ashok Ley Nomura
http://slidepdf.com/reader/full/ashok-ley-nomura 8/12
Nomura | Ashok Leyland 27 May 2014
8
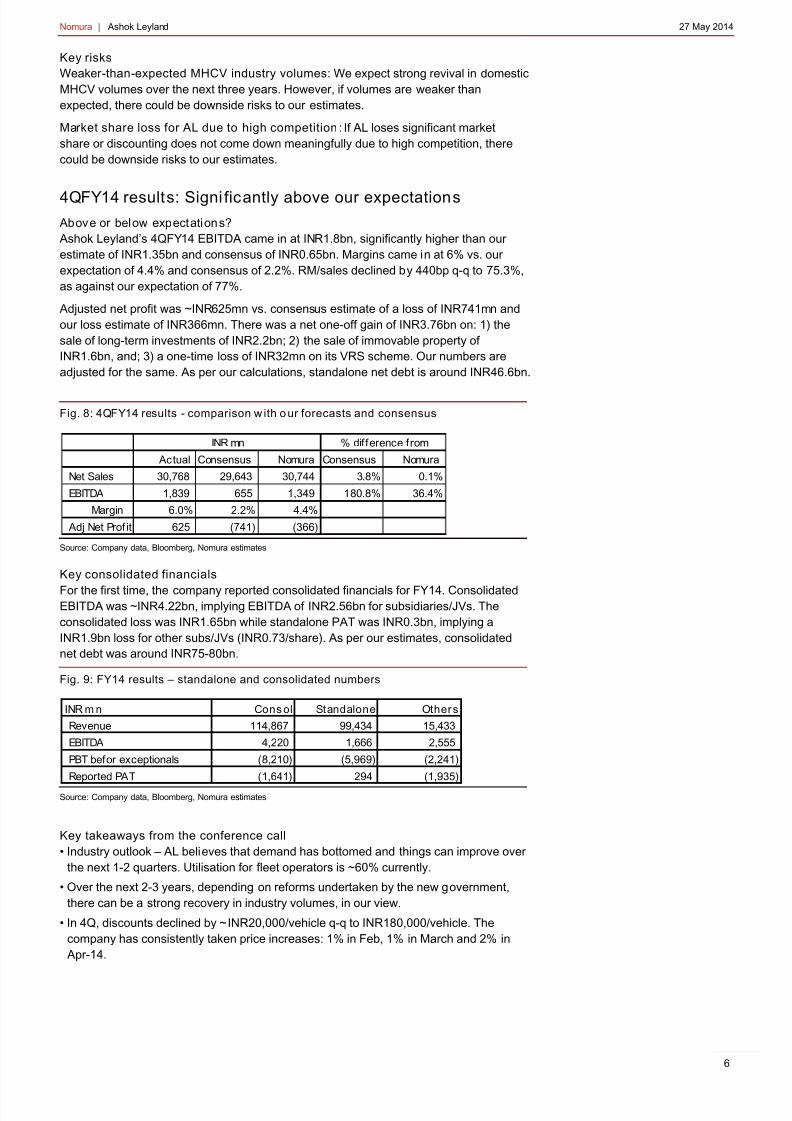
Fig. 11: Ratios
Source: Company data, Nomura estimates
4QFY13A 3QFY14A 4QFY14A YoY QoQ 4QFY14F
RM/Sales 75.8 79.7 75.3 (0.5) (4.4) 77.0
Staff Cost/Sales 7.6 12.3 8.0 0.5 (4.2) 8.3
Other Expenses/Sales 11.4 13.0 10.7 (0.7) (2.3) 10.3
Total Cost/Sales 94.7 105.0 94.0 (0.7) (10.9) 95.6
Realisation per vehicle (INR) 1,075,135 1,058,481 1,181,195 9.9% 11.6% 1,180,283
RM/Vehicle (INR) 814,477 843,673 889,267 9.2% 5.4% 908,818
8/12/2019 Ashok Ley Nomura
http://slidepdf.com/reader/full/ashok-ley-nomura 9/12
Nomura | Ashok Leyland 27 May 2014
9
Appendix A-1
Analyst Cert ifi cat ion
We, Kapil Singh and Nishit Jalan, hereby certify (1) that the views expressed in this Research report accurately reflect ourpersonal views about any or all of the subject securities or issuers referred to in this Research report, (2) no part of ourcompensation was, is or will be directly or indirectly related to the specific recommendations or views expressed in thisResearch report and (3) no part of our compensation is tied to any specific investment banking transactions performed byNomura Securities International, Inc., Nomura International plc or any other Nomura Group company.
Issuer Specifi c Regulatory Disclosures
The term "Nomura Group" used herein refers to Nomura Holdings, Inc. or any of its affiliates or subsidiaries, and may refer to one or moreNomura Group companies.
Materially mentioned issuers
Issuer Ticker Price Price date Stock rating Sector rating Disclosures Ashok Leyland AL IN INR 32 26-May-2014 Buy N/A
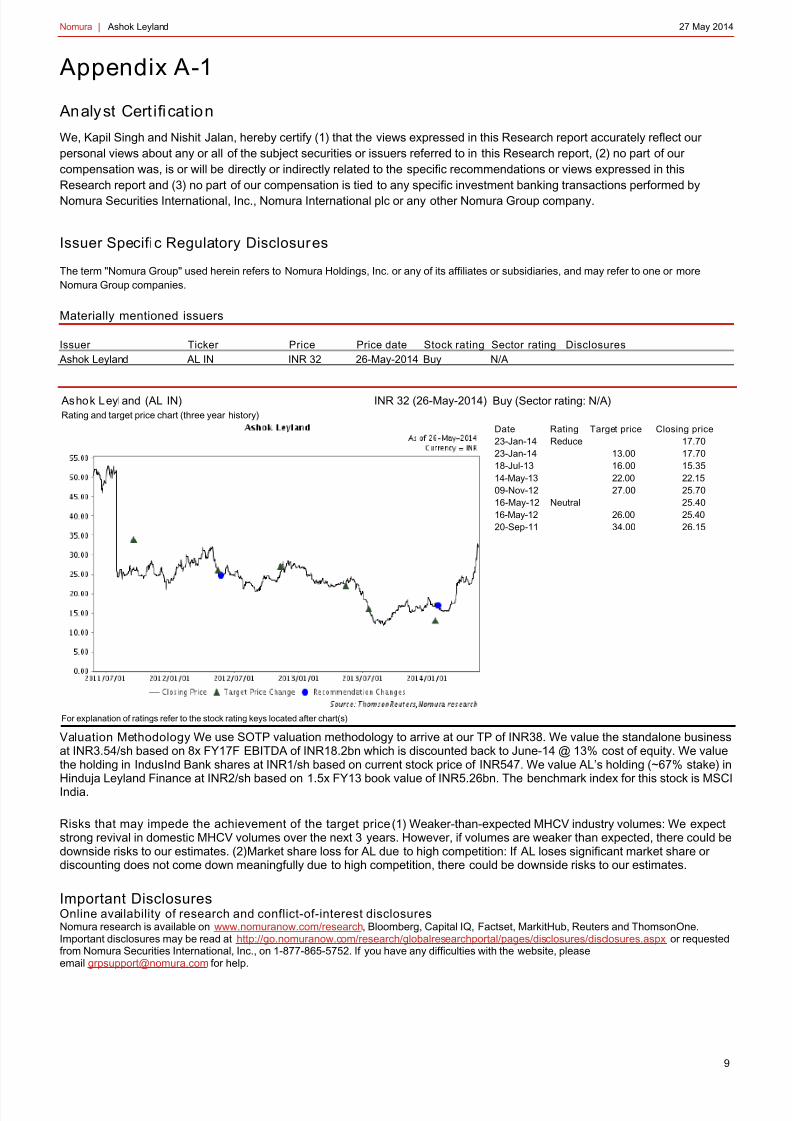
Ashok Leyland (AL IN) INR 32 (26-May-2014)Rating and target price chart (three year history)
Buy (Sector rating: N/A)
Date Rating Target price Closing price23-Jan-14 Reduce 17.7023-Jan-14 13.00 17.7018-Jul-13 16.00 15.3514-May-13 22.00 22.1509-Nov-12 27.00 25.7016-May-12 Neutral 25.4016-May-12 26.00 25.4020-Sep-11 34.00 26.15
For explanation of ratings refer to the stock rating keys located after chart(s)
Valuation Methodology We use SOTP valuation methodology to arrive at our TP of INR38. We value the standalone businessat INR3.54/sh based on 8x FY17F EBITDA of INR18.2bn which is discounted back to June-14 @ 13% cost of equity. We valuethe holding in IndusInd Bank shares at INR1/sh based on current stock price of INR547. We value AL’s holding (~67% stake) inHinduja Leyland Finance at INR2/sh based on 1.5x FY13 book value of INR5.26bn. The benchmark index for this stock is MSCIIndia.
Risks that may impede the achievement of the target price (1) Weaker-than-expected MHCV industry volumes: We expectstrong revival in domestic MHCV volumes over the next 3 years. However, if volumes are weaker than expected, there could bedownside risks to our estimates. (2)Market share loss for AL due to high competition: If AL loses significant market share ordiscounting does not come down meaningfully due to high competition, there could be downside risks to our estimates.
Important Disclosures Online availability of research and conflict-of-interest disclosures Nomura research is available on www.nomuranow.com/research , Bloomberg, Capital IQ, Factset, MarkitHub, Reuters and ThomsonOne. Important disclosures may be read at http://go.nomuranow.com/research/globalresearchportal/pages/disclosures/disclosures.aspx or requestedfrom Nomura Securities International, Inc., on 1-877-865-5752. If you have any difficulties with the website, pleaseemail [email protected] for help.
8/12/2019 Ashok Ley Nomura
http://slidepdf.com/reader/full/ashok-ley-nomura 10/12
Nomura | Ashok Leyland 27 May 2014
10
The analysts responsible for preparing this report have received compensation based upon various factors including the firm's total revenues, aportion of which is generated by Investment Banking activities. Unless otherwise noted, the non-US analysts listed at the front of this report arenot registered/qualified as research analysts under FINRA/NYSE rules, may not be associated persons of NSI, and may not be subject toFINRA Rule 2711 and NYSE Rule 472 restrictions on communications with covered companies, public appearances, and trading securities heldby a research analyst account.
Nomura Global Financial Products Inc. (“NGFP”) Nomura Derivative Products Inc. (“NDPI”) and Nomura International plc. (“NIplc”) areregistered with the Commodities Futures Trading Commission and the National Futures Association (NFA) as swap dealers. NGFP, NDPI, andNIplc are generally engaged in the trading of swaps and other derivative products, any of which may be the subject of this report.
Any authors named in this report are research analysts unless otherwise indicated. Industry Specialists identified in some Nomura Internationalplc research reports are employees within the Firm who are responsible for the sales and trading effort in the sector for which they havecoverage. Industry Specialists do not contribute in any manner to the content of research reports in which their names appear.
Distribution of ratings (Global) The distribution of all ratings published by Nomura Global Equity Research is as follows: 45% have been assigned a Buy rating which, for purposes of mandatory disclosures, are classified as a Buy rating; 42% of companies with thisrating are investment banking clients of the Nomura Group*. 44% have been assigned a Neutral rating which, for purposes of mandatory disclosures, is classified as a Hold rating; 54% of companies withthis rating are investment banking clients of the Nomura Group*.11% have been assigned a Reduce rating which, for purposes of mandatory disclosures, are classified as a Sell rating; 26% of companies withthis rating are investment banking clients of the Nomura Group*.
As at 31 March 2014. *The Nomura Group as defined in the Disclaimer section at the end of this report.
Explanation of Nomura's equity research rating system in Europe, Middle East and Africa, US and Latin America, andJapan and Asi a ex-Japan from 21 October 2013 The rating system is a relative system, indicating expected performance against a specific benchmark identified for each individual stock,subject to limited management discretion. An analyst’s target price is an assessment of the current intrinsic fair value of the stock based on anappropriate valuation methodology determined by the analyst. Valuation methodologies include, but are not limited to, discounted cash flowanalysis, expected return on equity and multiple analysis. Analysts may also indicate expected absolute upside/downside relative to the statedtarget price, defined as (target price - current price)/current price.
STOCKS A rating of 'Buy' , indicates that the analyst expects the stock to outperform the Benchmark over the next 12 months. A rating of 'Neutral' ,indicates that the analyst expects the stock to perform in line with the Benchmark over the next 12 months. A rating of 'Reduce' , indicates thatthe analyst expects the stock to underperform the Benchmark over the next 12 months. A rating of 'Suspended' , indicates that the rating, targetprice and estimates have been suspended temporarily to comply with applicable regulations and/or firm policies. Securities and/or companiesthat are labelled as 'Not rated' or shown as 'No rating' are not in regular research coverage. Investors should not expect continuing oradditional information from Nomura relating to such securities and/or companies. Benchmarks are as follows: United States/Europe/Asia ex-Japan : please see valuation methodologies for explanations of relevant benchmarks for stocks, which can be accessedat: http://go.nomuranow.com/research/globalresearchportal/pages/disclosures/disclosures.aspx ; Global Emerging Markets (ex-Asia) : MSCI
Emerging Markets ex-Asia, unless otherwise stated in the valuation methodology; Japan: Russell/Nomura Large Cap.
SECTORS A 'Bullish' stance, indicates that the analyst expects the sector to outperform the Benchmark during the next 12 months. A 'Neutral' stance,indicates that the analyst expects the sector to perform in line with the Benchmark during the next 12 months. A 'Bearish' stance, indicates thatthe analyst expects the sector to underperform the Benchmark during the next 12 months. Sectors that are labelled as 'Not rated' or shown as'N/A' are not assigned ratings. Benchmarks are as follows: United States: S&P 500; Europe: Dow Jones STOXX 600; Global EmergingMarkets (ex-Asia): MSCI Emerging Markets ex-Asia. Japan/Asia ex-Japan: Sector ratings are not assigned.
Explanation of Nomura's equity research rating system in Japan and Asia ex-Japan prior to 21 October 2013 STOCKS Stock recommendations are based on absolute valuation upside (downside), which is defined as (Target Price - Current Price) / Current Price,subject to limited management discretion. In most cases, the Target Price will equal the analyst's 12-month intrinsic valuation of the stock,based on an appropriate valuation methodology such as discounted cash flow, multiple analysis, etc. A 'Buy' recommendation indicates thatpotential upside is 15% or more. A 'Neutral' recommendation indicates that potential upside is less than 15% or downside is less than 5%. A'Reduce' recommendation indicates that potential downside is 5% or more. A rating of 'Suspended' indicates that the rating and target pricehave been suspended temporarily to comply with applicable regulations and/or firm policies in certain circumstances including when Nomura isacting in an advisory capacity in a merger or strategic transaction involving the subject company. Securities and/or companies that are labelledas 'Not rated' or shown as 'No rating' are not in regular research coverage of the Nomura entity identified in the top banner. Investors shouldnot expect continuing or additional information from Nomura relating to such securities and/or companies.
SECTORS A 'Bullish' rating means most stocks in the sector have (or the weighted average recommendation of the stocks under coverage is) a positiveabsolute recommendation. A 'Neutral' rating means most stocks in the sector have (or the weighted average recommendation of the stocksunder coverage is) a neutral absolute recommendation. A 'Bearish' rating means most stocks in the sector have (or the weighted averagerecommendation of the stocks under coverage is) a negative absolute recommendation.
Target Price A Target Price, if discussed, reflects in part the analyst's estimates for the company's earnings. The achievement of any target price may beimpeded by general market and macroeconomic trends, and by other risks related to the company or the market, and may not occur if thecompany's earnings differ from estimates.

8/12/2019 Ashok Ley Nomura
http://slidepdf.com/reader/full/ashok-ley-nomura 11/12
Nomura | Ashok Leyland 27 May 2014
11
Disclaimers This document contains material that has been prepared by the Nomura entity identified at the top or bottom of page 1 herein, if any, and/or,with the sole or joint contributions of one or more Nomura entities whose employees and their respective affiliations are specified on page 1herein or identified elsewhere in the document. The term "Nomura Group" used herein refers to Nomura Holdings, Inc. or any of its affiliates orsubsidiaries and may refer to one or more Nomura Group companies including: Nomura Securities Co., Ltd. ('NSC') Tokyo, Japan; NomuraInternational plc ('NIplc'), UK; Nomura Securities International, Inc. ('NSI'), New York, US; Nomura International (Hong Kong) Ltd. (‘NIHK’), HongKong; Nomura Financial Investment (Korea) Co., Ltd. (‘NFIK’), Korea (Information on Nomura analysts registered with the Korea FinancialInvestment Association ('KOFIA') can be found on the KOFIA Intranet at http://dis.kofia.or.kr) ; Nomura Singapore Ltd. (‘NSL’), Singapore(Registration number 197201440E, regulated by the Monetary Authority of Singapore); Nomura Australia Ltd. (‘NAL’), Australia (ABN 48 003032 513), regulated by the Australian Securities and Investment Commission ('ASIC') and holder of an Australian financial services licencenumber 246412; P.T. Nomura Indonesia (‘PTNI’), Indonesia; Nomura Securities Malaysia Sdn. Bhd. (‘NSM’), Malaysia; NIHK, Taipei Branch(‘NITB’), Taiwan; Nomura Financial Advisory and Securities (India) Private Limited (‘NFASL’), Mumbai, India (Registered Address: CeejayHouse, Level 11, Plot F, Shivsagar Estate, Dr. Annie Besant Road, Worli, Mumbai- 400 018, India; Tel: +91 22 4037 4037, Fax: +91 22 40374111; CIN No : U74140MH2007PTC169116, SEBI Registration No: BSE INB011299030, NSE INB231299034, INF231299034, INE 231299034,MCX: INE261299034) and NIplc, Madrid Branch (‘NIplc, Madrid’). ‘CNS Thailand’ next to an analyst’s name on the front page of a researchreport indicates that the analyst is employed by Capital Nomura Securities Public Company Limited (‘CNS’) to provide research assistanceservices to NSL under a Research Assistance Agreement. CNS is not a Nomura entity. THIS MATERIAL IS: (I) FOR YOUR PRIVATE INFORMATION, AND WE ARE NOT SOLICITING ANY ACTION BASED UPON IT; (II) NOT TOBE CONSTRUED AS AN OFFER TO SELL OR A SOLICITATION OF AN OFFER TO BUY ANY SECURITY IN ANY JURISDICTION WHERESUCH OFFER OR SOLICITATION WOULD BE ILLEGAL; AND (III) BASED UPON INFORMATION FROM SOURCES THAT WE CONSIDERRELIABLE, BUT HAS NOT BEEN INDEPENDENTLY VERIFIED BY NOMURA GROUP. Nomura Group does not warrant or represent that the document is accurate, complete, reliable, fit for any particular purpose or merchantableand does not accept liability for any act (or decision not to act) resulting from use of this document and related data. To the maximum extentpermissible all warranties and other assurances by Nomura group are hereby excluded and Nomura Group shall have no liability for the use,misuse, or distribution of this information. Opinions or estimates expressed are current opinions as of the original publication date appearing on this material and the information, includingthe opinions and estimates contained herein, are subject to change without notice. Nomura Group is under no duty to update this document.
Any comments or statements made herein are those of the author(s) and may differ from views held by other parties within Nomura Group.Clients should consider whether any advice or recommendation in this report is suitable for their particular circumstances and, if appropriate,seek professional advice, including tax advice. Nomura Group does not provide tax advice.Nomura Group, and/or its officers, directors and employees, may, to the extent permitted by applicable law and/or regulation, deal as principal,agent, or otherwise, or have long or short positions in, or buy or sell, the securities, commodities or instruments, or options or other derivativeinstruments based thereon, of issuers or securities mentioned herein. Nomura Group companies may also act as market maker or liquidityprovider (within the meaning of applicable regulations in the UK) in the financial instruments of the issuer. Where the activity of market maker iscarried out in accordance with the definition given to it by specific laws and regulations of the US or other jurisdictions, this will be separatelydisclosed within the specific issuer disclosures.This document may contain information obtained from third parties, including ratings from credit ratings agencies such as Standard & Poor’s.Reproduction and distribution of third party content in any form is prohibited except with the prior written permission of the related third party.Third party content providers do not guarantee the accuracy, completeness, timeliness or availability of any information, including ratings, andare not responsible for any errors or omissions (negligent or otherwise), regardless of the cause, or for the results obtained from the use of suchcontent. Third party content providers give no express or implied warranties, including, but not limited to, any warranties of merchantability orfitness for a particular purpose or use. Third party content providers shall not be liable for any direct, indirect, incidental, exemplary,
compensatory, punitive, special or consequential damages, costs, expenses, legal fees, or losses (including lost income or profits andopportunity costs) in connection with any use of their content, including ratings. Credit ratings are statements of opinions and are not statementsof fact or recommendations to purchase hold or sell securities. They do not address the suitability of securities or the suitability of securities forinvestment purposes, and should not be relied on as investment advice.
Any MSCI sourced information in this document is the exclusive property of MSCI Inc. (‘MSCI’). Without prior written permission of MSCI, thisinformation and any other MSCI intellectual property may not be reproduced, re-disseminated or used to create any financial products, includingany indices. This information is provided on an "as is" basis. The user assumes the entire risk of any use made of this information. MSCI, itsaffiliates and any third party involved in, or related to, computing or compiling the information hereby expressly disclaim all warranties oforiginality, accuracy, completeness, merchantability or fitness for a particular purpose with respect to any of this information. Without limiting anyof the foregoing, in no event shall MSCI, any of its affiliates or any third party involved in, or related to, computing or compiling the informationhave any liability for any damages of any kind. MSCI and the MSCI indexes are services marks of MSCI and its affiliates. Russell/Nomura Japan Equity Indexes are protected by certain intellectual property rights of Nomura Securities Co., Ltd. and RussellInvestments. Nomura Securities Co., Ltd. and Russell Investments do not guarantee the accuracy, completeness, reliability, or usefulnessthereof and do not account for business activities and services that any index user and its affiliates undertake with the use of the Indexes.Investors should consider this document as only a single factor in making their investment decision and, as such, the report should not beviewed as identifying or suggesting all risks, direct or indirect, that may be associated with any investment decision. Nomura Group produces a
number of different types of research product including, among others, fundamental analysis, quantitative analysis and short term trading ideas;recommendations contained in one type of research product may differ from recommendations contained in other types of research product,whether as a result of differing time horizons, methodologies or otherwise. Nomura Group publishes research product in a number of differentways including the posting of product on Nomura Group portals and/or distribution directly to clients. Different groups of clients may receivedifferent products and services from the research department depending on their individual requirements. Clients outside of the US may accessthe Nomura Research Trading Ideas platform (Retina) at http://go.nomuranow.com/equities/tradingideas/retina/ Figures presented herein may refer to past performance or simulations based on past performance which are not reliable indicators of futureperformance. Where the information contains an indication of future performance, such forecasts may not be a reliable indicator of futureperformance. Moreover, simulations are based on models and simplifying assumptions which may oversimplify and not reflect the futuredistribution of returns. Certain securities are subject to fluctuations in exchange rates that could have an adverse effect on the value or price of, or income derivedfrom, the investment.The securities described herein may not have been registered under the US Securities Act of 1933 (the ‘1933 Act’), and, in such case, may notbe offered or sold in the US or to US persons unless they have been registered under the 1933 Act, or except in compliance with an exemptionfrom the registration requirements of the 1933 Act. Unless governing law permits otherwise, any transaction should be executed via a Nomuraentity in your home jurisdiction.
This document has been approved for distribution in the UK and European Economic Area as investment research by NIplc. NIplc is authorisedby the Prudential Regulation Authority and regulated by the Financial Conduct Authority and the Prudential Regulation Authority. NIplc is a

8/12/2019 Ashok Ley Nomura
http://slidepdf.com/reader/full/ashok-ley-nomura 12/12
Nomura | Ashok Leyland 27 May 2014
12
member of the London Stock Exchange. This document does not constitute a personal recommendation within the meaning of applicableregulations in the UK, or take into account the particular investment objectives, financial situations, or needs of individual investors. Thisdocument is intended only for investors who are 'eligible counterparties' or 'professional clients' for the purposes of applicable regulations in theUK, and may not, therefore, be redistributed to persons who are 'retail clients' for such purposes. This document has been approved by NIHK,which is regulated by the Hong Kong Securities and Futures Commission, for distribution in Hong Kong by NIHK. This document has beenapproved for distribution in Australia by NAL, which is authorized and regulated in Australia by the ASIC. This document has also beenapproved for distribution in Malaysia by NSM. In Singapore, this document has been distributed by NSL. NSL accepts legal responsibility for thecontent of this document, where it concerns securities, futures and foreign exchange, issued by their foreign affiliates in respect of recipientswho are not accredited, expert or institutional investors as defined by the Securities and Futures Act (Chapter 289). Recipients of this documentin Singapore should contact NSL in respect of matters arising from, or in connection with, this document. Unless prohibited by the provisions ofRegulation S of the 1933 Act, this material is distributed in the US, by NSI, a US-registered broker-dealer, which accepts responsibility for itscontents in accordance with the provisions of Rule 15a-6, under the US Securities Exchange Act of 1934. The entity that prepared thisdocument permits its separately operated affiliates within the Nomura Group to make copies of such documents available to their clients. This document has not been approved for distribution to persons other than ‘Authorised Persons’, ‘Exempt Persons’ or ‘Institutions’ (as definedby the Capital Markets Authority) in the Kingdom of Saudi Arabia (‘Saudi Arabia’) or 'professional clients' (as defined by the Dubai FinancialServices Authority) in the United Arab Emirates (‘UAE’) or a ‘Market Counterparty’ or ‘Business Customers’ (as defined by the Qatar FinancialCentre Regulatory Authority) in the State of Qatar (‘Qatar’) by Nomura Saudi Arabia, NIplc or any other member of Nomura Group, as the casemay be. Neither this document nor any copy thereof may be taken or transmitted or distributed, directly or indirectly, by any person other thanthose authorised to do so into Saudi Arabia or in the UAE or in Qatar or to any person other than ‘Authorised Persons’, ‘Exempt Persons’ or‘Institutions’ located in Saudi Arabia or 'professional clients' in the UAE or a ‘Market Counterparty’ or ‘Business Customers’ in Qatar . Byaccepting to receive this document, you represent that you are not located in Saudi Arabia or that you are an ‘Authorised Person’, an ‘ExemptPerson’ or an ‘Institution’ in Saudi Arabia or that you are a 'professional client' in the UAE or a ‘Market Counterparty’ or ‘Business Customers’ inQatar and agree to comply with these restrictions. Any failure to comply with these restrictions may constitute a violation of the laws of the UAEor Saudi Arabia or Qatar. NO PART OF THIS MATERIAL MAY BE (I) COPIED, PHOTOCOPIED, OR DUPLICATED IN ANY FORM, BY ANY MEANS; OR (II)REDISTRIBUTED WITHOUT THE PRIOR WRITTEN CONSENT OF A MEMBER OF NOMURA GROUP. If this document has been distributedby electronic transmission, such as e-mail, then such transmission cannot be guaranteed to be secure or error-free as information could beintercepted, corrupted, lost, destroyed, arrive late or incomplete, or contain viruses. The sender therefore does not accept liability for any errorsor omissions in the contents of this document, which may arise as a result of electronic transmission. If verification is required, please request ahard-copy version.
Nomura Group manages conflicts with respect to the production of research through its compliance policies and procedures (including, but notlimited to, Conflicts of Interest, Chinese Wall and Confidentiality policies) as well as through the maintenance of Chinese walls and employeetraining.
Addi ti onal i nformati on is avai lab le upon reques t and di sc lo su re i nformat ion i s avail able at the Nom ura Discl osure webpage: http://go.nomuranow.com/research/globalresearchportal/pages/disclosures/disclosures.aspx Copyright © 2014 Nomura International (Hong Kong) Ltd. All rights reserved.