asia frontier capital - afc iraq fund presentation
TRANSCRIPT

CONFIDENTIALAFC Asia Frontier Fund
September 2013
AFC Iraq Fund
July 2015

Disclaimer & Sources 4
Abbreviations and conventions used 5
Why Iraq ? 6 – 10
The good, the bad and the ugly 11 – 17
Capital Markets 18 – 26
About Asia Frontier Capital 27 – 32
Appendices 33 – 39
Disclaimer 40
3AFC Iraq Fund
CONTENTS

Disclaimer This presentation is prepared on a confidential basis to a limited number of professional investors solely to provide some
information about Iraq and its potential
This presentation is based on information publically available either through web sites, publications, presentations and research reports. No representation or warranty, expressed or implied, is made as to their accuracy, completeness or correctness
Any information contained in this presentation is not to be relied upon as authorative or taken in substitution for the exercise of judgment. This presentation is not, and should not be construed as, an offer or solicitation to sell or buy any investment product
The analysis is my own and reflects my own views and outlook, however, said views and outlook are subject to change and maybe superseded without notice. I have learned a great deal about Iraq’s investment potential while reviewing the sources below which has both effected and guided me in my research
Sources Iraq: Central Bank of Iraq (CBI), Iraqi Securities Commission (ISC), Iraq Stock Exchange (ISX), Iraqi Depository Centre (IDC), Iraq
Statistical Organization (COSIT), Iraqi Ministry of Oil, Iraqi companies
IMF, World Bank, IEA, EIA, BP, CIA World Fact Book, Trading Economics, Index Mundi, Iraq Body Count
Presentations/Research reports : DB, Standard Chartered, Arqaam Capital, Rabee Securities, Akkadia Partners, Sansar Capital, HSBC, Euphrates Advisors, FMG, Pareto Securities. Iraqi companies research mostly provided by Rabee Securities
WSJ, NYT, FT, Reuters, Bloomberg, International Business Times, CNN, BBC, …
Data : Latest data is mostly as of 2012, 2013 & some as of 2014, 2014 are estimates, 2015-2018 are projections based mostly on IMF & World Bank for macro data while IEA & EIA for oil data as primary sources. Capital markets data is from the CBI, ISC, ISX & IDC. Company data collected & organized by Rabee Securities who maintain a significant data base of Iraq company data
A special thanks to the research team at Rabee Securities who have been very generous with their time and resource. The RabeeSecurities RSISX Index is used in the section on equity capital markets
4
DISCLAIMER AND SOURCES
AFC Iraq Fund

Currencies $ = US dollars, IQD = Iraqi Dinar. All figures displayed in $ using official exchange rate of $ = 1,166 IQD
Economic terms Gross Domestic Product (GDP) is used through as Nominal or Current prices GDP while GDP growth rate is used as real GDP
growth rate where 2007 is used as the base year used for real GDP. PPP used In tables is Purchasing Power Parity and used mostly to aid in making comparison to other economies
Note: Oil is the main driver of Iraq’s economy and hence its nominal GDP is highly dependent on the price of oil. This explainsthe seemingly large movements in estimates for future years which are dependent on estimates for the price of oil. Both nominal and PPP GDP’s are used in this presentation plus real or constant $ GDP growth is used as well to get the full picture.
Figures Billions and millions in main body text but abbreviated to (m) and (bn) in charts and tables
Iraqi specific terms CBI = Central Bank of Iraq, MoF = Ministry of Finance, SOE’s = State Owned Enterprises
KRI is the semi-autonomous Kurdish Region of Iraq which is governed by the Kurdish Regional Government (KRG)
Oil terms bbl/d = barrels per day
Others To make for easier reading the following abbreviations are used throughout :avg. for average, est. for estimate, esp. for
especially and vs. for versus
KSA is the Kingdom of Saudi Arabia as used in tables
ISIS refers to the so called Islamic State of Iraq & Sham or Da’esh as used in Arabic
5
ABBREVIATIONS AND CONVENTIONS USED
AFC Iraq Fund
WHY IRAQ
Iraq Is exceptionally rich in oil with
The 5th largest proved reserves in the world
One of the lowest extraction costs in the world
Is a significant economy with 2018 GDP seen at $250 billion Expected to decline by 2.4% in 2014 but grow by 1.3% in 2015
Projected to grow by an average of 8.3% annually until 2018
Its population is large, very young and growing 35.9 million growing by over 3% annually
56% under 25 years of age
Overlaid by a massive wholesale reconstruction of a country ravaged by 35 years of wars, sanctions and civil strife culminating in occupation and war
7AFC Iraq Fund
THE OPPORTUNITY AT A GLANCE
Two Iraqs: Iraq for at least ten years has been a country of two parts Kurdish Region of Iraq (KRI) in the north
With 13%, 16% & 17% of Iraq’s GDP, population and share of oil revenues
Arab Iraq in the rest
With 87%, 84 % & 83% of Iraq’s GDP, population and share of oil revenues
The rise of ISIS has accelerated the resolution of an un-tenable situation The prior central government lost control of the Sunni dominated west well before ISIS
Political instability held back the development of the two parts
Subsequent developments to unlock Iraq’s investment potential An inclusive central government with a high degree of regional devolution along current lines
The full development of the KRI, the massive southern oil fields and a mini-Marshal plan for the Sunni areas following the containment of ISIS
8AFC Iraq Fund
RECENT DEVELOPMENTS: WAR, STRIFE & ISIS
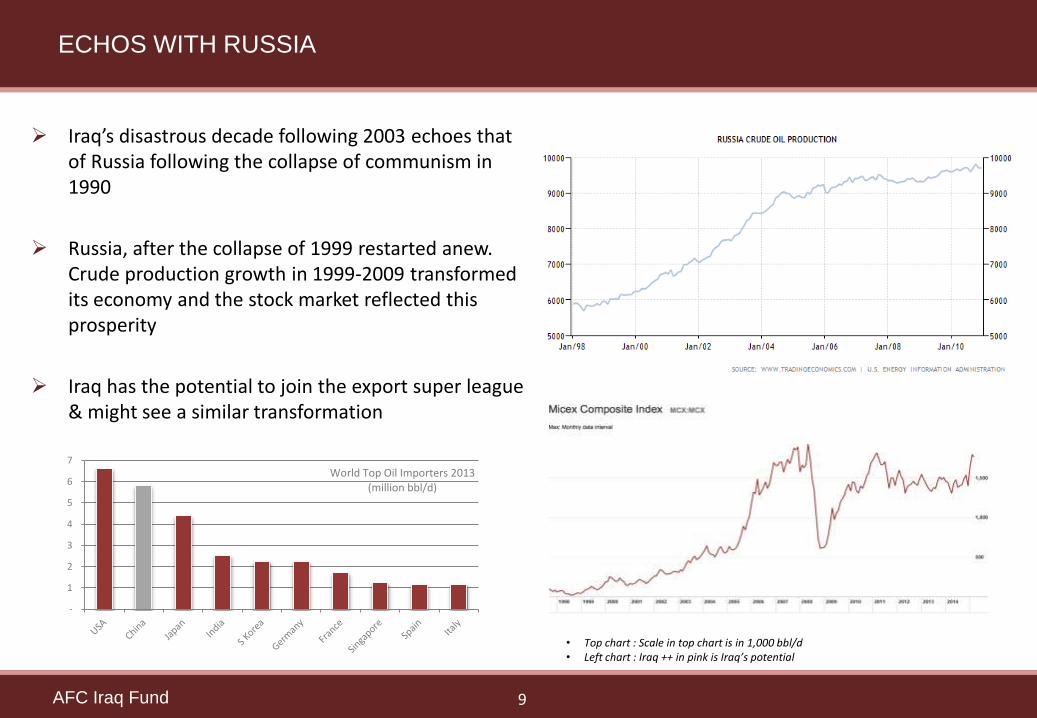
Iraq’s disastrous decade following 2003 echoes that of Russia following the collapse of communism in 1990
Russia, after the collapse of 1999 restarted anew. Crude production growth in 1999-2009 transformed its economy and the stock market reflected this prosperity
Iraq has the potential to join the export super league & might see a similar transformation
9AFC Iraq Fund
ECHOS WITH RUSSIA
• Top chart : Scale in top chart is in 1,000 bbl/d• Left chart : Iraq ++ in pink is Iraq’s potential
-
1
2
3
4
5
6
7World Top Oil Importers 2013
(million bbl/d)
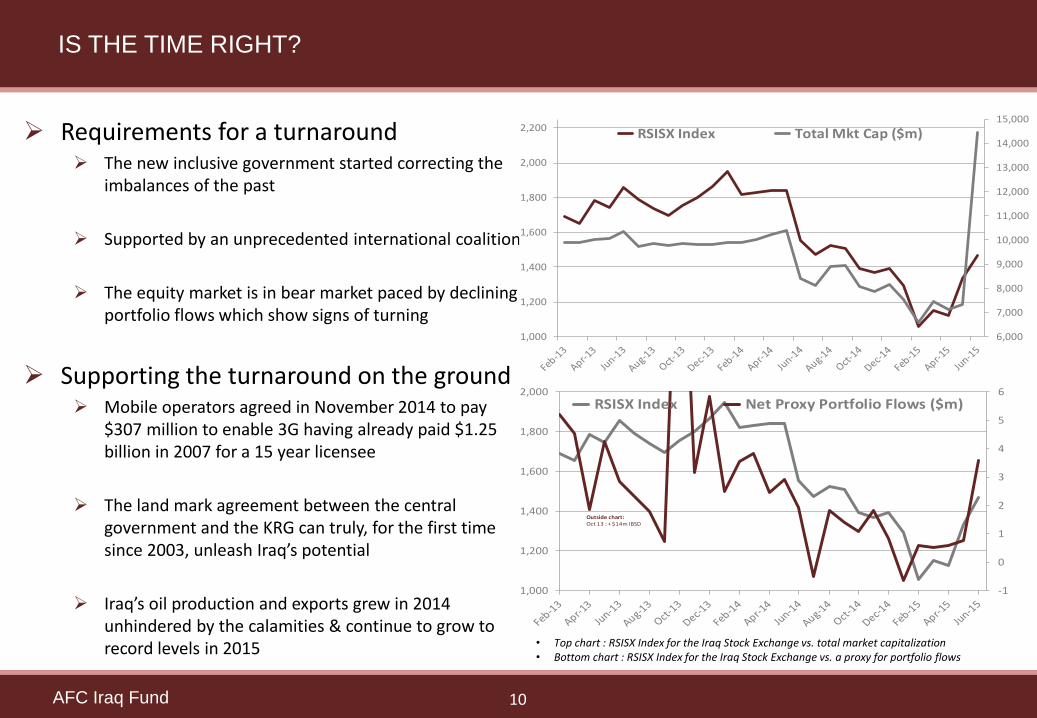
Requirements for a turnaround The new inclusive government started correcting the
imbalances of the past
Supported by an unprecedented international coalition
The equity market is in bear market paced by declining portfolio flows which show signs of turning
Supporting the turnaround on the ground Mobile operators agreed in November 2014 to pay
$307 million to enable 3G having already paid $1.25 billion in 2007 for a 15 year licensee
The land mark agreement between the central government and the KRG can truly, for the first time since 2003, unleash Iraq’s potential
Iraq’s oil production and exports grew in 2014 unhindered by the calamities & continue to grow to record levels in 2015
10AFC Iraq Fund
IS THE TIME RIGHT?
• Top chart : RSISX Index for the Iraq Stock Exchange vs. total market capitalization• Bottom chart : RSISX Index for the Iraq Stock Exchange vs. a proxy for portfolio flows
6,000
7,000
8,000
9,000
10,000
11,000
12,000
13,000
14,000
15,000
1,000
1,200
1,400
1,600
1,800
2,000
2,200 RSISX Index Total Mkt Cap ($m)
-1
0
1
2
3
4
5
6
1,000
1,200
1,400
1,600
1,800
2,000
Outside chart:Oct 13 : + $14m IBSD
RSISX Index Net Proxy Portfolio Flows ($m)

THE GOOD, THE BAD & THE UGLY
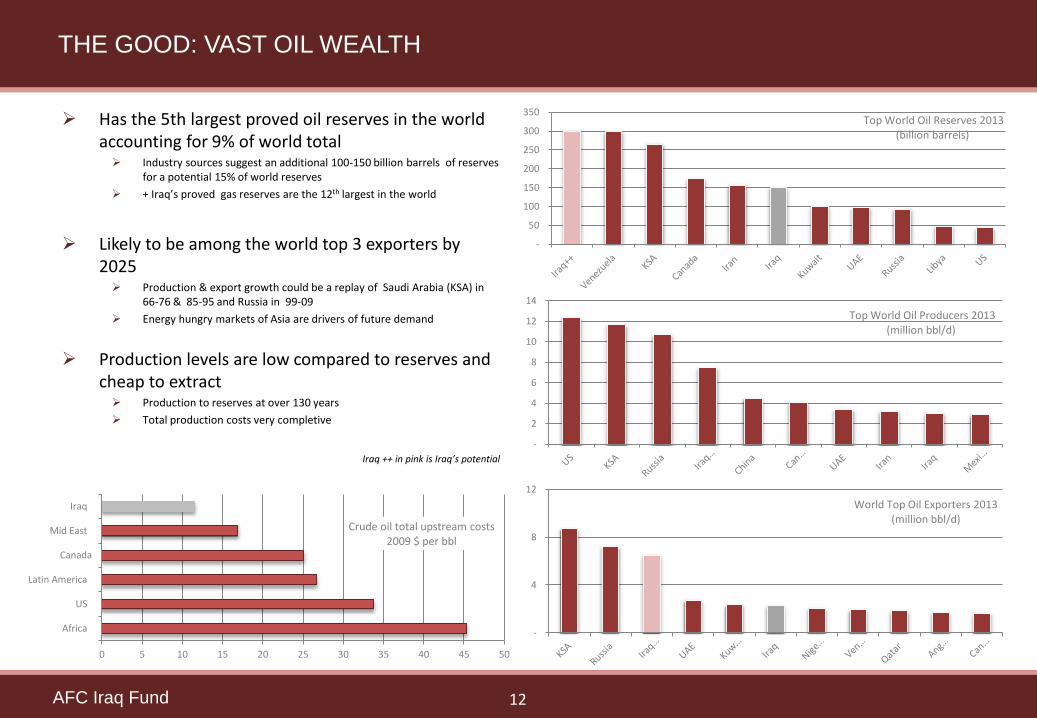
Has the 5th largest proved oil reserves in the world accounting for 9% of world total Industry sources suggest an additional 100-150 billion barrels of reserves
for a potential 15% of world reserves
+ Iraq’s proved gas reserves are the 12th largest in the world
Likely to be among the world top 3 exporters by 2025 Production & export growth could be a replay of Saudi Arabia (KSA) in
66-76 & 85-95 and Russia in 99-09
Energy hungry markets of Asia are drivers of future demand
Production levels are low compared to reserves and cheap to extract Production to reserves at over 130 years
Total production costs very completive
Iraq ++ in pink is Iraq’s potential
0 5 10 15 20 25 30 35 40 45 50
Africa
US
Latin America
Canada
Mid East
Iraq
Crude oil total upstream costs2009 $ per bbl
12AFC Iraq Fund
THE GOOD: VAST OIL WEALTH
-
50
100
150
200
250
300
350Top World Oil Reserves 2013
(billion barrels)
-
2
4
6
8
10
12
14
Top World Oil Producers 2013(million bbl/d)
-
4
8
12
World Top Oil Exporters 2013(million bbl/d)
Banking Less than 20% of the population have bank accounts
Credit to the private sector at 6.3% of GDP vs. avg. 55% for the region
Public sector banks account for almost 90% & 86% of total assets and deposits
Telecommunication Fixed line network penetration at about 7%
Around 15% (*) of the population have internet access
Mobile (2G) is the main vehicle for voice and data with penetration around 90%+
3G launched in early 2015
Minerals, Industrials & Agriculture Iraq had a competitive advantage in Oil & Gas related industries and similarly in minerals & materials
Iraq was a self sufficient & exporting agricultural country
But Infrastructure across all sectors, after 35 years of conflict, has deteriorated significantly
(*) New figures, released December 14, based on a phone survey of 2,000 phone users suggest that 50% of households have internet access but that 50% of the population have never used the internet. Iraq’s Ministry of Communication estimated that 15% of the population uses the internet (March 2014)
13AFC Iraq Fund
THE GOOD: A PRE-MARKET ECONOMY

A very young population of 35.9 million (2014e) growing at over 3% per annum with 56% under 25 years of age
Income levels recovered since 2003 but a long way to go in absolute basis and relative to peers in the region
This young population as it grows will be a massive driver of future economic growth
Age structure (2014 est.)0-14 years : 36.7% (male 6,093,069/female 5,878,590) 15-24 years : 19.6% (male 3,237,212/female 3,142,202) 25-54 years : 36.3% (male 6,032,379/female 5,785,967) 55-64 years : 4.2% (male 652,973/female 713,662) 65 + years : 3.2% (male 487,841/female 561,797)
14AFC Iraq Fund
THE GOOD: A YOUNG AND GROWING POPULATION
Note : GDP per Capital in above chart is based on real GDP (ie adjusted for inflation) and so should not be confused with figures in later slides.

Oil & State dependence Oil accounts for over 90% of government revenues. Government & SOE account for bulk of economic activity
Government & SOE’s employ over 50% of workforce & are the main vehicle for transfer of oil wealth
Budget very sensitive to high oil prices
Workforce challenges 35 years of conflict had a profound effect on quality of workforce (education and skills suffered)
Unemployment at 11% but probably higher esp. among the young
Extreme demographic pressures given its very young population
Weak infrastructure Weak administrational capacity in government across all levels
Weak infrastructure (electricity, roads and services)
Weak business environment (poor governance, inefficient judiciary and weak security)
KRI is healthier with a vibrant non-oil sector, good infrastructure but Is dependent on central government for revenues
Legal structure prevented full direct export of oil and receipt of oil income
Shares workforce challenges & state dependence but healthier unemployment rate at 6%
15AFC Iraq Fund
THE BAD: INFRASTRUCTURE WEAKNESS

Violence & death toll up to the ISIS occupation and war
Top chart shows the total death toll
But bottom chart shows death toll by anti-government perpetrators
The upshot: For most Iraqis the violence of the last two years is on par with the perceived relative calm of 09-12
The events following the fall of Mosul could bring back the horrors of the destructive sectarian violence of 06-07
The displacement of over 2.7 million Iraqis, or 7.5% of the population, adds a new layer of social tension and a huge financial drag
16AFC Iraq Fund
THE UGLY: VIOLENCE

Despite the bad and the ugly Iraq has managed to grow strongly until 2014
The ISIS occupation, population dislocation and war will hurt 2014 but begin to dissipate by 2015
Oil exports and accumulating oil wealth will provide the where-with-all for resumption of strong growth after 2015 The IMF on Dec 2014 raised 2013/2014 production and exports from 2.85/2.95 to 3.3/3.1 and from 2.33/2.40 to 3.1/3.1 reflecting a combined Iraq and KRG. Note historic figures above have
not fully reflected the inclusion of the KRI oil production and exports and as such be revised.
17AFC Iraq Fund
IRAQ IN NUMBERS
Macro Data 2010A 2011A 2012A 2013A 2014E 2015P 2016P 2017P 2018P
Nominal GDP ($bn) 138.5 185.8 218.0 232.5 221.1 173.8 199.6 227.9 252.7
Nominal GDP Per Capita ($) PPP 383.3 420.8 488.0 527.8 522.7 534.3 583.6 648.3 717.4
Real GDP change % 6.4% 7.5% 13.9% 6.6% -2.4% 1.3% 7.6% 8.9% 8.3%
Real Oil GDP change % 1.0% 12.5% 12.8% 0.3% 5.9% 5.7% 9.3% 9.3% 9.3%
Real Non-oil GDP change % 9.1% 8.6% 8.4% 7.3% -5.2% 0.0% 6.0% 6.0% 6.0%
Population (m) 31.7 32.7 33.7 34.8 35.9 37.0 38.1 39.2 40.3
Nominal GDP Per Capita ($) 4,374 5,687 6,469 6,686 6,165 4,701 5,240 5,811 6,264
Nominal GDP Per Capita ($) PPP 12,103 12,881 14,479 15,178 14,571 14,448 15,321 16,534 17,780
CPI YoY % (avg) 2.4% 5.6% 6.1% 1.9% 2.2% 3.0% 3.0% 3.0% 3.0%
M2 Growth (YoY) 32.6% 20.7% 4.1% 16.0% 3.7% 4.8% 7.0% 7.0% 7.0%
CBI Policy Rate 6.3% 6.0% 6.0% 6.0% 6.0% 5.0% 5.0% 5.0% 5.0%
Gross foreign reserves ($bn) 50.6 61.1 70.3 77.8 69.1 55.8 55.8 59.7 63.9
in months of imports 10.6 9.5 9.3 9.7 9.4 9.2 8.8 8.4 8.1
Current account as % of GDP 3.0% 12.0% 6.7% 1.3% -3.5% -9.6% -3.6% 1.7% 1.8%
Official exchange rate $/IQD 1,170 1,170 1,166 1,166 1,166 1,166 1,166 1,166 1,166
Banking : Assets 310.7 122.9 164.1 177.1
Banking : Deposits 41.0 48.0 53.2 59.1
Banking : Private sector deposits 11.69 15.55 18.11 20.97
Banking : private sector deposits as % of GDP 8.4% 8.4% 8.3% 9.0%
Banking : Loans to the private sector 7.3 9.7 12.6 14.5
Banking : Loans to the private sector as % of GDP 5.3% 5.2% 5.8% 6.3%
Government revenue as % of GDP 45.4% 48.1% 47.0% 42.6% 40.5% 40.9% 44.3% 45.4% 45.5%
Government oil revenues as % of total revenues 86.1% 89.2% 82.9% 83.8% 85.9% 79.7% 81.2% 81.7% 81.7%
Government expenditure as % of GDP 49.6% 43.4% 42.9% 48.4% 43.5% 50.9% 50.6% 44.8% 43.8%
Budget balance as % of GDP -4.2% 4.7% 4.1% -5.8% -3.0% -10.0% -6.3% 0.6% 1.7%
Government gross debt as % of GDP 53.2% 40.6% 34.6% 32.1% 37.0% 55.6% 56.2% 48.6% 42.1%
Government external debt as % of GDP 44.0% 32.9% 27.8% 26.0% 26.0% 30.5% 11.4% 9.0% 7.3%
Oil Production (mill ion bbl/d) 2.4 2.7 3.0 3.1 3.3 3.5 3.8 4.2 4.6
Production growth (%) 2.0% 11.4% 11.2% 6.1% 5.9% 5.7% 9.3% 10.0% 10.0%
Oil Exports (mill ion bbl/d) 1.8 2.0 2.3 2.5 2.5 3.0 3.3 3.6 3.9
Export growth(%) -1.3% 10.7% 11.7% 9.1% -0.4% 20.9% 8.3% 10.0% 10.0%
Figures from IMF WEO Apr 15 & REO Jan 15

IRAQ’S CAPITAL MARKETS
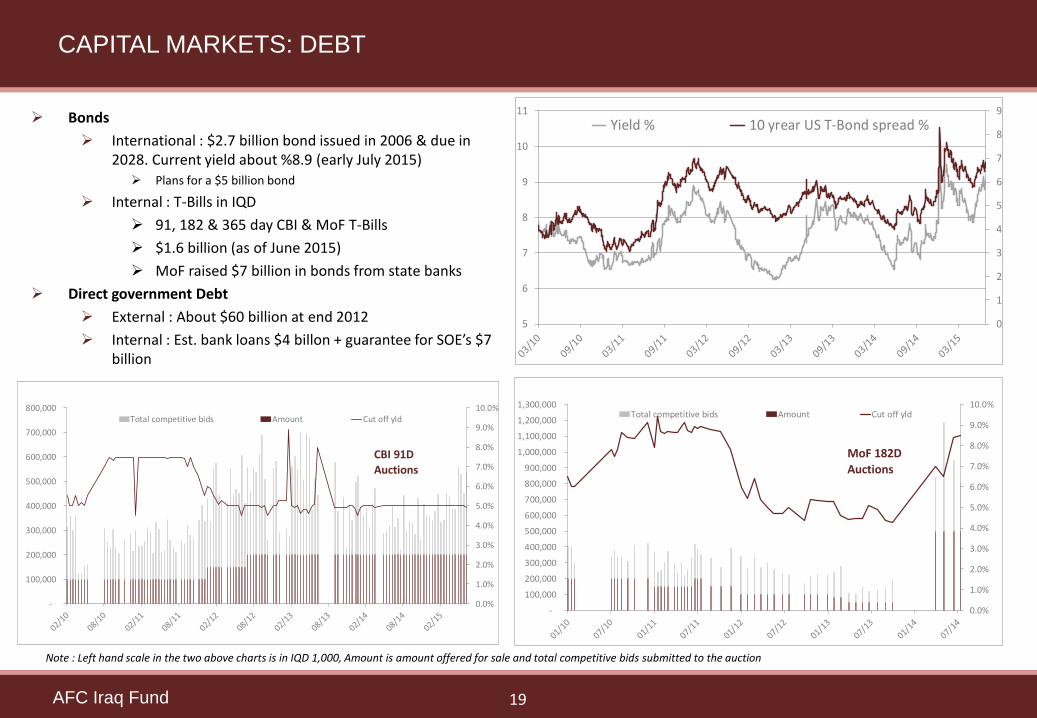
Bonds
International : $2.7 billion bond issued in 2006 & due in 2028. Current yield about %8.9 (early July 2015)
Plans for a $5 billion bond
Internal : T-Bills in IQD
91, 182 & 365 day CBI & MoF T-Bills
$1.6 billion (as of June 2015)
MoF raised $7 billion in bonds from state banks
Direct government Debt
External : About $60 billion at end 2012
Internal : Est. bank loans $4 billon + guarantee for SOE’s $7 billion
19AFC Iraq Fund
CAPITAL MARKETS: DEBT
Note : Left hand scale in the two above charts is in IQD 1,000, Amount is amount offered for sale and total competitive bids submitted to the auction
0
1
2
3
4
5
6
7
8
9
5
6
7
8
9
10
11
Yield % 10 yrear US T-Bond spread %
0.0%
1.0%
2.0%
3.0%
4.0%
5.0%
6.0%
7.0%
8.0%
9.0%
10.0%
-
100,000
200,000
300,000
400,000
500,000
600,000
700,000
800,000
900,000
1,000,000
1,100,000
1,200,000
1,300,000Total competitive bids Amount Cut off yld
MoF 182D
Auctions
0.0%
1.0%
2.0%
3.0%
4.0%
5.0%
6.0%
7.0%
8.0%
9.0%
10.0%
-
100,000
200,000
300,000
400,000
500,000
600,000
700,000
800,000Total competitive bids Amount Cut off yld
CBI 91D
Auctions

The Iraq Stock Exchange (ISX) is at its infancy and yet to play its part in the economy
The ISX is an SRO and governed by The Iraqi Securities Commission (ISC)
The ISX operates an electronic trading platform provided by NASDAQ-OMX
Share ownership is fully decartelized and held electronically with the Iraqi Depository Centre (IDC)
The ISX is made up of over 80 companies
Banks account for for 25% of the market cap & over 85% of trading
Prior to ZAIN Iraq IPO’s accounted for 56% of market Cap
Telecom account for 69% of market cap. Boosted by the listing of ZAIN Iraq
ZAIN Iraq listed, in June 2015, about 45 million shares from a total of 457 billion shares offered.
A USD 9 billion market cap based on small offering and will likely contract significantly as more shares are offered
Average trading is at under $1 million
20AFC Iraq Fund
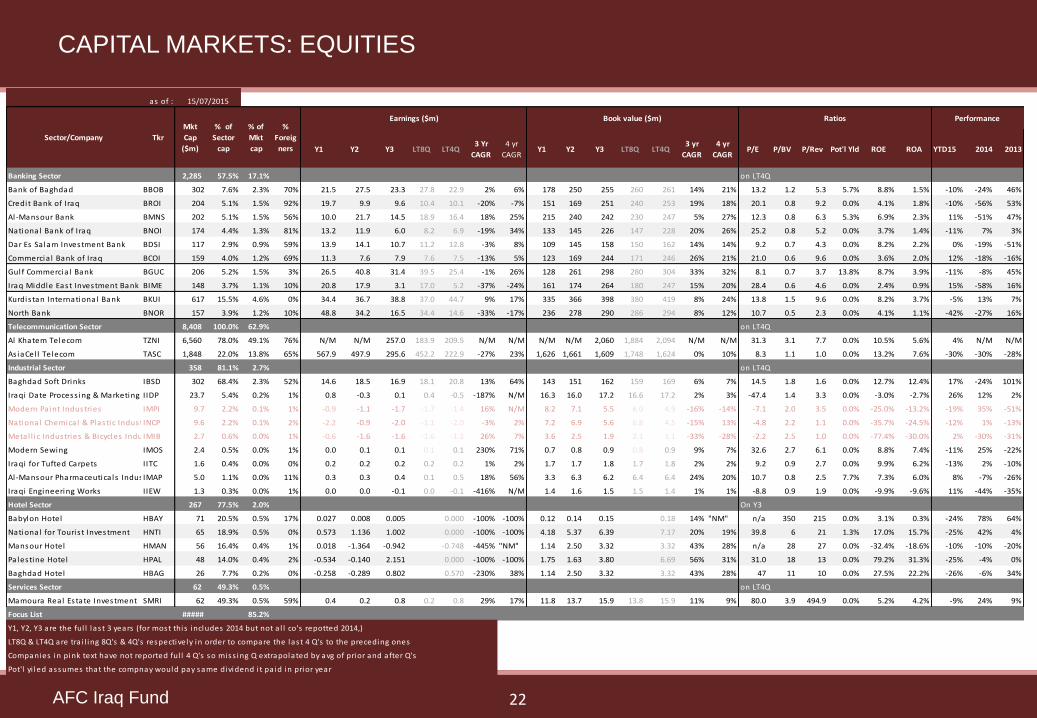
CAPITAL MARKETS: EQUITIES
6,000
7,000
8,000
9,000
10,000
11,000
12,000
13,000
14,000
15,000
1,000
1,200
1,400
1,600
1,800
2,000
2,200 RSISX Index Total Mkt Cap ($m)
05/07/2015 Market Cap $m % of Market cap
Banking Sector 4,115 28.49%
Telecommunication Sector 9,338 64.65%
Industrial Sector 431 2.98%
Hotel Sector 358 2.48%
Services Sector 127 0.88%
Agricultural Sector 55 0.38%
Insurance Sector 11 0.08%
Investment Sector 8 0.05%
Total market 14,443
L12M avg daily turnover $m < 1.0

Trading is dominated by local retail investors, however,
the total number of investors is tiny with active traders probably < 5,000 and overall investors probably < 35,000
Hardly any local institutional investors
Foreigners: The market opened to foreigners in
2007
Handful of funds with AuM’s about $170 million account for the bulk of institutional funds
Top chart shows net foreign inflows (grey line) vs. a proxy for net portfolio flows (red line)
In a regional context & as a percentage of GDP
The ISX is tiny in both absolute and relative terms
In the medium term the ISX should be line with Iran and ultimately with Saudi Arabia
21AFC Iraq Fund
CAPITAL MARKETS: EQUITIES
-2.0
-1.0
0.0
1.0
2.0
3.0
4.0
5.0
6.0
7.0
-15.0
-10.0
-5.0
0.0
5.0
10.0
15.0
20.0
25.0
30.0
35.0
Outside chart:Dec 12: +$18m IBSDFeb 13: +$813m TASC IPOOct 13 :+ $14m IBSD
Net total flows ($m) Net Proxy portfolio flows ($m)
Country
Market
cap April
2015 $bn % total
GDP
2014e
$bn % total
Mkt
Cap as
% GDP
KSA 597 46.0% 752 30.3% 79.3%
UAE 229 17.6% 402 16.2% 57.0%
Qatar 181 14.0% 210 8.5% 86.3%
Kuwait 99 7.6% 172 6.9% 57.2%
Egypt 67 5.2% 286 11.5% 23.4%
Jordan 29 2.2% 36 1.4% 80.5%
Iraq 7 0.5% 221 8.9% 3.2%
Iran 90 6.9% 404 16.3% 22.3%
Total /
Wgtd Avg 1,298 2,484 52.3%
GCC 1,105 85.1% 1,536 61.9% 71.9%
non-GCC 186 14.3% 726 29.2% 25.6%
Total-ex Iraq 1,291 99.5% 2,263 91.1% 57.1%
22AFC Iraq Fund
CAPITAL MARKETS: EQUITIES
as of :
Y1 Y2 Y3 LT8Q LT4Q3 Yr
CAGR
4 yr
CAGRY1 Y2 Y3 LT8Q LT4Q
3 yr
CAGR
4 yr
CAGRP/E P/BV P/Rev Pot'l Yld ROE ROA YTD15 2014 2013
Banking Sector 2,285 57.5% 17.1% on LT4Q
Bank of Baghdad BBOB 302 7.6% 2.3% 70% 21.5 27.5 23.3 27.8 22.9 2% 6% 178 250 255 260 261 14% 21% 13.2 1.2 5.3 5.7% 8.8% 1.5% -10% -24% 46%
Credit Bank of Iraq BROI 204 5.1% 1.5% 92% 19.7 9.9 9.6 10.4 10.1 -20% -7% 151 169 251 240 253 19% 18% 20.1 0.8 9.2 0.0% 4.1% 1.8% -10% -56% 53%
Al-Mansour Bank BMNS 202 5.1% 1.5% 56% 10.0 21.7 14.5 18.9 16.4 18% 25% 215 240 242 230 247 5% 27% 12.3 0.8 6.3 5.3% 6.9% 2.3% 11% -51% 47%
National Bank of Iraq BNOI 174 4.4% 1.3% 81% 13.2 11.9 6.0 8.2 6.9 -19% 34% 133 145 226 147 228 20% 26% 25.2 0.8 5.2 0.0% 3.7% 1.4% -11% 7% 3%
Dar Es Sa lam Investment Bank BDSI 117 2.9% 0.9% 59% 13.9 14.1 10.7 11.2 12.8 -3% 8% 109 145 158 150 162 14% 14% 9.2 0.7 4.3 0.0% 8.2% 2.2% 0% -19% -51%
Commercia l Bank of Iraq BCOI 159 4.0% 1.2% 69% 11.3 7.6 7.9 7.6 7.5 -13% 5% 123 169 244 171 246 26% 21% 21.0 0.6 9.6 0.0% 3.6% 2.0% 12% -18% -16%
Gulf Commercia l Bank BGUC 206 5.2% 1.5% 3% 26.5 40.8 31.4 39.5 25.4 -1% 26% 128 261 298 280 304 33% 32% 8.1 0.7 3.7 13.8% 8.7% 3.9% -11% -8% 45%
Iraq Middle East Investment Bank BIME 148 3.7% 1.1% 10% 20.8 17.9 3.1 17.0 5.2 -37% -24% 161 174 264 180 247 15% 20% 28.4 0.6 4.6 0.0% 2.4% 0.9% 15% -58% 16%
Kurdis tan International Bank BKUI 617 15.5% 4.6% 0% 34.4 36.7 38.8 37.0 44.7 9% 17% 335 366 398 380 419 8% 24% 13.8 1.5 9.6 0.0% 8.2% 3.7% -5% 13% 7%
North Bank BNOR 157 3.9% 1.2% 10% 48.8 34.2 16.5 34.4 14.6 -33% -17% 236 278 290 286 294 8% 12% 10.7 0.5 2.3 0.0% 4.1% 1.1% -42% -27% 16%
Telecommunication Sector 8,408 100.0% 62.9% on LT4Q
Al Khatem Telecom TZNI 6,560 78.0% 49.1% 76% N/M N/M 257.0 183.9 209.5 N/M N/M N/M N/M 2,060 1,884 2,094 N/M N/M 31.3 3.1 7.7 0.0% 10.5% 5.6% 4% N/M N/M
AsiaCel l Telecom TASC 1,848 22.0% 13.8% 65% 567.9 497.9 295.6 452.2 222.9 -27% 23% 1,626 1,661 1,609 1,748 1,624 0% 10% 8.3 1.1 1.0 0.0% 13.2% 7.6% -30% -30% -28%
Industrial Sector 358 81.1% 2.7% on LT4Q
Baghdad Soft Drinks IBSD 302 68.4% 2.3% 52% 14.6 18.5 16.9 18.1 20.8 13% 64% 143 151 162 159 169 6% 7% 14.5 1.8 1.6 0.0% 12.7% 12.4% 17% -24% 101%
Iraqi Date Process ing & Marketing IIDP 23.7 5.4% 0.2% 1% 0.8 -0.3 0.1 0.4 -0.5 -187% N/M 16.3 16.0 17.2 16.6 17.2 2% 3% -47.4 1.4 3.3 0.0% -3.0% -2.7% 26% 12% 2%
Modern Paint Industries IMPI 9.7 2.2% 0.1% 1% -0.9 -1.1 -1.7 -1.7 -1.4 16% N/M 8.2 7.1 5.5 6.0 4.9 -16% -14% -7.1 2.0 3.5 0.0% -25.0% -13.2% -19% 35% -51%
National Chemica l & Plastic IndustriesINCP 9.6 2.2% 0.1% 2% -2.2 -0.9 -2.0 -1.1 -2.0 -3% 2% 7.2 6.9 5.6 6.8 4.5 -15% 13% -4.8 2.2 1.1 0.0% -35.7% -24.5% -12% 1% -13%
Metal l ic Industries & Bicycles IndustriesIMIB 2.7 0.6% 0.0% 1% -0.6 -1.6 -1.6 -1.6 -1.2 26% 7% 3.6 2.5 1.9 2.1 1.1 -33% -28% -2.2 2.5 1.0 0.0% -77.4% -30.0% 2% -30% -31%
Modern Sewing IMOS 2.4 0.5% 0.0% 1% 0.0 0.1 0.1 0.1 0.1 230% 71% 0.7 0.8 0.9 0.8 0.9 9% 7% 32.6 2.7 6.1 0.0% 8.8% 7.4% -11% 25% -22%
Iraqi for Tufted Carpets IITC 1.6 0.4% 0.0% 0% 0.2 0.2 0.2 0.2 0.2 1% 2% 1.7 1.7 1.8 1.7 1.8 2% 2% 9.2 0.9 2.7 0.0% 9.9% 6.2% -13% 2% -10%
Al-Mansour Pharmaceutica ls IndustriesIMAP 5.0 1.1% 0.0% 11% 0.3 0.3 0.4 0.1 0.5 18% 56% 3.3 6.3 6.2 6.4 6.4 24% 20% 10.7 0.8 2.5 7.7% 7.3% 6.0% 8% -7% -26%
Iraqi Engineering Works IIEW 1.3 0.3% 0.0% 1% 0.0 0.0 -0.1 0.0 -0.1 -416% N/M 1.4 1.6 1.5 1.5 1.4 1% 1% -8.8 0.9 1.9 0.0% -9.9% -9.6% 11% -44% -35%
Hotel Sector 267 77.5% 2.0% On Y3
Babylon Hotel HBAY 71 20.5% 0.5% 17% 0.027 0.008 0.005 0.000 -100% -100% 0.12 0.14 0.15 0.18 14% "NM" n/a 350 215 0.0% 3.1% 0.3% -24% 78% 64%
National for Touris t Investment HNTI 65 18.9% 0.5% 0% 0.573 1.136 1.002 0.000 -100% -100% 4.18 5.37 6.39 7.17 20% 19% 39.8 6 21 1.3% 17.0% 15.7% -25% 42% 4%
Mansour Hotel HMAN 56 16.4% 0.4% 1% 0.018 -1.364 -0.942 -0.748 -445% "NM" 1.14 2.50 3.32 3.32 43% 28% n/a 28 27 0.0% -32.4% -18.6% -10% -10% -20%
Palestine Hotel HPAL 48 14.0% 0.4% 2% -0.534 -0.140 2.151 0.000 -100% -100% 1.75 1.63 3.80 6.69 56% 31% 31.0 18 13 0.0% 79.2% 31.3% -25% -4% 0%
Baghdad Hotel HBAG 26 7.7% 0.2% 0% -0.258 -0.289 0.802 0.570 -230% 38% 1.14 2.50 3.32 3.32 43% 28% 47 11 10 0.0% 27.5% 22.2% -26% -6% 34%
Services Sector 62 49.3% 0.5% on LT4Q
Mamoura Real Estate Investment SMRI 62 49.3% 0.5% 59% 0.4 0.2 0.8 0.2 0.8 29% 17% 11.8 13.7 15.9 13.8 15.9 11% 9% 80.0 3.9 494.9 0.0% 5.2% 4.2% -9% 24% 9%
Focus List ##### 85.2%
Y1, Y2, Y3 are the ful l las t 3 years (for most this includes 2014 but not a l l co's repotted 2014,)
LT8Q & LT4Q are tra i l ing 8Q's & 4Q's respectively in order to compare the last 4 Q's to the preceding ones
Companies in pink text have not reported ful l 4 Q's so miss ing Q extrapolated by avg of prior and after Q's
Pot'l yi led assumes that the compnay would pay same dividend i t pa id in prior year
Performance
15/07/2015
Sector/Company Tkr
Mkt
Cap
($m)
% of
Sector
cap
% of
Mkt
cap
%
Foreig
ners
Earnings ($m) Book value ($m) Ratios

Commercial banks have huge operating leverage as banking usage and credit expansion takes hold
The scale of the opportunity can be seen by noting that (figures from 2013) Less than 20% of the population have bank accounts and state banks dominate the landscape
Private sector deposits at 9% of GDP (40% with commercial banks) vs 75% for MENA ( GCC at 70% & non-GCC at 80%)
Private sector credit at 6.3% of GDP (39% with commercial banks) vs 55% for MENA (GCC at 70% & non-GCC at 40%)
Focusing on two banks, each at different end of the commercial banking spectrum Bank of Baghdad (BBOB) is majority owned (52%) by Burgan Bank of Kuwait, part of Kuwaiti conglomerate KIPCO group
BBOB Has grown deposits at 4 year CAGR of 13% while loan to deposit ratio stands at 15%
Gulf Commercial Bank (BGUC) with a major holding by prominent Iraqi merchant family BGUC Has grown deposits at 4 year CAGR of 17% while loan to deposit ratio stands at 56%
On the next page a conservative “what if scenario “ demonstrates the potential operating leverage For Bank of Baghdad a slight increase in deposit growth CAGR from 13% to 17% for next 10 years and loan deposit ratio at 30%/50% in
5/10 years time
For Gulf Commercial Bank a slight increase in deposit growth CAGR from 17% to 22% for next 10 years and loan deposit ratio at 75%/90% in 5/10 years time
For both banks a narrowing of lending margins, higher interest expense and modest growth in expenses
23AFC Iraq Fund
OPERATING LEVERAGE : BANKS
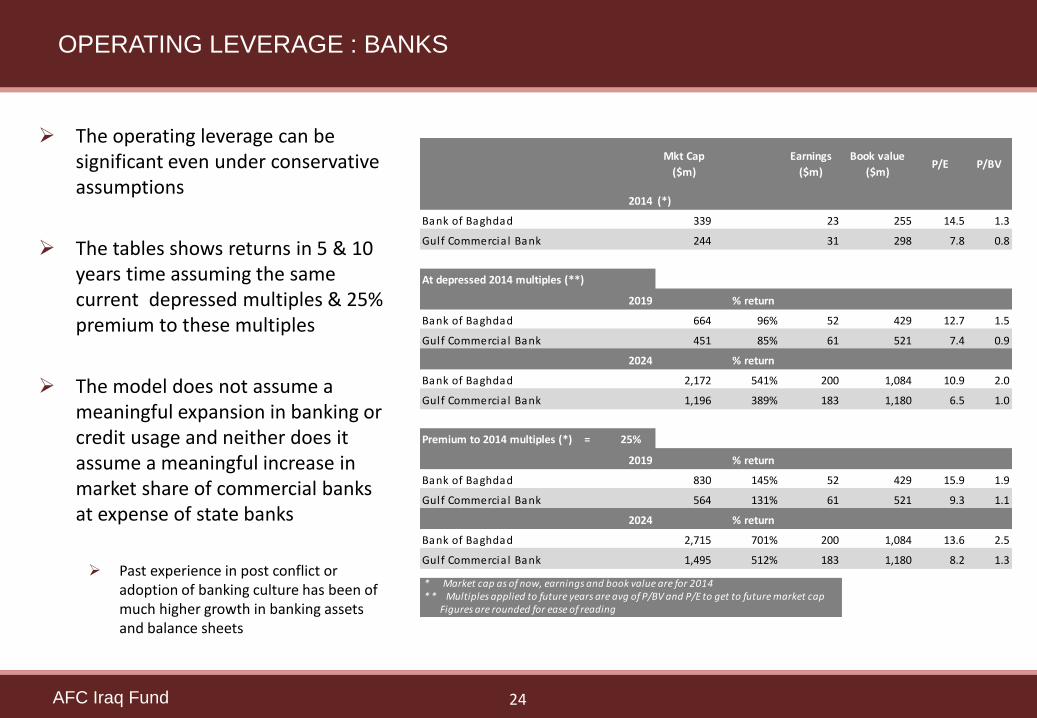
The operating leverage can be significant even under conservative assumptions
The tables shows returns in 5 & 10 years time assuming the same current depressed multiples & 25% premium to these multiples
The model does not assume a meaningful expansion in banking or credit usage and neither does it assume a meaningful increase in market share of commercial banks at expense of state banks
Past experience in post conflict or adoption of banking culture has been of much higher growth in banking assets and balance sheets
24AFC Iraq Fund
OPERATING LEVERAGE : BANKS
Mkt Cap
($m)
Earnings
($m)
Book value
($m)P/E P/BV
2014 (*)
Bank of Baghdad BBOB 339 23 255 14.5 1.3
Gulf Commercia l Bank BGUC 244 31 298 7.8 0.8
At depressed 2014 multiples (**)
2019 % return
Bank of Baghdad BBOB 664 96% 52 429 12.7 1.5
Gulf Commercia l Bank BGUC 451 85% 61 521 7.4 0.9
2024 % return
Bank of Baghdad BBOB 2,172 541% 200 1,084 10.9 2.0
Gulf Commercia l Bank BGUC 1,196 389% 183 1,180 6.5 1.0
Premium to 2014 multiples (*) = 25%
2019 % return
Bank of Baghdad BBOB 830 145% 52 429 15.9 1.9
Gulf Commercia l Bank BGUC 564 131% 61 521 9.3 1.1
2024 % return
Bank of Baghdad BBOB 2,715 701% 200 1,084 13.6 2.5
Gulf Commercia l Bank BGUC 1,495 512% 183 1,180 8.2 1.3
* Market cap as of now, earnings and book value are for 2014 * * Multiples applied to future years are avg of P/BV and P/E to get to future market cap Figures are rounded for ease of reading
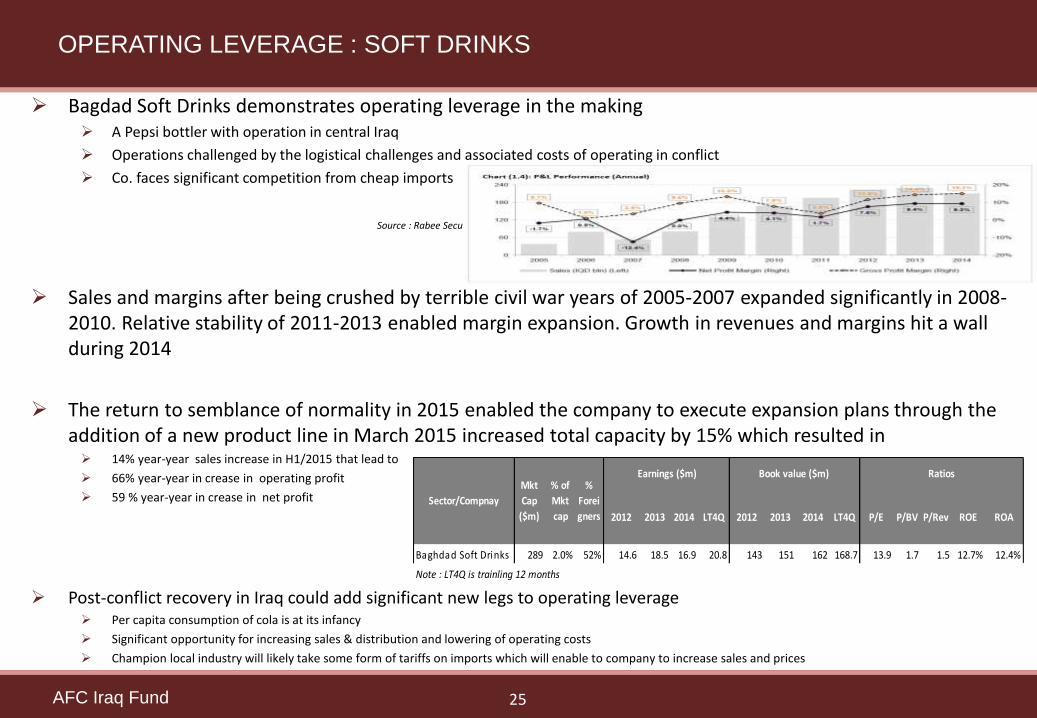
Bagdad Soft Drinks demonstrates operating leverage in the making A Pepsi bottler with operation in central Iraq
Operations challenged by the logistical challenges and associated costs of operating in conflict
Co. faces significant competition from cheap imports
Source : Rabee Securities research report
Sales and margins after being crushed by terrible civil war years of 2005-2007 expanded significantly in 2008-2010. Relative stability of 2011-2013 enabled margin expansion. Growth in revenues and margins hit a wall during 2014
The return to semblance of normality in 2015 enabled the company to execute expansion plans through the addition of a new product line in March 2015 increased total capacity by 15% which resulted in 14% year-year sales increase in H1/2015 that lead to
66% year-year in crease in operating profit
59 % year-year in crease in net profit
Post-conflict recovery in Iraq could add significant new legs to operating leverage Per capita consumption of cola is at its infancy
Significant opportunity for increasing sales & distribution and lowering of operating costs
Champion local industry will likely take some form of tariffs on imports which will enable to company to increase sales and prices
25AFC Iraq Fund
OPERATING LEVERAGE : SOFT DRINKS
2012 2013 2014 LT4Q 2012 2013 2014 LT4Q P/E P/BV P/Rev ROE ROA
Baghdad Soft Drinks 289 2.0% 52% 14.6 18.5 16.9 20.8 143 151 162 168.7 13.9 1.7 1.5 12.7% 12.4%
Note : LT4Q is trainling 12 months
Sector/Compnay
Mkt
Cap
($m)
% of
Mkt
cap
%
Forei
gners
Earnings ($m) Book value ($m) Ratios

Strategic oil supply to Asia esp. China China (22% of total), India (19%), South Korea (9%) and other Asian countries accounted for 58%
of Iraq’s average 2.6 million barrels/day of crude exports in 2014
For China this represented over 10% of its net oil imports. Its oil companies are active in the South + KRI & invest about $2 billion a year
Regional & International Companies Banks : Regional Banks in Kuwait, Qatar, Bahrain and Jordan as direct equity investments. Other
regionals and some internationals as branches
Telecoms : ZAIN, Ooredoo & France Telecom
World Bank and its investment arm the IFC World Bank : As of Feb 2014: 12 projects in infrastructure & private sector developments worth
about $870 million. In Apr 15 said would seek to finance reconstruction of liberated areas
IFC : As of Feb 2014: about $700 million, have taken forms of direct equity investments and/or loans. $112 million in 2013 in cement manufacturing, warehousing and logistics. In Apr 2015 said would step up investments to $100-130 million a year
26AFC Iraq Fund
FOREIGN DIRECT INVESTMENT HIGHLIGHTS
ABOUT ASIA FRONTIER CAPITAL

Our Team
Thomas Hugger, CEO and Fund Manager,has spent 27 years in private banking and hasbeen investing in Asian and African FrontierMarkets since 1993. He is the formerManaging Partner, CFO & COO of LeopardCapital; and was previously a ManagingDirector and Head of Portfolio Managementat LGT Bank in Hong Kong. Mr. Hugger wasthe founding shareholder of one of thelargest brokerage companies in Bangladesh.He is also a Certified Financial InvestmentAnalyst (CFIA) and Investment Adviser(Switzerland) and a Certified EuropeanFederation of Financial Analysts Societies(EFFAS) Financial Analyst.
Hon. Andrew Fraser, Director, is a graduate ofSt John's College, Oxford after which he heldnumerous posts in the financial sector both inthe City of London and elsewhere. He haspreviously held positions as; CEO of BaringSecurities in the UK, Chairman of EquityPartners Ltd., a Bangladesh investment bank,as well as Chairman of Bridge Securities, aquoted Korean company, amongst other posts.At present he is a global investor based inLondon.
Dr. Marc Faber, is CEO, investment advisor
and fund manager of Marc Faber Limited. He
is the publisher of a widely read monthly
investment newsletter The Gloom, Boom
and Doom report which highlights global
investment opportunities. Dr. Faber is
respected around the world for his market
forecasts over the past three decades.
28AFC Iraq Fund
SHAREHOLDERS OF ASIA FRONTIER CAPITAL LIMITED

Our Team
Ahmed Tabaqchali, CIO of AFC Iraq Fund, is an experienced Capital Markets professional with over 22 years experiences in US and MENA markets. Currently a board member of the Credit Bank of Iraq. He is a former Executive Director of NBK Capital, the investment banking arm of the National Bank of Kuwait as head of Brokerage.
Prior to that a Managing Director and Head of International Institutional Sales at WR Hambrecht + Co. based in London, New York and San Francisco. This followed on from roles as a Managing Director at KeyBanc in London charged with international sales, and before that Director & Head of Capital Markets & Institutional Sales at Jefferies Int’l in London. He started his career at Dean Witter Int’l in London.
Ahmed has an M. Sc. in Mathematics from Oxford University in the UK, a B.Sc. (Hons, 1st class) in Mathematics from Victoria University in New Zealand and a B.Sc. in Mathematics from Canterbury University in New Zealand. Ahmed is an Iraqi & a British national.
Thomas Hugger, Fund Manager and Founder of Asia Frontier Capital, has spent 27 years in private banking where he specialized in managing portfolios of listed and unlisted equities.
He has been investing in Asian and African Frontier Markets since 1993. He is the former Managing Partner, CFO & COO of Leopard Capital; and was previously a Managing Director and Head of Portfolio Management at LGT Bank in Hong Kong. He also held senior investment positions at Bank Julius Baer in Zurich and Hong Kong.
Mr. Hugger was the founding shareholder of one of the largest brokerage companies in Bangladesh. He is also a Certified Financial Investment Analyst (CFIA) and Investment Adviser (Switzerland) and a Certified European Federation of Financial Analysts Societies (EFFAS) Financial Analyst.
29AFC Iraq Fund
DIRECTORS OF ASIA FRONTIER CAPITAL (IRAQ) LIMITED
AFC IRAQ FUND DETAILS
30AFC Iraq Fund
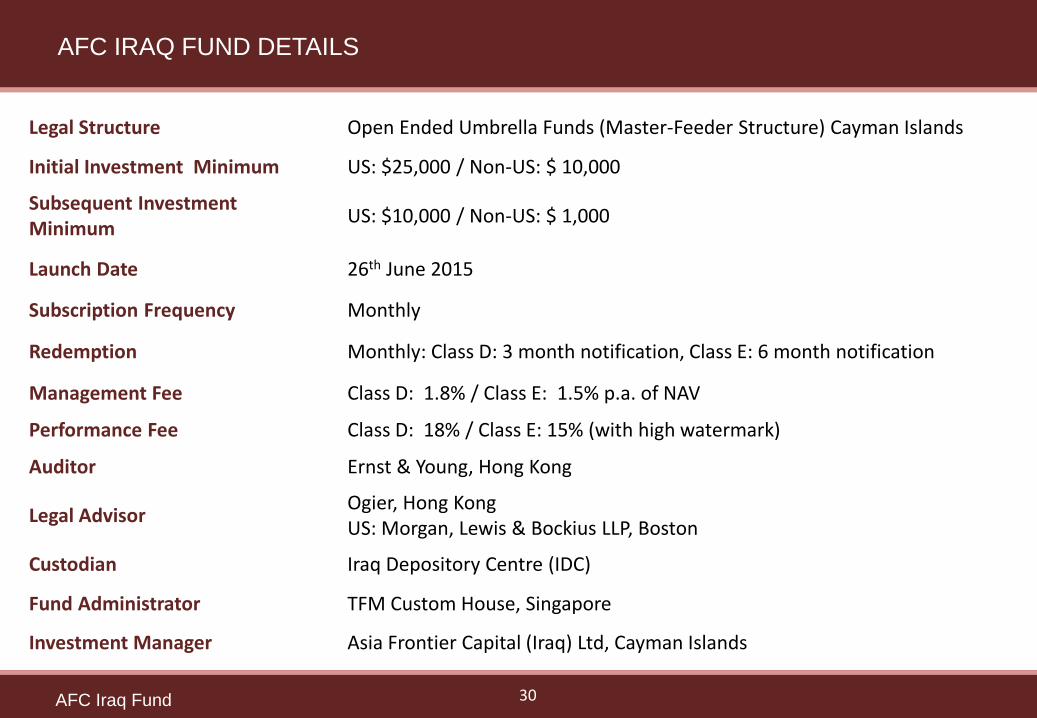
Legal Structure Open Ended Umbrella Funds (Master-Feeder Structure) Cayman Islands
Initial Investment Minimum US: $25,000 / Non-US: $ 10,000
Subsequent Investment Minimum
US: $10,000 / Non-US: $ 1,000
Launch Date 26th June 2015
Subscription Frequency Monthly
Redemption Monthly: Class D: 3 month notification, Class E: 6 month notification
Management Fee Class D: 1.8% / Class E: 1.5% p.a. of NAV
Performance Fee Class D: 18% / Class E: 15% (with high watermark)
Auditor Ernst & Young, Hong Kong
Legal AdvisorOgier, Hong KongUS: Morgan, Lewis & Bockius LLP, Boston
Custodian Iraq Depository Centre (IDC)
Fund Administrator TFM Custom House, Singapore
Investment Manager Asia Frontier Capital (Iraq) Ltd, Cayman Islands
31LEOPARD ASIA FRONTIER FUND
TERMS AND CONDITIONS
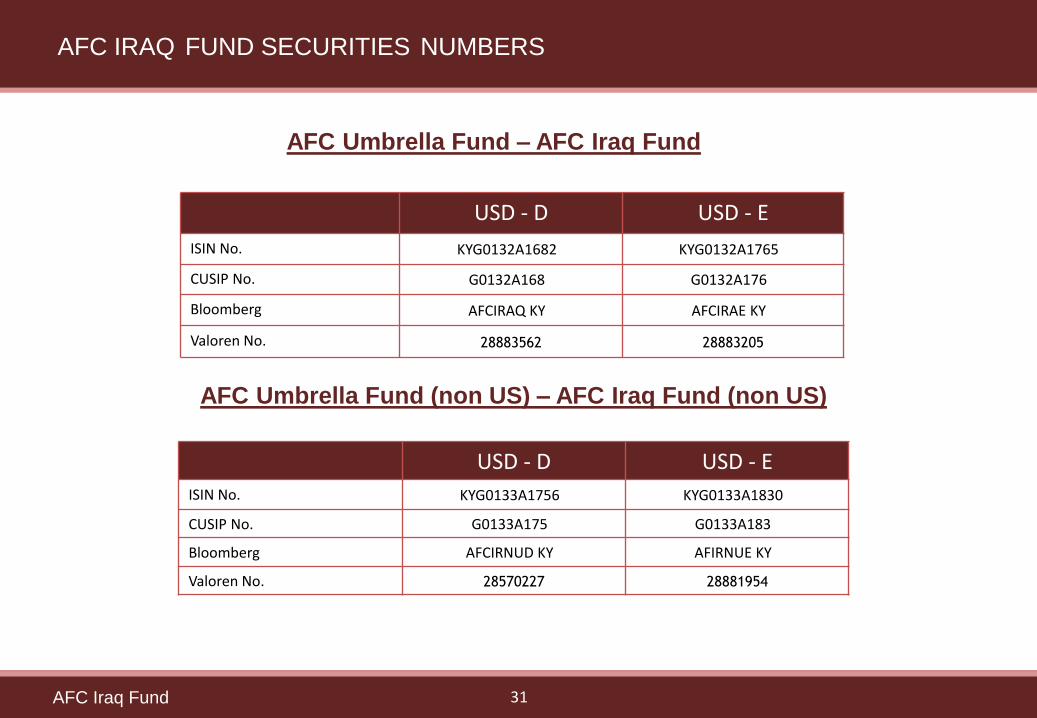
AFC Umbrella Fund – AFC Iraq Fund
AFC Umbrella Fund (non US) – AFC Iraq Fund (non US)
USD - D USD - E
ISIN No. KYG0132A1682 KYG0132A1765
CUSIP No. G0132A168 G0132A176
Bloomberg AFCIRAQ KY AFCIRAE KY
Valoren No. 28883562 28883205
USD - D USD - E
ISIN No. KYG0133A1756 KYG0133A1830
CUSIP No. G0133A175 G0133A183
Bloomberg AFCIRNUD KY AFIRNUE KY
Valoren No. 28570227 28881954
AFC IRAQ FUND SECURITIES NUMBERS
AFC Iraq Fund 31

ASIA FRONTIER CAPITAL (IRAQ) LTD.
c/o Elian Fiduciary Services (Cayman) Ltd.89 Nexus WayCamana BayGrand Cayman KY1-9007Cayman IslandsTel: +852 3904 1015Fax: +852 3904 1017
Investment Enquiries:
Email: [email protected]
32AFC Iraq Fund
CONTACT INFORMATION

APPENDICES
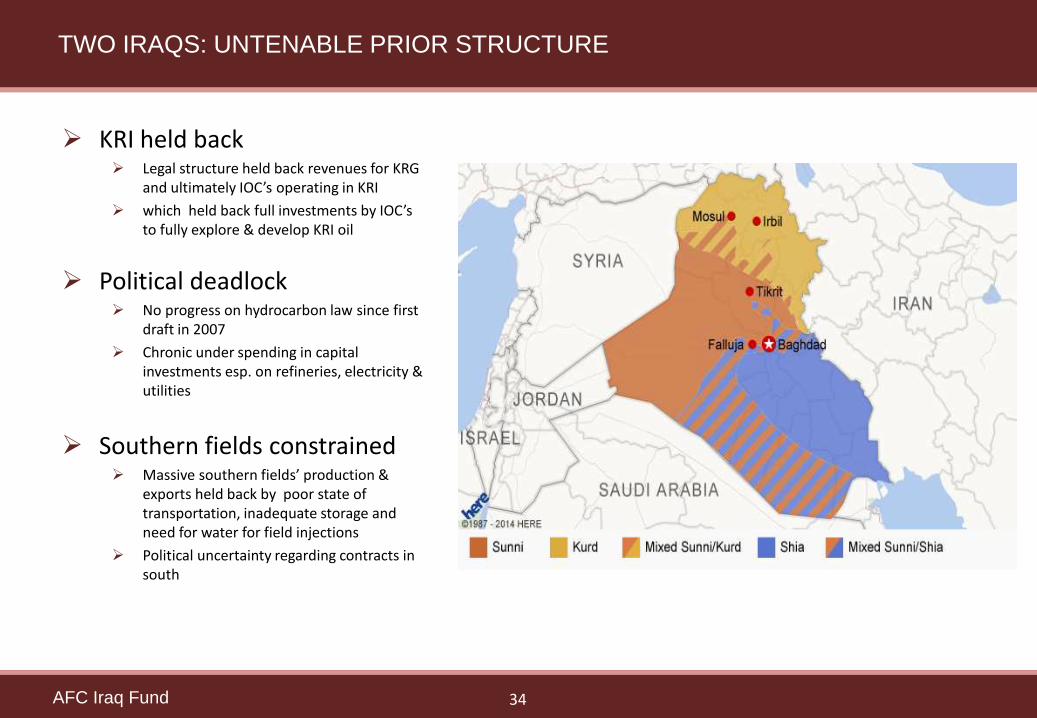
KRI held back Legal structure held back revenues for KRG
and ultimately IOC’s operating in KRI
which held back full investments by IOC’s to fully explore & develop KRI oil
Political deadlock No progress on hydrocarbon law since first
draft in 2007
Chronic under spending in capital investments esp. on refineries, electricity & utilities
Southern fields constrained Massive southern fields’ production &
exports held back by poor state of transportation, inadequate storage and need for water for field injections
Political uncertainty regarding contracts in south
34AFC Iraq Fund
TWO IRAQS: UNTENABLE PRIOR STRUCTURE
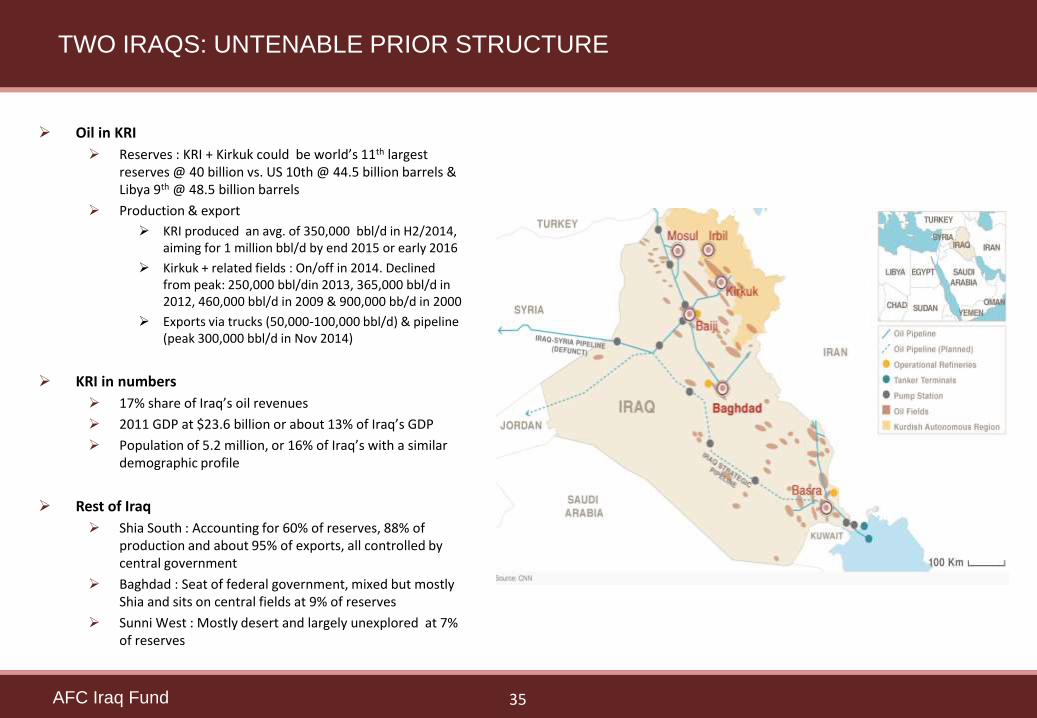
Oil in KRI
Reserves : KRI + Kirkuk could be world’s 11th largest reserves @ 40 billion vs. US 10th @ 44.5 billion barrels & Libya 9th @ 48.5 billion barrels
Production & export
KRI produced an avg. of 350,000 bbl/d in H2/2014, aiming for 1 million bbl/d by end 2015 or early 2016
Kirkuk + related fields : On/off in 2014. Declined from peak: 250,000 bbl/din 2013, 365,000 bbl/d in 2012, 460,000 bbl/d in 2009 & 900,000 bb/d in 2000
Exports via trucks (50,000-100,000 bbl/d) & pipeline (peak 300,000 bbl/d in Nov 2014)
KRI in numbers
17% share of Iraq’s oil revenues
2011 GDP at $23.6 billion or about 13% of Iraq’s GDP
Population of 5.2 million, or 16% of Iraq’s with a similar demographic profile
Rest of Iraq
Shia South : Accounting for 60% of reserves, 88% of production and about 95% of exports, all controlled by central government
Baghdad : Seat of federal government, mixed but mostly Shia and sits on central fields at 9% of reserves
Sunni West : Mostly desert and largely unexplored at 7% of reserves
35AFC Iraq Fund
TWO IRAQS: UNTENABLE PRIOR STRUCTURE

Thesis
KRI’s autonomy in signing oil contracts, freedom to export within federal framework & ultimately control of finances
Taking place within and speeding the trend of a decentralized federal Iraq as part of the post-Maliki power sharing deal
Sunni tribes are the core of the solution for the removal of ISIS from Iraq just as in the “awaking movement” of 2007. However, unlike in 2007 the price will be greater autonomy
Emerging Federal Iraq
An autonomous KRI
Federal government in Baghdad
Semi-autonomous/highly devolved regions : Sunni in the west, Shia in the south, + likely mixed Sunni/Shia in south-west
Major investment implications
Full investment in the KRI by IOC’s and accelerating investments across the economy
Fast and expedited spending in the devastated & ignored Sunni and Sunni/Shia areas esp. areas liberated from ISIS
Continued growth in southern fields and accelerated cap. ex. spending to develop supporting infrastructure
36AFC Iraq Fund
TWO IRAQS: EMERGING NEW STRUCTURE
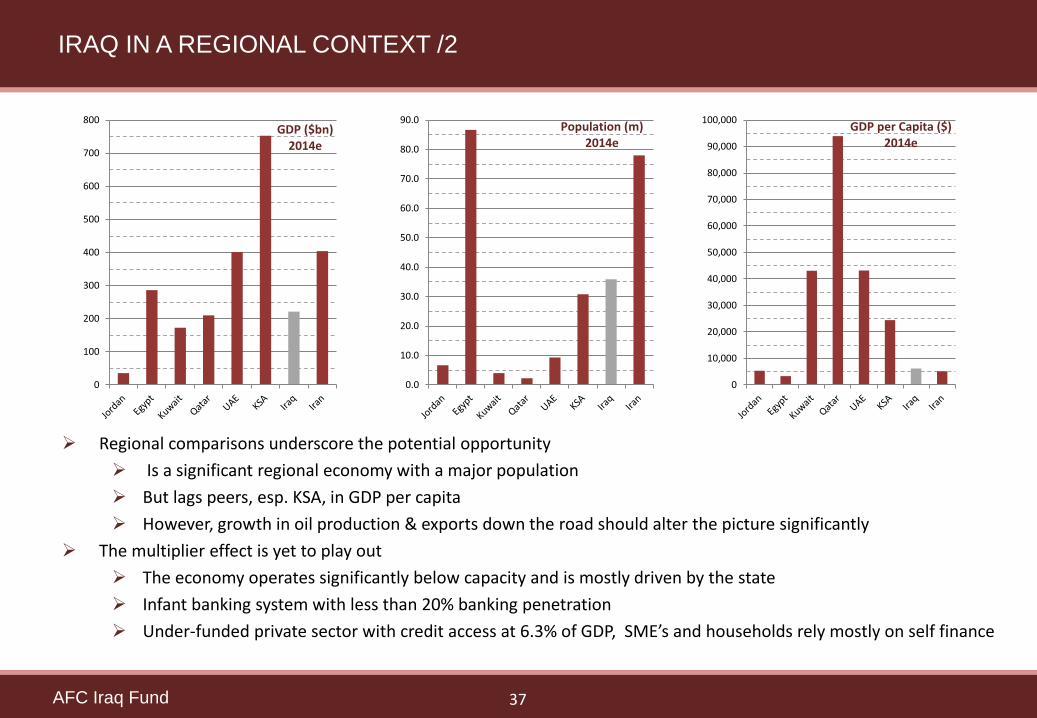
Regional comparisons underscore the potential opportunity
Is a significant regional economy with a major population
But lags peers, esp. KSA, in GDP per capita
However, growth in oil production & exports down the road should alter the picture significantly
The multiplier effect is yet to play out
The economy operates significantly below capacity and is mostly driven by the state
Infant banking system with less than 20% banking penetration
Under-funded private sector with credit access at 6.3% of GDP, SME’s and households rely mostly on self finance
37AFC Iraq Fund
IRAQ IN A REGIONAL CONTEXT /2
0
100
200
300
400
500
600
700
800GDP ($bn)
2014e
0.0
10.0
20.0
30.0
40.0
50.0
60.0
70.0
80.0
90.0Population (m)
2014e
0
10,000
20,000
30,000
40,000
50,000
60,000
70,000
80,000
90,000
100,000GDP per Capita ($)
2014e

Financial sector depth severely lags MENA in aggregate and components of MENA, i.e. GCC & non-GCC, on multiple fronts Banking
Stock market
Other financial services
Banking penetration for private sector as percentage of GDP:- Deposits at 9% of GDP vs. 75% for MENA ( GCC at 70% & non-GCC at 80%)
Credit at 6.3% of GDP vs. 55% for MENA (GCC at 70% & non-GCC at 40%)
Credit to deposit ratio at 60% vs. 65% for MENA (GCC at 100% & non-GCC at 50%)
But this is misleading due to special cases, select banks at 24% ratio
Stock market role in the economy Market capitalization as percent of GDP < 3% vs. 57% for MENA ( GCC at 67% and non-GCC at 33%)
Stock market turnover as percent of GDP < 1% vs. 45% for MENA (GCC at 50% & non-GCC at 35%)
However, like MENA and especially the GCC the stock market is not representative of the economy
38AFC Iraq Fund
A CASH ECONOMY

39AFC Iraq Fund
A RUSSIAN PARALLEL: 1999 – 2009

DISCLAIMER
40
This Presentation is presented solely for purposes of discussion to assist prospective investors in determining whether they have a preliminary interest in the investment opportunity described herein. Under no circumstances is it to beused or considered as an offer to sell, or a solicitation of an offer to buy, any security or other interest in AFC Iraq Fund, AFC Vietnam Fund, AFC Asia Frontier Fund, AFC Umbrella Fund or any other fund related thereto (the “Fund”).Offers and sales of interests in the Fund will not be registered under the laws of any jurisdiction and will be made solely to qualified investors under all applicable laws. Potential investors must read the entire Offering Memorandumdelivered by the Fund and the disclosure in this Subscription Agreement. Nothing contained herein shall be deemed to be binding against, or to create any obligations or commitment on the part of, any potential investor or the AsiaFrontier Capital (the “Fund Sponsors”). The Fund Sponsors reserve the right, in their sole and absolute discretion with or without notice, to alter the terms or conditions of this Presentation and the Fund and/or to alter or terminate thepotential investment opportunity described herein. Potential investors are not to construe this Presentation as investment, legal or tax advice. Prior to making any potential investment, potential investors should consult with their ownlegal, investment, accounting, regulatory, tax and other advisors to determine the consequences of the potential investment opportunity described herein and to arrive at an independent evaluation of such potential investmentopportunity.
By accepting this Presentation, the recipient agrees not to copy, distribute, discuss or otherwise disclose this Presentation or the contents hereof (including the potential investment opportunity described) or any other relatedinformation provided by the Fund Sponsors or by its agents to any person other than employees of recipient evaluating this potential investment opportunity on recipient’s behalf without the prior written consent of the Fund Sponsors.
While the information contained herein has been obtained from various sources which the Fund Sponsors believe, but does not guarantee, to be reliable, the Fund Sponsors do not represent that it is accurate or complete and it shouldnot be relied upon as such. No person has been authorized to give any information or make any representation or warranty regarding the subject matter hereof, either express or implied, and, if given or made in this Presentation, inother materials or verbally, such information, representation or warranty cannot and should not be relied upon nor is any representation or warranty made as to the accuracy, content, suitability or completeness of the information,analysis or conclusions or any information furnished in connection herewith contained in this Presentation and it is not to be relied upon as a substitute for independent review of the underlying documents, available due diligenceinformation and such other information as prospective investors may deem appropriate or prudent to review. The Fund Sponsors, their agents, their respective affiliates, and each of their respective shareholders, members, officers,directors, managers, employees, counsel, advisors, consultants and agents (“Representatives”), expressly disclaim any and all liability for express or implied representations or warranties that may be contained in, or for omissions fromor inaccuracies in, this Presentation or any other oral or written communication transmitted or made available to a prospective investor or its Representatives. Without limiting the generality of the foregoing, nothing contained herein isor shall be relied upon as a promise or representation as to any matter, including, without limitation, the future performance of the potential investment opportunity described herein. None of the Fund Sponsors, their agents, or theirrespective Representatives is under any obligation to correct any inaccuracies or omissions in this Presentation. Each prospective investor will have the sole responsibility for verifying the accuracy of all information furnished in thisPresentation and in any other due diligence information furnished to a prospective investor, and each prospective investor shall have the sole responsibility for determining the value of the potential investment based on assumptionssaid prospective investor believes to be reasonable. Representatives will from time to time have long or short positions in, act as principal in, and buy or sell, the securities, referred to in this document. There shall be no recourse againstthe Fund Sponsors or any of their Representatives in the event of any errors or omissions in the information furnished, the methodology used, the calculations of values or conclusions. Without limiting the generality of the foregoing,any historical information or information based on past performance included herein is for informational purposes only, has inherent limitations and is not intended to be a representation, warranty or guarantee of future performance.All of the information presented herein is subject to change without notice. Actual returns to potential investors may be lower than the figures shown herein. Projected performance data shown constitutes “forward-lookinginformation” which is based on numerous assumptions and is speculative in nature. Actual results may vary significantly from the values and rates of return projected herein. There can no assurance that the Fund will realize its rate ofreturn objectives or return of investors’ capital. Potential investors should have the financial ability and willingness to accept the risks (including without limitation the risk of loss and lack of liquidity) characteristic of investments inentities such as the Fund.
AN INVESTMENT IN THE FUND WILL NOT BE APPROPRIATE FOR ALL INVESTORS. INTERESTS IN THE FUND WILL INVOLVE A HIGH DEGREE OF RISK AND ARE INTENDED FOR SALE ONLY TO SOPHISTICATED INVESTORS WHO ARE CAPABLE OFUNDERSTANDING AND ASSUMING THE RISKS INVOLVED. INVESTORS MAY LOSE ALL OR SUBSTANTIALLY ALL OF THEIR INVESTMENT.
THE INTERESTS IN THE FUND HAVE NOT BEEN REGISTERED UNDER THE U.S. SECURITIES ACT OF 1933, AS AMENDED (THE “SECURITIES ACT”), OR THE APPLICABLE SECURITIES LAWS OF ANY US. STATE OR ANY NON-U.S. JURISDICTION, ANDARE BEING OFFERED AND SOLD IN RELIANCE ON EXEMPTIONS FROM THE REGISTRATION REQUIREMENTS OF THE SECURITIES ACT AND ANY SUCH APPLICABLE LAWS. INTERESTS IN THE FUND HAVE NOT BEEN APPROVED OR DISAPPROVEDBY THE US. SECURITIES AND EXCHANGE COMMISSION OR BY THE SECURITIES REGULATORY AUTHORITY OF ANY STATE OR ANY OTHER RELEVANT JURISDICTION, NOR HAS ANY OTHER AUTHORITY OR COMMISSION PASSED UPON THEACCURACY OR ADEQUACY OF THIS MEMORANDUM. ANY REPRESENTATION TO THE CONTRARY IS UNLAWFUL.
* The representative of the AFC Iraq Fund (non-US) in Switzerland is Hugo Fund Services SA, 6 Cours de Rive, 1204 Geneva. The distribution of Shares in Switzerland must exclusively be made to qualified investors. The place ofperformance and jurisdiction for Shares in the Fund distributed in Switzerland are at the registered office of the representative.
** By accessing information contained herein, users are deemed to be representing and warranting that they are either a Hong Kong Professional Investor or are observing the applicable laws and regulations of their relevantjurisdictions.