asia insights the long climb back apr-1
TRANSCRIPT
7/31/2019 Asia Insights the Long Climb Back Apr-1
http://slidepdf.com/reader/full/asia-insights-the-long-climb-back-apr-1 1/82
abcGlobal Research
Macro data and newsflow are likely to improve over the next few months. Economic
indicators such as exports are showing the first signs of bottoming and lead indicators –
notably the US manufacturing ISM – point to them improving further. Asian equities
should continue to benefit from this. But, after a 24% rally in the past few weeks, some of
this is already priced in. What may not be priced in yet is that analysts’ and economists’
forecasts for 2009, and analysts’ stock recommendations, are very cautious. The
momentum of these is likely to turn up – which could give a further boost to stocks.
It is too early to say whether this is just a bear market rally, or whether stocks have found
a bottom. It doesn’t matter much. Nasty bear markets in history have often seen 50%
rallies; the first leg-up after a bear market ends is typically about the same. This suggests
that for now, there is more upside than downside risk for equities. But it is true that the
upside is easier to foresee than the downside. Too many problems lurk out there to make
us confident that this is the start of a new sustainable bull market. The most likely
scenario is that the economy will double-dip and equities will face a rough period again
later in the year. We continue to believe that Asian equities will end this year ±10% from
their level at the beginning – in the first three months of the year they were flat.
How to play this as an investor? Our recommendation (not so different to last quarter) is
to take some exposure to the cyclical pick-up while minimising other risks. We increase
slightly our weightings in cyclical sectors: we are overweight industrials and energy and
raise consumer discretionary, IT and financials to neutral. We go underweight expensive
defensive sectors like utilities, healthcare and telecoms. Most of all, we recommend a
portfolio of cyclical blue-chip stocks – although, admittedly, it is harder to choose these
after the recent run-up. We also suggest some names for a higher-beta punchy portfolio.
Among markets, we would take our cyclical exposure in Taiwan (which we raise to
overweight) and Singapore. We prefer these to Japan and Korea: Singapore is structurally
safer; Taiwan has the advantage of improving cross-Strait relations. We lower China to
neutral after its 50% rise since October and because we see no further short-term catalysts.
We prefer India (we stay overweight), where growth will pick up later this year and which
will offer an attractive investment opportunity once the general election is out of the way.
Second Quarter 2009
Asia Insights Quarterly
The long climb back
Improving macro data and newsflow mean that equities
could remain buoyant for a while longer
But structural problems in the global economy have not gone
away, so this is unlikely to turn into a sustainable bull market
We recommend taking cyclical exposure but minimising otherrisks: we like Singapore, India, Taiwan and cyclical blue-chips
Garry Evans*
Strategist
The Hongkong and Shanghai Banking
Corporation Limited
+852 2996 6916
View HSBC Global Research at:http://www.research.hsbc.com
*Employed by a non-US affiliate ofHSBC Securities (USA) Inc, and is notregistered/qualified pursuant to NYSEand/or NASD regulations
ssuer of report: The Hongkong andShanghai BankingCorporation Limited
Disclaimer &Disclosures
This report must be readwith the disclosures andthe analyst certifications inthe Disclosure appendix,and with the Disclaimer,which forms part of it
Equity Strategy
Pan-Asia
7/31/2019 Asia Insights the Long Climb Back Apr-1
http://slidepdf.com/reader/full/asia-insights-the-long-climb-back-apr-1 2/82
2
Equity Strategy
Pan-Asia
Second Quarter 2009
abc
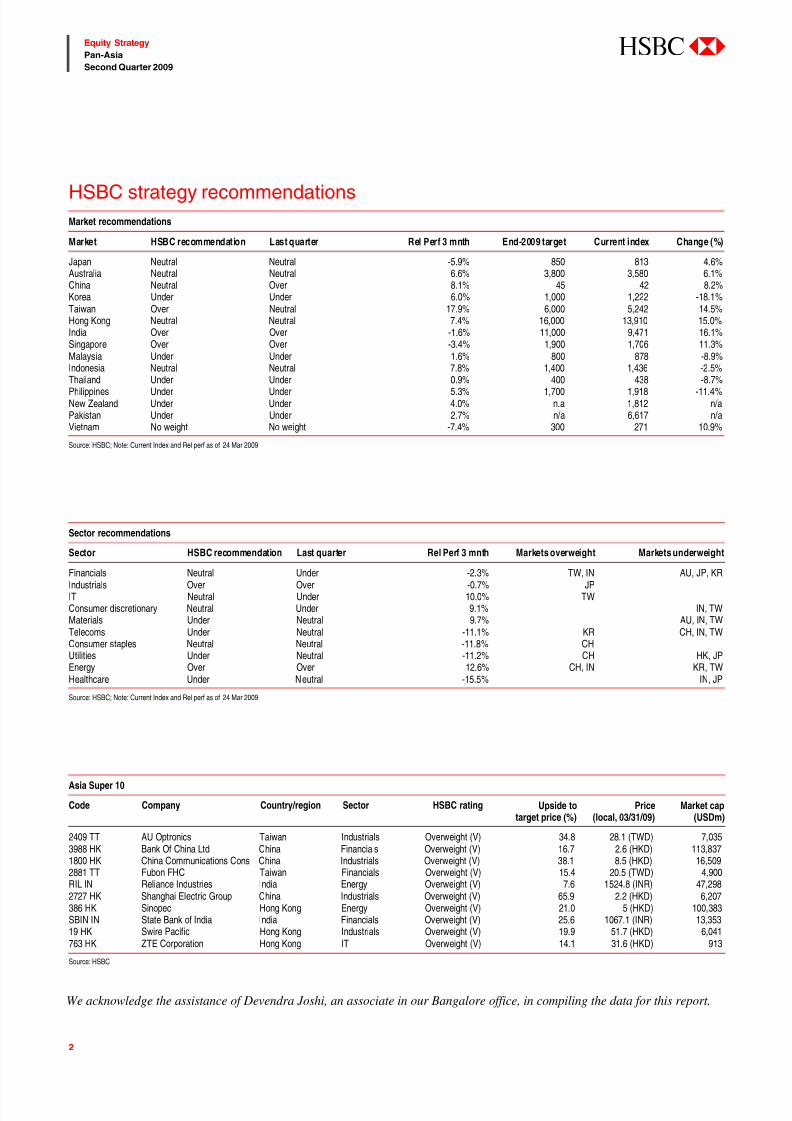
HSBC strategy recommendationsMarket recommendations
Market HSBC recommendation Last quarter Rel Perf 3 mnth End-2009 target Current index Change (%)
Japan Neutral Neutral -5.9% 850 813 4.6%Australia Neutral Neutral 6.6% 3,800 3,580 6.1%China Neutral Over 8.1% 45 42 8.2%Korea Under Under 6.0% 1,000 1,222 -18.1%Taiwan Over Neutral 17.9% 6,000 5,242 14.5%Hong Kong Neutral Neutral 7.4% 16,000 13,910 15.0%India Over Over -1.6% 11,000 9,471 16.1%Singapore Over Over -3.4% 1,900 1,706 11.3%Malaysia Under Under 1.6% 800 878 -8.9%Indonesia Neutral Neutral 7.8% 1,400 1,436 -2.5%
Thailand Under Under 0.9% 400 438 -8.7%Philippines Under Under 5.3% 1,700 1,918 -11.4%New Zealand Under Under 4.0% n.a 1,812 n/aPakistan Under Under 2.7% n/a 6,617 n/aVietnam No weight No weight -7.4% 300 271 10.9%
Source: HSBC; Note: Current Index and Rel perf as of 24 Mar 2009
Sector recommendations
Sector HSBC recommendation Last quarter Rel Perf 3 mnth Markets overweight Markets underweight
Financials Neutral Under -2.3% TW, IN AU, JP, KRIndustrials Over Over -0.7% JPIT Neutral Under 10.0% TWConsumer discretionary Neutral Under 9.1% IN, TWMaterials Under Neutral 9.7% AU, IN, TWTelecoms Under Neutral -11.1% KR CH, IN, TWConsumer staples Neutral Neutral -11.8% CHUtilities Under Neutral -11.2% CH HK, JPEnergy Over Over 12.6% CH, IN KR, TWHealthcare Under Neutral -15.5% IN, JP
Source: HSBC; Note: Current Index and Rel perf as of 24 Mar 2009
Asia Super 10
Code Company Country/region Sector HSBC rating Upside totarget price (%)
Price(local, 03/31/09)
Market cap(USDm)
2409 TT AU Optronics Taiwan Industrials Overweight (V) 34.8 28.1 (TWD) 7,0353988 HK Bank Of China Ltd China Financials Overweight (V) 16.7 2.6 (HKD) 113,8371800 HK China Communications Cons China Industrials Overweight (V) 38.1 8.5 (HKD) 16,5092881 TT Fubon FHC Taiwan Financials Overweight (V) 15.4 20.5 (TWD) 4,900RIL IN Reliance Industries India Energy Overweight (V) 7.6 1524.8 (INR) 47,2982727 HK Shanghai Electric Group China Industrials Overweight (V) 65.9 2.2 (HKD) 6,207386 HK Sinopec Hong Kong Energy Overweight (V) 21.0 5 (HKD) 100,383SBIN IN State Bank of India India Financials Overweight (V) 25.6 1067.1 (INR) 13,35319 HK Swire Pacific Hong Kong Industrials Overweight (V) 19.9 51.7 (HKD) 6,041763 HK ZTE Corporation Hong Kong IT Overweight (V) 14.1 31.6 (HKD) 913
Source: HSBC
We acknowledge the assistance of Devendra Joshi, an associate in our Bangalore office, in compiling the data for this report.
7/31/2019 Asia Insights the Long Climb Back Apr-1
http://slidepdf.com/reader/full/asia-insights-the-long-climb-back-apr-1 3/82
3
Equity Strategy
Pan-Asia
Second Quarter 2009
abc
Investment strategy 4
The long climb back 4
Market recommendations 16 Cyclical exposure… 16
Sector recommendations/ investment themes 21
Stick to quality cyclicals 21
Main markets 25
Japan (neutral) 26
China (neutral) & Hong Kong (neutral) 28 Korea (underweight) 32
Taiwan (overweight) 34
India (overweight) 36
Other markets 39
Australia 40
Singapore 41
Malaysia 42
Indonesia 43
Thailand 44 Philippines 45
Datapack 46
Country/ Sector performance 46
Earnings 48
Valuation 49
Supply & demand 50
Politics and risk 51
Sectors and stocks 52
Economic forecasts 56
Top stock picks 57
AU Optronics, 2409 58
Bank of China, 3988 59
China Agri, 606 60 China BlueChemical, 3983 61
CCC, 1800 62
Chinatrust, 2891 63
CIIH, 966 64
Fubon, 2881 65
Innolux Display, 3481 66
Maanshan, 323 67
Pacific Basin, 2343 68
Punjab National Bank, PNB 69
Reliance Industries, RELI 70 Shanghai Electric, 2727 71
Siliconware Precision, 2325 72
Sinopec, 386 73
Sinotrans, 598 74
State Bank of India, SBIN 75
Swire Pacific ‘A’, 19 76
ZTE, 0763 77
Disclosure appendix 78
Disclaimer 81
Contents
7/31/2019 Asia Insights the Long Climb Back Apr-1
http://slidepdf.com/reader/full/asia-insights-the-long-climb-back-apr-1 4/82
4
Equity Strategy
Pan-Asia
Second Quarter 2009
abc
The long climb back
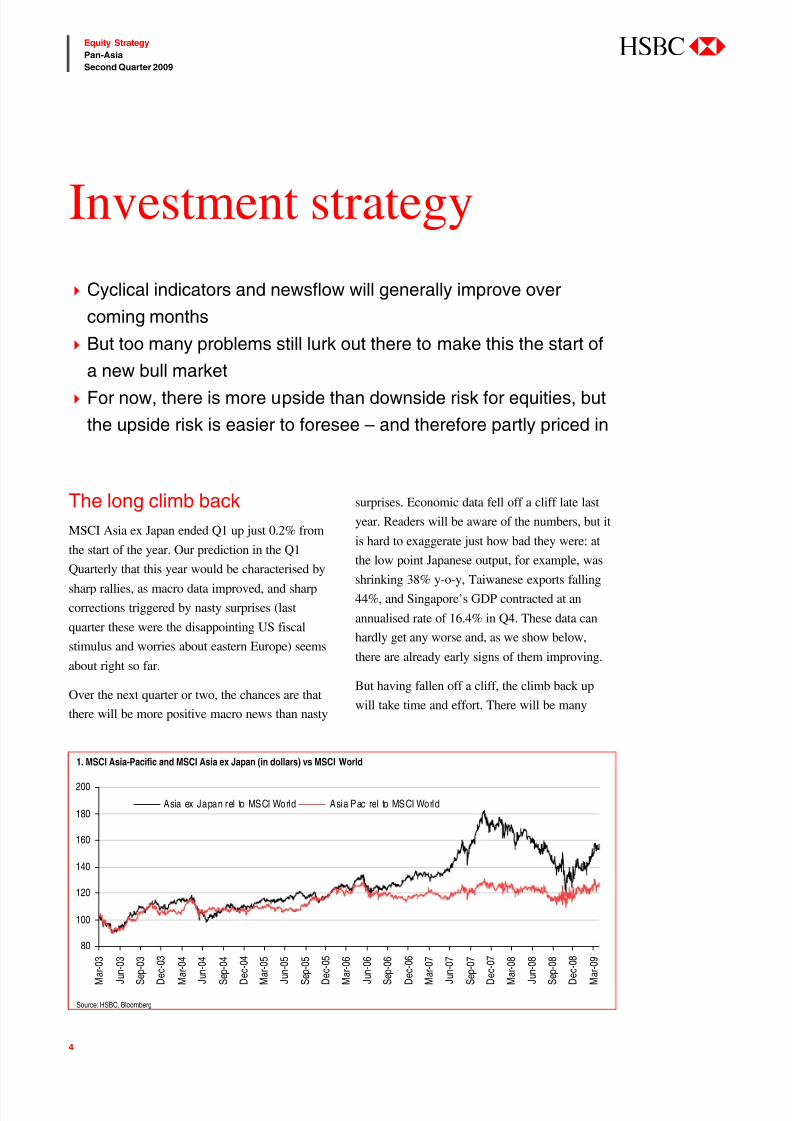
MSCI Asia ex Japan ended Q1 up just 0.2% from
the start of the year. Our prediction in the Q1
Quarterly that this year would be characterised bysharp rallies, as macro data improved, and sharp
corrections triggered by nasty surprises (last
quarter these were the disappointing US fiscal
stimulus and worries about eastern Europe) seems
about right so far.
Over the next quarter or two, the chances are that
there will be more positive macro news than nasty
surprises. Economic data fell off a cliff late last
year. Readers will be aware of the numbers, but it
is hard to exaggerate just how bad they were: at
the low point Japanese output, for example, was
shrinking 38% y-o-y, Taiwanese exports falling
44%, and Singapore’s GDP contracted at an
annualised rate of 16.4% in Q4. These data can
hardly get any worse and, as we show below,
there are already early signs of them improving.
But having fallen off a cliff, the climb back up
will take time and effort. There will be many
Investment strategy
Cyclical indicators and newsflow will generally improve over
coming months
But too many problems still lurk out there to make this the start of
a new bull market
For now, there is more upside than downside risk for equities, but
the upside risk is easier to foresee – and therefore partly priced in
1. MSCI Asia-Pacific and MSCI Asia ex Japan (in dollars) vs MSCI World
80
100
120
140
160
180
200
M a r - 0 3
J u n - 0 3
S e p - 0 3
D e c - 0 3
M a r - 0 4
J u n - 0 4
S e p - 0 4
D e c - 0 4
M a r - 0 5
J u n - 0 5
S e p - 0 5
D e c - 0 5
M a r - 0 6
J u n - 0 6
S e p - 0 6
D e c - 0 6
M a r - 0 7
J u n - 0 7
S e p - 0 7
D e c - 0 7
M a r - 0 8
J u n - 0 8
S e p - 0 8
D e c - 0 8
M a r - 0 9
Asia ex Japan rel to MSCI World Asia Pac rel to MSCI World
Source: HSBC, Bloomberg
7/31/2019 Asia Insights the Long Climb Back Apr-1
http://slidepdf.com/reader/full/asia-insights-the-long-climb-back-apr-1 5/82
5
Equity Strategy
Pan-Asia
Second Quarter 2009
abc
dangerous potholes and precipices along the way.
The US banking system is far from fixed. Over
the next year or two, we would not be surprised to
see some big companies file for bankruptcy and
defaults by sovereign borrowers. The global
recovery is likely to falter, since US consumer
spending will probably be weak for some time as
households repair balance sheets. The side-effects
of massive fiscal stimulus and quantitative
monetary easing are hard to forecast (but could
include nasties such as inflation and
uncomfortably high government debt).
In our view, these impediments mean we are
unlikely to enter a new bull market soon – in the
sense of a sustained multi-year run-up in equity
prices. The market is more likely to be
characterised by sharp ups and downs for some
time to come.
Bear bottoms
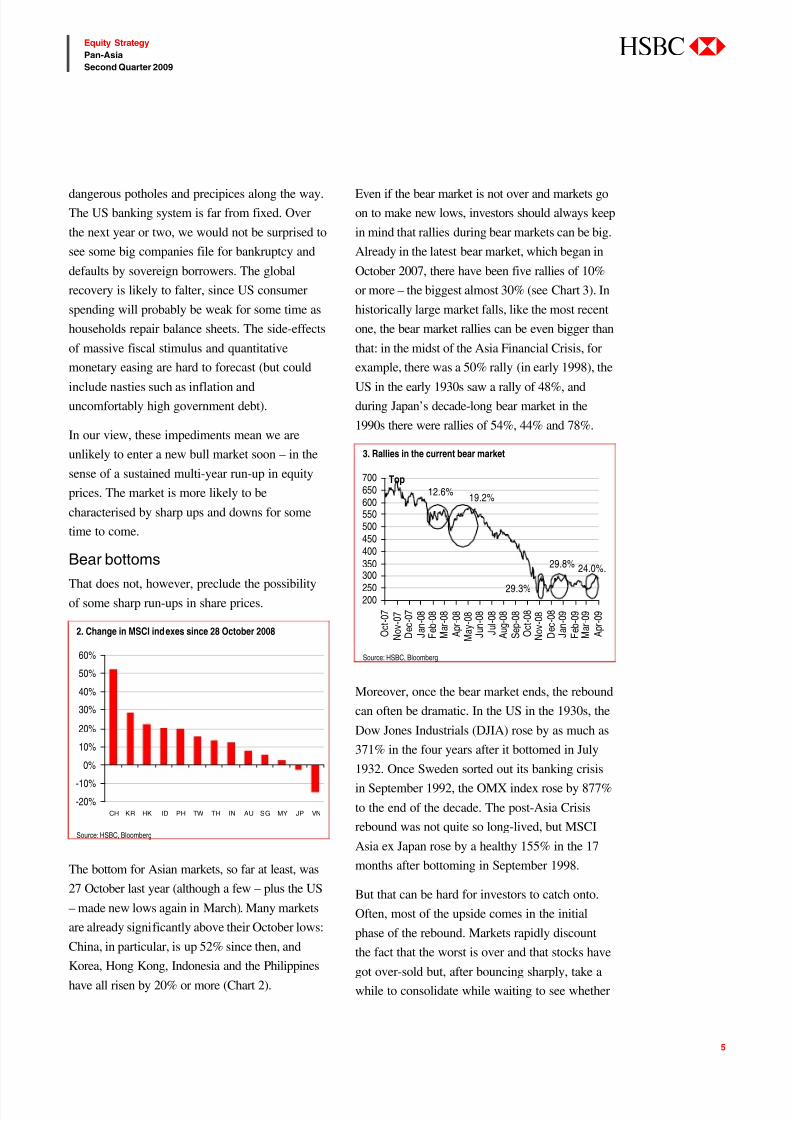
That does not, however, preclude the possibility
of some sharp run-ups in share prices.
2. Change in MSCI indexes since 28 October 2008
-20%
-10%
0%
10%
20%
30%
40%
50%
60%
CH KR HK ID PH TW TH IN AU SG MY JP VN
Source: HSBC, Bloomberg
The bottom for Asian markets, so far at least, was
27 October last year (although a few – plus the US
– made new lows again in March). Many markets
are already significantly above their October lows:
China, in particular, is up 52% since then, and
Korea, Hong Kong, Indonesia and the Philippines
have all risen by 20% or more (Chart 2).
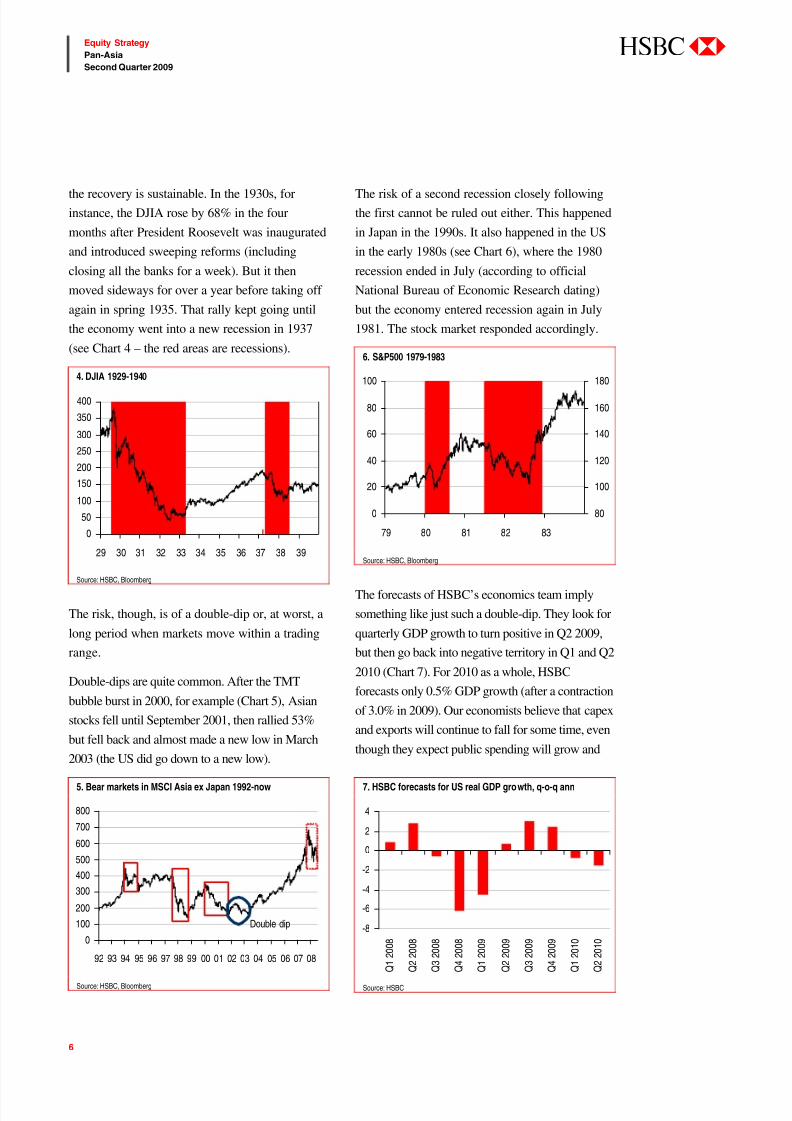
Even if the bear market is not over and markets go
on to make new lows, investors should always keep
in mind that rallies during bear markets can be big.
Already in the latest bear market, which began in
October 2007, there have been five rallies of 10%
or more – the biggest almost 30% (see Chart 3). In
historically large market falls, like the most recent
one, the bear market rallies can be even bigger than
that: in the midst of the Asia Financial Crisis, for
example, there was a 50% rally (in early 1998), the
US in the early 1930s saw a rally of 48%, and
during Japan’s decade-long bear market in the
1990s there were rallies of 54%, 44% and 78%.
3. Rallies in the current bear market
200250300
350
400450500550600650700
O c t - 0 7
N o v - 0 7
D e c - 0 7
J a n - 0 8
F e b - 0 8
M a r - 0 8
A p r - 0 8
M a y - 0 8
J u n - 0 8
J u l - 0 8
A u g - 0 8
S e p - 0 8
O c t - 0 8
N o v - 0 8
D e c - 0 8
J a n - 0 9
F e b - 0 9
M a r - 0 9
A p r - 0 9
Top
19.2%12.6%
29.3%
29.8%
24.0%.
Source: HSBC, Bloomberg
Moreover, once the bear market ends, the rebound
can often be dramatic. In the US in the 1930s, the
Dow Jones Industrials (DJIA) rose by as much as
371% in the four years after it bottomed in July
1932. Once Sweden sorted out its banking crisis
in September 1992, the OMX index rose by 877%
to the end of the decade. The post-Asia Crisis
rebound was not quite so long-lived, but MSCI
Asia ex Japan rose by a healthy 155% in the 17
months after bottoming in September 1998.
But that can be hard for investors to catch onto.
Often, most of the upside comes in the initial
phase of the rebound. Markets rapidly discount
the fact that the worst is over and that stocks havegot over-sold but, after bouncing sharply, take a
while to consolidate while waiting to see whether
7/31/2019 Asia Insights the Long Climb Back Apr-1
http://slidepdf.com/reader/full/asia-insights-the-long-climb-back-apr-1 6/82
6
Equity Strategy
Pan-Asia
Second Quarter 2009
abc
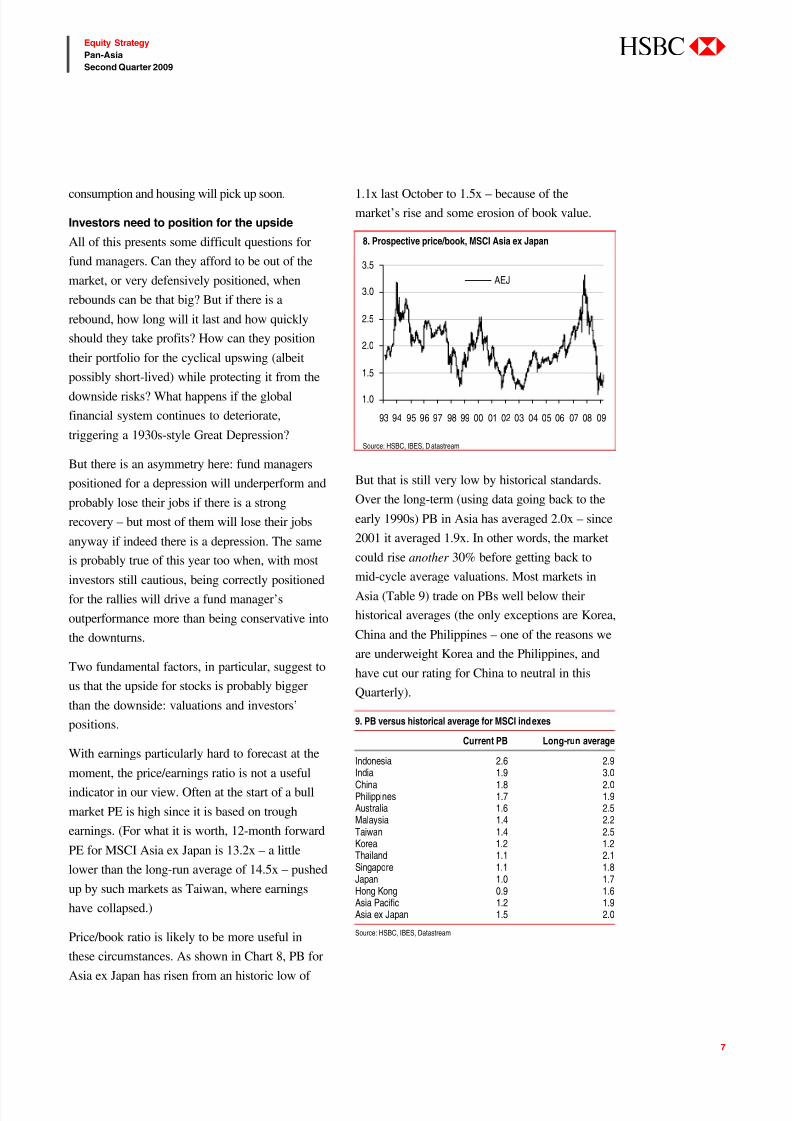
the recovery is sustainable. In the 1930s, for
instance, the DJIA rose by 68% in the four
months after President Roosevelt was inaugurated
and introduced sweeping reforms (including
closing all the banks for a week). But it then
moved sideways for over a year before taking off
again in spring 1935. That rally kept going until
the economy went into a new recession in 1937
(see Chart 4 – the red areas are recessions).
4. DJIA 1929-1940
0
50
100
150
200
250
300
350
400
29 30 31 32 33 34 35 36 37 38 39
Source: HSBC, Bloomberg
The risk, though, is of a double-dip or, at worst, a
long period when markets move within a trading
range.
Double-dips are quite common. After the TMT
bubble burst in 2000, for example (Chart 5), Asian
stocks fell until September 2001, then rallied 53%
but fell back and almost made a new low in March
2003 (the US did go down to a new low).
5. Bear markets in MSCI Asia ex Japan 1992-now
0
100
200
300
400
500
600
700
800
92 93 94 95 96 97 98 99 00 01 02 03 04 05 06 07 08
Double dip
Source: HSBC, Bloomberg
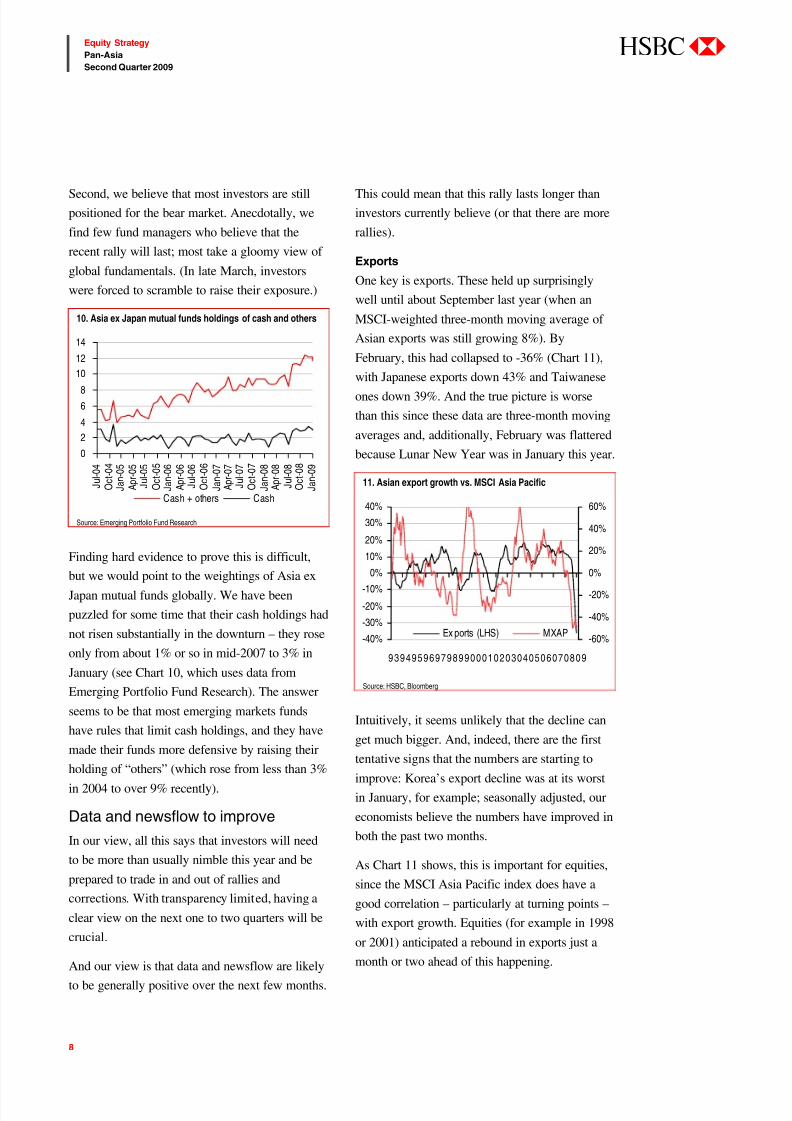
The risk of a second recession closely following
the first cannot be ruled out either. This happened
in Japan in the 1990s. It also happened in the US
in the early 1980s (see Chart 6), where the 1980
recession ended in July (according to official
National Bureau of Economic Research dating)
but the economy entered recession again in July
1981. The stock market responded accordingly.
6. S&P500 1979-1983
0
20
40
60
80
100
79 80 81 82 83
80
100
120
140
160
180
Source: HSBC, Bloomberg
The forecasts of HSBC’s economics team imply
something like just such a double-dip. They look for
quarterly GDP growth to turn positive in Q2 2009,
but then go back into negative territory in Q1 and Q2
2010 (Chart 7). For 2010 as a whole, HSBC
forecasts only 0.5% GDP growth (after a contraction
of 3.0% in 2009). Our economists believe that capex
and exports will continue to fall for some time, even
though they expect public spending will grow and
7. HSBC forecasts for US real GDP growth, q-o-q ann
-8
-6
-4
-2
0
2
4
Q 1 2
0 0 8
Q 2 2
0 0 8
Q 3 2
0 0 8
Q 4 2
0 0 8
Q 1 2
0 0 9
Q 2 2
0 0 9
Q 3 2
0 0 9
Q 4 2
0 0 9
Q 1 2
0 1 0
Q 2 2
0 1 0
Source: HSBC
7/31/2019 Asia Insights the Long Climb Back Apr-1
http://slidepdf.com/reader/full/asia-insights-the-long-climb-back-apr-1 7/82
7
Equity Strategy
Pan-Asia
Second Quarter 2009
abc
consumption and housing will pick up soon.
Investors need to position for the upside
All of this presents some difficult questions for
fund managers. Can they afford to be out of the
market, or very defensively positioned, when
rebounds can be that big? But if there is a
rebound, how long will it last and how quickly
should they take profits? How can they position
their portfolio for the cyclical upswing (albeit
possibly short-lived) while protecting it from thedownside risks? What happens if the global
financial system continues to deteriorate,
triggering a 1930s-style Great Depression?
But there is an asymmetry here: fund managers
positioned for a depression will underperform and
probably lose their jobs if there is a strong
recovery – but most of them will lose their jobs
anyway if indeed there is a depression. The same
is probably true of this year too when, with most
investors still cautious, being correctly positioned
for the rallies will drive a fund manager’s
outperformance more than being conservative into
the downturns.
Two fundamental factors, in particular, suggest to
us that the upside for stocks is probably bigger
than the downside: valuations and investors’
positions.
With earnings particularly hard to forecast at the
moment, the price/earnings ratio is not a useful
indicator in our view. Often at the start of a bull
market PE is high since it is based on trough
earnings. (For what it is worth, 12-month forward
PE for MSCI Asia ex Japan is 13.2x – a little
lower than the long-run average of 14.5x – pushed
up by such markets as Taiwan, where earnings
have collapsed.)
Price/book ratio is likely to be more useful in
these circumstances. As shown in Chart 8, PB forAsia ex Japan has risen from an historic low of
1.1x last October to 1.5x – because of the
market’s rise and some erosion of book value.
8. Prospective price/book, MSCI Asia ex Japan
1.0
1.5
2.0
2.5
3.0
3.5
93 94 95 96 97 98 99 00 01 02 03 04 05 06 07 08 09
AEJ
Source: HSBC, IBES, D atastream
But that is still very low by historical standards.
Over the long-term (using data going back to the
early 1990s) PB in Asia has averaged 2.0x – since
2001 it averaged 1.9x. In other words, the market
could rise another 30% before getting back to
mid-cycle average valuations. Most markets in
Asia (Table 9) trade on PBs well below their
historical averages (the only exceptions are Korea,
China and the Philippines – one of the reasons we
are underweight Korea and the Philippines, and
have cut our rating for China to neutral in this
Quarterly).
9. PB versus historical average for MSCI indexes
Current PB Long-run average
Indonesia 2.6 2.9India 1.9 3.0China 1.8 2.0Philippines 1.7 1.9Australia 1.6 2.5Malaysia 1.4 2.2Taiwan 1.4 2.5Korea 1.2 1.2Thailand 1.1 2.1Singapore 1.1 1.8Japan 1.0 1.7Hong Kong 0.9 1.6Asia Pacific 1.2 1.9Asia ex Japan 1.5 2.0
Source: HSBC, IBES, Datastream
7/31/2019 Asia Insights the Long Climb Back Apr-1
http://slidepdf.com/reader/full/asia-insights-the-long-climb-back-apr-1 8/82
8
Equity Strategy
Pan-Asia
Second Quarter 2009
abc
Second, we believe that most investors are still
positioned for the bear market. Anecdotally, we
find few fund managers who believe that the
recent rally will last; most take a gloomy view of
global fundamentals. (In late March, investors
were forced to scramble to raise their exposure.)
10. Asia ex Japan mutual funds holdings of cash and others
0
2
4
6
8
10
12
14
J u l - 0 4
O c t - 0 4
J a n - 0 5
A p r - 0 5
J u l - 0 5
O c t - 0 5
J a n - 0 6
A p r - 0 6
J u l - 0 6
O c t - 0 6
J a n - 0 7
A p r - 0 7
J u l - 0 7
O c t - 0 7
J a n - 0 8
A p r - 0 8
J u l - 0 8
O c t - 0 8
J a n - 0 9
Cash + others Cash
Source: Emerging Portfolio Fund Research
Finding hard evidence to prove this is difficult,
but we would point to the weightings of Asia ex
Japan mutual funds globally. We have been
puzzled for some time that their cash holdings had
not risen substantially in the downturn – they rose
only from about 1% or so in mid-2007 to 3% in
January (see Chart 10, which uses data from
Emerging Portfolio Fund Research). The answer
seems to be that most emerging markets funds
have rules that limit cash holdings, and they have
made their funds more defensive by raising their
holding of “others” (which rose from less than 3%
in 2004 to over 9% recently).
Data and newsflow to improve
In our view, all this says that investors will need
to be more than usually nimble this year and be
prepared to trade in and out of rallies and
corrections. With transparency limited, having a
clear view on the next one to two quarters will be
crucial.
And our view is that data and newsflow are likely
to be generally positive over the next few months.
This could mean that this rally lasts longer than
investors currently believe (or that there are more
rallies).
Exports
One key is exports. These held up surprisingly
well until about September last year (when an
MSCI-weighted three-month moving average of
Asian exports was still growing 8%). By
February, this had collapsed to -36% (Chart 11),
with Japanese exports down 43% and Taiwaneseones down 39%. And the true picture is worse
than this since these data are three-month moving
averages and, additionally, February was flattered
because Lunar New Year was in January this year.
11. Asian export growth vs. MSCI Asia Pacific
-40%
-30%
-20%
-10%0%
10%
20%
30%
40%
9394959697989900010203040506070809
-60%
-40%
-20%
0%
20%
40%
60%
Ex ports (LHS) MXAP
Source: HSBC, Bloomberg
Intuitively, it seems unlikely that the decline can
get much bigger. And, indeed, there are the first
tentative signs that the numbers are starting toimprove: Korea’s export decline was at its worst
in January, for example; seasonally adjusted, our
economists believe the numbers have improved in
both the past two months.
As Chart 11 shows, this is important for equities,
since the MSCI Asia Pacific index does have a
good correlation – particularly at turning points –
with export growth. Equities (for example in 1998
or 2001) anticipated a rebound in exports just a
month or two ahead of this happening.
7/31/2019 Asia Insights the Long Climb Back Apr-1
http://slidepdf.com/reader/full/asia-insights-the-long-climb-back-apr-1 9/82
9
Equity Strategy
Pan-Asia
Second Quarter 2009
abc
Lead indicators
Leading indicators are starting to point in the
same direction. We have long argued that the US
manufacturing ISM gives one of the clearest
messages about the direction of Asian equities.
The close correlation is apparent in Chart 12 (the
correlation coefficient over the past 10 years has
been 0.75).
12. US manufacturing ISM vs MSCI Asia ex Japan
30
35
40
45
50
55
6065
1 9 9 0
1 9 9 3
1 9 9 6
1 9 9 9
2 0 0 2
2 0 0 5
2 0 0 8
-80%
-60%
-40%
-20%
0%
20%
40%
60%80%
ISM Manufac turing (LHS) MXASJ y /y
Source: HSBC, Bloomberg
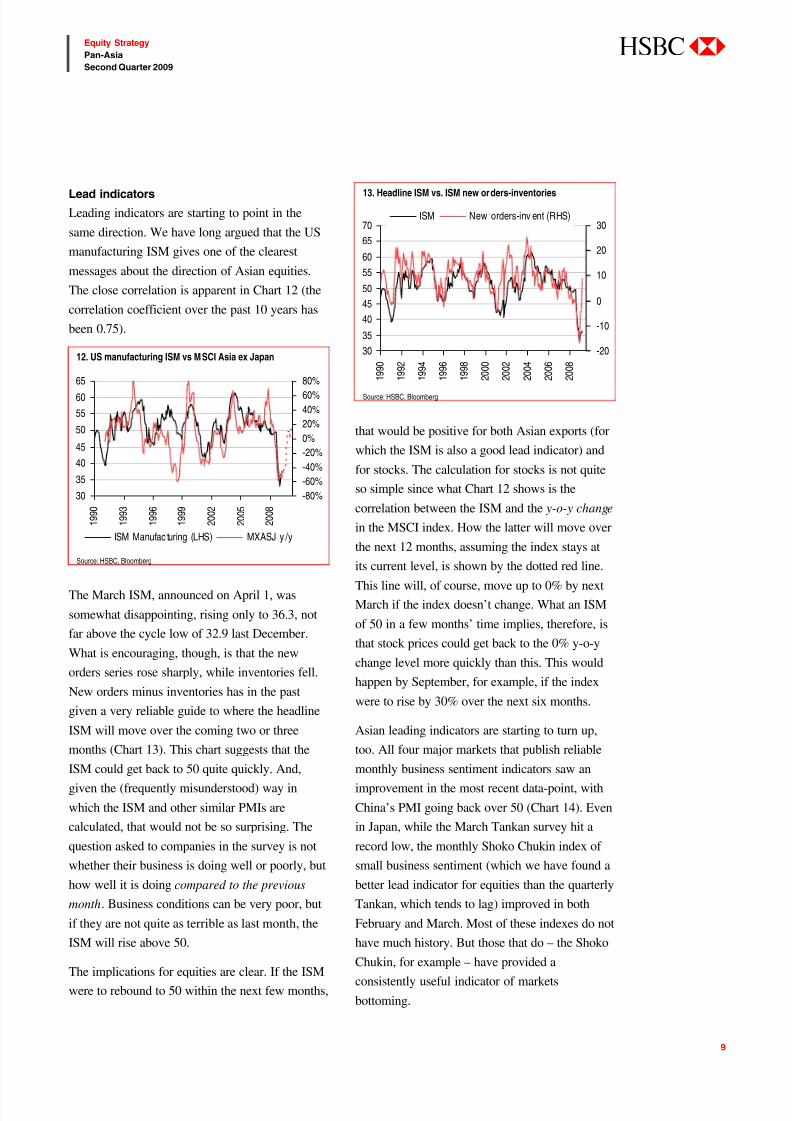
The March ISM, announced on April 1, was
somewhat disappointing, rising only to 36.3, not
far above the cycle low of 32.9 last December.
What is encouraging, though, is that the new
orders series rose sharply, while inventories fell.
New orders minus inventories has in the past
given a very reliable guide to where the headline
ISM will move over the coming two or three
months (Chart 13). This chart suggests that the
ISM could get back to 50 quite quickly. And,
given the (frequently misunderstood) way in
which the ISM and other similar PMIs are
calculated, that would not be so surprising. The
question asked to companies in the survey is not
whether their business is doing well or poorly, but
how well it is doing compared to the previous
month. Business conditions can be very poor, but
if they are not quite as terrible as last month, the
ISM will rise above 50.
The implications for equities are clear. If the ISM
were to rebound to 50 within the next few months,
that would be positive for both Asian exports (for
which the ISM is also a good lead indicator) and
for stocks. The calculation for stocks is not quite
so simple since what Chart 12 shows is the
correlation between the ISM and the y-o-y change
in the MSCI index. How the latter will move over
the next 12 months, assuming the index stays at
its current level, is shown by the dotted red line.
This line will, of course, move up to 0% by next
March if the index doesn’t change. What an ISM
of 50 in a few months’ time implies, therefore, is
that stock prices could get back to the 0% y-o-y
change level more quickly than this. This would
happen by September, for example, if the index
were to rise by 30% over the next six months.
Asian leading indicators are starting to turn up,
too. All four major markets that publish reliable
monthly business sentiment indicators saw an
improvement in the most recent data-point, with
China’s PMI going back over 50 (Chart 14). Even
in Japan, while the March Tankan survey hit a
record low, the monthly Shoko Chukin index of
small business sentiment (which we have found a
better lead indicator for equities than the quarterly
Tankan, which tends to lag) improved in both
February and March. Most of these indexes do not
have much history. But those that do – the Shoko
Chukin, for example – have provided a
consistently useful indicator of markets
bottoming.
13. Headline ISM vs. ISM new orders-inventories
30
35
40
45
50
55
60
65
70
1 9 9 0
1 9 9 2
1 9 9 4
1 9 9 6
1 9 9 8
2 0 0 0
2 0 0 2
2 0 0 4
2 0 0 6
2 0 0 8
-20
-10
0
10
20
30ISM New orders-inv ent (RHS)
Source: HSBC, Bloomberg

7/31/2019 Asia Insights the Long Climb Back Apr-1
http://slidepdf.com/reader/full/asia-insights-the-long-climb-back-apr-1 10/82
10
Equity Strategy
Pan-Asia
Second Quarter 2009
abc
14. Selected business sentiment indicators
20
30
40
50
60
00 01 02 03 04 05 06 07 08 09
JP KR HK CH
Source: HSBC, Bloomberg
So far, so good. But with markets having rallied
so strongly in March, a good deal of this is
already understood and discounted. Can there be
much in the way of further upside surprises?
Earnings
One place these could come from is analysts’
earnings forecasts and recommendations.
Analysts have continued to cut forecasts, but the
first signs are coming through that revision
momentum is bottoming. For example, with most
announcements for 2008 now in (only a few Hong
Kong-listed and Taiwan companies will not report
until April), results turned out to be not quite as
bad as analysts estimated - down 26% y-o-y,
rather than the -28% they expected in early March
(Chart 15). Chinese companies, for example, saw
a 3% decline in EPS, where analysts had foreseen-5%. The 2009 forecast, however, continues to be
revised down: analysts currently expect earnings
to decline by 11.4% this year, compared to a
forecast of -3.2% at the beginning of January.
Those numbers have been revised down further in
the past couple of months as most companies have
given out weak guidance at the time of their
results announcements.
15. Consensus forecasts for y-o-y EPS growth, Asia ex Japan
-40%
-30%
-20%
-10%
0%
10%
20%
30%
40%
J a n - 0 8
A p r - 0 8
J u l - 0 8
O c t - 0 8
J a n - 0 9
A p r - 0 9
200820092010
Source: HSBC, IBES, D atastream
However, once the results season is over – and
especially if export and production data show
signs of stabilising – there will be few reasons for
analysts to revise down further for a while. That
should allow the momentum of earnings forecasts
to bottom. And earnings momentum (which we
define as the change over the past six months in
the 12 months forward forecast) has a close
correlation with stock markets (Chart 16).
16. Momentum of EPS forecasts vs MSCI Asia ex Japan
-40
-30
-20
-10
0
10
20
30
40
1994 1996 1998 2000 2002 2004 2006 2008
-80-60
-40-20
020
4060
80100
R ev is ions (LHS) MSC I Asia ex -Japan y /y
Source: HSBC, IBES, D atastream
In March, earnings momentum was -35% – by far
the worst it has even been. Purely mathematically,
this will inevitably improve over coming months,
not least since for next year analysts forecast (an
unrealistically optimistic, in our view) 31%
growth in EPS. As this number starts to have abigger weight in the 12-month forward number, it
will rise. The change in momentum is already
7/31/2019 Asia Insights the Long Climb Back Apr-1
http://slidepdf.com/reader/full/asia-insights-the-long-climb-back-apr-1 11/82
11
Equity Strategy
Pan-Asia
Second Quarter 2009
abc
clear from the three-month momentum indicator,
which has improved over the past two months
(Chart 17) and which is often a useful guide to
where the six-month indicator will move (but is
too volatile to be useful in predicting market
movements).
17. 3-month and 6-month earnings momentum
-40
-30
-20
-10
0
10
20
30
40
1 9 9 4
1 9 9 5
1 9 9 6
1 9 9 7
1 9 9 8
1 9 9 9
2 0 0 0
2 0 0 1
2 0 0 2
2 0 0 3
2 0 0 4
2 0 0 5
2 0 0 6
2 0 0 7
2 0 0 8
2 0 0 9
6 mth 3 mth
Source: HSBC, IBES, Datastream
Could analysts even start to revise up their
forecasts? For 2009, it is not impossible. In some
markets, they have priced in quite pessimistic
scenarios. In Taiwan, for example, they forecast a
59% fall in EPS (after -54% last year), including
an aggregate loss in the technology sector.
Analysts also forecast -23% for Singapore, -18%
for Hong Kong and -17% for Malaysia (all of
which saw double digit declines in earnings last
year, too).
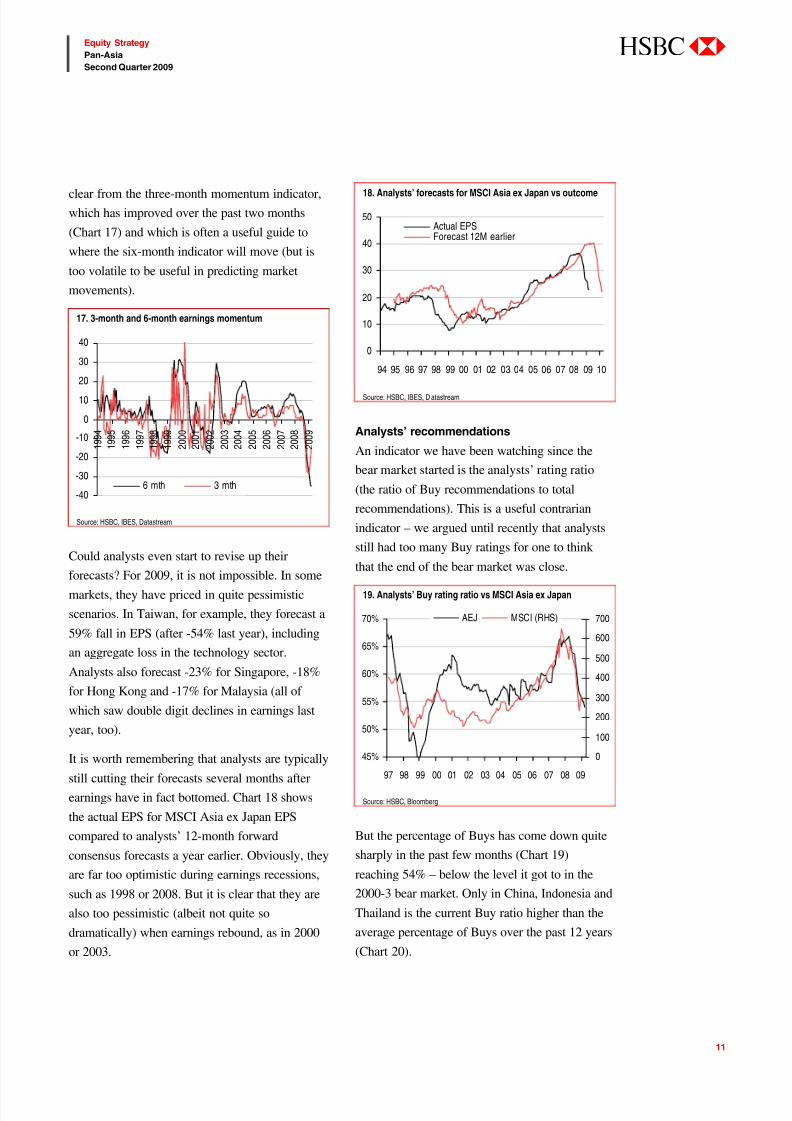
It is worth remembering that analysts are typicallystill cutting their forecasts several months after
earnings have in fact bottomed. Chart 18 shows
the actual EPS for MSCI Asia ex Japan EPS
compared to analysts’ 12-month forward
consensus forecasts a year earlier. Obviously, they
are far too optimistic during earnings recessions,
such as 1998 or 2008. But it is clear that they are
also too pessimistic (albeit not quite so
dramatically) when earnings rebound, as in 2000
or 2003.
18. Analysts’ forecasts for MSCI Asia ex Japan vs outcome
0
10
20
30
40
50
94 95 96 97 98 99 00 01 02 03 04 05 06 07 08 09 10
Actual EPSForecast 12M earlier
Source: HSBC, IBES, D atastream
Analysts’ recommendations
An indicator we have been watching since the
bear market started is the analysts’ rating ratio
(the ratio of Buy recommendations to total
recommendations). This is a useful contrarian
indicator – we argued until recently that analysts
still had too many Buy ratings for one to think
that the end of the bear market was close.
19. Analysts’ Buy rating ratio vs MSCI Asia ex Japan
45%
50%
55%
60%
65%
70%
97 98 99 00 01 02 03 04 05 06 07 08 09
0
100
200
300
400
500
600
700AEJ MSCI (RHS)
Source: HSBC, Bloomberg
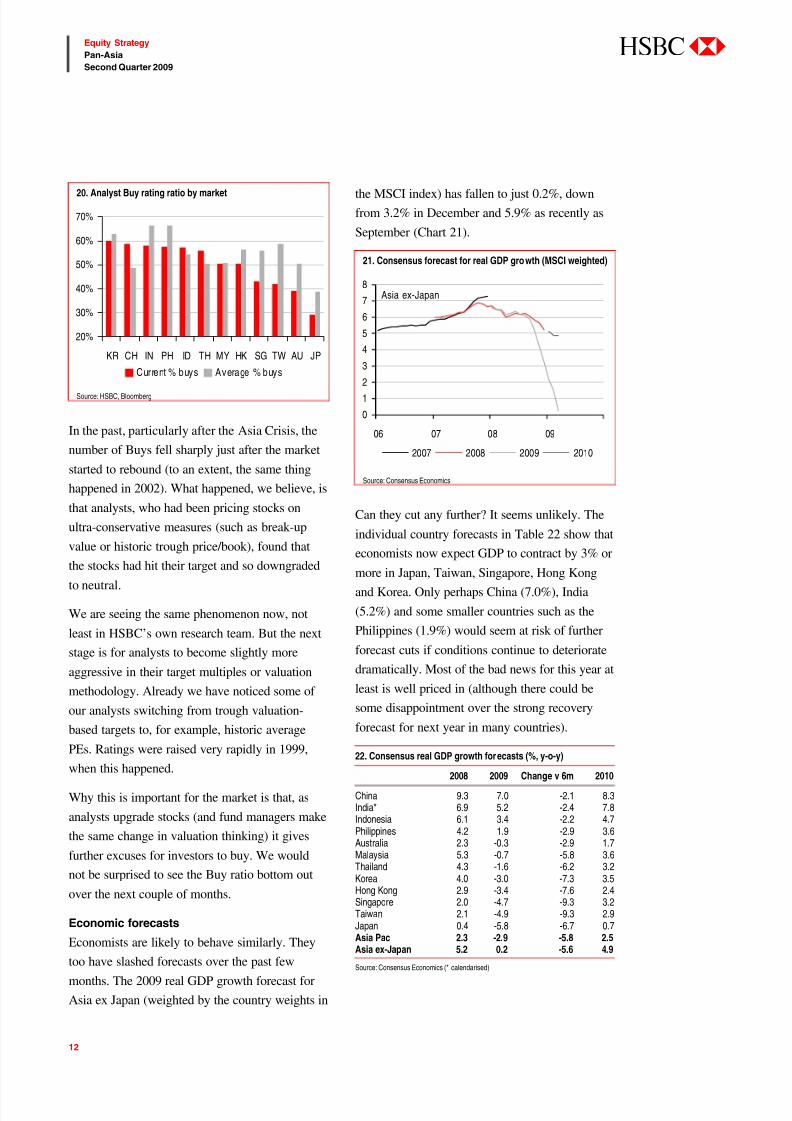
But the percentage of Buys has come down quite
sharply in the past few months (Chart 19)
reaching 54% – below the level it got to in the
2000-3 bear market. Only in China, Indonesia and
Thailand is the current Buy ratio higher than the
average percentage of Buys over the past 12 years
(Chart 20).
7/31/2019 Asia Insights the Long Climb Back Apr-1
http://slidepdf.com/reader/full/asia-insights-the-long-climb-back-apr-1 12/82
12
Equity Strategy
Pan-Asia
Second Quarter 2009
abc
20. Analyst Buy rating ratio by market
20%
30%
40%
50%
60%
70%
KR CH IN PH ID TH MY HK SG TW AU JP
Current % buys Average % buys
Source: HSBC, Bloomberg
In the past, particularly after the Asia Crisis, the
number of Buys fell sharply just after the market
started to rebound (to an extent, the same thing
happened in 2002). What happened, we believe, is
that analysts, who had been pricing stocks on
ultra-conservative measures (such as break-up
value or historic trough price/book), found that
the stocks had hit their target and so downgraded
to neutral.
We are seeing the same phenomenon now, not
least in HSBC’s own research team. But the next
stage is for analysts to become slightly more
aggressive in their target multiples or valuation
methodology. Already we have noticed some of
our analysts switching from trough valuation-
based targets to, for example, historic average
PEs. Ratings were raised very rapidly in 1999,
when this happened.
Why this is important for the market is that, as
analysts upgrade stocks (and fund managers make
the same change in valuation thinking) it gives
further excuses for investors to buy. We would
not be surprised to see the Buy ratio bottom out
over the next couple of months.
Economic forecasts
Economists are likely to behave similarly. They
too have slashed forecasts over the past few
months. The 2009 real GDP growth forecast for
Asia ex Japan (weighted by the country weights in
the MSCI index) has fallen to just 0.2%, down
from 3.2% in December and 5.9% as recently as
September (Chart 21).
21. Consensus forecast for real GDP growth (MSCI weighted)
0
12
3
4
5
6
7
8
06 07 08 09
2007 2008 2009 2010
Asia ex-Japan
Source: Consensus Economics
Can they cut any further? It seems unlikely. The
individual country forecasts in Table 22 show that
economists now expect GDP to contract by 3% or
more in Japan, Taiwan, Singapore, Hong Kongand Korea. Only perhaps China (7.0%), India
(5.2%) and some smaller countries such as the
Philippines (1.9%) would seem at risk of further
forecast cuts if conditions continue to deteriorate
dramatically. Most of the bad news for this year at
least is well priced in (although there could be
some disappointment over the strong recovery
forecast for next year in many countries).
22. Consensus real GDP growth forecasts (%, y-o-y)
2008 2009 Change v 6m 2010
China 9.3 7.0 -2.1 8.3India* 6.9 5.2 -2.4 7.8Indonesia 6.1 3.4 -2.2 4.7Philippines 4.2 1.9 -2.9 3.6Australia 2.3 -0.3 -2.9 1.7Malaysia 5.3 -0.7 -5.8 3.6Thailand 4.3 -1.6 -6.2 3.2Korea 4.0 -3.0 -7.3 3.5Hong Kong 2.9 -3.4 -7.6 2.4Singapore 2.0 -4.7 -9.3 3.2Taiwan 2.1 -4.9 -9.3 2.9Japan 0.4 -5.8 -6.7 0.7Asia Pac 2.3 -2.9 -5.8 2.5Asia ex-Japan 5.2 0.2 -5.6 4.9
Source: Consensus Economics (* calendarised)

7/31/2019 Asia Insights the Long Climb Back Apr-1
http://slidepdf.com/reader/full/asia-insights-the-long-climb-back-apr-1 13/82
13
Equity Strategy
Pan-Asia
Second Quarter 2009
abc
That means that – like analysts’ earnings forecasts
– economists’ forecast momentum will almost
certainly bottom out. The momentum indicator
(also measured as the change over the past six
months in the 12-month forward forecast), shown
in Chart 23, is as bad as it has ever been (although
we do not have data going back to the Asia Crisis
period). As the 2010 forecast becomes a greater
part of the 12-month forward, this will start to
rise. As the chart shows, this indicator has been
quite a good guide to stock market movements,
especially at the turning points.
23. GDP forecast momentum vs MSCI Asia ex Japan
-6
-4
-2
0
2
4
01 02 03 04 05 06 07 08 09
-80
-60
-40
-20
0
20
40
60
80
GDP f'cast momentumMXASJ Index (y/y , R HS)
Source: HSBC, Consensus Economics, Bloomberg
Newsflow
As well as the hard data (or softer data, such as
consensus forecasts), investors need to think about
whether newsflow over the next few months will
generally beat expectations or spring nasty
surprises. Our guess would be that it will mainly
produce positive surprises – for a few months at
least. Examples:
US banks. We won’t add much to the mass of
words written on this subject. But our feeling
is that expectations are low. Few investors
expect the US government to take strong
action on the banks, for example nationalising
them. Most are sceptical about the stress-tests,
results of which will be known in the nextfew weeks. That may be right. But President
Obama’s tougher stance on auto-makers
could presage that he will take decisive
action. That would be an upside surprise.
24. Asia ex Japan average M1 growth vs MSCI index
-5
0
5
10
15
20
1994 1996 1998 2000 2002 2004 2006 2008-80%-60%
-40%
-20%
0%
20%
40%
60%
M1 y /y (%) MXASJ y /y (RHS)
Source: HSBC, Bloomberg
Quantitative easing. One key reason for
markets to bounce in the past few weeks was
the Federal Reserve, Bank of England (and, to
a degree, Bank of Japan) announcing they
would move to quantitative easing. Asian
central banks have not taken rates to zero yet,
but monetary policy is certainly ultra-easy.
Remember that, in most circumstances, stock
markets have a close relationship with money
supply growth (especially M1). In Asia ex
Japan, the correlation since 1996 is 0.70
(Chart 24). In the US, M1 has already started
to accelerate; in the past three months average
y-o-y growth has been 15%, compared to zero
mid last year. In Asia, too, as the chart above
shows, M1 appears to have bottomed, most
notably in China, where it jumped to 11% y-
o-y in February up from 7% in January. One
warning: when Japan tried (a half-hearted)
quantitative easing in the 1990s but the
monetary transmission mechanism broke
down, the correlation between stocks and M1
vanished.
The effects of fiscal policy start to show
through. This has already happened in Chinawhere, for example, cement production has
accelerated to 11% y-o-y in January/February
7/31/2019 Asia Insights the Long Climb Back Apr-1
http://slidepdf.com/reader/full/asia-insights-the-long-climb-back-apr-1 14/82
14
Equity Strategy
Pan-Asia
Second Quarter 2009
abc
versus less than 1% at the end of last year. It
should happen modestly in the US later this
year – one reason why we expect a pick-up in
US growth in H2 (see Chart 7 above). The
unprecedented fiscal stimulus in Asia (as
much as 8% or 9% of GDP in some countries
– see Chart 25 for our economists’ estimates)
will surely start to kick in over the coming
quarters too.
25. Estimated fiscal stimulus as percentage of GDP
0
2
4
6
8
10
M a l a y s i a
S i n g a p o r e
V i e t n a m
P h i l i p p i n e s
C h i n a
T a i w a n
K o r e a
T h a i l a n d
I n d i a
H K
I n d o n e s i a
Fiscal stimulus estimates (% of GDP)
Source: HSBC estimates
What can go wrong next?
Before we get too carried away by the excitement
of a possible rebound over the next few months,
we should also remember that the way back up the
cliff will be slippery and steep.
While the likely positive trends over the next few
months are fairly easy to see, the negative
surprises are much harder to forecast. Where willthe shocks come from? Almost by definition, we
do not know.
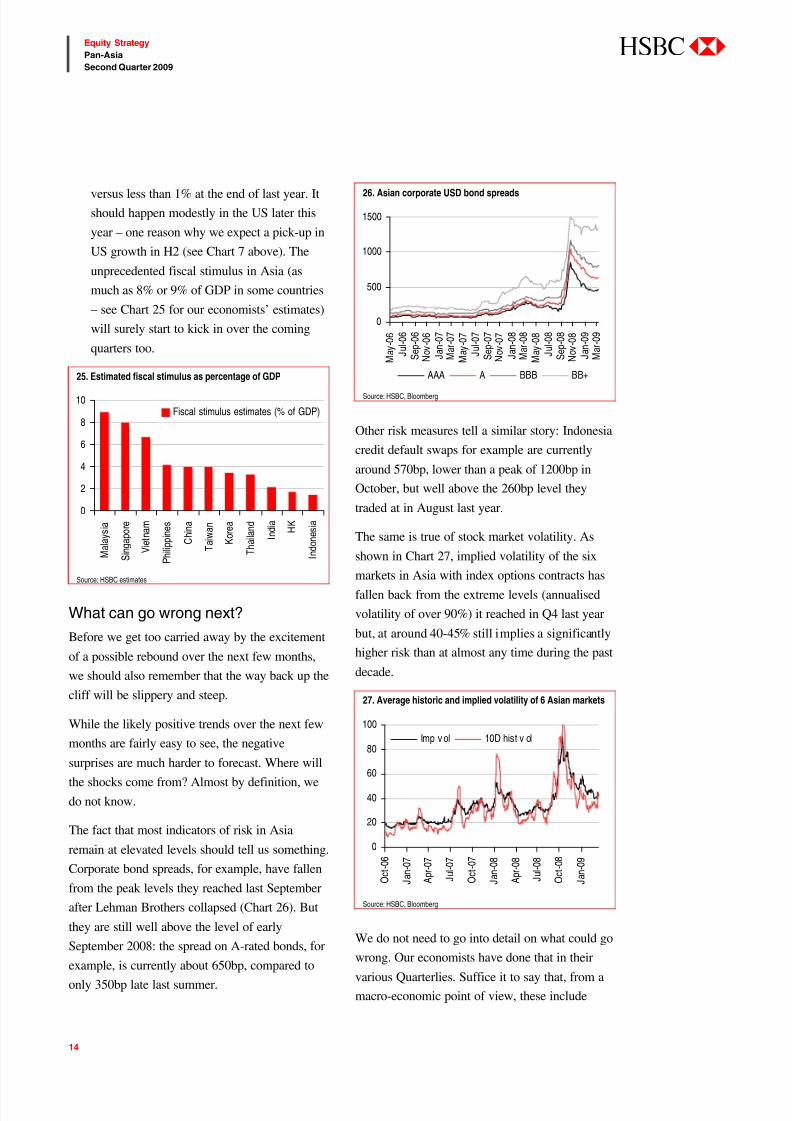
The fact that most indicators of risk in Asia
remain at elevated levels should tell us something.
Corporate bond spreads, for example, have fallen
from the peak levels they reached last September
after Lehman Brothers collapsed (Chart 26). But
they are still well above the level of early
September 2008: the spread on A-rated bonds, for
example, is currently about 650bp, compared to
only 350bp late last summer.
26. Asian corporate USD bond spreads
0
500
1000
1500
M a y - 0 6
J u l - 0 6
S e p - 0 6
N o v - 0 6
J a n - 0 7
M a r - 0 7
M a y - 0 7
J u l - 0 7
S e p - 0 7
N o v - 0 7
J a n - 0 8
M a r - 0 8
M a y - 0 8
J u l - 0 8
S e p - 0 8
N o v - 0 8
J a n - 0 9
M a r - 0 9
AAA A BBB BB+
Source: HSBC, Bloomberg
Other risk measures tell a similar story: Indonesia
credit default swaps for example are currently
around 570bp, lower than a peak of 1200bp in
October, but well above the 260bp level they
traded at in August last year.
The same is true of stock market volatility. As
shown in Chart 27, implied volatility of the six
markets in Asia with index options contracts has
fallen back from the extreme levels (annualised
volatility of over 90%) it reached in Q4 last year
but, at around 40-45% still implies a significantly
higher risk than at almost any time during the past
decade.
27. Average historic and implied volatility of 6 Asian markets
0
20
40
60
80
100
O c t - 0 6
J a n - 0 7
A p r - 0 7
J u l - 0 7
O c t - 0 7
J a n - 0 8
A p r - 0 8
J u l - 0 8
O c t - 0 8
J a n - 0 9
Imp v ol 10D hist v ol
Source: HSBC, Bloomberg
We do not need to go into detail on what could go
wrong. Our economists have done that in their
various Quarterlies. Suffice it to say that, from a
macro-economic point of view, these include
7/31/2019 Asia Insights the Long Climb Back Apr-1
http://slidepdf.com/reader/full/asia-insights-the-long-climb-back-apr-1 15/82
15
Equity Strategy
Pan-Asia
Second Quarter 2009
abc
deflation, inflation, rising unemployment, further
falls in US house prices, long-term weakness in
US consumer spending, further cuts in private-
sector capex, sell-offs in government bond
markets, rising protectionism, currency disorder,
sovereign defaults and a sharp rise in corporate
bankruptcies. The slowdown has been so sharp
and deep that we have no roadmap to show us
exactly what could be the knock-on effects.
Most importantly, the global banking system is farfrom fixed. The lesson from previous nasty bear
markets (1907 and the 1930s in the US, or 1992 in
Sweden or, as a contrary example, Japan in the
1990s) is that the worst is over only when the
problems in the banking system are solved. The
chances of the US achieving that are perhaps
higher than the market currently believes, but they
do not seem that high.
The rosy scenario also assumes that there will be
no policy gaffes. The Great Depression dragged
on longer than necessary because of a series of
mistakes: the Fed raised interest rates much too
early, and many countries stuck too stubbornly to
the gold standard. Policymakers will not make the
same mistakes again – but they could make other
equally serious ones.
We are also concerned that while analysts’ and
economists’ forecasts for this year are now
appropriately cautious, they are assuming a strong
rebound next year – something that our
economists think unlikely. As mentioned above,
analysts see 31% growth in Asia ex Japan
corporate earnings in 2010; economists forecast
4.9% GDP growth. There is definitely room for
downside surprises there when markets begin to
focus on the 2010 outlook, sometime around Q3.
Think back to the charts of nasty bear markets we
showed earlier in this piece. The typical pattern
was of a sharp initial rebound, with markets rising
perhaps 50% over a period of a few months,
followed by a lengthy period of moving sideways.
That ended only when the market either took off
and entered a new full-blown bull market or,
alternatively, double-dipped.
As things stand now, the most likely scenario for
markets is that the rally continues for a while but
that stocks struggle in the second half of this year
as it becomes clear that the problems have not
disappeared and that economic growth will be
anaemic for some time to come.
7/31/2019 Asia Insights the Long Climb Back Apr-1
http://slidepdf.com/reader/full/asia-insights-the-long-climb-back-apr-1 16/82
16
Equity Strategy
Pan-Asia
Second Quarter 2009
abc
Cyclical exposure…
…at a reasonable risk
With markets likely to be characterised by sharp
up- and downswings, we continue to recommend
a balanced approach to market allocation. If we
believed straightforwardly that a new bull market
had started, driven by an end to the global
economic slowdown, we would be overweight
Korea, Taiwan and Japan. If we believed the
world was headed for further problems, we would
be maximising cash and long the most defensive
markets in Asia, such as Malaysia.
The truth is somewhere in the middle. We want to
have some cyclical exposure, because of the
likelihood that economic data will improve over
the summer. But, while we want to take some
exposure to equities and to cyclicality, we also
want to avoid unnecessary risk.
We have again used a scorecard to help us think
through which markets optimally give us this mix
(see Table 2 overleaf). We have made two
changes to the format for the scorecard we used in
the first quarter:
We replaced the category “Sensitivity to
US/global growth” with “Exposure to cyclical
rebound”. Rather than avoiding markets that are
Market recommendations
We want to take some exposure to a cyclical pick-up while
minimising other risks
That means overweights on Taiwan, Singapore, and India, and
underweights on Korea and most of Asean
We lower China to neutral as an economic rebound is priced in
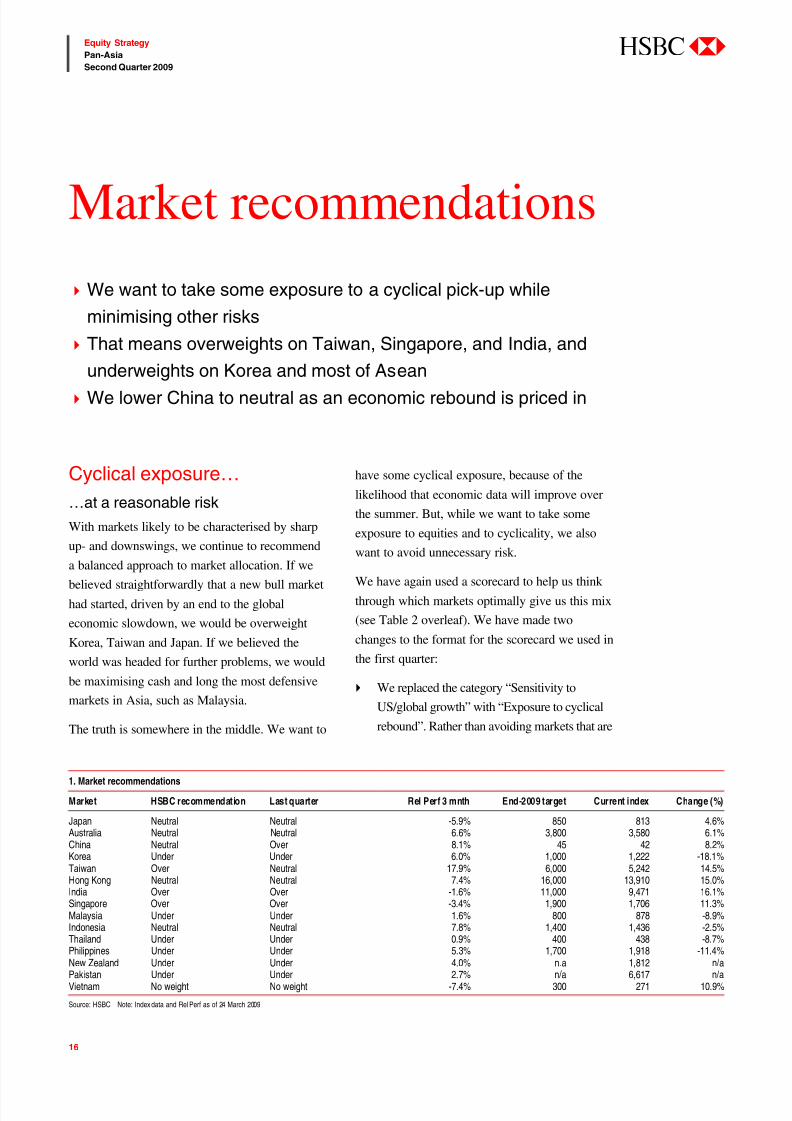
1. Market recommendations
Market HSBC recommendation Last quarter Rel Perf 3 mnth End-2009 target Current index Change (%)
Japan Neutral Neutral -5.9% 850 813 4.6%Australia Neutral Neutral 6.6% 3,800 3,580 6.1%China Neutral Over 8.1% 45 42 8.2%Korea Under Under 6.0% 1,000 1,222 -18.1%Taiwan Over Neutral 17.9% 6,000 5,242 14.5%Hong Kong Neutral Neutral 7.4% 16,000 13,910 15.0%India Over Over -1.6% 11,000 9,471 16.1%Singapore Over Over -3.4% 1,900 1,706 11.3%Malaysia Under Under 1.6% 800 878 -8.9%Indonesia Neutral Neutral 7.8% 1,400 1,436 -2.5%Thailand Under Under 0.9% 400 438 -8.7%
Philippines Under Under 5.3% 1,700 1,918 -11.4%New Zealand Under Under 4.0% n.a 1,812 n/aPakistan Under Under 2.7% n/a 6,617 n/aVietnam No weight No weight -7.4% 300 271 10.9%
Source: HSBC Note: Index data and Rel Perf as of 24 March 2009
7/31/2019 Asia Insights the Long Climb Back Apr-1
http://slidepdf.com/reader/full/asia-insights-the-long-climb-back-apr-1 17/82
17
Equity Strategy
Pan-Asia
Second Quarter 2009
abc
most sensitive to exports and to the global cycle,
we want to increase our weighting modestly
here since these markets are likely to outperform
if, as we believe, exports and industrial
production data and analysts’ forecasts bottom
out over the next one to two quarters.
We tweaked the weightings assigned to each
factor. We cut the weighting for “monetary
and fiscal policy” to 10% from 20%. Since all
countries have announced big stimulus
packages and rate cuts, this is unlikely to be
as much of a focus. We also cut the weighting
for “politics and social stability” to 10% from
20% because, as economies start to stabilise,
social unrest or the risk of governments
falling should become less of an issue. By
contrast, we raised the weight of “earnings
risk” to 20% from 10% because we see a
turning point coming in analysts’ forecasts,
with some countries, where analysts have cut
too far, seeing upward revisions and vice
versa. We introduce the “exposure to cyclical
rebound” factor at a 20% weighting.
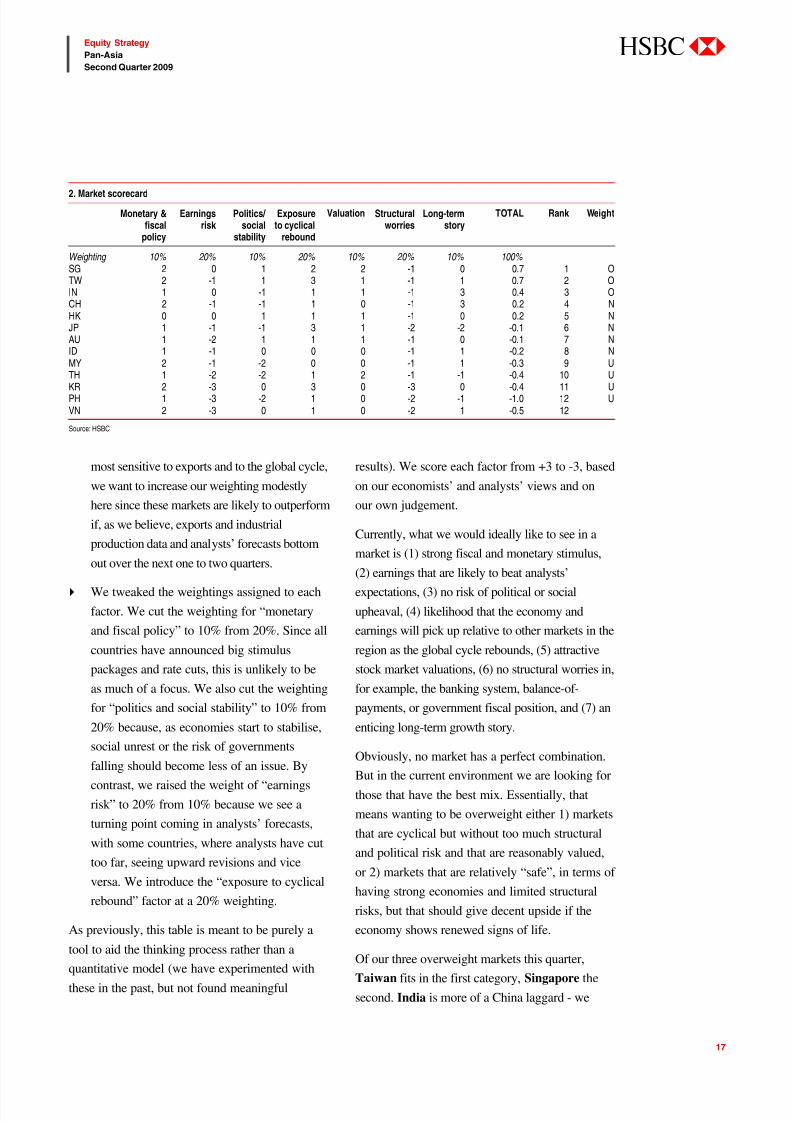
As previously, this table is meant to be purely a
tool to aid the thinking process rather than aquantitative model (we have experimented with
these in the past, but not found meaningful
results). We score each factor from +3 to -3, based
on our economists’ and analysts’ views and on
our own judgement.
Currently, what we would ideally like to see in a
market is (1) strong fiscal and monetary stimulus,
(2) earnings that are likely to beat analysts’expectations, (3) no risk of political or social
upheaval, (4) likelihood that the economy and
earnings will pick up relative to other markets in the
region as the global cycle rebounds, (5) attractive
stock market valuations, (6) no structural worries in,
for example, the banking system, balance-of-
payments, or government fiscal position, and (7) an
enticing long-term growth story.
Obviously, no market has a perfect combination.
But in the current environment we are looking for
those that have the best mix. Essentially, that
means wanting to be overweight either 1) markets
that are cyclical but without too much structural
and political risk and that are reasonably valued,
or 2) markets that are relatively “safe”, in terms of
having strong economies and limited structural
risks, but that should give decent upside if the
economy shows renewed signs of life.
Of our three overweight markets this quarter,
Taiwan fits in the first category, Singapore the
second. India is more of a China laggard - we
2. Market scorecard
Monetary &fiscal
policy
Earningsrisk
Politics/ social
stability
Exposureto cyclical
rebound
Valuation Structuralworries
Long-termstory
TOTAL Rank Weight
Weighting 10% 20% 10% 20% 10% 20% 10% 100% SG 2 0 1 2 2 -1 0 0.7 1 OTW 2 -1 1 3 1 -1 1 0.7 2 OIN 1 0 -1 1 1 -1 3 0.4 3 OCH 2 -1 -1 1 0 -1 3 0.2 4 NHK 0 0 1 1 1 -1 0 0.2 5 NJP 1 -1 -1 3 1 -2 -2 -0.1 6 NAU 1 -2 1 1 1 -1 0 -0.1 7 NID 1 -1 0 0 0 -1 1 -0.2 8 NMY 2 -1 -2 0 0 -1 1 -0.3 9 UTH 1 -2 -2 1 2 -1 -1 -0.4 10 UKR 2 -3 0 3 0 -3 0 -0.4 11 UPH 1 -3 -2 1 0 -2 -1 -1.0 12 UVN 2 -3 0 1 0 -2 1 -0.5 12
Source: HSBC
7/31/2019 Asia Insights the Long Climb Back Apr-1
http://slidepdf.com/reader/full/asia-insights-the-long-climb-back-apr-1 18/82
18
Equity Strategy
Pan-Asia
Second Quarter 2009
abc
think the stability of its economic growth has been
overlooked by markets (which preferred to focus
on election risk and the inability to implement a
punchy fiscal stimulus). While Chinese stocks
have risen 52% since the market bottom last
October, Indian stocks are up only 9%.
Our biggest underweights are markets which
present too much structural risk: investors do not
need to take this unnecessary risk in an
environment where most markets are reasonablyvalued and when relatively safer markets offer
good cyclical exposure. Underweights include
Thailand, Philippines and Korea.
We have cut China to neutral because, after its
recent run-up, it no longer looks so attractive: it is
hard to see where positive catalysts will come
from over the next one or two quarters. We
remain at least neutral on the big developed
markets, Japan, Australia and Hong Kong.
The only changes we have made this quarter are
to lower China, and to raise Taiwan to overweight
from neutral.
Detailed explanation of our views on the major
markets (Japan, China/Hong Kong, Korea,
Taiwan and India) are in the “Main markets”
section of this report. Brief comments on our
choices follow below.
Overweights Pessimism on India seems to us overdone. The
economy is likely to rebound starting from the
July-September quarter, with CY2009 real GDP
growth coming in at 6.2%. We expect earnings
growth of 5-10% this year, too, whereas the
consensus has already been cut to 4%. We find
most investors (including Indians) to be
pessimistic because of the fiscal position and the
general election to be held in April and May.
While the first worry is justified, we believe therisk of an anti-market government emerging is
very low. An attractive prospective PE of 11.4x
suggests India could rebound once the election
is out of the way.
Singapore offers an attractive combination of
cyclical exposure and structural safety. The
economy has been hurt badly by the global
slowdown – unsurprising given that exports are
97% of GDP. HSBC forecasts that GDP will
contract by 7% this year. This negative news has
pushed down the stock market (which has fallen
48% over the past year) as investor sentimentsoured. Despite this, earnings have proved
remarkably resilient, falling only 12% last year.
Due to the market’s fall, valuations on many
measures look the cheapest in Asia, with PE of
11.4x (despite an over-pessimistic consensus
forecast that EPS will fall by 23% this year) and
price to book (PB) of 1.1x. As a developed
country with a high proportion of listed blue-
chip stocks, Singapore should weather the storm
comparatively well. This balance of risk/reward,in our view, merits an overweight.
Taiwan is our favourite market for taking
cyclical exposure. We raise our weighting to
overweight from neutral (having taken it up
from underweight in January). The economy
has suffered disproportionately from the global
slowdown, with exports in January falling 44%
y-o-y and, on our forecasts, GDP likely to
shrink 6.2% this year. But Taiwan is likely to
benefit disproportionately as numbers bottom
out, too. Forecasts have overshot: the analysts’
consensus, for example, looks for a 59% fall in
earnings this year (including an aggregate loss
for the IT sector). With IT rush orders starting to
pick up, there is a good chance that forecasts
will start to be revised up a little in coming
months. Moreover, Taiwan has fewer structural
concerns than other equally cyclical markets.
The banking sector is relatively sound and able
to cope with the likely rise in NPLs.
Companies’ gearing is low. FX reserves, at
7/31/2019 Asia Insights the Long Climb Back Apr-1
http://slidepdf.com/reader/full/asia-insights-the-long-climb-back-apr-1 19/82
7/31/2019 Asia Insights the Long Climb Back Apr-1
http://slidepdf.com/reader/full/asia-insights-the-long-climb-back-apr-1 20/82
20
Equity Strategy
Pan-Asia
Second Quarter 2009
abc
over the coming months. But we believe there
are more structural risks in Korea than in the
other two markets. Analysts’ earnings forecasts
are more optimistic (flat y-o-y, versus -59% for
Taiwan, for example), valuations not noticeably
cheap with PE at 12.4x, bank NPLs are likely to
rise and Korean borrowers are having to pay a
premium to finance their overseas borrowing.
There are less risky ways of obtaining cyclical
exposure.
We can see the attractions of taking a position in
Thailand. After more than five years of
political uncertainty, the current government of
Abhisit Vejjajiva is showing signs that it might
last. And, after years of poor performance, the
Thai market is cheap, with prospective PE of
8.4x and PB of 1.1x. Now investment in Thai
equities might make sense. But investors should
realise, too, that risk is high. The economy does
have a high dependency on global sectors suchas car parts. After years of political wrangling,
the long-term future remains uncertain. The
health of the king is a concern. We stay
underweight.
Malaysia is the clearest example of an
expensive defensive. Its defensiveness showed
through last year, when it was the best
performing market in Asia. This year it has –
true to form – missed out during market rallies.
It looks somewhat expensive too, with
prospective PE of 12.7x not much below its
post-2001 average. In addition, the political
situation could destabilise after the arrival of
Najib Razak as Prime Minister this month.
Malaysia is not a bad place to hide for investors
who believe the worst of the bear market is not
over; for others, it should be an underweight, in
our view.
Philippines has the attraction that its economy
and market are relatively uncorrelated with
global trends. It is also true that government
finances and the banking system are healthier
than a few years ago. But we find this too risky
a market to overweight in the current
environment. Remittances have been the only
thing keeping the economy going in recent
years, but remittances are no longer growing
and we forecast -20% y-o-y for 2009. With PE
at 11.1x (based on a rather optimistic consensus
forecast of 7% EPS growth this year), valuations
are not especially attractive. And political
instability is likely to remain a focus in the run-
up to the presidential election in May 2010.
Non-benchmark
Vietnam was the worst-performing market in
Asia in Q1 in dollar terms. EPS for listed stocks
fell 30% in 2008 as companies wrote off losses
from property and stock market investment. Inthe absence of consensus forecasts, and with the
economy slowing rapidly, there is little
transparency about this year’s earnings.
Assuming EPS will be flat y-o-y this year, 12-
month forward PE is 10.8x – unattractive for a
market this risky. We think the Vietnamese
market will continue to struggle this year and
that there are more attractive markets in Asia
which investors would be advised to enter first.
Adventurous investors might, however, want todip their toes back into the water on a long-term
basis to buy some reasonably valued companies
that stuck to their core business and avoided
diversifying into real estate and finance.
7/31/2019 Asia Insights the Long Climb Back Apr-1
http://slidepdf.com/reader/full/asia-insights-the-long-climb-back-apr-1 21/82
21
Equity Strategy
Pan-Asia
Second Quarter 2009
abc
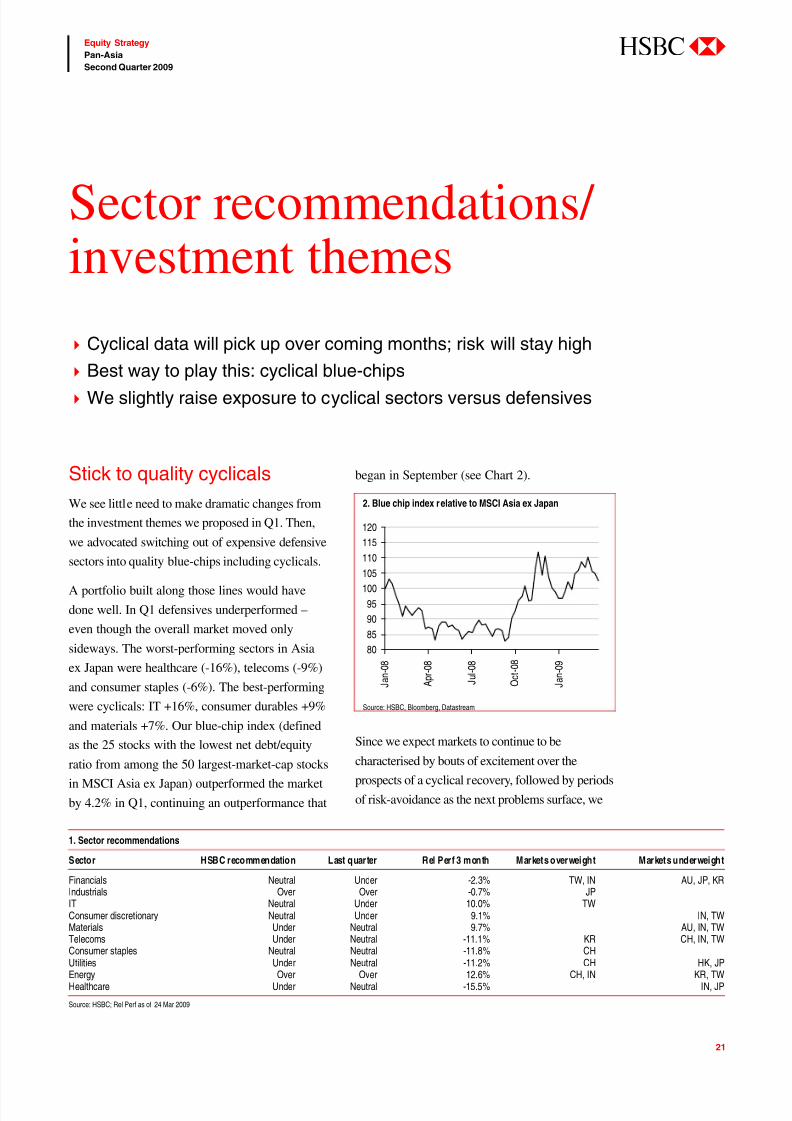
Stick to quality cyclicals
We see little need to make dramatic changes from
the investment themes we proposed in Q1. Then,
we advocated switching out of expensive defensive
sectors into quality blue-chips including cyclicals.
A portfolio built along those lines would have
done well. In Q1 defensives underperformed –
even though the overall market moved only
sideways. The worst-performing sectors in Asia
ex Japan were healthcare (-16%), telecoms (-9%)
and consumer staples (-6%). The best-performing
were cyclicals: IT +16%, consumer durables +9%
and materials +7%. Our blue-chip index (defined
as the 25 stocks with the lowest net debt/equity
ratio from among the 50 largest-market-cap stocksin MSCI Asia ex Japan) outperformed the market
by 4.2% in Q1, continuing an outperformance that
began in September (see Chart 2).
2. Blue chip index relative to MSCI Asia ex Japan
80
85
90
95
100105
110
115
120
J a n - 0 8
A p r - 0 8
J u l - 0 8
O c t - 0 8
J a n - 0 9
Source: HSBC, Bloomberg, Datastream
Since we expect markets to continue to be
characterised by bouts of excitement over theprospects of a cyclical recovery, followed by periods
of risk-avoidance as the next problems surface, we
Sector recommendations/ investment themes
Cyclical data will pick up over coming months; risk will stay high
Best way to play this: cyclical blue-chips
We slightly raise exposure to cyclical sectors versus defensives
1. Sector recommendations
Sector HSBC recommendation Last quarter Rel Perf 3 month Markets overweight Markets underweight
Financials Neutral Under -2.3% TW, IN AU, JP, KRIndustrials Over Over -0.7% JPIT Neutral Under 10.0% TWConsumer discretionary Neutral Under 9.1% IN, TWMaterials Under Neutral 9.7% AU, IN, TWTelecoms Under Neutral -11.1% KR CH, IN, TW
Consumer staples Neutral Neutral -11.8% CHUtilities Under Neutral -11.2% CH HK, JPEnergy Over Over 12.6% CH, IN KR, TWHealthcare Under Neutral -15.5% IN, JP
Source: HSBC; Rel Perf as of 24 Mar 2009
7/31/2019 Asia Insights the Long Climb Back Apr-1
http://slidepdf.com/reader/full/asia-insights-the-long-climb-back-apr-1 22/82
22
Equity Strategy
Pan-Asia
Second Quarter 2009
abc
still recommend taking some cyclical exposure,
while avoiding the excess risk that comes with
buying small caps, high-beta stocks or companies
with weak balance sheets. These will undoubtedly
do well when a full-blown bull market begins (our
blue-chip index underperformed, for example, in
2003-4), but we do not see this happening yet.
But which ones?While we are happy to stick to this theme, executing
it is getting harder. Many of the blue-chip cyclicals
have already performed remarkably well. For
example, with this report we are removing from our
list of Asia’s Super 10 stocks (Table 3) a number of
names which have either reached our target price or
where our analysts have downgraded the stocks as
valuations got pricier: ICBC (1398 HK, Overweight
(V), HKD4.03), Infosys (INFO IN, Overweight (V),
INR1324), Sun Hung Kai Properties (16 HK,Overweight (V), HKD69.40) and TSMC (2330 TT,
Neutral (V), TWD51.40).
Partly this is because of a typical market-bottom
phenomenon among analysts (and not just
HSBC’s). For the past few months, they have been
pricing stocks off trough valuations (using as
reference, for example, the PB low from 1998 or
2001). They have also become very conservative in
forecasting earnings given the lack of transparency.
When the market has a 20-30% rally, this takes
many stocks evaluated in this way up to their target
price. Analysts’ natural reaction is to downgrade.
But once analysts gain more confidence about the
robustness of the earnings recovery or about
normalisation of market conditions, they will start
to price stocks off mid-cycle valuations and raise
earnings forecasts, albeit modestly.
The rules of our portfolios are that we can include
only stocks covered by HSBC on which our analysts
have an Overweight rating. With lots of downgradesto Neutral recently, this universe has dwindled. We
suspect that it will grow again in coming weeks. We
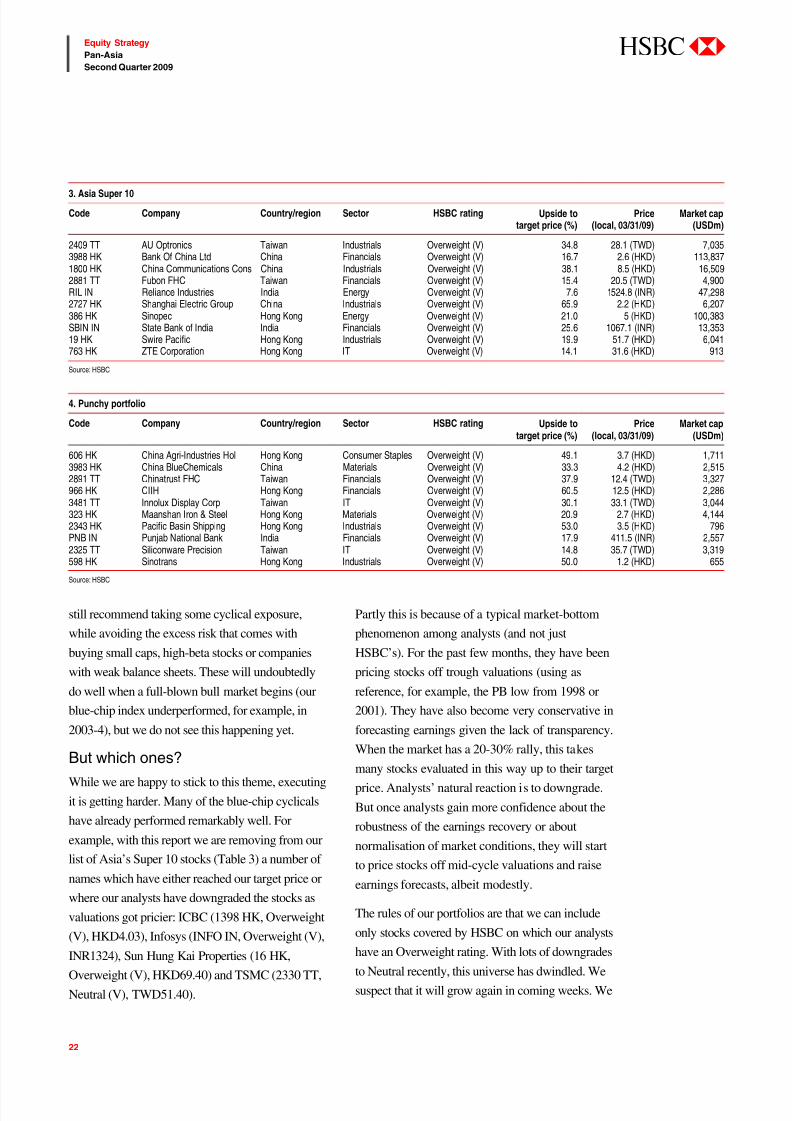
3. Asia Super 10
Code Company Country/region Sector HSBC rating Upside totarget price (%)
Price(local, 03/31/09)
Market cap(USDm)
2409 TT AU Optronics Taiwan Industrials Overweight (V) 34.8 28.1 (TWD) 7,0353988 HK Bank Of China Ltd China Financials Overweight (V) 16.7 2.6 (HKD) 113,8371800 HK China Communications Cons China Industrials Overweight (V) 38.1 8.5 (HKD) 16,5092881 TT Fubon FHC Taiwan Financials Overweight (V) 15.4 20.5 (TWD) 4,900RIL IN Reliance Industries India Energy Overweight (V) 7.6 1524.8 (INR) 47,2982727 HK Shanghai Electric Group China Industrials Overweight (V) 65.9 2.2 (HKD) 6,207386 HK Sinopec Hong Kong Energy Overweight (V) 21.0 5 (HKD) 100,383SBIN IN State Bank of India India Financials Overweight (V) 25.6 1067.1 (INR) 13,35319 HK Swire Pacific Hong Kong Industrials Overweight (V) 19.9 51.7 (HKD) 6,041763 HK ZTE Corporation Hong Kong IT Overweight (V) 14.1 31.6 (HKD) 913
Source: HSBC
4. Punchy portfolio
Code Company Country/region Sector HSBC rating Upside totarget price (%)
Price(local, 03/31/09)
Market cap(USDm)
606 HK China Agri-Industries Hol Hong Kong Consumer Staples Overweight (V) 49.1 3.7 (HKD) 1,7113983 HK China BlueChemicals China Materials Overweight (V) 33.3 4.2 (HKD) 2,5152891 TT Chinatrust FHC Taiwan Financials Overweight (V) 37.9 12.4 (TWD) 3,327966 HK CIIH Hong Kong Financials Overweight (V) 60.5 12.5 (HKD) 2,2863481 TT Innolux Display Corp Taiwan IT Overweight (V) 30.1 33.1 (TWD) 3,044323 HK Maanshan Iron & Steel Hong Kong Materials Overweight (V) 20.9 2.7 (HKD) 4,1442343 HK Pacific Basin Shipping Hong Kong Industrials Overweight (V) 53.0 3.5 (HKD) 796PNB IN Punjab National Bank India Financials Overweight (V) 17.9 411.5 (INR) 2,5572325 TT Siliconware Precision Taiwan IT Overweight (V) 14.8 35.7 (TWD) 3,319598 HK Sinotrans Hong Kong Industrials Overweight (V) 50.0 1.2 (HKD) 655
Source: HSBC

7/31/2019 Asia Insights the Long Climb Back Apr-1
http://slidepdf.com/reader/full/asia-insights-the-long-climb-back-apr-1 23/82
23
Equity Strategy
Pan-Asia
Second Quarter 2009
abc
are expecting, therefore, to be shuffling the names
around as new blue-chip Overweights emerge.
For now, we stick – as far as we can – in the Super
10 to large-cap stocks with quality managements,
healthy balance sheets and dominant positions in
their industries that give us some exposure to the
cycle. Although we have cut four stocks from our
most recently published list (those mentioned
above), we are happy to stick to AU Optronics,
Reliance, Shanghai Electric, Sinopec, Swire, andZTE – all of which we believe still to have potential
upside.
We have added four stocks: Bank of China (to
replace ICBC), Fubon (the best-quality financial in
Taiwan, where we have an overweight on the banks
sector), State Bank of India (since we move to
overweight on Indian banks), and China
Communications Construction (which we see as the
soundest of the China infrastructure plays).
A full explanation of why we like each of the
companies in our Super 10, together with valuation
and risks, is in the Top Stock Picks section at the end
of this report.
This is not intended to be a short-term theme. We
believe that this sort of Nifty-50 approach could be a
winner over a number of years – as it was in
previous periods of protracted market uncertainty,
such as the US in the 1960s (the original Nifty 50) or
Japan in the 1990s.
Punchy portfolio
When the market does rally sharply, as it did in
March, we think it will be the higher-beta, punchier
names that will outperform. Investors with a little
more appetite for risk might like to consider putting
a portion of their portfolios in some higher-
risk/higher-return stocks to cover those rallies.
Last quarter we recommended a barbell approach,with 70-80% of the portfolio in blue-chips and 20-
30% in stocks whose prices were 60-70% below
their peak, but where the company had a decent
business and would likely survive the downturn.
These stocks are no longer so cheap, so we are
shifting the focus of this higher-risk portfolio to
smaller-cap stocks, deep-value names and higher-
beta cyclicals. We include four stocks from last
quarter’s list of 60-70% off-peak stocks (China Agri-
Industries, Pacific Basin Shipping, Maanshan Iron &
Steel, and Sinotrans). All three remain cheap – the
first three have moved largely sideways during thepast three months, and Sinotrans has fallen a further
20%. (Stocks we removed from last quarter: Bank of
China (upgraded to the Super 10), Canara Bank
(CBK IN, Neutral (V) INR165.70), CESC (CESC
IN, Overweight (V), INR211) and Kingboard
Chemical (148 HK, Overweight (V)), HKD15.90)).
We have added China BlueChemicals (as a fertiliser
company, a play on Chinese rural demand),
Chinatrust (a higher-beta way of taking a view that
Taiwan banks are oversold), CIIH (the best-run of
the Chinese insurance companies), Innolux (a mid-
cap panel maker), Punjab National Bank (a cheaply
valued Indian bank with a strong balance sheet), and
Siliconware (an attractively valued tech laggard).
Sector recommendations
We raise slightly further our exposure to cyclicals at
the expense of defensives.
Despite the relative underperformance of defensives
in Q1, they generally remain very expensive.
Utilities in Asia ex Japan, for example, trade on
16.4x 2009 earnings and consumer staples on
13.5x. We think that many investors are still very
overweight these sectors, having built up positions
as the stock market collapsed last year. The
telecoms sector has seen stock prices fall in recent
months, bringing PE back to a reasonable 10.5x.
But regulatory risk and excess competition remain
a risk in many markets in Asia, particularly inChina (where we see China Mobile trying to grow
3G subscribers at the expense of short-term
7/31/2019 Asia Insights the Long Climb Back Apr-1
http://slidepdf.com/reader/full/asia-insights-the-long-climb-back-apr-1 24/82
24
Equity Strategy
Pan-Asia
Second Quarter 2009
abc
profitability) and India (where Reliance
Communications is doing something similar with
GSM). We cut telecoms, healthcare and utilities to
underweight from neutral. We leave consumer
staples at neutral, because parts of it (for example,
supermarkets) have some structural growth drivers
and are not just purely defensive.
It is a tougher call to know where to take the cyclical
exposure. As we argued last quarter, it is probably
better to do this via quality stocks rather than beingtoo choosy about which industries within the
cyclicals universe to focus on.
We keep our overweight on industrials, which we
see as less risky, since some of the sector’s earnings
come from public-sector and infrastructure-related
capex. We particularly like machinery companies in
Japan and China, and airlines (which should benefit
from cheaper jet fuel as well as being early plays on
a recovery in consumption). We continue to avoid
shippers and shipbuilders, which suffer from gross
over-capacity.
Later cyclical plays, such as consumer-related
sectors, are probably still a couple of quarters away
from outperforming, since employment and wages
are still falling. But we raise our weighting in
consumer discretionary to neutral, since it is
probably better to get in early than wait and miss the
bounce. This sector is exposed both to Asian
consumption and to a pick-up in US consumptionfor products such as autos and electronic goods.
While neither is likely to be strong, valuations more
than reflect that, in our view, with the sector PE at
11.0x for 2009 and 9.2x for 2010.
We also believe it is too early to take an overweight
position in financials, since the problems with US
and European banks are far from being solved,
which will drag the sector down globally, and NPLs
in Asia are likely to rise. But there is probably more
upside than downside risk in this sector now (healthy
banks in Asia might rebound strongly if the US
moves to nationalise some banks, for instance) and
so we think an underweight is risky. We raise our
weighting to neutral and would take positions
particularly in Taiwanese and Indian banks; we are
neutral on Chinese banks and cautious in Australia,
Japan, and Korea. We are generally, though,
underweight real estate (which MSCI classifies
under financials), which is exposed to refinancing
risk as well as to the likelihood that real estate prices
in a range of markets, from India to China and
Japan, will fall further.
In retrospect, we were wrong to be underweight on
technology in Q1 (although we did include a
number of blue-chip stocks in our Super 10 which
performed nicely). There is still some upside risk
over the next few months from restocking, although
most of the (slightly) better news is already priced in
– to semiconductors in particular. With end-demand
likely to stay weak as sales of PCs and handsets will
struggle this year, we would not chase this sector.But it is also probably best to have a reasonable
exposure so we are raising our recommendation to
neutral. We would look for laggards, for example
among components companies or panel-makers.
Despite our slight bias to cyclicals, we are
unenthusiastic about the materials sector, which we
lower to underweight from neutral. While demand in
some areas is likely to bottom out this year, this
sector has the added problem of increasing supply.
This is likely to depress prices in a range of areas
including coal, steel, aluminium and iron ore. Since
the last bull market was driven by resources, it is
highly unlikely that the next one will be.
We keep our overweight in energy. We expect the
crude oil price to be flat to slightly uptrending over
the next 12 months (our analysts forecast an average
of USD52 a barrel this year and USD76 next). But
the main reason for our overweight is that in both
China and India liberalisation of retail energy priceswill raise refiner margins.

7/31/2019 Asia Insights the Long Climb Back Apr-1
http://slidepdf.com/reader/full/asia-insights-the-long-climb-back-apr-1 25/82
25
Equity Strategy
Pan-Asia
Second Quarter 2009
abc
Main markets

7/31/2019 Asia Insights the Long Climb Back Apr-1
http://slidepdf.com/reader/full/asia-insights-the-long-climb-back-apr-1 26/82
26
Equity Strategy
Pan-Asia
Second Quarter 2009
abc
Cyclical buy too risky
Japan’s economy has deteriorated dramatically in
recent months: exports are falling 49% y-o-y,
industrial production 38% and department store
sales 12%. We estimate that in Q1 real GDP fell
7.9% y-o-y.
From a contrarian point of view, that perhaps
makes Japan interesting for investors wanting to
take some cyclical exposure. As in other cyclical
markets such as Taiwan and Korea, data should
bottom out over the next couple of quarters. There
is, for example, an 82% correlation between
MSCI Japan and the US ISM manufacturing index
(compared to 76% for Taiwan and 70% for China)
– which should pick up in coming months.
Moreover, the Japanese market looks fairly cheap.
PB is 1.0x, slightly above the low of 0.8x reachedin March, but well below the post-2003 average of
1.6x. (Note, though, that 12-month forward PE is
27x after earnings collapsed.)
We think, therefore, that it is unwise to be
underweight Japan in an environment where
newsflow should continue to improve. However,
there are a number of reasons why we would not
recommend an overweight. The political situation
will remain shaky until (and probably after) the
general election which must be held by September
6. Excitement about a regime change, with the
LDP losing power, has been undermined by the
recent arrest on bribery charges of the secretary of
Democratic Party leader Ichiro Ozawa. Continued
stalemate is the most likely outcome.
The negative impact of the economic slowdown
could drag on for some time. We expect q-o-q
GDP growth to continue to fall until Q4, although
the rate of decline will slow. Even in September,
we forecast that industrial production will still be
down 35% over a year earlier – and Japanese
equities have traditionally had a close correlation
with this data series. Japan’s high ratio of
outstanding debt to GDP (and the political
impasse) plus interest rates that have long been
close to zero mean the room for monetary and
fiscal stimulus is limited.
There are some structural implications too.
Electronics manufacturers will make big losses in
the fiscal year ending March 2009: Hitachi (6501
JP), for example, forecasts it will lose JPY700bn,
equal to 21% of its shareholders’ equity.
Bankruptcy risk among smaller export-oriented
manufacturers is rising. In combination with sharp
falls in real estate prices, this will put pressure on
banks too. Furthermore, we expect the yen to
decline to JPY105 to the dollar by year-end,
which will dampen equity returns.
We would take some exposure to machinery andIT, but avoid banks and outright defensive sectors
such as pharmaceuticals and utilities.
Japan (neutral)
Economic numbers have deteriorated dramatically
But political impasse is set to continue and structural risks are rising
Japan is too cyclical to underweight, too risky to overweight
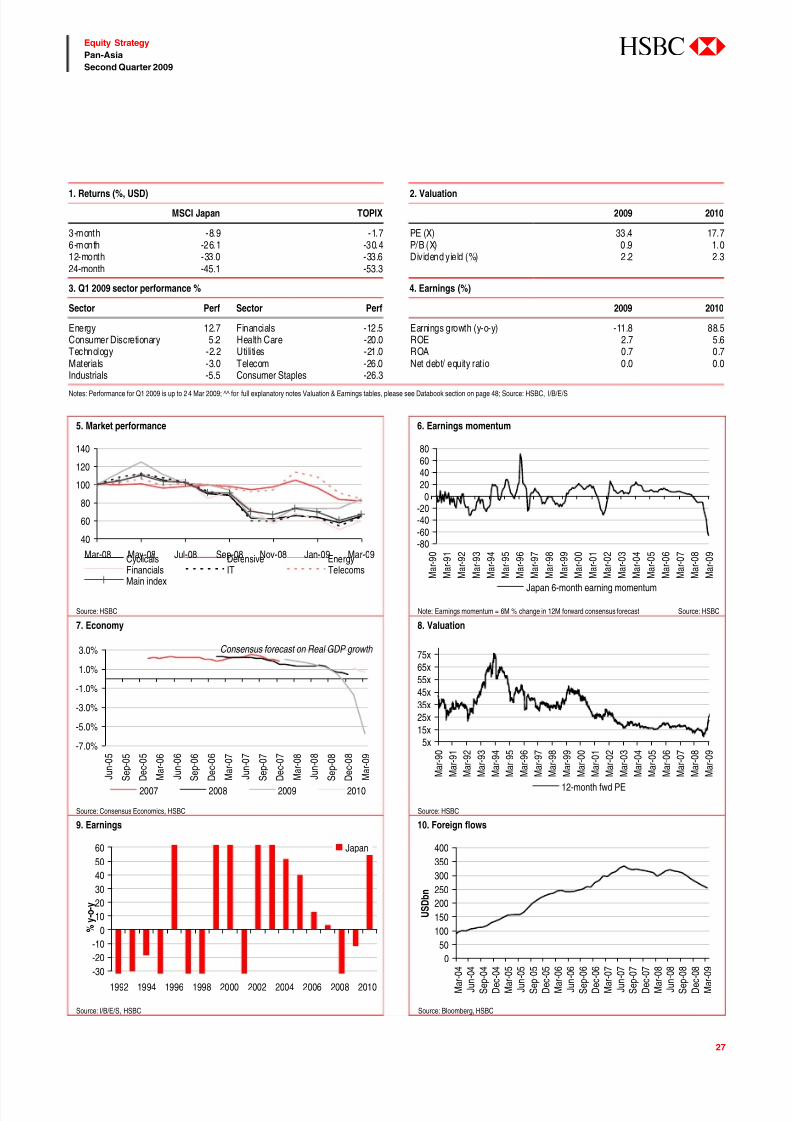
7/31/2019 Asia Insights the Long Climb Back Apr-1
http://slidepdf.com/reader/full/asia-insights-the-long-climb-back-apr-1 27/82
27
Equity Strategy
Pan-Asia
Second Quarter 2009
abc
1. Returns (%, USD) 2. Valuation
MSCI Japan TOPIX 2009 2010
3-month -8.9 -1.7 PE (X) 33.4 17.76-month -26.1 -30.4 P/B (X) 0.9 1.012-month -33.0 -33.6 Dividend yield (%) 2.2 2.324-month -45.1 -53.3
3. Q1 2009 sector performance % 4. Earnings (%)
Sector Perf Sector Perf 2009 2010
Energy 12.7 Financials -12.5 Earnings growth (y-o-y) -11.8 88.5Consumer Discretionary 5.2 Health Care -20.0 ROE 2.7 5.6Technology -2.2 Utilities -21.0 ROA 0.7 0.7Materials -3.0 Telecom -26.0 Net debt/ equity ratio 0.0 0.0Industrials -5.5 Consumer Staples -26.3
Notes: Performance for Q1 2009 is up to 2 4 Mar 2009; ^^ for full explanatory notes Valuation & Earnings tables, please see Databook section on page 48; Source: HSBC, I/B/E/S
5. Market performance 6. Earnings momentum
40
60
80
100
120
140
Mar-08 May-08 Jul-08 Sep-08 Nov-08 Jan-09 Mar-09Cyclicals Defensive Energy
Financials IT TelecomsMain index
-80-60-40-20
020406080
M
a r - 9 0
M
a r - 9 1
M
a r - 9 2
M
a r - 9 3
M
a r - 9 4
M
a r - 9 5
M
a r - 9 6
M
a r - 9 7
M
a r - 9 8
M
a r - 9 9
M
a r - 0 0
M
a r - 0 1
M
a r - 0 2
M
a r - 0 3
M
a r - 0 4
M
a r - 0 5
M
a r - 0 6
M
a r - 0 7
M
a r - 0 8
M
a r - 0 9
Japan 6-month earning momentum
Source: HSBC Note: Earnings momentum = 6M % change in 12M forward consensus forecast Source: HSBC
7. Economy 8. Valuation
Consensus forecast on Real GDP growth
-7.0%
-5.0%
-3.0%
-1.0%
1.0%
3.0%
J u n - 0 5
S e p - 0 5
D e c - 0 5
M a r - 0 6
J u n - 0 6
S e p - 0 6
D e c - 0 6
M a r - 0 7
J u n - 0 7
S e p - 0 7
D e c - 0 7
M a r - 0 8
J u n - 0 8
S e p - 0 8
D e c - 0 8
M a r - 0 9
2007 2008 2009 2010
5x
15x
25x
35x
45x
55x
65x
75x
M a r
- 9 0
M a r
- 9 1
M a r
- 9 2
M a r
- 9 3
M a r
- 9 4
M a r
- 9 5
M a r
- 9 6
M a r
- 9 7
M a r
- 9 8
M a r
- 9 9
M a r
- 0 0
M a r
- 0 1
M a r
- 0 2
M a r
- 0 3
M a r
- 0 4
M a r
- 0 5
M a r
- 0 6
M a r
- 0 7
M a r
- 0 8
M a r
- 0 9
12-month fwd PE
Source: Consensus Economics, HSBC Source: HSBC
9. Earnings 10. Foreign flows
-30-20
-10
0
10
20
30
40
50
60
1992 1994 1996 1998 2000 2002 2004 2006 2008 2010
% y - o - y
Japan
0
50
100
150
200
250
300
350
400
M a r - 0 4
J u n - 0 4
S e p - 0 4
D e c - 0 4
M a r - 0 5
J u n - 0 5
S e p - 0 5
D e c - 0 5
M a r - 0 6
J u n - 0 6
S e p - 0 6
D e c - 0 6
M a r - 0 7
J u n - 0 7
S e p - 0 7
D e c - 0 7
M a r - 0 8
J u n - 0 8
S e p - 0 8
D e c - 0 8
M a r - 0 9
U S D b n
Source: I/B/E/S, HSBC Source: Bloomberg, HSBC
7/31/2019 Asia Insights the Long Climb Back Apr-1
http://slidepdf.com/reader/full/asia-insights-the-long-climb-back-apr-1 28/82
28
Equity Strategy
Pan-Asia
Second Quarter 2009
abc
Good news priced in for now
The latest batch of Jan-Feb. economic statistics
shows that domestic demand, particularly public
sector investment, has held up better than
expected to partially offset the worse-than-
expected external slowdown. Moreover, China’s
banking sector has lent nearly RMB4trn in the
four months until February, though 40% of this
was short-term discounted bills. Demand and
production growth of cyclical sectors such as
electricity, cement, steel, coal and autos have
rebounded from historical low levels and further
improvement in the near term appears under way,
as indicated by PMI leading indicators.
MSCI China has rebounded over 50% from itstrough at the end of October, largely pricing in a
swift economic recovery in our view. Since 1995,
the 12-month forward PE for MSCI China has
traded in a wide range of 5-35x. The current
valuation of 11.1x appears a reasonable level
compared to the recent trough of 6x and the
average of 13x since 1995. Our 2009 index targets
remain unchanged: 16,000 for HSI, 9,000 for
HSCEI (H-share), 3,500 for HSCCI (red-chip)
and 2,300 for SHCOMP (A-share). We
downgrade China to neutral as upside to our
targets is now limited.
The market could be volatile in 2Q09 as: 1) views
are still divided on the sustainability of China’s
recovery and the effectiveness of developed
countries’ fiscal/monetary policy mix in reviving
credit markets and economic growth, particularly
next year; 2) industrial enterprises’ profit growthmay not return to positive territory until 2H09.
Our top-down profit forecast model, based on
seasonally adjusted M1 growth, suggests y-o-y
profit growth could remain negative 20-30% for
the first three quarters and turn positive (+5-10%)
only in 4Q09. On a sequential basis, q-o-q profit
growth could turn positive in 2Q09.
Our sector allocation strategy of overweighting
cyclicals at the cost of banks and telecoms has
been in place since 4Q08 (see China Investment
Atlas, issue 17, page 14). We think investors
should take profit on materials and IT sectors; we
downgrade both to underweight. Given the
stabilising A-share market, lower probability of
asymmetrical rate cuts and potential improvement
in loan mix, we raise the banking sector to neutral.
We retain overweights on energy, IPPs and
consumer staples; neutral on capital goods,
insurance, consumer discretionary, airlines and
property; and underweight on telecoms.
China (neutral) &Hong Kong (neutral)
Sharp market rebound is pricing in a swift economic recovery
Downgrade MSCI China to neutral
Rotate from cyclicals to banks

7/31/2019 Asia Insights the Long Climb Back Apr-1
http://slidepdf.com/reader/full/asia-insights-the-long-climb-back-apr-1 29/82
29
Equity Strategy
Pan-Asia
Second Quarter 2009
abc
China1. Return (%, USD) 2. Valuation
MSCI China HSCEI 2009 2010
3-month 5.1 4.9 PE (X) 11.6 9.96-month -14.6 -17.2 P/B (X) 1.6 1.512-month -28.2 -25.6 Dividend yield (%) 3.1 3.524-month -16.9 -15.0
3. Q1 2009 sector performance % 4. Earnings (%)
Sector Perf Sector Perf 2009 2010
Materials 25.9 Industrials 5.6 Earnings growth (y-o-y) 1.4 17.6Technology 17.2 Uti li ties 5.1 ROE 13.5 15.6Consumer Discretionary 16.2 Consumer Staples 0.0 ROA 2.1 2.3Energy 11.7 Telecom -8.2 Net debt/ equity ratio -72.7 -74.6
Financials 6.1
Notes: Performance for Q1 2009 is up to 2 4 Mar 2009; ^^ for full explanatory notes Valuation & Earnings tables, please see Databook section on page 48; Source: HSBC, I/B/E/S
5. Market performance 6. Earnings momentum
20
40
60
80
100
120
140
Mar-08 May-08 Jul-08 Sep-08 Nov-08 Jan-09 Mar-09
Cyclicals Defensive EnergyFinancials IT TelecomsMain index
-40-30-20-10
010203040
M a r - 9 6
M a r - 9 7
M a r - 9 8
M a r - 9 9
M a r - 0 0
M a r - 0 1
M a r - 0 2
M a r - 0 3
M a r - 0 4
M a r - 0 5
M a r - 0 6
M a r - 0 7
M a r - 0 8
M a r - 0 9
China 6-month earning momentum
Source: HSBC Note: Earnings momentum = 6M % change in 12M forward consensus forecast Source: HSBC
7. Economy 8. Valuation
Consensus forecast on Real GDP growth
6%
7%
8%
9%
10%
11%
12%
J u n - 0 5
S e p - 0 5
D e c - 0 5
M a r - 0 6
J u n - 0 6
S e p - 0 6
D e c - 0 6
M a r - 0 7
J u n - 0 7
S e p - 0 7
D e c - 0 7
M a r - 0 8
J u n - 0 8
S e p - 0 8
D e c - 0 8
M a r - 0 9
2007 2008 2009 2010
5x
10x
15x
20x
25x
30x
35x
40x
M a r - 9 6
M a r - 9 7
M a r - 9 8
M a r - 9 9
M a r - 0 0
M a r - 0 1
M a r - 0 2
M a r - 0 3
M a r - 0 4
M a r - 0 5
M a r - 0 6
M a r - 0 7
M a r - 0 8
M a r - 0 9
12-month fwd PE
Source: Consensus Economics, HSBC Source: HSBC
9. Earnings 10. Foreign flows
-80
-60-40
-20
0
20
40
60
80
100
1996 1998 2000 2002 2004 2006 2008 2010
%
y - o - y
China
02
46
810
12
1416
18
A p r - 0 4
J u l - 0 4
O c t - 0 4
J a n - 0 5
A p r - 0 5
J u l - 0 5
O c t - 0 5
J a n - 0 6
A p r - 0 6
J u l - 0 6
O c t - 0 6
J a n - 0 7
A p r - 0 7
J u l - 0 7
O c t - 0 7
J a n - 0 8
A p r - 0 8
J u l - 0 8
O c t - 0 8
J a n - 0 9
U S D b n
Source: I/B/E/S, HSBC Source: EPFR, HSBC
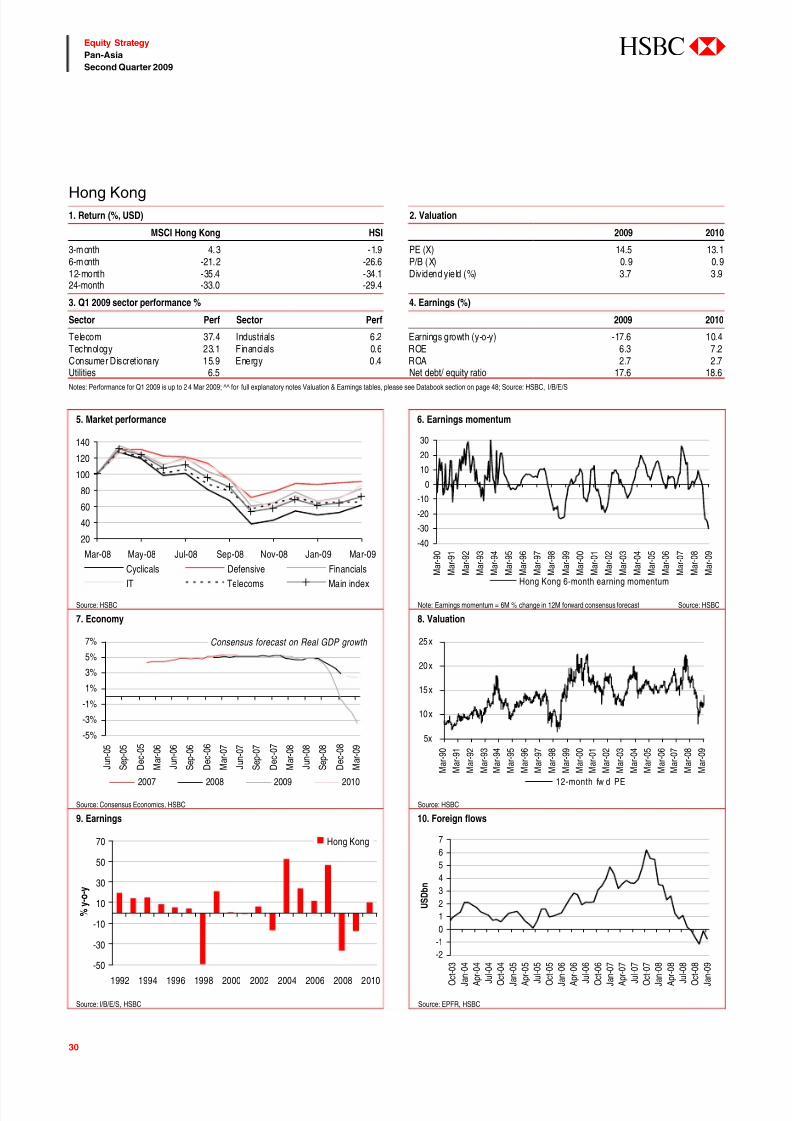
7/31/2019 Asia Insights the Long Climb Back Apr-1
http://slidepdf.com/reader/full/asia-insights-the-long-climb-back-apr-1 30/82
30
Equity Strategy
Pan-Asia
Second Quarter 2009
abc
Hong Kong1. Return (%, USD) 2. Valuation
MSCI Hong Kong HSI 2009 2010
3-month 4.3 -1.9 PE (X) 14.5 13.16-month -21.2 -26.6 P/B (X) 0.9 0.912-month -35.4 -34.1 Dividend yield (%) 3.7 3.924-month -33.0 -29.4
3. Q1 2009 sector performance % 4. Earnings (%)
Sector Perf Sector Perf 2009 2010
Telecom 37.4 Industrials 6.2 Earnings growth (y-o-y) -17.6 10.4Technology 23.1 Financials 0.6 ROE 6.3 7.2Consumer Discretionary 15.9 Energy 0.4 ROA 2.7 2.7Utilities 6.5 Net debt/ equity ratio 17.6 18.6
Notes: Performance for Q1 2009 is up to 2 4 Mar 2009; ^^ for full explanatory notes Valuation & Earnings tables, please see Databook section on page 48; Source: HSBC, I/B/E/S
5. Market performance 6. Earnings momentum
20
40
60
80
100
120
140
Mar-08 May-08 Jul-08 Sep-08 Nov-08 Jan-09 Mar-09
Cyclicals Defensive FinancialsIT Telecoms Main index
-40
-30
-20
-10
0
10
20
30
M
a r - 9 0
M
a r - 9 1
M
a r - 9 2
M
a r - 9 3
M
a r - 9 4
M
a r - 9 5
M
a r - 9 6
M
a r - 9 7
M
a r - 9 8
M
a r - 9 9
M
a r - 0 0
M
a r - 0 1
M
a r - 0 2
M
a r - 0 3
M
a r - 0 4
M
a r - 0 5
M
a r - 0 6
M
a r - 0 7
M
a r - 0 8
M
a r - 0 9
Hong Kong 6-month earning momentum
Source: HSBC Note: Earnings momentum = 6M % change in 12M forward consensus forecast Source: HSBC
7. Economy 8. Valuation
Consensus forecast on Real GDP growth
-5%
-3%
-1%
1%
3%
5%
7%
J u
n - 0 5
S e
p - 0 5
D e c - 0 5
M
a r - 0 6
J u
n - 0 6
S e
p - 0 6
D e c - 0 6
M
a r - 0 7
J u
n - 0 7
S e
p - 0 7
D e c - 0 7
M
a r - 0 8
J u
n - 0 8
S e
p - 0 8
D e c - 0 8
M
a r - 0 9
2007 2008 2009 2010
5x
10x
15x
20x
25x
M a
r - 9 0
M a
r - 9 1
M a
r - 9 2
M a
r - 9 3
M a
r - 9 4
M a
r - 9 5
M a
r - 9 6
M a
r - 9 7
M a
r - 9 8
M a
r - 9 9
M a
r - 0 0
M a
r - 0 1
M a
r - 0 2
M a
r - 0 3
M a
r - 0 4
M a
r - 0 5
M a
r - 0 6
M a
r - 0 7
M a
r - 0 8
M a
r - 0 9
12-month fw d PE
Source: Consensus Economics, HSBC Source: HSBC
9. Earnings 10. Foreign flows
-50
-30
-10
10
30
50
70
1992 1994 1996 1998 2000 2002 2004 2006 2008 2010
% y - o - y
Hong Kong
-2
-1
0
1
2
3
4
5
6
7
O c t - 0 3
J a n - 0 4
A p r - 0 4
J u l - 0 4
O c t - 0 4
J a n - 0 5
A p r - 0 5
J u l - 0 5
O c t - 0 5
J a n - 0 6
A p r - 0 6
J u l - 0 6
O c t - 0 6
J a n - 0 7
A p r - 0 7
J u l - 0 7
O c t - 0 7
J a n - 0 8
A p r - 0 8
J u l - 0 8
O c t - 0 8
J a n - 0 9
U S D b n
Source: I/B/E/S, HSBC Source: EPFR, HSBC

7/31/2019 Asia Insights the Long Climb Back Apr-1
http://slidepdf.com/reader/full/asia-insights-the-long-climb-back-apr-1 31/82
31
Equity Strategy
Pan-Asia
Second Quarter 2009
abc
This page has been left blank intentionally.
7/31/2019 Asia Insights the Long Climb Back Apr-1
http://slidepdf.com/reader/full/asia-insights-the-long-climb-back-apr-1 32/82
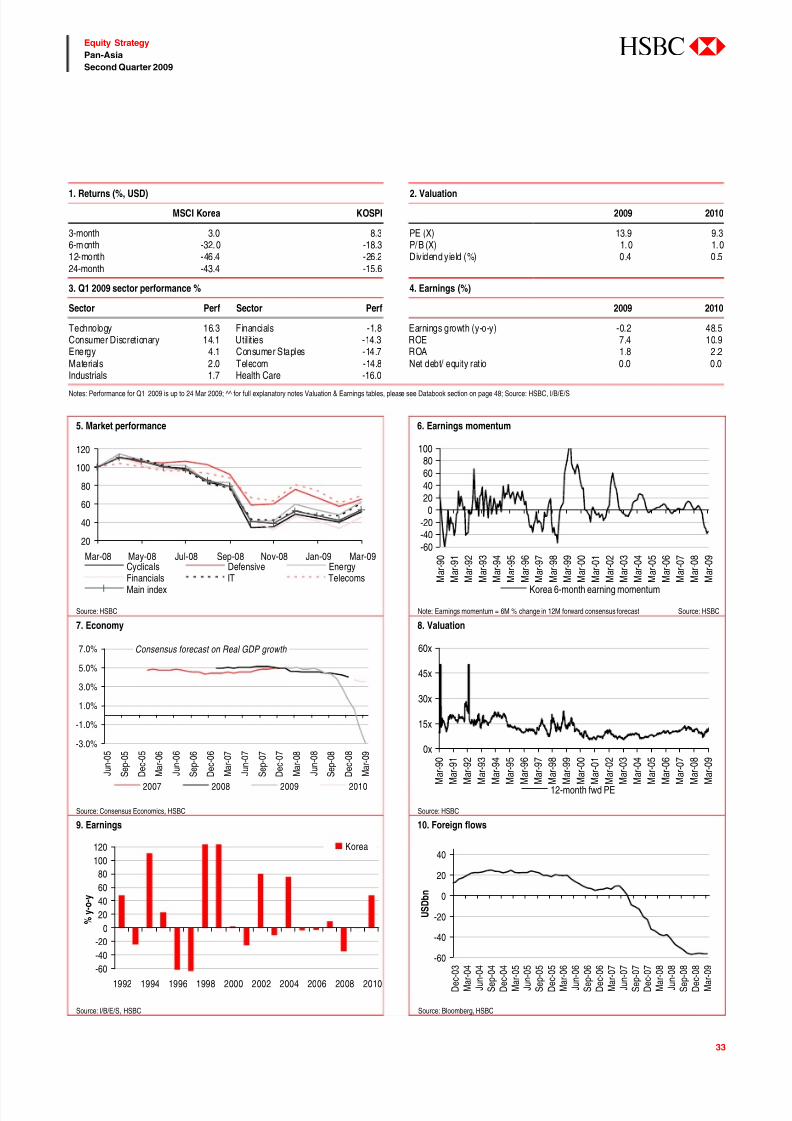
7/31/2019 Asia Insights the Long Climb Back Apr-1
http://slidepdf.com/reader/full/asia-insights-the-long-climb-back-apr-1 33/82
33
Equity Strategy
Pan-Asia
Second Quarter 2009
abc
1. Returns (%, USD) 2. Valuation
MSCI Korea KOSPI 2009 2010
3-month 3.0 8.3 PE (X) 13.9 9.36-month -32.0 -18.3 P/B (X) 1.0 1.012-month -46.4 -26.2 Dividend yield (%) 0.4 0.524-month -43.4 -15.6
3. Q1 2009 sector performance % 4. Earnings (%)
Sector Perf Sector Perf 2009 2010
Technology 16.3 Financials -1.8 Earnings growth (y-o-y) -0.2 48.5Consumer Discretionary 14.1 Utilities -14.3 ROE 7.4 10.9Energy 4.1 Consumer Staples -14.7 ROA 1.8 2.2Materials 2.0 Telecom -14.8 Net debt/ equity ratio 0.0 0.0Industrials 1.7 Health Care -16.0
Notes: Performance for Q1 2009 is up to 24 Mar 2009; ^^ for full explanatory notes Valuation & Earnings tables, please see Databook section on page 48; Source: HSBC, I/B/E/S
5. Market performance 6. Earnings momentum
20
40
60
80
100
120
Mar-08 May-08 Jul-08 Sep-08 Nov-08 Jan-09 Mar-09Cyclicals Defensive EnergyFinancials IT TelecomsMain index
-60-40-20
020406080
100
M a
r - 9 0
M a
r - 9 1
M a
r - 9 2
M a
r - 9 3
M a
r - 9 4
M a
r - 9 5
M a
r - 9 6
M a
r - 9 7
M a
r - 9 8
M a
r - 9 9
M a
r - 0 0
M a
r - 0 1
M a
r - 0 2
M a
r - 0 3
M a
r - 0 4
M a
r - 0 5
M a
r - 0 6
M a
r - 0 7
M a
r - 0 8
M a
r - 0 9
Korea 6-month earning momentum
Source: HSBC Note: Earnings momentum = 6M % change in 12M forward consensus forecast Source: HSBC
7. Economy 8. Valuation
Consensus forecast on Real GDP growth
-3.0%
-1.0%
1.0%
3.0%
5.0%
7.0%
J u n
- 0 5
S e p
- 0 5
D e c
- 0 5
M a r
- 0 6
J u n
- 0 6
S e p
- 0 6
D e c
- 0 6
M a r
- 0 7
J u n
- 0 7
S e p
- 0 7
D e c
- 0 7
M a r
- 0 8
J u n
- 0 8
S e p
- 0 8
D e c
- 0 8
M a r
- 0 9
2007 2008 2009 2010
0x
15x
30x
45x
60x
M a r - 9
0
M a r - 9
1
M a r - 9
2
M a r - 9
3
M a r - 9
4
M a r - 9
5
M a r - 9
6
M a r - 9
7
M a r - 9
8
M a r - 9
9
M a r - 0
0
M a r - 0
1
M a r - 0
2
M a r - 0
3
M a r - 0
4
M a r - 0
5
M a r - 0
6
M a r - 0
7
M a r - 0
8
M a r - 0
9
12-month fwd PE
Source: Consensus Economics, HSBC Source: HSBC
9. Earnings 10. Foreign flows
-60-40
-20
0
20
40
60
80
100
120
1992 1994 1996 1998 2000 2002 2004 2006 2008 2010
%
y - o - y
Korea
-60
-40
-20
0
20
40
D e c - 0 3
M a r - 0 4
J u n - 0 4
S e p - 0 4
D e c - 0 4
M a r - 0 5
J u n - 0 5
S e p - 0 5
D e c - 0 5
M a r - 0 6
J u n - 0 6
S e p - 0 6
D e c - 0 6
M a r - 0 7
J u n - 0 7
S e p - 0 7
D e c - 0 7
M a r - 0 8
J u n - 0 8
S e p - 0 8
D e c - 0 8
M a r - 0 9
U S D b n
Source: I/B/E/S, HSBC Source: Bloomberg, HSBC
7/31/2019 Asia Insights the Long Climb Back Apr-1
http://slidepdf.com/reader/full/asia-insights-the-long-climb-back-apr-1 34/82
34
Equity Strategy
Pan-Asia
Second Quarter 2009
abc
Toughened up by hard times
We raise Taiwan to overweight from neutral
based on lowered expectations, strong balance
sheets and the catalyst of improving cross-Strait
relations. Since the turn of the millennium,
Taiwan has experienced a harsh time with the tech
bubble burst and then a depressed economy undercross-Strait tensions. But Taiwan learned some
valuable lessons from these episodes that may
make its equity market more resilient than others
in the current downturn.
First, analysts covering Taiwan learned to price in
the downturn at first sight of the problem.
Forecasts for 2009 earnings have been revised
down by 79% over the past six months. This is the
sharpest revision in Asia ex-Japan, almost double
that in Korea. Above all, tech analysts have been
the most agile, bringing earnings down by 103%
over the past six months; they now forecast a loss
for the sector in 2009. With rush orders starting to
come in, partly helped by the stimulus package in
China, this sector is more likely to surprise on the
upside from here on. Thus, we raise tech to
overweight from underweight.
Second, companies now have much stronger
balance sheets to help them weather the crisis:
40% of listed companies have net cash, including
some heavyweights such as HTC and Mediatek
(net debt/equity ratios are -102% and -53%
respectively). The weighted average net
debt/equity ratio in Taiwan is 5%, compared to
15% in Singapore and 39% in Korea. Lower
leverage makes investing in Taiwan more
comfortable than in other markets during a credit
crunch.
Lastly, realising that a stand-still with Beijing will
not help to revive the economy, the more market-
friendly KMT government is gearing up for the
third round of cross-Strait negotiations which will
focus on financial cooperation. We do not believe
that the short-term benefits to Taiwanese banks of
doing business in the mainland will be more than
minimal, but a successful agreement will be a
good catalyst to boost sentiment. We maintain
overweight on financials.
Our economist expects GDP to contract by 6.2%
in 2009 and the unemployment rate to rise to
6.4%, higher than during the 2001 tech bust. We
acknowledge the weakness in the economy and
see possible downside risk from slack domestic
demand. But cautiously picking well-managed
blue chip companies in this market should be a
relatively safe way to get cyclical exposure. With
this backdrop, we raise Taiwan to overweight andhave tech and financials as our favourite sectors.
Taiwan (overweight)
We raise to overweight based on realistic forecasts, strong
balance sheets and the cross-Strait catalyst
Key is identifying sectors that have priced in most of the bad news
We recommend overweights on technology and financials
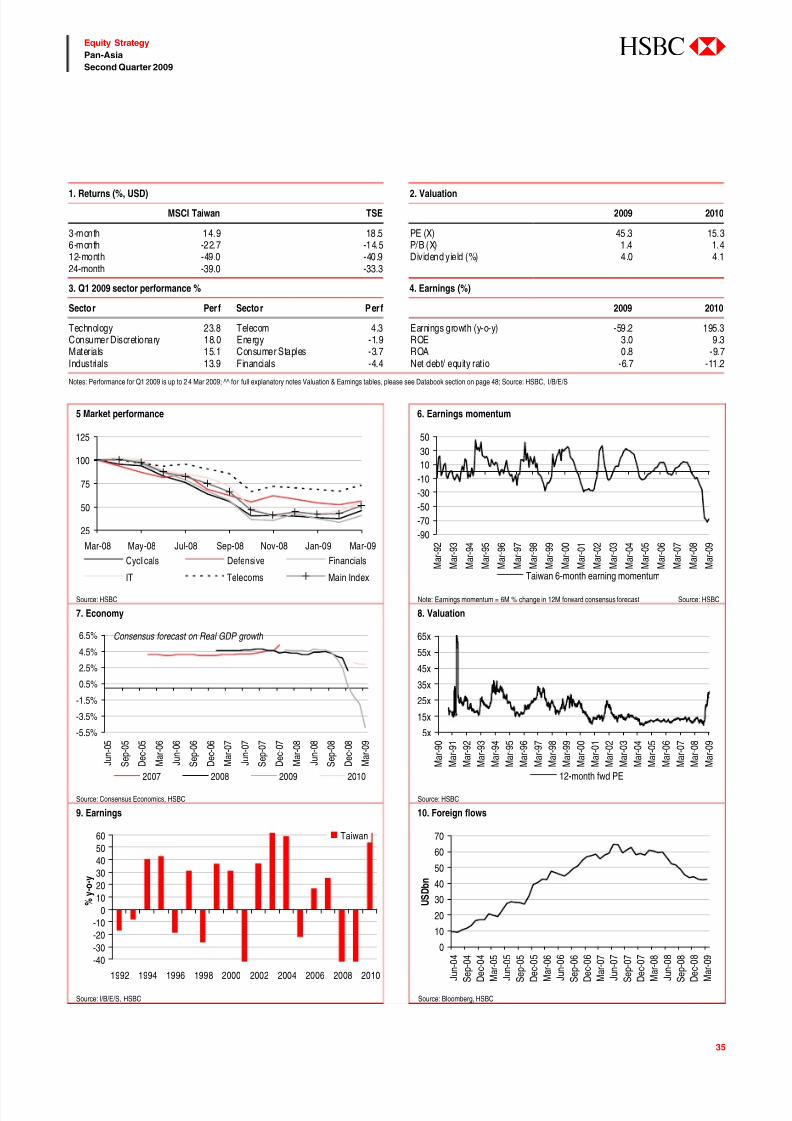
7/31/2019 Asia Insights the Long Climb Back Apr-1
http://slidepdf.com/reader/full/asia-insights-the-long-climb-back-apr-1 35/82
35
Equity Strategy
Pan-Asia
Second Quarter 2009
abc
1. Returns (%, USD) 2. Valuation
MSCI Taiwan TSE 2009 2010
3-month 14.9 18.5 PE (X) 45.3 15.36-month -22.7 -14.5 P/B (X) 1.4 1.412-month -49.0 -40.9 Dividend yield (%) 4.0 4.124-month -39.0 -33.3
3. Q1 2009 sector performance % 4. Earnings (%)
Sector Perf Sector Perf 2009 2010
Technology 23.8 Telecom 4.3 Earnings growth (y-o-y) -59.2 195.3Consumer Discretionary 18.0 Energy -1.9 ROE 3.0 9.3Materials 15.1 Consumer Staples -3.7 ROA 0.8 -9.7Industrials 13.9 Financials -4.4 Net debt/ equity ratio -6.7 -11.2
Notes: Performance for Q1 2009 is up to 2 4 Mar 2009; ^^ for full explanatory notes Valuation & Earnings tables, please see Databook section on page 48; Source: HSBC, I/B/E/S
5 Market performance 6. Earnings momentum
25
50
75
100
125
Mar-08 May-08 Jul-08 Sep-08 Nov-08 Jan-09 Mar-09
Cyclicals Defensive Financials
IT Telecoms Main Index
-90
-70
-50
-30
-10
10
30
50
M a r - 9 2
M a r - 9 3
M a r - 9 4
M a r - 9 5
M a r - 9 6
M a r - 9 7
M a r - 9 8
M a r - 9 9
M a r - 0 0
M a r - 0 1
M a r - 0 2
M a r - 0 3
M a r - 0 4
M a r - 0 5
M a r - 0 6
M a r - 0 7
M a r - 0 8
M a r - 0 9
Taiwan 6-month earning momentum
Source: HSBC Note: Earnings momentum = 6M % change in 12M forward consensus forecast Source: HSBC
7. Economy 8. Valuation
Consensus forecast on Real GDP growth
-5.5%
-3.5%
-1.5%
0.5%
2.5%
4.5%
6.5%
J
u n - 0 5
S
e p - 0 5
D
e c - 0 5
M
a r - 0 6
J
u n - 0 6
S
e p - 0 6
D
e c - 0 6
M
a r - 0 7
J
u n - 0 7
S
e p - 0 7
D
e c - 0 7
M
a r - 0 8
J
u n - 0 8
S
e p - 0 8
D
e c - 0 8
M
a r - 0 9
2007 2008 2009 2010
5x
15x
25x
35x
45x
55x
65x
M
a r - 9 0
M
a r - 9 1
M
a r - 9 2
M
a r - 9 3
M
a r - 9 4
M
a r - 9 5
M
a r - 9 6
M
a r - 9 7
M
a r - 9 8
M
a r - 9 9
M
a r - 0 0
M
a r - 0 1
M
a r - 0 2
M
a r - 0 3
M
a r - 0 4
M
a r - 0 5
M
a r - 0 6
M
a r - 0 7
M
a r - 0 8
M
a r - 0 9
12-month fwd PE
Source: Consensus Economics, HSBC Source: HSBC
9. Earnings 10. Foreign flows
-40
-30
-20
-10
0
10
20
30
40
50
60
1992 1994 1996 1998 2000 2002 2004 2006 2008 2010
% y - o - y
Taiwan
0
10
20
30
40
50
60
70
J u n - 0 4
S e p - 0 4
D e c - 0 4
M a r - 0 5
J u n - 0 5
S e p - 0 5
D e c - 0 5
M a r - 0 6
J u n - 0 6
S e p - 0 6
D e c - 0 6
M a r - 0 7
J u n - 0 7
S e p - 0 7
D e c - 0 7
M a r - 0 8
J u n - 0 8
S e p - 0 8
D e c - 0 8
M a r - 0 9
U S D b n
Source: I/B/E/S, HSBC Source: Bloomberg, HSBC
7/31/2019 Asia Insights the Long Climb Back Apr-1
http://slidepdf.com/reader/full/asia-insights-the-long-climb-back-apr-1 36/82
36
Equity Strategy
Pan-Asia
Second Quarter 2009
abc
Pessimism overdone
India’s valuation premium has shrunk in the past
five months and Indian markets are now cheaper
than many peers. For example, India’s PE of
11.4x is lower than Korea, Malaysia and Taiwan,
and similar to China – all markets to which it has
typically traded at a premium.
Moreover, prospects for corporate earnings in
India are stronger than for other Asian markets.
We expect earnings for MSCI India to grow 5-
10% in CY2009e (against a consensus expectation
of 3.6%), whereas consensus for Asia ex Japan is
for earnings to drop by 11%.
Our economics team forecasts Indian GDP to
grow by about 6% this year, which makes India
the second fastest growing economy in the region.
While this represents a significant slowdown andeconomic conditions will be tough, relatively
speaking it is a stellar performance compared to
most economies. Also, we expect the quarter
ending June 2008 to be the trough of the
economic cycle, with growth accelerating in late
2009/early 2010, on account of the lagged effects
of monetary easing, fiscal stimulus, the decline of
commodity prices and additional oil and gas
output.
What will matter towards the latter half of the
year, however, will be the outlook for CY2010,
when we expect the economy to grow at 7.6%,
and corporate earnings to grow close to trend
levels of 10-12%.
We doubt if this is priced in. At the current index
level, the market is implying flat to a 10% decline
for corporate earnings. The market may be
pleasantly surprised towards the end of 2009.
India’s markets face two major risks: one is an
event risk (the election), and the second is a
structural risk arising out of the state of public
finances.
We think the next government is likely to be a
coalition anchored by the BJP or Congress Party.
Most recent opinion polls indicate that the
Congress-led coalition has the edge but elections
are difficult to call.
India has one of the world’s highest ratios of
outstanding public debt as a percentage of GDP,
and the current fiscal slippage is a concern. Fiscal
consolidation will be a key task for the next
government. In the past, economic reforms have
been triggered by economic crisis, and a Congress
or BJP-led government may accelerate economic
reforms, which would boost sentiment.
In our sector recommendations, we are
overweight banks (which we upgrade from
underweight) and energy, and underweightconsumer discretionary, materials and healthcare.
India (overweight)
Earnings and GDP growth likely to provide positive surprises
Elections and the state of public finances are the major risks
We upgrade banks to overweight
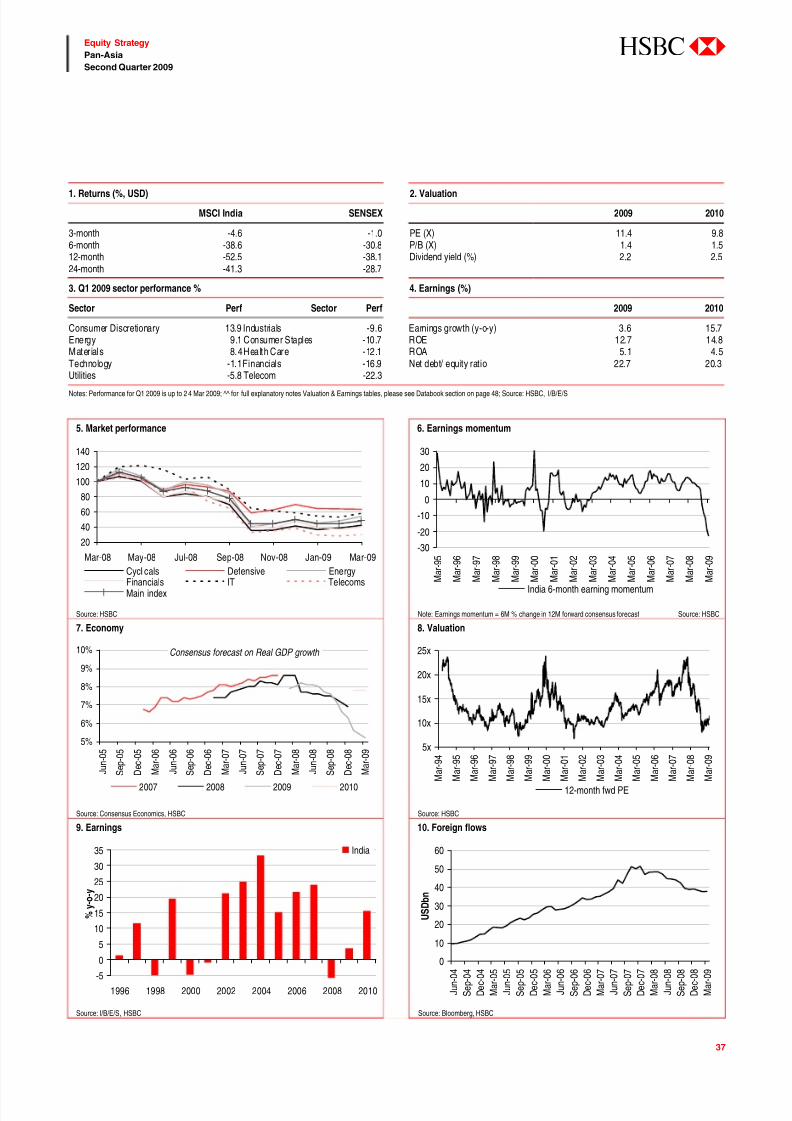
7/31/2019 Asia Insights the Long Climb Back Apr-1
http://slidepdf.com/reader/full/asia-insights-the-long-climb-back-apr-1 37/82
37
Equity Strategy
Pan-Asia
Second Quarter 2009
abc
1. Returns (%, USD) 2. Valuation
MSCI India SENSEX 2009 2010
3-month -4.6 -1.0 PE (X) 11.4 9.86-month -38.6 -30.8 P/B (X) 1.4 1.512-month -52.5 -38.1 Dividend yield (%) 2.2 2.524-month -41.3 -28.7
3. Q1 2009 sector performance % 4. Earnings (%)
Sector Perf Sector Perf 2009 2010
Consumer Discretionary 13.9 Industrials -9.6 Earnings growth (y-o-y) 3.6 15.7Energy 9.1 Consumer Staples -10.7 ROE 12.7 14.8Materials 8.4Health Care -12.1 ROA 5.1 4.5Technology -1.1Financials -16.9 Net debt/ equity ratio 22.7 20.3Utilities -5.8 Telecom -22.3
Notes: Performance for Q1 2009 is up to 2 4 Mar 2009; ^^ for full explanatory notes Valuation & Earnings tables, please see Databook section on page 48; Source: HSBC, I/B/E/S
5. Market performance 6. Earnings momentum
20
40
60
80
100
120
140
Mar-08 May-08 Jul-08 Sep-08 Nov-08 Jan-09 Mar-09
Cyclicals Defensive EnergyFinancials IT TelecomsMain index
-30
-20
-10
0
10
20
30
M a
r - 9 5
M a
r - 9 6
M a
r - 9 7
M a
r - 9 8
M a
r - 9 9
M a
r - 0 0
M a
r - 0 1
M a
r - 0 2
M a
r - 0 3
M a
r - 0 4
M a
r - 0 5
M a
r - 0 6
M a
r - 0 7
M a
r - 0 8
M a
r - 0 9
India 6-month earning momentum
Source: HSBC Note: Earnings momentum = 6M % change in 12M forward consensus forecast Source: HSBC
7. Economy 8. Valuation
Consensus forecast on Real GDP growth
5%
6%
7%
8%
9%
10%
J u n
- 0 5
S e p
- 0 5
D e c
- 0 5
M a r - 0 6
J u n
- 0 6
S e p
- 0 6
D e c
- 0 6
M a r - 0 7
J u n
- 0 7
S e p
- 0 7
D e c
- 0 7
M a r - 0 8
J u n
- 0 8
S e p
- 0 8
D e c
- 0 8
M a r - 0 9
2007 2008 2009 2010
5x
10x
15x
20x
25x
M a r - 9 4
M a r - 9 5
M a r - 9 6
M a r - 9 7
M a r - 9 8
M a r - 9 9
M a r - 0 0
M a r - 0 1
M a r - 0 2
M a r - 0 3
M a r - 0 4
M a r - 0 5
M a r - 0 6
M a r - 0 7
M a r - 0 8
M a r - 0 9
12-month fwd PE
Source: Consensus Economics, HSBC Source: HSBC
9. Earnings 10. Foreign flows
-5
0
5
10
15
20
25
30
35
1996 1998 2000 2002 2004 2006 2008 2010
%
y - o - y
India
0
10
20
30
40
50
60
J u n - 0 4
S e p - 0 4
D e c - 0 4
M a r - 0 5
J u n - 0 5
S e p - 0 5
D e c - 0 5
M a r - 0 6
J u n - 0 6
S e p - 0 6
D e c - 0 6
M a r - 0 7
J u n - 0 7
S e p - 0 7
D e c - 0 7
M a r - 0 8
J u n - 0 8
S e p - 0 8
D e c - 0 8
M a r - 0 9
U S D b n
Source: I/B/E/S, HSBC Source: Bloomberg, HSBC

7/31/2019 Asia Insights the Long Climb Back Apr-1
http://slidepdf.com/reader/full/asia-insights-the-long-climb-back-apr-1 38/82

7/31/2019 Asia Insights the Long Climb Back Apr-1
http://slidepdf.com/reader/full/asia-insights-the-long-climb-back-apr-1 39/82
39
Equity Strategy
Pan-Asia
Second Quarter 2009
abc
Other markets
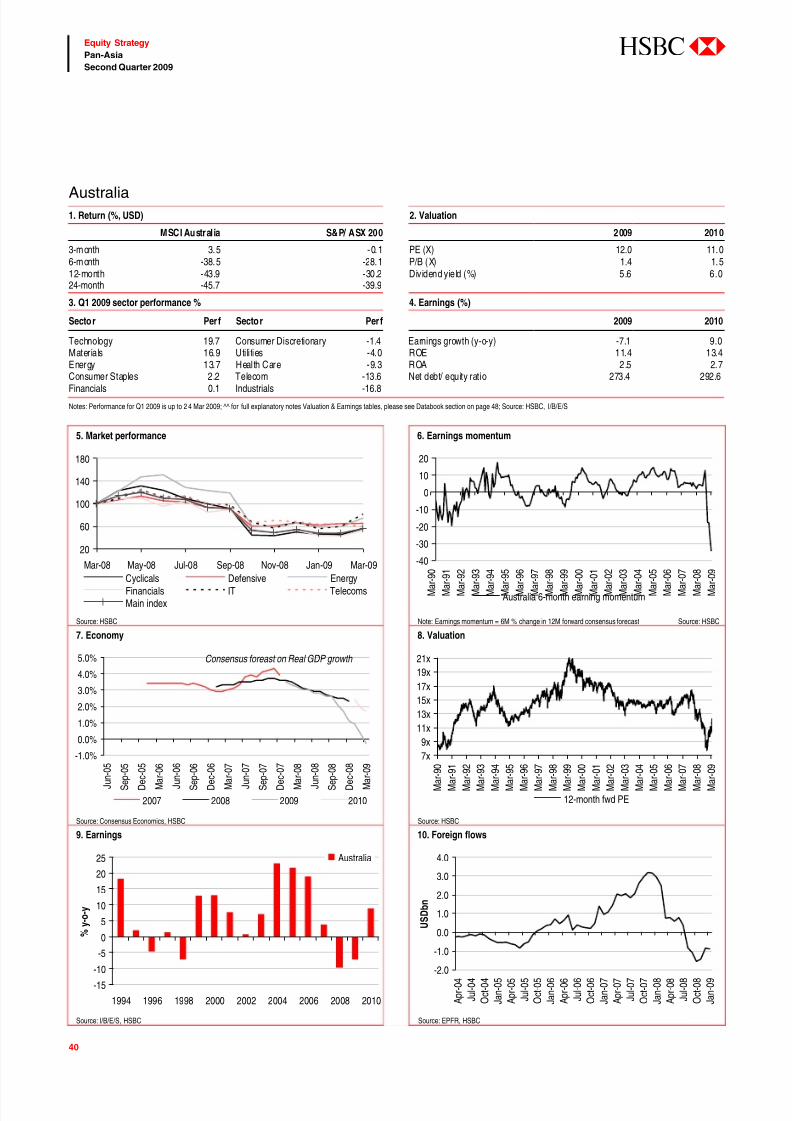
7/31/2019 Asia Insights the Long Climb Back Apr-1
http://slidepdf.com/reader/full/asia-insights-the-long-climb-back-apr-1 40/82
40
Equity Strategy
Pan-Asia
Second Quarter 2009
abc
Australia1. Return (%, USD) 2. Valuation
MSCI Austral ia S&P/ ASX 200 2009 2010
3-month 3.5 -0.1 PE (X) 12.0 11.06-month -38.5 -28.1 P/B (X) 1.4 1.512-month -43.9 -30.2 Dividend yield (%) 5.6 6.024-month -45.7 -39.9
3. Q1 2009 sector performance % 4. Earnings (%)
Sector Perf Sector Perf 2009 2010
Technology 19.7 Consumer Discretionary -1.4 Earnings growth (y-o-y) -7.1 9.0Materials 16.9 Uti li ties -4.0 ROE 11.4 13.4Energy 13.7 Heal th Care -9.3 ROA 2.5 2.7Consumer Staples 2.2 Telecom -13.6 Net debt/ equity ratio 273.4 292.6Financials 0.1 Industrials -16.8
Notes: Performance for Q1 2009 is up to 2 4 Mar 2009; ^^ for full explanatory notes Valuation & Earnings tables, please see Databook section on page 48; Source: HSBC, I/B/E/S
5. Market performance 6. Earnings momentum
20
60
100
140
180
Mar-08 May-08 Jul-08 Sep-08 Nov-08 Jan-09 Mar-09
Cyclicals Defensive Energy
Financials IT TelecomsMain index
-40
-30
-20
-10
0
10
20
M a r - 9 0
M a r - 9 1
M a r - 9 2
M a r - 9 3
M a r - 9 4
M a r - 9 5
M a r - 9 6
M a r - 9 7
M a r - 9 8
M a r - 9 9
M a r - 0 0
M a r - 0 1
M a r - 0 2
M a r - 0 3
M a r - 0 4
M a r - 0 5
M a r - 0 6
M a r - 0 7
M a r - 0 8
M a r - 0 9
Australia 6-month earning momentum
Source: HSBC Note: Earnings momentum = 6M % change in 12M forward consensus forecast Source: HSBC
7. Economy 8. Valuation
Consensus foreast on Real GDP growth
-1.0%
0.0%
1.0%
2.0%
3.0%
4.0%
5.0%
J u n - 0 5
S e p - 0 5
D e c - 0 5
M a r - 0 6
J u n - 0 6
S e p - 0 6
D e c - 0 6
M a r - 0 7
J u n - 0 7
S e p - 0 7
D e c - 0 7
M a r - 0 8
J u n - 0 8
S e p - 0 8
D e c - 0 8
M a r - 0 9
2007 2008 2009 2010
7x
9x
11x
13x
15x
17x
19x
21x
M a r - 9 0
M a r - 9 1
M a r - 9 2
M a r - 9 3
M a r - 9 4
M a r - 9 5
M a r - 9 6
M a r - 9 7
M a r - 9 8
M a r - 9 9
M a r - 0 0
M a r - 0 1
M a r - 0 2
M a r - 0 3
M a r - 0 4
M a r - 0 5
M a r - 0 6
M a r - 0 7
M a r - 0 8
M a r - 0 9
12-month fwd PE
Source: Consensus Economics, HSBC Source: HSBC
9. Earnings 10. Foreign flows
-15
-10-5
0
5
10
15
20
25
1994 1996 1998 2000 2002 2004 2006 2008 2010
%
y - o - y
Australia
-2.0-1.0
0.0
1.0
2.0
3.0
4.0
A p r - 0 4
J u l - 0 4
O c t - 0 4
J a n - 0 5
A p r - 0 5
J u l - 0 5
O c t - 0 5
J a n - 0 6
A p r - 0 6
J u l - 0 6
O c t - 0 6
J a n - 0 7
A p r - 0 7
J u l - 0 7
O c t - 0 7
J a n - 0 8
A p r - 0 8
J u l - 0 8
O c t - 0 8
J a n - 0 9
U S D b n
Source: I/B/E/S, HSBC Source: EPFR, HSBC
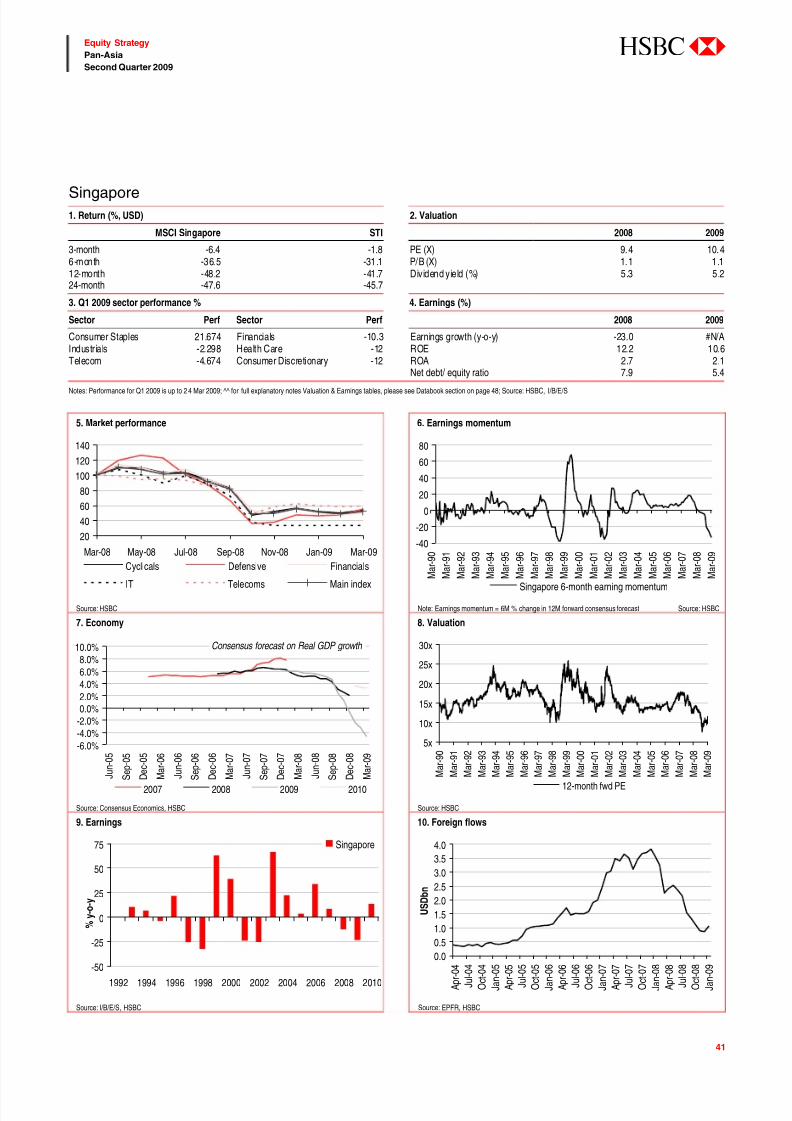
7/31/2019 Asia Insights the Long Climb Back Apr-1
http://slidepdf.com/reader/full/asia-insights-the-long-climb-back-apr-1 41/82
41
Equity Strategy
Pan-Asia
Second Quarter 2009
abc
Singapore1. Return (%, USD) 2. Valuation
MSCI Singapore STI 2008 2009
3-month -6.4 -1.8 PE (X) 9.4 10.46-month -36.5 -31.1 P/B (X) 1.1 1.112-month -48.2 -41.7 Dividend yield (%) 5.3 5.224-month -47.6 -45.7
3. Q1 2009 sector performance % 4. Earnings (%)
Sector Perf Sector Perf 2008 2009
Consumer Staples 21.674 Financials -10.3 Earnings growth (y-o-y) -23.0 #N/AIndustrials -2.298 Health Care -12 ROE 12.2 10.6Telecom -4.674 Consumer Discretionary -12 ROA 2.7 2.1
Net debt/ equity ratio 7.9 5.4
Notes: Performance for Q1 2009 is up to 2 4 Mar 2009; ^^ for full explanatory notes Valuation & Earnings tables, please see Databook section on page 48; Source: HSBC, I/B/E/S
5. Market performance 6. Earnings momentum
20
40
60
80
100
120
140
Mar-08 May-08 Jul-08 Sep-08 Nov-08 Jan-09 Mar-09
Cyclicals Defensive Financials
IT Telecoms Main index
-40
-20
0
20
40
60
80
M
a r - 9 0
M
a r - 9 1
M
a r - 9 2
M
a r - 9 3
M
a r - 9 4
M
a r - 9 5
M
a r - 9 6
M
a r - 9 7
M
a r - 9 8
M
a r - 9 9
M
a r - 0 0
M
a r - 0 1
M
a r - 0 2
M
a r - 0 3
M
a r - 0 4
M
a r - 0 5
M
a r - 0 6
M
a r - 0 7
M
a r - 0 8
M
a r - 0 9
Singapore 6-month earning momentum
Source: HSBC Note: Earnings momentum = 6M % change in 12M forward consensus forecast Source: HSBC
7. Economy 8. Valuation
Consensus forecast on Real GDP growth
-6.0%
-4.0%
-2.0%0.0%2.0%
4.0%
6.0%
8.0%10.0%
J u n -
0 5
S e p -
0 5
D e c -
0 5
M a r -
0 6
J u n -
0 6
S e p -
0 6
D e c -
0 6
M a r -
0 7
J u n -
0 7
S e p -
0 7
D e c -
0 7
M a r -
0 8
J u n -
0 8
S e p -
0 8
D e c -
0 8
M a r -
0 9
2007 2008 2009 2010
5x
10x
15x
20x
25x
30x
M a r
- 9 0
M a r
- 9 1
M a r
- 9 2
M a r
- 9 3
M a r
- 9 4
M a r
- 9 5
M a r
- 9 6
M a r
- 9 7
M a r
- 9 8
M a r
- 9 9
M a r
- 0 0
M a r
- 0 1
M a r
- 0 2
M a r
- 0 3
M a r
- 0 4
M a r
- 0 5
M a r
- 0 6
M a r
- 0 7
M a r
- 0 8
M a r
- 0 9
12-month fwd PE
Source: Consensus Economics, HSBC Source: HSBC
9. Earnings 10. Foreign flows
-50
-25
0
25
50
75
1992 1994 1996 1998 2000 2002 2004 2006 2008 2010
% y - o - y
Singapore
0.0
0.5
1.0
1.5
2.0
2.5
3.0
3.5
4.0
A p r - 0 4
J u l - 0 4
O c t - 0 4
J a n - 0 5
A p r - 0 5
J u l - 0 5
O c t - 0 5
J a n - 0 6
A p r - 0 6
J u l - 0 6
O c t - 0 6
J a n - 0 7
A p r - 0 7
J u l - 0 7
O c t - 0 7
J a n - 0 8
A p r - 0 8
J u l - 0 8
O c t - 0 8
J a n - 0 9
U S D b n
Source: I/B/E/S, HSBC Source: EPFR, HSBC
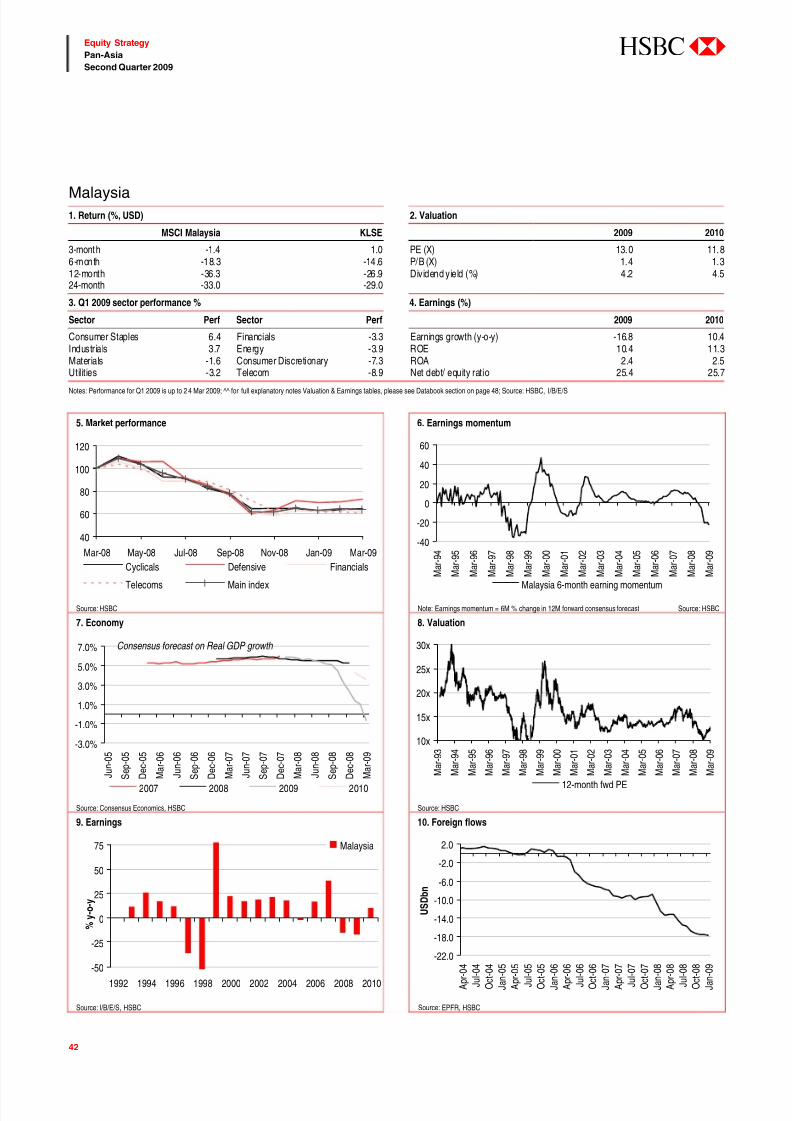
7/31/2019 Asia Insights the Long Climb Back Apr-1
http://slidepdf.com/reader/full/asia-insights-the-long-climb-back-apr-1 42/82
42
Equity Strategy
Pan-Asia
Second Quarter 2009
abc
Malaysia1. Return (%, USD) 2. Valuation
MSCI Malaysia KLSE 2009 2010
3-month -1.4 1.0 PE (X) 13.0 11.86-month -18.3 -14.6 P/B (X) 1.4 1.312-month -36.3 -26.9 Dividend yield (%) 4.2 4.524-month -33.0 -29.0
3. Q1 2009 sector performance % 4. Earnings (%)
Sector Perf Sector Perf 2009 2010
Consumer Staples 6.4 Financials -3.3 Earnings growth (y-o-y) -16.8 10.4Industrials 3.7 Energy -3.9 ROE 10.4 11.3Materials -1.6 Consumer Discretionary -7.3 ROA 2.4 2.5Utilities -3.2 Telecom -8.9 Net debt/ equity ratio 25.4 25.7
Notes: Performance for Q1 2009 is up to 2 4 Mar 2009; ^^ for full explanatory notes Valuation & Earnings tables, please see Databook section on page 48; Source: HSBC, I/B/E/S
5. Market performance 6. Earnings momentum
40
60
80
100
120
Mar-08 May-08 Jul-08 Sep-08 Nov-08 Jan-09 Mar-09
Cyclicals Defensive Financials
Telecoms Main index
-40
-20
0
20
40
60
M
a r - 9 4
M
a r - 9 5
M
a r - 9 6
M
a r - 9 7
M
a r - 9 8
M
a r - 9 9
M
a r - 0 0
M
a r - 0 1
M
a r - 0 2
M
a r - 0 3
M
a r - 0 4
M
a r - 0 5
M
a r - 0 6
M
a r - 0 7
M
a r - 0 8
M
a r - 0 9
Malaysia 6-month earning momentum
Source: HSBC Note: Earnings momentum = 6M % change in 12M forward consensus forecast Source: HSBC
7. Economy 8. Valuation
Consensus forecast on Real GDP growth
-3.0%
-1.0%
1.0%
3.0%
5.0%
7.0%
J u n - 0 5
S e p - 0 5
D e c - 0 5
M a r - 0 6
J u n - 0 6
S e p - 0 6
D e c - 0 6
M a r - 0 7
J u n - 0 7
S e p - 0 7
D e c - 0 7
M a r - 0 8
J u n - 0 8
S e p - 0 8
D e c - 0 8
M a r - 0 9
2007 2008 2009 2010
10x
15x
20x
25x
30x
M a r - 9 3
M a r - 9 4
M a r - 9 5
M a r - 9 6
M a r - 9 7
M a r - 9 8
M a r - 9 9
M a r - 0 0
M a r - 0 1
M a r - 0 2
M a r - 0 3
M a r - 0 4
M a r - 0 5
M a r - 0 6
M a r - 0 7
M a r - 0 8
M a r - 0 9
12-month fwd PE
Source: Consensus Economics, HSBC Source: HSBC
9. Earnings 10. Foreign flows
-50
-25
0
25
50
75
1992 1994 1996 1998 2000 2002 2004 2006 2008 2010
% y - o - y
Malaysia
-22.0
-18.0
-14.0
-10.0
-6.0
-2.0
2.0
A p r - 0 4
J u l - 0 4
O c t - 0 4
J a n - 0 5
A p r - 0 5
J u l - 0 5
O c t - 0 5
J a n - 0 6
A p r - 0 6
J u l - 0 6
O c t - 0 6
J a n - 0 7
A p r - 0 7
J u l - 0 7
O c t - 0 7
J a n - 0 8
A p r - 0 8
J u l - 0 8
O c t - 0 8
J a n - 0 9
U S D b n
Source: I/B/E/S, HSBC Source: EPFR, HSBC
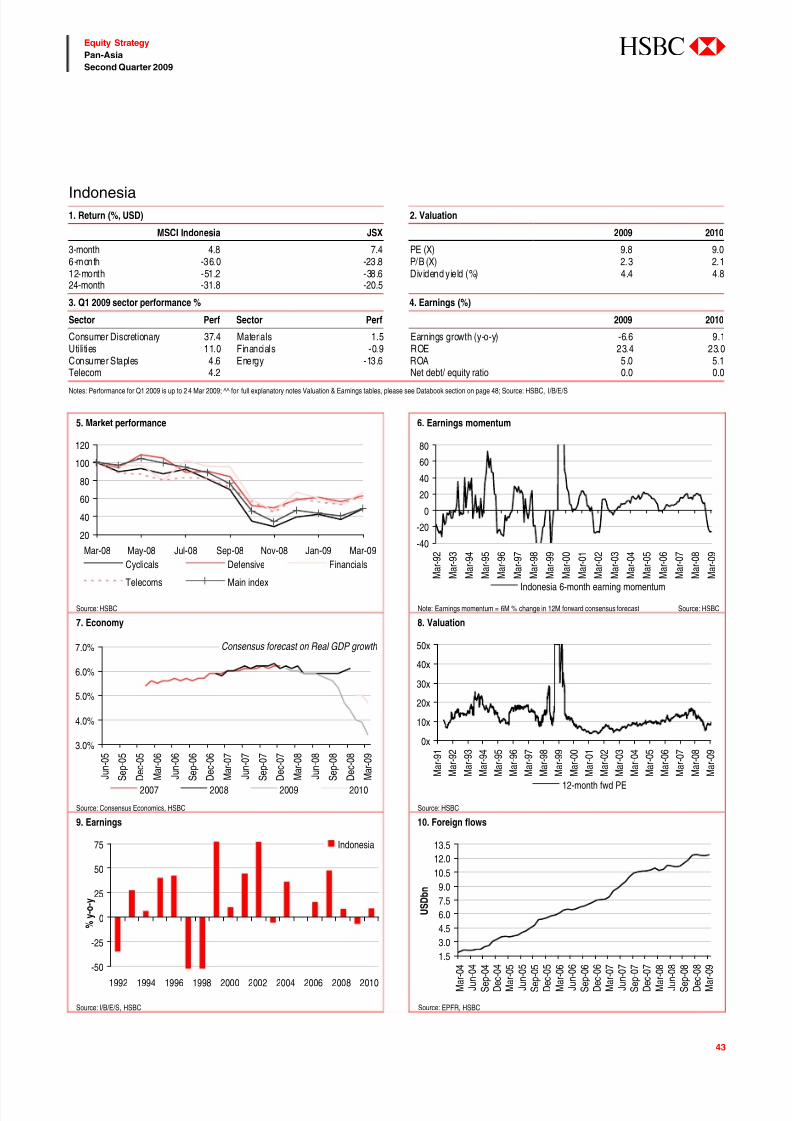
7/31/2019 Asia Insights the Long Climb Back Apr-1
http://slidepdf.com/reader/full/asia-insights-the-long-climb-back-apr-1 43/82
43
Equity Strategy
Pan-Asia
Second Quarter 2009
abc
Indonesia1. Return (%, USD) 2. Valuation
MSCI Indonesia JSX 2009 2010
3-month 4.8 7.4 PE (X) 9.8 9.06-month -36.0 -23.8 P/B (X) 2.3 2.112-month -51.2 -38.6 Dividend yield (%) 4.4 4.824-month -31.8 -20.5
3. Q1 2009 sector performance % 4. Earnings (%)
Sector Perf Sector Perf 2009 2010
Consumer Discretionary 37.4 Materials 1.5 Earnings growth (y-o-y) -6.6 9.1Utilities 11.0 Financials -0.9 ROE 23.4 23.0Consumer Staples 4.6 Energy -13.6 ROA 5.0 5.1Telecom 4.2 Net debt/ equity ratio 0.0 0.0
Notes: Performance for Q1 2009 is up to 2 4 Mar 2009; ^^ for full explanatory notes Valuation & Earnings tables, please see Databook section on page 48; Source: HSBC, I/B/E/S
5. Market performance 6. Earnings momentum
20
40
60
80
100
120
Mar-08 May-08 Jul-08 Sep-08 Nov-08 Jan-09 Mar-09
Cyclicals Defensive Financials
Telecoms Main index
-40
-20
0
20
40
60
80
M
a r - 9 2
M
a r - 9 3
M
a r - 9 4
M
a r - 9 5
M
a r - 9 6
M
a r - 9 7
M
a r - 9 8
M
a r - 9 9
M
a r - 0 0
M
a r - 0 1
M
a r - 0 2
M
a r - 0 3
M
a r - 0 4
M
a r - 0 5
M
a r - 0 6
M
a r - 0 7
M
a r - 0 8
M
a r - 0 9
Indonesia 6-month earning momentum
Source: HSBC Note: Earnings momentum = 6M % change in 12M forward consensus forecast Source: HSBC
7. Economy 8. Valuation
Consensus forecast on Real GDP growth
3.0%
4.0%
5.0%
6.0%
7.0%
J u n -
0 5
S e p -
0 5
D e c -
0 5
M a r -
0 6
J u n -
0 6
S e p -
0 6
D e c -
0 6
M a r -
0 7
J u n -
0 7
S e p -
0 7
D e c -
0 7
M a r -
0 8
J u n -
0 8
S e p -
0 8
D e c -
0 8
M a r -
0 9
2007 2008 2009 2010
0x
10x
20x
30x
40x
50x
M a r - 9 1
M a r - 9 2
M a r - 9 3
M a r - 9 4
M a r - 9 5
M a r - 9 6
M a r - 9 7
M a r - 9 8
M a r - 9 9
M a r - 0 0
M a r - 0 1
M a r - 0 2
M a r - 0 3
M a r - 0 4
M a r - 0 5
M a r - 0 6
M a r - 0 7
M a r - 0 8
M a r - 0 9
12-month fwd PE
Source: Consensus Economics, HSBC Source: HSBC
9. Earnings 10. Foreign flows
-50
-25
0
25
50
75
1992 1994 1996 1998 2000 2002 2004 2006 2008 2010
% y - o - y
Indonesia
1.5
3.0
4.5
6.0
7.5
9.0
10.5
12.0
13.5
M a r - 0 4
J u n - 0 4
S e p - 0 4
D e c - 0 4
M a r - 0 5
J u n - 0 5
S e p - 0 5
D e c - 0 5
M a r - 0 6
J u n - 0 6
S e p - 0 6
D e c - 0 6
M a r - 0 7
J u n - 0 7
S e p - 0 7
D e c - 0 7
M a r - 0 8
J u n - 0 8
S e p - 0 8
D e c - 0 8
M a r - 0 9
U S D b n
Source: I/B/E/S, HSBC Source: EPFR, HSBC
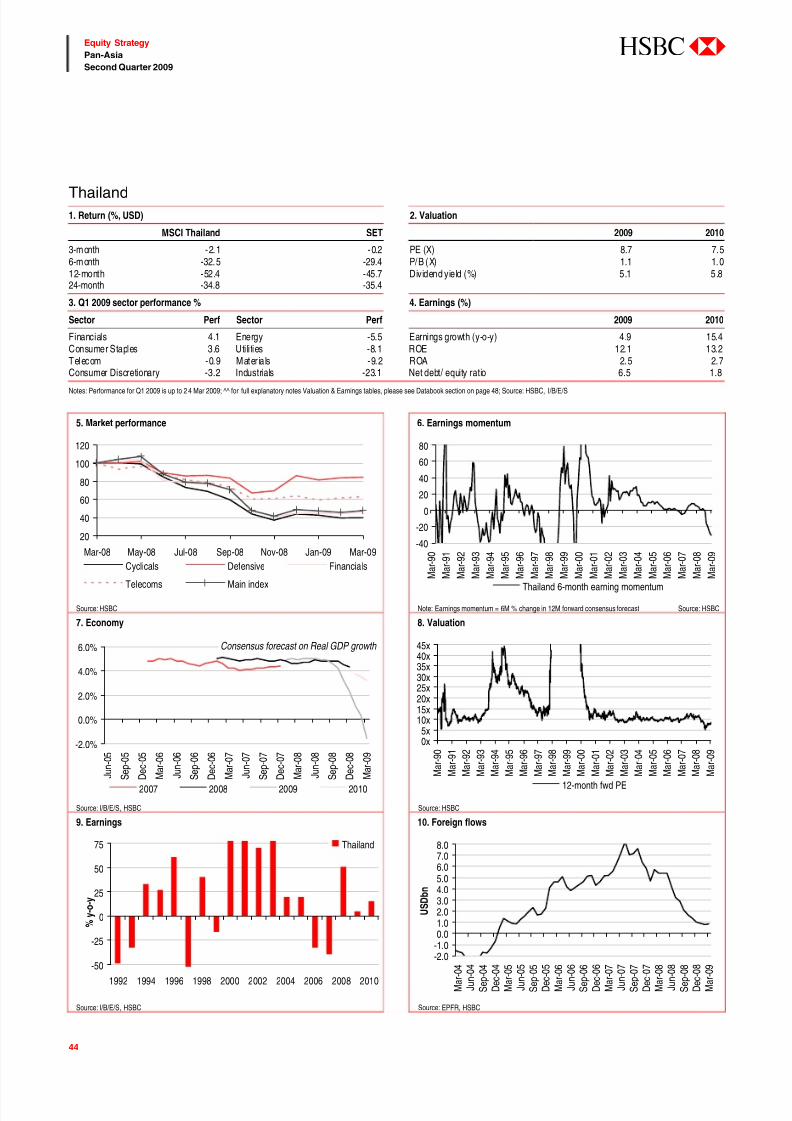
7/31/2019 Asia Insights the Long Climb Back Apr-1
http://slidepdf.com/reader/full/asia-insights-the-long-climb-back-apr-1 44/82
44
Equity Strategy
Pan-Asia
Second Quarter 2009
abc
Thailand1. Return (%, USD) 2. Valuation
MSCI Thailand SET 2009 2010
3-month -2.1 -0.2 PE (X) 8.7 7.56-month -32.5 -29.4 P/B (X) 1.1 1.012-month -52.4 -45.7 Dividend yield (%) 5.1 5.824-month -34.8 -35.4
3. Q1 2009 sector performance % 4. Earnings (%)
Sector Perf Sector Perf 2009 2010
Financials 4.1 Energy -5.5 Earnings growth (y-o-y) 4.9 15.4Consumer Staples 3.6 Uti li ties -8.1 ROE 12.1 13.2Telecom -0.9 Materia ls -9.2 ROA 2.5 2.7Consumer Discretionary -3.2 Industrials -23.1 Net debt/ equity ratio 6.5 1.8
Notes: Performance for Q1 2009 is up to 2 4 Mar 2009; ^^ for full explanatory notes Valuation & Earnings tables, please see Databook section on page 48; Source: HSBC, I/B/E/S
5. Market performance 6. Earnings momentum
20
40
60
80
100
120
Mar-08 May-08 Jul-08 Sep-08 Nov-08 Jan-09 Mar-09
Cyclicals Defensive Financials
Telecoms Main index
-40
-20
0
20
40
60
80
M
a r - 9 0
M
a r - 9 1
M
a r - 9 2
M
a r - 9 3
M
a r - 9 4
M
a r - 9 5
M
a r - 9 6
M
a r - 9 7
M
a r - 9 8
M
a r - 9 9
M
a r - 0 0
M
a r - 0 1
M
a r - 0 2
M
a r - 0 3
M
a r - 0 4
M
a r - 0 5
M
a r - 0 6
M
a r - 0 7
M
a r - 0 8
M
a r - 0 9
Thailand 6-month earning momentum
Source: HSBC Note: Earnings momentum = 6M % change in 12M forward consensus forecast Source: HSBC
7. Economy 8. Valuation
Consensus forecast on Real GDP growth
-2.0%
0.0%
2.0%
4.0%
6.0%
J u n - 0 5
S e p - 0 5
D e c - 0 5
M a r - 0 6
J u n - 0 6
S e p - 0 6
D e c - 0 6
M a r - 0 7
J u n - 0 7
S e p - 0 7
D e c - 0 7
M a r - 0 8
J u n - 0 8
S e p - 0 8
D e c - 0 8
M a r - 0 9
2007 2008 2009 2010
0x5x
10x15x20x25x30x35x40x45x
M a r - 9 0
M a r - 9 1
M a r - 9 2
M a r - 9 3
M a r - 9 4
M a r - 9 5
M a r - 9 6
M a r - 9 7
M a r - 9 8
M a r - 9 9
M a r - 0 0
M a r - 0 1
M a r - 0 2
M a r - 0 3
M a r - 0 4
M a r - 0 5
M a r - 0 6
M a r - 0 7
M a r - 0 8
M a r - 0 9
12-month fwd PE
Source: I/B/E/S, HSBC Source: HSBC
9. Earnings 10. Foreign flows
-50
-25
0
25
50
75
1992 1994 1996 1998 2000 2002 2004 2006 2008 2010
% y - o - y
Thailand
-2.0
-1.00.01.02.03.04.05.06.07.08.0
M a r - 0 4
J u n - 0 4
S e p - 0 4
D e c - 0 4
M a r - 0 5
J u n - 0 5
S e p - 0 5
D e c - 0 5
M a r - 0 6
J u n - 0 6
S e p - 0 6
D e c - 0 6
M a r - 0 7
J u n - 0 7
S e p - 0 7
D e c - 0 7
M a r - 0 8
J u n - 0 8
S e p - 0 8
D e c - 0 8
M a r - 0 9
U S D b n
Source: I/B/E/S, HSBC Source: EPFR, HSBC
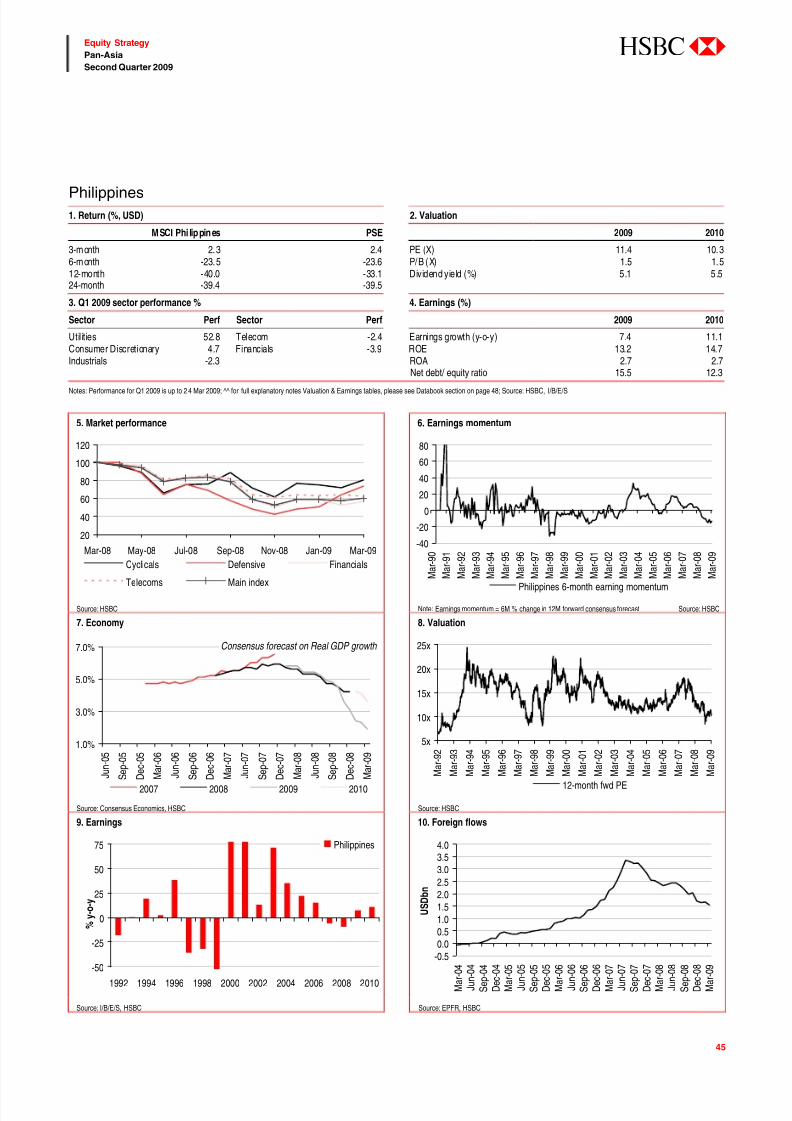
7/31/2019 Asia Insights the Long Climb Back Apr-1
http://slidepdf.com/reader/full/asia-insights-the-long-climb-back-apr-1 45/82
45
Equity Strategy
Pan-Asia
Second Quarter 2009
abc
Philippines1. Return (%, USD) 2. Valuation
MSCI Phi lippines PSE 2009 2010
3-month 2.3 2.4 PE (X) 11.4 10.36-month -23.5 -23.6 P/B (X) 1.5 1.512-month -40.0 -33.1 Dividend yield (%) 5.1 5.524-month -39.4 -39.5
3. Q1 2009 sector performance % 4. Earnings (%)
Sector Perf Sector Perf 2009 2010
Utilities 52.8 Telecom -2.4 Earnings growth (y-o-y) 7.4 11.1Consumer Discretionary 4.7 Financials -3.9 ROE 13.2 14.7Industrials -2.3 ROA 2.7 2.7
Net debt/ equity ratio 15.5 12.3
Notes: Performance for Q1 2009 is up to 2 4 Mar 2009; ^^ for full explanatory notes Valuation & Earnings tables, please see Databook section on page 48; Source: HSBC, I/B/E/S
5. Market performance 6. Earnings momentum
20
40
60
80
100
120
Mar-08 May-08 Jul-08 Sep-08 Nov-08 Jan-09 Mar-09
Cyclicals Defensive Financials
Telecoms Main index
-40
-20
0
20
40
60
80
M
a r - 9 0
M
a r - 9 1
M
a r - 9 2
M
a r - 9 3
M
a r - 9 4
M
a r - 9 5
M
a r - 9 6
M
a r - 9 7
M
a r - 9 8
M
a r - 9 9
M
a r - 0 0
M
a r - 0 1
M
a r - 0 2
M
a r - 0 3
M
a r - 0 4
M
a r - 0 5
M
a r - 0 6
M
a r - 0 7
M
a r - 0 8
M
a r - 0 9
Philippines 6-month earning momentum
Source: HSBC Note: Earnings momentum = 6M % change in 12M forward consensus forecast Source: HSBC
7. Economy 8. Valuation
Consensus forecast on Real GDP growth
1.0%
3.0%
5.0%
7.0%
J u n - 0 5
S e p - 0 5
D e c - 0 5
M a r - 0 6
J u n - 0 6
S e p - 0 6
D e c - 0 6
M a r - 0 7
J u n - 0 7
S e p - 0 7
D e c - 0 7
M a r - 0 8
J u n - 0 8
S e p - 0 8
D e c - 0 8
M a r - 0 9
2007 2008 2009 2010
5x
10x
15x
20x
25x
M a r - 9 2
M a r - 9 3
M a r - 9 4
M a r - 9 5
M a r - 9 6
M a r - 9 7
M a r - 9 8
M a r - 9 9
M a r - 0 0
M a r - 0 1
M a r - 0 2
M a r - 0 3
M a r - 0 4
M a r - 0 5
M a r - 0 6
M a r - 0 7
M a r - 0 8
M a r - 0 9
12-month fwd PE
Source: Consensus Economics, HSBC Source: HSBC
9. Earnings 10. Foreign flows
-50
-25
0
25
50
75
1992 1994 1996 1998 2000 2002 2004 2006 2008 2010
% y - o - y
Philippines
-0.5
0.00.5
1.0
1.5
2.0
2.5
3.0
3.54.0
M a r - 0 4
J u n - 0 4
S e p - 0 4
D e c - 0 4
M a r - 0 5
J u n - 0 5
S e p - 0 5
D e c - 0 5
M a r - 0 6
J u n - 0 6
S e p - 0 6
D e c - 0 6
M a r - 0 7
J u n - 0 7
S e p - 0 7
D e c - 0 7
M a r - 0 8
J u n - 0 8
S e p - 0 8
D e c - 0 8
M a r - 0 9
U S D b n
Source: I/B/E/S, HSBC Source: EPFR, HSBC

7/31/2019 Asia Insights the Long Climb Back Apr-1
http://slidepdf.com/reader/full/asia-insights-the-long-climb-back-apr-1 46/82
46
Equity Strategy
Pan-Asia
Second Quarter 2009
abc
Country/ Sector performance
MSCI indices performance (%)
By country/ region
Countries/Region Current level 1M 3M 6M 12M 24M
Asia Pacific 84 12.9 -3.0 -27.8 -38.3 -42.5Asia Ex Japan 292 14.1 3.8 -25.7 -42.6 -35.8Australia 467 18.3 3.5 -38.5 -43.9 -45.7China 42 12.0 5.1 -14.6 -28.2 -16.9Hong Kong 4,849 9.2 4.3 -21.2 -35.4 -33.0India 224 7.5 -4.6 -38.6 -52.5 -41.3Indonesia 295 20.5 4.8 -36.0 -51.2 -31.8Japan 1,851 10.6 -8.9 -26.1 -33.0 -45.1Korea 193 27.1 3.0 -32.0 -46.4 -43.4Malaysia 225 -0.7 -1.4 -18.3 -36.3 -33.0Philippines 172 4.2 2.3 -23.5 -40.0 -39.4Singapore 272 6.3 -6.4 -36.5 -48.2 -47.6Taiwan 166 20.4 14.9 -22.7 -49.0 -39.0Thailand 128 4.3 -2.1 -32.5 -52.4 -34.8
Source: HSBC
By Asia Pacific sector
Asia Pac Sectors Current level 1M 3M 6M 12M 24M
Energy 350 16.2 9.6 -29.5 -37.0 -18.9Consumer Discretionary 94 11.5 6.1 -27.9 -38.5 -47.0Automobiles & Components 122 8.0 13.8 -28.5 -36.5 -47.6Consumer Durables & Apparel 76 21.1 7.7 -29.6 -41.9 -48.0Consumer Services 100 5.2 -7.6 -24.2 -43.7 -50.9Media 73 4.8 -19.1 -33.5 -43.6 -48.1Retailing 81 15.3 -8.4 -21.5 -36.0 -41.0Consumer Staples 103 3.7 -14.8 -25.2 -33.1 -31.9Food & Staples Retailing 136 4.1 -12.8 -28.0 -32.1 -36.1Food, Beverage & Tobacco 108 3.9 -13.7 -23.8 -35.8 -31.4Household & Personal Products 108 2.2 -22.8 -22.5 -24.7 -21.7Financials 99 18.4 -5.4 -33.3 -42.7 -50.5Banks 91 18.1 -2.9 -33.4 -41.5 -49.2Diversified Financials 81 27.8 -12.3 -41.9 -54.5 -61.1Insurance 112 16.3 -4.6 -28.6 -33.7 -37.3Real Estate 103 17.2 -9.4 -32.0 -44.8 -55.2Health Care 128 -1.8 -18.5 -26.7 -25.1 -32.5Health Care Equipment & Services 143 14.3 -11.9 -32.5 -35.8 -34.0Pharmaceuticals, Biotechnology & Life Sciences 125 -4.3 -19.6 -25.6 -22.8 -32.4Industrials 105 14.6 -3.7 -28.4 -41.1 -43.6Capital Goods 117 17.5 2.0 -29.3 -42.6 -44.5Commercial Services & Supplies 57 20.6 -14.0 -26.7 -38.3 -43.2Transportation 107 7.7 -13.1 -26.5 -37.3 -40.9Information Technology 102 20.3 7.0 -25.5 -39.2 -43.1Software & Services 134 15.1 -11.0 -27.8 -37.6 -29.1Technology Hardware & Equipment 95 19.6 8.0 -28.3 -40.1 -46.2Semiconductors & Semiconductor Equipment 115 25.2 20.5 -18.3 -38.6 -44.5Materials 182 19.9 6.7 -29.6 -42.1 -42.0Telecommunication Services 59 -0.8 -14.1 -19.3 -31.7 -26.9Utilities 122 -3.1 -14.2 -7.0 -14.0 -26.3
Source: HSBC, Datastream
Datapack
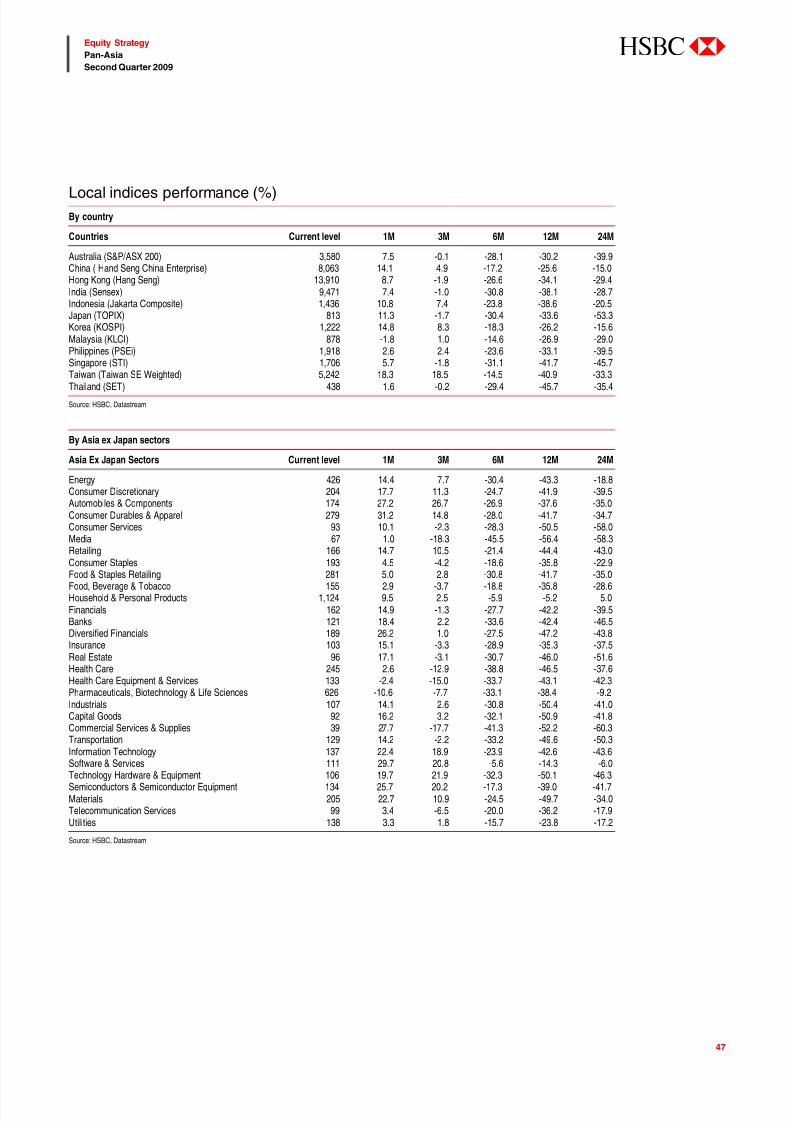
7/31/2019 Asia Insights the Long Climb Back Apr-1
http://slidepdf.com/reader/full/asia-insights-the-long-climb-back-apr-1 47/82
47
Equity Strategy
Pan-Asia
Second Quarter 2009
abc
Local indices performance (%)By country
Countries Current level 1M 3M 6M 12M 24M
Australia (S&P/ASX 200) 3,580 7.5 -0.1 -28.1 -30.2 -39.9China ( Hand Seng China Enterprise) 8,063 14.1 4.9 -17.2 -25.6 -15.0Hong Kong (Hang Seng) 13,910 8.7 -1.9 -26.6 -34.1 -29.4India (Sensex) 9,471 7.4 -1.0 -30.8 -38.1 -28.7Indonesia (Jakarta Composite) 1,436 10.8 7.4 -23.8 -38.6 -20.5Japan (TOPIX) 813 11.3 -1.7 -30.4 -33.6 -53.3Korea (KOSPI) 1,222 14.8 8.3 -18.3 -26.2 -15.6Malaysia (KLCI) 878 -1.8 1.0 -14.6 -26.9 -29.0Philippines (PSEi) 1,918 2.6 2.4 -23.6 -33.1 -39.5Singapore (STI) 1,706 5.7 -1.8 -31.1 -41.7 -45.7Taiwan (Taiwan SE Weighted) 5,242 18.3 18.5 -14.5 -40.9 -33.3Thailand (SET) 438 1.6 -0.2 -29.4 -45.7 -35.4
Source: HSBC, Datastream
By Asia ex Japan sectors
Asia Ex Japan Sectors Current level 1M 3M 6M 12M 24M
Energy 426 14.4 7.7 -30.4 -43.3 -18.8Consumer Discretionary 204 17.7 11.3 -24.7 -41.9 -39.5Automobiles & Components 174 27.2 26.7 -26.9 -37.6 -35.0Consumer Durables & Apparel 279 31.2 14.8 -28.0 -41.7 -34.7Consumer Services 93 10.1 -2.3 -28.3 -50.5 -58.0Media 67 1.0 -18.3 -45.5 -56.4 -58.3Retailing 166 14.7 10.5 -21.4 -44.4 -43.0Consumer Staples 193 4.5 -4.2 -18.6 -35.8 -22.9
Food & Staples Retailing 281 5.0 2.8 -30.8 -41.7 -35.0Food, Beverage & Tobacco 155 2.9 -3.7 -18.8 -35.8 -28.6Household & Personal Products 1,124 9.5 2.5 -5.9 -5.2 5.0Financials 162 14.9 -1.3 -27.7 -42.2 -39.5Banks 121 18.4 2.2 -33.6 -42.4 -46.5Diversified Financials 189 26.2 1.0 -27.5 -47.2 -43.8Insurance 103 15.1 -3.3 -28.9 -35.3 -37.5Real Estate 96 17.1 -3.1 -30.7 -46.0 -51.6Health Care 245 2.6 -12.9 -38.8 -46.5 -37.6Health Care Equipment & Services 133 -2.4 -15.0 -33.7 -43.1 -42.3Pharmaceuticals, Biotechnology & Life Sciences 626 -10.6 -7.7 -33.1 -38.4 -9.2Industrials 107 14.1 2.6 -30.8 -50.4 -41.0Capital Goods 92 16.2 3.2 -32.1 -50.9 -41.8Commercial Services & Supplies 39 27.7 -17.7 -41.3 -52.2 -60.3Transportation 129 14.2 -2.2 -33.2 -49.6 -50.3Information Technology 137 22.4 18.9 -23.9 -42.6 -43.6
Software & Services 111 29.7 20.8 -5.6 -14.3 -6.0Technology Hardware & Equipment 106 19.7 21.9 -32.3 -50.1 -46.3Semiconductors & Semiconductor Equipment 134 25.7 20.2 -17.3 -39.0 -41.7Materials 205 22.7 10.9 -24.5 -49.7 -34.0Telecommunication Services 99 3.4 -6.5 -20.0 -36.2 -17.9Utilities 138 3.3 1.8 -15.7 -23.8 -17.2
Source: HSBC, Datastream

7/31/2019 Asia Insights the Long Climb Back Apr-1
http://slidepdf.com/reader/full/asia-insights-the-long-climb-back-apr-1 48/82
48
Equity Strategy
Pan-Asia
Second Quarter 2009
abc
1. 12-month forward EPS growth vs MSC Asia ex Japan
-10
0
10
20
30
40
50
1994 1997 2000 2003 2006 2009
(%)
-60%
-40%
-20%
0%
20%
40%
60%
80%
EPS growth MS CI AE J index y-o-y (RHS)
Source: Bloomberg, I/B/E/S, HSBC
3. Earnings momentum – Asia ex Japan
-40
-30
-20
-10
0
10
20
30
40
1 9 9 4
1 9 9 5
1 9 9 6
1 9 9 7
1 9 9 8
1 9 9 9
2 0 0 0
2 0 0 1
2 0 0 2
2 0 0 3
2 0 0 4
2 0 0 5
2 0 0 6
2 0 0 7
2 0 0 8
2 0 0 9
Asia ex-Japan
Source: I/B/E/S, HSBC
5. Revisions to 2009 EPS forecasts by country
Country vs 3M ago Rank vs 6M ago Rank
PH -5.9% 1 -18.3% 1MY -10.2% 2 -25.8% 2ID -11.8% 3 -32.1% 6CN -13.4% 4 -29.4% 3HK -13.5% 5 -33.2% 7IN -15.4% 6 -29.7% 4AU -15.8% 7 -29.9% 5TH -16.5% 8 -34.6% 8SG -17.2% 9 -36.3% 9KR -24.3% 10 -44.1% 10TW -47.6% 11 -78.7% 11JP -87.4% 12 -90.1% 12AEJ -20.9% -44.8%AP -39.2% -55.1%
Source: I/B/E/S, HSBC
2. Consensus forecast for EPS growth
2008 2009 2010
Australia -9.6 -7.1 9.0China -4.9 1.4 17.6Hong Kong -36.2 -17.6 10.4India -10.5 3.6 15.7Indonesia 8.7 -6.6 9.1Japan -68.3 -11.8 88.5Korea -34.5 -0.2 48.5Malaysia -14.9 -16.8 10.4Philippines -9.3 7.4 11.1Singapore -12.1 -23.0 13.8
Taiwan -53.6 -59.2 195.3Thailand 50.9 4.9 15.4Asia ex-Japan -26.1 -11.4 30.7Asia Pacific -58.8 18.4 40.1
Source: I/B/E/S, HSBC
4. Upgrades as % of total earnings revisions – Asia Pacific
10
20
30
40
50
60
70
2 0 0 0
2 0 0 1
2 0 0 2
2 0 0 3
2 0 0 4
2 0 0 5
2 0 0 6
2 0 0 7
2 0 0 8
2 0 0 9
Upgrades as % ot total
Source: I/B/E/S, HSBC
6. Revisions to 2009 EPS forecasts for Asia Pacific sectors
Sector vs 3M ago Rank vs 6M ago Rank
Telco -7.6% 1 -9.2% 2Cons. stap -13.2% 2 -18.2% 4Health care -14.6% 3 -10.9% 3Utilities -20.2% 4 3.8% 1Financials -22.2% 5 -38.6% 5Energy -22.4% 6 -39.9% 6Industrials -44.8% 7 -58.1% 7Materials -49.1% 8 -68.0% 8IT -85.1% 9 -92.4% 9Cons. discr -95.6% 10 -97.5% 10Asia Pac -39.2% -55.1%
Source: I/B/E/S, HSBC
Earnings
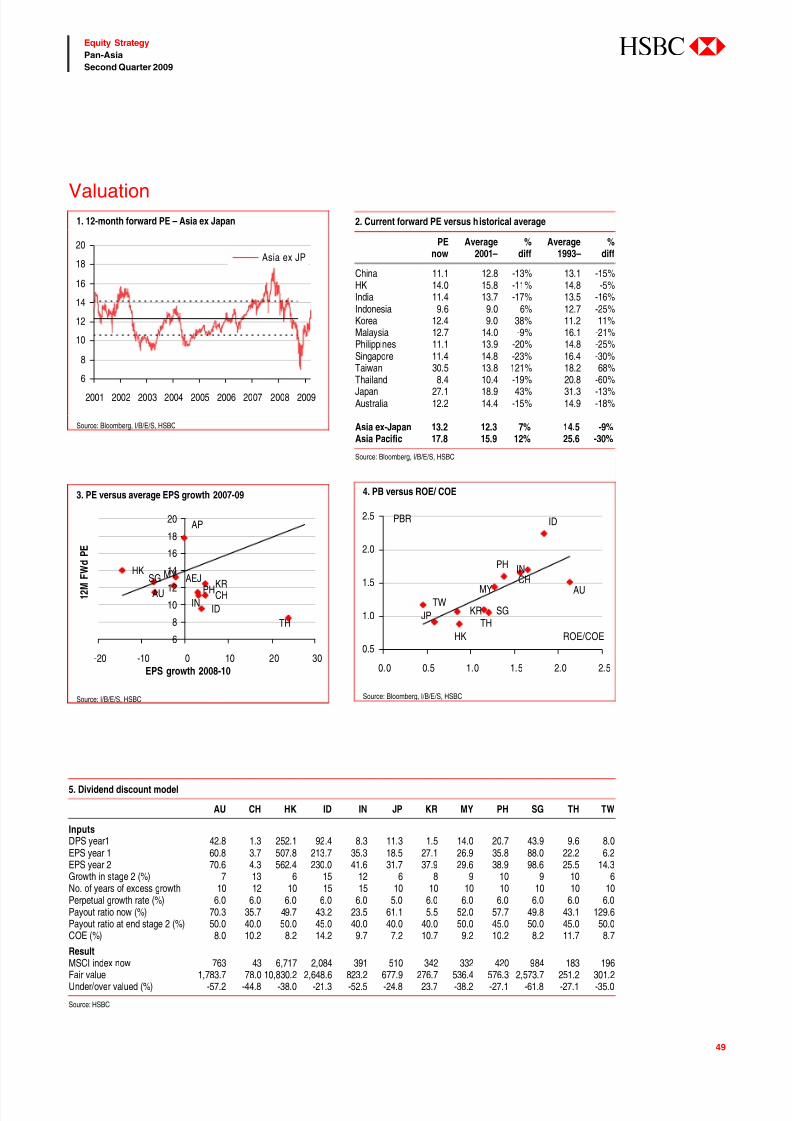
7/31/2019 Asia Insights the Long Climb Back Apr-1
http://slidepdf.com/reader/full/asia-insights-the-long-climb-back-apr-1 49/82
49
Equity Strategy
Pan-Asia
Second Quarter 2009
abc
1. 12-month forward PE – Asia ex Japan
6
8
10
12
14
16
18
20
2001 2002 2003 2004 2005 2006 2007 2008 2009
Asia ex JP
Source: Bloomberg. I/B/E/S, HSBC
3. PE versus average EPS growth 2007-09
AU CH
HK
INID
KRMY
PHSG
TH
AEJ
AP
6
8
10
1214
16
18
20
-20 -10 0 10 20 30
EPS growth 2008-10
1 2 M F W
d P E
Source: I/B/E/S, HSBC
2. Current forward PE versus historical average
PEnow
Average2001–
%diff
Average1993–
%diff
China 11.1 12.8 -13% 13.1 -15%HK 14.0 15.8 -11% 14.8 -5%India 11.4 13.7 -17% 13.5 -16%Indonesia 9.6 9.0 6% 12.7 -25%Korea 12.4 9.0 38% 11.2 11%Malaysia 12.7 14.0 -9% 16.1 -21%Philippines 11.1 13.9 -20% 14.8 -25%Singapore 11.4 14.8 -23% 16.4 -30%Taiwan 30.5 13.8 121% 18.2 68%
Thailand 8.4 10.4 -19% 20.8 -60%Japan 27.1 18.9 43% 31.3 -13%Australia 12.2 14.4 -15% 14.9 -18%
Asia ex-Japan 13.2 12.3 7% 14.5 -9%Asia Pacific 17.8 15.9 12% 25.6 -30%
Source: Bloomberg, I/B/E/S, HSBC
4. PB versus ROE/ COE
TH
AU
JP
IN
PH
ID
MY
SGKR
CH
TW
HK0.5
1.0
1.5
2.0
2.5
0.0 0.5 1.0 1.5 2.0 2.5
PBR
ROE/COE
Source: Bloomberg, I/B/E/S, HSBC
Valuation
5. Dividend discount model
AU CH HK ID IN JP KR MY PH SG TH TW
InputsDPS year1 42.8 1.3 252.1 92.4 8.3 11.3 1.5 14.0 20.7 43.9 9.6 8.0EPS year 1 60.8 3.7 507.8 213.7 35.3 18.5 27.1 26.9 35.8 88.0 22.2 6.2EPS year 2 70.6 4.3 562.4 230.0 41.6 31.7 37.9 29.6 38.9 98.6 25.5 14.3Growth in stage 2 (%) 7 13 6 15 12 6 8 9 10 9 10 6No. of years of excess growth 10 12 10 15 15 10 10 10 10 10 10 10Perpetual growth rate (%) 6.0 6.0 6.0 6.0 6.0 5.0 6.0 6.0 6.0 6.0 6.0 6.0Payout ratio now (%) 70.3 35.7 49.7 43.2 23.5 61.1 5.5 52.0 57.7 49.8 43.1 129.6Payout ratio at end stage 2 (%) 50.0 40.0 50.0 45.0 40.0 40.0 40.0 50.0 45.0 50.0 45.0 50.0COE (%) 8.0 10.2 8.2 14.2 9.7 7.2 10.7 9.2 10.2 8.2 11.7 8.7
ResultMSCI index now 763 43 6,717 2,084 391 510 342 332 420 984 183 196Fair value 1,783.7 78.0 10,830.2 2,648.6 823.2 677.9 276.7 536.4 576.3 2,573.7 251.2 301.2Under/over valued (%) -57.2 -44.8 -38.0 -21.3 -52.5 -24.8 23.7 -38.2 -27.1 -61.8 -27.1 -35.0
Source: HSBC
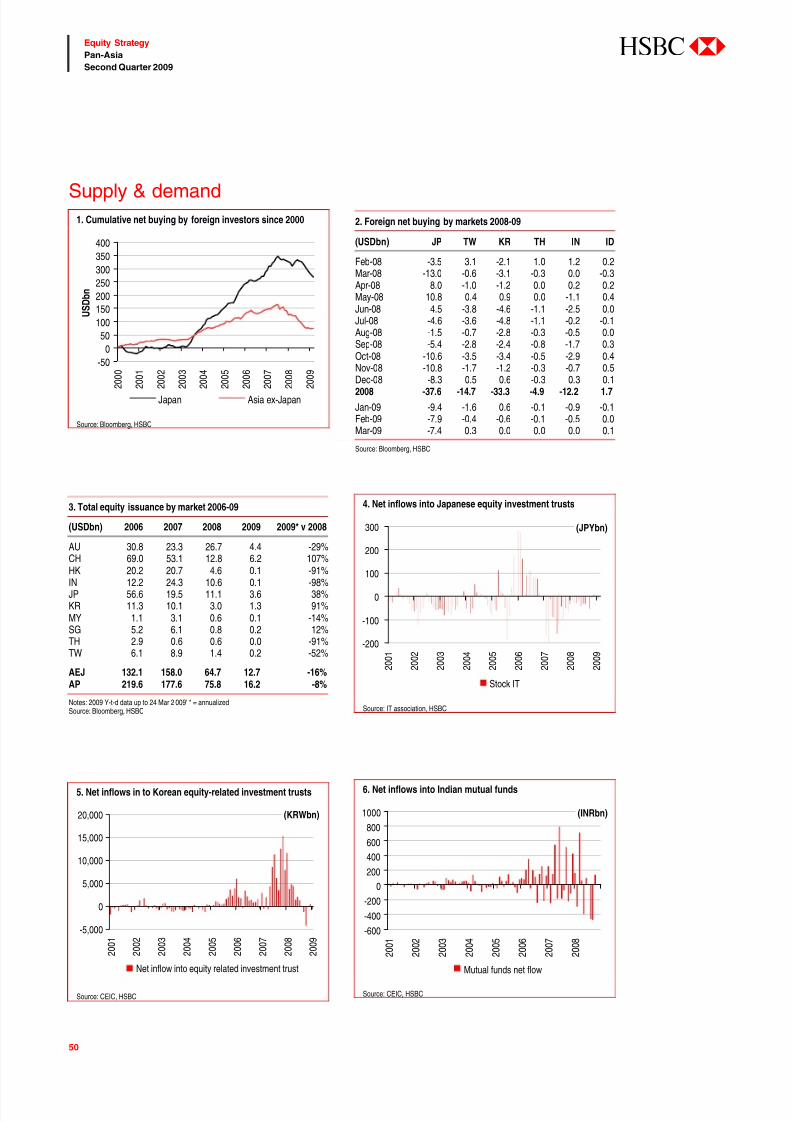
7/31/2019 Asia Insights the Long Climb Back Apr-1
http://slidepdf.com/reader/full/asia-insights-the-long-climb-back-apr-1 50/82
50
Equity Strategy
Pan-Asia
Second Quarter 2009
abc
1. Cumulative net buying by foreign investors since 2000
-50
0
50
100
150
200
250
300
350
400
2 0
0 0
2 0
0 1
2 0
0 2
2 0
0 3
2 0
0 4
2 0
0 5
2 0
0 6
2 0
0 7
2 0
0 8
2 0
0 9
U S D b n
Japan Asia ex-Japan
Source: Bloomberg, HSBC
3. Total equity issuance by market 2006-09
(USDbn) 2006 2007 2008 2009 2009* v 2008
AU 30.8 23.3 26.7 4.4 -29%CH 69.0 53.1 12.8 6.2 107%
HK 20.2 20.7 4.6 0.1 -91%IN 12.2 24.3 10.6 0.1 -98%JP 56.6 19.5 11.1 3.6 38%KR 11.3 10.1 3.0 1.3 91%MY 1.1 3.1 0.6 0.1 -14%SG 5.2 6.1 0.8 0.2 12%TH 2.9 0.6 0.6 0.0 -91%TW 6.1 8.9 1.4 0.2 -52%
AEJ 132.1 158.0 64.7 12.7 -16%AP 219.6 177.6 75.8 16.2 -8%
Notes: 2009 Y-t-d data up to 24 Mar 2 009' * = annualizedSource: Bloomberg, HSBC
5. Net inflows in to Korean equity-related investment trusts
-5,000
0
5,000
10,000
15,000
20,000
2 0 0 1
2 0 0 2
2 0 0 3
2 0 0 4
2 0 0 5
2 0 0 6
2 0 0 7
2 0 0 8
2 0 0 9
(KRWbn)
Net inflow into equity related investment trust
Source: CEIC, HSBC
2. Foreign net buying by markets 2008-09
(USDbn) JP TW KR TH IN ID
Feb-08 -3.5 3.1 -2.1 1.0 1.2 0.2Mar-08 -13.0 -0.6 -3.1 -0.3 0.0 -0.3Apr-08 8.0 -1.0 -1.2 0.0 0.2 0.2May-08 10.8 0.4 0.9 0.0 -1.1 0.4Jun-08 4.5 -3.8 -4.6 -1.1 -2.5 0.0Jul-08 -4.6 -3.6 -4.8 -1.1 -0.2 -0.1Aug-08 -1.5 -0.7 -2.8 -0.3 -0.5 0.0Sep-08 -5.4 -2.8 -2.4 -0.8 -1.7 0.3Oct-08 -10.6 -3.5 -3.4 -0.5 -2.9 0.4Nov-08 -10.8 -1.7 -1.2 -0.3 -0.7 0.5
Dec-08 -8.3 0.5 0.6 -0.3 0.3 0.12008 -37.6 -14.7 -33.3 -4.9 -12.2 1.7
Jan-09 -9.4 -1.6 0.6 -0.1 -0.9 -0.1Feb-09 -7.9 -0.4 -0.6 -0.1 -0.5 0.0Mar-09 -7.4 0.3 0.0 0.0 0.0 0.1
Source: Bloomberg, HSBC
4. Net inflows into Japanese equity investment trusts
-200
-100
0
100
200
300
2 0 0 1
2 0 0 2
2 0 0 3
2 0 0 4
2 0 0 5
2 0 0 6
2 0 0 7
2 0 0 8
2 0 0 9
(JPYbn)
Stock IT
Source: IT association, HSBC
6. Net inflows into Indian mutual funds
-600
-400
-200
0
200
400
600
800
1000
2
0 0 1
2
0 0 2
2
0 0 3
2
0 0 4
2
0 0 5
2
0 0 6
2
0 0 7
2
0 0 8
(INRbn)
Mutual funds net flow
Source: CEIC, HSBC
Supply & demand
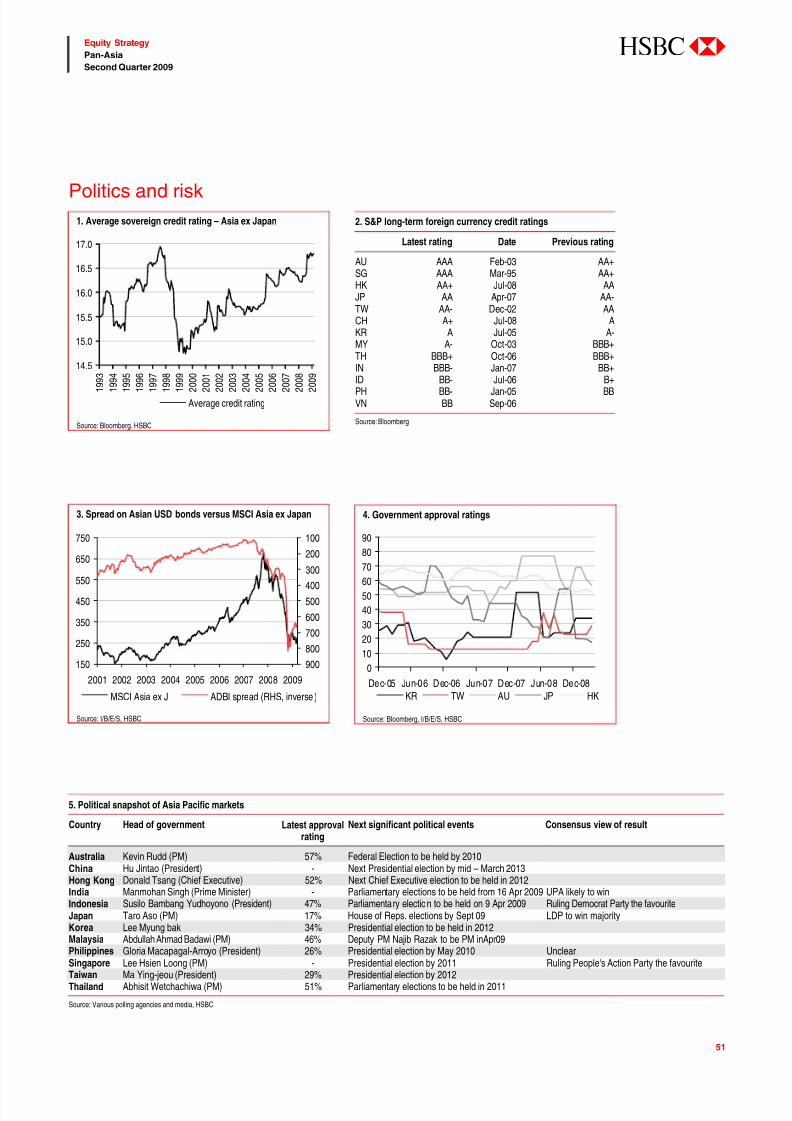
7/31/2019 Asia Insights the Long Climb Back Apr-1
http://slidepdf.com/reader/full/asia-insights-the-long-climb-back-apr-1 51/82
51
Equity Strategy
Pan-Asia
Second Quarter 2009
abc
1. Average sovereign credit rating – Asia ex Japan
14.5
15.0
15.5
16.0
16.5
17.0
1 9 9
3
1 9 9
4
1 9 9
5
1 9 9
6
1 9 9
7
1 9 9
8
1 9 9
9
2 0 0
0
2 0 0
1
2 0 0
2
2 0 0
3
2 0 0
4
2 0 0
5
2 0 0
6
2 0 0
7
2 0 0
8
2 0 0
9
Average credit rating
Source: Bloomberg. HSBC
3. Spread on Asian USD bonds versus MSCI Asia ex Japan
150
250
350
450
550
650
750
2001 2002 2003 2004 2005 2006 2007 2008 2009
100
200
300400
500
600
700
800
900
MSCI Asia ex J ADBI spread (RHS, inverse )
Source: I/B/E/S, HSBC
2. S&P long-term foreign currency credit ratings
Latest rating Date Previous rating
AU AAA Feb-03 AA+SG AAA Mar-95 AA+HK AA+ Jul-08 AAJP AA Apr-07 AA-TW AA- Dec-02 AACH A+ Jul-08 AKR A Jul-05 A-MY A- Oct-03 BBB+TH BBB+ Oct-06 BBB+IN BBB- Jan-07 BB+
ID BB- Jul-06 B+PH BB- Jan-05 BBVN BB Sep-06
Source: Bloomberg
4. Government approval ratings
0
10
20
30
40
50
60
70
80
90
Dec-05 Jun-06 Dec-06 Jun-07 Dec-07 Jun-08 Dec-08
KR TW AU JP HK
Source: Bloomberg, I/B/E/S, HSBC
Politics and risk
5. Political snapshot of Asia Pacific markets
Country Head of government Latest approvalrating
Next significant political events Consensus view of result
Australia Kevin Rudd (PM) 57% Federal Election to be held by 2010China Hu Jintao (President) - Next Presidential election by mid – March 2013Hong Kong Donald Tsang (Chief Executive) 52% Next Chief Executive election to be held in 2012India Manmohan Singh (Prime Minister) - Parliamentary elections to be held from 16 Apr 2009 UPA likely to winIndonesia Susilo Bambang Yudhoyono (President) 47% Parliamentary election to be held on 9 Apr 2009 Ruling Democrat Party the favouriteJapan Taro Aso (PM) 17% House of Reps. elections by Sept 09 LDP to win majorityKorea Lee Myung bak 34% Presidential election to be held in 2012Malaysia Abdullah Ahmad Badawi (PM) 46% Deputy PM Najib Razak to be PM inApr09
Philippines Gloria Macapagal-Arroyo (President) 26% Presidential election by May 2010 UnclearSingapore Lee Hsien Loong (PM) - Presidential election by 2011 Ruling People's Action Party the favouriteTaiwan Ma Ying-jeou (President) 29% Presidential election by 2012Thailand Abhisit Wetchachiwa (PM) 51% Parliamentary elections to be held in 2011
Source: Various polling agencies and media, HSBC
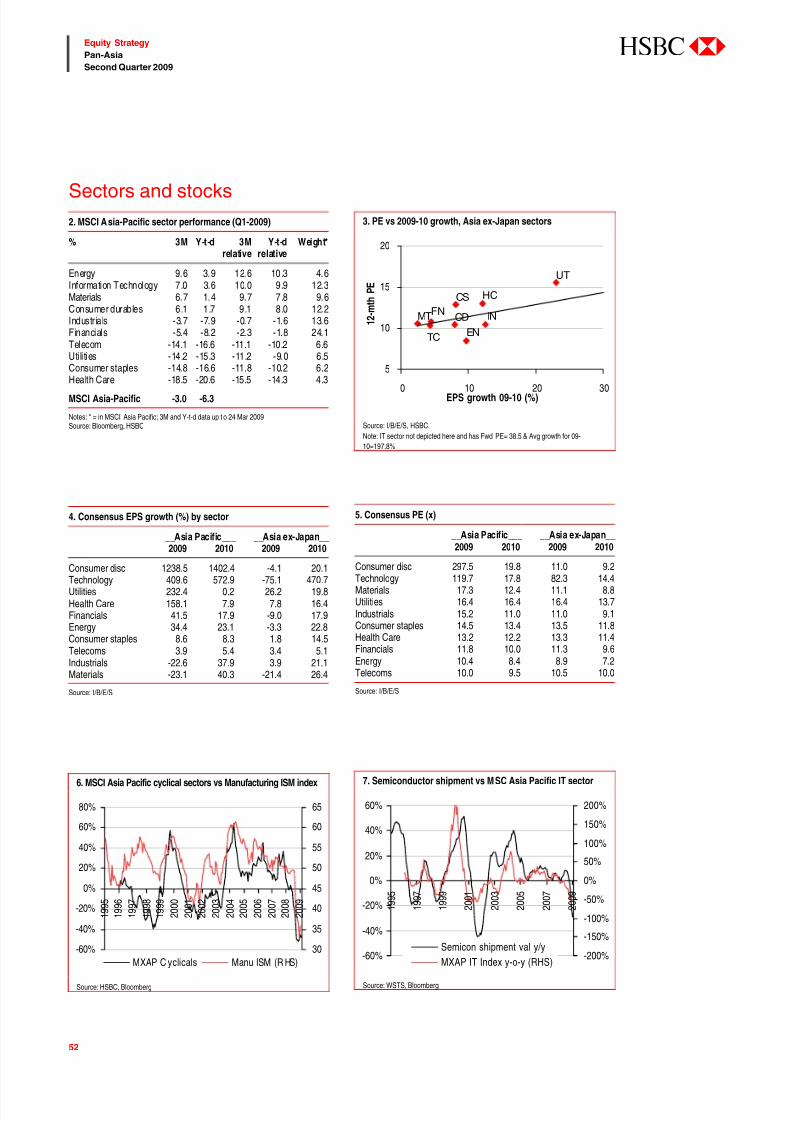
7/31/2019 Asia Insights the Long Climb Back Apr-1
http://slidepdf.com/reader/full/asia-insights-the-long-climb-back-apr-1 52/82
52
Equity Strategy
Pan-Asia
Second Quarter 2009
abc
2. MSCI Asia-Pacific sector performance (Q1-2009)
% 3M Y-t-d 3M Y-t-d Weight*relative relative
Energy 9.6 3.9 12.6 10.3 4.6Information Technology 7.0 3.6 10.0 9.9 12.3Materials 6.7 1.4 9.7 7.8 9.6Consumer durables 6.1 1.7 9.1 8.0 12.2Industrials -3.7 -7.9 -0.7 -1.6 13.6Financials -5.4 -8.2 -2.3 -1.8 24.1Telecom -14.1 -16.6 -11.1 -10.2 6.6Utilities -14.2 -15.3 -11.2 -9.0 6.5Consumer staples -14.8 -16.6 -11.8 -10.2 6.2
Health Care -18.5 -20.6 -15.5 -14.3 4.3MSCI Asia-Pacific -3.0 -6.3
Notes: * = in MSCI Asia Pacific; 3M and Y-t-d data up t o 24 Mar 2009Source: Bloomberg, HSBC
4. Consensus EPS growth (%) by sector
__Asia Pacific___ __Asia ex-Japan__2009 2010 2009 2010
Consumer disc 1238.5 1402.4 -4.1 20.1Technology 409.6 572.9 -75.1 470.7Utilities 232.4 0.2 26.2 19.8Health Care 158.1 7.9 7.8 16.4Financials 41.5 17.9 -9.0 17.9Energy 34.4 23.1 -3.3 22.8Consumer staples 8.6 8.3 1.8 14.5Telecoms 3.9 5.4 3.4 5.1Industrials -22.6 37.9 3.9 21.1Materials -23.1 40.3 -21.4 26.4
Source: I/B/E/S
6. MSCI Asia Pacific cyclical sectors vs Manufacturing ISM index
-60%
-40%
-20%
0%
20%
40%
60%
80%
1 9 9 5
1 9 9 6
1 9 9 7
1 9 9 8
1 9 9 9
2 0 0 0
2 0 0 1
2 0 0 2
2 0 0 3
2 0 0 4
2 0 0 5
2 0 0 6
2 0 0 7
2 0 0 8
2 0 0 9
30
35
40
45
50
55
60
65
MXAP C yclicals Manu ISM (R HS)
Source: HSBC, Bloomberg
3. PE vs 2009-10 growth, Asia ex-Japan sectors
UT
TC
FN
HCCS
CD INMT
EN
5
10
15
20
0 10 20 30EPS growth 09-10 (%)
1 2 - m t h P E
Source: I/B/E/S, HSBC.
Note: IT sector not depicted here and has Fwd PE= 38.5 & Avg growth for 09-
10=197.8%
5. Consensus PE (x)
__Asia Pacific___ __Asia ex-Japan__2009 2010 2009 2010
Consumer disc 297.5 19.8 11.0 9.2Technology 119.7 17.8 82.3 14.4Materials 17.3 12.4 11.1 8.8Utilities 16.4 16.4 16.4 13.7Industrials 15.2 11.0 11.0 9.1Consumer staples 14.5 13.4 13.5 11.8Health Care 13.2 12.2 13.3 11.4Financials 11.8 10.0 11.3 9.6Energy 10.4 8.4 8.9 7.2Telecoms 10.0 9.5 10.5 10.0
Source: I/B/E/S
7. Semiconductor shipment vs MSC Asia Pacific IT sector
-60%
-40%
-20%
0%
20%
40%
60%
1 9 9 5
1 9 9 7
1 9 9 9
2 0 0 1
2 0 0 3
2 0 0 5
2 0 0 7
2 0 0 9
-200%
-150%
-100%
-50%
0%
50%
100%
150%
200%
Semicon shipment val y/y
MXAP IT Index y-o-y (RHS)
Source: WSTS, Bloomberg
Sectors and stocks

7/31/2019 Asia Insights the Long Climb Back Apr-1
http://slidepdf.com/reader/full/asia-insights-the-long-climb-back-apr-1 53/82
53
Equity Strategy
Pan-Asia
Second Quarter 2009
abc
Scorecards8. Asia ex-Japan
___ Price momentum_____ ___ Earnings momentum__ ________Valuation _______ _____Consolidated_______Now 1M chg 3M chg Now 1M chg 3M chg Now 1M chg 3M chg Now 1M chg 3M chg
Consumer Staples 2 1 1 1 0 0 5 1 2 1 1 3Utilities 1 1 1 2 0 0 7 -1 -2 2 0 0Telecommunication Services 4 -3 0 6 0 -3 4 0 -1 3 1 0Energy 8 -1 2 5 4 2 2 0 -1 4 3 2Health Care 5 -1 -4 8 -6 -4 2 1 0 4 -3 -3Financials 10 -2 -5 6 -1 0 1 0 2 6 -1 -1Consumer Discretionary 9 0 -3 3 7 1 7 -1 1 7 2 -1Materials 3 3 5 8 0 1 9 0 1 8 0 2Information Technology 7 3 0 4 2 6 10 0 -1 9 1 0Industrials 6 -1 3 10 -6 -3 6 -1 0 10 -5 -2
Source: HSBC
9. Australia
___ Price momentum_____ ___ Earnings momentum__ ________Valuation _______ _____Consolidated_______Now 1M chg 3M chg Now 1M chg 3M chg Now 1M chg 3M chg Now 1M chg 3M chg
Health Care 5 -4 -2 1 1 0 3 0 2 1 0 0Consumer Staples 2 2 1 3 2 0 5 0 1 2 2 2
Information Technology 1 4 8 2 1 4 9 1 1 3 3 6Utilities 2 0 -1 4 -3 -2 6 0 2 3 0 -1Energy 4 3 3 4 2 -1 7 1 0 5 4 1Consumer Discretionary 8 -1 0 6 1 1 1 0 1 5 0 1Telecommunication Services 7 -5 -5 6 -3 -1 2 0 2 5 -3 -3Financials 9 -2 -4 8 1 1 4 0 -1 8 -1 -2Materials 5 0 1 10 -2 -3 10 -3 -9 9 -2 -4Industrials 10 0 0 8 1 1 8 0 0 10 0 0
Source: HSBC
10. China
___ Price momentum_____ ___ Earnings momentum__ ________Valuation _______ _____Consolidated_______Now 1M chg 3M chg Now 1M chg 3M chg Now 1M chg 3M chg Now 1M chg 3M chg
Utilities 2 -1 -1 1 1 7 1 0 5 1 0 4Financials 3 3 -1 4 0 2 3 0 -2 2 2 0Telecommunication Services 5 -2 -3 3 0 0 2 0 2 2 0 0Consumer Staples 5 -4 1 2 -1 1 4 2 0 4 -2 0Materials 1 4 3 5 3 2 8 -1 -1 5 2 1Industrials 8 -2 -1 7 2 1 5 0 -2 6 1 0Consumer Discretionary 7 2 1 6 0 -4 7 1 1 6 3 0Information Technology 3 0 5 8 -2 -5 9 0 0 6 0 3Energy 9 -3 -5 8 -4 -7 6 -2 -4 9 -4 -8
Source: HSBC
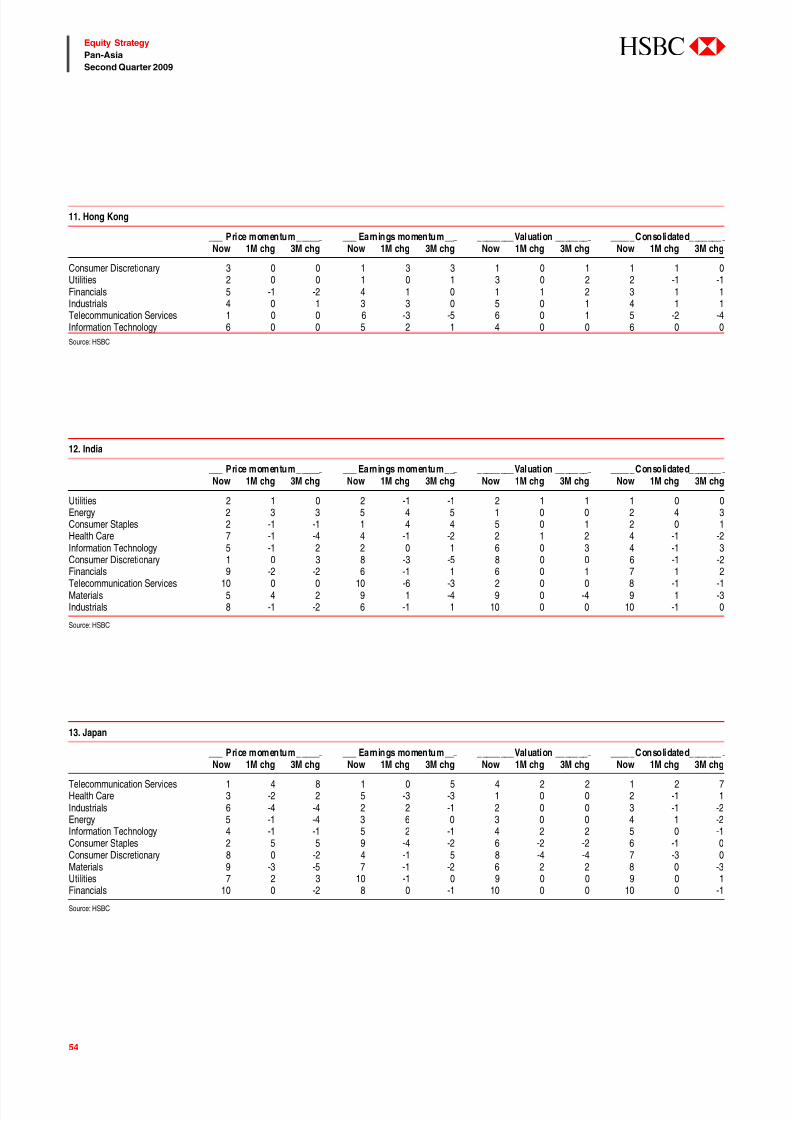
7/31/2019 Asia Insights the Long Climb Back Apr-1
http://slidepdf.com/reader/full/asia-insights-the-long-climb-back-apr-1 54/82
54
Equity Strategy
Pan-Asia
Second Quarter 2009
abc
11. Hong Kong
___ Price momentum_____ ___ Earnings momentum__ ________Valuation _______ _____Consolidated_______Now 1M chg 3M chg Now 1M chg 3M chg Now 1M chg 3M chg Now 1M chg 3M chg
Consumer Discretionary 3 0 0 1 3 3 1 0 1 1 1 0Utilities 2 0 0 1 0 1 3 0 2 2 -1 -1Financials 5 -1 -2 4 1 0 1 1 2 3 1 1Industrials 4 0 1 3 3 0 5 0 1 4 1 1Telecommunication Services 1 0 0 6 -3 -5 6 0 1 5 -2 -4Information Technology 6 0 0 5 2 1 4 0 0 6 0 0
Source: HSBC
12. India
___ Price momentum_____ ___ Earnings momentum__ ________Valuation _______ _____Consolidated_______Now 1M chg 3M chg Now 1M chg 3M chg Now 1M chg 3M chg Now 1M chg 3M chg
Utilities 2 1 0 2 -1 -1 2 1 1 1 0 0Energy 2 3 3 5 4 5 1 0 0 2 4 3Consumer Staples 2 -1 -1 1 4 4 5 0 1 2 0 1Health Care 7 -1 -4 4 -1 -2 2 1 2 4 -1 -2Information Technology 5 -1 2 2 0 1 6 0 3 4 -1 3Consumer Discretionary 1 0 3 8 -3 -5 8 0 0 6 -1 -2
Financials 9 -2 -2 6 -1 1 6 0 1 7 1 2Telecommunication Services 10 0 0 10 -6 -3 2 0 0 8 -1 -1Materials 5 4 2 9 1 -4 9 0 -4 9 1 -3Industrials 8 -1 -2 6 -1 1 10 0 0 10 -1 0
Source: HSBC
13. Japan
___ Price momentum_____ ___ Earnings momentum__ ________Valuation _______ _____Consolidated_______
Now 1M chg 3M chg Now 1M chg 3M chg Now 1M chg 3M chg Now 1M chg 3M chg
Telecommunication Services 1 4 8 1 0 5 4 2 2 1 2 7Health Care 3 -2 2 5 -3 -3 1 0 0 2 -1 1Industrials 6 -4 -4 2 2 -1 2 0 0 3 -1 -2Energy 5 -1 -4 3 6 0 3 0 0 4 1 -2Information Technology 4 -1 -1 5 2 -1 4 2 2 5 0 -1Consumer Staples 2 5 5 9 -4 -2 6 -2 -2 6 -1 0Consumer Discretionary 8 0 -2 4 -1 5 8 -4 -4 7 -3 0Materials 9 -3 -5 7 -1 -2 6 2 2 8 0 -3Utilities 7 2 3 10 -1 0 9 0 0 9 0 1Financials 10 0 -2 8 0 -1 10 0 0 10 0 -1
Source: HSBC
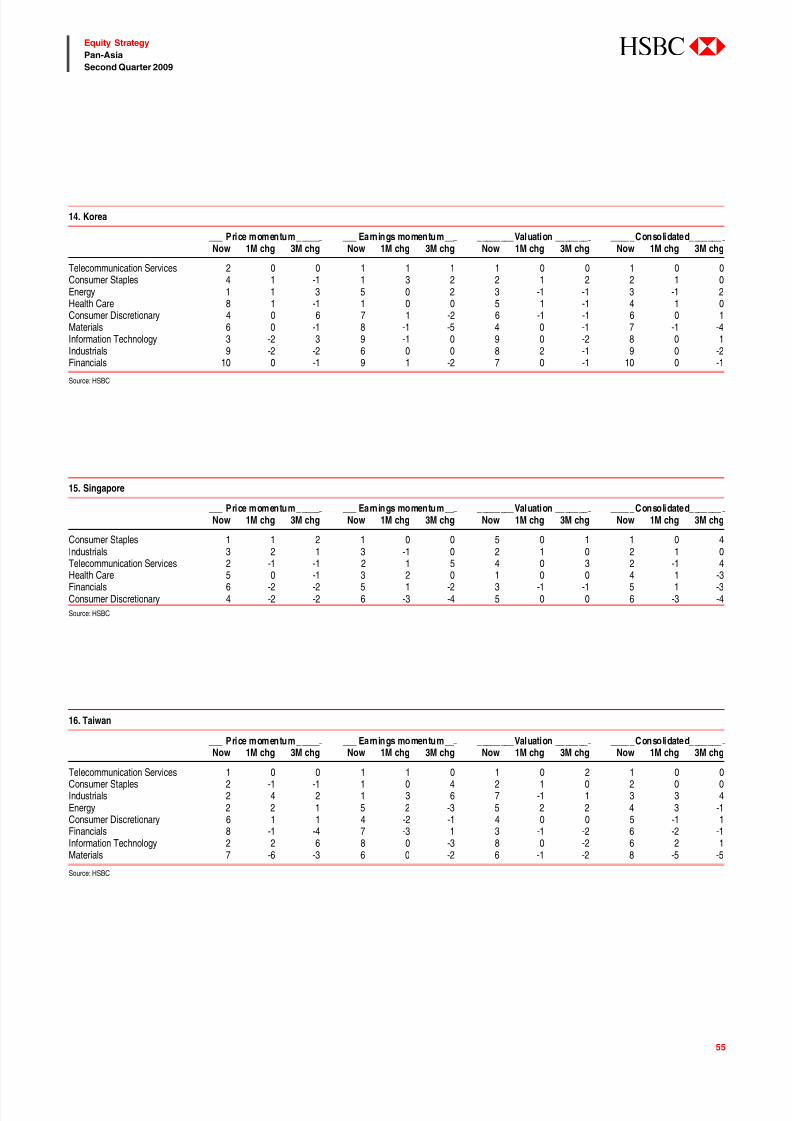
7/31/2019 Asia Insights the Long Climb Back Apr-1
http://slidepdf.com/reader/full/asia-insights-the-long-climb-back-apr-1 55/82
55
Equity Strategy
Pan-Asia
Second Quarter 2009
abc
14. Korea
___ Price momentum_____ ___ Earnings momentum__ ________Valuation _______ _____Consolidated_______Now 1M chg 3M chg Now 1M chg 3M chg Now 1M chg 3M chg Now 1M chg 3M chg
Telecommunication Services 2 0 0 1 1 1 1 0 0 1 0 0Consumer Staples 4 1 -1 1 3 2 2 1 2 2 1 0Energy 1 1 3 5 0 2 3 -1 -1 3 -1 2Health Care 8 1 -1 1 0 0 5 1 -1 4 1 0Consumer Discretionary 4 0 6 7 1 -2 6 -1 -1 6 0 1Materials 6 0 -1 8 -1 -5 4 0 -1 7 -1 -4Information Technology 3 -2 3 9 -1 0 9 0 -2 8 0 1Industrials 9 -2 -2 6 0 0 8 2 -1 9 0 -2Financials 10 0 -1 9 1 -2 7 0 -1 10 0 -1
Source: HSBC
15. Singapore
___ Price momentum_____ ___ Earnings momentum__ ________Valuation _______ _____Consolidated_______Now 1M chg 3M chg Now 1M chg 3M chg Now 1M chg 3M chg Now 1M chg 3M chg
Consumer Staples 1 1 2 1 0 0 5 0 1 1 0 4Industrials 3 2 1 3 -1 0 2 1 0 2 1 0Telecommunication Services 2 -1 -1 2 1 5 4 0 3 2 -1 4
Health Care 5 0 -1 3 2 0 1 0 0 4 1 -3Financials 6 -2 -2 5 1 -2 3 -1 -1 5 1 -3Consumer Discretionary 4 -2 -2 6 -3 -4 5 0 0 6 -3 -4
Source: HSBC
16. Taiwan
___ Price momentum_____ ___ Earnings momentum__ ________Valuation _______ _____Consolidated_______Now 1M chg 3M chg Now 1M chg 3M chg Now 1M chg 3M chg Now 1M chg 3M chg
Telecommunication Services 1 0 0 1 1 0 1 0 2 1 0 0Consumer Staples 2 -1 -1 1 0 4 2 1 0 2 0 0Industrials 2 4 2 1 3 6 7 -1 1 3 3 4Energy 2 2 1 5 2 -3 5 2 2 4 3 -1Consumer Discretionary 6 1 1 4 -2 -1 4 0 0 5 -1 1Financials 8 -1 -4 7 -3 1 3 -1 -2 6 -2 -1Information Technology 2 2 6 8 0 -3 8 0 -2 6 2 1Materials 7 -6 -3 6 0 -2 6 -1 -2 8 -5 -5
Source: HSBC
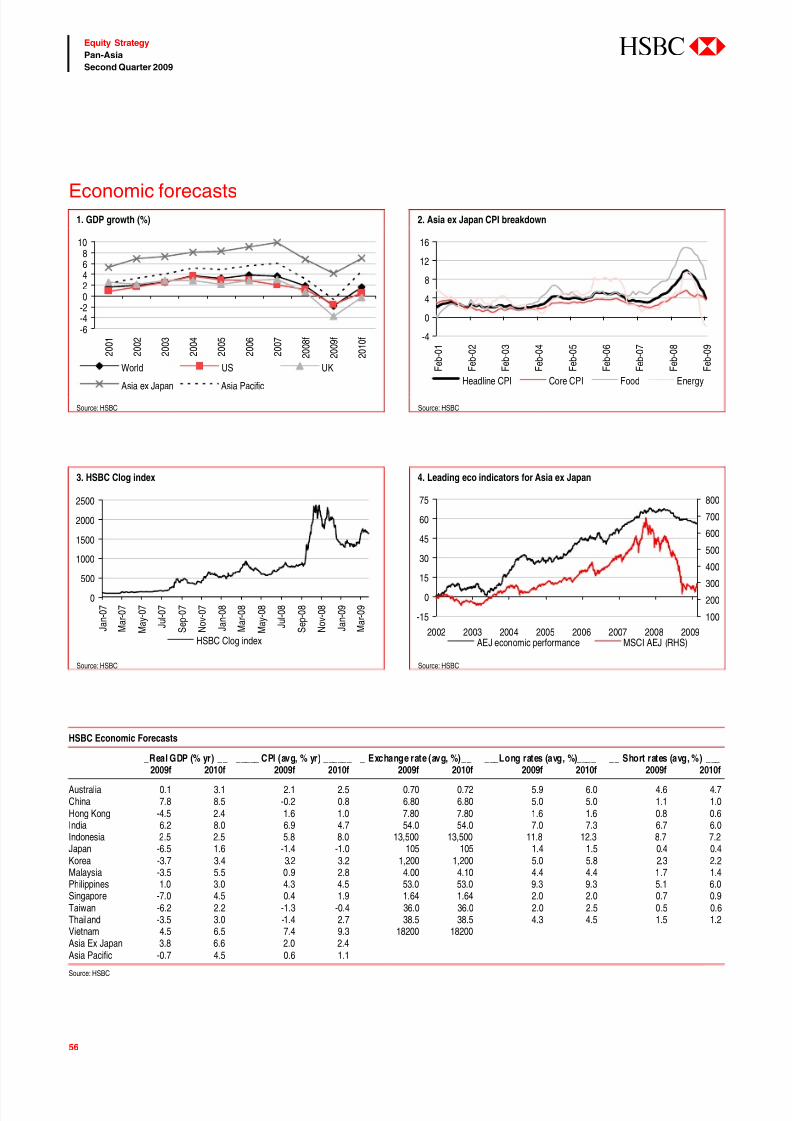
7/31/2019 Asia Insights the Long Climb Back Apr-1
http://slidepdf.com/reader/full/asia-insights-the-long-climb-back-apr-1 56/82
56
Equity Strategy
Pan-Asia
Second Quarter 2009
abc
Economic forecasts1. GDP growth (%) 2. Asia ex Japan CPI breakdown
-6-4-202468
10
2 0 0 1
2 0 0 2
2 0 0 3
2 0 0 4
2 0 0 5
2 0 0 6
2 0 0 7
2 0 0 8 f
2 0 0 9 f
2 0 1 0 f
World US UK
Asia ex Japan Asia Pacific
-4
0
4
8
12
16
F e b - 0 1
F e b - 0 2
F e b - 0 3
F e b - 0 4
F e b - 0 5
F e b - 0 6
F e b - 0 7
F e b - 0 8
F e b - 0 9
Headline CPI Core CPI Food Energy
Source: HSBC Source: HSBC
3. HSBC Clog index 4. Leading eco indicators for Asia ex Japan
0
500
1000
1500
2000
2500
J a n - 0 7
M a r - 0 7
M a y - 0 7
J u l - 0 7
S e p - 0 7
N o v - 0 7
J a n - 0 8
M a r - 0 8
M a y - 0 8
J u l - 0 8
S e p - 0 8
N o v - 0 8
J a n - 0 9
M a r - 0 9
HSBC Clog index
-15
0
15
30
45
60
75
2002 2003 2004 2005 2006 2007 2008 2009
100
200
300
400
500
600
700
800
AEJ economic performance MSCI AEJ (RHS)
Source: HSBC Source: HSBC
HSBC Economic Forecasts
_Real GDP (% yr) __ _____ CPI (avg, % yr) ______ _ Exchange rate (avg, %)__ ___Long rates (avg, %)____ __ Short rates (avg, %) ___2009f 2010f 2009f 2010f 2009f 2010f 2009f 2010f 2009f 2010f
Australia 0.1 3.1 2.1 2.5 0.70 0.72 5.9 6.0 4.6 4.7China 7.8 8.5 -0.2 0.8 6.80 6.80 5.0 5.0 1.1 1.0Hong Kong -4.5 2.4 1.6 1.0 7.80 7.80 1.6 1.6 0.8 0.6India 6.2 8.0 6.9 4.7 54.0 54.0 7.0 7.3 6.7 6.0Indonesia 2.5 2.5 5.8 8.0 13,500 13,500 11.8 12.3 8.7 7.2Japan -6.5 1.6 -1.4 -1.0 105 105 1.4 1.5 0.4 0.4Korea -3.7 3.4 3.2 3.2 1,200 1,200 5.0 5.8 2.3 2.2Malaysia -3.5 5.5 0.9 2.8 4.00 4.10 4.4 4.4 1.7 1.4Philippines 1.0 3.0 4.3 4.5 53.0 53.0 9.3 9.3 5.1 6.0Singapore -7.0 4.5 0.4 1.9 1.64 1.64 2.0 2.0 0.7 0.9Taiwan -6.2 2.2 -1.3 -0.4 36.0 36.0 2.0 2.5 0.5 0.6Thailand -3.5 3.0 -1.4 2.7 38.5 38.5 4.3 4.5 1.5 1.2Vietnam 4.5 6.5 7.4 9.3 18200 18200Asia Ex Japan 3.8 6.6 2.0 2.4
Asia Pacific -0.7 4.5 0.6 1.1
Source: HSBC

7/31/2019 Asia Insights the Long Climb Back Apr-1
http://slidepdf.com/reader/full/asia-insights-the-long-climb-back-apr-1 57/82
57
Equity Strategy
Pan-Asia
Second Quarter 2009
abc
Top stock picks
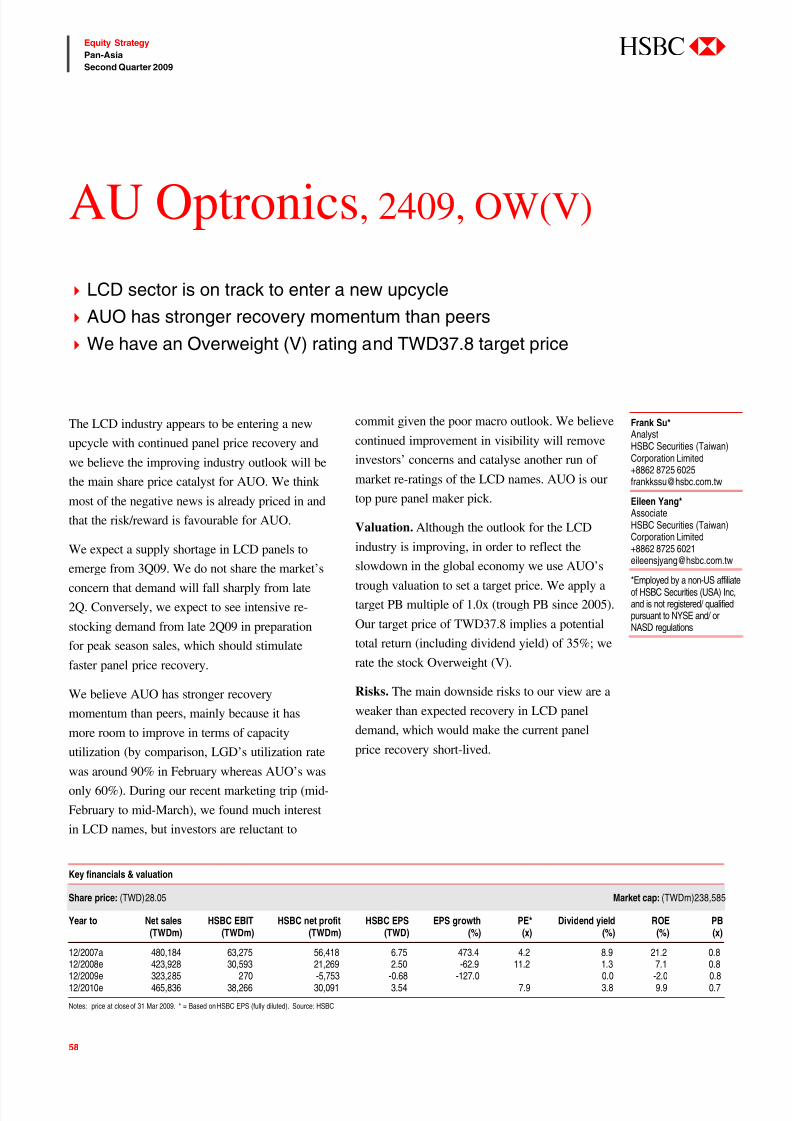
7/31/2019 Asia Insights the Long Climb Back Apr-1
http://slidepdf.com/reader/full/asia-insights-the-long-climb-back-apr-1 58/82
58
Equity Strategy
Pan-Asia
Second Quarter 2009
abc
The LCD industry appears to be entering a new
upcycle with continued panel price recovery and
we believe the improving industry outlook will be
the main share price catalyst for AUO. We think
most of the negative news is already priced in and
that the risk/reward is favourable for AUO.
We expect a supply shortage in LCD panels to
emerge from 3Q09. We do not share the market’sconcern that demand will fall sharply from late
2Q. Conversely, we expect to see intensive re-
stocking demand from late 2Q09 in preparation
for peak season sales, which should stimulate
faster panel price recovery.
We believe AUO has stronger recovery
momentum than peers, mainly because it has
more room to improve in terms of capacity
utilization (by comparison, LGD’s utilization rate
was around 90% in February whereas AUO’s was
only 60%). During our recent marketing trip (mid-
February to mid-March), we found much interest
in LCD names, but investors are reluctant to
commit given the poor macro outlook. We believe
continued improvement in visibility will remove
investors’ concerns and catalyse another run of
market re-ratings of the LCD names. AUO is our
top pure panel maker pick.
Valuation. Although the outlook for the LCD
industry is improving, in order to reflect the
slowdown in the global economy we use AUO’s
trough valuation to set a target price. We apply a
target PB multiple of 1.0x (trough PB since 2005).
Our target price of TWD37.8 implies a potential
total return (including dividend yield) of 35%; we
rate the stock Overweight (V).
Risks. The main downside risks to our view are a
weaker than expected recovery in LCD panel
demand, which would make the current panel
price recovery short-lived.
AU Optronics, 2409, OW(V)
LCD sector is on track to enter a new upcycle
AUO has stronger recovery momentum than peers
We have an Overweight (V) rating and TWD37.8 target price
Frank Su*AnalystHSBC Securities (Taiwan)Corporation Limited+8862 8725 [email protected]
Eileen Yang*AssociateHSBC Securities (Taiwan)Corporation Limited+8862 8725 [email protected]
*Employed by a non-US affiliateof HSBC Securities (USA) Inc,and is not registered/ qualifiedpursuant to NYSE and/ orNASD regulations
Key financials & valuation
Share price: (TWD) 28.05 Market cap: (TWDm)238,585
Year to Net sales HSBC EBIT HSBC net profit HSBC EPS EPS growth PE* Dividend yield ROE PB(TWDm) (TWDm) (TWDm) (TWD) (%) (x) (%) (%) (x)
12/2007a 480,184 63,275 56,418 6.75 473.4 4.2 8.9 21.2 0.812/2008e 423,928 30,593 21,269 2.50 -62.9 11.2 1.3 7.1 0.812/2009e 323,285 270 -5,753 -0.68 -127.0 0.0 -2.0 0.812/2010e 465,836 38,266 30,091 3.54 7.9 3.8 9.9 0.7
Notes: price at close of 31 Mar 2009. * = Based on HSBC EPS (fully diluted). Source: HSBC

7/31/2019 Asia Insights the Long Climb Back Apr-1
http://slidepdf.com/reader/full/asia-insights-the-long-climb-back-apr-1 59/82
59
Equity Strategy
Pan-Asia
Second Quarter 2009
abc
NIM better protected. NIM declined 6bps q-o-q
in 4Q, much smaller than peers (14bps at ICBC,
23bps at CCB, and 60bps at BoCOM). We believe
BOC is most defensive to rate cuts as 29% of loans
and 37% of investments are in foreign currency,
thus not directly affected by PBOC rate cuts.
More diversified revenue. Net interest income
accounts for c70% of operating income, the
lowest among Chinese banks. As a result, revenue
is more diversified and protected.
Toxic assets and FX investments cut. Toxic assets
were reduced to USD7.25bn at end-2008, or 32%
below 2Q08. FX investments were cut 11% y-o-y to
RMB615bn, accounting for 37% of total investment
(vs. 43% at end-07). We expect much lower
impairment charges on FX investment in 2009.
Share overhang reduced: 13.9% of shares that
were held by strategic investors saw lock-up
expiry in December 2008. UBS, Li Ka-shing and
RBS Group sold an aggregate 6.4% of BOC
shares in January 2009. This brings down the
percentage of shares subject to strategic
shareholder sell-down to 7.5%.
Low volatility compared to peers. This is a plus
in a down-cycle and markets may become more
sentiment driven.
Valuation. Even with the recent price rally,
BOC’s valuation is still attractive compared to
other SOE banks. BOC is trading at 1.2x 2009e
book value vs BoCOM at 1.5x, CCB and ICBC
each at 1.9x. Our target price is HKD3.00 for the
H-share, based on sum-of-the-parts valuation.
Risks. Major upside (and downside) risks include
a) higher/ (lower) NIM due to smaller / bigger than
expected rate cuts; b) better/ (worse) asset quality;
c) lower/(higher) fx and sub-prime related losses.
Bank of China, 3988, OW(V)
Profit “protection”: Least sensitive to rate cuts of H-share banks;
revenue sources perhaps more diversified through the cycle
Overhangs reduced: Toxic assets/FX investments greatly reduced
and recent blocks have removed large share overhang threats
We have an Overweight (V) rating and HKD3.00 target price
Todd Dunivant*Regional Head of BanksResearchThe Hongkong and ShanghaiBanking Corporation Limited+852 2996 [email protected]
Shary Wu*AnalystThe Hongkong and ShanghaiBanking Corporation Limited+852 2996 6585 [email protected]
*Employed by a non-US affiliateof HSBC Securities (USA) Inc,and is not registered/ qualifiedpursuant to NYSE and/ orNASD regulations
Key financials & valuation
Share price: (HKD) 2.57 Market cap: (USDbn)84
Year to HSBC NAV HSBC PBT HSBC net profit HSBC EPS EPS growth PE* Dividend yield ROE PB__________________ RMBm ____________________ RMB (%) (x) (%) (%) (x)
12/2008a 1.83 87,197 64,360 0.25 14 8.9 5.8 14.5 1.212/2009e 1.93 74,185 57,728 0.23 -10 9.9 4.5 12.1 1.212/2010e 2.10 91,370 70,964 0.28 23 8.1 5.6 13.9 1.1
Notes: price at close of 31 Mar 2009. * = Based on HSBC EPS (fully diluted). Source: HSBC estimates
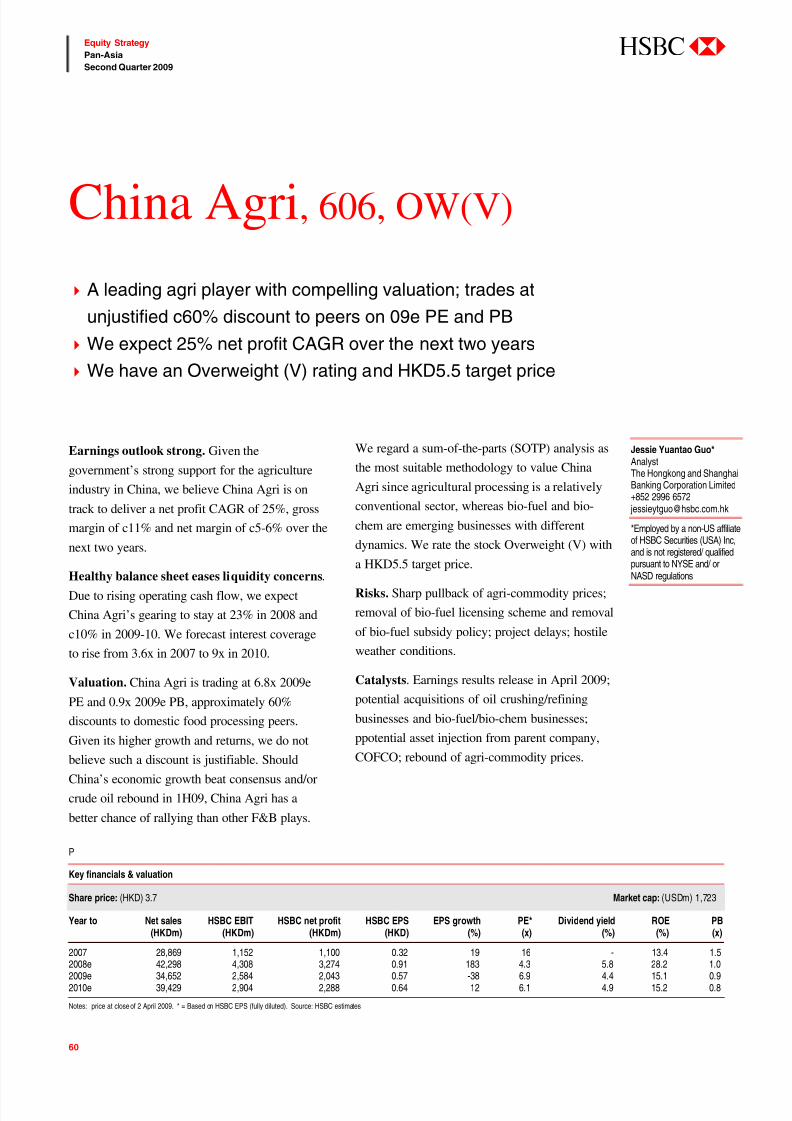
7/31/2019 Asia Insights the Long Climb Back Apr-1
http://slidepdf.com/reader/full/asia-insights-the-long-climb-back-apr-1 60/82
60
Equity Strategy
Pan-Asia
Second Quarter 2009
abc
Earnings outlook strong. Given the
government’s strong support for the agriculture
industry in China, we believe China Agri is on
track to deliver a net profit CAGR of 25%, gross
margin of c11% and net margin of c5-6% over the
next two years.
Healthy balance sheet eases liquidity concerns.
Due to rising operating cash flow, we expect
China Agri’s gearing to stay at 23% in 2008 and
c10% in 2009-10. We forecast interest coverage
to rise from 3.6x in 2007 to 9x in 2010.
Valuation. China Agri is trading at 6.8x 2009e
PE and 0.9x 2009e PB, approximately 60%
discounts to domestic food processing peers.
Given its higher growth and returns, we do not
believe such a discount is justifiable. ShouldChina’s economic growth beat consensus and/or
crude oil rebound in 1H09, China Agri has a
better chance of rallying than other F&B plays.
We regard a sum-of-the-parts (SOTP) analysis as
the most suitable methodology to value China
Agri since agricultural processing is a relatively
conventional sector, whereas bio-fuel and bio-
chem are emerging businesses with different
dynamics. We rate the stock Overweight (V) with
a HKD5.5 target price.
Risks. Sharp pullback of agri-commodity prices;
removal of bio-fuel licensing scheme and removal
of bio-fuel subsidy policy; project delays; hostile
weather conditions.
Catalysts. Earnings results release in April 2009;
potential acquisitions of oil crushing/refining
businesses and bio-fuel/bio-chem businesses;
ppotential asset injection from parent company,
COFCO; rebound of agri-commodity prices.
China Agri, 606, OW(V)
A leading agri player with compelling valuation; trades at
unjustified c60% discount to peers on 09e PE and PB
We expect 25% net profit CAGR over the next two years
We have an Overweight (V) rating and HKD5.5 target price
Jessie Yuantao Guo*AnalystThe Hongkong and ShanghaiBanking Corporation Limited+852 2996 6572
*Employed by a non-US affiliateof HSBC Securities (USA) Inc,and is not registered/ qualifiedpursuant to NYSE and/ or
NASD regulations
P
Key financials & valuation
Share price: (HKD) 3.7 Market cap: (USDm) 1,723
Year to Net sales HSBC EBIT HSBC net profit HSBC EPS EPS growth PE* Dividend yield ROE PB(HKDm) (HKDm) (HKDm) (HKD) (%) (x) (%) (%) (x)
2007 28,869 1,152 1,100 0.32 19 16 - 13.4 1.52008e 42,298 4,308 3,274 0.91 183 4.3 5.8 28.2 1.02009e 34,652 2,584 2,043 0.57 -38 6.9 4.4 15.1 0.92010e 39,429 2,904 2,288 0.64 12 6.1 4.9 15.2 0.8
Notes: price at close of 2 April 2009. * = Based on HSBC EPS (fully diluted). Source: HSBC estimates

7/31/2019 Asia Insights the Long Climb Back Apr-1
http://slidepdf.com/reader/full/asia-insights-the-long-climb-back-apr-1 61/82
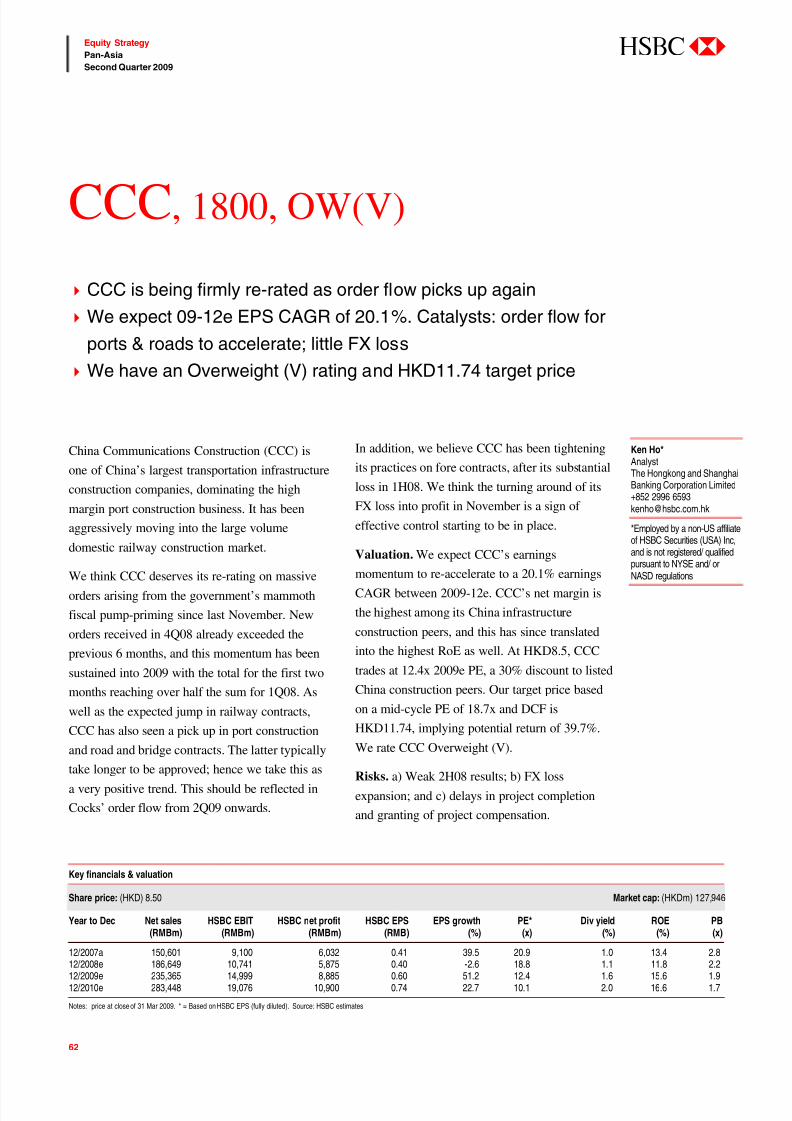
7/31/2019 Asia Insights the Long Climb Back Apr-1
http://slidepdf.com/reader/full/asia-insights-the-long-climb-back-apr-1 62/82
62
Equity Strategy
Pan-Asia
Second Quarter 2009
abc
China Communications Construction (CCC) is
one of China’s largest transportation infrastructure
construction companies, dominating the high
margin port construction business. It has been
aggressively moving into the large volume
domestic railway construction market.
We think CCC deserves its re-rating on massive
orders arising from the government’s mammoth
fiscal pump-priming since last November. New
orders received in 4Q08 already exceeded the
previous 6 months, and this momentum has been
sustained into 2009 with the total for the first two
months reaching over half the sum for 1Q08. As
well as the expected jump in railway contracts,
CCC has also seen a pick up in port construction
and road and bridge contracts. The latter typically
take longer to be approved; hence we take this as
a very positive trend. This should be reflected in
Cocks’ order flow from 2Q09 onwards.
In addition, we believe CCC has been tightening
its practices on fore contracts, after its substantial
loss in 1H08. We think the turning around of its
FX loss into profit in November is a sign of
effective control starting to be in place.
Valuation. We expect CCC’s earnings
momentum to re-accelerate to a 20.1% earningsCAGR between 2009-12e. CCC’s net margin is
the highest among its China infrastructure
construction peers, and this has since translated
into the highest RoE as well. At HKD8.5, CCC
trades at 12.4x 2009e PE, a 30% discount to listed
China construction peers. Our target price based
on a mid-cycle PE of 18.7x and DCF is
HKD11.74, implying potential return of 39.7%.
We rate CCC Overweight (V).
Risks. a) Weak 2H08 results; b) FX loss
expansion; and c) delays in project completion
and granting of project compensation.
CCC, 1800, OW(V)
CCC is being firmly re-rated as order flow picks up again
We expect 09-12e EPS CAGR of 20.1%. Catalysts: order flow for
ports & roads to accelerate; little FX loss
We have an Overweight (V) rating and HKD11.74 target price
Ken Ho*AnalystThe Hongkong and ShanghaiBanking Corporation Limited +852 2996 [email protected]
*Employed by a non-US affiliateof HSBC Securities (USA) Inc,and is not registered/ qualifiedpursuant to NYSE and/ or
NASD regulations
Key financials & valuation
Share price: (HKD) 8.50 Market cap: (HKDm) 127,946
Year to Dec Net sales HSBC EBIT HSBC net profit HSBC EPS EPS growth PE* Div yield ROE PB(RMBm) (RMBm) (RMBm) (RMB) (%) (x) (%) (%) (x)
12/2007a 150,601 9,100 6,032 0.41 39.5 20.9 1.0 13.4 2.812/2008e 186,649 10,741 5,875 0.40 -2.6 18.8 1.1 11.8 2.212/2009e 235,365 14,999 8,885 0.60 51.2 12.4 1.6 15.6 1.912/2010e 283,448 19,076 10,900 0.74 22.7 10.1 2.0 16.6 1.7
Notes: price at close of 31 Mar 2009. * = Based on HSBC EPS (fully diluted). Source: HSBC estimates
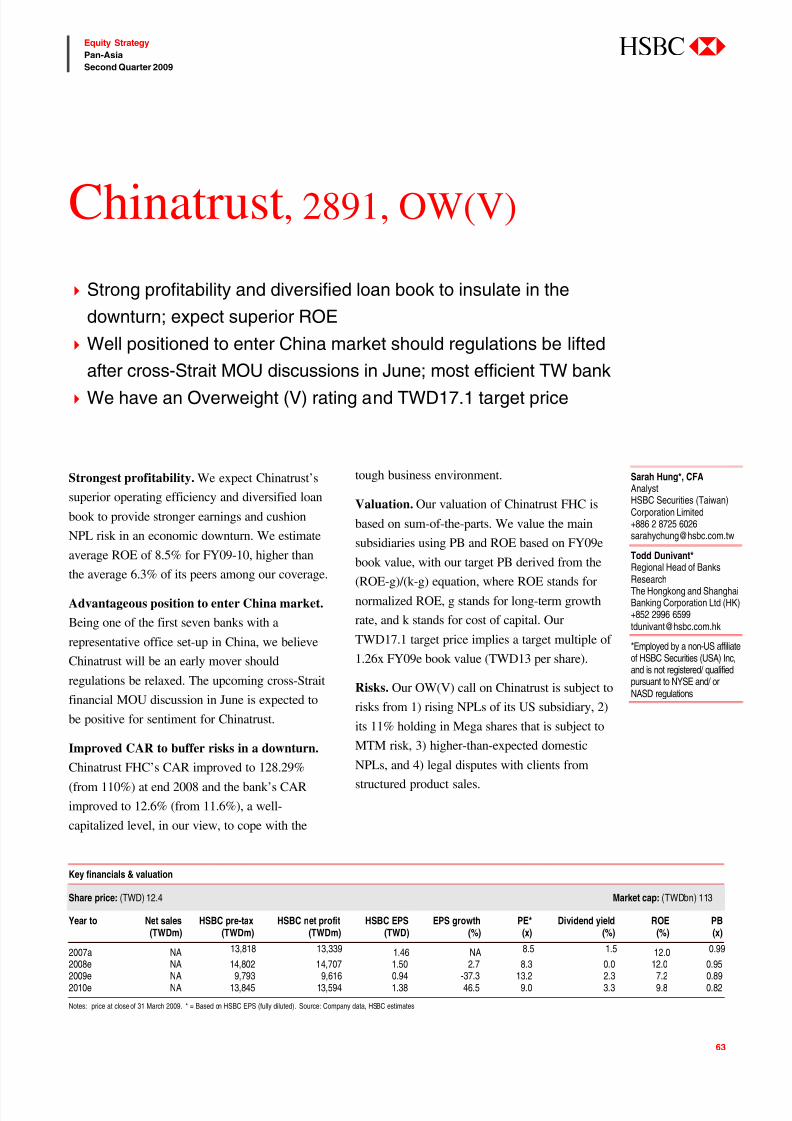
7/31/2019 Asia Insights the Long Climb Back Apr-1
http://slidepdf.com/reader/full/asia-insights-the-long-climb-back-apr-1 63/82
63
Equity Strategy
Pan-Asia
Second Quarter 2009
abc
Strongest profitability. We expect Chinatrust’s
superior operating efficiency and diversified loan
book to provide stronger earnings and cushion
NPL risk in an economic downturn. We estimate
average ROE of 8.5% for FY09-10, higher than
the average 6.3% of its peers among our coverage.
Advantageous position to enter China market.
Being one of the first seven banks with a
representative office set-up in China, we believe
Chinatrust will be an early mover should
regulations be relaxed. The upcoming cross-Strait
financial MOU discussion in June is expected to
be positive for sentiment for Chinatrust.
Improved CAR to buffer risks in a downturn.
Chinatrust FHC’s CAR improved to 128.29%
(from 110%) at end 2008 and the bank’s CAR
improved to 12.6% (from 11.6%), a well-
capitalized level, in our view, to cope with the
tough business environment.
Valuation. Our valuation of Chinatrust FHC is
based on sum-of-the-parts. We value the main
subsidiaries using PB and ROE based on FY09e
book value, with our target PB derived from the
(ROE-g)/(k-g) equation, where ROE stands for
normalized ROE, g stands for long-term growth
rate, and k stands for cost of capital. Our
TWD17.1 target price implies a target multiple of
1.26x FY09e book value (TWD13 per share).
Risks. Our OW(V) call on Chinatrust is subject to
risks from 1) rising NPLs of its US subsidiary, 2)
its 11% holding in Mega shares that is subject to
MTM risk, 3) higher-than-expected domestic
NPLs, and 4) legal disputes with clients fromstructured product sales.
Chinatrust, 2891, OW(V)
Strong profitability and diversified loan book to insulate in the
downturn; expect superior ROE
Well positioned to enter China market should regulations be lifted
after cross-Strait MOU discussions in June; most efficient TW bank
We have an Overweight (V) rating and TWD17.1 target price
Sarah Hung*, CFAAnalystHSBC Securities (Taiwan)Corporation Limited +886 2 8725 [email protected]
Todd Dunivant*Regional Head of BanksResearchThe Hongkong and ShanghaiBanking Corporation Ltd (HK)+852 2996 [email protected]
*Employed by a non-US affiliateof HSBC Securities (USA) Inc,and is not registered/ qualifiedpursuant to NYSE and/ orNASD regulations
Key financials & valuation
Share price: (TWD) 12.4 Market cap: (TWDbn) 113
Year to Net sales HSBC pre-tax HSBC net profit HSBC EPS EPS growth PE* Dividend yield ROE PB(TWDm) (TWDm) (TWDm) (TWD) (%) (x) (%) (%) (x)
2007a NA13,818 13,339
1.46 NA8.5 1.5
12.00.99
2008e NA 14,802 14,707 1.50 2.7 8.3 0.0 12.0 0.952009e NA 9,793 9,616 0.94 -37.3 13.2 2.3 7.2 0.892010e NA 13,845 13,594 1.38 46.5 9.0 3.3 9.8 0.82
Notes: price at close of 31 March 2009. * = Based on HSBC EPS (fully diluted). Source: Company data, HSBC estimates
7/31/2019 Asia Insights the Long Climb Back Apr-1
http://slidepdf.com/reader/full/asia-insights-the-long-climb-back-apr-1 64/82

7/31/2019 Asia Insights the Long Climb Back Apr-1
http://slidepdf.com/reader/full/asia-insights-the-long-climb-back-apr-1 65/82
65
Equity Strategy
Pan-Asia
Second Quarter 2009
abc
Life business relatively stable versus peers. We
expect the inclusion of ING Life from February to
have limited financial impact on Fubon’s FY09
financial figures due to ING Taiwan’s asset
cleanup at end 2008 and its conservative
investment portfolio. We believe the acquisition
of ING Life is strategically positive to Fubon inthe long term for its greater scale.
Improved asset quality at the banking arm.
The NPL ratio of Taipei Fubon Bank improved to
0.79% at end 2008 from 1.19% at end 2007, with
provision coverage lifted to 75% from 67%; we
believe this level is sound versus peers and will
buffer against the impact of an upward NPL cycle
in the coming quarters.
Diversified business and strong capital. Weexpect Fubon to stay defensive in a downturn due
to its diversified business across banking,
insurance and securities. Fubon FHC’s CAR
improved to 145.7% at end 2008. Despite the
RBC calculation for insurance coming to an end
in 2009, we expect Fubon’s capital to remain
strong and the chance of further recapitalization
for its insurance arm to be small.
Valuation. Our valuation of Fubon FHC is based
on sum-of-the-parts. We value the main
subsidiaries using PB and ROE based on FY09e
book value, with our target PB derived from the
(ROE-g)/(k-g) equation, where ROE stands for
normalized ROE, g stands for long-term growth
rate, and k stands for cost of capital. Life business
is valued using embedded values. Our target price
of TWD23.6 implies a target PB multiple of 1.14x
FY09e book value (TWD20.9 per share).
Risks. Our OW(V) rating is subject to risks from
1) higher-than-expected NPL formation, 2) low
investment yield due to further rate cuts, and 3) a
lengthy economic downturn that drags overall
business environment further.
Fubon, 2881, OW(V)
ING Life inclusion to have limited impact on financial performance
and capital strength
Diversified business and strong capital make Fubon more
defensive in economic downturn
We have an Overweight (V) rating and TWD23.6 target price
Sarah Hung*, CFAAnalystHSBC Securities (Taiwan)Corporation Limited +886 2 8725 [email protected]
Todd Dunivant*Head of Regional BanksResearch
The Hongkong and ShanghaiBanking Corporation Limited +852 2996 [email protected]
*Employed by a non-US affiliateof HSBC Securities (USA) Inc,and is not registered/ qualifiedpursuant to NYSE and/ orNASD regulations
Key financials & valuation
Share price: (TWD) 20.45 Market cap: (TWDbn)166
Year to Net sales HSBC pre-tax HSBC net profit HSBC EPS EPS growth PE* Dividend yield ROE PB(TWDm) (TWDm) (TWDm) (TWD) (%) (x) (%) (%) (x)
2007a NA14,407 14,432 1.87
71.810.9 7.3 8.8 0.94
2008e NA 10,873 10,810 1.40 -25.1 14.6 0.0 7.0 1.082009e NA 11,538 11,463 1.41 0.7 14.5 3.5 7.4 0.982010e NA 12,274 12,236 1.51 6.7 13.6 5.1 7.1 0.93
Notes: price at close of 31 March 2009. * = Based on HSBC EPS (fully diluted). Source: HSBC estimates
7/31/2019 Asia Insights the Long Climb Back Apr-1
http://slidepdf.com/reader/full/asia-insights-the-long-climb-back-apr-1 66/82
66
Equity Strategy
Pan-Asia
Second Quarter 2009
abc
We believe that from 2Q through year-end, the
normal demand cycle will stimulate sales of LCD
panels for large TVs and notebook computers. We
think this will result in a shortage of supply of LCD panels from 3Q09. Monitor panel prices, the
main earnings driver for Innolux, have risen by
about 3% in 1Q09 since the end of 2008. We
forecast that panel prices will rise 10-15% q-o-q in
2Q and 15-20% q-o-q in 3Q09, driven by the
tightening supply-demand balance for LCD panels.
Due to the expected price recovery, better
utilization rates, and greater economies of scale,
we believe Innolux will reach breakeven in April
and become profitable from May. Thus we expectInnolux to return to the black from 2Q09, three
months before pure panel makers AUO (2409 TT)
and LGD (034220 KS).
Valuation. We believe it is appropriate to value
Innolux based on a reasonable PE in an upcycle,
as the company’s business model is for
sustainable profitability and is less cyclical than
pure panel makers. We set our target PE multiple
for Innolux at 20x 2009e EPS. Although the
shares have outperformed the market over the past
three months, we believe rising panel prices and
growing market share will continue to be catalysts
for a market re-rating of the stock over the next 12
months. Our target price of TWD43.0 implies a
potential total return (including dividend yield) of
32%; we rate the stock Overweight (V).
Risks. If the magnitude of the supply shortage isgreater than we expect, Innolux could face the risk
of sourcing inadequate LCD panel supply and
jeopardise its business growth.
Innolux Display, 3481,
OW(V)
Industry outlook remains positive and recovery in monitor panel
prices should accelerate from 2Q09
No change in our view that Innolux will become profitable from
2Q09, one quarter ahead of pure panel makers
We have an Overweight (V) rating and TWD43 target price
Frank Su*AnalystHSBC Securities (Taiwan)Corporation Limited +8862 8725 6025
Eileen Yang*AssociateHSBC Securities (Taiwan)Corporation Limited +8862 8725 [email protected]
*Employed by a non-US affiliateof HSBC Securities (USA) Inc,and is not registered/ qualifiedpursuant to NYSE and/ orNASD regulations
Key financials & valuation
Share price: (TWD) 33.05 Market cap: (TWDm)103,238
Year to Net sales HSBC EBIT HSBC net profit HSBC EPS EPS growth PE* Dividend yield ROE PB(TWDm) (TWDm) (TWDm) (TWD) (%) (x) (%) (%) (x)
12/2007a 157,171 17,078 16,152 6.32 395.7 5.2 4.5 24.6 1.012/2008e 160,008 5,966 5,449 1.72 -72.7 19.2 1.3 5.7 1.112/2009e 187,629 8,244 6,780 2.15 24.4 15.4 1.6 6.8 1.012/2010e 242,978 17,896 15,292 4.84 125.5 6.8 3.7 14.0 0.9
Notes: price at close of 31 Mar 2009. * = Based on HSBC EPS (fully diluted). Source: HSBC estimates

7/31/2019 Asia Insights the Long Climb Back Apr-1
http://slidepdf.com/reader/full/asia-insights-the-long-climb-back-apr-1 67/82
67
Equity Strategy
Pan-Asia
Second Quarter 2009
abc
Maanshan will be a major beneficiary of China’s
RMB4trn stimulus package that will focus on
investment in railways, roads, public housing and
rural infrastructure, all of which will require
construction steel. Long steel (construction steel),
which account for nearly half of Maanshan’s
revenues, should benefit from increasing
expenditure on infrastructure activity over the
next 12-18 months. The stock is inexpensive
relative to its peers.
Catalysts. Confirmation of improved demand for
construction steel should be evidenced by declining
stock levels over the coming months. After a large
loss of Rmb2.3bn in 4Q08, we are looking for a
return to profits by late 2Q09, which will be an
important indicator of improving market conditions,
at least incrementally. An area where Maanshan
stands to strongly benefit is in increased investmentsin railways, where the company is the largest railway
wheel producer in China.
Valuation. We reiterate our OW(V) rating on
Maanshan for its organic growth and leverage to
construction steel. Maanshan should benefit from
its recently completed 5mt flat steel plant,
together with tight markets for construction steel.
We view its valuation as compelling – 0.8x 2009e
PB (EV/t of USD364/t), nearly a 50% discount to
its regional peers. Our target price of HKD3.3 is
based on 0.86x 2008e PB (book value RMB3.35).
This multiple is based on a residual income
method, i.e., P=BVx(ROE-g)/(CoE-g), assuming
our forecast ROE of 10%.
Risks. A more severe slowdown in the US or
China would negatively impact steel consumption
growth, plus Maanshan’s ability to manage costs
will be critical given its low margins and high
gearing.
Maanshan, 323, OW(V)
A major beneficiary of China’s fiscal infrastructure stimulus
Leverage to China’s potential undersupply in construction steel
We have an Overweight (V) rating and HKD3.3 target price
Daniel Kang*AnalystThe Hongkong and ShanghaiBanking Corporation Limited +852 2996 [email protected]
Sarah Mak*AnalystThe Hongkong and ShanghaiBanking Corporation Limited +852 2822 [email protected]
*Employed by a non-US affiliateof HSBC Securities (USA) Inc,and is not registered/ qualifiedpursuant to NYSE and/ orNASD regulations
Key financials & valuation
Share price: (HKD) 2.73 Market cap: (USDm) 3,019
Year to Net sales HSBC EBIT HSBC net profi t HSBC EPS EPS growth PE* Dividend yield ROE PBDec (RMBm) (RMBm) (RMBm) (RMB) (%) (x) (%) (%) (x)
200749,053
3,8132,467 0.35 -5.5% 6.9 5.4% 11.4% 0.8
2008e 73,483 2,439 720 0.09 -73.3% 25.8 0.0% 3.1% 0.82009e 60,355 1,951 510 0.07 -29.2% 36.4 0.0% 2.1% 0.82010e 64,162 5,029 2,954 0.38 479.1% 6.3 4.2% 10.8% 0.6
Notes: price at close of 31 March 2009. * = Based on HSBC EPS (fully diluted). Source: Company data, HSBC estimates
7/31/2019 Asia Insights the Long Climb Back Apr-1
http://slidepdf.com/reader/full/asia-insights-the-long-climb-back-apr-1 68/82
68
Equity Strategy
Pan-Asia
Second Quarter 2009
abc
We forecast Pacific Basin will make profits in
2009-10, despite the industry’s low spot rates. The
group has covered 60% and 28% of its 2009 and
2010 handysize days, respectively, and more than
100% of its handymax days at rates that are
significantly higher than y-t-d one-year average
rates.
In the medium term, we believe Pacific Basin isdefensive compared to most other dry bulk
shipping companies because it mostly operates
smaller handysize vessels. We argue that
handysize rates are more defensive than larger
vessels such as capsize because of the high
scrapping potential of the ageing global handysize
fleet. Handysize vessels also serve a niche market
where they are not easily substituted with ability
to operate at smaller and shallow ports.
Furthermore, Pacific Basin faces lower counter-
party risk: chartering to well-capitalised producers
and end-users of industrial cargoes and receiving
95% payment upfront on charter. It has a strong
balance sheet with gross cash totalling
USD1,019m and net cash of USD121m at end
2008.
Valuation. We reiterate our Overweight (V)
rating with 58% potential return, including 5%
dividend yield. Our HKD5.4 target price is based
on replacement value per share. We value fleet at
HKD4.3 (consisting of dry bulk fleet value of
HKD2.4 based on sales and purchases since early
2009 and other fleet value of HKD1.9), net cash
position of HKD0.8, and use FY09e EPS of
HKD0.4.
Risks. Loss of key managers is a risk. Pacific
Basin may be exposed to spot rates in 2011, but
we expect scrapping to mitigate oversupply.
Takeovers and asset acquisitions are potential
catalysts.
Pacific Basin, 2343, OW(V)
Profitable in 2009-10e even at low spot rates
Benefits from handysize scrapping potential, offsetting oversupply
We have an Overweight (V) rating and HKD5.4 target price
Azura Shahrim*AnalystThe Hongkong and ShanghaiBanking Corporation Limited+852 2996 [email protected]
Mark Webb*AnalystThe Hongkong and ShanghaiBanking Corporation Limited +852 2996 [email protected]
*Employed by a non-US affiliateof HSBC Securities (USA) Inc,and is not registered/ qualifiedpursuant to NYSE and/ orNASD regulations
Key financials & valuation
Share price: (HKD) 3.53 Market cap: (HKDm) 6,168
Year to Net sales HSBC EBIT HSBC net profit HSBC EPS EPS growth PE* Dividend yield ROE PB(USDm) (USDm) (USDm) (USD) (%) (x) (%) (%) (x)
12/2008a 909 305 314 0.19 -32.5 2.4 22.2 30.1 0.712/2009e 485 111 78 0.05 -75.0 9.8 5.1 5.7 0.512/2010e 464 78 51 0.03 -35.4 15.1 3.3 3.0 0.412/2011e 433 70 45 0.03 -11.7 17.1 2.9 2.3 0.3
Notes: price at close of 31 Mar 2009. * = Based on HSBC EPS (fully diluted). Source: Company data, HSBC estimates
7/31/2019 Asia Insights the Long Climb Back Apr-1
http://slidepdf.com/reader/full/asia-insights-the-long-climb-back-apr-1 69/82
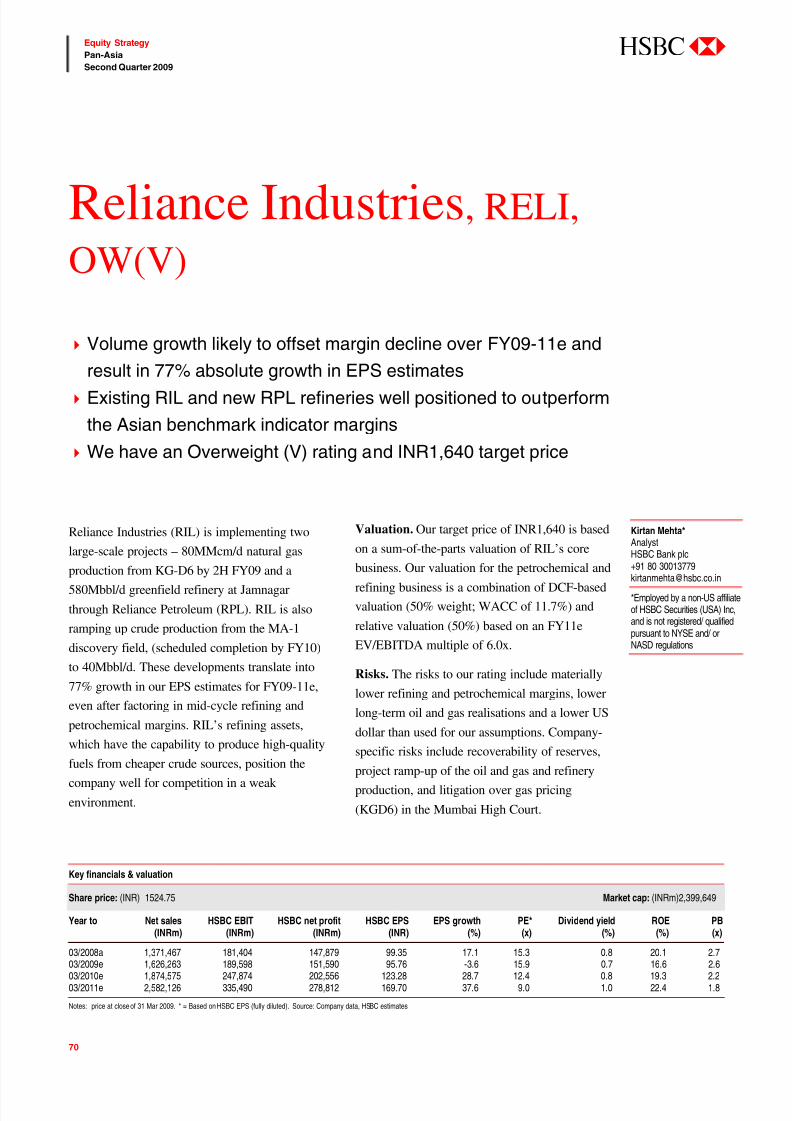
7/31/2019 Asia Insights the Long Climb Back Apr-1
http://slidepdf.com/reader/full/asia-insights-the-long-climb-back-apr-1 70/82
70
Equity Strategy
Pan-Asia
Second Quarter 2009
abc
Reliance Industries (RIL) is implementing two
large-scale projects – 80MMcm/d natural gas
production from KG-D6 by 2H FY09 and a580Mbbl/d greenfield refinery at Jamnagar
through Reliance Petroleum (RPL). RIL is also
ramping up crude production from the MA-1
discovery field, (scheduled completion by FY10)
to 40Mbbl/d. These developments translate into
77% growth in our EPS estimates for FY09-11e,
even after factoring in mid-cycle refining and
petrochemical margins. RIL’s refining assets,
which have the capability to produce high-quality
fuels from cheaper crude sources, position thecompany well for competition in a weak
environment.
Valuation. Our target price of INR1,640 is based
on a sum-of-the-parts valuation of RIL’s core
business. Our valuation for the petrochemical andrefining business is a combination of DCF-based
valuation (50% weight; WACC of 11.7%) and
relative valuation (50%) based on an FY11e
EV/EBITDA multiple of 6.0x.
Risks. The risks to our rating include materially
lower refining and petrochemical margins, lower
long-term oil and gas realisations and a lower US
dollar than used for our assumptions. Company-
specific risks include recoverability of reserves,
project ramp-up of the oil and gas and refinery
production, and litigation over gas pricing
(KGD6) in the Mumbai High Court.
Reliance Industries, RELI,
OW(V)
Volume growth likely to offset margin decline over FY09-11e and
result in 77% absolute growth in EPS estimates
Existing RIL and new RPL refineries well positioned to outperform
the Asian benchmark indicator margins
We have an Overweight (V) rating and INR1,640 target price
Kirtan Mehta*AnalystHSBC Bank plc+91 80 [email protected]
*Employed by a non-US affiliateof HSBC Securities (USA) Inc,and is not registered/ qualifiedpursuant to NYSE and/ orNASD regulations
Key financials & valuation
Share price: (INR) 1524.75 Market cap: (INRm)2,399,649
Year to Net sales HSBC EBIT HSBC net profit HSBC EPS EPS growth PE* Dividend yield ROE PB(INRm) (INRm) (INRm) (INR) (%) (x) (%) (%) (x)
03/2008a 1,371,467 181,404 147,879 99.35 17.1 15.3 0.8 20.1 2.703/2009e 1,626,263 189,598 151,590 95.76 -3.6 15.9 0.7 16.6 2.603/2010e 1,874,575 247,874 202,556 123.28 28.7 12.4 0.8 19.3 2.203/2011e 2,582,126 335,490 278,812 169.70 37.6 9.0 1.0 22.4 1.8
Notes: price at close of 31 Mar 2009. * = Based on HSBC EPS (fully diluted). Source: Company data, HSBC estimates
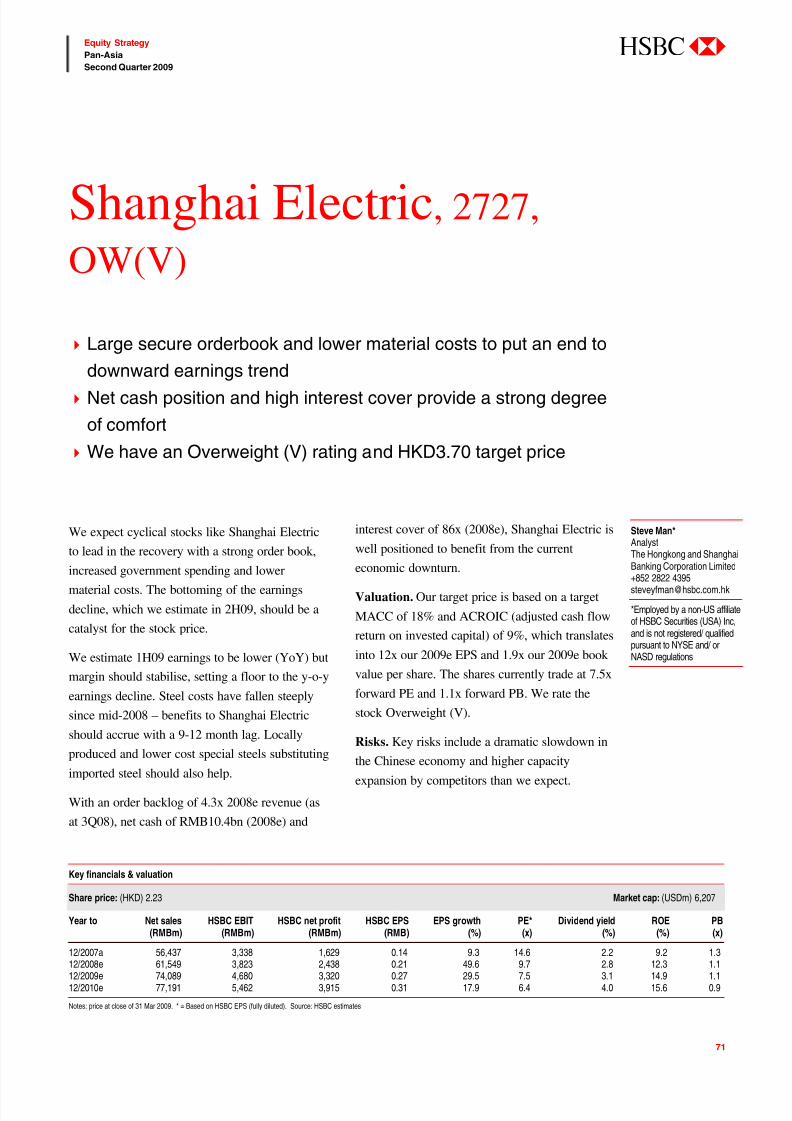
7/31/2019 Asia Insights the Long Climb Back Apr-1
http://slidepdf.com/reader/full/asia-insights-the-long-climb-back-apr-1 71/82
71
Equity Strategy
Pan-Asia
Second Quarter 2009
abc
We expect cyclical stocks like Shanghai Electric
to lead in the recovery with a strong order book,
increased government spending and lowermaterial costs. The bottoming of the earnings
decline, which we estimate in 2H09, should be a
catalyst for the stock price.
We estimate 1H09 earnings to be lower (YoY) but
margin should stabilise, setting a floor to the y-o-y
earnings decline. Steel costs have fallen steeply
since mid-2008 – benefits to Shanghai Electric
should accrue with a 9-12 month lag. Locally
produced and lower cost special steels substituting
imported steel should also help.
With an order backlog of 4.3x 2008e revenue (as
at 3Q08), net cash of RMB10.4bn (2008e) and
interest cover of 86x (2008e), Shanghai Electric is
well positioned to benefit from the current
economic downturn.
Valuation. Our target price is based on a target
MACC of 18% and ACROIC (adjusted cash flow
return on invested capital) of 9%, which translates
into 12x our 2009e EPS and 1.9x our 2009e book
value per share. The shares currently trade at 7.5x
forward PE and 1.1x forward PB. We rate the
stock Overweight (V).
Risks. Key risks include a dramatic slowdown in
the Chinese economy and higher capacityexpansion by competitors than we expect.
Shanghai Electric, 2727,
OW(V)
Large secure orderbook and lower material costs to put an end to
downward earnings trend
Net cash position and high interest cover provide a strong degree
of comfort
We have an Overweight (V) rating and HKD3.70 target price
Steve Man*AnalystThe Hongkong and ShanghaiBanking Corporation Limited+852 2822 [email protected]
*Employed by a non-US affiliateof HSBC Securities (USA) Inc,and is not registered/ qualifiedpursuant to NYSE and/ orNASD regulations
Key financials & valuation
Share price: (HKD) 2.23 Market cap: (USDm) 6,207
Year to Net sales HSBC EBIT HSBC net profit HSBC EPS EPS growth PE* Dividend yield ROE PB(RMBm) (RMBm) (RMBm) (RMB) (%) (x) (%) (%) (x)
12/2007a 56,437 3,338 1,629 0.14 9.3 14.6 2.2 9.2 1.312/2008e 61,549 3,823 2,438 0.21 49.6 9.7 2.8 12.3 1.112/2009e 74,089 4,680 3,320 0.27 29.5 7.5 3.1 14.9 1.112/2010e 77,191 5,462 3,915 0.31 17.9 6.4 4.0 15.6 0.9
Notes: price at close of 31 Mar 2009. * = Based on HSBC EPS (fully diluted). Source: HSBC estimates
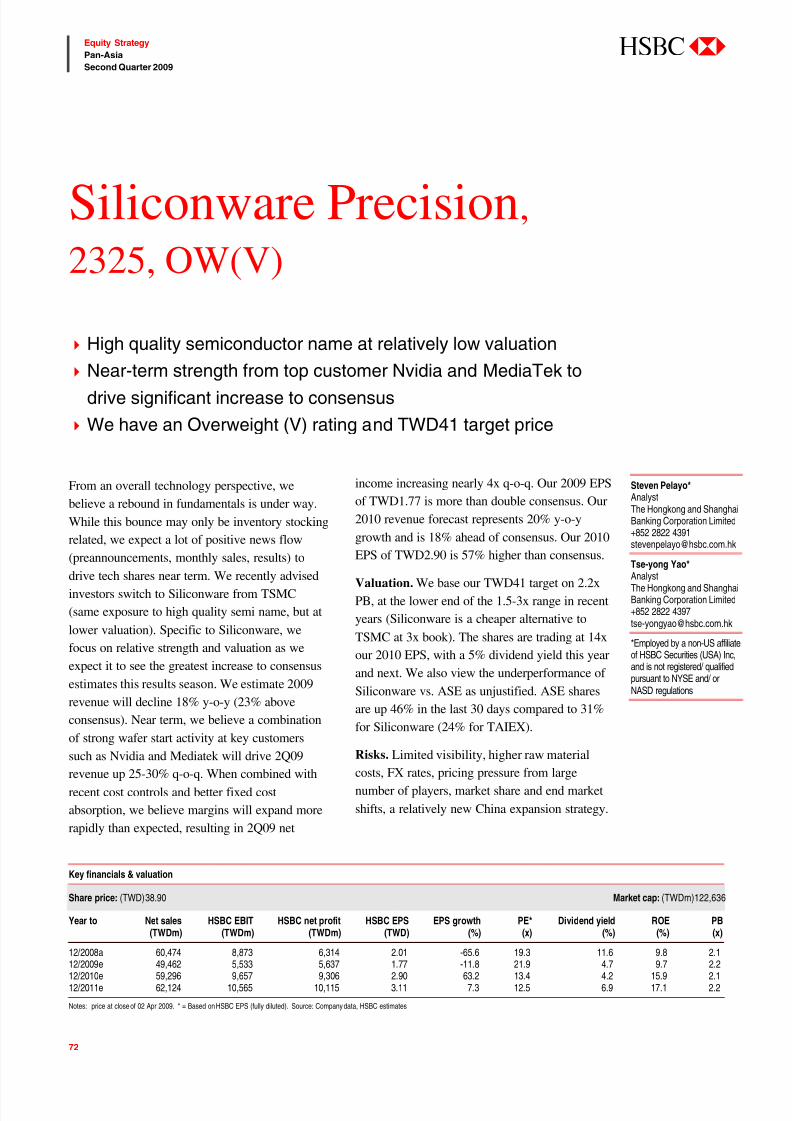
7/31/2019 Asia Insights the Long Climb Back Apr-1
http://slidepdf.com/reader/full/asia-insights-the-long-climb-back-apr-1 72/82
72
Equity Strategy
Pan-Asia
Second Quarter 2009
abc
From an overall technology perspective, we
believe a rebound in fundamentals is under way.
While this bounce may only be inventory stocking
related, we expect a lot of positive news flow
(preannouncements, monthly sales, results) to
drive tech shares near term. We recently advised
investors switch to Siliconware from TSMC
(same exposure to high quality semi name, but at
lower valuation). Specific to Siliconware, we
focus on relative strength and valuation as we
expect it to see the greatest increase to consensus
estimates this results season. We estimate 2009
revenue will decline 18% y-o-y (23% above
consensus). Near term, we believe a combination
of strong wafer start activity at key customers
such as Nvidia and Mediatek will drive 2Q09
revenue up 25-30% q-o-q. When combined with
recent cost controls and better fixed cost
absorption, we believe margins will expand more
rapidly than expected, resulting in 2Q09 net
income increasing nearly 4x q-o-q. Our 2009 EPS
of TWD1.77 is more than double consensus. Our
2010 revenue forecast represents 20% y-o-y
growth and is 18% ahead of consensus. Our 2010
EPS of TWD2.90 is 57% higher than consensus.
Valuation. We base our TWD41 target on 2.2x
PB, at the lower end of the 1.5-3x range in recent
years (Siliconware is a cheaper alternative to
TSMC at 3x book). The shares are trading at 14x
our 2010 EPS, with a 5% dividend yield this year
and next. We also view the underperformance of
Siliconware vs. ASE as unjustified. ASE shares
are up 46% in the last 30 days compared to 31%
for Siliconware (24% for TAIEX).
Risks. Limited visibility, higher raw material
costs, FX rates, pricing pressure from large
number of players, market share and end market
shifts, a relatively new China expansion strategy.
Siliconware Precision,
2325, OW(V)
High quality semiconductor name at relatively low valuation
Near-term strength from top customer Nvidia and MediaTek to
drive significant increase to consensus
We have an Overweight (V) rating and TWD41 target price
Steven Pelayo*AnalystThe Hongkong and ShanghaiBanking Corporation Limited+852 2822 [email protected]
Tse-yong Yao*
AnalystThe Hongkong and ShanghaiBanking Corporation Limited +852 2822 [email protected]
*Employed by a non-US affiliateof HSBC Securities (USA) Inc,and is not registered/ qualifiedpursuant to NYSE and/ orNASD regulations
Key financials & valuation
Share price: (TWD) 38.90 Market cap: (TWDm)122,636
Year to Net sales HSBC EBIT HSBC net profit HSBC EPS EPS growth PE* Dividend yield ROE PB(TWDm) (TWDm) (TWDm) (TWD) (%) (x) (%) (%) (x)
12/2008a 60,474 8,873 6,314 2.01 -65.6 19.3 11.6 9.8 2.112/2009e 49,462 5,533 5,637 1.77 -11.8 21.9 4.7 9.7 2.212/2010e 59,296 9,657 9,306 2.90 63.2 13.4 4.2 15.9 2.112/2011e 62,124 10,565 10,115 3.11 7.3 12.5 6.9 17.1 2.2
Notes: price at close of 02 Apr 2009. * = Based on HSBC EPS (fully diluted). Source: Company data, HSBC estimates
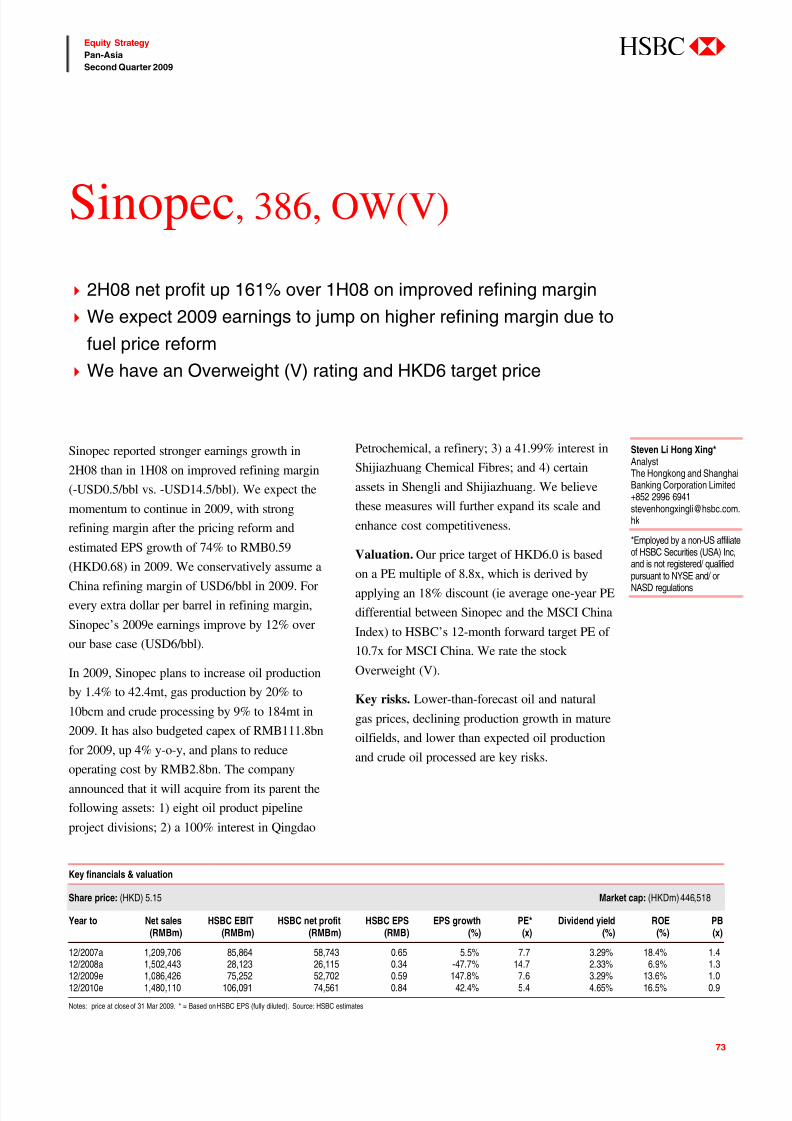
7/31/2019 Asia Insights the Long Climb Back Apr-1
http://slidepdf.com/reader/full/asia-insights-the-long-climb-back-apr-1 73/82
73
Equity Strategy
Pan-Asia
Second Quarter 2009
abc
Sinopec reported stronger earnings growth in
2H08 than in 1H08 on improved refining margin
(-USD0.5/bbl vs. -USD14.5/bbl). We expect the
momentum to continue in 2009, with strong
refining margin after the pricing reform and
estimated EPS growth of 74% to RMB0.59
(HKD0.68) in 2009. We conservatively assume aChina refining margin of USD6/bbl in 2009. For
every extra dollar per barrel in refining margin,
Sinopec’s 2009e earnings improve by 12% over
our base case (USD6/bbl).
In 2009, Sinopec plans to increase oil production
by 1.4% to 42.4mt, gas production by 20% to
10bcm and crude processing by 9% to 184mt in
2009. It has also budgeted capex of RMB111.8bn
for 2009, up 4% y-o-y, and plans to reduce
operating cost by RMB2.8bn. The company
announced that it will acquire from its parent the
following assets: 1) eight oil product pipeline
project divisions; 2) a 100% interest in Qingdao
Petrochemical, a refinery; 3) a 41.99% interest in
Shijiazhuang Chemical Fibres; and 4) certain
assets in Shengli and Shijiazhuang. We believe
these measures will further expand its scale and
enhance cost competitiveness.
Valuation. Our price target of HKD6.0 is based
on a PE multiple of 8.8x, which is derived byapplying an 18% discount (ie average one-year PE
differential between Sinopec and the MSCI China
Index) to HSBC’s 12-month forward target PE of
10.7x for MSCI China. We rate the stock
Overweight (V).
Key risks. Lower-than-forecast oil and natural
gas prices, declining production growth in mature
oilfields, and lower than expected oil production
and crude oil processed are key risks.
Sinopec, 386, OW(V)
2H08 net profit up 161% over 1H08 on improved refining margin
We expect 2009 earnings to jump on higher refining margin due to
fuel price reform
We have an Overweight (V) rating and HKD6 target price
Key financials & valuation
Share price: (HKD) 5.15 Market cap: (HKDm)446,518
Year to Net sales HSBC EBIT HSBC net profit HSBC EPS EPS growth PE* Dividend yield ROE PB(RMBm) (RMBm) (RMBm) (RMB) (%) (x) (%) (%) (x)
12/2007a 1,209,706 85,864 58,743 0.65 5.5% 7.7 3.29% 18.4% 1.412/2008a 1,502,443 28,123 26,115 0.34 -47.7% 14.7 2.33% 6.9% 1.312/2009e 1,086,426 75,252 52,702 0.59 147.8% 7.6 3.29% 13.6% 1.012/2010e 1,480,110 106,091 74,561 0.84 42.4% 5.4 4.65% 16.5% 0.9
Notes: price at close of 31 Mar 2009. * = Based on HSBC EPS (fully diluted). Source: HSBC estimates
Steven Li Hong Xing*AnalystThe Hongkong and ShanghaiBanking Corporation Limited+852 2996 [email protected]
*Employed by a non-US affiliateof HSBC Securities (USA) Inc,and is not registered/ qualified
pursuant to NYSE and/ orNASD regulations
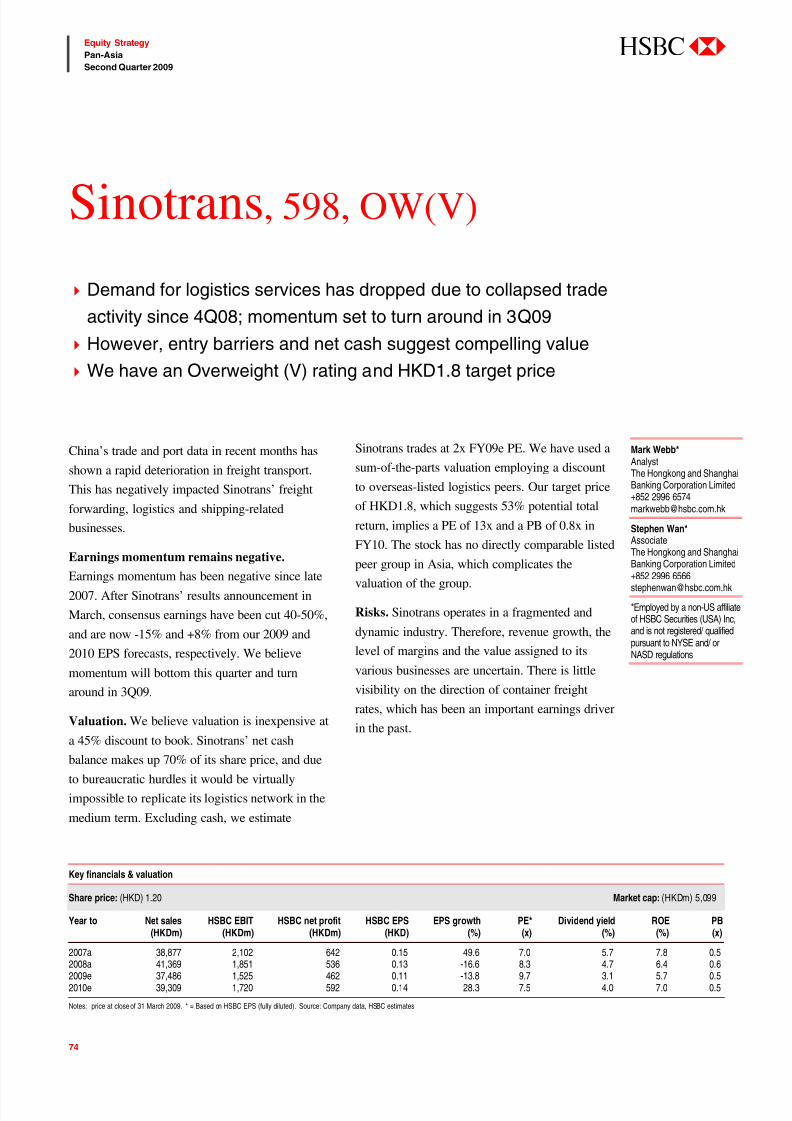
7/31/2019 Asia Insights the Long Climb Back Apr-1
http://slidepdf.com/reader/full/asia-insights-the-long-climb-back-apr-1 74/82
74
Equity Strategy
Pan-Asia
Second Quarter 2009
abc
China’s trade and port data in recent months has
shown a rapid deterioration in freight transport.
This has negatively impacted Sinotrans’ freight
forwarding, logistics and shipping-related
businesses.
Earnings momentum remains negative.
Earnings momentum has been negative since late
2007. After Sinotrans’ results announcement in
March, consensus earnings have been cut 40-50%,
and are now -15% and +8% from our 2009 and
2010 EPS forecasts, respectively. We believe
momentum will bottom this quarter and turn
around in 3Q09.
Valuation. We believe valuation is inexpensive at
a 45% discount to book. Sinotrans’ net cash
balance makes up 70% of its share price, and dueto bureaucratic hurdles it would be virtually
impossible to replicate its logistics network in the
medium term. Excluding cash, we estimate
Sinotrans trades at 2x FY09e PE. We have used a
sum-of-the-parts valuation employing a discount
to overseas-listed logistics peers. Our target price
of HKD1.8, which suggests 53% potential total
return, implies a PE of 13x and a PB of 0.8x in
FY10. The stock has no directly comparable listed
peer group in Asia, which complicates the
valuation of the group.
Risks. Sinotrans operates in a fragmented and
dynamic industry. Therefore, revenue growth, the
level of margins and the value assigned to its
various businesses are uncertain. There is little
visibility on the direction of container freight
rates, which has been an important earnings driver
in the past.
Sinotrans, 598, OW(V)
Demand for logistics services has dropped due to collapsed trade
activity since 4Q08; momentum set to turn around in 3Q09
However, entry barriers and net cash suggest compelling value
We have an Overweight (V) rating and HKD1.8 target price
Mark Webb*AnalystThe Hongkong and ShanghaiBanking Corporation Limited+852 2996 [email protected]
Stephen Wan*AssociateThe Hongkong and ShanghaiBanking Corporation Limited
+852 2996 [email protected]
*Employed by a non-US affiliateof HSBC Securities (USA) Inc,and is not registered/ qualifiedpursuant to NYSE and/ orNASD regulations
Key financials & valuation
Share price: (HKD) 1.20 Market cap: (HKDm) 5,099
Year to Net sales HSBC EBIT HSBC net profit HSBC EPS EPS growth PE* Dividend yield ROE PB(HKDm) (HKDm) (HKDm) (HKD) (%) (x) (%) (%) (x)
2007a 38,877 2,102 642 0.15 49.6 7.0 5.7 7.8 0.52008a 41,369 1,851 536 0.13 -16.6 8.3 4.7 6.4 0.62009e 37,486 1,525 462 0.11 -13.8 9.7 3.1 5.7 0.52010e 39,309 1,720 592 0.14 28.3 7.5 4.0 7.0 0.5
Notes: price at close of 31 March 2009. * = Based on HSBC EPS (fully diluted). Source: Company data, HSBC estimates
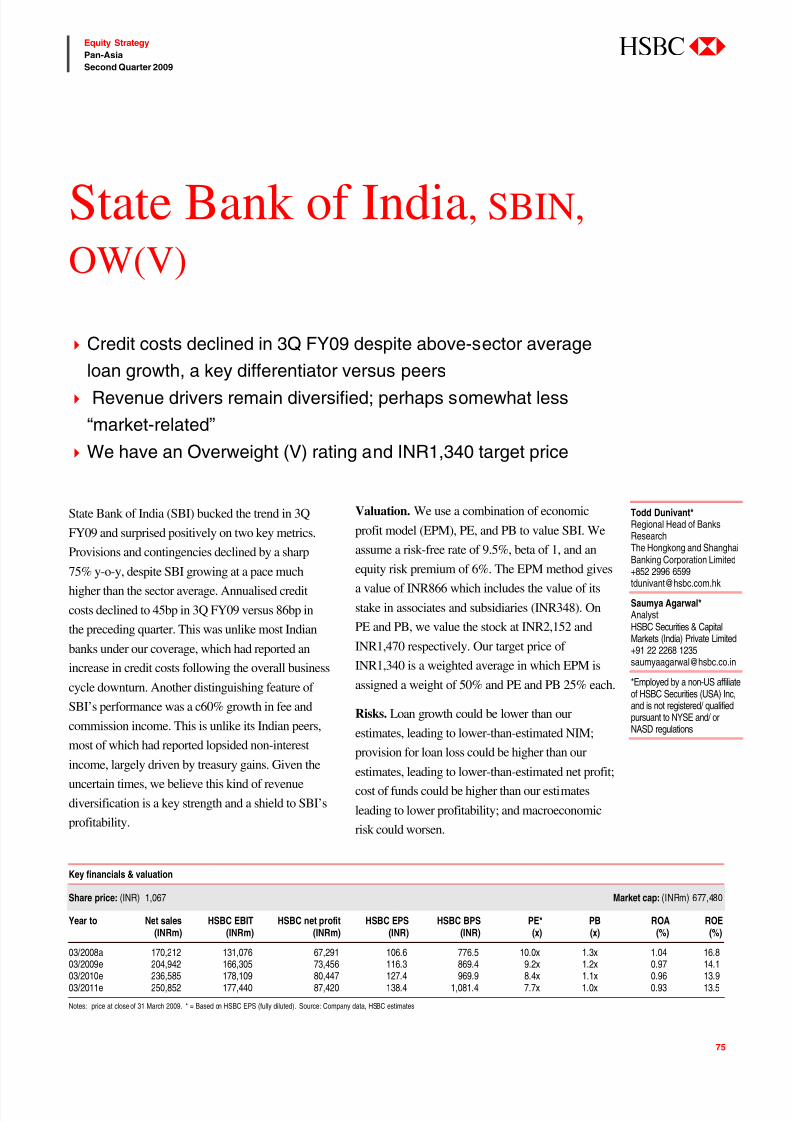
7/31/2019 Asia Insights the Long Climb Back Apr-1
http://slidepdf.com/reader/full/asia-insights-the-long-climb-back-apr-1 75/82
75
Equity Strategy
Pan-Asia
Second Quarter 2009
abc
State Bank of India (SBI) bucked the trend in 3Q
FY09 and surprised positively on two key metrics.
Provisions and contingencies declined by a sharp
75% y-o-y, despite SBI growing at a pace muchhigher than the sector average. Annualised credit
costs declined to 45bp in 3Q FY09 versus 86bp in
the preceding quarter. This was unlike most Indian
banks under our coverage, which had reported an
increase in credit costs following the overall business
cycle downturn. Another distinguishing feature of
SBI’s performance was a c60% growth in fee and
commission income. This is unlike its Indian peers,
most of which had reported lopsided non-interest
income, largely driven by treasury gains. Given theuncertain times, we believe this kind of revenue
diversification is a key strength and a shield to SBI’s
profitability.
Valuation. We use a combination of economic
profit model (EPM), PE, and PB to value SBI. We
assume a risk-free rate of 9.5%, beta of 1, and an
equity risk premium of 6%. The EPM method givesa value of INR866 which includes the value of its
stake in associates and subsidiaries (INR348). On
PE and PB, we value the stock at INR2,152 and
INR1,470 respectively. Our target price of
INR1,340 is a weighted average in which EPM is
assigned a weight of 50% and PE and PB 25% each.
Risks. Loan growth could be lower than our
estimates, leading to lower-than-estimated NIM;
provision for loan loss could be higher than our
estimates, leading to lower-than-estimated net profit;
cost of funds could be higher than our estimates
leading to lower profitability; and macroeconomic
risk could worsen.
State Bank of India, SBIN,
OW(V)
Credit costs declined in 3Q FY09 despite above-sector average
loan growth, a key differentiator versus peers
Revenue drivers remain diversified; perhaps somewhat less
“market-related”
We have an Overweight (V) rating and INR1,340 target price
Todd Dunivant*Regional Head of BanksResearchThe Hongkong and ShanghaiBanking Corporation Limited
+852 2996 [email protected]
Saumya Agarwal*AnalystHSBC Securities & CapitalMarkets (India) Private Limited +91 22 2268 [email protected]
*Employed by a non-US affiliateof HSBC Securities (USA) Inc,and is not registered/ qualifiedpursuant to NYSE and/ orNASD regulations
Key financials & valuation
Share price: (INR) 1,067 Market cap: (INRm) 677,480
Year to Net sales HSBC EBIT HSBC net profit HSBC EPS HSBC BPS PE* PB ROA ROE(INRm) (INRm) (INRm) (INR) (INR) (x) (x) (%) (%)
03/2008a 170,212 131,076 67,291 106.6 776.5 10.0x 1.3x 1.04 16.803/2009e 204,942 166,305 73,456 116.3 869.4 9.2x 1.2x 0.97 14.103/2010e 236,585 178,109 80,447 127.4 969.9 8.4x 1.1x 0.96 13.903/2011e 250,852 177,440 87,420 138.4 1,081.4 7.7x 1.0x 0.93 13.5
Notes: price at close of 31 March 2009. * = Based on HSBC EPS (fully diluted). Source: Company data, HSBC estimates
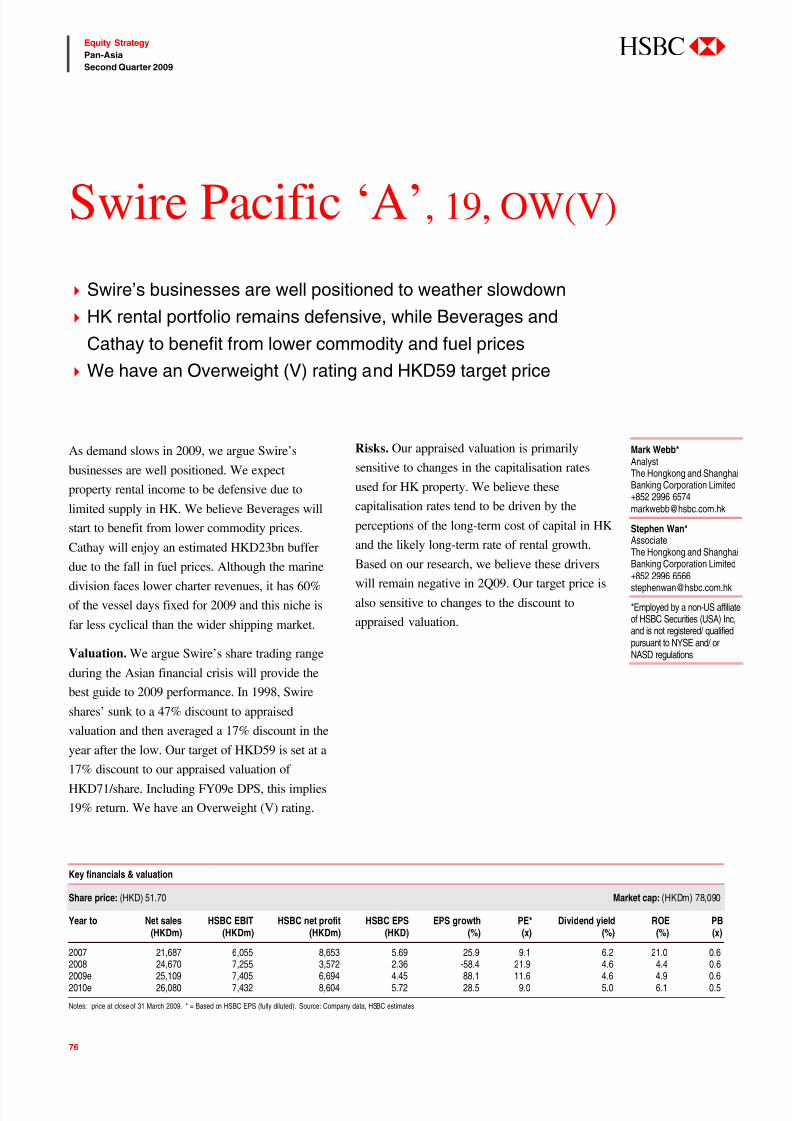
7/31/2019 Asia Insights the Long Climb Back Apr-1
http://slidepdf.com/reader/full/asia-insights-the-long-climb-back-apr-1 76/82
76
Equity Strategy
Pan-Asia
Second Quarter 2009
abc
As demand slows in 2009, we argue Swire’s
businesses are well positioned. We expect
property rental income to be defensive due to
limited supply in HK. We believe Beverages will
start to benefit from lower commodity prices.
Cathay will enjoy an estimated HKD23bn buffer
due to the fall in fuel prices. Although the marinedivision faces lower charter revenues, it has 60%
of the vessel days fixed for 2009 and this niche is
far less cyclical than the wider shipping market.
Valuation. We argue Swire’s share trading range
during the Asian financial crisis will provide the
best guide to 2009 performance. In 1998, Swire
shares’ sunk to a 47% discount to appraised
valuation and then averaged a 17% discount in the
year after the low. Our target of HKD59 is set at a
17% discount to our appraised valuation of
HKD71/share. Including FY09e DPS, this implies
19% return. We have an Overweight (V) rating.
Risks. Our appraised valuation is primarily
sensitive to changes in the capitalisation rates
used for HK property. We believe these
capitalisation rates tend to be driven by the
perceptions of the long-term cost of capital in HK
and the likely long-term rate of rental growth.
Based on our research, we believe these drivers
will remain negative in 2Q09. Our target price is
also sensitive to changes to the discount to
appraised valuation.
Swire Pacific ‘A’, 19, OW(V)
Swire’s businesses are well positioned to weather slowdown
HK rental portfolio remains defensive, while Beverages and
Cathay to benefit from lower commodity and fuel prices
We have an Overweight (V) rating and HKD59 target price
Mark Webb*AnalystThe Hongkong and ShanghaiBanking Corporation Limited+852 2996 [email protected]
Stephen Wan*AssociateThe Hongkong and ShanghaiBanking Corporation Limited
+852 2996 [email protected]
*Employed by a non-US affiliateof HSBC Securities (USA) Inc,and is not registered/ qualifiedpursuant to NYSE and/ orNASD regulations
Key financials & valuation
Share price: (HKD) 51.70 Market cap: (HKDm) 78,090
Year to Net sales HSBC EBIT HSBC net profit HSBC EPS EPS growth PE* Dividend yield ROE PB(HKDm) (HKDm) (HKDm) (HKD) (%) (x) (%) (%) (x)
2007 21,687 6,055 8,653 5.69 25.9 9.1 6.2 21.0 0.62008 24,670 7,255 3,572 2.36 -58.4 21.9 4.6 4.4 0.62009e 25,109 7,405 6,694 4.45 88.1 11.6 4.6 4.9 0.62010e 26,080 7,432 8,604 5.72 28.5 9.0 5.0 6.1 0.5
Notes: price at close of 31 March 2009. * = Based on HSBC EPS (fully diluted). Source: Company data, HSBC estimates
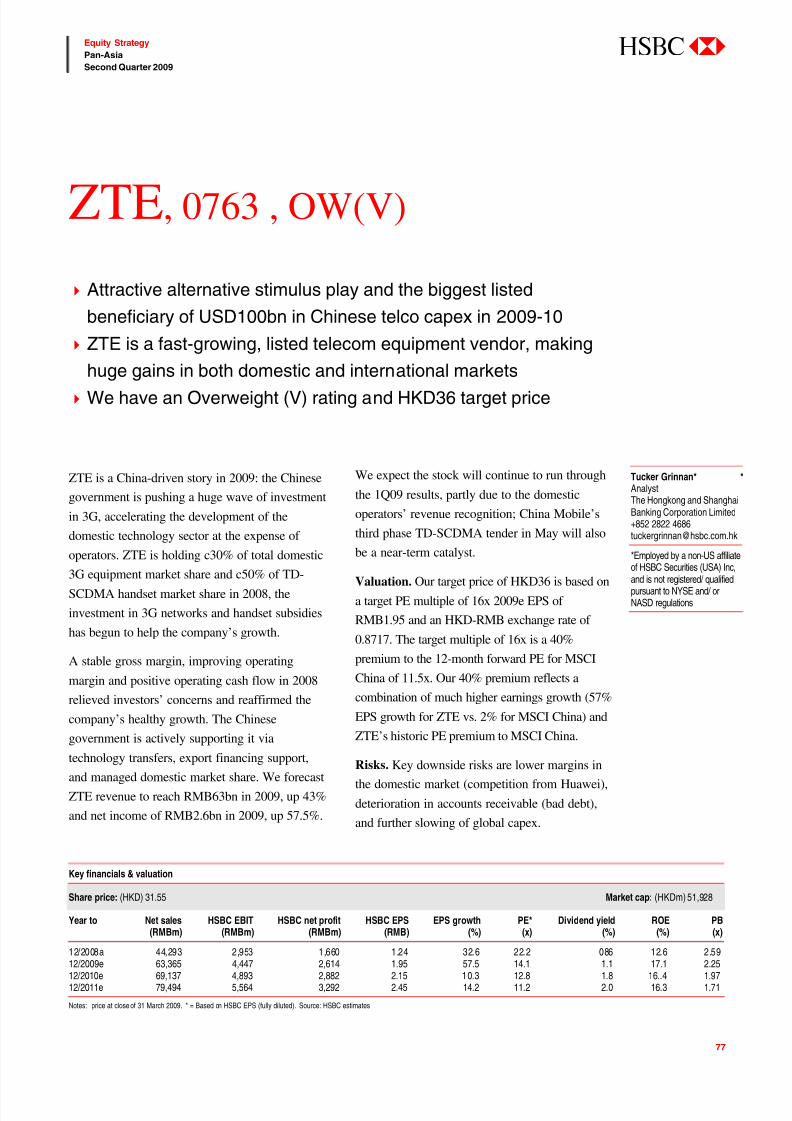
7/31/2019 Asia Insights the Long Climb Back Apr-1
http://slidepdf.com/reader/full/asia-insights-the-long-climb-back-apr-1 77/82
77
Equity Strategy
Pan-Asia
Second Quarter 2009
abc
ZTE is a China-driven story in 2009: the Chinese
government is pushing a huge wave of investment
in 3G, accelerating the development of the
domestic technology sector at the expense of
operators. ZTE is holding c30% of total domestic
3G equipment market share and c50% of TD-
SCDMA handset market share in 2008, the
investment in 3G networks and handset subsidies
has begun to help the company’s growth.
A stable gross margin, improving operating
margin and positive operating cash flow in 2008
relieved investors’ concerns and reaffirmed the
company’s healthy growth. The Chinese
government is actively supporting it via
technology transfers, export financing support,and managed domestic market share. We forecast
ZTE revenue to reach RMB63bn in 2009, up 43%
and net income of RMB2.6bn in 2009, up 57.5%.
We expect the stock will continue to run through
the 1Q09 results, partly due to the domestic
operators’ revenue recognition; China Mobile’s
third phase TD-SCDMA tender in May will also
be a near-term catalyst.
Valuation. Our target price of HKD36 is based on
a target PE multiple of 16x 2009e EPS of
RMB1.95 and an HKD-RMB exchange rate of
0.8717. The target multiple of 16x is a 40%
premium to the 12-month forward PE for MSCI
China of 11.5x. Our 40% premium reflects a
combination of much higher earnings growth (57%
EPS growth for ZTE vs. 2% for MSCI China) and
ZTE’s historic PE premium to MSCI China.
Risks. Key downside risks are lower margins inthe domestic market (competition from Huawei),
deterioration in accounts receivable (bad debt),
and further slowing of global capex.
ZTE, 0763 , OW(V)
Attractive alternative stimulus play and the biggest listed
beneficiary of USD100bn in Chinese telco capex in 2009-10
ZTE is a fast-growing, listed telecom equipment vendor, making
huge gains in both domestic and international markets
We have an Overweight (V) rating and HKD36 target price
Key financials & valuation
Share price: (HKD) 31.55 Market cap: (HKDm) 51,928
Year to Net sales HSBC EBIT HSBC net profit HSBC EPS EPS growth PE* Dividend yield ROE PB(RMBm) (RMBm) (RMBm) (RMB) (%) (x) (%) (%) (x)
12/2008a 44,293 2,953 1,660 1.24 32.6 22.2 086 12.6 2.5912/2009e 63,365 4,447 2,614 1.95 57.5 14.1 1.1 17.1 2.2512/2010e 69,137 4,893 2,882 2.15 10.3 12.8 1.8 16..4 1.9712/2011e 79,494 5,564 3,292 2.45 14.2 11.2 2.0 16.3 1.71
Notes: price at close of 31 March 2009. * = Based on HSBC EPS (fully diluted). Source: HSBC estimates
Tucker Grinnan* *AnalystThe Hongkong and ShanghaiBanking Corporation Limited+852 2822 [email protected]
*Employed by a non-US affiliateof HSBC Securities (USA) Inc,and is not registered/ qualifiedpursuant to NYSE and/ orNASD regulations
7/31/2019 Asia Insights the Long Climb Back Apr-1
http://slidepdf.com/reader/full/asia-insights-the-long-climb-back-apr-1 78/82
78
Equity Strategy
Pan-Asia
Second Quarter 2009
abc
Disclosure appendix
Analyst certification
The following analyst(s), who is(are) primarily responsible for this report, certifies(y) that the opinion(s) on the subject
security(ies) or issuer(s) and any other views or forecasts expressed herein accurately reflect their personal view(s) and that no
part of their compensation was, is or will be directly or indirectly related to the specific recommendation(s) or views contained
in this research report: Garry Evans
Important disclosuresStock ratings and basis for financial analysis
HSBC believes that investors utilise various disciplines and investment horizons when making investment decisions, which
depend largely on individual circumstances such as the investor's existing holdings, risk tolerance and other considerations.
Given these differences, HSBC has two principal aims in its equity research: 1) to identify long-term investment opportunities
based on particular themes or ideas that may affect the future earnings or cash flows of companies on a 12 month time horizon;
and 2) from time to time to identify short-term investment opportunities that are derived from fundamental, quantitative,
technical or event-driven techniques on a 0-3 month time horizon and which may differ from our long-term investment rating.
HSBC has assigned ratings for its long-term investment opportunities as described below.
This report addresses only the long-term investment opportunities of the companies referred to in the report. As and when
HSBC publishes a short-term trading idea the stocks to which these relate are identified on the website at
www.hsbcnet.com/research. Details of these short-term investment opportunities can be found under the Reports section of thiswebsite.
HSBC believes an investor's decision to buy or sell a stock should depend on individual circumstances such as the investor's
existing holdings and other considerations. Different securities firms use a variety of ratings terms as well as different rating
systems to describe their recommendations. Investors should carefully read the definitions of the ratings used in each research
report. In addition, because research reports contain more complete information concerning the analysts' views, investors
should carefully read the entire research report and should not infer its contents from the rating. In any case, ratings should not
be used or relied on in isolation as investment advice.
Rating definitions for long-term investment opportunities
Stock ratings
HSBC assigns ratings to its stocks in this sector on the following basis:
For each stock we set a required rate of return calculated from the risk free rate for that stock's domestic, or as appropriate,
regional market and the relevant equity risk premium established by our strategy team. The price target for a stock represents
the value the analyst expects the stock to reach over our performance horizon. The performance horizon is 12 months. For a
stock to be classified as Overweight, the implied return must exceed the required return by at least 5 percentage points over the
next 12 months (or 10 percentage points for a stock classified as Volatile*). For a stock to be classified as Underweight, the
stock must be expected to underperform its required return by at least 5 percentage points over the next 12 months (or 10
percentage points for a stock classified as Volatile*). Stocks between these bands are classified as Neutral.
Our ratings are re-calibrated against these bands at the time of any 'material change' (initiation of coverage, change of volatility
status or change in price target). Notwithstanding this, and although ratings are subject to ongoing management review,
expected returns will be permitted to move outside the bands as a result of normal share price fluctuations without necessarily
triggering a rating change.
*A stock will be classified as volatile if its historical volatility has exceeded 40%, if the stock has been listed for less than 12
months (unless it is in an industry or sector where volatility is low) or if the analyst expects significant volatility. However,
7/31/2019 Asia Insights the Long Climb Back Apr-1
http://slidepdf.com/reader/full/asia-insights-the-long-climb-back-apr-1 79/82
79
Equity Strategy
Pan-Asia
Second Quarter 2009
abc
stocks which we do not consider volatile may in fact also behave in such a way. Historical volatility is defined as the pastmonth's average of the daily 365-day moving average volatilities. In order to avoid misleadingly frequent changes in rating,
however, volatility has to move 2.5 percentage points past the 40% benchmark in either direction for a stock's status to change.
Prior to this, from 7 June 2005 HSBC applied a ratings structure which ranked the stocks according to their notional target
price vs current market price and then categorised (approximately) the top 40% as Overweight, the next 40% as Neutral and
the last 20% as Underweight. The performance horizon is 2 years. The notional target price was defined as the mid-point of the
analysts' valuation for a stock.
From 15 November 2004 to 7 June 2005, HSBC carried no ratings and concentrated on long-term thematic reports which
identified themes and trends in industries, but did not make a conclusion as to the investment action that potential investors
should take.
Prior to 15 November 2004, HSBC's ratings system was based upon a two-stage recommendation structure: a combination of the analysts' view on the stock relative to its sector and the sector call relative to the market, together giving a view on the
stock relative to the market. The sector call was the responsibility of the strategy team, set in co-operation with the analysts.
For other companies, HSBC showed a recommendation relative to the market. The performance horizon was 6-12 months. The
target price was the level the stock should have traded at if the market accepted the analysts' view of the stock.
Rating distribution for long-term investment opportunities
As of 03 April 2009, the distribution of all ratings published is as follows:
Overweight (Buy) 39% (30% of these provided with Investment Banking Services)
Neutral (Hold) 37% (30% of these provided with Investment Banking Services)
Underweight (Sell) 24% (28% of these provided with Investment Banking Services)
Information regarding company share price performance and history of HSBC ratings and price targets in respect of its long-
term investment opportunities for the companies the subject of this report,is available from www.hsbcnet.com/research.
HSBC & Analyst disclosures
Disclosure checklist
Company Ticker Recent price Price Date Disclosure
AU OPTRONICS 2409.TW 29.45 02-Apr-2009 5, 6, 7BANK OF CHINA LTD 3988.HK 2.67 02-Apr-2009 2, 4, 5, 6, 7, 11CANARA BANK CNBK.BO 165.15 02-Apr-2009 2, 4, 5, 6, 7CHINA AGRI-INDUSTRIES HOL 0606.HK 3.88 02-Apr-2009 4CHINA BLUE CHEMICALS 3983.HK 4.29 02-Apr-2009 4CHINA COMMUNICATIONS CONS 1800.HK 9.15 02-Apr-2009 4, 6, 7, 11CHINATRUST FHC 2891.TW 13.90 02-Apr-2009 2, 5CIIH 0966.HK 13.40 02-Apr-2009 2, 5, 11FUBON FHC 2881.TW 22.55 02-Apr-2009 2, 5INDUSTRIAL COM BANK OF CHINA 1398.HK 4.11 02-Apr-2009 4, 11INFOSYS TECHNOLOGIES INFY.NS 1419.40 02-Apr-2009 6KINGBOARD CHEMICAL 0148.HK 19.00 02-Apr-2009 1, 4, 5, 6, 7MAANSHAN IRON & STEEL 0323.HK 2.95 02-Apr-2009 4, 6, 7, 11PACIFIC BASIN SHIPPING 2343.HK 4.00 02-Apr-2009 2, 5, 6, 7, 11PUNJAB NATIONAL BANK PNBK.BO 428.85 02-Apr-2009 2, 5, 6, 7RELIANCE INDUSTRIES RELI.BO 1661.35 02-Apr-2009 2, 5, 6, 9, 11SINOPEC 0386.HK 5.47 02-Apr-2009 2, 4, 5, 6, 7SINOTRANS 0598.HK 1.31 02-Apr-2009 6, 7, 11STATE BANK OF INDIA SBI.NS 1147.05 02-Apr-2009 2, 5, 6, 7SUN HUNG KAI PROPERTIES 0016.HK 77.65 02-Apr-2009 2, 5, 6SWIRE PACIFIC 0019.HK 55.70 02-Apr-2009 2, 4, 5, 6, 7, 11ZTE CORPORATION 0763.HK 33.80 02-Apr-2009 4
Source: HSBC
7/31/2019 Asia Insights the Long Climb Back Apr-1
http://slidepdf.com/reader/full/asia-insights-the-long-climb-back-apr-1 80/82
80
Equity Strategy
Pan-Asia
Second Quarter 2009
abc
1 HSBC* has managed or co-managed a public offering of securities for this company within the past 12 months.2 HSBC expects to receive or intends to seek compensation for investment banking services from this company in the next
3 months.3 At the time of publication of this report, HSBC Securities (USA) Inc. is a Market Maker in securities issued by this
company.4 As of 28 February 2009 HSBC beneficially owned 1% or more of a class of common equity securities of this company.5 As of 28 February 2009, this company was a client of HSBC or had during the preceding 12 month period been a client
of and/or paid compensation to HSBC in respect of investment banking services.6 As of 28 February 2009, this company was a client of HSBC or had during the preceding 12 month period been a client
of and/or paid compensation to HSBC in respect of non-investment banking-securities related services.
7 As of 28 February 2009, this company was a client of HSBC or had during the preceding 12 month period been a clientof and/or paid compensation to HSBC in respect of non-securities services.
8 A covering analyst/s has received compensation from this company in the past 12 months.
9 A covering analyst/s or a member of his/her household has a financial interest in the securities of this company, asdetailed below.
10 A covering analyst/s or a member of his/her household is an officer, director or supervisory board member of this
company, as detailed below.11 At the time of publication of this report, HSBC is a non-US Market Maker in securities issued by this company and/or in
securities in respect of this company
Analysts are paid in part by reference to the profitability of HSBC which includes investment banking revenues.
For disclosures in respect of any company, please see the most recently published report on that company available at
www.hsbcnet.com/research.
* HSBC Legal Entities are listed in the Disclaimer below.
Additional disclosures
1 This report is dated as at 06 April 2009.2 All market data included in this report are dated as at close 31 March 2009, unless otherwise indicated in the report.3 HSBC has procedures in place to identify and manage any potential conflicts of interest that arise in connection with its
Research business. HSBC's analysts and its other staff who are involved in the preparation and dissemination of Researchoperate and have a management reporting line independent of HSBC's Investment Banking business. Chinese Wall
procedures are in place between the Investment Banking and Research businesses to ensure that any confidential and/orprice sensitive information is handled in an appropriate manner.
7/31/2019 Asia Insights the Long Climb Back Apr-1
http://slidepdf.com/reader/full/asia-insights-the-long-climb-back-apr-1 81/82
81
Equity Strategy
Pan-Asia
Second Quarter 2009
abc
Disclaimer
* Legal entities as at 22 October 2008
'UAE' HSBC Bank Middle East Limited, Dubai; 'HK' The Hongkong and Shanghai Banking
Corporation Limited, Hong Kong; 'TW' HSBC Securities (Taiwan) Corporation Limited; 'CA'
HSBC Securities (Canada) Inc, Toronto; HSBC Bank, Paris branch; HSBC France; 'DE' HSBC
Trinkaus & Burkhardt AG, Dusseldorf; 000 HSBC Bank (RR), Moscow; 'IN' HSBC Securities
and Capital Markets (India) Private Limited, Mumbai; 'JP' HSBC Securities (Japan) Limited,
Tokyo; 'EG' HSBC Securities Egypt S.A.E., Cairo; 'CN' HSBC Investment Bank Asia Limited,
Beijing Representative Office; The Hongkong and Shanghai Banking Corporation Limited,
Singapore branch; The Hongkong and Shanghai Banking Corporation Limited, Seoul Securities
Branch; HSBC Securities (South Africa) (Pty) Ltd, Johannesburg; 'GR' HSBC Pantelakis
Securities S.A., Athens; HSBC Bank plc, London, Madrid, Milan, Stockholm, Tel Aviv, 'US'
HSBC Securities (USA) Inc, New York; HSBC Yatirim Menkul Degerler A.S., Istanbul; HSBC
México, S.A., Institución de Banca Múltiple, Grupo Financiero HSBC, HSBC Bank Brasil S.A. -
Banco Múltiplo, HSBC Bank Australia Limited, HSBC Bank Argentina S.A., HSBC Saudi Arabia
Limited.
Issuer of report
The Hongkong and Shanghai
Banking Corporation Limited
Level 19, 1 Queen’s Road Central
Hong Kong SAR
Telephone: +852 2843 9111
Telex: 75100 CAPEL HXFax: +852 2596 0200
Website: www.research.hsbc.com
This document has been issued by The Hongkong and Shanghai Banking Corporation Limited (“HSBC”) in the conduct of its Hong Kongregulated business for the information of its institutional and professional customers; it is not intended for and should not be distributed toretail customers in Hong Kong. The Hongkong and Shanghai Banking Corporation Limited is regulated by the Securities and FuturesCommission. All enquires by recipients in Hong Kong must be directed to your HSBC contact in Hong Kong. If it is received by a customerof an affiliate of HSBC, its provision to the recipient is subject to the terms of business in place between the recipient and such affiliate. This
document is not and should not be construed as an offer to sell or the solicitation of an offer to purchase or subscribe for any investment.
HSBC has based this document on information obtained from sources it believes to be reliable but which it has not independently verified;
HSBC makes no guarantee, representation or warranty and accepts no responsibility or liability as to its accuracy or completeness.Expressions of opinion are those of the Research Division of HSBC only and are subject to change without notice. HSBC and its affiliatesand/or their officers, directors and employees may have positions in any securities mentioned in this document (or in any related investment)
and may from time to time add to or dispose of any such securities (or investment). HSBC and its affiliates may act as market maker or haveassumed an underwriting commitment in the securities of companies discussed in this document (or in related investments), may sell them toor buy them from customers on a principal basis and may also perform or seek to perform investment banking or underwriting services for or
relating to those companies.HSBC Securities (USA) Inc. accepts responsibility for the content of this research report prepared by its non-US foreign affiliate. All U.S.
persons receiving and/or accessing this report and wishing to effect transactions in any security discussed herein should do so with HSBCSecurities (USA) Inc. in the United States and not with its non-US foreign affiliate, the issuer of this report.In the UK this report may only be distributed to persons of a kind described in Article 19(5) of the Financial Services and Markets Act 2000(Financial Promotion) Order 2001. The protections afforded by the UK regulatory regime are available only to those dealing with arepresentative of HSBC Bank plc in the UK. In Singapore, this publication is distributed by The Hongkong and Shanghai Banking
Corporation Limited, Singapore Branch for the general information of institutional investors or other persons specified in Sections 274 and
304 of the Securities and Futures Act (Chapter 289) (“SFA”) and accredited investors and other persons in accordance with the conditionsspecified in Sections 275 and 305 of the SFA. This publication is not a prospectus as defined in the SFA. It may not be further distributed inwhole or in part for any purpose. The Hongkong and Shanghai Banking Corporation Limited Singapore Branch is regulated by the MonetaryAuthority of Singapore. In Australia, this publication has been distributed by The Hongkong and Shanghai Banking Corporation Limited
(ABN 65 117 925 970, AFSL 301737) for the general information of its “wholesale” customers (as defined in the Corporations Act 2001).Where distributed to retail customers, this research is distributed by HSBC Bank Australia Limited (AFSL No. 232595). These respectiveentities make no representations that the products or services mentioned in this document are available to persons in Australia or arenecessarily suitable for any particular person or appropriate in accordance with local law. No consideration has been given to the particular
investment objectives, financial situation or particular needs of any recipient.
In Japan, this publication has been distributed by HSBC Securities (Japan) Limited. It may not be further distributed in whole or in part forany purpose.© Copyright. The Hongkong and Shanghai Banking Corporation Limited 2009, ALL RIGHTS RESERVED. No part of this publication maybe reproduced, stored in a retrieval system, or transmitted, on any form or by any means, electronic, mechanical, photocopying, recording, orotherwise, without the prior written permission of The Hongkong and Shanghai Banking Corporation Limited. MICA (P) 258/09/2008
239862
7/31/2019 Asia Insights the Long Climb Back Apr-1
http://slidepdf.com/reader/full/asia-insights-the-long-climb-back-apr-1 82/82