asia pacific organic food and beverages industry outlook to 2016- sample report
DESCRIPTION
TRANSCRIPT
1
© This is a licensed product of Ken Research and should not be copied
2
© This is a licensed product of Ken Research and should not be copied
TABLE OF CONTENTS
1. Global Organic Food and Beverages Industry Introduction
2. Global Organic Food and Beverages Market Size by Revenue, 2006-2011
3. Global Organic Food and Beverages Market Segmentation
3.1. By Geography, 2006-2011
4. Asia-Pacific Organic Food and Beverages Industry
4.1. Asia-Pacific Organic Food and Beverages Market Size, 2006-2011
4.2. Asia-Pacific Organic Food and Beverages Market Segmentation
4.2.1. By Geography, 2006-2011
4.3. Japan Organic Food and Beverages Market Introduction
4.3.1. Japan Organic Food and Beverages Market Size, 2006-2011
4.3.2. Japan Organic Food and Beverages Market Segmentation, 2011
4.3.2.1. By Products, 2011
4.3.3. Japan Organic Agricultural Land Development, 2006-2011
4.3.4. Government Regulations in Japan Organic Food and Beverages Indsutry
4.3.5. Market Share of Distribution Channels in Japan Organic Food and Beverages Industry, 2011
4.3.6. Macro Economic Factors of Japan Organic Food and Beverages Industry
4.3.6.1. Urban Population, 2006-2016
4.3.6.2. Consumer Expenditure on Food and Beverages, 2006-2016
4.3.7. Japan Organic Food and Beverages Market Future Outlook and Projections, 2012-2016
4.4. Australia Organic Food and Beverages Industry Introduction
4.4.1. Australia Organic Food and Beverages Market Size, 2006-2011
4.4.2. Australia Organic Food and Beverages Market Segmentation, 2011
4.4.3. Australia Organic Agricultural Land Development, 2006-2011
4.4.4. Government Regulations in Australia Organic Food and Beverages Industry
3
© This is a licensed product of Ken Research and should not be copied
4.4.5. Competitive Landscape of Australia Organic Food and Beverages Industry, 2011
4.4.6. Macro Economic Factors of Australia Organic Food and Beverages Industry
4.4.6.1. Urban Population, 2006-2016
4.4.6.2. Consumer Food Price Index, 2006-2016
4.4.6.3. Consumer Expenditure on Food and Beverages, 2006-2016
4.4.7. Australia Organic Food and Beverages Market Future Outlook and Projections, 2012-2016
4.5. China Organic Food and Beverages Market Introduction
4.5.1. China Organic Food and Beverages Market Size, 2006-2011
4.5.2. China Organic Food and Beverages Market Segmentation, 2011
4.5.2.1. By Products, 2011
4.5.3. China Organic Agricultural Land Development, 2006-2011
4.5.4. Government Regulations in China Organic Food and Beverages Industry
4.5.5. Market Share of Distribution Channels in China Organic food and Beverages Industry, 2011
4.5.6. Competitive Landscape of China Organic Food and Beverages Industry, 2011
4.5.7. Macro Economic Factors of China Organic Food and Beverages Industry
4.5.7.1. Urban Population, 2006-2016
4.5.7.2. Consumer Food Price Index, 2006-2016
4.5.8. China Organic Food and Beverages Market Future Outlook and Projections, 2012-2016
4.6. India Organic Food and Beverages Market Introduction
4.6.1. India Organic Food and Beverages Market Size, 2006-2011
4.6.2. India Organic Food and Beverages Market Segmentation, 2011
4.6.2.1. By Products, 2011
4.6.3. India Organic Agricultural Land Development, 2006-2011
4.6.4. India Organic Food and Beverages Trends and Developments
4.6.5. Competitive Landscape of India Organic Food and Beverages Industry, 2011
4
© This is a licensed product of Ken Research and should not be copied
4.6.6. Macro Economic Factors of India Organic Food and Beverages industry
4.6.6.1. Personal Disposable Income, FY’2006-FY’2016
4.6.6.2. Urban Population, 2006-2016
4.6.7. India Organic Food and Beverages Market Future Outlook and Projections, 2012-2016
5. Global Organic Food and Beverages Industry Future Outlook and Projections, 2012-2016
5.1. By Geography, 2012-2016
6. Asia-Pacific Organic Food and Beverages Industry Future Outlook and Projections, 2012-2016
6.1. Cause and Effect Relationship Between Industry Factors and Asia Pacific Organic Food and Beverages Industry Prospects
7. Appendix
7.1. Market Definition
7.2. Abbreviations
7.3. Research Methodology
Data Collection Methods
Approach
Variables (Dependent and Independent)
Multi Factor Based Sensitivity Model
Final Conclusion
7.4. Disclaimer
5
© This is a licensed product of Ken Research and should not be copied
LIST OF FIGURES
Figure 1: Global Organic Food and Beverages Market Size by Revenue in USD Million, 2006-2011
Figure 2: Global Organic Food and Beverages Market Segmentation by North America, Europe and Asia-Pacific and Rest of World on the Basis of Contribution in Percentage (%), 2006-2011
Figure 3: Asia –Pacific Organic Food and Beverages Market by Revenue in USD Million, 2006-2011
Figure 4: Asia-Pacific Organic Food and Beverages Market by Japan, Australia, China and India on the Basis of Contribution in Percentage (%), 2006-2011
Figure 5: Japan Organic Food and Beverages Market by Revenue in USD Million, 2006-2011
Figure 6: Japan Organic Food and Beverages Market Segmentation by Products on the Basis of Contribution in Percentage (%), 2011
Figure 7: Japan Organic Agricultural Land Development in Hectares, 2006-2011
Figure 8: Japan Organic Food and Beverages Market Share by Distribution Channels on in Percentage (%), 2011
Figure 9: Japan Urban Population in Million, 2006-2016
Figure 10: Japan Consumer Expenditure on Food and Beverages in USD Million, 2006-2016
Figure 11: Japan Organic Food and Beverages Market Projections by Revenue in USD Million, 2012-2016
Figure 12: Australia Organic Food and Beverages Market Size by Retail Sales in USD Million, 2006-2011
Figure 13: Australia Organic Farming Market on the Basis of Contribution in Percentage (%), 2011
Figure 14: Australia Organic Agricultural Land in Hectares, 2006-2011
Figure 15: Australia Organic Food and Beverages Market Share by Leading Companies in Percentage (%), 2011
Figure 16: Major Players in Australia Organic Food and Beverages Industry, 2011
Figure 17: Australia Urban Population in Million, 2006-2016
Figure 18: Australia Consumer Food Price Index, 2006-2016
6
© This is a licensed product of Ken Research and should not be copied
Figure 19: Australia Consumer Expenditure on Food and Beverages in USD Million, 2006-2016
Figure 20: Australia Organic Food and Beverages Market Projections by Retail Sales in USD Million, 2012-2016
Figure 21: China Organic Food and Beverages Market Size by Revenue in USD Million, 2006-2011
Figure 22: China Organic Food and Beverages Market Segmentation by Products on the Basis of Contribution in Percentage (%), 2011
Figure 23: China Organic Agricultural Land Development in Hectares, 2006-2011
Figure 24: China Organic Food and Beverages Market Share by Distribution Channels in Percentage (%), 2011
Figure 25: China Urban Population in Million, 2006-2016
Figure 26: China Consumer Food Price Index, 2006-2016
Figure 27: China Organic Food and Beverages Market Projections by Revenue in USD Million, 2012-2016
Figure 28: India Organic Food and Beverages Market Size by Revenue in USD Million, 2006-2011
Figure 29: India Organic Food and Beverages Market Segmentation on the Basis of Contribution in Percentage (%), 2011
Figure 30: India Organic Agricultural Land in Hectares, 2006-2011
Figure 31: India Personal Disposable Income in USD Million, FY’2006-FY’2016
Figure 32: India Urban Population in Million, 2006-2016
Figure 33: India Organic Food and Beverages Market Projections by Revenue in USD Million, 2012-2016
Figure 34: Global Organic Food and Beverages Market Projections by Revenue in USD Million, 2012-2016
Figure 35: Global Organic Food and Beverages Market Projections by North America, Europe and Asia-Pacific and ROW on the Basis of Contribution in Percentage (%), 2012-2016
Figure 36: Asia-Pacific Organic Food and Beverages Market Future Projections by Revenue in USD Million, 2012-2016
7
© This is a licensed product of Ken Research and should not be copied
LIST OF TABLES
Table 1: Global Organic Certification Labels by Geography
Table 2: Global Organic Food and Beverages Market Segmentation by North America, Europe and Asia-Pacific and Rest of World on the Basis of Revenue in USD Million, 2006-2011
Table 3: Asia-Pacific Organic Food and Beverages Industry by Japan, Australia, China and India on the Basis of Sales in USD Million, 2006-2011
Table 4: Japan Organic Food and Beverages Market Segmentation on the Basis of Revenue in USD Million, 2011
Table 5: China Organic Food and Beverages Market Segmentation by products on the Basis of Revenue in USD Million, 2011
Table 6: Major Players in China Organic Food and Beverages Industry, 2011
Table 7: India Organic Food and Beverages Market Segmentation by Products on the Basis of Revenue in USD Million, 2011
Table 8: India Organic Agriculture Particulars, FY’2011
Table 9: India Organic Product Export Volume and Share in Percentage (%), FY’2011
Table 10: Major Players in India Organic Food and Beverages Industry, 2011
Table 11: Global Organic Food and Beverages Market Projections by North America, Europe and Asia-Pacific and ROW on the Basis of Revenue in USD Million, 2012-2016
Table 12: Cause and Effect Relationship Analysis between Industry Factors and Expected Industry Prospects of the Asia-Pacific Organic Food and Beverages Industry
Table 13: Correlation Matrix of the Australia Organic Food and Beverages Market
Table 14: Regression Coefficients Output
8
© This is a licensed product of Ken Research and should not be copied
GLOBAL ORGANIC FOOD AND BEVERAGES MARKET SIZE BY REVENUE, 2006-2011
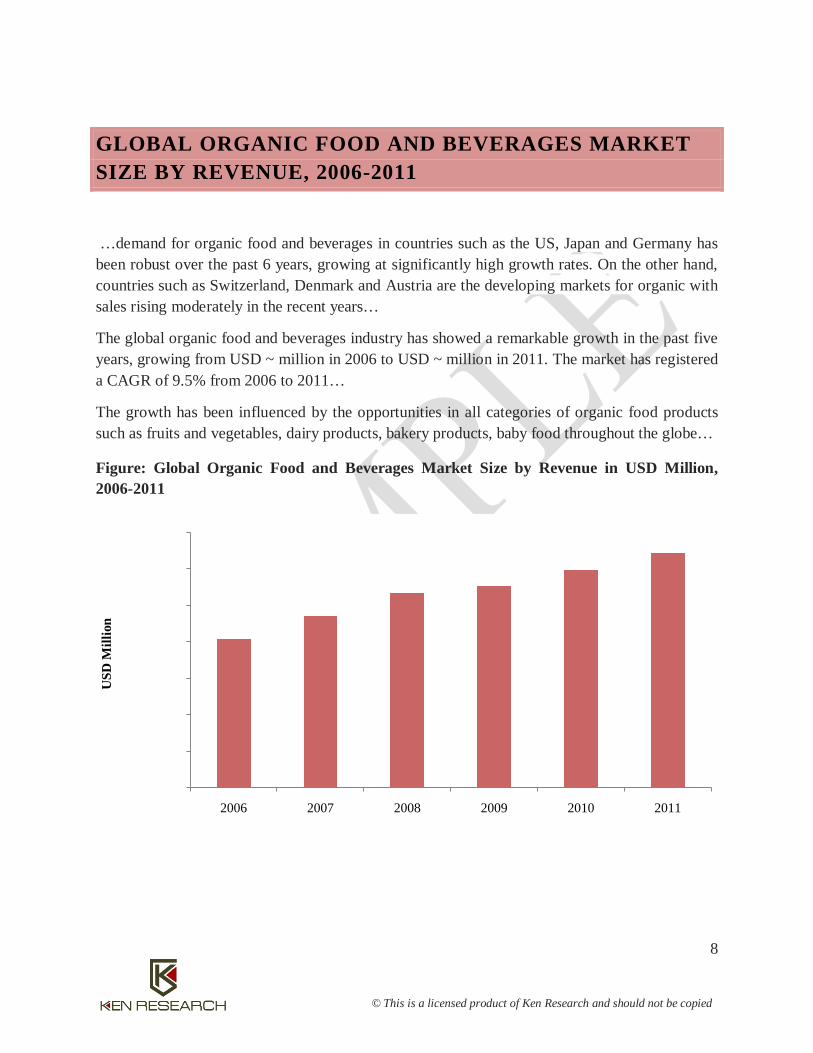
…demand for organic food and beverages in countries such as the US, Japan and Germany has been robust over the past 6 years, growing at significantly high growth rates. On the other hand, countries such as Switzerland, Denmark and Austria are the developing markets for organic with sales rising moderately in the recent years…
The global organic food and beverages industry has showed a remarkable growth in the past five years, growing from USD ~ million in 2006 to USD ~ million in 2011. The market has registered a CAGR of 9.5% from 2006 to 2011…
The growth has been influenced by the opportunities in all categories of organic food products such as fruits and vegetables, dairy products, bakery products, baby food throughout the globe…
Figure: Global Organic Food and Beverages Market Size by Revenue in USD Million, 2006-2011
0.0
10,000.0
20,000.0
30,000.0
40,000.0
50,000.0
60,000.0
70,000.0
2006 2007 2008 2009 2010 2011
USD
Mill
ion
9
© This is a licensed product of Ken Research and should not be copied
ASIA-PACIFIC ORGANIC FOOD AND BEVERAGES INDUSTRY
The organic food and beverages market in Asia-Pacific has surged in the recent years due to a marked increase in both consumption and production in the region. Though Asia has been slow in…
The organic farmland in the region has also shown considerable increase over the years with the largest increase witnessed in China. Other countries such as India and Thailand are also… it has been observed that the producer countries which also include smaller producers such as Indonesia, Vietnam and the Philippines are exporting more than ~% of their produce mainly to Europe and North America…
… demand for organic bakery products and beverages is predominant in the cities of Beijing and Shanghai in China but the demand can only be met through…
ASIA-PACIFIC ORGANIC FOOD AND BEVERAGES MARKET SIZE, 2006-2011
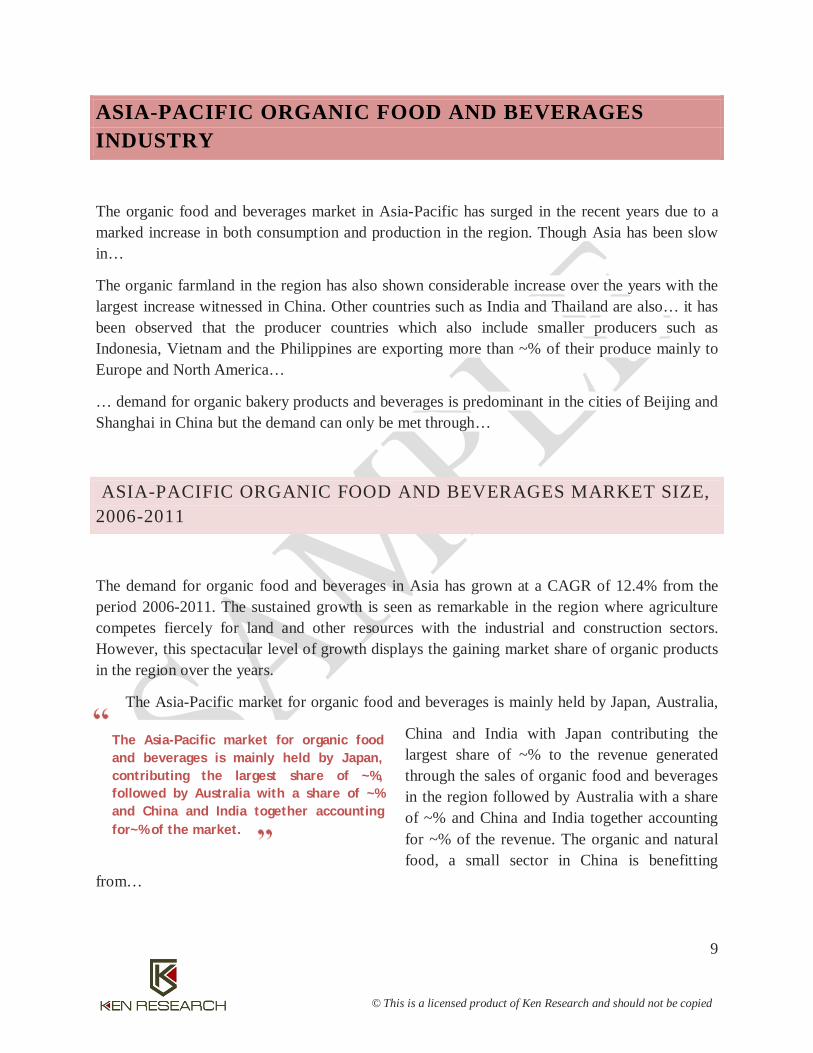
The demand for organic food and beverages in Asia has grown at a CAGR of 12.4% from the period 2006-2011. The sustained growth is seen as remarkable in the region where agriculture competes fiercely for land and other resources with the industrial and construction sectors. However, this spectacular level of growth displays the gaining market share of organic products in the region over the years.
The Asia-Pacific market for organic food and beverages is mainly held by Japan, Australia,
China and India with Japan contributing the largest share of ~% to the revenue generated through the sales of organic food and beverages in the region followed by Australia with a share of ~% and China and India together accounting for ~% of the revenue. The organic and natural food, a small sector in China is benefitting
from…
The Asia-Pacific market for organic food and beverages is mainly held by Japan, contributing the largest share of ~%, followed by Australia with a share of ~% and China and India together accounting for~% of the market.
10
© This is a licensed product of Ken Research and should not be copied
In India, environmental distress, imminent health hazards and… have led to the promotion of organic farming. The Indian organic food market is in its nascent stage which is less than USD ~ million in 2011 is growing at 14.5% per annum…
Figure: Asia –Pacific Organic Food and Beverages Market by Revenue in USD Million, 2006-2011
JAPAN ORGANIC FOOD AND BEVERAGES MARKET SIZE, 2006-2011
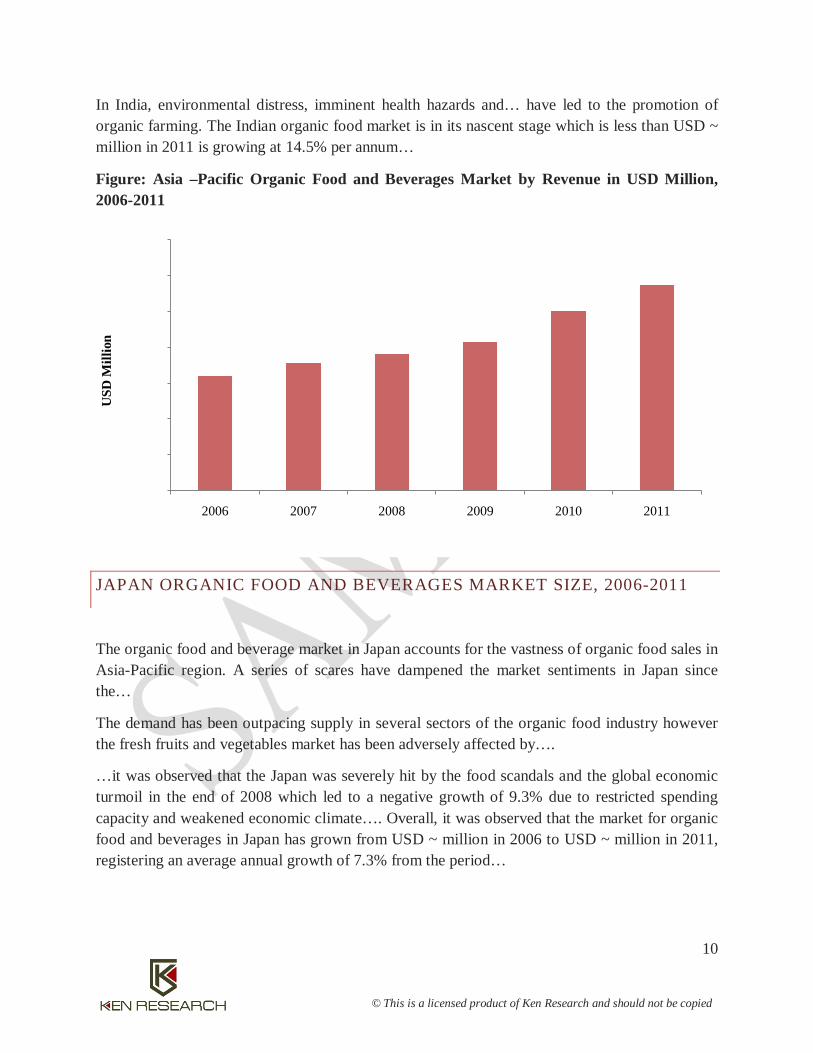
The organic food and beverage market in Japan accounts for the vastness of organic food sales in Asia-Pacific region. A series of scares have dampened the market sentiments in Japan since the…
The demand has been outpacing supply in several sectors of the organic food industry however the fresh fruits and vegetables market has been adversely affected by….
…it was observed that the Japan was severely hit by the food scandals and the global economic turmoil in the end of 2008 which led to a negative growth of 9.3% due to restricted spending capacity and weakened economic climate…. Overall, it was observed that the market for organic food and beverages in Japan has grown from USD ~ million in 2006 to USD ~ million in 2011, registering an average annual growth of 7.3% from the period…
0.0
500.0
1,000.0
1,500.0
2,000.0
2,500.0
3,000.0
3,500.0
2006 2007 2008 2009 2010 2011
USD
Mill
ion
11
© This is a licensed product of Ken Research and should not be copied
Figure: Japan Organic Food and Beverages Market by Revenue in USD Million, 2006-2011
JAPAN ORGANIC AGRICULTURAL LAND DEVELOPMENT, 2006-2011
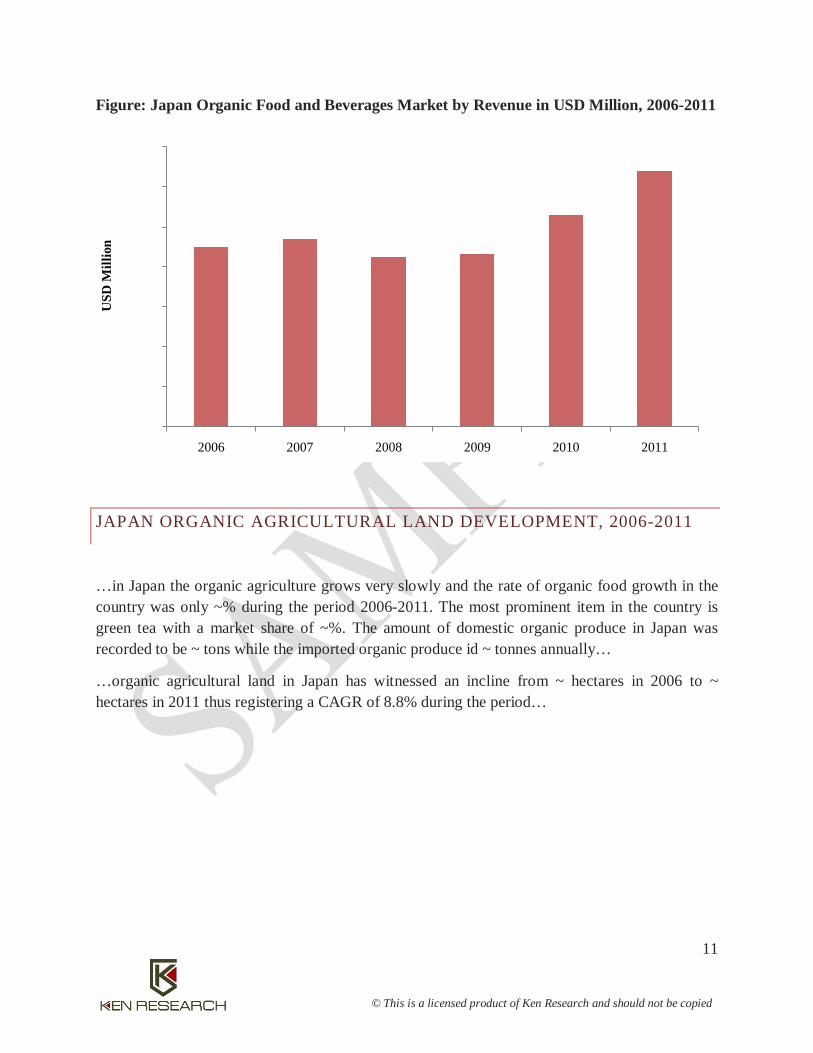
…in Japan the organic agriculture grows very slowly and the rate of organic food growth in the country was only ~% during the period 2006-2011. The most prominent item in the country is green tea with a market share of ~%. The amount of domestic organic produce in Japan was recorded to be ~ tons while the imported organic produce id ~ tonnes annually…
…organic agricultural land in Japan has witnessed an incline from ~ hectares in 2006 to ~ hectares in 2011 thus registering a CAGR of 8.8% during the period…
0.0
200.0
400.0
600.0
800.0
1,000.0
1,200.0
1,400.0
2006 2007 2008 2009 2010 2011
USD
Mill
ion
12
© This is a licensed product of Ken Research and should not be copied
Figure: Japan Organic Agricultural Land Development in Hectares, 2006-2011
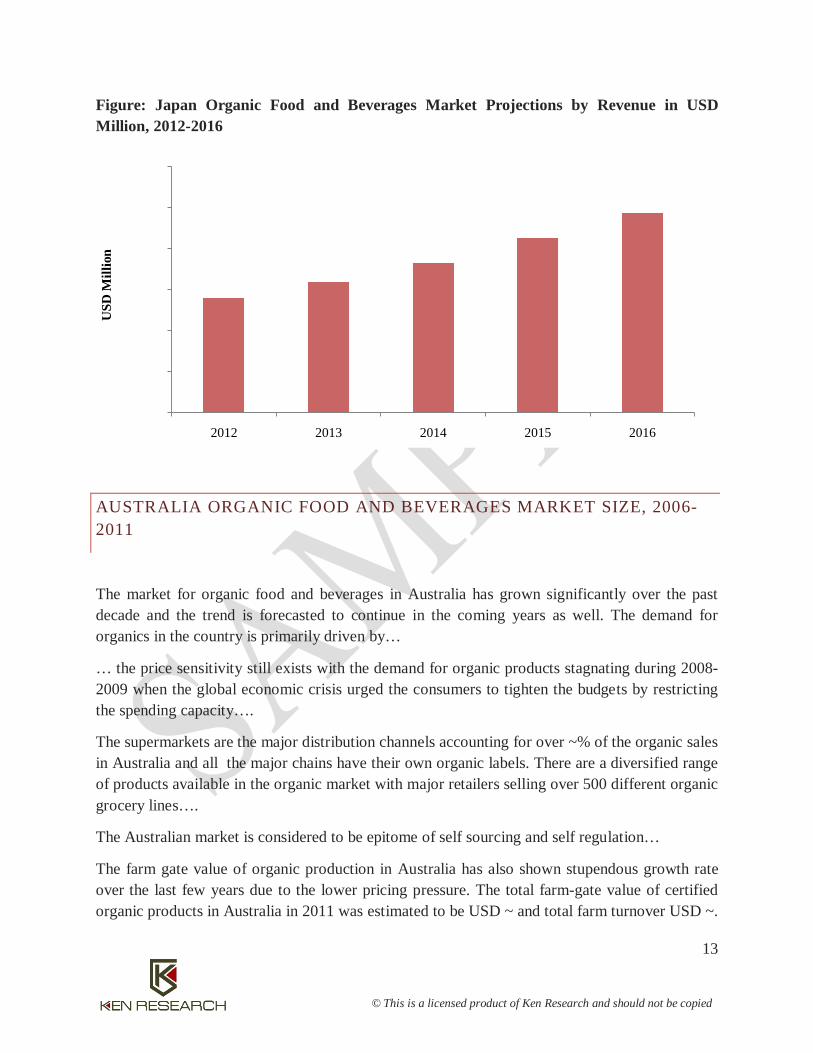
JAPAN ORGANIC FOOD AND BEVERAGES MARKET FUTURE OUTLOOK AND PROJECTIONS, 2012-2016
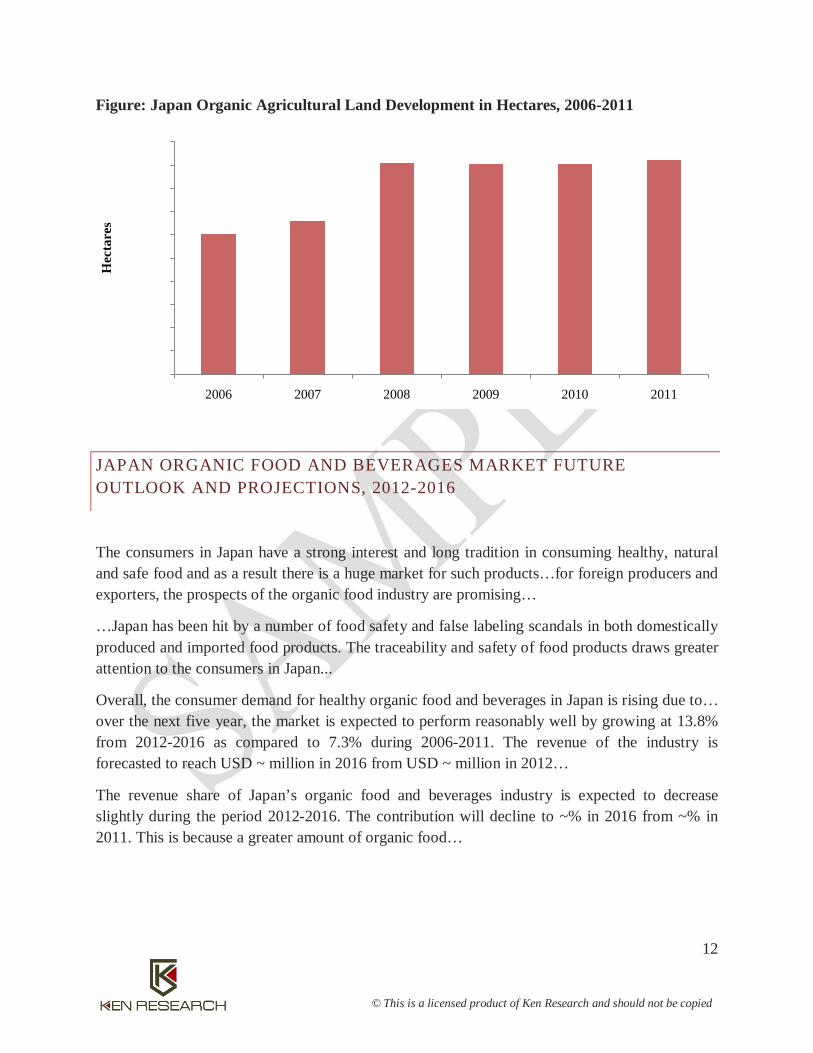
The consumers in Japan have a strong interest and long tradition in consuming healthy, natural and safe food and as a result there is a huge market for such products…for foreign producers and exporters, the prospects of the organic food industry are promising…
…Japan has been hit by a number of food safety and false labeling scandals in both domestically produced and imported food products. The traceability and safety of food products draws greater attention to the consumers in Japan...
Overall, the consumer demand for healthy organic food and beverages in Japan is rising due to… over the next five year, the market is expected to perform reasonably well by growing at 13.8% from 2012-2016 as compared to 7.3% during 2006-2011. The revenue of the industry is forecasted to reach USD ~ million in 2016 from USD ~ million in 2012…
The revenue share of Japan’s organic food and beverages industry is expected to decrease slightly during the period 2012-2016. The contribution will decline to ~% in 2016 from ~% in 2011. This is because a greater amount of organic food…
0.0
1,000.0
2,000.0
3,000.0
4,000.0
5,000.0
6,000.0
7,000.0
8,000.0
9,000.0
10,000.0
2006 2007 2008 2009 2010 2011
Hec
tare
s
13
© This is a licensed product of Ken Research and should not be copied
Figure: Japan Organic Food and Beverages Market Projections by Revenue in USD Million, 2012-2016
AUSTRALIA ORGANIC FOOD AND BEVERAGES MARKET SIZE, 2006-2011
The market for organic food and beverages in Australia has grown significantly over the past decade and the trend is forecasted to continue in the coming years as well. The demand for organics in the country is primarily driven by…
… the price sensitivity still exists with the demand for organic products stagnating during 2008-2009 when the global economic crisis urged the consumers to tighten the budgets by restricting the spending capacity….
The supermarkets are the major distribution channels accounting for over ~% of the organic sales in Australia and all the major chains have their own organic labels. There are a diversified range of products available in the organic market with major retailers selling over 500 different organic grocery lines….
The Australian market is considered to be epitome of self sourcing and self regulation…
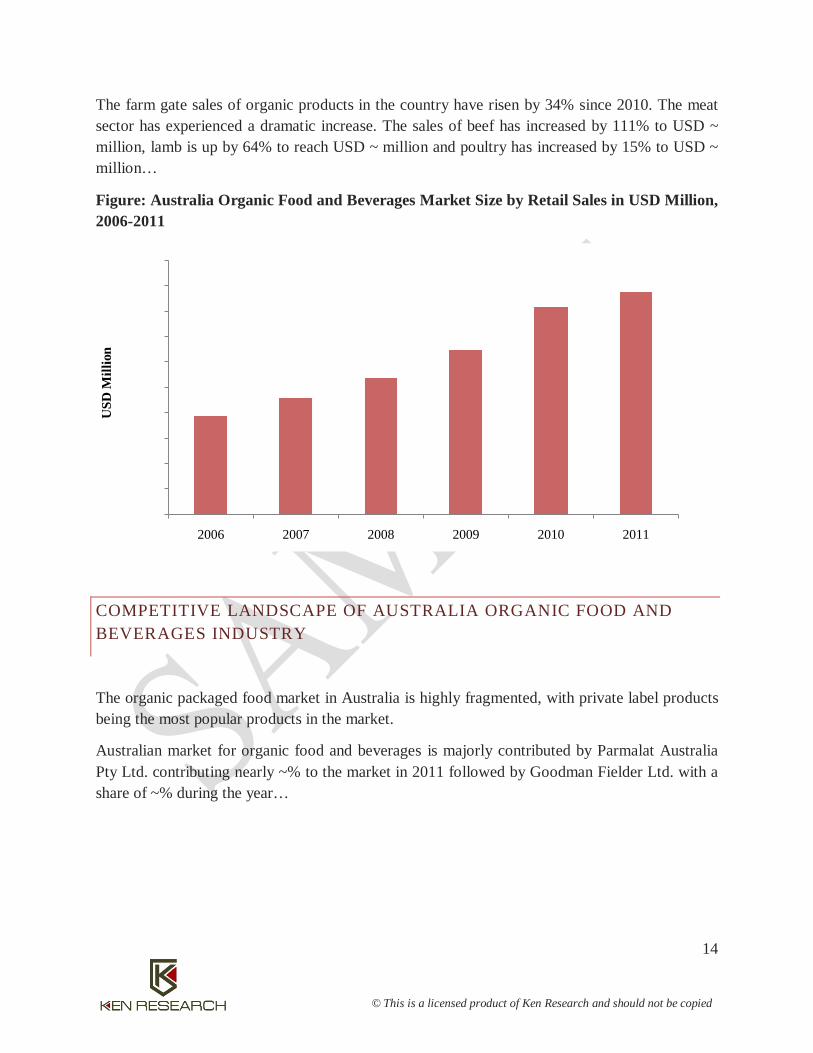
The farm gate value of organic production in Australia has also shown stupendous growth rate over the last few years due to the lower pricing pressure. The total farm-gate value of certified organic products in Australia in 2011 was estimated to be USD ~ and total farm turnover USD ~.
0.0
500.0
1,000.0
1,500.0
2,000.0
2,500.0
3,000.0
2012 2013 2014 2015 2016
USD
Mill
ion
14
© This is a licensed product of Ken Research and should not be copied
The farm gate sales of organic products in the country have risen by 34% since 2010. The meat sector has experienced a dramatic increase. The sales of beef has increased by 111% to USD ~ million, lamb is up by 64% to reach USD ~ million and poultry has increased by 15% to USD ~ million…
Figure: Australia Organic Food and Beverages Market Size by Retail Sales in USD Million, 2006-2011
COMPETITIVE LANDSCAPE OF AUSTRALIA ORGANIC FOOD AND BEVERAGES INDUSTRY
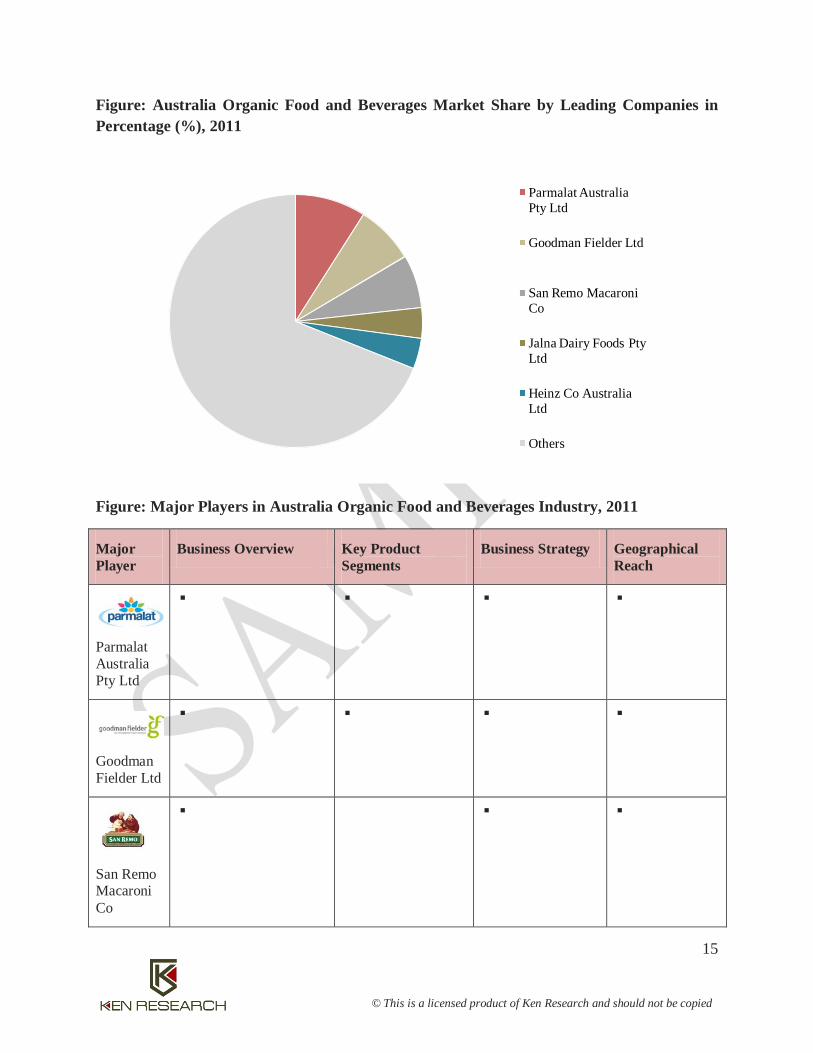
The organic packaged food market in Australia is highly fragmented, with private label products being the most popular products in the market.
Australian market for organic food and beverages is majorly contributed by Parmalat Australia Pty Ltd. contributing nearly ~% to the market in 2011 followed by Goodman Fielder Ltd. with a share of ~% during the year…
0.0
100.0
200.0
300.0
400.0
500.0
600.0
700.0
800.0
900.0
1,000.0
2006 2007 2008 2009 2010 2011
USD
Mill
ion
15
© This is a licensed product of Ken Research and should not be copied
Figure: Australia Organic Food and Beverages Market Share by Leading Companies in Percentage (%), 2011
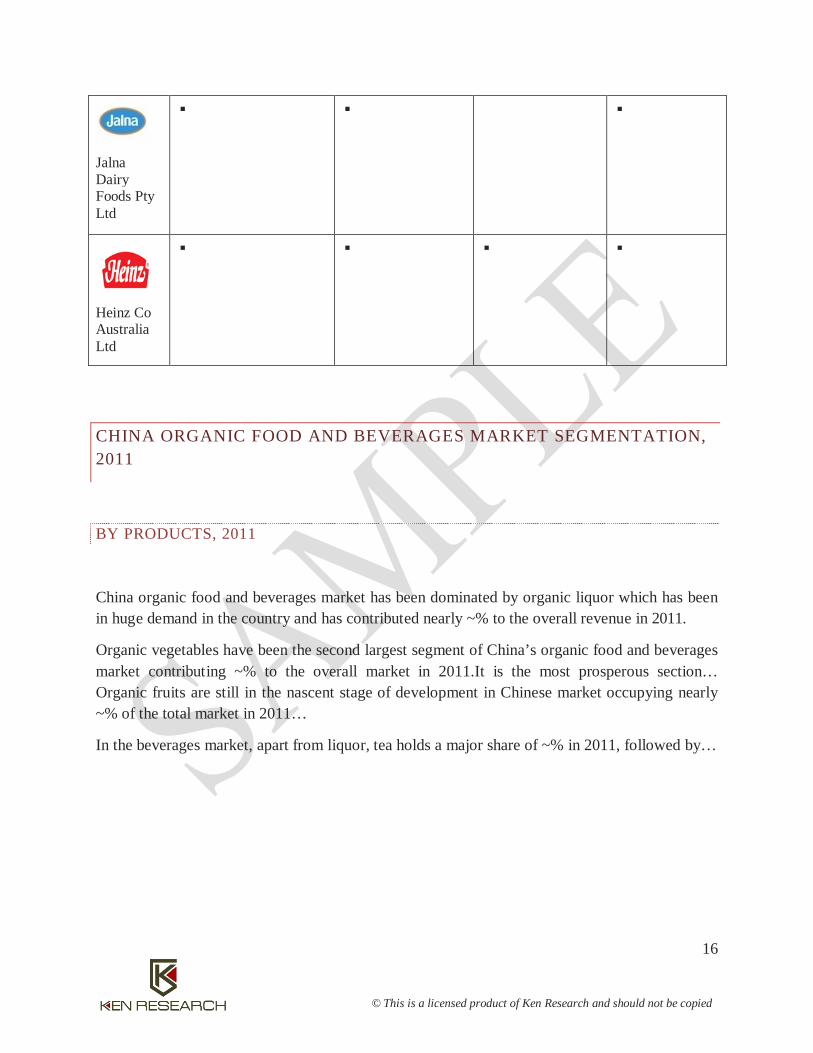
Figure: Major Players in Australia Organic Food and Beverages Industry, 2011
Major Player
Business Overview Key Product Segments
Business Strategy Geographical Reach
Parmalat Australia Pty Ltd
Goodman Fielder Ltd
San Remo Macaroni Co
Parmalat Australia Pty Ltd
Goodman Fielder Ltd
San Remo Macaroni Co
Jalna Dairy Foods Pty Ltd
Heinz Co Australia Ltd
Others
16
© This is a licensed product of Ken Research and should not be copied
Jalna Dairy Foods Pty Ltd
Heinz Co Australia Ltd
CHINA ORGANIC FOOD AND BEVERAGES MARKET SEGMENTATION, 2011
BY PRODUCTS, 2011
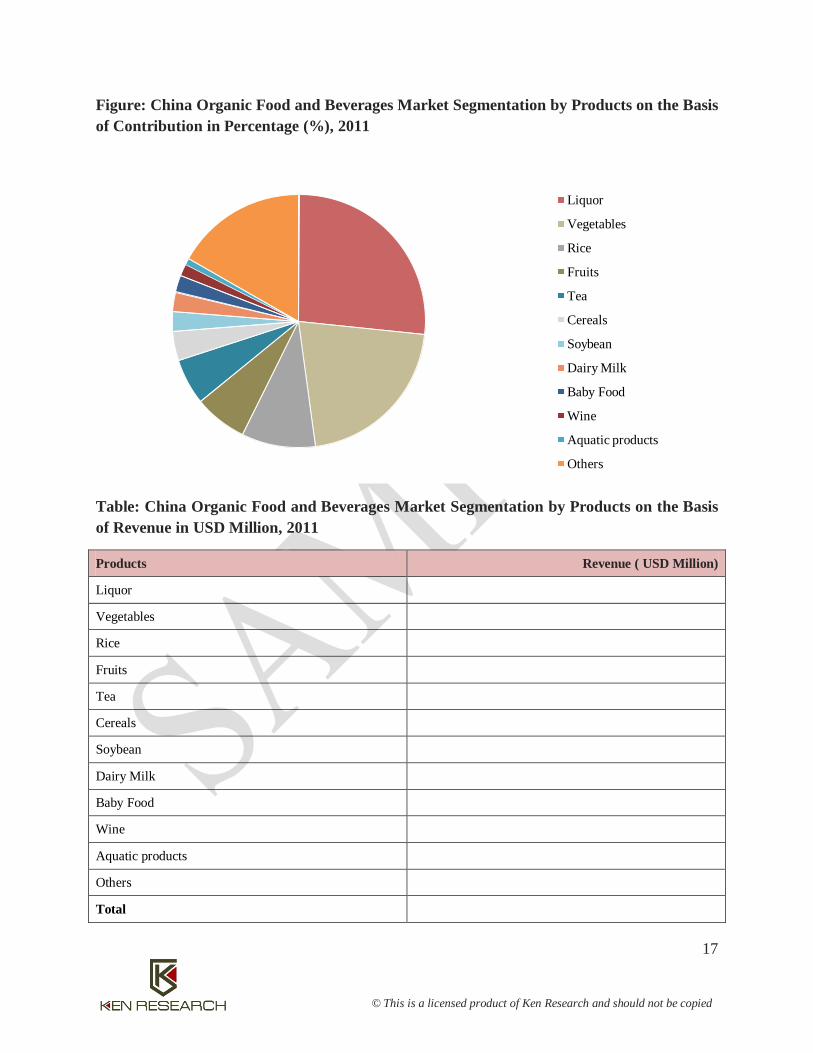
China organic food and beverages market has been dominated by organic liquor which has been in huge demand in the country and has contributed nearly ~% to the overall revenue in 2011.
Organic vegetables have been the second largest segment of China’s organic food and beverages market contributing ~% to the overall market in 2011.It is the most prosperous section… Organic fruits are still in the nascent stage of development in Chinese market occupying nearly ~% of the total market in 2011…
In the beverages market, apart from liquor, tea holds a major share of ~% in 2011, followed by…
17
© This is a licensed product of Ken Research and should not be copied
Figure: China Organic Food and Beverages Market Segmentation by Products on the Basis of Contribution in Percentage (%), 2011
Table: China Organic Food and Beverages Market Segmentation by Products on the Basis of Revenue in USD Million, 2011
Products Revenue ( USD Million)
Liquor
Vegetables
Rice
Fruits
Tea
Cereals
Soybean
Dairy Milk
Baby Food
Wine
Aquatic products
Others
Total
Liquor
Vegetables
Rice
Fruits
Tea
Cereals
Soybean
Dairy Milk
Baby Food
Wine
Aquatic products
Others
18
© This is a licensed product of Ken Research and should not be copied
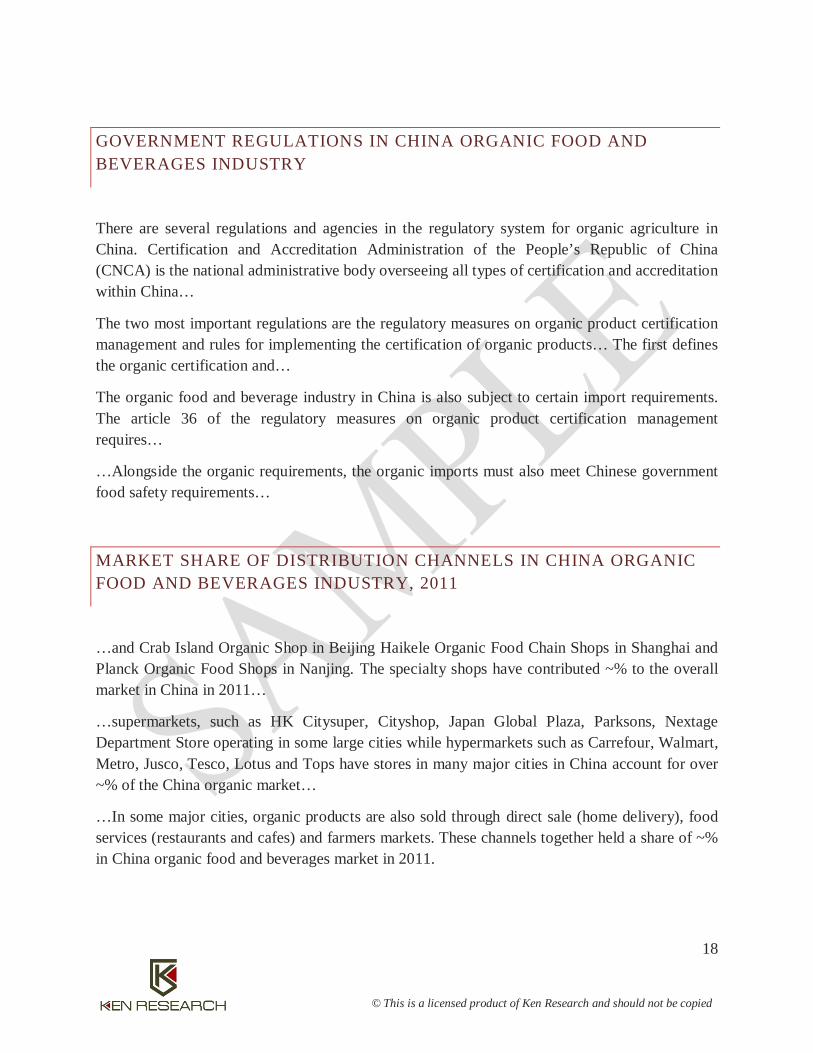
GOVERNMENT REGULATIONS IN CHINA ORGANIC FOOD AND BEVERAGES INDUSTRY
There are several regulations and agencies in the regulatory system for organic agriculture in China. Certification and Accreditation Administration of the People’s Republic of China (CNCA) is the national administrative body overseeing all types of certification and accreditation within China…
The two most important regulations are the regulatory measures on organic product certification management and rules for implementing the certification of organic products… The first defines the organic certification and…
The organic food and beverage industry in China is also subject to certain import requirements. The article 36 of the regulatory measures on organic product certification management requires…
…Alongside the organic requirements, the organic imports must also meet Chinese government food safety requirements…
MARKET SHARE OF DISTRIBUTION CHANNELS IN CHINA ORGANIC FOOD AND BEVERAGES INDUSTRY, 2011
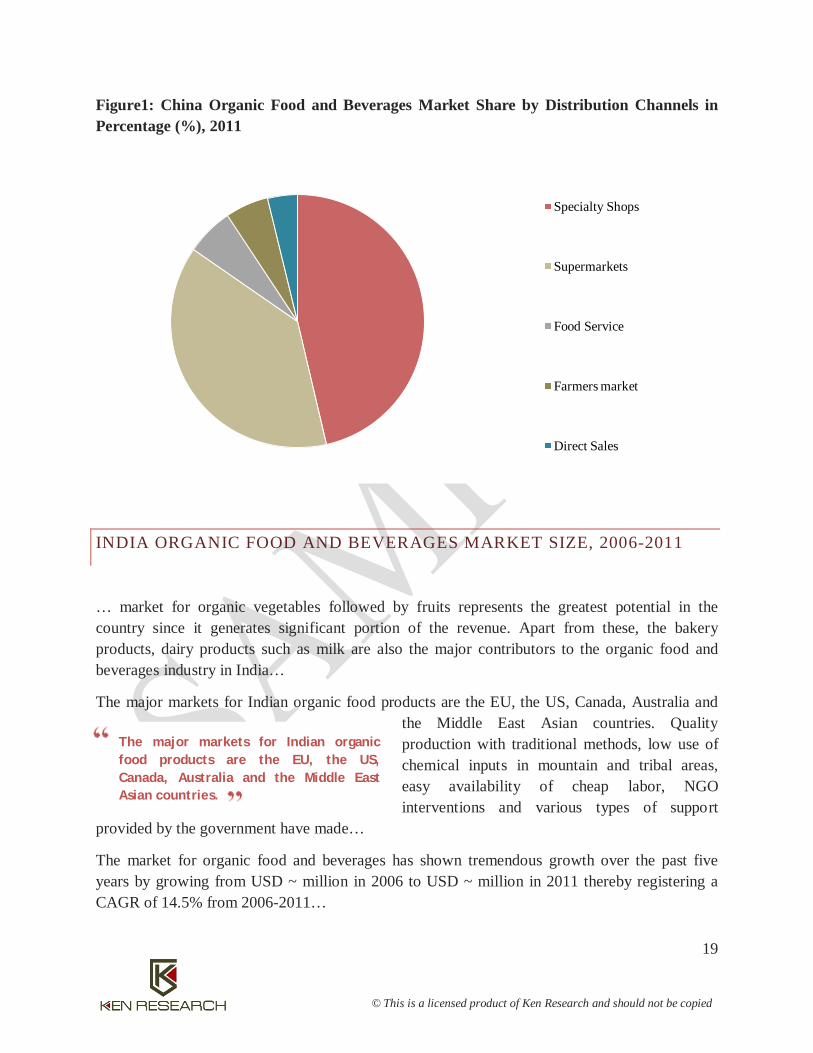
…and Crab Island Organic Shop in Beijing Haikele Organic Food Chain Shops in Shanghai and Planck Organic Food Shops in Nanjing. The specialty shops have contributed ~% to the overall market in China in 2011…
…supermarkets, such as HK Citysuper, Cityshop, Japan Global Plaza, Parksons, Nextage Department Store operating in some large cities while hypermarkets such as Carrefour, Walmart, Metro, Jusco, Tesco, Lotus and Tops have stores in many major cities in China account for over ~% of the China organic market…
…In some major cities, organic products are also sold through direct sale (home delivery), food services (restaurants and cafes) and farmers markets. These channels together held a share of ~% in China organic food and beverages market in 2011.
19
© This is a licensed product of Ken Research and should not be copied
The major markets for Indian organic food products are the EU, the US, Canada, Australia and the Middle East Asian countries.
Figure1: China Organic Food and Beverages Market Share by Distribution Channels in Percentage (%), 2011
INDIA ORGANIC FOOD AND BEVERAGES MARKET SIZE, 2006-2011
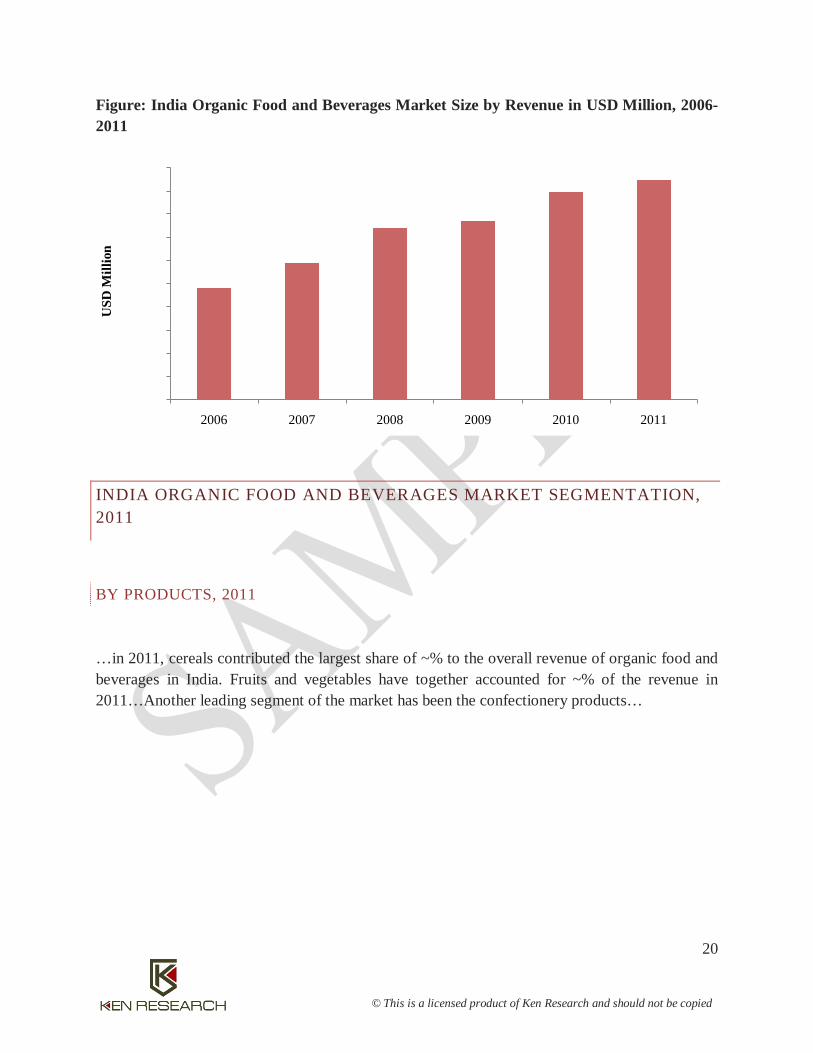
… market for organic vegetables followed by fruits represents the greatest potential in the country since it generates significant portion of the revenue. Apart from these, the bakery products, dairy products such as milk are also the major contributors to the organic food and beverages industry in India…
The major markets for Indian organic food products are the EU, the US, Canada, Australia and the Middle East Asian countries. Quality production with traditional methods, low use of chemical inputs in mountain and tribal areas, easy availability of cheap labor, NGO interventions and various types of support
provided by the government have made…
The market for organic food and beverages has shown tremendous growth over the past five years by growing from USD ~ million in 2006 to USD ~ million in 2011 thereby registering a CAGR of 14.5% from 2006-2011…
Specialty Shops
Supermarkets
Food Service
Farmers market
Direct Sales
20
© This is a licensed product of Ken Research and should not be copied
Figure: India Organic Food and Beverages Market Size by Revenue in USD Million, 2006-2011
INDIA ORGANIC FOOD AND BEVERAGES MARKET SEGMENTATION, 2011
BY PRODUCTS, 2011
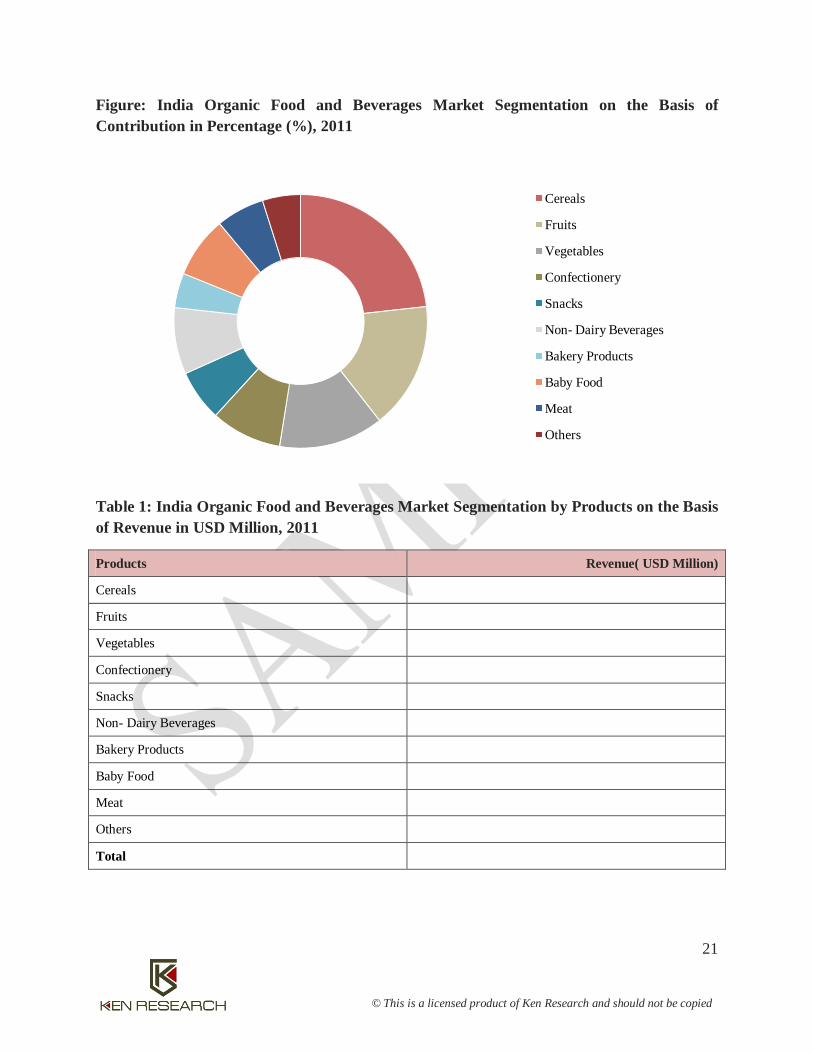
…in 2011, cereals contributed the largest share of ~% to the overall revenue of organic food and beverages in India. Fruits and vegetables have together accounted for ~% of the revenue in 2011…Another leading segment of the market has been the confectionery products…
0.0
20.0
40.0
60.0
80.0
100.0
120.0
140.0
160.0
180.0
200.0
2006 2007 2008 2009 2010 2011
USD
Mill
ion
21
© This is a licensed product of Ken Research and should not be copied
Figure: India Organic Food and Beverages Market Segmentation on the Basis of Contribution in Percentage (%), 2011
Table 1: India Organic Food and Beverages Market Segmentation by Products on the Basis of Revenue in USD Million, 2011
Products Revenue( USD Million)
Cereals
Fruits
Vegetables
Confectionery
Snacks
Non- Dairy Beverages
Bakery Products
Baby Food
Meat
Others
Total
Cereals
Fruits
Vegetables
Confectionery
Snacks
Non- Dairy Beverages
Bakery Products
Baby Food
Meat
Others
22
© This is a licensed product of Ken Research and should not be copied
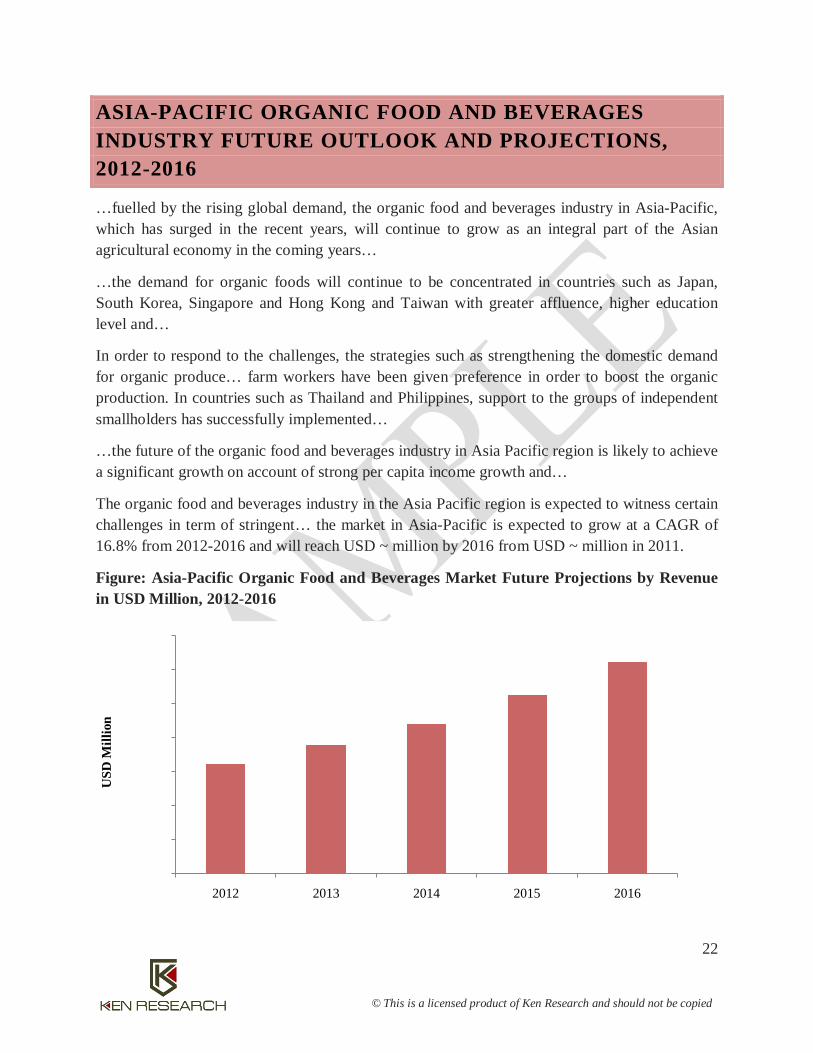
ASIA-PACIFIC ORGANIC FOOD AND BEVERAGES INDUSTRY FUTURE OUTLOOK AND PROJECTIONS, 2012-2016
…fuelled by the rising global demand, the organic food and beverages industry in Asia-Pacific, which has surged in the recent years, will continue to grow as an integral part of the Asian agricultural economy in the coming years…
…the demand for organic foods will continue to be concentrated in countries such as Japan, South Korea, Singapore and Hong Kong and Taiwan with greater affluence, higher education level and…
In order to respond to the challenges, the strategies such as strengthening the domestic demand for organic produce… farm workers have been given preference in order to boost the organic production. In countries such as Thailand and Philippines, support to the groups of independent smallholders has successfully implemented…
…the future of the organic food and beverages industry in Asia Pacific region is likely to achieve a significant growth on account of strong per capita income growth and…
The organic food and beverages industry in the Asia Pacific region is expected to witness certain challenges in term of stringent… the market in Asia-Pacific is expected to grow at a CAGR of 16.8% from 2012-2016 and will reach USD ~ million by 2016 from USD ~ million in 2011.
Figure: Asia-Pacific Organic Food and Beverages Market Future Projections by Revenue in USD Million, 2012-2016
0.0
1,000.0
2,000.0
3,000.0
4,000.0
5,000.0
6,000.0
7,000.0
2012 2013 2014 2015 2016
USD
Mill
ion
23
© This is a licensed product of Ken Research and should not be copied
DISCLAIMER
The research reports provided by Ken Research are for the personal information of the authorized recipient and is not for public distribution and should not be reproduced or redistributed without prior permission. You are permitted to print or download extracts from this material for your personal use only. None of this material may be used for any commercial or public use.
The information provided in the research documents is from publicly available data and other sources, which are reliable. Efforts are made to try and ensure accuracy of data. With respect to documents available, neither the company nor any of its employees makes any warranty, express or implied, including the warranties of merchantability and fitness for a particular purpose, or assumes any legal liability or responsibility for the accuracy, completeness, or usefulness of any information, apparatus, product, or process disclosed, or represents that its use will not infringe privately owned rights.
The report also includes analysis and views expressed by our research team. The research reports are purely for information purposes. The opinions expressed are our current opinions as of the date appearing in the material and may be subject to change from time to time without notice. Investors should not solely rely on the information contained in the research documents and must make investment decisions based on their own investment objectives, risk profile and financial position. The recipients of this material should take their own professional advice before acting on this information.
Ken Research will not accept returns of reports once dispatched due to the confidentiality of information provided in our reports. In case, a report qualify for return, we will issue a credit, minus shipping charges, of equal value to the original purchase price, toward a future purchase—no refunds. The decision about whether the product return can be accepted or not is solely at our discretion. Any dispute will be subject to laws of India and exclusive jurisdiction of Indian Courts.
No part of this manual or any material appearing may be reproduced, stored in or transmitted on any other Web site without written permission of Ken Research and any payments of a specified fee. Requests to republish any material may be sent to us.