asia pacific: textile, apparel & footwear -...
TRANSCRIPT
December 1, 2016
Asia Pacific: Textile, Apparel & Footwear
Equity Research
When the going gets tough: Buy Shenzhou (CL), Yue Yuen
Three debates facing Greater China exporters
China is the largest exporter of apparel and footwear to the US, accounting for
36% and 63% of US imports in 2015, respectively. In this report, we examine
the potential impact of possible changes to US trade policy on exporters in
Greater China, under three potential scenarios: 1) Production move back to
the US: Textile and footwear are labor intensive industries, employing c.23mn
in China. Average hourly wages in China are US$3-4 vs. US$19 in the US. This
makes it difficult to move these jobs back to the US in a big way, in our view.
2) Tariff increase: We estimate that the imposition of an additional tariff of
45% on textile imports would increase US retail prices by 11% on a full pass-
through basis with most of the costs borne by retailers/brands. We estimate
OEMs' earnings for China exports to the US would be cut 30-60% if they take
on 10-20% of the tax duty increase. 3) Future of TPP: If the US withdraws from
the TPP, it could impact brands’ sourcing strategies in the near term. However,
we believe Vietnam, a key production base for many Greater China exporters,
still enjoys cost advantages and preferential duties through FTAs with the EU.
US exposure and production allocation to determine impact
We do stress tests to analyze the potential impact on exporters and
conclude that it largely depends on exporters’ end-market exposures and
production base allocations. Shenzhou has the lowest US exposure (13% of
sales in 2015) but the biggest production base in China (82% of production)
within our coverage. Makalot has high US market exposure (77%) but low
China production (8%). Stella has relatively high US exposure (53%) as well as
high China production (73%) and will likely be impacted the most if it needs to
share a part of potential additional duties on US imports from China.
Shenzhou added to CL (Buy), Yue Yuen up to Buy, Eclat to Neutral
With market concerns on global trade and demand uncertainties, we
recommend investing in quality names with healthy earnings outlooks. We
add Shenzhou to our Conviction List (Buy), on 1) low US exposure, 2)
strong client mix and share gains, 3) integrated business model, 4) Vietnam
capacity ramp-up, and 5) margin upside from product mix and cost
management. Yue Yuen up to Buy from Neutral on 1) stabilized
operation/margin trend, 2) balanced market/client exposure, and 3) rising
contribution from Pou Sheng. Eclat down to Neutral from Buy as: 1) we
forecast EPS recovery to be lower than what we had previously expected, and
2) see uncertainties from US retail clients (26% of 2016E sales) on inventory
control/slower SSSG. We update estimates/target price across our coverage.
COVERAGE SUMMARY
Prices as of Nov 29, 2016; * denotes the stock is on our Conviction List
Source: Datastream, Company data, Goldman Sachs Global Investment Research.
UPCOMING EVENTS
Lululemon 3Q16 result: Dec 7
November monthly sales for Makalot, Eclat, Pou Sheng, Yue
Yuen: by Dec 10
Shenzhou/Li & Fung/Stella 2H16 result: Mar-17
Yue Yuen/Eclat/Makalot 4Q16 result: Mar-17
RELATED RESEARCH
Americas: Retail: Transition and consumption: Implications
of tax reform for retail, 23 Nov 2016
Americas Retail: Specialty Apparel & Accessories: Off-
pricers continue to win the traffic war; athletic retail comps
hold firm #Scoreboard, 18 Nov 2016
Americas Retail: Specialty Apparel & Accessories: Wild
moves in department stores and handbags but overall
demand is sluggish #Scoreboard, 11 Nov 2016
Michelle Cheng +886(2)2730-4181 [email protected] Goldman Sachs (Asia) L.L.C., Taipei Branch Goldman Sachs does and seeks to do business with
companies covered in its research reports. As a result, investors should be aware that the firm may have a conflict of interest that could affect the objectivity of this report. Investors should consider this report as only a single factor in making their investment decision. For Reg AC certification and other important disclosures, see the Disclosure Appendix, or go to www.gs.com/research/hedge.html. Analysts employed by non-US affiliates are not registered/qualified as research analysts with FINRA in the U.S.
Joshua Lu +852-2978-1024 [email protected] Goldman Sachs (Asia) L.L.C. Goldie Chang +65-6654-5154 [email protected] Goldman Sachs (Singapore) Pte
The Goldman Sachs Group, Inc. Global Investment Research
Old Mkt cap New Old
Potential
up/down
Company Ticker Rating Rating (US$mn) 12m-TP 12m-TP side (%)
Shenzhou 2313.HK Buy* Buy 8,477 HK$ 58.0 56.0 23%Yue Yuen 0551.HK Buy Neutral 5,907 HK$ 33.0 33.0 19%
Eclat 1476.TW Neutral Buy 2,755 NT$ 340.0 410.0 4%
Li&Fung 0494.HK Neutral Neutral 3,651 HK$ 3.5 4.9 3%
Stella 1836.HK Neutral Neutral 1,378 HK$ 13.7 12.0 2%Makalot 1477.TW Sell Sell 765 NT$ 111.0 114.0 -6%

December 1, 2016 Asia Pacific: Textile, Apparel & Footwear
Goldman Sachs Global Investment Research 2
Table of contents
Overview: Focus on earnings quality amid looming uncertainty; Buy Shenzou (CL), Yue Yuen 3
Potential impact of additional duties on US imports from China 5
US heavily reliant on imports; challenges in moving back production 7
Free trade agreements impact sourcing strategies 10
Near-term uncertainty, but longer-term concerns overdone 12
Earnings revisions and valuation 14
Shenzhou: Buy on share gains, defensive market exposure; to CL 18
Yue Yuen: Stabilized margins and rising retail mix; up to Buy 22
Eclat: Down to Neutral as EPS recovery appears priced in 25
Appendix 1: Share price performance 28
Appendix 2: Lukewarm US apparel demand vs. inventory control 29
Disclosure Appendix 31
All prices in this report are as of November 29, 2016 unless otherwise stated.
December 1, 2016 Asia Pacific: Textile, Apparel & Footwear
Goldman Sachs Global Investment Research 3
Overview: Focus on earnings quality amid looming uncertainty;
Buy Shenzou (CL), Yue Yuen
US trade policy key for Chinese exporters
US President-elect Donald Trump has a significantly more hawkish stance than that of the
current administration and may impose new tariffs on imports from China and Mexico, up
to 45%/35%, respectively. Besides, Mr. Trump opposes the Trans-Pacific Partnership (TPP),
which has been one of the most important FTA under negotiation globally, involving the
US, Japan, and another 10 countries including Vietnam. His stance on global trade has
raised concerns among Asian manufacturers. In this report, we analyse the following
possibilities:
1. Imposition of additional tariffs: Chinese players could lose their competitiveness if
brands alter their sourcing strategies and start sourcing from other countries. This
would put pressure on production in China and could speed up a move out of China.
2. Future of TPP: Brands could change their sourcing strategy for import to the US in the
near term, without incurring an immediate duty benefit. Vietnam still enjoys cost
advantages, on top of free trade agreements with other countries.
3. Production move back to the US: With higher labor costs and insufficient labor
supply, production is unlikely to move back to the US immediately. We believe
technology upgrade/automation will determine the feasibility of moving production
back to the US.
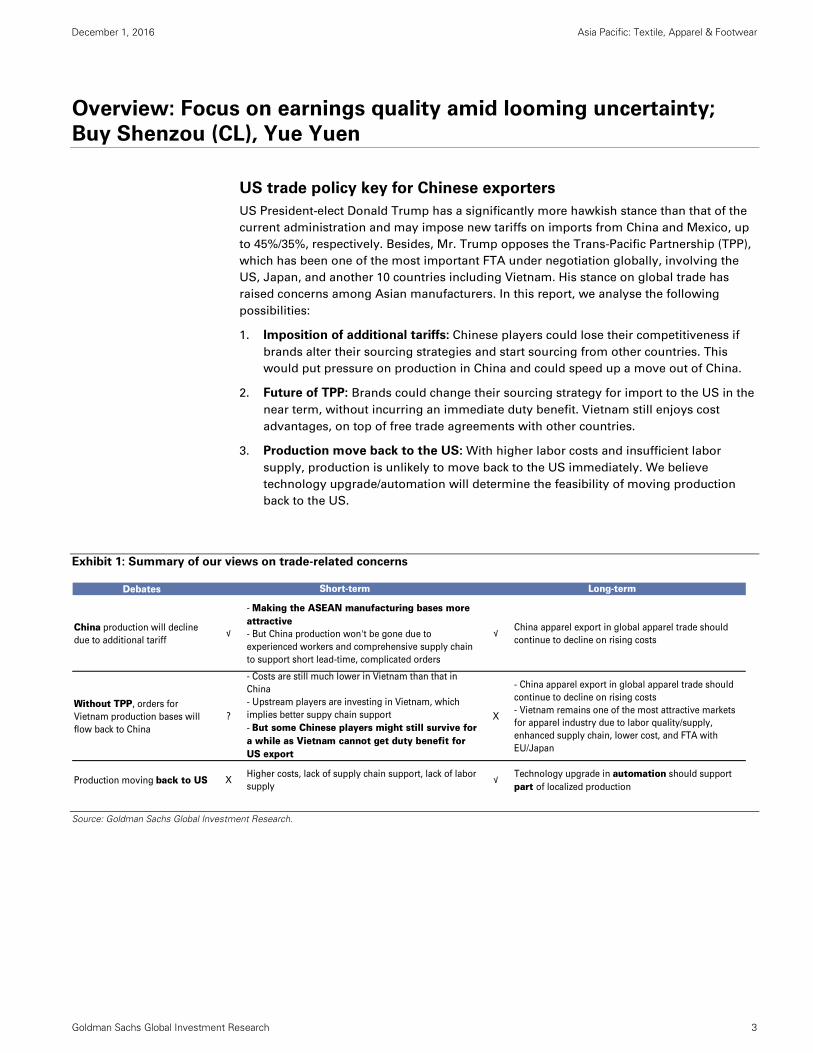
Exhibit 1: Summary of our views on trade-related concerns
Source: Goldman Sachs Global Investment Research.
Debates
China production will decline
due to additional tariff√
- Making the ASEAN manufacturing bases more attractive- But China production won't be gone due to
experienced workers and comprehensive supply chain
to support short lead-time, complicated orders
√China apparel export in global apparel trade should
continue to decline on rising costs
Without TPP, orders for
Vietnam production bases will
flow back to China
?
- Costs are still much lower in Vietnam than that in
China
- Upstream players are investing in Vietnam, which
implies better suppy chain support
- But some Chinese players might still survive for a while as Vietnam cannot get duty benefit for US export
X
- China apparel export in global apparel trade should
continue to decline on rising costs
- Vietnam remains one of the most attractive markets
for apparel industry due to labor quality/supply,
enhanced supply chain, lower cost, and FTA with
EU/Japan
Production moving back to US XHigher costs, lack of supply chain support, lack of labor
supply√
Technology upgrade in automation should support
part of localized production
Short-term Long-term

December 1, 2016 Asia Pacific: Textile, Apparel & Footwear
Goldman Sachs Global Investment Research 4
Four factors drive our stock picks: Buy Shenzhou (CL), Yue Yuen
Over the long term, we believe industry consolidation and tougher supply chain control
would enable leading OEMs to gain market share. However, to deal with the near-term
uncertainties, we prefer companies with:
1. A more balanced end-market exposure (less US): Shenzhou has the lowest US
exposure at 13% of total sales (2015).
2. Benefiting from China growth story: Yue Yuen has rising contribution from Pou
Sheng (10% in 2015 to 16% in 2018E); Shenzhou is likely to benefit from
Nike/Adidas/Uniqlo’s growth in China.
3. Better client mix: Shenzhou’s key clients (Nike, Uniqlo, Adidas, Puma) are on a solid
track, especially in China; Yue Yuen has diversified sports shoe clients (Nike/Adidas
27%/23% of 2015 OEM sales.
4. Company-specific margin expansion potential: Shenzhou on product mix and
Vietnam capacity ramp-up; Yue Yuen on stabilized operations following relocation
pressures in 2013-15.
Accordingly, we maintain our Buy rating on Shenzhou and add it to our Conviction List,
and upgrade Yue Yuen to Buy from Neutral. We also move Shenzhou (2313.HK), Yue Yuen
(0551.HK), Eclat (1476.TW); Li & Fung (0494.HK), Stella (1836.HK) and Makalot (1477.HK) to
the “Greater China Retail” Coverage Group (Coverage View: Neutral) from the ”TW and HK
Retail” Coverage Group (Coverage View: Neutral).
Exhibit 2: Comparison of OEMs in terms of business model, market/client/production exposure
Source: Company data, Goldman Sachs Global Investment Research.
Makalot Eclat Shenzhou Yue Yuen Feng Tay Stella Li & Fung
Ticker 1477.TW 1476.TW 2313.HK 0551.HK 9910.TW 1836.HK 494.HK
Business description Garment OEM/ODMFabric, garment OEM/ODM
Fabric, garment OEM/ODM
Footwear OEM/ODM Footwear OEM/ODM Footwear OEM/ODM Trading and logistics
Degree of integration5% of fabric supplied from its JV
35% of the fabric is for internal garment manufacturing
100% NA NA NA NA
Sales breakdown by
client (2015)
Gap (23%), Kohl's (23%), Target (15%), GU (12%), Hanesbrands (5%)
Nike (10-15%), lululemon(7-8%), Under Armour (7-8%), JC Penny, Macy's
Nike (30%), Uniqlo (30%), adidas (22%), Puma (8%)
Nike (27% of OEM), adidas (23%)
Nike (80%)UGG, Nike, Clarks, VFC, WWW (c.70%)
Kohl's, Macy, JC Penney
Sales breakdown by
businesses (2015)Garment: 100%
Garment: 65%Fabric: 35%
Garment: 100%OEM: 73%Retail: 27%
Shoes manufacturing and selling:90%Shoes material trade: 1%Others: 9%
Footwear: 100%Trading: 95%Logistics: 5%
Sales breakdown by
product (2015)
Fashion: 58%Active: 15%Sleepwear: 15%Functional sports: 12%
Mostly functional sportswear
Sportswear: 64%Casual wear: 28%Lingerie: 8%Other knitting: 1%
For OEM:Sports shoes: 73%Casual & outdoors: 27%
Sport shoes: 83%Casual shoes and equipment: 10%Wholesale on daily necessities: 5%Ball: 2%
Dress/Casual shoes: c.85%Sports shoes: c.15%
Soft goods: 59%Hard goods:36%Logistics: 5%
Sales breakdown by
geography (2015)
US: 77%Asia:18%Europe:1%Others: 4%
US: 52%Canada: 5%Cambodia: 6%China: 4%Others: 33%
Japan: 23%China: 22%Europe: 18%US: 13%Others: 24%
For OEM: China: 10%US: 35%Europe: 27%Others: 28%
US: 52%Europe: 19%China: 4%Others: 25%
North America: 53%Europe: 26%China: 13%Asia: 6%Others: 2%
US: 62%Europe: 17%Asia: 15%Others: 7%
Production base
breakdown (2015)
Indonesia: 31%Vietnam:33%Cambodia: 23%China: 8%Philippines: 6%
-FabricVietnam: 54%Taiwan: 46%- GarmentVietnam: 63%Lesotho: 16%Cambodia: 11%China: 5%Taiwan: 5%
-FabricChina: 77%Vietnam: 23%- GarmentChina: 82%Cambodia: 16%Vietnam: 2%
Vietnam: 42%Indonesia: 32%China: 25%Others: 1%
Vietnam: 53%India: 20%China: 14%Indonesia: 13%
China: 73%South East Asia: 27%
Sourcing areas: China (50+% of sourcing unit volume), followed by Vietnam, then Bangladesh
Gross margin (2015) 23.6% 28.0% 30.5%23.4% (total company); 19.7% (OEM only)
21.1% 21.0% 11.5%
EBIT margin (2015) 11.3% 19.0% 20.8%5.1% (total company); 5.4% (OEM only)
9.9% 6.4% 2.7%

December 1, 2016 Asia Pacific: Textile, Apparel & Footwear
Goldman Sachs Global Investment Research 5
Potential impact of additional duties on US imports from China
While US trade policies remain unclear, we conduct a stress test to assess the impact of
potential additional duties on companies under our coverage.
Based on our analysis, we estimate a cotton T-shirt sold at a retail price of US$12 has an
FOB price of c.US$3 per piece. Currently, we estimate duties paid by brands/retailers
amount to c.US$0.5/piece (subject to 16.5% duties).
If imports from China incur an additional 45% duty, it would imply an additional US$1.35
per piece. We summarize three scenarios below (Exhibit 3):
1. If additional duties are fully passed on to the retail price, we estimate retail ASP will
increase by 11%. Considering apparel imports to the US from China and Mexico make
41% of total imports (2015) and assuming an additional 35-45% tariff on apparel
imports from Mexico and China with all tariff increases reflected in ASP, we calculate
5.7% higher costs for consumers’ apparel consumption, or 0.2% of the total per capita
spending. A 5-6% impact is significant in our view given the US apparel market had a
sales CAGR of 1-2% in the past decade.
2. If an OEM making OP margin of 15% (integrated player producing both fabric and
garment) shares 10% of the additional duties, it would imply a 30% hit to profits per
our calculation.
3. If an OEM shares 20% of the additional duties, we estimate earnings will be hurt by
60%.
Exhibit 3: For a cotton T-shirt sold at USD12 per piece, we estimate FOB price at c.US$3.0
Apparel value chain
Source: US ITC, Goldman Sachs Global Investment Research.
Garment FOB, $3.00
Current duty, $0.50
Other handing fee/freight,
$0.11
Wholesaler's GP, $3.00
Retailer's GP, $5.40
$0.00
$2.00
$4.00
$6.00
$8.00
$10.00
$12.00
Apparel value chain, assuming retail ASP of US$12
Retail ASP US$12

December 1, 2016 Asia Pacific: Textile, Apparel & Footwear
Goldman Sachs Global Investment Research 6
Exhibit 4: If additional duties are fully passed on, we estimate retail ASP will rise by 11%. If
OEMs absorb 10-20% of additional duties, assuming an OPM of 15%, we expect earnings
to be hit by 30-60% Scenario analysis on retail price and OEMs’ profits
Source: US ITC, Goldman Sachs Global Investment Research.
Exhibit 5: Assuming OEMs absorb 20% of the additional duties on US imports from China,
NI would decline 1-48% within our coverage NI analysis if OEMs share 20% of the additional duties
Source: Company data, Goldman Sachs Global Investment Research.
In addition to NI impact, if PE de-rates due to earnings cut and slower NI growth, implied
valuations will lower. Assuming lower NI based on 20% sharing of the additional duties
and lower PE multiples, implied valuations for our OEM coverage slide 20-55%.
T‐Shirt made of cotton
Imported garment value chain
Garment FOB $3.00
Current duty $0.50
Other handing fee/freight $0.11
Wholesaler's GP $3.00
Retailer's GP $5.40
Retail price / piece $12.00
Current duty for import to US
without trade benefits 16.5%Additional duty of 45% imposed
on China import 45%
Additional duty per piece $1.35
OEM's OPM (Garment + fabric) 15.0%
OEM's OP / piece $0.45
Scenario 1) additional duty fully refected on retail ASP, impact on consumers
New retail price / piece $13.35
Upside vs original retail price 11.3%
Scenario 2) OEMs take 10% of the hit from additional duties
OEM's new OP / piece $0.32
vs original OP ‐30.0%
New OPM 10.5%
vs original OPM ‐4.5%
Scenario 3) OEMs take 20% of the hit from additional duties
OEM's new OP / piece $0.18
vs original OP ‐60.0%
New OPM 6.0%
vs original OPM ‐9.0%
US sales as % of total sales China as % of total production OPM
Using 2015 as reference 2018E 2018E 2018E
Shenzhou 13% 71% 23% ‐4%
Yue Yuen 35% 19% 7% ‐7%
Eclat 58% 3% 20% ‐1%
Stella 53% 60% 6% ‐48%
Makalot 77% 8% 8% ‐6%
NI impact

December 1, 2016 Asia Pacific: Textile, Apparel & Footwear
Goldman Sachs Global Investment Research 7
Exhibit 6: Potential impact on valuations Implied valuations assuming OEMs share 20% of the additional duties and PE multiples de-rate
Source: Datastream, Goldman Sachs Global Investment Research.
US heavily reliant on imports; challenges in moving back production
US imported 97% of its apparel/footwear consumption in 2015
We believe a large-scale production move back to the US would be difficult given higher
costs and a lack of labor supply. US textile industry workers earn an hourly salary of
c.US$19 vs the minimum wage of c.US$2 in China, or total hourly salary of c.US$3-4. There
are only 0.3m workers in the US textile industry vs 23m in China and 2.5m in Vietnam.
US imported 97% of its apparel/footwear consumption in 2015. China is the largest
exporter to the US, accounting for 39%/63% of total US apparel/footwear imports in 2015.
Due to rising costs and a shrinking labor supply in China, China has been losing its cost
advantage while Vietnam has been consistently gaining share in recent years.
Exhibit 7: China accounts for the highest imports to the
US for apparel, but the ratio is declining… US apparel import breakdown by country
Exhibit 8: … same for footwear import
US footwear import breakdown by country
Source: ITA.
Source: Eurostat.
NI impact on OEMs under our coverage, if assuming OEMs absorb 20% of the additional duties
GS target multiple TP Current PE
(X) (LLC) (X)Average since
2011 +1SD ‐1SD
Ave. PE since
2011PE +1SD PE ‐1SD
Ave. PE since
2011PE +1SD PE ‐1SD
Shenzhou 18 58.0 16 12.1 15.7 8.4 37.4 48.8 26.1 ‐35% ‐16% ‐55%
Yue Yuen 13 33.0 12 12.0 13.4 10.6 29.2 32.7 25.8 ‐11% ‐1% ‐22%
Eclat 18 340.0 20 18.7 28.5 8.8 349.4 532.5 164.4 3% 57% ‐52%
Stella 14 13.7 14 16.4 19.3 13.4 8.7 10.2 7.1 ‐36% ‐25% ‐48%Makalot 14 111.0 16 17.1 22.7 11.6 131.7 174.8 89.3 19% 57% ‐20%
Implied valuation based on Change vs current TPPE
0%
10%
20%
30%
40%
50%
60%
70%
80%
90%
100%
2000
2001
2002
2003
2004
2005
2006
2007
2008
2009
2010
2011
2012
2013
2014
2015
9M16
US apparel import breakdown
China Vietnam CAFTA Indonesia Bangladesh
NAFTA India EU Others
0%
10%
20%
30%
40%
50%
60%
70%
80%
90%
100%
2010
2011
2012
2013
2014
2015
9M16
US footwear import breakdown
China Vietnam Indonesia Italy India
Mexico CAFTA-DR Bangladesh Others

December 1, 2016 Asia Pacific: Textile, Apparel & Footwear
Goldman Sachs Global Investment Research 8
Exhibit 9: Vietnam is consistently gaining share in the US apparel import… Yoy value change for apparel import to the US by country
Source: ITA.
Exhibit 10: …same for footwear market
Yoy value change for footwear import to the US by country
Source: ITA.
Cost structure and labor supply drive production base allocation
China’s rising production costs (labor and utility) and difficulties in recruiting workers in
labor-intensive manufacturing industries are making it gradually lose its cost advantage to
other emerging countries including ASEAN. Vietnam has been the biggest beneficiary on
the back of lower costs, labor supply, government support, preferential duty treatment, and
access to upstream material supplies. Not only are downstream garment factories moving
to Vietnam, we see upstream/integrated players including Shenzhou, Far Eastern New
Century (1402.TW), Formosa Group investing. A better industry cluster for textile industry
would also help drive cost efficiency and lead-time management for all players.
Even though labor costs in ASEAN countries including Vietnam have risen by 15-20%
CAGR in recent years, the cost advantage still persists. For example, we estimate
Shenzhou’s production costs in Vietnam are c.20% lower than China assuming similar
productivity (Exhibit 15).
YoY 2005 2006 2007 2008 2009 2010 2011 2012 2013 2014 2015 9M16
Total 6% 4% 3% -3% -12% 13% 9% -1% 4% 2% 4% -5%
China 70% 22% 23% 1% 3% 19% 5% -1% 2% 0% 3% -9%Vietnam 6% 18% 35% 20% -3% 16% 13% 7% 14% 14% 14% 2%CAFTA -4% -8% -6% -4% -19% 14% 12% -1% 1% 4% 2% -1%Indonesia 20% 28% 8% 1% -4% 15% 14% -2% 1% -3% 2% -3%Bangladesh 20% 23% 6% 11% -1% 15% 15% -1% 11% -2% 12% 1%NAFTA -10% -12% -15% -14% -18% 4% 7% -2% 0% 2% -4% -7%India 34% 7% -1% -3% -7% 9% 7% -8% 6% 6% 8% 0%EU -9% -4% 6% -8% -32% 5% 22% 7% 8% 10% -4% -5%Others -10% -3% -10% -12% -30% 4% 9% -4% 2% 2% 3% -7%
YoY 2011 2012 2013 2014 2015 9M16
Total 9% 5% 4% 5% 6% -8%
China 6% 2% -1% 0% 1% -15%Vietnam 25% 18% 21% 23% 22% 10%Indonesia 28% 23% 23% 6% 16% -2%Italy 24% 8% 11% 9% -2% -3%India 8% 34% 10% 18% 32% 12%Mexico 21% 30% 12% -8% 0% -17%CAFTA-DR 39% 22% 4% 13% 14% 0%Bangladesh 177% 16% 25% 84% 71% -4%Others -3% -3% 6% 17% 15% 9%

December 1, 2016 Asia Pacific: Textile, Apparel & Footwear
Goldman Sachs Global Investment Research 9
Exhibit 11: Labor cost differences remain big, driving
production allocation Min. wage comparison across different countries - 2015
Exhibit 12: Labor costs rising significantly in ASEAN Min. wage increase, 2009-2015 CAGR
Source: CEIC
Source: CEIC
Exhibit 13: Shrinking youth also implies a smaller worker base in China
Population distribution by year born, indexed to 1970s, China vs Vietnam
Source: Euromonitor
0 100 200 300 400 500
ChinaVietnam
IndonesiaThailand
PhilippinesMalaysiaCambodia
BangladeshIndiaLaos
MexicoHondurasEl Salvador
TurkeyMoroccoTunisia
Min monthly wage (US$, 2015)
‐5% 0% 5% 10% 15% 20% 25%
China
Vietnam
Indonesia
Thailand
Philippines
Cambodia
Bangladesh
India
Laos
Mexico
Honduras
El Salvador
Turkey
Morocco
TunisiaMin wage: 2009‐2015 CAGR
2000s
2000s1990s
1990s
1980s
1980s
1970s 1970s1960s
1960s
1950s
1950s
1940s
1940s1930s 1930s
0%
20%
40%
60%
80%
100%
120%
140%
China Vietnam

December 1, 2016 Asia Pacific: Textile, Apparel & Footwear
Goldman Sachs Global Investment Research 10
Exhibit 14: China is expensive, not only for labor, but also
for utility costs Water and electricity costs comparison, China vs Vietnam
Exhibit 15: We estimate Shenzhou can save c.20% of
COGS from lower labor and utility costs if productivity in
Vietnam is at a level similar to China COGS comparison
Source: CEIC
Source: Company data, Goldman Sachs Global Investment Research.
Free trade agreements impact sourcing strategies
Apparel products are subject to import tariffs in the US market ranging from 0% to 32%
while footwear import duties range from 0% to 48%, depending on material, product type,
and import value (exhibit 16). Brands/retailers pay duties with various free trade
agreements and cost structures impacting their sourcing strategies.
There are various FTAs globally/regionally (Exhibit 17). In the US, only c.15% of apparel
import was duty free in 2015. Of these, CAFTA-DR accounted for 62% of duty-free imports
to the US, followed by NAFTA (21%). The major apparel countries that the US imports from,
including China, Vietnam, Indonesia, and Bangladesh (60% of US imports), do not have any
preferential duty treatment in the US.
‐
5
10
15
20
25
30
35
40
Yarn
Accessories
Other raw
materials
Labour
Utility
Depreciation
Others
Current (mostly China) In Vietnam

December 1, 2016 Asia Pacific: Textile, Apparel & Footwear
Goldman Sachs Global Investment Research 11
Exhibit 16: Apparel/footwear imports into the US incur 0-32%/0-48% duties, depending on material, type and value Illustration of US apparel/footwear import duties on different categories
Source: US ITC.
Exhibit 17: Below we highlight the major global free trade agreements (FTA). In addition to these, there are FTAs
between countries like Bangladesh/Cambodia/Vietnam and the EU
Source: Goldman Sachs Global Investment Research.
Tariffs % HS Chapter/subheading US
Apparel 61-62 0 - 32 *-Women's or girls' blouses and shirts, knitted or crocheted
- Silk 6106.90.15 0.9 - 5.6- Wool 6106.90.10 13.6- Cotton 6106.10.00 19.7- Man-made fibers 6106.20 14.9 - 32-T-shirts, singlets, tank tops and similar garments, knitted or crochete
- Silk 6109.90.40 2.6- Wool 6109.90.15 5.6- Cotton 6109.10.00 16.5- Man-made fibers 6109.90.10 32-Men's or boys' shirts
- Silk 6205.90.10/6205.90.30 1.1 -7.1- Wool 6205.90.05/6205.90.07 9.2 - 17.5- Cotton 6205.20 8.7 - 19.7- Man-made fibers 6205.30 12.2 - 25.9%+29.1¢/kg-Jeans 6201- 6204 8.2 - 16.6
Footwear 64 0 - 48- Footwear with outer soles of rubber, plastics, leather or composition leather and uppers of leather
- Sports footwear 6403.12/ 6403.19 0 - 10- Others 6403.40/ 6403.51/ 6403.59/ 6403.91/ 6403.99 0 - 10- Footwear with outer soles of rubber, plastics, leather or composition leather and uppers of textile materials
- Sports footwear 6404.11 7.5 - 48 *- Others 6404.19 7.5 - 48*Depend on raw materials/types of apparel or footwear/import value; lower for silk and higher for man-made fibers generally in apparel category;lower for vegetable fibers/leather and higher for other materials generally in footwear category

December 1, 2016 Asia Pacific: Textile, Apparel & Footwear
Goldman Sachs Global Investment Research 12
Exhibit 18: Only c.15% of apparel imports into the US are under FTA and enjoy preferential
duty treatment US apparel imports by FTA—2015
Source: USFIA
Near-term uncertainty, but longer-term concerns overdone
Although uncertainty in the near term will likely impact brands’ sourcing strategies and
impact the cost advantage among different production bases, investor concerns over the
longer-term appear overdone. Key points to consider:
Costs in China are high, in terms of labor and utility, which implies production moving out to
lower cost ASEAN countries is unlikely to reverse.
Costs in the US are even higher with labor in short supply, making a large-scale production move
to the US difficult unless there is a break-through in automation technology.
Additional duties’ impact on consumers’ spending power and OEMs’ margins could be significant,
hurting overall retail market and brands’ profitability.
a. An additional tariff of 35-45% on China/Mexico imports implies 5-6% cost increase
for consumers’ apparel consumption, assuming all else equal. If the additional
duties are fully passed on, it could impact consumer spending power in the US.
b. Given leading OEMs are making 5-20% OPM (in 2015), our analysis shows that
sharing of additional duties will impact some players’ NI significantly (for example,
Stella; Exhibit 5) . If the additional duties are not passed on, we could see huge
margin contractions leading to more aggressive industry consolidation.
How bad can it get from here?
1. If US brands/retailers further destock before a clearer picture emerges on trade policies,
companies suffering from slower order growth from the US, especially from retailers, could see more pressure.
CAFTA FTA62%
NAFTA FTA21%
Jordan FTA6%
QIZ‐Egypt6%
Peru FTA2%
South Korea FTA1%
Colombia FTA1% Others
1%
US FTA World Apparel Imports 2015

December 1, 2016 Asia Pacific: Textile, Apparel & Footwear
Goldman Sachs Global Investment Research 13
2. If additional duties are imposed on imports from China, suppliers in China will get hurt
while production moving out from China will accelerate.
3. If US officially withdraws from the TPP and China is not subject to additional duties,
competition may intensify as some Chinese local players may survive for a bit longer
as they won’t have duty disadvantage. But, YTD data suggests that China’s exports to
the US dropped the most among major countries although a depreciating RMB favors
Chinese makers.
Long-term industry trends appear intact
Key industry development trends remain unchanged or may speed up, favoring leading
players:
Brands like Nike, Adidas have been highlighting their investments in automation. OEMs with the
ability to work with brands on further cost efficiency improvement will likely gain shares.
OEMs with multi-national operations will have better capabilities to accommodate brands’
sourcing strategies, in our view.
Based on our conversation with OEMs, we summarize several key strategies:
Vietnam remains an important country for future investment given its cost advantage, industry
supply chain, trade benefit (i.e. EU).
OEMs are also surveying other countries like Myanmar, Laos, etc. to diversify risks.
Without TPP, production allocation for different items will be re-organized because synthetic
materials were to get higher duty savings under the TPP framework. OEMs can potentially re-
arrange production lines based on scale or manufacturing costs.
Investment in automation, production efficiency improvement, and materials will continue to
drive differentiation and enable share gains, in our view.
Exhibit 19: Vietnam is still small in terms of apparel export to EU (3% in 2015), but could
pick up if an FTA is signed in 2018 EU apparel import breakdown by country
Source: Eurostat.
0%
10%
20%
30%
40%
50%
60%
70%
80%
90%
100%
2002
2003
2004
2005
2006
2007
2008
2009
2010
2011
2012
2013
2014
2015
8M16
EU apparel import breakdown
Others
Tunisia
Morocco
Cambodia
Vietnam
India
Turkey
Bangladesh
China

December 1, 2016 Asia Pacific: Textile, Apparel & Footwear
Goldman Sachs Global Investment Research 14
Earnings revisions and valuation
Our top pick among OEMs is Shenzhou. We believe Shenzhou is the most defensive OEM
as it has the lowest exposure to the US, a balanced market/client base, is gaining market
share in key accounts, and has potential for margin upside from product mix and Vietnam
capacity ramp-up. We reiterate Buy on Shenzhou and add it to our Conviction List as we
note increased upside following the recent market pullback (down 10% over last three
months vs. the Hang Seng index down 0.4%). We also like Yue Yuen and upgrade it to Buy
from Neutral given its stabilized margin trend, balanced market/clients mix, and rising
contribution from Pou Sheng. We downgrade Eclat on Neutral from Buy, as we forecast
earnings recovery from 4Q16 to be lower than what we had previously expected due to
uncertainties in global trade and US retailers’ destocking. Moreover, we believe this
recovery is already priced in with its shares currently trading at 20.5X vs. its historical
average of 19X (since 2011). Li & Fung, Stella and Makalot remain more challenging given
high casual/fashion and private label clients’ exposure. However, we remain Neutral-rated
on Li & Fung and Stella as valuations appear fair at current levels. We maintain Sell on
Makalot as its private label clients (Kohl’s and Target) could see significant order
contraction due to muted sales growth.
In this note, we roll over our valuation base from 2017/18PE average to 2018 PE. Our PE
multiples still take into account EPS growth and CROCI, and are benchmarked to global
peers.
Shenzhou (CL-Buy; TP: HK$58): Most defensive OEM with solid
brand/market exposure
We reiterate our Buy on Shenzhou and add it to our regional Conviction list. We think the
13% pullback in its share price since its Sept. peak, driven by market concerns over global
trade and demand, offers a good opportunity to accumulate. Shenzhou is the most
defensive name among our covered exporters due to: 1) balanced market exposure with
less exposure to the US (10% in 1H16); 2) strong client mix and share gains; 3) integrated
business model to support clients’ short lead-time orders; 4) volume growth with rising
contribution from Vietnam capacity; 5) margin upside from product mix and cost mgmt.
We expect EPS growth of 24%/20% in 2H16 and 2017E. We fine tune 2016-18E EPS by -
0.5%-2% to factor in latest FX trend. Our 12-m TP rises to HK$58 from HK$56 as we roll
over to 2018. Our target multiple remains 18x, benchmarked vs global peers on earnings
growth and CROCI. Risks: 1) Slower sportswear demand growth, 2) higher-than-expected
labor costs increase, 3) slower ramp-up in production in Vietnam, 4) FX.
Yue Yuen (Buy; TP: HK$33): Stabilized margins and rising
contribution from Pou Sheng
We upgrade Yue Yuen to Buy from Neutral on: 1) stabilized operations with decent
margin improvement from 4Q15, after relocation issues dragged down efficiency in China;
2) balanced client and market exposure for OEM business; 3) rising contribution from
Pou Sheng. We fine tune our 2016-18E EPS by 1-5% to factor in the latest 3Q16 result and
FX trend (RMB against USD at 6.9 from 4Q16-2017). Our 12-month SOTP-based target price
is unchanged at HK$33. We roll over our valuation base to 2018E and derive our target
price by applying 14X P/E to value Pou Sheng (down from 16X, as we believe the easiest
path to margin expansion, from 4.2% in 2015 to 6.5% in 2016E, is almost done and further
re-rating to previous peak PE of 16X requires stronger execution on margin beat in our
view) and 13X P/E (unchanged) to the OEM business. Risks: 1) Worse-than-expected
production efficiency in China, 2) weaker-than-expected volume growth in sports and
casual shoes, 3) rising raw material costs in the near term, and 4) lower contribution from
Pou Sheng.
December 1, 2016 Asia Pacific: Textile, Apparel & Footwear
Goldman Sachs Global Investment Research 15
Eclat (Neutral; TP: TW$340): EPS recovery priced in
We downgrade Eclat to Neutral from Buy. While EPS growth is likely to recover from 4Q16
at 4% yoy vs -23% in 9M16, we believe the magnitude of this recovery will be smaller than
what we had previously anticipated (15% yoy in 4Q16E), thanks to uncertainties in global
trade and US retailers’ destocking. Historically, Eclat’s growth is supported by both decent
ASP and volume growth. We believe its ASP trend is still solid backed by its strong R&D
capabilities and management’s efforts to improve vertical integration in order to drive
garment ASP and overall margins. However, we expect volume growth will be slower,
impacted by retail clients. Net net, we expect 15%/23% OP/NI growth in 2017 vs -3%/-15% in
2016. Since we upgraded the stock to Buy on Aug 7th, 2015, its share price has dropped
25% vs the TWSE up 9%. We attribute this to investors’ concerns on US retailers’
restocking demand and continued weak traffic seen at malls/department stores.
We cut our EPS estimates by 6-17% in 2016E-18E, factoring in slower sales growth and
lower-than-expected margin expansion. Accordingly, we cut our 12m target price from
NT$410 to NT$340, based on our lower earnings estimates and a lower target multiple of
18x (20x previously) to reflect its slower growth (20% NI CAGR in 2016-18E vs previous
estimate of 27%). We also roll over our valuation base from average of 2017-2018 to 2018.
Risks: 1) Stronger/weaker restocking demand from retail clients, 2) more/less adoption of
new materials, 3) new clients, 4) better/worse vertical integration, 5) FX.
Li & Fung (Neutral; TP: HK$3.50): Muted demand environment, but
strong cash generation
We maintain Neutral on Li & Fung. As a sourcing agent with a vast network of suppliers in
multiple countries, L&F is well-positioned to increase its value-add to customers given the
tariff uncertainties. Technically, it should not be subject to any duty changes being a
sourcing agent. At the same time, L&F’s margins comprise both a commission rate from
customers and a rebate from factories. However, given the whole supply chain could be
subject to changes, it may not be completely immune to margin pressure. Deflationary
pressure (at FOB price) usually translates to persistent pressure on revenue and margins
(from de-leveraging). Therefore, we lower our 2016E-18E EPS by 19% to 25% to factor in
lower topline growth and lower core operating profit (COP) margins. Accordingly, we lower
our 12m DCF-based target price from HK$4.90 to HK$3.50 using a terminal COP margin of
2.6% (down from 3%) and 1.5% terminal growth (down from 2.6%). Risks: 1) Better/worse
operating leverage, 2) stronger/weaker US retail environment, and 3) more/less pressure
on commission rates.
Stella (Neutral; TP: HK$13.7): NI uptick on aggressive cost cutting
We maintain Neutral on Stella with a higher 12-m TP of HK$13.7 (HK$12.0 prior) as we roll
over our valuation base and change to 14X 2018E target PE vs. 13X 2017E/18E average PE
to better reflect its earnings growth potential as a result of its aggressive cost cutting
stance. We also raise 2016E-18E EPS by 2-5% on the back of management’s cost cutting
initiatives. While casual footwear (c.85% of sales in 2015) outlook remains muted, we
expect Stella’s sports footwear volume will continue its strong growth, reaching 33% of
total sales volume in 2018E vs. 17% in 2015. We forecast NI to recover at 6%/10% yoy in
2017E/18E on the back of flattish sales growth but improving margins from better
productivity and lower costs/OPEX, after declining 26% yoy in 2016E. Risks: 1)
Faster/slower growth in dress/casual shoes, 2) better/weaker efficiency in new capacities, 3)
FX.

December 1, 2016 Asia Pacific: Textile, Apparel & Footwear
Goldman Sachs Global Investment Research 16
Makalot (Sell; TP: TW$111): Private label clients still a drag
We remain Sell-rated on Makalot given 1) lower visibility of client orders due to weak performance of retail clients (Kohl’s and Target) and some fashion brands (Gap); 2) unfavorable product mix as new products/clients take time to contribute
meaningfully; 3) margin contraction as management targets to secure volumes through
price cuts. We cut our 2016-18E EPS by 0%-6% to factor in price cuts and margin
contraction. Accordingly, we revise our 12m target price down from NT$114 to NT$111. We
roll over our valuation to 2018E, but maintain our PE multiple at 14X. Risks: 1) Stronger
apparel consumption, 2) faster capacity ramp-up at the new sportswear plant in Vietnam, 3)
better product mix, 4) higher contribution from new clients, 5) FX.
Exhibit 20: Earnings revision summary Greater China exporters’ earnings revision vs. consensus
Source: Company data, Goldman Sachs Global Investment Research.
Exhibit 21: 12m TPs for our Greater China exporters: CL-Buy on Shenzhou, Buy Yue Yuen, Neutral on Eclat 12-m TP revision summary
Source: Company data, Datastream Goldman Sachs Global Investment Research.
EPS % % % GSe vs. Consensus
Ticker Currency New Old chg New Old chg New Old chg 16E 17E 18E 16E 17E 18E 16E 17E 18E
Exporters
Shenzhou 2313.HK Rmb 1.68 2.13 2.14 -0.5% 2.57 2.52 2.1% 2.86 2.80 2.0% 27% 20% 11% 4% 5% 0% 2.05 2.44 2.86Eclat 1476.TW NT$ 15.52 13.18 14.05 -6.2% 16.26 18.20 -10.7% 18.84 22.69 -17.0% -15% 23% 16% -1% -2% -7% 13.3 16.6 20.2Makalot 1477.TW NT$ 10.48 7.64 7.64 0.0% 7.20 7.50 -3.9% 8.19 8.74 -6.3% -27% -6% 14% -10% -12% -14% 8.4 8.2 9.6 Yue Yuen 0551.HK US$ 0.24 0.30 0.28 4.9% 0.31 0.30 1.3% 0.34 0.34 0.8% 25% 4% 10% 4% 0% -9% 0.29 0.31 0.33Stella 1836.HK US$ 0.15 0.11 0.11 5.0% 0.12 0.12 2.4% 0.13 0.13 2.2% -26% 6% 10% 5% 0% -13% 0.11 0.12 0.13Li & Fung 0494.HK US$ 0.05 0.03 0.04 -22.1% 0.03 0.04 -18.8% 0.03 0.04 -24.8% -36% 4% -3% -10% -9% -16% 0.04 0.04 0.04
Consensus2015 2016E 2017E 2018E YoY%
Valuations (on 2018E EPS)
New target
P/E (X)
Old target
P/E (X)
2018E
EPSCurr
12m TP
(New)
Price
Nov-29
Up/down
sideRating (New) TP (Old)
TP
change
Rating
(Old)
Exporters
Shenzhou 18 18 3.21 HK$ 58.00 47.00 23% Buy* 56.00 4% BuyYue Yuen 13 14 2.62 HK$ 33.00 27.75 19% Buy 33.00 0% NeutralEclat 18 20 18.84 NT$ 340.00 325.50 4% Neutral 410.00 -17% BuyLi & Fung *14 15 0.25 HK$ 3.50 3.39 3% Neutral 4.90 -29% NeutralStella 14 13 1.01 HK$ 13.70 13.46 2% Neutral 12.00 14% NeutralMakalot 14 14 8.19 NT$ 111.00 118.00 -6% Sell 114.00 -3% SellNote: We refer to implied P/E for Li & Fung and Yue Yuen, as they are based on DCF valuation and SOTP, respectively. For Yue Yuen, we use 13X/14X 2018E target P/E for OEM/retail business (Pou Sheng)*denotes that the stock is on our Conviction List

Decem
ber 1, 2016 A
sia Pacific: Textile, Apparel &
Footwear
Goldm
an Sachs Global Investm
ent Research
17
Exhibit 22: Peers’ valuation
*denotes stock is on our regional Conviction List; all target prices mentioned above are on a 12-month timeframe. NC=Not Covered; NA=Not Applicable.
Source: Company data, Goldman Sachs Global Investment Research.
Stock Market cap Price Pricing TargetPotentialupside/ P/B (X) ROE
DivYield
FCF Yield
EV/EBITDA
(X)Net debt/Equity CROCI
Company Ticker Rating (US$mn) 29-Nov-2016 currency Price downside 2016E 2017E 2018E 2016 2017E 2018E 2016E 2017E 2018E 2016E 2017E 2018E 2017E 2017E 2017E 2017E 2017EChina sports brands & apparel/footwear OEMs
Shenzhou International Group 2313.HK Buy* 8,477 47.00 HKD 58.0 23% 27% 20% 11% 19.6 16.3 14.6 4.0 3.5 3.1 21% 23% 22% 3.3% 3% 11.7 -13% 24%Pou Sheng International Holdings 3813.HK Buy 1,600 2.33 HKD 3.0 29% 60% 16% 21% 15.4 13.2 10.9 1.8 1.6 1.5 12% 13% 14% 1.7% 8% 7.3 -7% 12%Yue Yuen Industrial 0551.HK Buy 5,907 27.75 HKD 33.0 19% 25% 4% 10% 12.0 11.6 10.6 1.2 1.2 1.1 11% 11% 11% 5.2% 7% 6.8 -9% 10%Li Ning Co. 2331.HK Buy 1,003 5.68 HKD 6.5 14% NM 11% 31% 20.8 18.7 14.2 2.7 2.3 1.9 16% 16% 18% 0.0% 5% 8.9 -34% 12%Eclat Textile Co. 1476.TW Neutral 2,755 325.50 TWD 340.0 4% -15% 23% 16% 24.7 20.0 17.3 5.8 5.2 4.6 26% 27% 28% 3.5% 3% 13.3 -32% 26%Anta Sports Products 2020.HK Neutral 6,895 21.45 HKD 22.6 5% 16% 17% 10% 20.1 17.2 15.6 5.1 4.7 4.3 27% 29% 29% 4.1% 5% 12.9 -62% 26%Belle International Holdings 1880.HK Neutral 4,828 4.44 HKD 4.7 6% 4% -1% -5% 10.2 10.2 10.7 1.2 1.2 1.1 13% 12% 11% 6.0% 6% 5.1 -27% 14%Li & Fung 0494.HK Neutral 3,652 3.39 HKD 3.5 3% -36% 4% -3% 13.5 12.9 13.4 1.4 1.4 1.4 11% 11% 11% 6.8% 6% 7.5 0% 9%Stella International Holdings 1836.HK Neutral 1,378 13.46 HKD 13.7 2% -26% 6% 10% 15.4 14.6 13.3 1.4 1.4 1.4 9% 10% 10% 6.9% 5% 9.2 -13% 11%Makalot Industrial Co 1477.TW Sell 765 118.00 TWD 111.0 -6% -27% -6% 14% 15.4 16.4 14.4 2.8 2.8 2.6 18% 17% 19% 5.3% 6% 10.6 -16% 19%Median 4% 8% 11% 15.4 15.4 13.8 2.3 2.0 1.7 15% 15% 16% 4.6% 5.4% 9.0 -14% 13%
Apparel OEM/ODM peers
Regina Miracle 2199.HK NC 1,214 7.69 HKD NA NA -61% 80% 72% 47.5 26.4 15.4 3.4 3.1 2.6 11% 12% 18% 0.9% NA 17.9 17% NALuen Thai 0311.HK NC 428 3.21 HKD NA NA 91% 31% NA 18.0 13.8 NA 1.1 1.0 NA 6% 7% NA 2.4% NA 2.6 NA NAPacific Textiles 1382.HK NC 1,675 8.98 HKD NA NA -5% 5% 8% 12.6 12.0 11.1 3.9 3.9 3.8 31% 33% 36% 8.2% NA 9.4 -18% NATexwinca 0321.HK NC 1,003 5.63 HKD NA NA -13% -22% 3% 9.7 12.5 12.1 1.3 1.3 1.3 12% 10% 10% 8.9% NA 6.1 -40% NABest Pacific 2111.HK NC 843 6.36 HKD NA NA 25% 18% 26% 15.1 12.8 10.2 3.2 2.8 2.4 23% 23% 25% 2.6% NA 10.0 3% NADe Licacy 1464.TW NC 233 26.70 TWD NA NA NA NA NA NA NA NA NA NA NA NA NA NA NA NA NA NA NAEverest Textile 1460.TW NC 255 17.25 TWD NA NA 10% NA NA 15.2 NA NA 1.6 NA NA 10% NA NA NA NA NA NA NAYoungone 111770.KS NC 1,056 27,900 KRW NA NA 6% 9% 12% 9.0 8.2 7.3 1.0 0.9 0.8 11% 11% 11% 0.7% NA 5.3 -7% NAHansae 105630.KS NC 764 22,350 KRW NA NA -20% 16% 13% 12.2 10.5 9.3 1.8 1.6 1.4 16% 16% 16% 1.1% NA 8.9 34% NAWillbes 008600.KS NC 128 2,635 KRW NA NA NA NA NA NA NA NA NA NA NA NA NA NA NA NA NA NA NAPan Brothers PBRX.JK NC 208 434 IDR NA NA NM NA NA 11.4 NA NA 1.0 NA NA 9% NA NA NA NA 6.0 NA NAMedian 1% 16% 13% 12.6 12.5 10.7 1.6 1.6 1.9 11% 12% 17% 2.4% NA 7.5 -2% NA
Global apparel brands- Casual & fashion
Global Brands Group 0787.HK Buy 1,215 1.14 HKD 1.40 23% 9% 88% 55% 18.0 9.5 6.2 0.5 0.5 0.4 3% 5% 7% 0.0% 13% 6.5 30% 5%L Brands Inc. LB Buy 20,885 71.8 USD 86.0 20% -6% 4% 15% 19.4 18.7 16.2 NA NA NA NA NA NA 3.7% 3% 9.3 NA 16%Inditex ITX.MC Buy* 106,315 32.2 EUR 37.0 15% 12% 11% 12% 31.7 28.5 25.4 7.9 7.1 6.4 26% 26% 27% 2.3% 3% 16.2 -53% 14%Ralph Lauren Corp. RL Buy* 9,727 110.9 USD 127.0 15% -15% 2% 12% 19.5 19.0 17.0 2.6 2.5 2.3 13% 13% 14% 1.5% 4% 9.4 -13% 11%Urban Outfitters Inc. URBN Neutral 4,230 32.4 USD 36.0 11% 9% 11% 9% 16.8 15.1 13.8 2.9 2.6 2.3 19% 18% 18% 0.0% 6% 6.2 -26% 12%Gap Inc. GPS Neutral 10,804 25.5 USD 27.0 6% -19% 2% 3% 12.9 12.5 12.2 3.5 3.0 2.7 29% 26% 23% 3.0% 7% 5.0 -10% 11%Hennes & Mauritz HMb.ST Neutral 48,067 267.9 SEK 275.0 3% -11% 14% 10% 24.1 21.2 19.2 7.3 6.8 6.2 31% 33% 34% 3.8% 3% 12.2 -5% 10%PVH Corp. PVH Neutral 8,775 108.1 USD 108.0 0% -5% 7% 10% 16.2 15.2 13.7 1.8 1.6 1.5 11% 11% 11% 0.2% 6% 9.6 38% 12%Fast Retailing 9983.T Neutral 36,467 40,200 JPY 34,000 -15% -25% 53% 8% 57.2 37.3 34.6 6.9 6.1 5.5 11% 17% 17% 0.9% 2% 18.5 -14% 12%American Eagle Outfitters Inc. AEO Sell 3,575 18.4 USD 12.0 -35% 13% -6% -1% 15.6 16.6 16.7 2.8 2.5 2.3 19% 16% 15% 3.3% 6% 5.9 -39% 12%Median -6% 9% 10% 18.7 17.6 16.5 2.9 2.6 2.3 19% 17% 17% 1.9% 5% 9.3 -13% 12%
Global sportwear & functional brands
adidas ADSGn.DE Buy 29,418 137.6 EUR 181.0 32% 42% 15% 19% 27.5 24.0 20.1 4.4 3.9 3.5 17% 17% 18% 1.7% 2% 12.8 4% 14%Nike Inc. NKE Buy 86,941 51.0 USD 62.0 22% 10% 8% 13% 22.9 21.2 18.8 6.8 6.5 6.1 31% 32% 34% 1.5% 4% 14.1 -23% 24%Columbia Sportswear Co. COLM Buy* 4,174 59.6 USD 71.0 19% 8% 10% 11% 22.5 20.5 18.4 2.7 2.4 2.2 13% 13% 13% 1.2% 4% 9.8 -36% 17%Under Armour Inc. UA Neutral 13,334 31.2 USD 35.0 12% 21% 13% 13% 49.0 43.3 38.2 6.7 5.8 5.0 15% 15% 14% 0.0% -2% 19.8 32% 18%VF Corp. VFC Buy 24,192 56.9 USD 63.0 11% 2% 11% 14% 18.1 16.4 14.4 4.8 5.0 4.9 26% 29% 33% 2.8% 5% 11.4 39% 20%Puma PUMG.DE Neutral 3,700 234.0 EUR 242.0 3% 59% 57% 29% 59.4 37.9 29.4 2.1 1.9 1.8 4% 5% 6% 0.4% 2% 13.2 -18% 10%Asics Corp. 7936.T Buy 4,115 2,434.0 JPY 2,500.0 3% 26% 22% 13% 35.8 29.2 26.0 2.2 2.1 2.0 6% 7% 8% 1.2% 3% 11.2 -21% 8%lululemon athletica inc. LULU Sell 8,121 57.2 USD 46.0 -20% 10% 10% 9% 28.0 25.4 23.4 0.0 0.2 3.7 25% 22% 20% 0.0% 2% 13.2 -51% 25%Median 16% 12% 13% 29.3 25.2 22.4 3.8 3.7 3.5 14% 14% 13% 1.2% 4% 12.3 -19% 18%
US department stores & discount stores
TJX Cos. TJX Buy 52,727 78.7 USD 89.0 13% 5% 6% 11% 22.5 21.2 19.0 11.5 11.1 10.5 53% 54% 58% 1.4% 4% 10.9 6% 26%Burlington Stores Inc. BURL Buy 6,234 87.4 USD 98.0 12% 37% 21% 18% 28.0 23.2 19.7 NA NA NA NA NA NA 0.0% 6% 10.7 NA 12%Macy's Inc. M Neutral 13,284 43.1 USD 44.0 2% -15% 17% -6% 13.2 11.3 12.0 3.3 3.5 3.5 25% 30% 29% 3.5% 8% 6.3 202% 8%Ross Stores Inc. ROST Neutral 27,263 68.4 USD 69.0 1% 12% 12% 13% 24.5 21.8 19.3 9.7 7.9 6.4 42% 40% 37% 0.8% 5% 11.1 -33% 38%Nordstrom Inc. JWN Neutral 9,850 56.1 USD 49.0 -13% -6% 5% 5% 18.6 17.7 16.8 8.4 7.0 5.9 50% 44% 38% 2.7% 4% 6.9 124% 12%Kohl's Corp. KSS Sell 9,848 54.1 USD 35.0 -35% -2% -7% -8% 13.7 14.8 16.0 1.9 1.7 1.7 13% 12% 11% 3.8% 8% 5.0 43% 11%Median -1% 14% 4% 18.8 16.6 15.7 6.5 5.7 4.9 34% 35% 33% 2.2% 6% 8.7 84% 23%
EPS growth P/E (X)

December 1, 2016 Asia Pacific: Textile, Apparel & Footwear
Goldman Sachs Global Investment Research 18
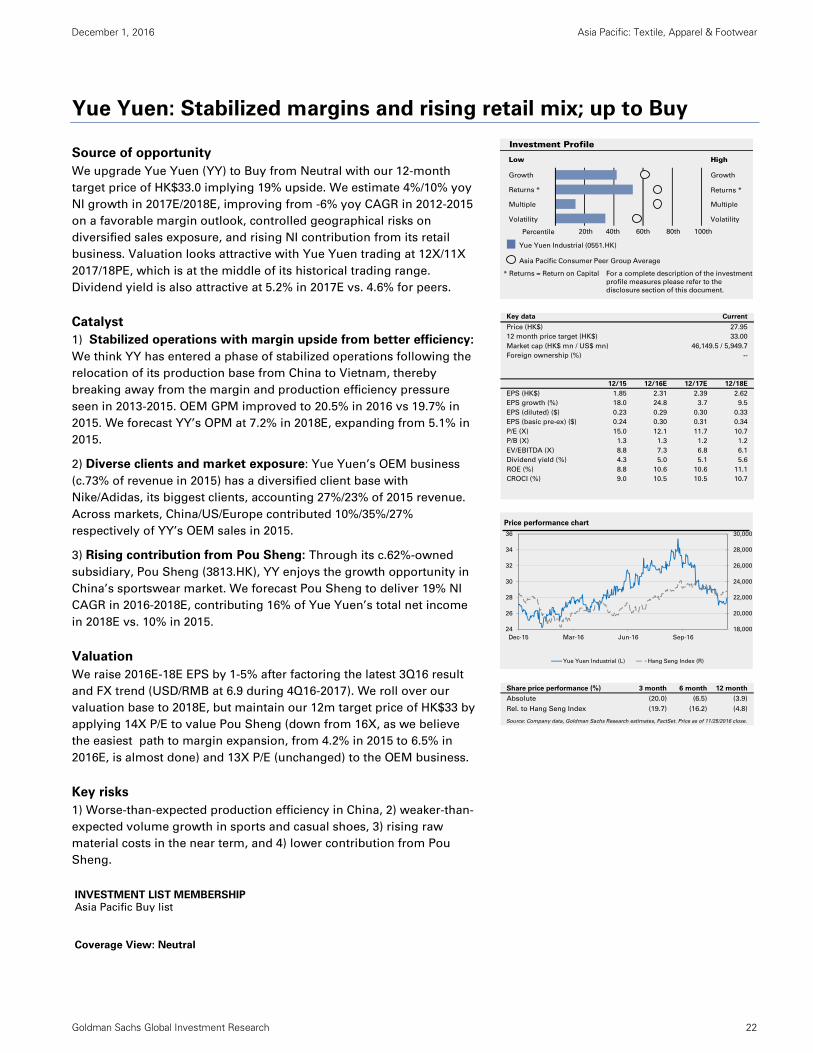
Shenzhou: Buy on share gains, defensive market exposure; to CL
Source of opportunity
We reiterate our Buy on Shenzhou and add it to our regional Conviction
list. We think the 13% pullback in its share price since its Sept. peak,
driven by market concerns over global trade and demand, offers a good
opportunity to accumulate. Shenzhou is the most defensive name
among our covered exporters due to: 1) balanced market exposure with
less exposure to the US (10% in 1H16); 2) strong client mix and share
gains; 3) integrated business model to support clients’ short lead-time
orders; 4) volume growth with rising contribution from Vietnam
capacity; 5) margin upside from product mix and cost mgmt. We expect
EPS growth of 24%/20% in 2H16 and 2017E.
Catalyst
1) Less impacted by uncertain US trade policies: Shenzhou is down
7% and peers down 3% in the past month on concerns on US trade
policies. Even though key accounts are Uniqlo/Nike/Adidas/Puma, we
believe potential impact should be smaller for Shenzhou as it sells to
diversified markets especially in Asia, unlike many other OEMs like
Makalot/Eclat/Stella. Shenzhou has North America exposure of only
13% vs c.77%/57%/53% in 2015.
2) Resilient growth prospects: Shenzhou’s sales growth from its top
four clients grew at an avg. of 25% in 1H16. We expect growth of 17%
yoy for 2H16E and 2017E on market share gains, given its strong
production efficiency, product upgrade, and its capability to fulfill short
lead-time orders. Also, Shenzhou has been ramping up its capacity in
Vietnam and we expect this to support 15%/11% volume growth for the
group in 2017/18E. On top of that, we believe an improved product mix
and better efficiency in Vietnam imply further margin upside for
Shenzhou.
Valuation
We fine tune 2016-18E EPS by -0.5%-2% to factor in latest FX trend. Our
12-m TP rises to HK$58 from HK$56 as we roll over to 2018. Our target
multiple remains 18x, benchmarked vs global peers on earnings growth
and CROCI.
Key risks
1) Slower sportswear demand growth, 2) higher-than-expected labor
costs increase, 3) slower ramp-up in production in Vietnam, 4) Changes
in FX.
INVESTMENT LIST MEMBERSHIP
Asia Pacific Buy list
Asia Pacific Conviction Buy list
Coverage View: Neutral
Growth
Returns *
Multiple
Volatility Volatility
Multiple
Returns *
Growth
Investment Profile
Low High
Percentile 20th 40th 60th 80th 100th
* Returns = Return on Capital For a complete description of the investment
profile measures please refer to the
disclosure section of this document.
Shenzhou International Group (2313.HK)
Asia Pacific Consumer Peer Group Average
Key data Current
Price (HK$) 47.00
12 month price target (HK$) 58.00
Market cap (HK$ mn / US$ mn) 65,753.0 / 8,477.6
Foreign ownership (%) --
12/15 12/16E 12/17E 12/18E
EPS (Rmb) 1.68 2.13 2.57 2.86
EPS growth (%) 14.0 26.7 20.4 11.2
EPS (diluted) (Rmb) 1.68 2.13 2.57 2.86
EPS (basic pre-ex) (Rmb) 1.68 2.13 2.57 2.86
P/E (X) 17.5 19.6 16.3 14.6
P/B (X) 3.2 3.9 3.5 3.1
EV/EBITDA (X) 12.8 14.0 11.7 10.2
Dividend yield (%) 3.1 2.7 3.3 3.7
ROE (%) 18.9 21.4 22.7 22.4
CROCI (%) 22.4 22.5 24.0 23.7
7,500
8,500
9,500
10,500
11,500
12,500
35
40
45
50
55
60
Nov-15 Mar-16 Jun-16 Sep-16
Price performance chart
Shenzhou International Group (L) Hang Seng China Ent. Index (R)
Share price performance (%) 3 month 6 month 12 month
Absolute (6.4) 22.0 17.2
Rel. to Hang Seng China Ent. Index (9.2) 7.9 16.6
Source: Company data, Goldman Sachs Research estimates, FactSet. Price as of 11/30/2016 close.
December 1, 2016 Asia Pacific: Textile, Apparel & Footwear
Goldman Sachs Global Investment Research 19
*Closing price as of Nov 30th, 2016
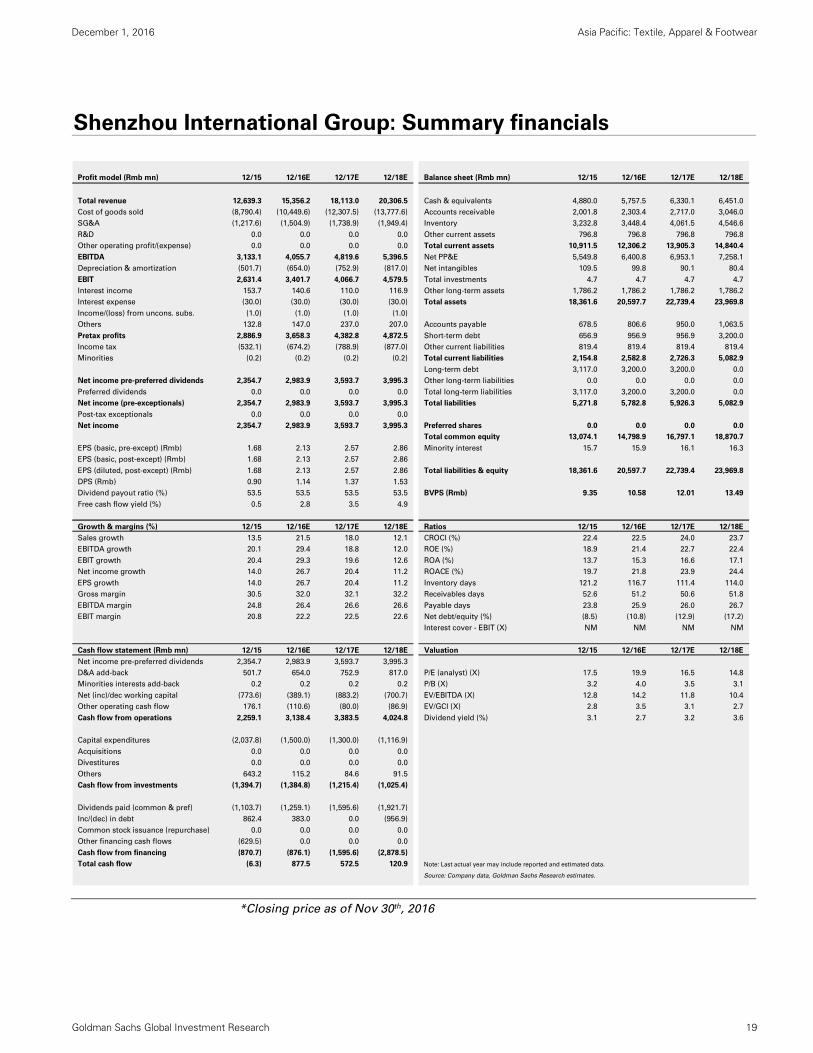
Shenzhou International Group: Summary financials
Profit model (Rmb mn) 12/15 12/16E 12/17E 12/18E Balance sheet (Rmb mn) 12/15 12/16E 12/17E 12/18E
Total revenue 12,639.3 15,356.2 18,113.0 20,306.5 Cash & equivalents 4,880.0 5,757.5 6,330.1 6,451.0
Cost of goods sold (8,790.4) (10,449.6) (12,307.5) (13,777.6) Accounts receivable 2,001.8 2,303.4 2,717.0 3,046.0
SG&A (1,217.6) (1,504.9) (1,738.9) (1,949.4) Inventory 3,232.8 3,448.4 4,061.5 4,546.6
R&D 0.0 0.0 0.0 0.0 Other current assets 796.8 796.8 796.8 796.8
Other operating profit/(expense) 0.0 0.0 0.0 0.0 Total current assets 10,911.5 12,306.2 13,905.3 14,840.4
EBITDA 3,133.1 4,055.7 4,819.6 5,396.5 Net PP&E 5,549.8 6,400.8 6,953.1 7,258.1
Depreciation & amortization (501.7) (654.0) (752.9) (817.0) Net intangibles 109.5 99.8 90.1 80.4
EBIT 2,631.4 3,401.7 4,066.7 4,579.5 Total investments 4.7 4.7 4.7 4.7
Interest income 153.7 140.6 110.0 116.9 Other long-term assets 1,786.2 1,786.2 1,786.2 1,786.2
Interest expense (30.0) (30.0) (30.0) (30.0) Total assets 18,361.6 20,597.7 22,739.4 23,969.8
Income/(loss) from uncons. subs. (1.0) (1.0) (1.0) (1.0)
Others 132.8 147.0 237.0 207.0 Accounts payable 678.5 806.6 950.0 1,063.5
Pretax profits 2,886.9 3,658.3 4,382.8 4,872.5 Short-term debt 656.9 956.9 956.9 3,200.0
Income tax (532.1) (674.2) (788.9) (877.0) Other current liabilities 819.4 819.4 819.4 819.4
Minorities (0.2) (0.2) (0.2) (0.2) Total current liabilities 2,154.8 2,582.8 2,726.3 5,082.9
Long-term debt 3,117.0 3,200.0 3,200.0 0.0
Net income pre-preferred dividends 2,354.7 2,983.9 3,593.7 3,995.3 Other long-term liabilities 0.0 0.0 0.0 0.0
Preferred dividends 0.0 0.0 0.0 0.0 Total long-term liabilities 3,117.0 3,200.0 3,200.0 0.0
Net income (pre-exceptionals) 2,354.7 2,983.9 3,593.7 3,995.3 Total liabilities 5,271.8 5,782.8 5,926.3 5,082.9
Post-tax exceptionals 0.0 0.0 0.0 0.0
Net income 2,354.7 2,983.9 3,593.7 3,995.3 Preferred shares 0.0 0.0 0.0 0.0
Total common equity 13,074.1 14,798.9 16,797.1 18,870.7
EPS (basic, pre-except) (Rmb) 1.68 2.13 2.57 2.86 Minority interest 15.7 15.9 16.1 16.3
EPS (basic, post-except) (Rmb) 1.68 2.13 2.57 2.86
EPS (diluted, post-except) (Rmb) 1.68 2.13 2.57 2.86 Total liabilities & equity 18,361.6 20,597.7 22,739.4 23,969.8
DPS (Rmb) 0.90 1.14 1.37 1.53
Dividend payout ratio (%) 53.5 53.5 53.5 53.5 BVPS (Rmb) 9.35 10.58 12.01 13.49
Free cash flow yield (%) 0.5 2.8 3.5 4.9
Growth & margins (%) 12/15 12/16E 12/17E 12/18E Ratios 12/15 12/16E 12/17E 12/18E
Sales growth 13.5 21.5 18.0 12.1 CROCI (%) 22.4 22.5 24.0 23.7
EBITDA growth 20.1 29.4 18.8 12.0 ROE (%) 18.9 21.4 22.7 22.4
EBIT growth 20.4 29.3 19.6 12.6 ROA (%) 13.7 15.3 16.6 17.1
Net income growth 14.0 26.7 20.4 11.2 ROACE (%) 19.7 21.8 23.9 24.4
EPS growth 14.0 26.7 20.4 11.2 Inventory days 121.2 116.7 111.4 114.0
Gross margin 30.5 32.0 32.1 32.2 Receivables days 52.6 51.2 50.6 51.8
EBITDA margin 24.8 26.4 26.6 26.6 Payable days 23.8 25.9 26.0 26.7
EBIT margin 20.8 22.2 22.5 22.6 Net debt/equity (%) (8.5) (10.8) (12.9) (17.2)
Interest cover - EBIT (X) NM NM NM NM
Cash flow statement (Rmb mn) 12/15 12/16E 12/17E 12/18E Valuation 12/15 12/16E 12/17E 12/18E
Net income pre-preferred dividends 2,354.7 2,983.9 3,593.7 3,995.3
D&A add-back 501.7 654.0 752.9 817.0 P/E (analyst) (X) 17.5 19.9 16.5 14.8
Minorities interests add-back 0.2 0.2 0.2 0.2 P/B (X) 3.2 4.0 3.5 3.1
Net (inc)/dec working capital (773.6) (389.1) (883.2) (700.7) EV/EBITDA (X) 12.8 14.2 11.8 10.4
Other operating cash flow 176.1 (110.6) (80.0) (86.9) EV/GCI (X) 2.8 3.5 3.1 2.7
Cash flow from operations 2,259.1 3,138.4 3,383.5 4,024.8 Dividend yield (%) 3.1 2.7 3.2 3.6
Capital expenditures (2,037.8) (1,500.0) (1,300.0) (1,116.9)
Acquisitions 0.0 0.0 0.0 0.0
Divestitures 0.0 0.0 0.0 0.0
Others 643.2 115.2 84.6 91.5
Cash flow from investments (1,394.7) (1,384.8) (1,215.4) (1,025.4)
Dividends paid (common & pref) (1,103.7) (1,259.1) (1,595.6) (1,921.7)
Inc/(dec) in debt 862.4 383.0 0.0 (956.9)
Common stock issuance (repurchase) 0.0 0.0 0.0 0.0
Other financing cash flows (629.5) 0.0 0.0 0.0
Cash flow from financing (870.7) (876.1) (1,595.6) (2,878.5)
Total cash flow (6.3) 877.5 572.5 120.9 Note: Last actual year may include reported and estimated data.
Source: Company data, Goldman Sachs Research estimates.
December 1, 2016 Asia Pacific: Textile, Apparel & Footwear
Goldman Sachs Global Investment Research 20
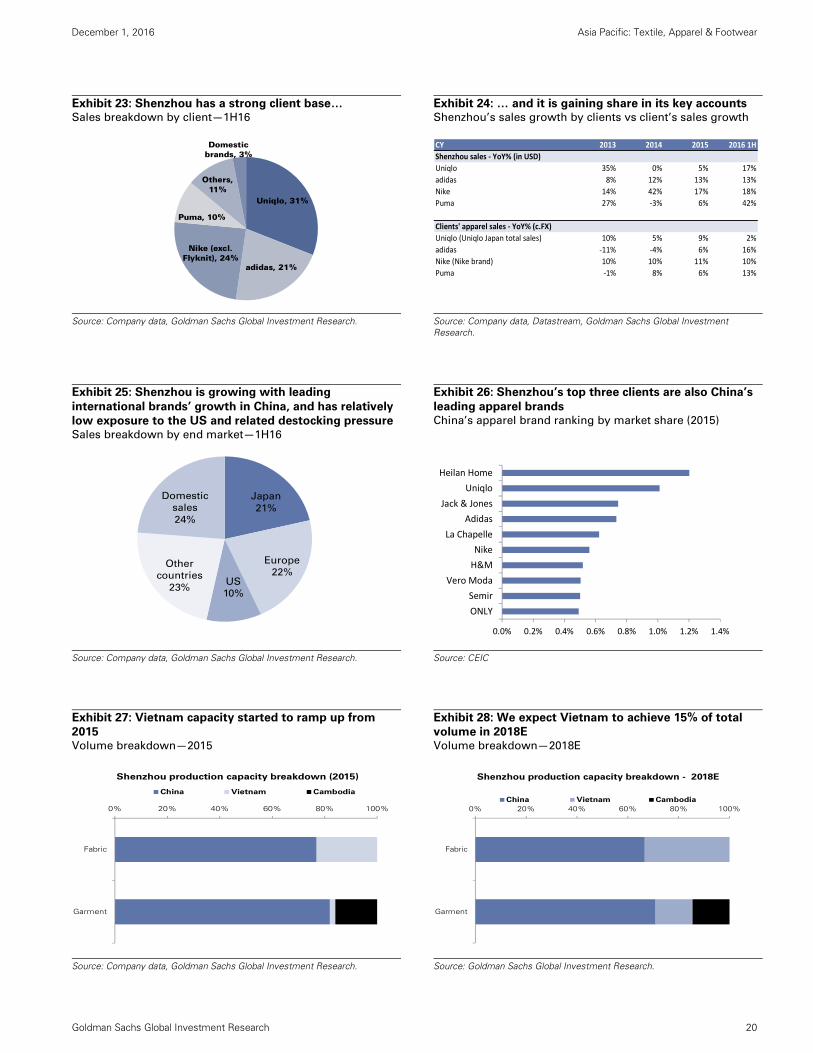
Exhibit 23: Shenzhou has a strong client base… Sales breakdown by client—1H16
Exhibit 24: … and it is gaining share in its key accounts Shenzhou’s sales growth by clients vs client’s sales growth
Source: Company data, Goldman Sachs Global Investment Research.
Source: Company data, Datastream, Goldman Sachs Global Investment Research.
Exhibit 25: Shenzhou is growing with leading
international brands’ growth in China, and has relatively
low exposure to the US and related destocking pressureSales breakdown by end market—1H16
Exhibit 26: Shenzhou’s top three clients are also China’s
leading apparel brands China’s apparel brand ranking by market share (2015)
Source: Company data, Goldman Sachs Global Investment Research.
Source: CEIC
Exhibit 27: Vietnam capacity started to ramp up from
2015 Volume breakdown—2015
Exhibit 28: We expect Vietnam to achieve 15% of total
volume in 2018E Volume breakdown—2018E
Source: Company data, Goldman Sachs Global Investment Research.
Source: Goldman Sachs Global Investment Research.
Uniqlo, 31%
adidas, 21%
Nike (excl. Flyknit), 24%
Puma, 10%
Others, 11%
Domestic brands, 3%
CY 2013 2014 2015 2016 1H
Shenzhou sales ‐ YoY% (in USD)
Uniqlo 35% 0% 5% 17%
adidas 8% 12% 13% 13%
Nike 14% 42% 17% 18%
Puma 27% ‐3% 6% 42%
Clients' apparel sales ‐ YoY% (c.FX)
Uniqlo (Uniqlo Japan total sales) 10% 5% 9% 2%
adidas ‐11% ‐4% 6% 16%
Nike (Nike brand) 10% 10% 11% 10%
Puma ‐1% 8% 6% 13%
Japan
21%
Europe
22%US
10%
Other
countries
23%
Domestic
sales
24%
0.0% 0.2% 0.4% 0.6% 0.8% 1.0% 1.2% 1.4%
ONLY
Semir
Vero Moda
H&M
Nike
La Chapelle
Adidas
Jack & Jones
Uniqlo
Heilan Home
0% 20% 40% 60% 80% 100%
Fabric
Garment
Shenzhou production capacity breakdown (2015)
China Vietnam Cambodia
0% 20% 40% 60% 80% 100%
Fabric
Garment
Shenzhou production capacity breakdown - 2018E
China Vietnam Cambodia
December 1, 2016 Asia Pacific: Textile, Apparel & Footwear
Goldman Sachs Global Investment Research 21
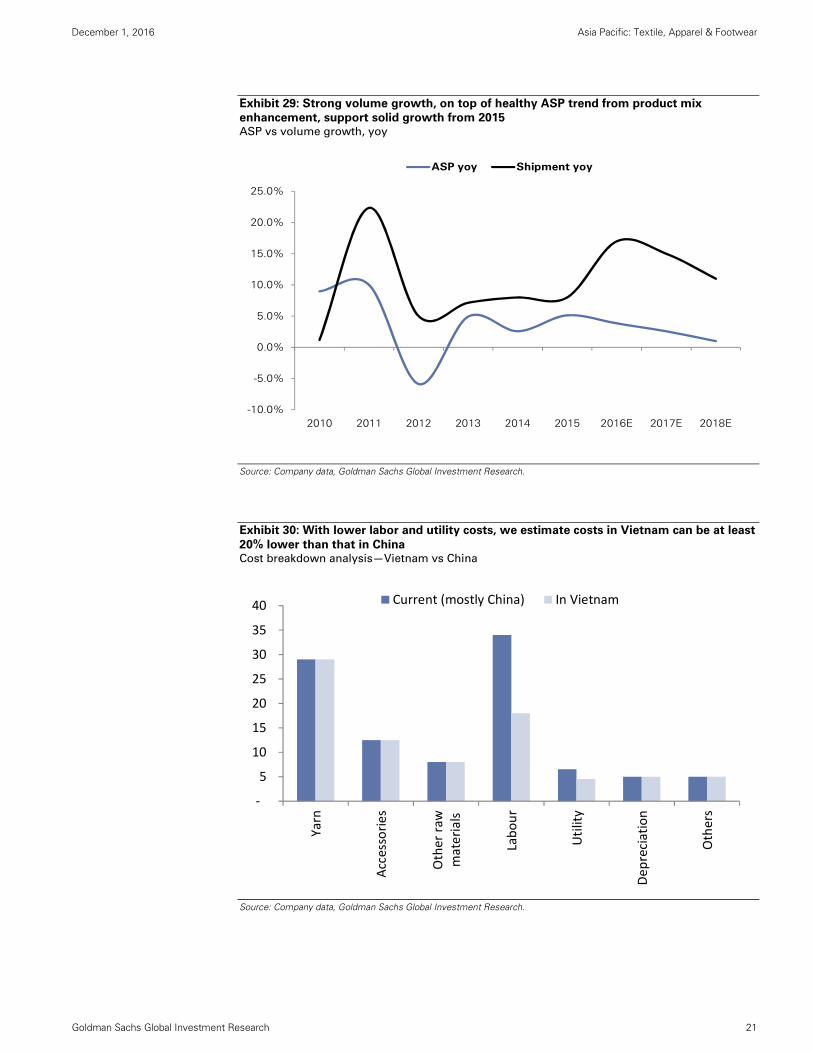
Exhibit 29: Strong volume growth, on top of healthy ASP trend from product mix
enhancement, support solid growth from 2015 ASP vs volume growth, yoy
Source: Company data, Goldman Sachs Global Investment Research.
Exhibit 30: With lower labor and utility costs, we estimate costs in Vietnam can be at least
20% lower than that in China Cost breakdown analysis—Vietnam vs China
Source: Company data, Goldman Sachs Global Investment Research.
-10.0%
-5.0%
0.0%
5.0%
10.0%
15.0%
20.0%
25.0%
2010 2011 2012 2013 2014 2015 2016E 2017E 2018E
ASP yoy Shipment yoy
‐
5
10
15
20
25
30
35
40
Yarn
Accessories
Other raw
materials
Labour
Utility
Depreciation
Others
Current (mostly China) In Vietnam
December 1, 2016 Asia Pacific: Textile, Apparel & Footwear
Goldman Sachs Global Investment Research 22
Yue Yuen: Stabilized margins and rising retail mix; up to Buy
Source of opportunity
We upgrade Yue Yuen (YY) to Buy from Neutral with our 12-month
target price of HK$33.0 implying 19% upside. We estimate 4%/10% yoy
NI growth in 2017E/2018E, improving from -6% yoy CAGR in 2012-2015
on a favorable margin outlook, controlled geographical risks on
diversified sales exposure, and rising NI contribution from its retail
business. Valuation looks attractive with Yue Yuen trading at 12X/11X
2017/18PE, which is at the middle of its historical trading range.
Dividend yield is also attractive at 5.2% in 2017E vs. 4.6% for peers.
Catalyst
1) Stabilized operations with margin upside from better efficiency:
We think YY has entered a phase of stabilized operations following the
relocation of its production base from China to Vietnam, thereby
breaking away from the margin and production efficiency pressure
seen in 2013-2015. OEM GPM improved to 20.5% in 2016 vs 19.7% in
2015. We forecast YY’s OPM at 7.2% in 2018E, expanding from 5.1% in
2015.
2) Diverse clients and market exposure: Yue Yuen’s OEM business
(c.73% of revenue in 2015) has a diversified client base with
Nike/Adidas, its biggest clients, accounting 27%/23% of 2015 revenue.
Across markets, China/US/Europe contributed 10%/35%/27%
respectively of YY’s OEM sales in 2015.
3) Rising contribution from Pou Sheng: Through its c.62%-owned
subsidiary, Pou Sheng (3813.HK), YY enjoys the growth opportunity in
China’s sportswear market. We forecast Pou Sheng to deliver 19% NI
CAGR in 2016-2018E, contributing 16% of Yue Yuen’s total net income
in 2018E vs. 10% in 2015.
Valuation
We raise 2016E-18E EPS by 1-5% after factoring the latest 3Q16 result
and FX trend (USD/RMB at 6.9 during 4Q16-2017). We roll over our
valuation base to 2018E, but maintain our 12m target price of HK$33 by
applying 14X P/E to value Pou Sheng (down from 16X, as we believe
the easiest path to margin expansion, from 4.2% in 2015 to 6.5% in
2016E, is almost done) and 13X P/E (unchanged) to the OEM business.
Key risks
1) Worse-than-expected production efficiency in China, 2) weaker-than-
expected volume growth in sports and casual shoes, 3) rising raw
material costs in the near term, and 4) lower contribution from Pou
Sheng.
INVESTMENT LIST MEMBERSHIP
Asia Pacific Buy list
Coverage View: Neutral
Growth
Returns *
Multiple
Volatility Volatility
Multiple
Returns *
Growth
Investment Profile
Low High
Percentile 20th 40th 60th 80th 100th
* Returns = Return on Capital For a complete description of the investment
profile measures please refer to the
disclosure section of this document.
Yue Yuen Industrial (0551.HK)
Asia Pacific Consumer Peer Group Average
Key data Current
Price (HK$) 27.95
12 month price target (HK$) 33.00
Market cap (HK$ mn / US$ mn) 46,149.5 / 5,949.7
Foreign ownership (%) --
12/15 12/16E 12/17E 12/18E
EPS (HK$) 1.85 2.31 2.39 2.62
EPS growth (%) 18.0 24.8 3.7 9.5
EPS (diluted) ($) 0.23 0.29 0.30 0.33
EPS (basic pre-ex) ($) 0.24 0.30 0.31 0.34
P/E (X) 15.0 12.1 11.7 10.7
P/B (X) 1.3 1.3 1.2 1.2
EV/EBITDA (X) 8.8 7.3 6.8 6.1
Dividend yield (%) 4.3 5.0 5.1 5.6
ROE (%) 8.8 10.6 10.6 11.1
CROCI (%) 9.0 10.5 10.5 10.7
18,000
20,000
22,000
24,000
26,000
28,000
30,000
24
26
28
30
32
34
36
Dec-15 Mar-16 Jun-16 Sep-16
Price performance chart
Yue Yuen Industrial (L) Hang Seng Index (R)
Share price performance (%) 3 month 6 month 12 month
Absolute (20.0) (6.5) (3.9)
Rel. to Hang Seng Index (19.7) (16.2) (4.8)
Source: Company data, Goldman Sachs Research estimates, FactSet. Price as of 11/25/2016 close.

December 1, 2016 Asia Pacific: Textile, Apparel & Footwear
Goldman Sachs Global Investment Research 23
*Closing price as of Nov 30th, 2016
Yue Yuen Industrial: Summary financials
Profit model ($ mn) 12/15 12/16E 12/17E 12/18E Balance sheet ($ mn) 12/15 12/16E 12/17E 12/18E
Total revenue 8,434.9 8,375.4 8,616.7 9,033.5 Cash & equivalents 1,046.6 1,503.9 1,632.4 1,761.4
Cost of goods sold (6,462.6) (6,276.0) (6,424.2) (6,697.1) Accounts receivable 1,413.8 1,403.8 1,444.2 1,514.1
SG&A (1,302.8) (1,300.8) (1,356.6) (1,429.6) Inventory 1,254.2 1,217.9 1,246.7 1,299.7
R&D (157.1) (156.0) (160.5) (168.3) Other current assets 22.2 22.2 22.2 22.2
Other operating profit/(expense) (83.8) (97.4) (87.3) (87.9) Total current assets 3,736.7 4,147.8 4,345.5 4,597.4
EBITDA 678.3 814.9 875.7 955.7 Net PP&E 1,945.2 2,018.1 2,039.6 2,058.2
Depreciation & amortization (249.7) (269.7) (287.7) (305.1) Net intangibles 375.0 367.5 359.9 352.3
EBIT 428.5 545.2 588.0 650.6 Total investments 865.9 937.1 1,013.9 1,097.0
Interest income 9.3 10.0 14.4 15.7 Other long-term assets 341.6 341.6 341.6 341.6
Interest expense (19.4) (20.5) (24.2) (24.2) Total assets 7,264.5 7,812.1 8,100.5 8,446.5
Income/(loss) from uncons. subs. 82.2 71.1 76.8 83.1
Others (16.4) 15.0 0.0 0.0 Accounts payable 1,482.0 1,439.2 1,473.2 1,535.8
Pretax profits 484.2 620.8 655.1 725.1 Short-term debt 433.2 433.2 433.2 433.2
Income tax (66.3) (87.9) (95.9) (107.9) Other current liabilities 76.7 76.7 76.7 76.7
Minorities (27.7) (45.3) (51.2) (61.0) Total current liabilities 1,991.9 1,949.1 1,983.1 2,045.7
Long-term debt 370.0 720.0 720.0 720.0
Net income pre-preferred dividends 390.2 487.6 507.9 556.2 Other long-term liabilities 36.3 36.3 36.3 36.3
Preferred dividends 0.0 0.0 0.0 0.0 Total long-term liabilities 406.3 756.3 756.3 756.3
Net income (pre-exceptionals) 390.2 487.6 507.9 556.2 Total liabilities 2,398.3 2,705.5 2,739.5 2,802.1
Post-tax exceptionals 0.0 0.0 0.0 0.0
Net income 390.2 487.6 507.9 556.2 Preferred shares 0.0 0.0 0.0 0.0
Total common equity 4,498.6 4,693.6 4,896.8 5,119.3
EPS (basic, pre-except) ($) 0.24 0.30 0.31 0.34 Minority interest 367.6 413.0 464.2 525.2
EPS (basic, post-except) ($) 0.24 0.30 0.31 0.34
EPS (diluted, post-except) ($) 0.23 0.29 0.30 0.33 Total liabilities & equity 7,264.5 7,812.1 8,100.5 8,446.5
DPS ($) 0.15 0.18 0.19 0.20
Dividend payout ratio (%) 64.9 60.0 60.0 60.0 BVPS ($) 2.73 2.85 2.97 3.11
Free cash flow yield (%) 6.2 6.3 6.8 7.2
Growth & margins (%) 12/15 12/16E 12/17E 12/18E Ratios 12/15 12/16E 12/17E 12/18E
Sales growth 5.3 (0.7) 2.9 4.8 CROCI (%) 9.0 10.5 10.5 10.7
EBITDA growth 5.2 20.1 7.5 9.1 ROE (%) 8.8 10.6 10.6 11.1
EBIT growth 5.0 27.2 7.9 10.6 ROA (%) 5.4 6.5 6.4 6.7
Net income growth 17.9 25.0 4.2 9.5 ROACE (%) 9.1 11.6 11.8 12.6
EPS growth 18.0 25.0 4.2 9.5 Inventory days 72.7 71.9 70.0 69.4
Gross margin 23.4 25.1 25.4 25.9 Receivables days 61.0 61.4 60.3 59.8
EBITDA margin 8.0 9.7 10.2 10.6 Payable days 79.8 84.9 82.7 82.0
EBIT margin 5.1 6.5 6.8 7.2 Net debt/equity (%) (5.0) (6.9) (8.9) (10.8)
Interest cover - EBIT (X) 42.5 51.9 60.0 76.0
Cash flow statement ($ mn) 12/15 12/16E 12/17E 12/18E Valuation 12/15 12/16E 12/17E 12/18E
Net income pre-preferred dividends 390.2 487.6 507.9 556.2
D&A add-back 249.7 269.7 287.7 305.1 P/E (analyst) (X) 15.0 12.1 11.7 10.7
Minorities interests add-back 27.7 45.3 51.2 61.0 P/B (X) 1.3 1.3 1.2 1.2
Net (inc)/dec working capital 197.0 3.4 (35.2) (60.2) EV/EBITDA (X) 8.8 7.3 6.8 6.1
Other operating cash flow (77.0) (71.1) (76.8) (83.1) EV/GCI (X) 0.8 0.8 0.7 0.7
Cash flow from operations 787.6 734.8 734.9 779.0 Dividend yield (%) 4.3 5.0 5.1 5.6
Capital expenditures (398.1) (335.0) (301.6) (316.2)
Acquisitions 0.0 0.0 0.0 0.0
Divestitures 0.0 0.0 0.0 0.0
Others 0.0 0.0 0.0 0.0
Cash flow from investments (398.1) (335.0) (301.6) (316.2)
Dividends paid (common & pref) (242.8) (292.6) (304.8) (333.7)
Inc/(dec) in debt (143.0) 350.0 0.0 0.0
Common stock issuance (repurchase) 0.0 0.0 0.0 0.0
Other financing cash flows 73.5 0.0 0.0 0.0
Cash flow from financing (312.3) 57.4 (304.8) (333.7)
Total cash flow 77.2 457.3 128.5 129.1 Note: Last actual year may include reported and estimated data.
Source: Company data, Goldman Sachs Research estimates.

December 1, 2016 Asia Pacific: Textile, Apparel & Footwear
Goldman Sachs Global Investment Research 24
Exhibit 31: Optimizing production in China still continues, but margin impact stabilized Production volume change by country
Source: Company data.
Exhibit 32: GPM/OPM has bottomed out and should
improve on better efficiency and geographical mix Yue Yuen’s OEM GPM and OPM
Exhibit 33: Contribution from Pou Sheng increasing to
16% of YY’s NI in 2018E Pou Sheng’s contribution
Source: Company data, Goldman Sachs Global Investment Research.
Source: Company data, Goldman Sachs Global Investment Research.
Exhibit 34: We use 13X PE to value the OEM business and 14X PE to value Pou Sheng
SoTP valuation
Source: Company data, Goldman Sachs Global Investment Research.
% of volume 4Q13 1Q14 2Q14 3Q14 4Q14 1Q15 2Q15 3Q15 4Q15 1Q16 2Q16 3Q16
PRC 34% 29% 29% 32% 26% 25% 25% 25% 25% 22% 22% 19%Vietnam 34% 39% 39% 39% 39% 41% 43% 42% 42% 43% 43% 46%Indonesia 31% 31% 31% 28% 34% 33% 31% 32% 32% 33% 33% 33%Others 1% 1% 1% 1% 1% 1% 1% 1% 1% 2% 2% 2%Total 100% 100% 100% 100% 100% 100% 100% 100% 100% 100% 100% 100%
Volume (mn pairs) 4Q13 1Q14 2Q14 3Q14 4Q14 1Q15 2Q15 3Q15 4Q15 1Q16 2Q16 3Q16
PRC 28.4 22.0 23.8 22.8 20.4 18.6 21.2 18.1 21.5 17.6 18.8 13.1 Vietnam 28.4 29.6 32.0 27.6 30.5 30.5 36.3 30.4 36.2 34.5 36.8 32.6 Indonesia 25.9 23.6 25.4 19.7 26.6 24.6 26.3 23.1 27.6 26.5 28.2 23.2 Others 0.8 0.8 0.8 0.7 0.8 0.7 0.8 0.7 0.9 1.6 1.7 1.4 Total 83.4 76.0 82.0 70.8 78.3 74.5 84.6 72.3 86.1 80.2 85.5 70.4
Volume YoY 4Q14 1Q15 2Q15 3Q15 4Q15 1Q16 2Q16 3Q16
PRC -28% -15% -11% -21% 5% -5% -11% -27%Vietnam 8% 3% 13% 10% 18% 13% 1% 7%Indonesia 3% 4% 4% 18% 4% 8% 7% 0%Others -6% -2% 3% 2% 10% 115% 102% 95%Total -6% -2% 3% 2% 10% 8% 1% -3%
=
-
2.0%
4.0%
6.0%
8.0%
10.0%
12.0%
16.0%
17.0%
18.0%
19.0%
20.0%
21.0%
22.0%
23.0%
24.0%
25.0%
OEM's GPM OEM's OPM (RHS)
-5.5%
0.9%
10.2%
13.2%15.1%
16.4%
-10.0%
-5.0%
0.0%
5.0%
10.0%
15.0%
20.0%
2013 2014 2015 2016E 2017E 2018E
Pou Sheng as % of YY's NI
NI breakdown PE (x) EPS (HK$) Implied value (HK$)OEM 83.7% 13 2.19 27.4 Pou Sheng 16.3% 14 0.43 6.0
TP (HK$) 33.0

December 1, 2016 Asia Pacific: Textile, Apparel & Footwear
Goldman Sachs Global Investment Research 25
Eclat: Down to Neutral as EPS recovery appears priced in
What happened
We downgrade Eclat to Neutral from Buy. While EPS growth is likely to
recover from 4Q16 at 4% yoy vs -23% in 9M16, we believe the
magnitude of this recovery will be smaller than what we had previously
anticipated (15%), thanks to uncertainties in global trade and US
retailers’ destocking. Fundamentally, we still see solid trend for ASP,
but lower visibility on volume growth. We lower our 2016-18E EPS by
6-17% to reflect weaker sales/margins. Accordingly, we cut our 12m
target price from NT$410 to NT$340, based on our lower earnings
estimates and a lower target multiple of 18x (20x previously) to reflect
its slower growth (20% NI CAGR in 2016-18E vs previous estimate of
27%). We also roll over our valuation base from average 2017 and 2018
PE to 2018 PE. Since we upgraded the stock to Buy on Aug 7th, 2015, its
share price is down 25% vs the TWSE up 9%. We attribute this to
investors’ concerns on inventory control and weak traffic at US
retailers.
Current view
1) ASP growth is likely to remain solid on contribution from new
materials backed by superior R&D on stretchable functional products.
2) Vertical integration by adopting more fabric internally allows
Eclat to strive for value growth given its superior fabric development
track record. More services provided in the supply chain and
production efficiency also help realize clients’ design ideas into
products and strengthen the relationship with clients. Eclat’s market
share in US apparel imports has more than doubled in the past five
years. 3) We see headwinds in volume growth as retail clients’
restocking demand remains slow. Retail clients still represented c.25%
of Eclat’s 3Q16 sales although client mix is improving (c.27% retail
clients in 1H16 and c.35% in 2015). 4) If US brand/retailers continue destocking before a clearer picture emerges on trade policies, volume
growth for Eclat would be hurt as direct orders from the US represent c.
52% of total sales and indirect orders could be even higher.
Valuation
We cut our 2016-18E sales by 3-12% and net margins by 0.5-1pp to
factor in lower demand from US retailer clients. Valuation wise, we roll
over our valuation base to 2018E and cut our target multiple from 20X
to 18X on the back of its weaker EPS outlook and on a par with
Shenzhou’s multiple.
Key risks
Risks: 1) Stronger/weaker restocking demand from retail clients, 2)
more/less adoption for new materials, 3) new clients, 4) better/worse
vertical integration, 5) FX.
INVESTMENT LIST MEMBERSHIP
Neutral
Coverage View: Neutral
Growth
Returns *
Multiple
Volatility Volatility
Multiple
Returns *
Growth
Investment Profile
Low High
Percentile 20th 40th 60th 80th 100th
* Returns = Return on Capital For a complete description of the investment
profile measures please refer to the
disclosure section of this document.
Eclat Textile Co. (1476.TW)
Asia Pacific Consumer Peer Group Average
Key data Current
Price (NT$) 325.50
12 month price target (NT$) 340.00
Market cap (NT$ mn / US$ mn) 87,555.3 / 2,752.5
Foreign ownership (%) 42.4
12/15 12/16E 12/17E 12/18E
EPS (NT$) 15.52 13.18 16.26 18.84
EPS growth (%) 39.0 (15.1) 23.4 15.9
EPS (diluted) (NT$) 15.52 13.18 16.26 18.84
EPS (basic pre-ex) (NT$) 15.52 13.18 16.26 18.84
P/E (X) 27.8 24.7 20.0 17.3
P/B (X) 9.8 5.8 5.2 4.6
EV/EBITDA (X) 20.5 15.2 13.3 11.4
Dividend yield (%) 2.4 2.8 3.5 4.1
ROE (%) 39.3 26.4 27.3 28.2
CROCI (%) 37.2 24.7 25.5 25.8
7,600
8,100
8,600
9,100
9,600
10,100
250
300
350
400
450
500
Dec-15 Mar-16 Jun-16 Sep-16
Price performance chart
Eclat Textile Co. (L) Taiwan SE Weighted Index (R)
Share price performance (%) 3 month 6 month 12 month
Absolute (17.9) (5.7) (24.4)
Rel. to Taiwan SE Weighted Index (19.4) (12.9) (31.9)
Source: Company data, Goldman Sachs Research estimates, FactSet. Price as of 11/30/2016 close.

December 1, 2016 Asia Pacific: Textile, Apparel & Footwear
Goldman Sachs Global Investment Research 26
*Closing price as of Nov 30th, 2016
Eclat Textile Co.: Summary financials
Profit model (NT$ mn) 12/15 12/16E 12/17E 12/18E Balance sheet (NT$ mn) 12/15 12/16E 12/17E 12/18E
Total revenue 25,520.7 24,985.1 27,614.5 30,800.9 Cash & equivalents 3,661.1 6,597.0 6,713.7 6,933.2
Cost of goods sold (18,367.2) (17,899.8) (19,686.5) (21,884.6) Accounts receivable 3,058.1 2,943.9 3,253.8 3,629.2
SG&A (2,186.7) (2,272.4) (2,397.9) (2,517.8) Inventory 3,563.3 3,472.6 3,819.2 4,245.6
R&D (128.4) (133.4) (140.8) (147.8) Other current assets 389.3 386.6 399.7 415.5
Other operating profit/(expense) 0.0 0.0 0.0 0.0 Total current assets 10,671.7 13,400.1 14,186.3 15,223.6
EBITDA 5,594.4 5,438.6 6,199.2 7,174.5 Net PP&E 6,591.0 7,032.0 8,022.1 8,898.2
Depreciation & amortization (755.9) (759.1) (809.9) (923.9) Net intangibles 22.1 22.1 22.1 22.1
EBIT 4,838.5 4,679.5 5,389.3 6,250.6 Total investments 13.9 13.9 13.9 13.9
Interest income 3.0 3.9 14.2 16.1 Other long-term assets 383.5 383.5 383.5 383.5
Interest expense (31.8) 0.0 0.0 0.0 Total assets 17,682.2 20,851.5 22,627.8 24,541.2
Income/(loss) from uncons. subs. 2.7 0.0 0.0 0.0
Others 308.6 (270.0) 30.0 30.0 Accounts payable 1,538.0 1,879.5 2,067.1 2,297.9
Pretax profits 5,121.0 4,413.4 5,433.5 6,296.7 Short-term debt 2,274.1 1,774.1 1,274.1 774.1
Income tax (947.3) (869.4) (1,059.5) (1,227.9) Other current liabilities 1,682.1 1,730.3 1,925.8 2,101.4
Minorities 0.0 0.0 0.0 0.0 Total current liabilities 5,494.2 5,383.9 5,267.1 5,173.4
Long-term debt 88.8 88.8 88.8 88.8
Net income pre-preferred dividends 4,173.8 3,544.0 4,374.0 5,068.8 Other long-term liabilities 324.8 324.8 324.8 324.8
Preferred dividends 0.0 0.0 0.0 0.0 Total long-term liabilities 413.6 413.6 413.6 413.6
Net income (pre-exceptionals) 4,173.8 3,544.0 4,374.0 5,068.8 Total liabilities 5,907.8 5,797.6 5,680.7 5,587.0
Post-tax exceptionals 0.0 0.0 0.0 0.0
Net income 4,173.8 3,544.0 4,374.0 5,068.8 Preferred shares 0.0 0.0 0.0 0.0
Total common equity 11,774.3 15,053.9 16,947.1 18,954.2
EPS (basic, pre-except) (NT$) 15.52 13.18 16.26 18.84 Minority interest 0.0 0.0 0.0 0.0
EPS (basic, post-except) (NT$) 15.52 13.18 16.26 18.84
EPS (diluted, post-except) (NT$) 15.52 13.18 16.26 18.84 Total liabilities & equity 17,682.2 20,851.5 22,627.8 24,541.2
DPS (NT$) 10.19 9.22 11.38 13.19
Dividend payout ratio (%) 65.7 70.0 70.0 70.0 BVPS (NT$) 43.77 55.97 63.00 70.47
Free cash flow yield (%) 3.4 4.2 3.5 4.3
Growth & margins (%) 12/15 12/16E 12/17E 12/18E Ratios 12/15 12/16E 12/17E 12/18E
Sales growth 22.4 (2.1) 10.5 11.5 CROCI (%) 37.2 24.7 25.5 25.8
EBITDA growth 37.8 (2.8) 14.0 15.7 ROE (%) 39.3 26.4 27.3 28.2
EBIT growth 38.0 (3.3) 15.2 16.0 ROA (%) 25.6 18.4 20.1 21.5
Net income growth 39.0 (15.1) 23.4 15.9 ROACE (%) 40.5 33.6 39.2 40.8
EPS growth 39.0 (15.1) 23.4 15.9 Inventory days 66.2 71.7 67.6 67.3
Gross margin 28.0 28.4 28.7 28.9 Receivables days 41.7 43.8 41.0 40.8
EBITDA margin 21.9 21.8 22.4 23.3 Payable days 29.9 34.8 36.6 36.4
EBIT margin 19.0 18.7 19.5 20.3 Net debt/equity (%) (11.0) (31.4) (31.6) (32.0)
Interest cover - EBIT (X) 168.1 NM NM NM
Cash flow statement (NT$ mn) 12/15 12/16E 12/17E 12/18E Valuation 12/15 12/16E 12/17E 12/18E
Net income pre-preferred dividends 4,173.8 3,544.0 4,374.0 5,068.8
D&A add-back 755.9 759.1 809.9 923.9 P/E (analyst) (X) 27.8 25.0 20.3 17.5
Minorities interests add-back 0.0 0.0 0.0 0.0 P/B (X) 9.8 5.9 5.2 4.7
Net (inc)/dec working capital (677.5) 546.3 (468.8) (571.1) EV/EBITDA (X) 20.5 15.5 13.5 11.5
Other operating cash flow 411.1 50.9 182.4 159.7 EV/GCI (X) 7.3 4.3 3.7 3.3
Cash flow from operations 4,663.3 4,900.3 4,897.4 5,581.4 Dividend yield (%) 2.4 2.8 3.4 4.0
Capital expenditures (770.6) (1,200.0) (1,800.0) (1,800.0)
Acquisitions 0.0 0.0 0.0 0.0
Divestitures 0.0 0.0 0.0 0.0
Others (12.1) 0.0 0.0 0.0
Cash flow from investments (782.7) (1,200.0) (1,800.0) (1,800.0)
Dividends paid (common & pref) (2,087.9) (2,824.4) (2,480.8) (3,061.8)
Inc/(dec) in debt 39.8 (500.0) (500.0) (500.0)
Common stock issuance (repurchase) 0.0 2,560.0 0.0 0.0
Other financing cash flows (21.3) 0.0 0.0 0.0
Cash flow from financing (2,069.4) (764.4) (2,980.8) (3,561.8)
Total cash flow 1,811.2 2,935.9 116.7 219.6 Note: Last actual year may include reported and estimated data.
Source: Company data, Goldman Sachs Research estimates.

December 1, 2016 Asia Pacific: Textile, Apparel & Footwear
Goldman Sachs Global Investment Research 27
Exhibit 35: Both ASP and volume were the drivers for
Eclat’s growth… ASP trend
Exhibit 36: … but with slow restocking demand, growth
prospects should be reset Volume trend
Source: Company data, Goldman Sachs Global Investment Research.
Source: Company data, Goldman Sachs Global Investment Research.
Exhibit 37: Near-term pressure from retailer clients
whose inventory control remains strict, implying slow
restocking demand Sales breakdown
Exhibit 38: We believe Eclat’s LT market share gain story
is still intact given its strong R&D on advanced materialsMarket share in US apparel import
Source: Company data, Goldman Sachs Global Investment Research.
Source: Company data, Goldman Sachs Global Investment Research.
-10%
-5%
0%
5%
10%
15%
20%
2010 2011 2012 2012 2013 2014 2015 2016E 2017E 2018E
ASP yoy Fabric Garment
-30%
-20%
-10%
0%
10%
20%
30%
40%
50%
60%
2010 2011 2012 2012 2013 2014 2015 2016E 2017E 2018E
Volume yoy Fabric Garment
‐30%
‐25%
‐20%
‐15%
‐10%
‐5%
0%
5%
10%
15%
20%
‐
5,000
10,000
15,000
20,000
25,000
30,000
2015 2016E 2017E 2018E
(NT$mn)
Sales from retailers
Sales from brands
Yoy growth, retailer client (RHS)
Yoy growth, brand client (RHS)
0.00%
0.10%
0.20%
0.30%
0.40%
0.50%
0.60%
2003 2004 2005 2006 2007 2008 2009 2010 2011 2012 2013 2014 2015
Share in US apparel import
Eclat

December 1, 2016 Asia Pacific: Textile, Apparel & Footwear
Goldman Sachs Global Investment Research 28
Appendix 1: Share price performance
Exhibit 39: Share prices for Greater China exporters within our coverage dropped 10% on average in the past month
due to concerns on US demand and global trade
Share price performance across the industry players
Source: FactSet.
1 day
price perf
1 week
price perf
1 month
price perf
3 month
price perf
6 month
price perf
12 month
price perf
Exporters
Makalot ‐1% 3% ‐5% ‐22% ‐25% ‐44%
Eclat 0% 3% ‐11% ‐19% ‐1% ‐25%
Shenzhou ‐1% 0% ‐7% ‐10% 19% 15%
Yue Yuen 2% 2% ‐4% ‐16% ‐4% 3%
Stella 1% 6% 0% ‐14% ‐11% ‐24%
Li & Fung 0% 1% ‐12% ‐14% ‐14% ‐36%
China sportswear
Pou Sheng 0% 6% ‐2% ‐9% 6% 59%
Li Ning 1% 1% 0% 12% 81% 39%
Anta Sports ‐1% ‐3% ‐5% 10% 27% ‐6%
Global sportswear
NKE ‐1% ‐2% ‐3% ‐14% ‐10% ‐25%
UA ‐1% 0% 0% ‐27% ‐19% ‐33%
ADSGn.DE 1% 0% ‐7% ‐9% 21% 56%
LULU 2% 0% 0% ‐25% ‐10% 11%
COLM ‐2% ‐2% 1% 2% 10% 19%
PUMG.DE 1% ‐2% 4% 5% 11% 19%
VFC ‐2% ‐4% 2% ‐13% ‐11% ‐15%
Global apparel brands
Global Brands Group 1% 7% 33% 56% 50% ‐25%
ITX.MC 1% 3% 0% 2% 8% ‐3%
HMb.ST 0% 0% 4% 2% 4% ‐16%
9983.T ‐3% 0% 12% 10% 39% ‐19%
LB 0% 2% ‐2% ‐6% 6% ‐26%
GPS ‐1% ‐2% ‐7% ‐5% 39% ‐8%
HBI ‐1% ‐3% ‐9% ‐14% ‐13% ‐25%
RL ‐2% ‐4% 11% 2% 15% ‐12%
PVH ‐2% ‐2% 0% ‐2% 12% 14%
URBN 0% ‐17% ‐4% ‐13% 12% 37%
AEO 3% 0% 12% 1% 21% 15%
ANF 2% ‐3% 2% ‐34% ‐25% ‐44%
US department stores
KSS 0% ‐3% 23% 20% 50% 13%
M ‐1% ‐4% 19% 10% 30% 6%
JCP 4% ‐2% 13% ‐3% 21% 16%
JWN 1% ‐3% 7% 7% 48% ‐2%
BURL 2% 3% 20% 10% 46% 80%
ROST 0% ‐1% 10% 9% 27% 30%
TJX 0% ‐1% 7% 0% 3% 10%
Sporting goods retailers
FL ‐1% ‐1% 8% 9% 32% 9%
FINL ‐1% ‐3% 17% ‐3% 27% 35%
DECK ‐5% ‐8% 9% ‐11% 12% 19%
DKS 2% 0% 9% 2% 40% 52%
>10%
<-10%

December 1, 2016 Asia Pacific: Textile, Apparel & Footwear
Goldman Sachs Global Investment Research 29
Appendix 2: Lukewarm US apparel demand vs. inventory control
Looking at the latest 3Q16 results from US retailers and brands, sporting goods retailers
delivered better SSSG, benefiting from TSA (The Sports Authority) bankruptcy, while
sportswear brands outperformed department stores, fashion brands, and outdoor brands
due to consumers’ preference for athleisure and functional products.
Inventory control remains very strict (exhibit 41), in view of the slower demand growth.
Besides, with volatile weather conditions and fast-changing consumer preference, we
believe brands/retailers will continue to strive for shorter lead time. Hence, manufacturers’
production allocation will likely become more challenging as the lead time will be shorter
or order visibility weaker. However, big players with integrated business model, diversified
client base, product lines, and production bases should be able to better accommodate
clients’ needs and gain share.
Exhibit 40: Sporting goods retailers posted better SSSG;
off-price retailers also solid, while department stores are
only “less bad” US retailers’ SSSG
Exhibit 41: But inventory across the board still stringentUS retailers’ inventory growth
Source: Company data.
Source: Company data.
4.7%
5.1%
5.2%
‐1.7%
‐2.7%
‐0.8%
2.4%
3.7%
7.0%
5.0%
‐8% ‐6% ‐4% ‐2% 0% 2% 4% 6% 8% 10%
Foot Locker
Finish Line
Dick's Sporting Goods
Kohl's
Macy's
JC Penny
Nordstrom
Burlington
Ross Stores
TJX
2015 Q3
2015 Q4
2016 Q1
2016 Q2
2016 Q3
Departmentstores & Discounters
Sporting goods retailer
US retailers SSSG (yoy)
1.9%
1.6%
4.8%
‐10.1%
‐6.9%
0.6%
0.4%
‐12.0%
3.7%
‐1.3%
‐15% ‐10% ‐5% 0% 5% 10% 15% 20%
Foot Locker
Finish Line
Dick's Sporting Goods
Kohl's
Macy's
JC Penny
Nordstrom
Burlington
Ross Stores
TJX
2015 Q3
2015 Q4
2016 Q1
2016 Q2
2016 Q3
Departmentstores & Discounters
Sporting goods retailer
US retailers inventory growth (yoy)
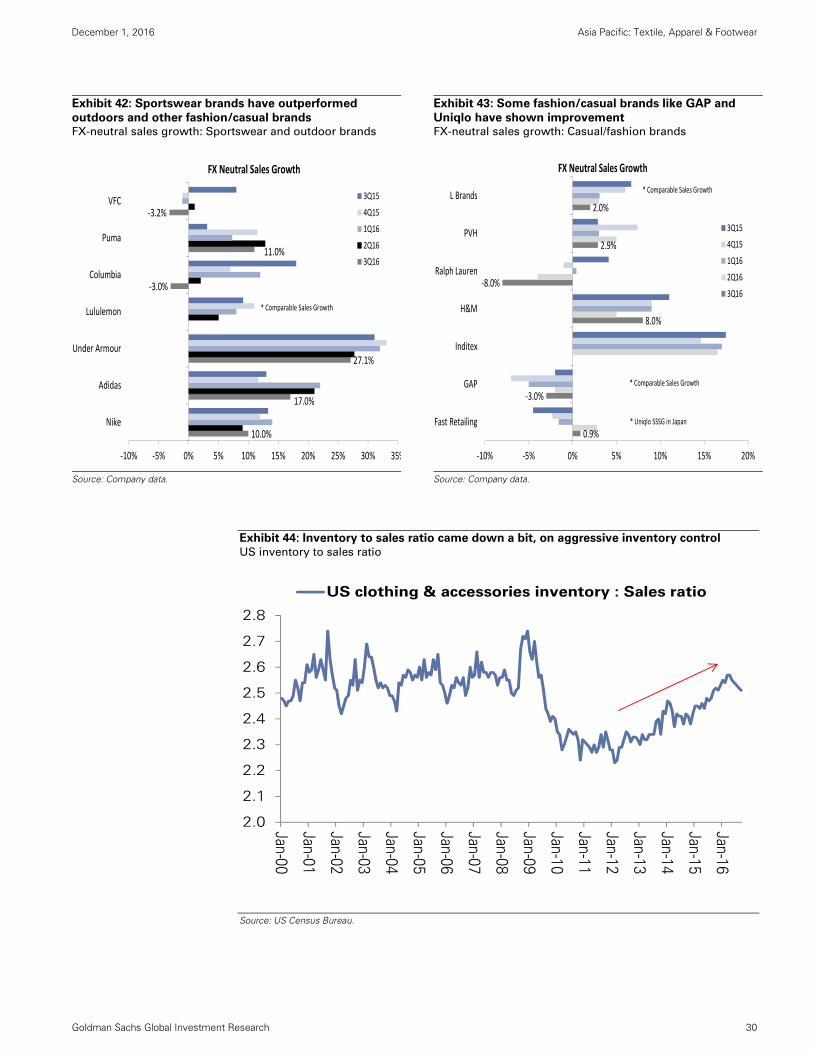
December 1, 2016 Asia Pacific: Textile, Apparel & Footwear
Goldman Sachs Global Investment Research 30
Exhibit 42: Sportswear brands have outperformed
outdoors and other fashion/casual brands FX-neutral sales growth: Sportswear and outdoor brands
Exhibit 43: Some fashion/casual brands like GAP and
Uniqlo have shown improvement FX-neutral sales growth: Casual/fashion brands
Source: Company data.
Source: Company data.
Exhibit 44: Inventory to sales ratio came down a bit, on aggressive inventory control
US inventory to sales ratio
Source: US Census Bureau.
10.0%
17.0%
27.1%
‐3.0%
11.0%
‐3.2%
‐10% ‐5% 0% 5% 10% 15% 20% 25% 30% 35%
Nike
Adidas
Under Armour
Lululemon
Columbia
Puma
VFC 3Q15
4Q15
1Q16
2Q16
3Q16
FX Neutral Sales Growth
* Comparable Sales Growth
0.9%
‐3.0%
8.0%
‐8.0%
2.9%
2.0%
‐10% ‐5% 0% 5% 10% 15% 20%
Fast Retailing
GAP
Inditex
H&M
Ralph Lauren
PVH
L Brands
3Q15
4Q15
1Q16
2Q16
3Q16
* Uniqlo SSSG in Japan
FX Neutral Sales Growth
* Comparable Sales Growth
* Comparable Sales Growth
2.0
2.1
2.2
2.3
2.4
2.5
2.6
2.7
2.8
Jan-00
Jan-01
Jan-02
Jan-03
Jan-04
Jan-05
Jan-06
Jan-07
Jan-08
Jan-09
Jan-10
Jan-11
Jan-12
Jan-13
Jan-14
Jan-15
Jan-16
US clothing & accessories inventory : Sales ratio

December 1, 2016 Asia Pacific: Textile, Apparel & Footwear
Goldman Sachs Global Investment Research 31
Disclosure Appendix
Reg AC
I, Michelle Cheng, hereby certify that all of the views expressed in this report accurately reflect my personal views about the subject company or
companies and its or their securities. I also certify that no part of my compensation was, is or will be, directly or indirectly, related to the specific
recommendations or views expressed in this report.
Unless otherwise stated, the individuals listed on the cover page of this report are analysts in Goldman Sachs' Global Investment Research division.
Investment Profile
The Goldman Sachs Investment Profile provides investment context for a security by comparing key attributes of that security to its peer group and
market. The four key attributes depicted are: growth, returns, multiple and volatility. Growth, returns and multiple are indexed based on composites
of several methodologies to determine the stocks percentile ranking within the region's coverage universe.
The precise calculation of each metric may vary depending on the fiscal year, industry and region but the standard approach is as follows:
Growth is a composite of next year's estimate over current year's estimate, e.g. EPS, EBITDA, Revenue. Return is a year one prospective aggregate
of various return on capital measures, e.g. CROCI, ROACE, and ROE. Multiple is a composite of one-year forward valuation ratios, e.g. P/E, dividend
yield, EV/FCF, EV/EBITDA, EV/DACF, Price/Book. Volatility is measured as trailing twelve-month volatility adjusted for dividends.
Quantum
Quantum is Goldman Sachs' proprietary database providing access to detailed financial statement histories, forecasts and ratios. It can be used for
in-depth analysis of a single company, or to make comparisons between companies in different sectors and markets.
GS SUSTAIN
GS SUSTAIN is a global investment strategy aimed at long-term, long-only performance with a low turnover of ideas. The GS SUSTAIN focus list
includes leaders our analysis shows to be well positioned to deliver long term outperformance through sustained competitive advantage and
superior returns on capital relative to their global industry peers. Leaders are identified based on quantifiable analysis of three aspects of corporate
performance: cash return on cash invested, industry positioning and management quality (the effectiveness of companies' management of the
environmental, social and governance issues facing their industry).
Disclosures
Coverage group(s) of stocks by primary analyst(s)
Michelle Cheng: Greater China Retail, TW and HK Retail. Joshua Lu: Greater China Retail.
Greater China Retail: Anta Sports Products, Belle International Holdings, Eclat Textile Co., Global Brands Group, Li & Fung, Li Ning Co., Makalot
Industrial Co, Pou Sheng International Holdings, Samsonite International SA, Shenzhou International Group, Stella International Holdings, Sun Art
Retail Group, Yue Yuen Industrial, Yum China Holdings.
TW and HK Retail: MOMO.COM Inc., PChome Online Inc., President Chain Store, Uni-President Enterprises.
Company-specific regulatory disclosures
Compendium report: please see disclosures at http://www.gs.com/research/hedge.html. Disclosures applicable to the companies included in this
compendium can be found in the latest relevant published research
Distribution of ratings/investment banking relationships
Goldman Sachs Investment Research global Equity coverage universe
Rating Distribution Investment Banking Relationships
Buy Hold Sell Buy Hold Sell
Global 31% 55% 14% 64% 59% 53%
As of October 1, 2016, Goldman Sachs Global Investment Research had investment ratings on 2,921 equity securities. Goldman Sachs assigns stocks
as Buys and Sells on various regional Investment Lists; stocks not so assigned are deemed Neutral. Such assignments equate to Buy, Hold and Sell
for the purposes of the above disclosure required by the FINRA Rules. See 'Ratings, Coverage groups and views and related definitions' below. The
Investment Banking Relationships chart reflects the percentage of subject companies within each rating category for whom Goldman Sachs has
provided investment banking services within the previous twelve months.
Price target and rating history chart(s)
Compendium report: please see disclosures at http://www.gs.com/research/hedge.html. Disclosures applicable to the companies included in this
compendium can be found in the latest relevant published research
Regulatory disclosures
Disclosures required by United States laws and regulations
See company-specific regulatory disclosures above for any of the following disclosures required as to companies referred to in this report: manager
or co-manager in a pending transaction; 1% or other ownership; compensation for certain services; types of client relationships; managed/co-
managed public offerings in prior periods; directorships; for equity securities, market making and/or specialist role. Goldman Sachs trades or may
trade as a principal in debt securities (or in related derivatives) of issuers discussed in this report.
The following are additional required disclosures: Ownership and material conflicts of interest: Goldman Sachs policy prohibits its analysts,
professionals reporting to analysts and members of their households from owning securities of any company in the analyst's area of
coverage. Analyst compensation: Analysts are paid in part based on the profitability of Goldman Sachs, which includes investment banking

December 1, 2016 Asia Pacific: Textile, Apparel & Footwear
Goldman Sachs Global Investment Research 32
revenues. Analyst as officer or director: Goldman Sachs policy prohibits its analysts, persons reporting to analysts or members of their
households from serving as an officer, director, advisory board member or employee of any company in the analyst's area of coverage. Non-U.S. Analysts: Non-U.S. analysts may not be associated persons of Goldman, Sachs & Co. and therefore may not be subject to FINRA Rule 2241 or FINRA
Rule 2242 restrictions on communications with subject company, public appearances and trading securities held by the analysts.
Distribution of ratings: See the distribution of ratings disclosure above. Price chart: See the price chart, with changes of ratings and price targets in
prior periods, above, or, if electronic format or if with respect to multiple companies which are the subject of this report, on the Goldman Sachs
website at http://www.gs.com/research/hedge.html.
Additional disclosures required under the laws and regulations of jurisdictions other than the United States
The following disclosures are those required by the jurisdiction indicated, except to the extent already made above pursuant to United States laws
and regulations. Australia: Goldman Sachs Australia Pty Ltd and its affiliates are not authorised deposit-taking institutions (as that term is defined in
the Banking Act 1959 (Cth)) in Australia and do not provide banking services, nor carry on a banking business, in Australia. This research, and any
access to it, is intended only for "wholesale clients" within the meaning of the Australian Corporations Act, unless otherwise agreed by Goldman
Sachs. In producing research reports, members of the Global Investment Research Division of Goldman Sachs Australia may attend site visits and
other meetings hosted by the issuers the subject of its research reports. In some instances the costs of such site visits or meetings may be met in part
or in whole by the issuers concerned if Goldman Sachs Australia considers it is appropriate and reasonable in the specific circumstances relating to
the site visit or meeting. Brazil: Disclosure information in relation to CVM Instruction 483 is available at
http://www.gs.com/worldwide/brazil/area/gir/index.html. Where applicable, the Brazil-registered analyst primarily responsible for the content of this
research report, as defined in Article 16 of CVM Instruction 483, is the first author named at the beginning of this report, unless indicated otherwise at
the end of the text. Canada: Goldman Sachs Canada Inc. is an affiliate of The Goldman Sachs Group Inc. and therefore is included in the company
specific disclosures relating to Goldman Sachs (as defined above). Goldman Sachs Canada Inc. has approved of, and agreed to take responsibility for,
this research report in Canada if and to the extent that Goldman Sachs Canada Inc. disseminates this research report to its clients. Hong Kong: Further information on the securities of covered companies referred to in this research may be obtained on request from Goldman Sachs
(Asia) L.L.C. India: Further information on the subject company or companies referred to in this research may be obtained from Goldman Sachs
(India) Securities Private Limited, Research Analyst - SEBI Registration Number INH000001493, 951-A, Rational House, Appasaheb Marathe Marg,
Prabhadevi, Mumbai 400 025, India, Corporate Identity Number U74140MH2006FTC160634, Phone +91 22 6616 9000, Fax +91 22 6616 9001. Goldman
Sachs may beneficially own 1% or more of the securities (as such term is defined in clause 2 (h) the Indian Securities Contracts (Regulation) Act,
1956) of the subject company or companies referred to in this research report. Japan: See below. Korea: Further information on the subject
company or companies referred to in this research may be obtained from Goldman Sachs (Asia) L.L.C., Seoul Branch. New Zealand: Goldman
Sachs New Zealand Limited and its affiliates are neither "registered banks" nor "deposit takers" (as defined in the Reserve Bank of New Zealand Act
1989) in New Zealand. This research, and any access to it, is intended for "wholesale clients" (as defined in the Financial Advisers Act 2008) unless
otherwise agreed by Goldman Sachs. Russia: Research reports distributed in the Russian Federation are not advertising as defined in the Russian
legislation, but are information and analysis not having product promotion as their main purpose and do not provide appraisal within the meaning of
the Russian legislation on appraisal activity. Singapore: Further information on the covered companies referred to in this research may be obtained
from Goldman Sachs (Singapore) Pte. (Company Number: 198602165W). Taiwan: This material is for reference only and must not be reprinted
without permission. Investors should carefully consider their own investment risk. Investment results are the responsibility of the individual
investor. United Kingdom: Persons who would be categorized as retail clients in the United Kingdom, as such term is defined in the rules of the
Financial Conduct Authority, should read this research in conjunction with prior Goldman Sachs research on the covered companies referred to
herein and should refer to the risk warnings that have been sent to them by Goldman Sachs International. A copy of these risks warnings, and a
glossary of certain financial terms used in this report, are available from Goldman Sachs International on request.
European Union: Disclosure information in relation to Article 4 (1) (d) and Article 6 (2) of the European Commission Directive 2003/125/EC is available
at http://www.gs.com/disclosures/europeanpolicy.html which states the European Policy for Managing Conflicts of Interest in Connection with
Investment Research.
Japan: Goldman Sachs Japan Co., Ltd. is a Financial Instrument Dealer registered with the Kanto Financial Bureau under registration number Kinsho
69, and a member of Japan Securities Dealers Association, Financial Futures Association of Japan and Type II Financial Instruments Firms
Association. Sales and purchase of equities are subject to commission pre-determined with clients plus consumption tax. See company-specific
disclosures as to any applicable disclosures required by Japanese stock exchanges, the Japanese Securities Dealers Association or the Japanese
Securities Finance Company.
Ratings, coverage groups and views and related definitions
Buy (B), Neutral (N), Sell (S) -Analysts recommend stocks as Buys or Sells for inclusion on various regional Investment Lists. Being assigned a Buy
or Sell on an Investment List is determined by a stock's return potential relative to its coverage group as described below. Any stock not assigned as
a Buy or a Sell on an Investment List is deemed Neutral. Each regional Investment Review Committee manages various regional Investment Lists to a
global guideline of 25%-35% of stocks as Buy and 10%-15% of stocks as Sell; however, the distribution of Buys and Sells in any particular coverage
group may vary as determined by the regional Investment Review Committee. Regional Conviction Buy and Sell lists represent investment
recommendations focused on either the size of the potential return or the likelihood of the realization of the return.
Return potential represents the price differential between the current share price and the price target expected during the time horizon associated
with the price target. Price targets are required for all covered stocks. The return potential, price target and associated time horizon are stated in each
report adding or reiterating an Investment List membership.
Coverage groups and views: A list of all stocks in each coverage group is available by primary analyst, stock and coverage group at
http://www.gs.com/research/hedge.html. The analyst assigns one of the following coverage views which represents the analyst's investment outlook
on the coverage group relative to the group's historical fundamentals and/or valuation. Attractive (A). The investment outlook over the following 12
months is favorable relative to the coverage group's historical fundamentals and/or valuation. Neutral (N). The investment outlook over the
following 12 months is neutral relative to the coverage group's historical fundamentals and/or valuation. Cautious (C). The investment outlook over
the following 12 months is unfavorable relative to the coverage group's historical fundamentals and/or valuation.
Not Rated (NR). The investment rating and target price have been removed pursuant to Goldman Sachs policy when Goldman Sachs is acting in an
advisory capacity in a merger or strategic transaction involving this company and in certain other circumstances. Rating Suspended (RS). Goldman
Sachs Research has suspended the investment rating and price target for this stock, because there is not a sufficient fundamental basis for
determining, or there are legal, regulatory or policy constraints around publishing, an investment rating or target. The previous investment rating and
price target, if any, are no longer in effect for this stock and should not be relied upon. Coverage Suspended (CS). Goldman Sachs has suspended
coverage of this company. Not Covered (NC). Goldman Sachs does not cover this company. Not Available or Not Applicable (NA). The
information is not available for display or is not applicable. Not Meaningful (NM). The information is not meaningful and is therefore excluded.
December 1, 2016 Asia Pacific: Textile, Apparel & Footwear
Goldman Sachs Global Investment Research 33
Global product; distributing entities
The Global Investment Research Division of Goldman Sachs produces and distributes research products for clients of Goldman Sachs on a global
basis. Analysts based in Goldman Sachs offices around the world produce equity research on industries and companies, and research on
macroeconomics, currencies, commodities and portfolio strategy. This research is disseminated in Australia by Goldman Sachs Australia Pty Ltd
(ABN 21 006 797 897); in Brazil by Goldman Sachs do Brasil Corretora de Títulos e Valores Mobiliários S.A.; in Canada by either Goldman Sachs
Canada Inc. or Goldman, Sachs & Co.; in Hong Kong by Goldman Sachs (Asia) L.L.C.; in India by Goldman Sachs (India) Securities Private Ltd.; in
Japan by Goldman Sachs Japan Co., Ltd.; in the Republic of Korea by Goldman Sachs (Asia) L.L.C., Seoul Branch; in New Zealand by Goldman Sachs
New Zealand Limited; in Russia by OOO Goldman Sachs; in Singapore by Goldman Sachs (Singapore) Pte. (Company Number: 198602165W); and in
the United States of America by Goldman, Sachs & Co. Goldman Sachs International has approved this research in connection with its distribution in
the United Kingdom and European Union.
European Union: Goldman Sachs International authorised by the Prudential Regulation Authority and regulated by the Financial Conduct Authority
and the Prudential Regulation Authority, has approved this research in connection with its distribution in the European Union and United Kingdom;
Goldman Sachs AG and Goldman Sachs International Zweigniederlassung Frankfurt, regulated by the Bundesanstalt für
Finanzdienstleistungsaufsicht, may also distribute research in Germany.
General disclosures
This research is for our clients only. Other than disclosures relating to Goldman Sachs, this research is based on current public information that we
consider reliable, but we do not represent it is accurate or complete, and it should not be relied on as such. The information, opinions, estimates and
forecasts contained herein are as of the date hereof and are subject to change without prior notification. We seek to update our research as
appropriate, but various regulations may prevent us from doing so. Other than certain industry reports published on a periodic basis, the large
majority of reports are published at irregular intervals as appropriate in the analyst's judgment.
Goldman Sachs conducts a global full-service, integrated investment banking, investment management, and brokerage business. We have
investment banking and other business relationships with a substantial percentage of the companies covered by our Global Investment Research
Division. Goldman, Sachs & Co., the United States broker dealer, is a member of SIPC (http://www.sipc.org).
Our salespeople, traders, and other professionals may provide oral or written market commentary or trading strategies to our clients and principal
trading desks that reflect opinions that are contrary to the opinions expressed in this research. Our asset management area, principal trading desks
and investing businesses may make investment decisions that are inconsistent with the recommendations or views expressed in this research.
The analysts named in this report may have from time to time discussed with our clients, including Goldman Sachs salespersons and traders, or may
discuss in this report, trading strategies that reference catalysts or events that may have a near-term impact on the market price of the equity
securities discussed in this report, which impact may be directionally counter to the analyst's published price target expectations for such stocks. Any
such trading strategies are distinct from and do not affect the analyst's fundamental equity rating for such stocks, which rating reflects a stock's
return potential relative to its coverage group as described herein.
We and our affiliates, officers, directors, and employees, excluding equity and credit analysts, will from time to time have long or short positions in,
act as principal in, and buy or sell, the securities or derivatives, if any, referred to in this research.
The views attributed to third party presenters at Goldman Sachs arranged conferences, including individuals from other parts of Goldman Sachs, do
not necessarily reflect those of Global Investment Research and are not an official view of Goldman Sachs.
Any third party referenced herein, including any salespeople, traders and other professionals or members of their household, may have positions in
the products mentioned that are inconsistent with the views expressed by analysts named in this report.
This research is not an offer to sell or the solicitation of an offer to buy any security in any jurisdiction where such an offer or solicitation would be
illegal. It does not constitute a personal recommendation or take into account the particular investment objectives, financial situations, or needs of
individual clients. Clients should consider whether any advice or recommendation in this research is suitable for their particular circumstances and, if
appropriate, seek professional advice, including tax advice. The price and value of investments referred to in this research and the income from them
may fluctuate. Past performance is not a guide to future performance, future returns are not guaranteed, and a loss of original capital may occur.
Fluctuations in exchange rates could have adverse effects on the value or price of, or income derived from, certain investments.
Certain transactions, including those involving futures, options, and other derivatives, give rise to substantial risk and are not suitable for all investors.
Investors should review current options disclosure documents which are available from Goldman Sachs sales representatives or at
http://www.theocc.com/about/publications/character-risks.jsp. Transaction costs may be significant in option strategies calling for multiple purchase
and sales of options such as spreads. Supporting documentation will be supplied upon request.
All research reports are disseminated and available to all clients simultaneously through electronic publication to our internal client websites. Not all
research content is redistributed to our clients or available to third-party aggregators, nor is Goldman Sachs responsible for the redistribution of our
research by third party aggregators. For research, models or other data available on a particular security, please contact your sales representative or
go to http://360.gs.com.
Disclosure information is also available at http://www.gs.com/research/hedge.html or from Research Compliance, 200 West Street, New York, NY
10282.
© 2016 Goldman Sachs.
No part of this material may be (i) copied, photocopied or duplicated in any form by any means or (ii) redistributed without the prior written consent of The Goldman Sachs Group, Inc.