asia pacific travels retail association...travel retail sector throughout the region and beyond. the...
TRANSCRIPT

Economic Impact of Duty Free and Travel Retail
in Asia Pacific 15 October 2019
FINAL REPORT


Economic Impact of Duty Free and Travel Retail in the Asia Pacific Region – FINAL REPORT 15 October 2019 i
Executive Summary
The duty free and travel retail industry is a fast-growing sector of the Asia Pacific economy that comprises the sale of goods to international travellers.1 Duty free and travel retail is available for purchase at airports and on airlines, on cruises and ferries, and at downtown duty free shops and land border crossings. In addition to duty free, full-retail shops (referred to as travel retail) are also available to travellers. These non-duty free offerings can include convenience stores, book stores and specialty stores selling fully taxable goods or services located post-security in airports or on cruise and ferry ships.
The Duty Free World Council (DFWC) and the Asia Pacific Travel Retail Association (APTRA) commissioned this study to estimate the economic contribution made by duty free and travel retail industry in the Asia Pacific region.2 The duty free and travel retail sector contributes significantly to economic development of countries in the Asia Pacific region through the employment and activity it generates. Furthermore, it supports and facilitates wider economic activity in other industry sectors, such as aviation, maritime travel, and tourism, supporting the growth and development of economies in the region.
1 Duty Free World Council (http://dfworldcouncil.com/what-is-duty free-travel-retail/). The Duty Free World Council, the DFWC, is the industry association representing the interests of the global duty free and travel retail channel and has the overall objective of creating the optimal operating environment for the industry that will allow it to achieve its full potential. Asia Pacific Travel Retail Association (http://www.aptra.asia/), APTRA is the trade association for the duty free and travel retail industry in the Asia Pacific region, serving all members and the industry to help grow the business and protect it when challenges arise. The geographical area covered by APTRA includes countries in Eastern Asia, South Eastern Asia, South Central Asia and Oceania. 2 The Asia Pacific region is comprised of the sub-regions - East Asia, Southeast Asia, Oceania, and South Asia.
Key Findings
▪ In 2017, an estimated US$36.2 billion was spent on duty free and travel retail in the Asia Pacific region. The principal components included the following:
o Airports and airlines accounted for nearly US$21.2 billion in duty free and travel retail sales, of which 75% occurred in the sub-region of East Asia.
• Non-aeronautical revenues such as duty free and travel retail provide airports with the funds needed to continue to invest in airport infrastructure and service improvements.
o Land and maritime duty free and travel retail sales amounted to approximately US$15 billion.
o 79% of all duty free and travel retail sales in the region occurred in East Asia.
▪ Duty free and travel retail spending in the Asia Pacific region accounted for an estimated 140,900 direct jobs and US$7.6 billion in direct GDP.
▪ Together with the businesses that supply the goods and services (indirect impacts) and spending of employees in the wider economy (induced impacts), duty free and travel retail in Asia Pacific is estimated to support a total of 320,200 jobs and US$14.7 billion in GDP.

ii Economic Impact of Duty Free and Travel Retail in the Asia Pacific Region – FINAL REPORT 15 October 2019
Key Attributes of Asia Pacific’s Duty Free and Travel Retail Industry
The Asia Pacific region accounts for roughly 60% of the world’s population. According to Generation Research, the global duty free and travel retail industry had sales estimated to total US$69 billion in 2017. The Asia Pacific region is estimated to account for approximately 45% of global sales, or approximately US$32 billion.3 Based on an analysis that re-estimates airport sales in the region using other industry sources, InterVISTAS estimates that duty free and travel retail sales in Asia Pacific could be higher, at approximately US$36 billion in 2017.
The region is home to many different countries, cultures, political systems, and stages of economic development. Asia Pacific’s duty free and travel retail sector has the following key attributes:
• Continuing Duty Free and Travel Retail Sector Growth. The region is the global leader in duty free and travel retail sales and its growth trajectory will continue to be positive. From 2000-2017, the region’s sector grew at an average of 13% per annum. This compares to the global average of 8% per annum. Europe and the Americas had lower annual average growth rates over the same time frame at 4% and 5%, respectively. The Asia Pacific region has vast potential for continued future growth due to the region’s large population base and growing economies which are resulting in rising incomes, increasing buying power and appetite for products, and an increasing desire and propensity to travel. These are all key ingredients for the continued growth and development of the duty free and travel retail sector in the region.
• Increasing Propensity to Travel by Mainland Chinese Travellers. Mainland China accounts for 36% of the Asia Pacific region’s population and over 40% of its estimated GDP. The development of Mainland Chinese travel and tourism has been and will continue to be vital to the growth of the region’s duty free and travel retail sector. W ith improving living standards, Mainland Chinese residents have shown a growing propensity to travel, and due to their numbers and purchasing power, they have a significant impact on the duty free and travel retail sector throughout the region and beyond. The sector has had to cater to Mainland Chinese shoppers’ product demands (e.g., availability of luxury brands) and service requirements (e.g., availability of mobile payment technologies like WeChat Pay or AliPay). Korean duty free sales have been a major beneficiary of Mainland Chinese demand, which is largely supported by the daigou trade.4
• Potential for Increased Travel by Indian Travellers. The growth of the Indian economy and of its middle class has increased the desire to travel, with airports in the country building up their duty free and travel retail offerings as a result. Currently, locals are the main customers, with many ordering their duty free goods for delivery or pick-up after they have arrived home from their international travel.
• Increasing Presence of Downtown Shops. In Asia Pacific, and especially Korea, there has been a proliferation of downtown duty free shops. These shops provide travellers with opportunities to purchase goods at any time during their trip, rather than just before departure (e.g., at the airport). Many duty free and travel retail operators in the region have operations at both downtown and airport locations (e.g., DFS at Hong Kong International Airport and in Causeway Bay/Tsim Sha Tsui (main shopping districts in Hong Kong/Kowloon)). The presence of downtown shops can therefore be complementary to an operator’s airport operations, though in other circumstances there is likely to be competition between airport and downtown locations and between operators.
3 Generation Research figures listed in this report incorporate the Indian Subcontinent as part of the Asia Pacific region. This is in contrast to the conventional regional breakdowns used by Generation Research, which include the Indian Subcontinent as part of the Middle East region. 4 “Daigou” or “surrogate shopping” involves buying products abroad (usually luxury goods) and selling to customers located in Mainland China. This is discussed in more detail in Sections 3.3.1 and 3.3.2.

Economic Impact of Duty Free and Travel Retail in the Asia Pacific Region – FINAL REPORT 15 October 2019 iii
• More Asians are Cruising. Cruising is a relatively new travel experience for Asians but is growing in popularity. In comparison to more established cruise markets, Asians prefer cruises of shorter duration (e.g., 4 to 5 days) and to travel in larger party sizes that include extended family and multiple generations. This has implications for on-board duty free and travel retail sales; there is less time to shop and potentially fewer active shoppers in family groups. Nevertheless, Asian travellers’ increased propensity to cruise is reflected in the expansion and tailoring of cruise ship duty free offerings to this growing market.
• Growing Importance of E-Commerce. The Asia Pacific region is the global leader in the development, diffusion, and use of e-commerce and related technologies. Duty free and travel retail operators have developed apps designed to attract and entice customers to buy products by offering discounts and other incentives (e.g., Red by Dufry). Airports in the Asia Pacific region also have well-developed internet and e-commerce platforms to service their customers, with several airports providing visitors with the ability to purchase goods online which are then available for pick-up at the airport.
Estimated Duty Free and Travel Retail Sales in Asia Pacific
Total duty free and travel retail sales in the Asia Pacific region are estimated to be US$36 billion in 2017.5 Nearly 60% of revenues are attributable to aviation sales channels at over US$21 billion. The remaining US$15 billion in sales revenues are handled through the cruise, ferry, land border, and downtown shops. East Asia dominates with the lion’s share of sales revenue across all sales channels at nearly US$29 billion. Table ES-1 summarizes the estimated duty free and travel retail sales in the Asia Pacific region in 2017.
Table ES-1: Total Duty Free and Travel Retail Sales in Asia Pacific, 2017
Region Aviation
(US$ Billions)
Maritime
(US$ Billions)
Land
(US$ Billions)
All Channels
Total
(US$ Billions)
East Asia $15.8 $0.4 $12.6 $28.7
Southeast Asia $3.4 $0.2 $1.5 $5.0
Oceania $1.1 $0.3 $0.1 $1.5
South Asia $1.0 <$0.1 <$0.1 $1.0
Asia Pacific Total $21.2 $0.8 $14.2 $36.2
Note 1: Figures may not sum to totals due to rounding. Aviation covers airports and airlines, maritime covers cruise and ferries, land covers downtown shops and border crossings. Refer to Appendix A for the listing of countries included in each sub-region. Note 2: Figures above incorporate InterVISTAS’ re-estimate of duty free and travel retail sales at airports, using data from ACI and Moodie Davitt, which resulted in higher airport sales than reported by Generation Research. These figures are used as the basis for the economic impact analysis for airports, presented in Section 7. Bottom-line sales figures for airlines, ferries, and “other” sales channels are consistent with information from Generation Research and used in the computations of economic impact that are displayed in Section 7.
5 This figure incorporates InterVISTAS’ estimates of duty free and travel retail sales at airports, which has been re-estimated using data from ACI and Moodie Davitt, which resulted in higher airport sales than reported by Generation Research. These figures are used as the basis for the economic impact analysis for airports, presented in Section 7. Bottom-line sales figures for airlines, ferries, and “other” sales channels are consistent with information from Generation Research and used in the computations of economic impact that are displayed in Section 7.

iv Economic Impact of Duty Free and Travel Retail in the Asia Pacific Region – FINAL REPORT 15 October 2019
Estimated Total Economic Impact of Duty Free and Travel Retail in Asia Pacific
The total economic impact of duty free and travel retail in Asia Pacific amounts to an estimated 320,200 jobs and US$14.7 billion in GDP. This includes activities directly related to the sales channel and the indirect and induced impacts that flow from that. The combined total impacts of duty free and travel retail in Asia Pacific are summarised in Table ES-2 and Table ES-3 below.
East Asia accrues the largest impacts, generating a total of 225,300 jobs and US$11.3 billion in GDP, with the remainder of Asia generating a combined total of 87,100 jobs and US$2.7 billion in GDP. Duty free and travel retail activities in Oceania support approximately 7,800 jobs and US$0.7 billion in GDP.
Of the total jobs generated by duty free and travel retail, approximately 44% per cent is directly generated by duty free and travel retail, such as cashiers and brand representatives working in the storefront. The remainder are accounted for by the broader (indirect and induced) economic impacts of the industry including, for example, the indirect jobs from suppliers to the duty free and travel retail stores, or the induced impact of duty free and travel retail employees spending their wages in the general economy.
Table ES-2: Total Employment Economic Impacts in Asia Pacific, 2017
Region Aviation
Total Jobs
Maritime
Total Jobs
Land
Total Jobs
All Channels
Total Jobs
East Asia 151,600 3,400 70,200 225,300
Southeast Asia 48,400 2,300 19,300 70,000
Oceania 5,800 1,300 700 7,800
South Asia 16,300 200 600 17,100
Asia Pacific Total 222,100 7,300 90,800 320,200
Note: Figures may not sum to totals due to rounding. Aviation covers airports and airlines, maritime covers cruise and ferries, land covers downtown shops and border crossings. Economic impacts in each sub-region were calculated using available multipliers from Input Output tables for representative countries within sub-region. Further information on the economic multipliers used in the study can be found in Appendix B.
Economic Impact of Duty Free and Travel Retail in the Asia Pacific Region – FINAL REPORT 15 October 2019 v
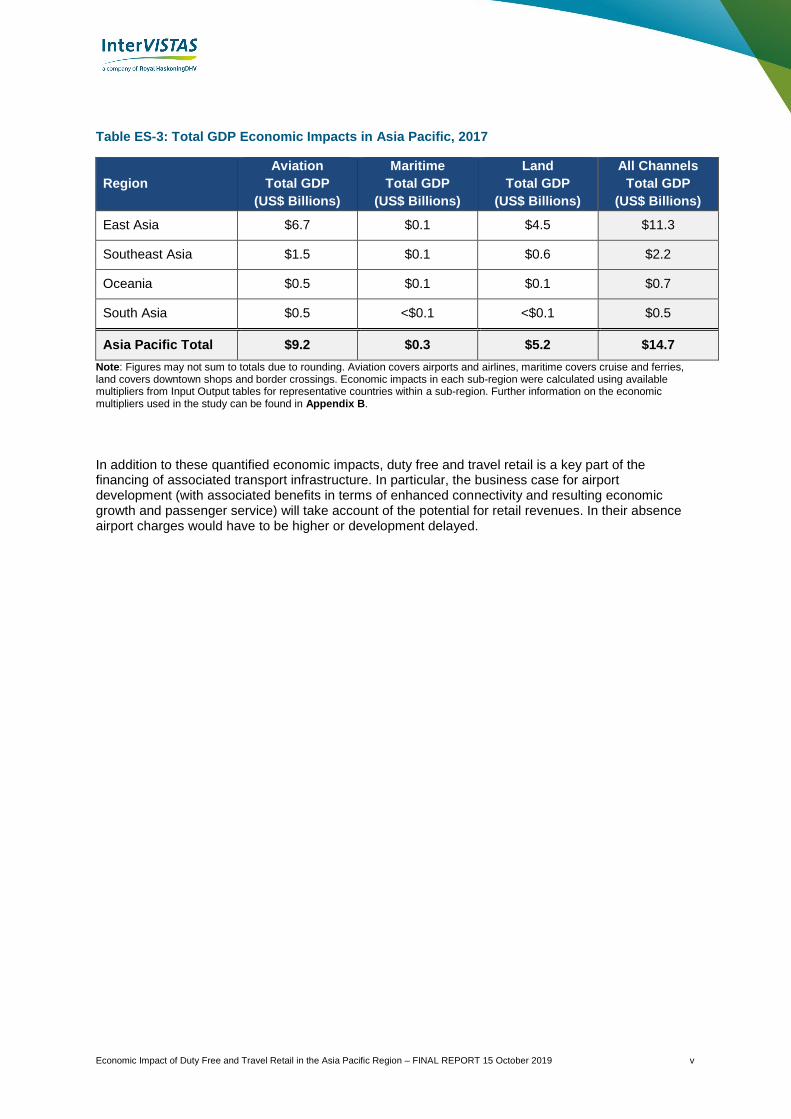
Table ES-3: Total GDP Economic Impacts in Asia Pacific, 2017
Region
Aviation
Total GDP
(US$ Billions)
Maritime
Total GDP
(US$ Billions)
Land
Total GDP
(US$ Billions)
All Channels
Total GDP
(US$ Billions)
East Asia $6.7 $0.1 $4.5 $11.3
Southeast Asia $1.5 $0.1 $0.6 $2.2
Oceania $0.5 $0.1 $0.1 $0.7
South Asia $0.5 <$0.1 <$0.1 $0.5
Asia Pacific Total $9.2 $0.3 $5.2 $14.7
Note: Figures may not sum to totals due to rounding. Aviation covers airports and airlines, maritime covers cruise and ferries, land covers downtown shops and border crossings. Economic impacts in each sub-region were calculated using available multipliers from Input Output tables for representative countries within a sub-region. Further information on the economic multipliers used in the study can be found in Appendix B.
In addition to these quantified economic impacts, duty free and travel retail is a key part of the financing of associated transport infrastructure. In particular, the business case for airport development (with associated benefits in terms of enhanced connectivity and resulting economic growth and passenger service) will take account of the potential for retail revenues. In their absence airport charges would have to be higher or development delayed.

vi Economic Impact of Duty Free and Travel Retail in the Asia Pacific Region – FINAL REPORT 15 October 2019
Contents
Executive Summary ....................................................................................................... i
1 Introduction ............................................................................................................ 1
2 Global duty free and travel retail trends and patterns ......................................... 3
2.1 Overview .......................................................................................................................... 3 2.2 Sales Growth .................................................................................................................... 5 2.3 Product Categories ........................................................................................................... 8 2.4 Summary .......................................................................................................................... 9
3 Duty Free and Travel Retail Trends in the Asia Pacific Region ........................ 11
3.1 Introduction ..................................................................................................................... 11 3.2 Travel and Passenger Flows within the Asia Pacific Region and Global Connections .. 12 3.3 Key Market Dynamics within the Region ........................................................................ 13 3.4 Changing Consumer Habits and Growth of E-Commerce ............................................. 23 3.5 Improving Physical Retail Spaces .................................................................................. 25 3.6 A Diverse Duty Free Market within the Asia Pacific Region ........................................... 26 3.7 Summary of Duty Free and Travel Retail Trends in the Asia Pacific Region ................ 27
4 Aviation Sales Channels ...................................................................................... 32
4.1 Airport Sector .................................................................................................................. 33 4.2 Airline Sector .................................................................................................................. 49 4.3 Aviation Channels Summary .......................................................................................... 53
5 Land Sales Channels ........................................................................................... 57
5.1 Introduction ..................................................................................................................... 57 5.2 Land Borders .................................................................................................................. 57 5.3 Downtown Duty Free Retail ............................................................................................ 62 5.4 Land Channels Summary ............................................................................................... 67
6 Maritime Sales Channels ..................................................................................... 70
6.1 Cruises ............................................................................................................................ 70 6.2 Ferries ............................................................................................................................. 79 6.3 Maritime Channels Summary ......................................................................................... 80
7 Economic Impacts of Duty Free and Travel Retail in the Asia Pacific Region. 84
7.1 Total Sales by Sub-Region and Sector .......................................................................... 84 7.2 Defining Economic Impacts ............................................................................................ 85 7.3 Direct Economic Impacts ................................................................................................ 86 7.4 Indirect and Induced Economic Impacts......................................................................... 88 7.5 Total Economic Impacts ................................................................................................. 90
8 Conclusions and Key Messages ......................................................................... 91
8.1 Key Attributes of Asia Pacific’s Duty Free and Travel Retail Industry ............................ 92 8.2 Estimated Duty Free and Travel Retail Sales in Asia Pacific ......................................... 93 8.3 Estimated Total Economic Impact of Duty Free and Travel Retail in Asia Pacific ......... 94
Appendix A: List of Countries in Study Scope by Sub-Region ............................... 96
Appendix B: Economic Multipliers and Input-Output Tables .................................. 98
Appendix C: Asia Pacific Region Population, GDP, and GDP per Capita ............. 100
Appendix D: Air Travel Patterns within the Asia Pacific Region ........................... 104
Appendix E: Duty Free Limits within Asia Pacific Region .................................... 106
Economic Impact of Duty Free and Travel Retail in the Asia Pacific Region – FINAL REPORT 15 October 2019 1
1 Introduction
The Duty Free World Council (DFWC) and the Asia Pacific Travel Retail Association (APTRA) commissioned InterVISTAS Consulting Inc (InterVISTAS) and Optimas Management Group (Optimas) to undertake a study of the economic impacts of the duty free and travel retail market in the Asia Pacific region. The purpose of the study is to examine and communicate the contribution that the duty free and travel retail industry contributes to economic prosperity in the Asia Pacific region. This is primarily through direct economic activity and employment generation, but the industry also facilitates the profitability of broader economic activities, particularly aviation (most notably, the financing of airport infrastructure) and tourism. The study follows two previous studies on the economic impacts of duty free and travel retail in Europe and the Americas.6,7
According to the DFWC, duty free and travel retail is defined as:
“[A] global industry that encompasses the sale of goods to international travellers. Duty free shops are exempt from the payment of certain local or national taxes and duties, normally with the requirement that the goods are only sold to travellers who will take them out of the country. Products that can be sold duty free vary by jurisdiction and different rules based on duty calculations, allowance restrictions and other factors.”8
The duty free and travel retail industry, globally, is estimated to have generated $69 billion in sales in 2017.9
International travellers have access to a variety of products including fashion and accessories, alcohol, fragrances and cosmetics, food and confectionery, tobacco, and jewellery and watches. The continued growth and development of the duty free and travel retail sector supports transport modes through the financial contribution it makes, and global tourism by further incentivising international travel by air, land, and sea.
Economic impact is a measure of the spending and employment associated with a sector of the economy, a specific project, or a change in government policy or regulation. In this case, economic impact refers to the economic contribution associated with the duty free and travel retail sector through its various channels of distribution at airports, on airlines, at land border crossings and downtown duty free shops, and on cruises and ferries. The three major components of economic impact are classified as direct, indirect, and induced impacts. Together, they provide a snapshot of economic activity and employment generated by the duty free and travel retail sectors in the Asia Pacific region.
6 Economic Impact of duty free and travel retail in Europe, published at http://dfworldcouncil.com/wp-content/uploads/2016/03/DFWC-European-Economic-Impact-Report.pdf 7 Weblink for Americas study is published at http://dfworldcouncil.com/wp-content/uploads/2018/09/Full-Report_Economic-Impact-of-Duty-Free-and-Travel-Retail-in-the-Americ....pdf 8 Source: http://dfworldcouncil.com/what-is-duty free-travel-retail/ 9 Source: Generation Research. Generation Research is a firm based in Sweden that provides data on duty free & travel retail statistics, globally. Their website can be found at: http://www.generation.se/
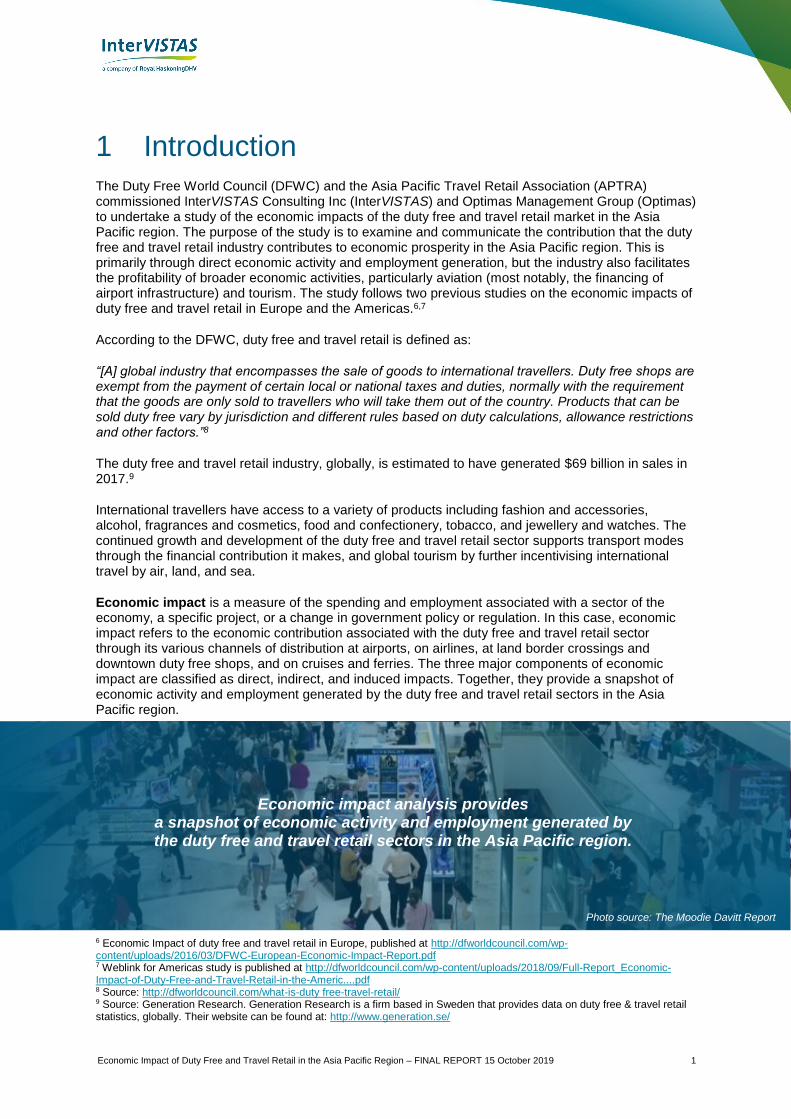
Economic impact analysis provides a snapshot of economic activity and employment generated by the duty free and travel retail sectors in the Asia Pacific region.
Photo source: The Moodie Davitt Report
2 Economic Impact of Duty Free and Travel Retail in the Asia Pacific Region – FINAL REPORT 15 October 2019.
The report is structured as follows:
• Section 2 provides a contextual overview of the global duty free and travel retail market and a regional focus on Asia Pacific’s key themes and trends;
• Section 3 reviews and details the key themes and trends of the duty free and travel retail market in the Asia Pacific region;
• Section 4 summarises the role that aviation channels have in the duty free and travel retail market, including airports and airline sales;
• Section 5 summarises the role that land based sales channels have in the duty free and travel retail market, including downtown retail and land border crossings;
• Section 6 summarises the role that maritime channels have in the duty free and travel retail market, including cruises and ferries;
• Section 7 sets out the economic impacts of the duty free and travel retail market in the Asia Pacific region; and
• Section 8 draws out the conclusions and key messages from the study.

Economic Impact of Duty Free and Travel Retail in the Asia Pacific Region – FINAL REPORT 15 October 2019 3
2 Global duty free and travel retail trends and patterns
2.1 Overview
This chapter provides a detailed overview of the global duty free and travel retail sector. Data and statistics are provided by world region, sales channel, and product group, where possible. Historical time series data is also presented. The source of the data in this chapter is Generation Research, unless otherwise specified.10,11
The DFWC defines duty free and travel retail as the sale of goods to international travellers. Duty free and travel retail products are purchased by locals and visitors alike when leaving or arriving in a country. Duty free and travel retail is available through several different sales channels including at airports and on aircraft with some airlines, on cruises and ferries, and also at land border crossings or at downtown locations, which are quite prevalent in the Asia Pacific region.
Total global duty free and travel retail sales for 2017 are estimated at US$69 billion, up 9% from 2016 and nearly 3.5 times higher since 2000. Figure 2-1 shows total duty free and travel retail sales, by world region and sales channel in 2017. According to Generation Research, sales in Asia Pacific made up 45% of overall global sales, the highest of all world regions. Europe accounted for nearly 30% of global sales, followed by the Americas with 17%. Asia Pacific’s growth in global share has been at the expense of Europe and the Americas.
As shown in Figure 2-2, Airports (55%) and airlines (4%), combined, accounted for 59% of duty free and travel retail sales globally. In the Asia Pacific region, airports (50%) and airlines (3%), accounted for 52% of duty free and travel retail sales. Asia Pacific’s “other” category accounted for the remaining
10 Generation Research (http://www.generation.se/ ) is a firm based in Sweden that provides data on duty free & travel retail statistics, globally. 11 All figures in this chapter refer to Generation Research figures, where applicable, on airport sales.
Key Findings
▪ Total global duty free and travel retail sales have more than tripled, from an estimated US$20 billion in 2000 to an estimated US$69 billion in 2017. This is up from US$60 billion in 2016.
▪ According to Generation Research, the Asia Pacific region accounted for 45% of global duty free and travel retail sales in 2017, the largest market for the industry. This is up from 21% in 2000.
▪ The compound annual growth rate from 2000 to 2017 in duty free and travel retail sales was 13% in the Asia Pacific region, the highest of all world regions.
▪ Fragrances/cosmetics, wines/spirits, and fashion/accessories accounted for approximately 67% of total sales in the global duty free and travel retail sector in 2017. In Asia Pacific, these product categories made up 75% of all duty free and travel retail sales. The Americas mirrored the world profile, whereas these product categories made up 60% of Europe’s sales.

4 Economic Impact of Duty Free and Travel Retail in the Asia Pacific Region – FINAL REPORT 15 October 2019.
48% of sales and was made up of sales at land border shops, diplomatic stores, downtown shops, port shops, ferries and cruises.12
Figure 2-1: Duty free and travel retail sales by region and sales channel, 2017
Source: Generation Research. The “Other” category includes: land border shops, diplomatic stores, downtown shops, port shops, and cruises. Note 1: The Indian subcontinent is included as part of Asia Pacific in Figure 2-1. Note 2: The airport share, and volume of duty free and travel retail sales presented in Figure 2-1 may be understated for Asia Pacific. InterVISTAS Consulting compared the data sourced from Generation Research with information provided by ACI and Moodie Davitt, which indicates higher sales in duty free and travel retail for the airport sector than Generation Research’s figures. As such, InterVISTAS opted to use information from Moodie Davitt and ACI as the basis for the economic impact analysis for the airport sector, presented in Section 7. Bottom-line sales figures for airlines, ferries, and “other” sales channels are consistent with information from Generation Research and used in the computations of economic impact that are displayed in Section 7.
12 Per Generation Research, a further breakdown of the components of the “Other” category is not available.
$0
$5,000
$10,000
$15,000
$20,000
$25,000
$30,000
$35,000
Europe Americas Africa Asia Pacific Middle East
US$
Mill
ion
Airports Airlines Ferries Other

Economic Impact of Duty Free and Travel Retail in the Asia Pacific Region – FINAL REPORT 15 October 2019 5
Figure 2-2: Duty free and travel retail sales channel shares by region, 2017
Source: Generation Research. The “Other” category includes: land border shops, diplomatic stores, downtown shops, port shops, and cruises. Note 1: The Indian subcontinent is included as part of Asia Pacific in Figure 2-2. Note 2: The airport share, and volume of duty free and travel retail sales presented in Figure 2-2 may be understated for Asia Pacific. InterVISTAS Consulting compared the data sourced from Generation Research with information provided by ACI and Moodie Davitt, which indicates higher sales in duty free and travel retail for the airport sector than Generation Research’s figures. As such, InterVISTAS opted to use information from Moodie Davitt and ACI as the basis for the economic impact analysis for the airport sector, presented in Section 7. Bottom-line sales figures for airlines, ferries, and “other” sales channels are consistent with information from Generation Research and used in the computations of economic impact that are displayed in Section 7.
2.2 Sales Growth
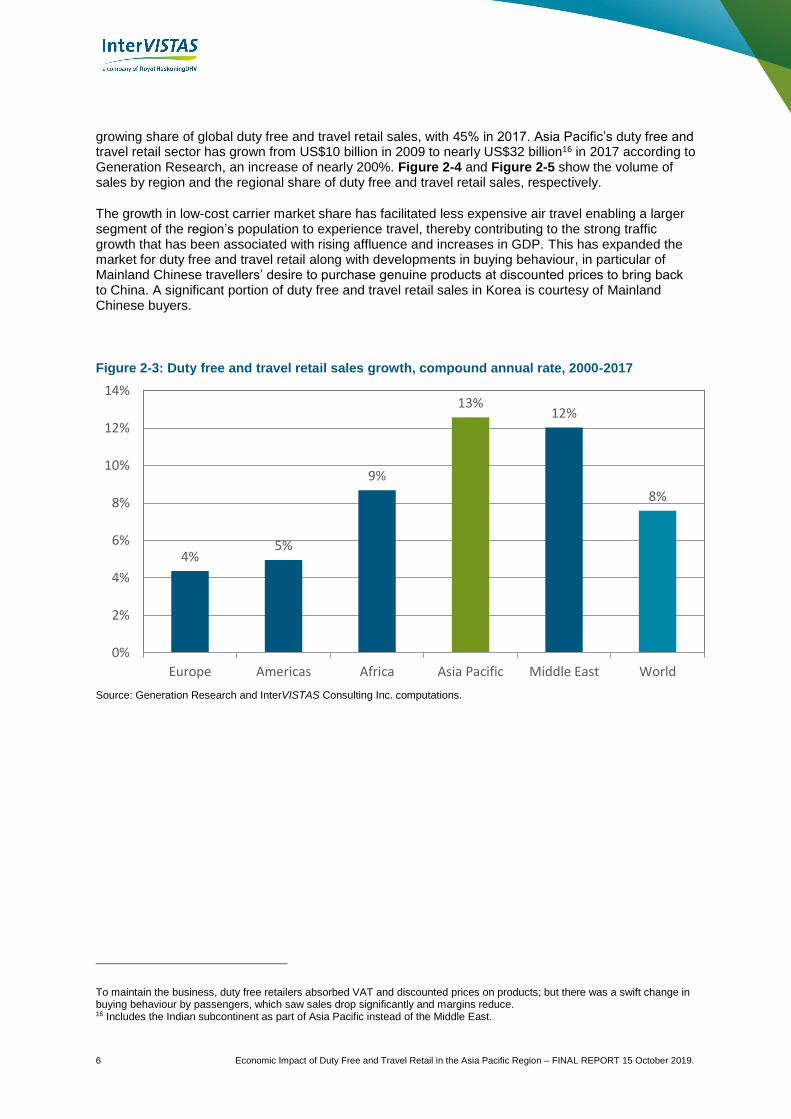
Global duty free and travel retail sales volume has grown at a compound annual growth rate (CAGR or annual rate)13 of 8% (as shown in Figure 2-3) between 2000 and 2017. This compares to nominal world Gross Domestic Product (GDP) growth of 5.3% per year over the same period.14 Asia Pacific and the Middle East have experienced the greatest growth, with annual rates of 13% and 12%, respectively. By comparison, Europe and the Americas have grown moderately at 4% and 5%, respectively.
In 2000, Europe led the sector with 50% of global sales;15 however, by 2012 Asia Pacific surpassed Europe with 36% of global sales, compared to Europe’s 35%. Asia Pacific continues to capture a
13 All subsequent references to annual growth rates in this report refer to compound annual growth rates. 14 Source: Worldbank. (https://data.worldbank.org/indicator/ny.gdp.mktp.cd?name_desc=false) World GDP in 2000 was $33.6 trillion in 2000 and $80.9 trillion in 2017, representing a cumulative annual growth rate of 5.3% per year. 15 The year 1999 was a seminal moment for duty free in Europe as all intra-EU duty free sales were abolished. This meant that all intra-EU travel effectively became domestic travel, thus passengers on those air services did not qualify for duty free pricing.
0%
10%
20%
30%
40%
50%
60%
70%
80%
90%
100%
Europe Americas Africa Asia Pacific Middle East World
Shar
e o
f To
tal R
egi
on
al S
ale
s
Airports Airlines Ferries Other
Since 2000, Asia Pacific’s duty free and travel retail sales have grown faster than all other world regions, becoming the largest by volume since 2012.
6 Economic Impact of Duty Free and Travel Retail in the Asia Pacific Region – FINAL REPORT 15 October 2019.
growing share of global duty free and travel retail sales, with 45% in 2017. Asia Pacific’s duty free and travel retail sector has grown from US$10 billion in 2009 to nearly US$32 billion16 in 2017 according to Generation Research, an increase of nearly 200%. Figure 2-4 and Figure 2-5 show the volume of sales by region and the regional share of duty free and travel retail sales, respectively.
The growth in low-cost carrier market share has facilitated less expensive air travel enabling a larger segment of the region’s population to experience travel, thereby contributing to the strong traffic growth that has been associated with rising affluence and increases in GDP. This has expanded the market for duty free and travel retail along with developments in buying behaviour, in particular of Mainland Chinese travellers’ desire to purchase genuine products at discounted prices to bring back to China. A significant portion of duty free and travel retail sales in Korea is courtesy of Mainland Chinese buyers.
Figure 2-3: Duty free and travel retail sales growth, compound annual rate, 2000-2017
Source: Generation Research and InterVISTAS Consulting Inc. computations.
To maintain the business, duty free retailers absorbed VAT and discounted prices on products; but there was a swift change in buying behaviour by passengers, which saw sales drop significantly and margins reduce. 16 Includes the Indian subcontinent as part of Asia Pacific instead of the Middle East.
4%5%
9%
13%12%
8%
0%
2%
4%
6%
8%
10%
12%
14%
Europe Americas Africa Asia Pacific Middle East World

Economic Impact of Duty Free and Travel Retail in the Asia Pacific Region – FINAL REPORT 15 October 2019 7
Figure 2-4: Duty free and travel retail sales by region, 2000-2017
Source: Generation Research.
Figure 2-5: Duty free and travel retail sales, regional shares, 2000-2017
Source: Generation Research.
$0
$5,000
$10,000
$15,000
$20,000
$25,000
$30,000
$35,000
20
00
20
01
20
02
20
03
20
04
20
05
20
06
20
07
20
08
20
09
20
10
20
11
20
12
201
3
20
14
20
15
20
16
20
17
US$
Mill
ion
Europe Americas Africa Asia Pacific Middle East
0%
10%
20%
30%
40%
50%
60%
2000
2001
200
2
2003
2004
2005
2006
2007
2008
2009
2010
2011
2012
2013
2014
2015
2016
201
7
Europe Americas Africa Asia Pacific Middle East

8 Economic Impact of Duty Free and Travel Retail in the Asia Pacific Region – FINAL REPORT 15 October 2019.
Figure 2-6 shows that South Korea is the leader in duty free and travel retail sales; sales generated within South Korea accounted for nearly 18% of global sales in 2017. China is second with over 8% of global sales, with the U.S. in third place with 6%. The UK and Germany are in 4th and 5th place overall in 2017. Other Asia Pacific geographies in the top 25 ranking are: Hong Kong (7th), Thailand (8th), Singapore (9th), Japan (11th), Taiwan (14th), Australia (21st), and Macau (22nd).
Figure 2-6: Market share and annual growth rate of duty free and travel retail sales (selected countries), 2017
Source: Generation Research. Note: Jordan experienced growth with the opening of downtown and diplomatic shops in 2017, thus the substantial change from the prior year.
2.3 Product Categories
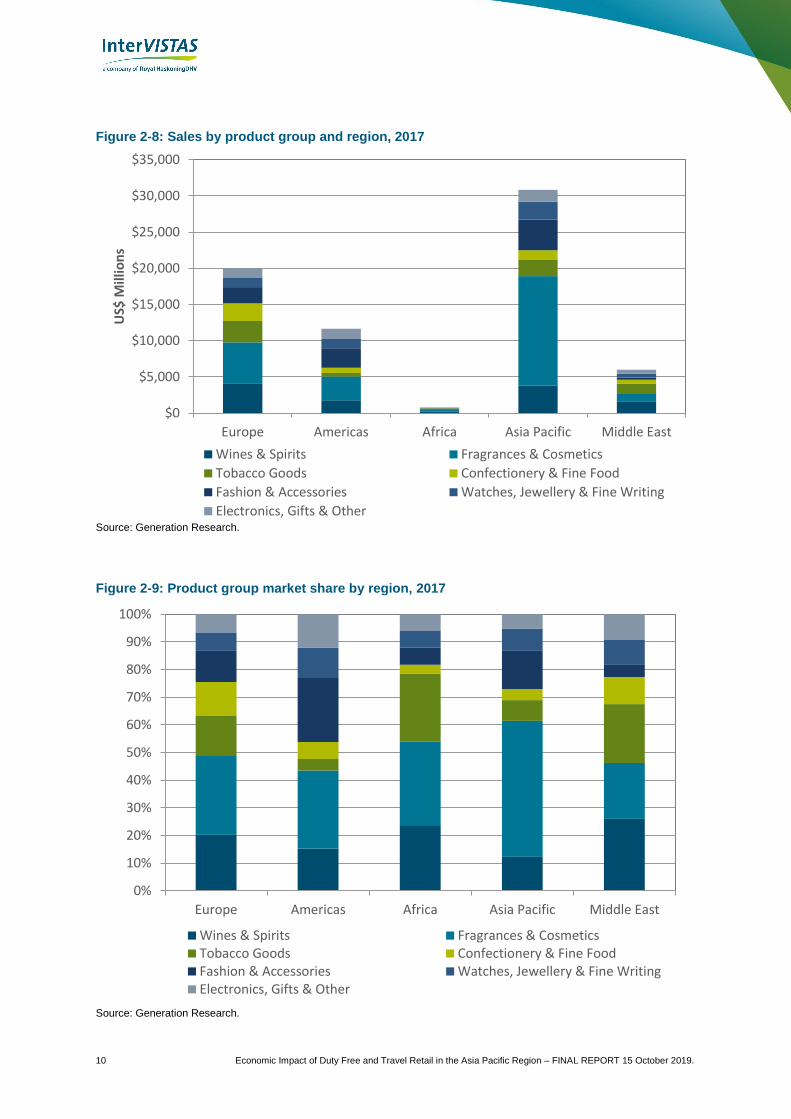
The main product categories globally available for purchase in duty free and travel retail include (in order of magnitude of sales from largest to smallest) ‘fragrances and cosmetics’, ‘wines and spirits’, ‘fashion and accessories’, ‘tobacco goods’, ‘watches, jewellery, and fine writing’, ‘confectionery and fine foods’, and ‘electronics, gifts, and other’. The top three product categories make up 67% (up from 65% in 2016) of total sales in the duty free and travel retail sector, as shown in Figure 2-7. Figure 2-8 shows the breakdown of global duty free and travel retail sales by world region.
Figure 2-9 shows a comparison of percentage sales per product category across different world regions. In general, the top three product categories are similar for all world regions, with a few exceptions. Wines and spirits, fragrances and cosmetics, and tobacco goods are the top product categories for Europe, Africa, and the Middle East. For the Americas and Asia Pacific, fashion & accessories is a top product category in place of tobacco goods.
-5%
0%
5%
10%
15%
20%
25%
30%
35%
Sou
th K
ore
a
Ch
ina
USA U
K
Ger
man
y
UA
E
Ho
ng
Ko
ng
Thai
lan
d
Sin
gap
ore
Turk
ey
Jap
an
Fran
ce
Spai
n
Taiw
an
U.S
. Vir
gin
Isla
nd
s
Ru
ssia
No
rway
Bra
zil
Ital
y
Jord
an
Au
stra
lia
Mac
au
Isra
el
Esto
nia
Fin
lan
d
Market share, globally Sales growth, 2017 on 2016, local currency

Economic Impact of Duty Free and Travel Retail in the Asia Pacific Region – FINAL REPORT 15 October 2019 9
Figure 2-7: Global duty free and travel retail sales, product category market shares, 2017
Source: Generation Research.
In 2017, fragrances and cosmetics made up 37% of global duty free and travel retail sales. It was the top product category in all regions except for the Middle East, where wines and spirits was the top product category. Fragrances and cosmetics made up nearly half (49%) of all duty free and travel retail sales in Asia Pacific. In 2017, wine and spirits made up 16% of all duty free and travel retail sales, followed by fashion and accessories (14%). The fashion and accessories product category has shown the largest growth globally with sales estimated at over US$9 billion in 2017, compared to US$1.2 billion in 2000, with its share of total sales increasing from 6% in 2000 to over 14% in 2017. Fragrances and cosmetics sales grew from US$4.4 billion in 2000 to over US$25 billion in 2017. Sales of tobacco products have been relatively flat over the past six years with approximately US$7 billion in sales, resulting in a decline in the share of tobacco sales in a growing total duty free and travel retail sector. Tobacco goods made up 21% of global duty free and travel retail sales in 2000, but only 11% in 2017.
2.4 Summary
The global duty free and travel retail sector has grown immensely since 2000, when the sector was estimated to generate US$20 billion in sales, compared to US$69 billion in 2017. Asia Pacific has been the regional leader since 2012, seeing its annual share of global duty free and travel retail sales grow to 45% in 2017. The region also demonstrates different product characteristics from other regions with greater emphasis on fragrances and cosmetics and fashion and accessories.
Fragrances & Cosmetics
37%
Wines & Spirits16%
Fashion & Accessories
14%
Tobacco Goods11%
Watches, Jewellery & Fine Writing
8%
Confectionery & Fine Food
7%
Electronics, Gifts and Other
7%
10 Economic Impact of Duty Free and Travel Retail in the Asia Pacific Region – FINAL REPORT 15 October 2019.
Figure 2-8: Sales by product group and region, 2017
Source: Generation Research.
Figure 2-9: Product group market share by region, 2017
Source: Generation Research.
$0
$5,000
$10,000
$15,000
$20,000
$25,000
$30,000
$35,000
Europe Americas Africa Asia Pacific Middle East
US$
Mill
ion
s
Wines & Spirits Fragrances & Cosmetics
Tobacco Goods Confectionery & Fine Food
Fashion & Accessories Watches, Jewellery & Fine Writing
Electronics, Gifts & Other
0%
10%
20%
30%
40%
50%
60%
70%
80%
90%
100%
Europe Americas Africa Asia Pacific Middle East
Wines & Spirits Fragrances & CosmeticsTobacco Goods Confectionery & Fine FoodFashion & Accessories Watches, Jewellery & Fine WritingElectronics, Gifts & Other

Economic Impact of Duty Free and Travel Retail in the Asia Pacific Region – FINAL REPORT 15 October 2019 11
3 Duty Free and Travel Retail Trends in the Asia Pacific Region
3.1 Introduction
The Asia Pacific region accounted for roughly 60% of the world’s population and 45% of the global duty free market in 2017.17 The region contains a myriad of different countries, cultures, political systems, and stages of economic development. Within this diverse global region there are notable countries and dynamics that play particularly important roles in the region’s duty free and travel retail market. Korea is the world’s largest duty free market accounting for nearly US$12 billion in sales, with China and Japan also being globally significant markets.
Duty free and travel retail sales in the region grew at an annual rate of 10.2% from 2012 to 2017, though this is projected to temper to 8.7% from 2017 to 2022.18 However, this will still be the highest growth rate of all global regions. By 2022, the region’s duty free and travel retail sales are anticipated to reach nearly US$43 billion.19
17 Generation Research. 18 Global Data (June 2018) Duty Free Retailing in Asia Pacific 2017-2022 19 Global Data (June 2018) Duty Free Retailing in Asia Pacific 2017-2022
Key Findings
▪ Growth in disposable incomes, consumer spending, and tourism are driving duty free sales and travel retail within the region, and these trends are all anticipated to continue in the future.
▪ Korea is the world’s largest duty free market accounting for nearly US$12 billion in sales, with China and Japan also being globally significant markets.
▪ Mainland China is also anticipated to strengthen its position as the second biggest duty free and travel retail market in the region.
▪ India is one the greatest growth opportunities for global duty free and travel retail. A combination of a large and growing population, increasing air connectivity, inbound tourism, and the growing disposable incomes and propensity to travel internationally by India’s middle class are all driving growth in its duty free market.
▪ Duty free shoppers in the Asia Pacific region increasingly look to digital platforms to facilitate their purchases. This is typically using mobile apps such as WeChat Pay, Alipay, and Paytm which are becoming increasingly common payment methods for consumers.
▪ Duty free operators in the Asia Pacific region are increasingly focusing on downtown retail locations to accommodate growing demand for duty free throughout the region.

12 Economic Impact of Duty Free and Travel Retail in the Asia Pacific Region – FINAL REPORT 15 October 2019.
Figure 3-1 summarises the change in GDP per capita from 2000 to 2017 in the Asia Pacific region and its component sub-regions. It is worth recognising that there is significant variation across the region and within sub-regions. For example, the East Asia sub-region has a modest annual growth rate of 4.9% but subsumes the rapid growth in China and stagnation in Japan. Appendix C summarises the Asian Development Bank’s latest data on population, GDP, and GDP per capita for countries in the region.
Figure 3-1: GDP per Capita in Asia Pacific sub-regions 2000 to 2017 (US$2017 prices)
Source: Asian Development Bank (2019) Key Indicators for Asia and the Pacific 2018. Currencies converted using World Bank annual average currency conversion in 2017. Prices inflated to US$2017 using World Bank GDP deflator.
3.2 Travel and Passenger Flows within the Asia Pacific Region and Global Connections
According to the UNWTO, there were 1.4 billion international tourist arrivals globally in 2018, of which over 25% were travelling to the Asia Pacific region. These travellers were estimated to spend over US$1.4 trillion. On average, each international tourist arrival spends approximately US$1,000. However, this compares to over US$1,200 for international visitors to the Asia Pacific region. Visitors to the Americas had the highest average trip spend per visitor at over US$1,500.20
Airports in the Asia Pacific region saw approximately 1.8 billion passengers in 2017; nearly half of global origin-destination air passenger traffic.21 This included passengers flying domestically and internationally within the Asia Pacific region, and passengers flying between an Asia Pacific country and a country outside the Asia Pacific region. Air passenger traffic in the Asia Pacific region grew by 43% from 2013 to 2017 while global air passenger traffic grew by 30%.22 Appendix D provides further
20 Source: World Tourism Barometer, UNWTO, May 2019. (http://marketintelligence.unwto.org/content/unwto-world-tourism-barometer) 21 Sabre AirVision Market Intelligence (Accessed February 2019)
22 Sabre AirVision Market Intelligence (Accessed February 2019)
$20,519
$646
$6,443
$2,688$3,822
$33,766
$1,917
$11,851
$4,300
$6,829
0%
2%
4%
6%
8%
10%
12%
14%
$0
$5,000
$10,000
$15,000
$20,000
$25,000
$30,000
$35,000
$40,000
Oceania South Asia East Asia South EastAsia
Asia PacificRegion
Co
mp
ou
nd
An
nu
al Gro
wth
Rate
20
00
-2
01
7U
S$ p
er P
erso
n (
20
17
pri
ces)
GDP per Capita 2000
GDP per Capita 2017

Economic Impact of Duty Free and Travel Retail in the Asia Pacific Region – FINAL REPORT 15 October 2019 13
information on the volume of origin-destination air passenger traffic for countries in the Asia Pacific region, and the air passenger traffic connections outside the Asia Pacific region.
Domestic passenger traffic made up 64.6% of air passenger flows within the Asia Pacific region while international traffic accounted for 35.4%.23 Air traffic between an Asia Pacific country and a country outside the Asia Pacific region accounted for 184 million passengers in 2017.24 The countries that saw the largest total passenger flows by air were China, Japan, and India. Together these three countries accounted for 970 million passengers in total (domestic and international travel).25 Over half (51.6%) of these passengers were travelling domestically within Mainland China, making it the largest market in the region. As commented on further in Section 3.3.2, domestic travel in Mainland China is a growing component of the country’s duty free and travel retail market.
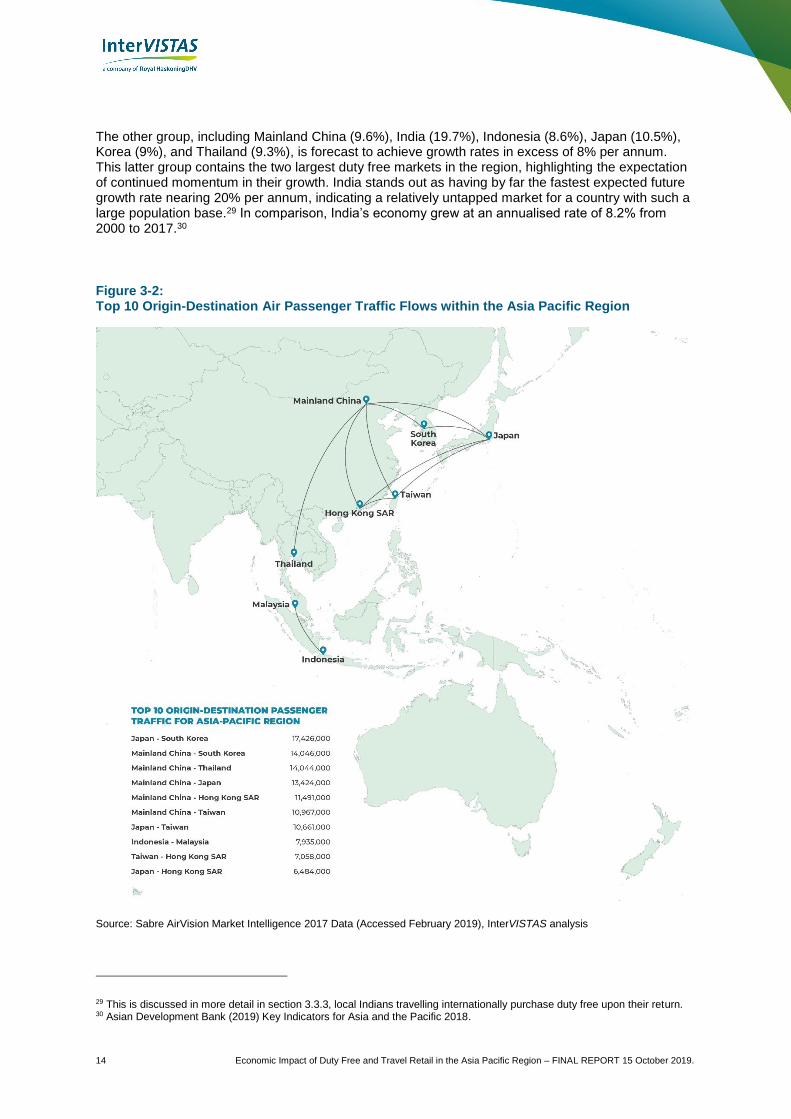
Figure 3-2 shows the ten biggest air passenger traffic flows between Asia Pacific countries. This draws on bi-directional origin-destination air passenger traffic data from Sabre. Travel between Japan and Korea represents the region’s greatest traffic flow by air at 17.4 million passengers. The region’s 2nd to 6th top air passenger traffic flows are all between Mainland China and other destinations within the region.
The region’s fastest growing air passenger traffic markets are in South East Asia. From 2013 to 2017 traffic to and from Vietnam grew by the fastest rate in the Asia Pacific region at an annual average of 26.9%.26 Additionally, Cambodia, Myanmar and Bangladesh all experienced high annual average growth rates of 24.1%, 21.6%, and 21.4% respectively.27
3.3 Key Market Dynamics within the Region
Growth in disposable incomes, consumer spending, and tourism are driving duty free sales and travel retail within the region, and these trends are all anticipated to continue in the future.
Figure 3-3 shows the forecast growth in duty free retail sales in Asia and Australasia for 2017 to 2022 (note that data for some countries in the region are unavailable).28 Korea is the world’s largest duty free market at US$11.7 billion in 2017, and is expected to retain its position with growth of 54% to reach US$18 billion in 2022. Mainland China, Hong Kong, Thailand, Singapore, and Japan are all significant markets. The Mainland Chinese market is also expected to consolidate its position as the second biggest market in the region and grow by nearly 60% to US$8.3 billion in 2022.
Figure 3-4 compares the annual growth of duty free sales from 2007 to 2017 with forecast rates for 2017 to 2022. While all countries are forecast to grow their duty free markets, they appear to be segmented into two broad groups. One group is anticipated to achieve annual growth of less than 7%, including Australia (5.1%), Hong Kong (3.7%), Malaysia (6.1%), New Zealand (5.7%), Philippines (6.9%), and Singapore (5.6%) between 2017 and 2022.
23 Sabre AirVision Market Intelligence (Accessed February 2019) 24 Sabre AirVision Market Intelligence (Accessed February 2019) 25 Sabre AirVision Market Intelligence (Accessed February 2019)
26 Sabre AirVision Market Intelligence (Accessed February 2019) 27 Sabre AirVision Market Intelligence (Accessed February 2019) 28 Source: GlobalData (January 2019) Duty Free Retail Insights – Market Size Asia and Australasia Regions. InterVISTAS analysis.
14 Economic Impact of Duty Free and Travel Retail in the Asia Pacific Region – FINAL REPORT 15 October 2019.
The other group, including Mainland China (9.6%), India (19.7%), Indonesia (8.6%), Japan (10.5%), Korea (9%), and Thailand (9.3%), is forecast to achieve growth rates in excess of 8% per annum. This latter group contains the two largest duty free markets in the region, highlighting the expectation of continued momentum in their growth. India stands out as having by far the fastest expected future growth rate nearing 20% per annum, indicating a relatively untapped market for a country with such a large population base.29 In comparison, India’s economy grew at an annualised rate of 8.2% from 2000 to 2017.30
Figure 3-2: Top 10 Origin-Destination Air Passenger Traffic Flows within the Asia Pacific Region
Source: Sabre AirVision Market Intelligence 2017 Data (Accessed February 2019), InterVISTAS analysis
29 This is discussed in more detail in section 3.3.3, local Indians travelling internationally purchase duty free upon their return. 30 Asian Development Bank (2019) Key Indicators for Asia and the Pacific 2018.

Economic Impact of Duty Free and Travel Retail in the Asia Pacific Region – FINAL REPORT 15 October 2019 15
Figure 3-3: Duty free retail sales Asia and Australasia
Source: Global Data (January 2019) Duty Free Retail Insights – Market Size Asia and Australasia Regions. InterVISTAS analysis.
0
2
4
6
8
10
12
14
16
18
0
1
2
3
4
5
6
7
8
9
2017 2018 2019 2020 2021 2022U
S$ b
illio
ns
(So
uth
Ko
rea
on
ly)
US$
bill
ion
s (a
ll co
un
trie
s e
xce
pt
Sou
th K
ore
a)
Australia
China
Hong Kong
India
Indonesia
Japan
Malaysia
NewZealandPhilippines
Singapore
Thailand

16 Economic Impact of Duty Free and Travel Retail in the Asia Pacific Region – FINAL REPORT 15 October 2019.
Figure 3-4: Compound annual growth rate of duty free retail sales in Asia and Australasia
Source: Global Data (January 2019) Duty Free Retail Insights – Market Size Asia and Australasia Regions. InterVISTAS analysis
5%
4%
5%
4%
4%
6%
9%
4%
11%
6%
15%
8%
21%
4%
5%
6%
6%
6%
7%
9%
9%
9%
9%
10%
10%
20%
0% 5% 10% 15% 20% 25%
Hong Kong
Australia
Singapore
New Zealand
Malaysia
Philippines
Average
Indonesia
Korea
Thailand
China
Japan
India
Slo
we
r gr
ow
thFa
ster
gro
wth
Compound annual growth rate
2017 to 2022
2007 to 2017
Economic Impact of Duty Free and Travel Retail in the Asia Pacific Region – FINAL REPORT 15 October 2019 17
3.3.1 Korea Forecast to Remain the Region’s Largest Duty Free Market
According to Global Data’s Asia Pacific Forecast for 2017 to 2022, Korea is forecast to remain the largest duty free market in the Asia Pacific region over the period 2017 to 2022.31 Accounting for 42% of duty free sales in the region, Korea’s market is estimated to be nearly US$12 billion in 2017.32 This is forecast to increase by a 9% CAGR to US$18 billion in 2022.33 The most recent data for Q1 2019 shows sustained growth in Korea’s duty free market, with sales growing by 27% compared to Q1 2018.34
Korea’s duty free market benefits from growth of Korean travellers, as well as increasing numbers of Chinese and Japanese travellers. This was evident in the double digit growth of Incheon International Airport’s duty free sales, confirming its position as the world’s number one airport operator of duty free sales in 2018.35 The strengthening of Korea’s travel market was an important boost following the challenging relations between China and Korea in 2016. The strained relations resulted in a 48% drop in Mainland Chinese travellers to Korea;36 but sales were not as heavily impacted due to the strong impact of daigou shoppers.37 Daigou shoppers are individual or groups of exporters located outside of China that buy duty free products (usually luxury goods) and resell to customers located in Mainland China38.
Although Korean airport sales have grown, Korea’s duty free market is weighted significantly towards downtown channels rather than airport based sales. This is not typical of many other duty free markets around the world, and particularly established duty free markets in European countries. Section 5.3 provides further discussion regarding Korea’s downtown duty free sales channels.
With a strong downtown retail presence and popularity with Chinese and Japanese travellers, Korea’s duty free market is focused on beauty, cosmetics, and fashion products. Cosmetics products are by far the largest product category; the latest data for Q1 2019 reported it at US$2.9 billion or nearly 63% of the estimated total quarterly market value of US$4.6 billion (on track to far exceed the projected growth rates noted by Global Data above).39 Not only are cosmetics products the largest product category in the market but they have also experienced much higher growth than all other product categories. Cosmetics saw year-on-year growth of 45% in Q1 2019. In comparison the second biggest product category ‘bags and accessories’ accounted for US$390 million or 8% of the market in Q1 2019. Korea is also the world’s largest market for fashion duty free sales; an estimated US$2.3 billion in 2017.40
31 Global Data (June 2018) Duty Free Retailing in Asia Pacific 2017-2022 32 Global Data (June 2018) Duty Free Retailing in Asia Pacific 2017-2022 33 Global Data (June 2018) Duty Free Retailing in Asia Pacific 2017-2022 34 Moodie Davitt (April 2019) The Moodie Davitt Report Asia Pacific https://www.moodiedavittreport.com/lotte-and-shilla-flourish-as-korean-duty free-market-surges-by-27-in-q1-to-record-high/?utm_source=The+Moodie+Davitt+Report&utm_campaign=808aae0d67-EMAIL_CAMPAIGN_2019_04_17_12_57&utm_medium=email&utm_term=0_f46e146459-808aae0d67-227375421 35 https://www.moodiedavittreport.com/moodie-davitt-exclusive-lotte-duty free-retains-korean-duty free-dominance-through-a-stormy-2017/ 36 Source: Korea Tourism Organization (https://kto.visitkorea.or.kr/eng/tourismStatics/keyFacts/KoreaMonthlyStatistics/eng/inout/inout.kto) 37 Source: http://www.themoodieblog.com/22587-2/, The Moodie Blog, “Welcome to Korean duty free 2018-style”, 7 April 2018. 38 Further discussion on daigou shoppers is presented in section 3.3.2 39 Moodie Davitt (April 2019) The Moodie Davitt Report Asia Pacific https://www.moodiedavittreport.com/lotte-and-shilla-flourish-as-korean-duty free-market-surges-by-27-in-q1-to-record-high/?utm_source=The+Moodie+Davitt+Report&utm_campaign=808aae0d67-EMAIL_CAMPAIGN_2019_04_17_12_57&utm_medium=email&utm_term=0_f46e146459-808aae0d67-227375421 40 Global Data (November 2018) Global Fashion Duty Free Retailing, 2017-2022
Korea’s duty free market is projected to reach US$18 billion by 2022.

18 Economic Impact of Duty Free and Travel Retail in the Asia Pacific Region – FINAL REPORT 15 October 2019.
Looking ahead, cosmetics products are forecast to remain the dominant product category in Korea’s duty free market. By 2022 they are forecast to reach US$8.4 billion, of a total estimated US$18 billion market.41 Jewellery and watches are expected to grow to become the second largest product category, overtaking luggage and leather goods.
While increasingly affluent Mainland Chinese travellers have boosted Korea’s duty free market, Korean nationals are high spenders in their own right – both overseas and at Korean airports. This is supported by Korea’s relatively high incomes and per capita Gross Domestic Product (GDP) of US$29,800 (US$2017).42 Additionally, the Korean Won was the third strongest currency on Moodie Davitt’s spend index for its strengthening against other currencies from 2017 to 2018.43 Spending by outbound and returning Korean travellers via downtown duty free shopping in Korea are important components of the region’s largest duty free market.44 A strong Korean Won increases the purchasing power of Korean travellers and reduces the costs of importing overseas goods and products for Korean duty free businesses. Conversely, though, a strong Korean Won can dampen demand from overseas visitors from countries with weaker currencies.
3.3.2 Importance of Mainland Chinese Travellers and Duty Free and Travel Retail Market Share
China’s influence on the region’s duty free and travel retail market is threefold; increasing numbers of Mainland Chinese travelling overseas, greater domestic travel to Hainan,45 with its increasingly generous duty free incentives, and increasing volumes of international visitors to China.
Mainland China has an increasing share of domestic and international air passengers in the region. Mainland China is the largest passenger volume connection for Thailand, Hong Kong, and Taiwan, and second largest for Korea and Japan. Figure 3-5 below summarises the origin-destination passenger traffic between Mainland China and other countries within the Asia Pacific region, and to the rest of the world. It should be noted that data is for 2017, and that volumes of Mainland Chinese travellers to other countries have been volatile with significant fluctuations from year-to-year in some cases (discussed further below).
Globally, Mainland Chinese travellers have in recent years impacted the local tourism market in each country they visit due to the sheer volume of travellers and their purchasing power. According to the UNWTO, Mainland China’s outbound travellers are estimated to have spent US$258 billion in 2017, nearly double the world’s second largest market of American travellers (US$135 billion in 2017).46 Research from 2011 reported that Mainland Chinese duty free buyers typically spent 73% more than the global average.47
41 Global Data (June 2018) Duty Free Retailing in Asia Pacific 2017-2022 42 Asia Development Bank (2018) Key Indicators for Asia and the Pacific 2018, converted to US$2017 using OECD annual currency conversion data 43 Moodie Davitt (March 2018) Moodie Davitt Spend Index https://www.moodiedavittreport.com/the-moodie-davitt-spend-index-spending-power-evolution-by-nationality-destination/ 44 Many downtown duty free stores function just like department stores, with international travellers showing passports/flight tickets to receive DF discounts. Korean shoppers are able to purchase goods in them as normal but are only eligible for DF discounts if they will be travelling outside of Korea (i.e. presumably they are within a certain travel window and have evidence of a flight ticket). 45 In April 2018, China’s President, Xi Jinping, designated Hainan Island as China’s 12th free-trade zone. Known for its beaches and sunshine, the island is being supported as China’s southern hub for tech innovation. In addition, the plan is to transform Hainan into an “international tourism destination”. Hainan is also home to a number of dedicated shopping malls which include duty free, which attract both visitors and domestic travellers. Source: https://www.scmp.com/tech/policy/article/2182681/hainan-latest-chinese-free-trade-zone-tech-hub-ambitions 46 United Nations World Tourism Organization (2018) Tourism Highlights 2018 Edition 47 TFWA (2012) Chinese Passenger Shopper Research
Cosmetics sales are forecast to reach US$8.4 billion in Korea in 2022.

Economic Impact of Duty Free and Travel Retail in the Asia Pacific Region – FINAL REPORT 15 October 2019 19
While the international impact of Mainland Chinese travellers is significant, it is in fact smaller than on the burgeoning domestic travel industry. Research by the Chinese travel company Ctrip and the Chinese Tourism Academy estimated total domestic Mainland tourism spending to be US$720 billion.48 These spending figures capture much more than just duty free spending.49 More recent data from the Ministry of Culture and Tourism indicate that domestic Mainland travel has continued to grow, with total tourism spending increasing to US$764 billion.50
Figure 3-5: Origin-Destination passenger traffic from Mainland China (millions of passengers in 2017)
Source: Sabre AirVision Market Intelligence 2017 Data (Accessed February 2019). InterVISTAS Analysis.
As a result of growth in both international and domestic tourism and visitor spending in Mainland China, the duty free and travel retail market there has grown considerably in recent years, at an annual rate of 14% from 2007 to 2017.51 The duty free market in Mainland China is expected to continue to grow at a lower annual rate of 4% to reach more than US$8 billion in 2022.52 It is expected to remain the second largest duty free market in the region by a considerable margin; the third largest market in 2022 is forecast to be Thailand at US$3.1 billion.53 .
The key growth markets for duty free shopping by Mainland Chinese are centred around locations promoting duty free sales such as Hainan and Macau, and to a lesser extent Hong Kong.54 In the case of Hainan, Chinese President Xi Jinping made a strong commitment to turn Hainan into an international free trade zone, which would include an “open and convenient” duty free shopping policy for the island.
48 https://skift.com/2018/08/18/chinas-domestic-tourism-boom-has-lessons-for-the-rest-of-the-world/ 49 http://media.unwto.org/press-release/2018-04-23/strong-outbound-tourism-demand-both-traditional-and-emerging-markets-2017 50 https://www.tourism-review.com/chinese-domestic-tourism-keeps-growing-news10925 51 Global Data (June 2018) Duty Free Retailing in Asia Pacific 2017-2022 52 Global Data (June 2018) Duty Free Retailing in Asia Pacific 2017-2022 53 Global Data (June 2018) Duty Free Retailing in Asia Pacific 2017-2022 54 Regulatory restrictions and devaluations in the Chinese yuan (CN¥) relative to the Hong Kong dollar (HK$) are likely to taper Mainland Chinese spending in Hong Kong.
14.0 14.0 13.411.5 11.0
5.5 5.03.1 2.6 2.5 2.3 1.7 1.7 1.1 1.1 1.9
30.3
0
5
10
15
20
25
30
35
Ori
gin
-De
stin
atio
n P
asse
nge
r V
olu
me
(m
illio
ns
of
pas
sen
gers
)
Korea, Thailand and Japan are Mainland China’s top 3 origin/destination air passenger markets with over 41 million passengers handled in 2017.
20 Economic Impact of Duty Free and Travel Retail in the Asia Pacific Region – FINAL REPORT 15 October 2019.
Hainan is currently home to two mega shopping complexes; the China Duty Free Group opened a mega duty free and shopping complex called the Sanya International Duty Free Shopping Complex in Haitang Bay and HNDF Haikou Meilan Airport Duty Free Shop (Hainan Duty Free) that is hosting international tourists but is also supported by local Chinese shoppers.
Daigou Shopper
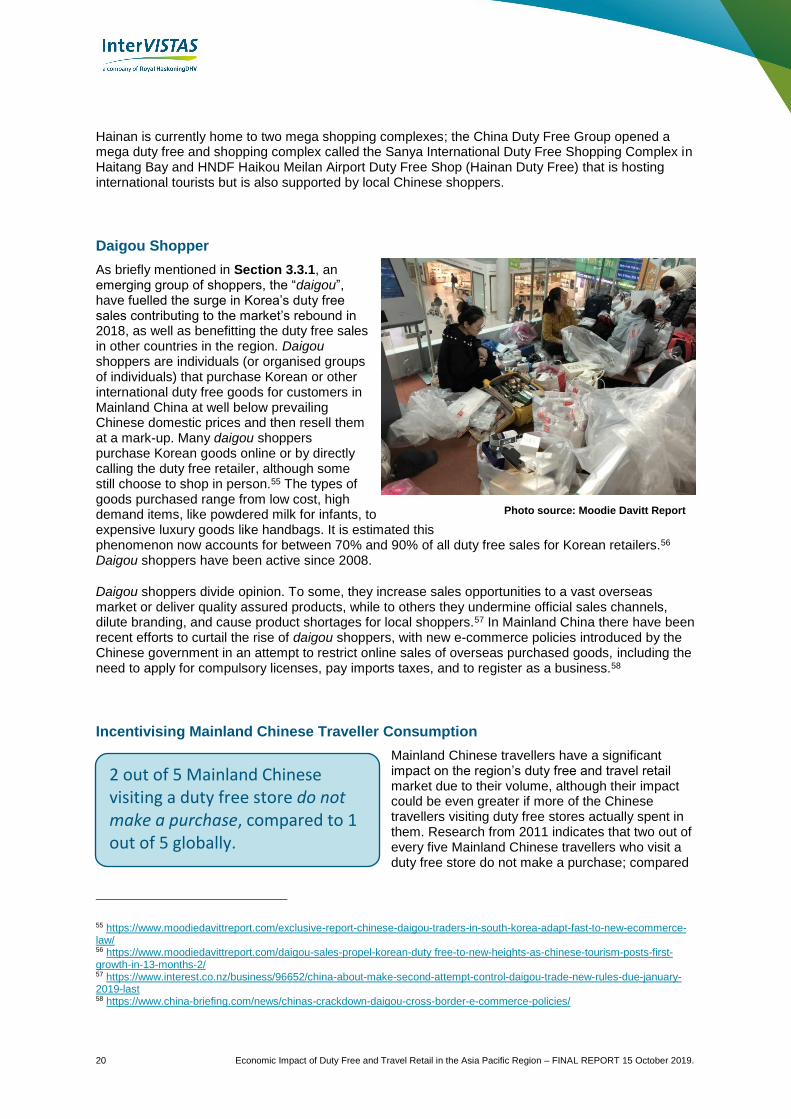
As briefly mentioned in Section 3.3.1, an emerging group of shoppers, the “daigou”, have fuelled the surge in Korea’s duty free sales contributing to the market’s rebound in 2018, as well as benefitting the duty free sales in other countries in the region. Daigou shoppers are individuals (or organised groups of individuals) that purchase Korean or other international duty free goods for customers in Mainland China at well below prevailing Chinese domestic prices and then resell them at a mark-up. Many daigou shoppers purchase Korean goods online or by directly calling the duty free retailer, although some still choose to shop in person.55 The types of goods purchased range from low cost, high demand items, like powdered milk for infants, to expensive luxury goods like handbags. It is estimated this phenomenon now accounts for between 70% and 90% of all duty free sales for Korean retailers.56 Daigou shoppers have been active since 2008.
Daigou shoppers divide opinion. To some, they increase sales opportunities to a vast overseas market or deliver quality assured products, while to others they undermine official sales channels, dilute branding, and cause product shortages for local shoppers.57 In Mainland China there have been recent efforts to curtail the rise of daigou shoppers, with new e-commerce policies introduced by the Chinese government in an attempt to restrict online sales of overseas purchased goods, including the need to apply for compulsory licenses, pay imports taxes, and to register as a business.58
Incentivising Mainland Chinese Traveller Consumption
Mainland Chinese travellers have a significant impact on the region’s duty free and travel retail market due to their volume, although their impact could be even greater if more of the Chinese travellers visiting duty free stores actually spent in them. Research from 2011 indicates that two out of every five Mainland Chinese travellers who visit a duty free store do not make a purchase; compared
55 https://www.moodiedavittreport.com/exclusive-report-chinese-daigou-traders-in-south-korea-adapt-fast-to-new-ecommerce-law/ 56 https://www.moodiedavittreport.com/daigou-sales-propel-korean-duty free-to-new-heights-as-chinese-tourism-posts-first-growth-in-13-months-2/ 57 https://www.interest.co.nz/business/96652/china-about-make-second-attempt-control-daigou-trade-new-rules-due-january-2019-last 58 https://www.china-briefing.com/news/chinas-crackdown-daigou-cross-border-e-commerce-policies/
Photo source: Moodie Davitt Report
2 out of 5 Mainland Chinese visiting a duty free store do not make a purchase, compared to 1 out of 5 globally.
Economic Impact of Duty Free and Travel Retail in the Asia Pacific Region – FINAL REPORT 15 October 2019 21
to a global average of one in five travellers.59 In efforts to alter this trend, governments and retailers of other countries in the region have implemented initiatives designed to increase the propensity of Chinese travellers to spend and to encourage Chinese visitors overall.
Government initiatives aimed at stimulating Chinese visitation and spending include reforming tax laws and supporting new air routes to and from Mainland China.60 For example, the Japanese government reformed its taxes on foreign travellers, allowing them to claim a refund on a minimum purchase of JP¥5,000.61,62 This is projected to increase spending by tourists on duty free and travel retail, with specific focus on increasing spending by Chinese travellers. The Philippines implemented a Visa Upon Arrival scheme for Chinese tourists, while duty free operators increased their offerings of international luxury brands. These initiatives resulted in China surpassing the US to become the second largest tourist source for the Philippines, behind only South Korea in 2017.63
For their part, retailers continue to adjust their duty free product ranges, price points, and payment systems to better suit the changing preferences of Chinese visitors. In terms of product choices, research from 2017 indicates that skin care and beauty products are the most popular product category for Chinese travellers, followed by local specialities, souvenirs, clothing, and food.64 This differs and has evolved from research undertaken in 2012 which reported that tobacco was the duty free category on which Chinese travellers spent the most.65 The influence of Chinese travellers is also seen in the decreasing presence of West European brands in some higher value oriented duty free and travel retail operations, and an increasing presence of Chinese and Korean brands.66,67 However, Chinese travellers are also affecting the lower end of the duty free and travel retail market. In locations which receive significant volumes of Chinese tour groups and travellers, operators are being driven to lower their price points to remain competitive (or offer more purchasing incentives) to appeal to Chinese travellers. This process is particularly apparent in destinations which have seen a rapid growth of Chinese travellers in recent years, such as Phnom Penh in Cambodia.
While Chinese travellers play an important role in supporting the travel retail industries in other countries across the Asia Pacific region, their impact can be volatile and change abruptly. This is typically driven by foreign policy relations between China and other countries rather than changing consumer preferences. As previously mentioned in Section 3.3.1, the impact on Korea’s duty free and tourism industry arising from the reduced volume of Chinese travellers following the THAAD dispute in 2017 is well documented. More recently, New Zealand experienced a similar drop in arrivals of Chinese tourists in February 2019 relative February 2018 as a result of several ongoing disputes between the countries.68 Though curbing the growing independent traveller market is challenging, indirect or direct pressure from Beijing on tour operators can affect the volume of Chinese travellers and the destinations frequented.69
59 TFWA (2012) Chinese Passenger Shopper Research 60 Global Data (June 2018) Duty Free Retailing in Asia Pacific 2017-2022 61 https://mainichi.jp/english/articles/20171205/p2a/00m/0na/008000c 62 https://tax-freeshop.jnto.go.jp/eng/shopping-guide.php 63 Global Data (June 2018) Duty Free Retailing in Asia Pacific 2017-2022 64 Nielsen (2017) Outbound Chinese Tourism and Consumption Trends 65 TFWA (2012) Chinese Passenger Shopper Research 66 http://www.premiumbeautynews.com/en/asia-and-younger-generations-drive,13997 67 Daxue Consulting (June 2017) https://daxueconsulting.com/south-korea-china-tensions/ 68 Tourism New Zealand Key Statistics February 2019 https://www.tourismnewzealand.com/markets-stats/markets/china/ 69 The Economist (February 2019) China’s high-spending tourists bring political clout https://www.economist.com/china/2019/02/23/chinas-high-spending-tourists-bring-political-clout

22 Economic Impact of Duty Free and Travel Retail in the Asia Pacific Region – FINAL REPORT 15 October 2019.
3.3.3 Rise of India’s Duty Free and Travel Retail Market
India is one the greatest growth opportunities for global duty free and travel retail. A combination of a large and growing population, increasing air connectivity, inbound tourism, and the growing disposable incomes and propensity to travel internationally by India’s middle class are all driving growth in its duty free market.70 Between 2017 and 2022, India’s duty free market is expected to more than double from US$0.9 billion to US$2.1 billion.71 India is forecast to be the fastest growing market in the region to 2022, with an annual growth rate of 20%.72
Research in 2017 estimated that 80% of the country’s duty free shoppers are Indian.73 This is quite unlike other markets in the region, such as Korea or Thailand, where the majority of duty free sales are from international travellers rather than local travellers.
However, this is likely to change with international tourism to India growing; the volume of international visitors to India nearly doubled from 2007 to 2017.74 While India accounts for only 4.8% of the Asia Pacific region’s total international tourist arrivals, its year-on-year growth rate has been well above the region’s average in recent years.75 Changes by the Indian Government to its e-visa regime are simplifying procedures, making it friendlier to international tourists. These developments will help grow India’s duty free and travel retail market.76
Currently, India’s duty free and travel retail market is relatively nascent. For example, in 2017 only 17 of India’s 42 international airports had duty free zones.77 Expansion of its airport infrastructure along with new retail space is generating significant opportunities for duty free operators. As a result, India is likely to be a key focus in the Asia Pacific region for duty free operators looking to expand and secure new contracts. Despite the anticipated growth in the coming years, India’s duty free and travel retail market is expected to still be a quarter the size of China’s and just over a tenth the size of Korea’s by 2022.
Though alcohol accounts for the majority of duty free sales in India, demand for other products is growing rapidly in line with its burgeoning middle class. Demand for fashion products from domestic travellers is growing, evidenced by Mumbai Duty Free securing an eight-year contract to operate thirteen fashion boutiques spanning 13,000 sq ft at Mumbai International Airport.78 Locals also have different expectations from duty free shopping experiences compared to other countries in the region. Online pre-purchasing, mobile sales apps, and in-airport purchases for return pick up or home delivery are more popular than in other markets in the Asia Pacific region.
70 Indians who travel overseas shop at duty free in India for delivery upon their return home. (https://qz.com/india/1135374/in-indias-200-million-duty free-market-four-in-five-travellers-shop-for-alcohol/) 71 Global Data (June 2018) Duty Free Retailing in Asia Pacific 2017-2022 72 Global Data (June 2018) Duty Free Retailing in Asia Pacific 2017-2022 73 https://qz.com/india/1135374/in-indias-200-million-duty free-market-four-in-five-travellers-shop-for-alcohol/ 74 Ministry of Tourism Government of India (2018) India Tourism Statistics at a glance - 2018 75 United Nations World Tourism Organization (2018) Tourism Highlights 2018 Edition 76 https://centreforaviation.com/members/direct-news/government-liberalizes-the-e-visa-regime-making-it-more-tourist-friendly-460358?utm_source=capa&utm_medium=email&utm_campaign=Asia%20Pacific%20Airline%20Daily%3A%2019%20February%202019 77 https://qz.com/india/1135374/in-indias-200-million-duty free-market-four-in-five-travellers-shop-for-alcohol/ 78 Global Data (November 2018) Global Fashion Duty Free Retailing 2017-2022
India’s duty free market is forecast to be the fastest growing in the region to 2022, with an annual average growth rate of 20%.

Economic Impact of Duty Free and Travel Retail in the Asia Pacific Region – FINAL REPORT 15 October 2019 23
3.4 Changing Consumer Habits and Growth of E-Commerce
Though the duty free and travel retail market has not experienced the degree of disruption that online shopping has brought to the traditional retail sector, it has nevertheless changed the market. Some parts of the Asia Pacific region are leading the growth of e-commerce and digitalisation in the duty free and travel retail market. However, the uptake is not uniform across the region. Additionally, the habits and purchasing preferences of consumers are changing, leading to varying responses by the duty free and travel retail market. These processes are discussed further in the following sections.
3.4.1 Growth of E-Commerce
Duty free shoppers in the Asia Pacific region increasingly look to digital platforms to facilitate their purchases. This is typically using mobile apps such as WeChat Pay, Alipay, and Paytm which are becoming increasingly common payment methods for consumers.79 As a result, there is a growing expectation of duty free and general retailers providing such payment services. But within the Asia Pacific region there are important exceptions to this trend. For example, South East Asia has higher levels of its population without bank accounts, resulting in the uptake of mobile payment apps lagging the rest of the region; cash is still the focus. 80 Other parts of the region are leading the charge in allowing customers to pay using new digital tools. But the growth of e-commerce is not just about decreasing popularity of cash and credit cards; it is also about providing genuinely new and innovative tools to help customers make purchases. Duty free operators in airports are increasingly offering online ordering and instore pick-up services; for example, duty free retailers at Singapore, Hong Kong, Australian (including Sydney and Melbourne), and Mumbai airports (among others) offer this service. Some airports are taking their digitalisation efforts further; Mumbai International Airport expanded its e-commerce app Mumbai T2 App to enable travellers to order duty free products online from multiple retailers for pick up when they travel or for delivery upon their return.81 Online pre-purchase orders for airport pickup are more popular in the Indian market than anywhere else in the Asia Pacific region. There is a growing response by duty free operators to the increasing flexible payment, ordering, pick-up, and delivery needs of customers. Available in Section 3.7 is a case study which further discusses the expanding role of e-commerce at airports in Asia Pacific, with specific focus on Hong Kong International Airport.
The growth of e-commerce can be seen as part of a broader digitalisation of the travel industry and especially airports. This is in part due to younger profiles of travellers, and the increasing use of technology. More passengers now travel using electronic boarding passes, with a notable growth in the Chinese market.82 Flight check-in and baggage inspection systems are increasingly automated or at least semi-automated, and Jakarta Soekarno-Hatta International Airport recently announced it was rolling out tablets for all service personnel to better serve its customers.83
79 https://www.researchandmarkets.com/research/b7c7k3/asian_mobile?w=4 Research by Mercator Advisory Group, May 2018 80 https://www.reuters.com/article/us-southeastasia-mobilepayments/mobile-payment-firms-struggle-to-dethrone-cash-in-southeast-asia-idUSKCN1IO0PW 81 Global Data (June 2018) Duty Free Retailing in Asia Pacific 2017-2022 82 Source: https://centreforaviation.com/data/profiles/government-bodies/caac-china?utm_source=capa&utm_medium=email&utm_campaign=Airport%20Business%20Daily%3A%2019%20February%202019 83 https://centreforaviation.com/members/direct-news/60-penumpang-dari-kalangan-generasi-milenial-personil-pelayanan-bandara-soekarno-hatta-dilengkapi-460532?utm_source=capa&utm_medium=email&utm_campaign=Airport%20Business%20Daily%3A%2019%20February%202019 Translated to English using Google Chrome translator
Asia Pacific airports are increasingly offering online ordering and instore pickup services.
24 Economic Impact of Duty Free and Travel Retail in the Asia Pacific Region – FINAL REPORT 15 October 2019.
3.4.2 Changing Consumer Habits and Product Demands
While traditional product categories such as alcohol and tobacco remain important components of the Asia Pacific region’s duty free market, there is growing diversity and interest in other product types.
These changing demands are summarised below:
• Luxury brands are increasingly important to the Asia Pacific region’s duty free market, reflecting the growing affluence of the region’s travellers. This is especially the case in already established duty free markets such as Korea and Japan. For example, the new terminal at Incheon International Airport features the flagship stores of international luxury brands such as Chanel, Dior, Sulwhasoo, Lancôme, SK2, and Estée Lauder84. It also includes renowned liquor and tobacco brands such as Ballantyne's, Johnnie Walker, Royal Salute, Hennessy and KT&G, and IQOS. However, more nascent duty free markets such as India are already demonstrating their focus on luxury brands and are innovating their offer to appeal to travellers. For example, Hugo Boss reopened its concept store in Delhi duty free, with exclusive men’s product ranges.85
• Fashion products are seeing global demand increase, and this is the case in the region as well. Korea is anticipated to remain a major market for global duty free fashion sales, driven in part by Chinese travellers, and there is rising appetite in India’s market. Following the growing demand from Indian travellers, Mumbai Duty Free has expanded, as discussed in Section 3.3.3.
• The growing importance of luxury brands has been accompanied by a change in that demand from Western to Chinese and Korean brands. This is largely driven by the growing volume and affluence of Mainland Chinese travellers.
• Demand for beauty and cosmetics products grew faster in the Asia Pacific region at 20% between 2016 and 2017 than it did globally (at 14% over the same time period).86 Hair care products, men’s fragrances and dermo-cosmetics (a mix of skin health and beauty) are becoming particularly popular in the region.87
• Product personalisation has become a popular feature among a large demographic of Asian tourists, when they purchase gifts for friends and loved ones. This is expected to become an increasingly common service in markets where the volume and influence of Chinese travellers is growing. Personalisation of products takes a plethora of forms, but some examples include unique or named engravings on hip flasks in whisky shops, and confectionery stores that offer customers choice of precisely which items they want and of wrapping, rather than just selling a pre-set and packaged gift box.
• Consumers are driving and increasingly expect competitive pricing from duty free operators. This is especially the case in markets which are strongly influenced by Chinese travellers and where there is competition with downtown duty free stores.
84 Global Data (November 2018) Global Fashion Duty Free Retailing 2017-2022 85 Global Data (June 2018) Duty Free Retailing in Asia Pacific 2017-2022 86 https://retailinasia.com/in-trends/news/in-world/duty free-industry-worth-68-6bn-in-2017/ 87 Global Data (June 2018) Duty Free Retailing in Asia Pacific 2017-2022

Economic Impact of Duty Free and Travel Retail in the Asia Pacific Region – FINAL REPORT 15 October 2019 25
3.5 Improving Physical Retail Spaces
Future growth in the Asia Pacific region’s duty free market will be bolstered by improvements to physical retail spaces and a strengthening of the downtown duty free offer in many countries. With numerous airport expansions and refurbishments, there will be opportunities for new store openings and contract renewals.
3.5.1 Refurbishments and New Store Openings
Refurbishments and new store openings are helping to drive duty free growth throughout all major sub-regions in the Asia Pacific region. Expansions and renovations are occurring not only in major airports but also in downtown shops (discussed further below) as well as cruise ships and ports.
In countries with increasing inbound and outbound international travel, a plethora of new stores has appeared, aimed at capturing growing market potential. In response to rising demand for fashion products from Indian duty free shoppers, Mumbai International Airport has expanded facilities, as previously mentioned. In addition, new airports in countries with emerging air travel sectors, such as Cambodia, are being built with new, fit-for-purpose duty free stores. This approach pushes retail space toward the forefront of terminal design and development instead of being retrofitted.
In many mature duty free markets there is a renewed focus on refurbishments to improve and grow the duty free offer. In Australia, the renovation of duty free retail space at Sydney International Airport led to 13 luxury brands opening new stores and thus giving travellers more choice, while Dufry launched a walk-through “New Generation” store in Melbourne Airport that is 30% larger than the previous store.88 Tokyo’s Narita International Airport recently opened new duty free stores in its Terminal 2 arrivals section, the first Japanese duty free presence in an arrivals area.89 Additionally, Hong Kong International Airport is planning to create a 24 hour ‘SkyCity’ for both locals and travellers. The first phase of the project includes retail, dining, and entertainment areas spanning 195,000 m2, and is scheduled to open in 2021.90
Renovations are geared toward modernising the user experience, keeping in mind growing flows of younger and tech-savvy customers. In January 2018 Shilla Duty Free opened a dedicated beauty store at Seoul-Incheon International Airport equipped with large digital screens embedded into the walls and pillars to display brands and promotions.91 Dufry’s “New Generation” store in Melbourne incorporates similar technology, including high-definition visuals of the city along with digital screen content that changes on an hourly basis in order to market to different flows of incoming passengers.92 Enhanced in-store offerings include customised bottle engraving and product personalisation.
88 Global Data (June 2018) Duty Free Retailing in Asia Pacific 2017-2022; https://www.trbusiness.com/regional-news/Asia Pacific/dufry-opens-new-generation-2743sq-m-melbourne-store/131800 89 https://www.businesstraveller.com/business-travel/2017/09/05/narita-airport-now-duty free-shopping-arrivals-area/ 90 Global Data (June 2018) Duty Free Retailing in Asia Pacific 2017-2022 91 Global Data (June 2018) Duty Free Retailing in Asia Pacific 2017-2022 92 https://www.trbusiness.com/regional-news/Asia Pacific/dufry-opens-new-generation-2743sq-m-melbourne-store/131800
Store renovations are geared towards creating a modern user experience which appeals to the growing number of young, tech-savvy customers.

26 Economic Impact of Duty Free and Travel Retail in the Asia Pacific Region – FINAL REPORT 15 October 2019.
Melbourne Airport's new luxury retail precinct
Source: Melbourne Airport
3.5.2 Role of Downtown Duty Free Locations
Downtown stores circumvent several of the constraints that apply to shopping in traditional duty free venues, such as limited shopping time and narrower product offerings and services. As a result, duty free operators in the Asia Pacific region are increasingly focusing on downtown retail locations to accommodate growing demand for duty free throughout the region. A more detailed discussion on the role of downtown duty free stores is provided in Chapter 5 – Land Sales Channels.
3.6 A Diverse Duty Free Market within the Asia Pacific Region
Not only are consumer preferences, product ranges, and market sizes diverse across the Asia Pacific region, there is also diverse legislation on duty free limits, product ranges, and eligible sales channels. There are few overlaps in terms of the agreed limits and sales channels, painting a complex picture across the region. This is a stark contrast to Europe where there are uniform limits for travellers entering the E.U.93 The Asia Pacific region’s complex duty free allowances can be confusing for travellers; as a result, many duty free operators try to support their customers by providing guides per country.
93 https://ec.europa.eu/taxation_customs/individuals/travelling/entering-eu_en

Economic Impact of Duty Free and Travel Retail in the Asia Pacific Region – FINAL REPORT 15 October 2019 27
Additionally, numerous countries throughout the region have made changes to duty free allowances for domestic and international travellers in recent years. There are two key drivers of these changes: 1) to encourage travellers to spend more on duty free products or make it simpler and easier for them to do so, and 2) to respond to public health initiatives such as reducing smoking rates. Duty free allowances for countries in the Asia Pacific region are set out in Appendix E.
3.7 Summary of Duty Free and Travel Retail Trends in the Asia Pacific Region
Home to most of the world’s population, the Asia Pacific region is also the global leader in the duty free and travel retail industry, with a 45% share of global revenues in 2017 and a record of product and payment innovation. The region contains a myriad of different countries, cultures, political systems, and stages of economic development which is reflected in the status of the sector in different countries. The potential for growth in less mature but sizeable markets suggests that the duty free and travel retail sector will continue to play an important role in the region as an employer and facilitator of economic development.
Current trends suggest that the Asia Pacific region will consolidate its position as the largest duty free and travel retail market. Despite its established nature, Korea, the world’s largest market, is widely expected to maintain its strong growth rate. This is in part due to the strengthening of its downtown duty free market and continually growing volumes of visitors, especially from Mainland China.
Mainland China is also anticipated to strengthen its position as the second biggest duty free and travel retail market in the region, in response to a robust domestic travel market and increasing visitation from travellers from other countries. But China’s role in the Asia Pacific region’s duty free and travel retail market extends profoundly into other countries in the region. This is due to the growing volume and spending of Mainland Chinese travellers, as well as the response by operators to increasingly tailor their product ranges and services to align with Chinese shoppers’ preferences.
India is one of the greatest growth opportunities for the region’s duty free and travel retail market. Despite the size of its population and economy, it has a nascent duty free offer. However, it is forecast to be the fastest growing duty free and travel retail market in the region up to 2022.
Growth in the region’s duty free and travel retail market is also being driven by trends which span borders and cultural differences. E-commerce and new consumer habits are changing how customers want to browse, reserve, and pay for products. At the same time, there is an on-going revitalisation and expansion of the physical duty free and travel retail space. A significant component of this is new retail space in new or growing airports, while new downtown duty free opportunities are becoming increasingly evident across the region.

28 Economic Impact of Duty Free and Travel Retail in the Asia Pacific Region – FINAL REPORT 15 October 2019.
Case Study: Growth of E-Commerce in Hong Kong International Airport’s Duty Free Offering
Introduction
E-commerce in the Asia Pacific Region has undergone rapid growth, at a pace well beyond that of any other region. By the end of 2019, the Asia Pacific region will generate US$832 billion in e-commerce sales to other world regions. On a country-level basis for those within Asia Pacific, China will lead the way at US$740 billion, followed by Japan at US$87 billion and South Korea at US$69 billion.94 There are two main contributors to the high rate of commercial activities online in China. First is the penetration of mobile. In China, there are 800 million users who buy online, make mobile payments, and watch videos produced by marketers. The second is WeChat, which has 1.1 billion registered accounts and over 800 million users. Since WeChat is used in 25 countries, WeChat Pay has made it convenient for users to transact at any merchant accepting this form of payment.95
Recently, WeChat has developed a pilot project “Good Product Circle” to converge social media with commerce platforms to increase opportunities for selling goods and services through social media.96 This allows WeChat members to socially interact with each other, recommending goods and services as well as accessing friends’ recommendation lists.
Another popular mobile payment platform is Alipay, an international payment platform with 800 million registered active users. Alipay, owned by the Alibaba Group, has over 50% of Mainland China’s market.97 This platform enables users to transact directly from their mobile devices to purchase goods and services.
These forms of e-payment have transformed China into an increasingly cashless system and provide a seamless way for Chinese tourists to transact in foreign currencies while travelling. For retailers catering to Chinese travellers, both WeChat Pay and Alipay are now essential.
E-Commerce Shopping at Hong Kong International Airport
With such a high number of e-commerce users in the Asia Pacific region, particularly Mainland Chinese, it is natural for a key hub airport like Hong Kong International Airport to implement an e-commerce platform.
94 Country-level figures include transactions between countries within the same region. Source: https://www.shopify.com/enterprise/global-ecommerce-statistics 95 Source: Vancouver Board of Trade presentation December 11, 2018. Mimi Vong, Founder & CEO, Pontier 96 Source: Jing Daily June 10, 2019. https://jingdaily.com/wechat-social-commerce/ 97 Source: https://en.wikipedia.org/wiki/Alipay
Figure 2 – Shopping on the airport app

Economic Impact of Duty Free and Travel Retail in the Asia Pacific Region – FINAL REPORT 15 October 2019 29
Figure 1 – Passengers by market for Hong Kong International Airport
Source: http://www.hongkongairport.com/iwov-resources/file/airport-authority/publications/annual-and-interim-reports/en/17_18/flipping/63/index.html#zoom=z
In July 2017, the Airport Authority Hong Kong launched its own airport pre-order online platform, HKairportshop.com. Orders placed can be picked up at the airport in 90 minutes or shipped to 15 different market destinations, even long haul destinations such as Australia, USA, or Canada. Complimentary shipping is provided depending on spend amount.
Promotions are regularly offered through online coupons or promo codes for discounts on purchases over a certain threshold. Customers can also shop on the airport app “My Flight HKG” with a chat option to provide information on demand.
While there are three different duty free operators at the airport, the online store is set up to aggregate merchandise from every operator to create a single store experience. To the shopper, the online store is seamless as it transitions between product lines and the operator responsible: beauty is offered by Shilla, while liquor and tobacco is from China Duty Free Group, with Heinemann carrying candies and confectionery. There is one online shopping cart with one check-out transaction. Once the orders have been assembled, customers can pick up their purchase at one of the three Hong-Kong Airport Shop Concierge locations located pre- and post-security.
The various pick-up points serve different customers. For instance, post-security locations serve departing and transiting passengers whereas the pre-security location serves arriving passengers as well as local residents who wish to shop at the airport. For local residents, all goods can be purchased at HKairportshop except for liquor and tobacco with duty free restrictions, the purchase of which requires a valid airline boarding card. Shopping ambassadors are also available at the concierge counters to assist travellers with their airport shopping experience.
Airport and Retailer Channels
Industry experts have speculated that the impact on duty free sales of rising mobile use will be dramatic. Duty free stores see digital as a key driver to connect with customers seamlessly and continuously. Moreover, airports see digital engagement as a way to establish relationships with their customers and to manage these relationships through CRM (customer relationship management). With increasing ability to use CRM to promote airport services and goods, airports are investing
30 Economic Impact of Duty Free and Travel Retail in the Asia Pacific Region – FINAL REPORT 15 October 2019.
heavily in digital technology,98 including apps with location-based services which make use of Bluetooth beacon technology which gathers data points from travellers’ mobile devices as they traverse the terminal.
Airports and concession operators learn about passengers’ preferences and their whereabouts as they journey through the terminal. This data allows airports to send customised retail offers directly to passengers’ mobile devices to promote or incentivise purchases. Airport apps that enable shopping and promote loyalty have intrinsic value to airports, enabling them to collect data and establish a direct communication with passengers. The technology allows airports to capture customer data that airport retailers already collect through their own channels.
More retailers are transitioning to an omnichannel approach, where electronic and physical retail come together to create a seamless experience for customers. For example, Dufry’s online “Reserve & Collect” platform and loyalty app, “Red by Dufry”, allows customers to purchase online and access special promotions at airports where Dufry has a presence. These platforms allow Dufry to connect with its customers wherever they are around the world.
However, while retailers have multiple customer touch points and customized messaging opportunities throughout the customers’ browsing and purchasing process, for the duty free industry, e-commerce platforms are still being used predominantly as an e-catalogue for browsing, with merchandise ultimately being purchased in store.
Impact on sales
Despite the availability of e-commerce tools offered by airports and retailers, sales conversion rates online are low. Industry insiders have indicated that it is difficult to measure incremental revenue from e-commerce sales. However, given Asia’s rapid acceptance of technological advances, shoppers expect e-commerce solutions to be available. The jury is still out as to whether the customer would have made a purchase as part of their journey through the terminal anyway, or whether the ability to pre-shop online precipitated the purchase.
While the airport’s relationship with passengers may be enhanced by technology’s ability to communicate with them prior to departure and in the terminal, little information has been shared publicly about the success of digital channels in generating incremental retail sales. The value for passengers in the airport’s platform is the ease and convenience of finding merchandise as they move through the airport. For the airport and airport retailers, a digital presence and the ability to communicate offerings and transact through e-channels will be essential to retail strategies in the future, given the ubiquity of such technology and passengers’ expectations of its availability, despite the lack of evidence of an immediate return for the investment made in developing them.
For the 2018 fiscal year, Hong Kong International Airport reported annual retail revenue of HK$7.9 billion (US$1 billion), which represents 36% of total airport revenue of HK$22 billion (US$2.8 billion). 2018 retail concessions revenue recorded an increase of 1.4% over the previous year, largely due to passenger growth of 4.5%.99 Using industry standard benchmarking ratio of 1% passenger growth
98 Source: http://www.airport-world.com/news/general-news/6646-asia-pacific-leads-the-way-as-global-duty-free-sales-exceed-68-million.html 99 https://www.hongkongairport.com/iwov-resources/file/airport-authority/publications/annual-and-interim-reports/en/17_18/19-financial-review.pdf

Economic Impact of Duty Free and Travel Retail in the Asia Pacific Region – FINAL REPORT 15 October 2019 31
translates into 0.7%-1% revenue growth;100 it would appear that Hong Kong International Airport’s retail revenue is not increasing in proportion to passenger growth despite its e-commerce efforts. However, it may be that without these developments customers would have been even less willing to spend. E-commerce may therefore simply be a cost of doing business for airports in an increasingly digital environment in the Asia Pacific region. If so, there will be questions as to how the necessary investment can be made most cost effectively.
Airport-retailer partnership
This could be through collaboration with concession operators which is the approach taken by Hong Kong International Airport. When a customer browses for merchandise on its shopping app, the duty free retailers offering that particular product category are automatically displayed with their merchandise selection. For example, shopping for cosmetics would bring up beauty products by Shilla Duty Free, whereas browsing for confectionery would bring up a selection by Heinemann.
Once the purchase is made, collection of goods is supported by the Airport Authority through the airport operated concierge counters. The symbiotic relationship between retailers and HKIA demonstrates how the two entities can work together to support a common goal of increasing sales and improving customer service. Airport portals thereby become a gateway to the duty free retailer as well as allowing airports to use them for other purposes.
100 Moodie Davitt Report.April 2016.Airports Council International, “Main Drivers to Increase Non-Aeronautical Revenues”.
Figure 3 – Hong-Kong International Airport Shop Concierge counter
32 Economic Impact of Duty Free and Travel Retail in the Asia Pacific Region – FINAL REPORT 15 October 2019.
4 Aviation Sales Channels
This chapter focuses on the aviation sales channels (airports and airlines) for duty free and travel retail sales in the Asia Pacific region.101 International passengers travelling by air have the opportunity to buy products in travel retail and duty free stores at airports and on-board those airlines that have opted to provide the service for their passengers.
The development of retail in the aviation sector depends primarily on the health of aviation transport. Continued growth in the demand for air travel has created a well-established channel for duty free and travel retail consumption. Figure 4-1 compares regional trends in air passenger traffic between 2008 and 2017. Over this period, global air passenger traffic grew steadily at an annual rate of 6.2%, spurred primarily by double digit annual growth in Asia Pacific and the Middle East (11.5% and 11.3%, respectively). Latin America and the Caribbean have kept pace with worldwide average passenger growth, with a CAGR of 6.8%. Conversely, air passenger traffic in the mature North American market has the lowest CAGR of all world regions at 2.1%. Europe has grown more than the Americas, but at a slower pace than the global CAGR, at 4.4%.
101 Note that the scope of this study encompasses the duty free and travel retail that is sold to international passengers only. This is consistent with the Duty Free World Council’s definition of duty free and travel retail. See http://dfworldcouncil.com/what-is-duty free-travel-retail/
Key Findings
▪ Total estimated duty free and travel retail sales in the airports and airlines sales channels were US$21.2 billion in 2017.
o The number of direct jobs associated with this sales channel was 95,100.
o The direct GDP associated with this sales channel was US$4.7 billion.
▪ Airport sales, which account for the largest share of duty free and travel retail sales in Asia Pacific, also contribute a substantial share of non-aeronautical revenue to airports which diversifies their revenue stream and can contribute to further investment in operations.
▪ On a per passenger basis, average duty free revenues collected by airports in Asia Pacific are higher than in any other region. Average revenues vary widely across countries and sub-regions within Asia Pacific, however, and are broadly represented by higher revenues in more developed markets relative to emerging markets.
▪ The duty free and travel retail sales generated by airlines were a fraction (5%) of those generated by airport stores in Asia Pacific in 2017. While some carriers in the region have opted to discontinue inflight retail, others have become leading innovators in the inflight duty free market.

Economic Impact of Duty Free and Travel Retail in the Asia Pacific Region – FINAL REPORT 15 October 2019 33
Figure 4-1: Air Passenger Traffic Index (2008 = 1.00), By Region, 2008-2017
Source: ACI World Air Traffic Report and InterVISTAS Consulting analysis.
4.1 Airport Sector
Airports not only facilitate the movement of passengers and cargo, they are major employers in regions where they are located and are therefore important assets to a community. Duty free and travel retail operations are central to an airport’s strategy to build non-aeronautical revenue streams. They are generators of revenue and employment in their own right, offering services to customers, but their financial contribution also assists the airport to invest and expand.
The following sections provide world regional comparisons (and sub-regional data for the Asia Pacific region, where possible) on the key factors driving the scale of duty free and travel retail operations at airports. The airports sector continues to play a significant role in the Asia Pacific region, with the majority of duty free and travel retail sales occurring in airports despite the greater contribution made by other channels compared with other regions of the world.
4.1.1 Data Sources
In assessing the condition of retail infrastructure and revenue102 at airport terminals throughout the Asia Pacific region, Section 4.1.2 and Section 4.1.3 draw upon data contained in the Airport Economics Report: Key Performance Indicators 2019 (KPI), that provides worldwide data from large sample of airports in each global region.103 The data includes ACI World’s own survey data as well as publicly available financial information. A total of 929 airports were surveyed, which together
102 Data on revenues throughout this chapter refer to revenues collected by the airport. For instance, the data on retail concessions and duty free revenues refer to the revenue paid by concessionaires to the airport, rather than the total sales generated by their stores. 103 ACI World’s Key Performance Indicators 2019 was used in this study, representing data from 2017. At the time of this study, this was the most recent data available.
0.9
1.1
1.3
1.5
1.7
1.9
2.1
2.3
2.5
2.7
2008 2009 2010 2011 2012 2013 2014 2015 2016 2017
Ind
ex (
20
08
= 1
.00
)
Africa Asia-Pacific
Europe Latin America and Caribbean
Middle East North America
World

34 Economic Impact of Duty Free and Travel Retail in the Asia Pacific Region – FINAL REPORT 15 October 2019.
handle approximately 78% of worldwide passenger traffic. The Asia Pacific sample includes a total of 247 airports.
In addition, Section 4.1.3 outlines retail trends of airports in four defined sub-regions of the larger Asia Pacific region. This analysis was performed using a subset of the 2019 Key Performance Indicators data set which was provided by ACI World specifically for this study. The subset is comprised of a total of 247 Asia Pacific airports, broken down into sub-regions, as shown in Table 4-1.
Table 4-1: Sub-Regional Breakdown of Airports Included in the 2019 KPI Data Subset
Sub-Region Number of Airports in Subset Sample
East Asia 31
South Asia 134
South East Asia 60
Oceania 22
Total Sub-Region 247
It is noted that data on some airports in some countries are not available due to incomplete survey responses or non-participation. The ACI World sub-regional data does not include information from airports in Mainland China and others (notably Singapore Changi Airport). In addition, certain cuts of data will have varying sample sizes since not all respondents answered all questions. Sample sizes are lower for more detailed KPIs including those on duty free revenues. With these major exceptions data presented in the following sections captures the major economic players in Asia Pacific.
4.1.2 Revenue Trends in Airport Terminals
Airport financial performance is dependent on two general sources of revenue: aeronautical fees related to air transportation services carried out at the airports, and non-aeronautical or commercial revenues from other business activities conducted at or by the airport (e.g., food and beverage concessions, car parking, duty free and travel retail concessions).
Non-Aeronautical Revenues
The profile of non-aeronautical business at airports varies significantly across different world regions. For most regions, including Asia Pacific, the single largest source of non-aeronautical revenue is from retail concessions (which includes duty free), as shown in Figure 4-2. In the Asia Pacific region, 45% of non-aeronautical revenues are generated from this business segment, well above the global average of 30% and greater than all other regions except the Middle East (53% of total non-aeronautical revenues). In contrast, North American airports predominantly rely on car rental and car parking business segments (58% of total non-aeronautical revenues) as their single largest source of non-aeronautical revenues, while retail concessions revenues make up only 8%.104
104 For more information on the Economic Impact of Duty Free and Travel Retail in the Americas, the study is available at: http://dfworldcouncil.com/wp-content/uploads/2018/09/Full-Report_Economic-Impact-of-Duty-Free-and-Travel-Retail-in-the-Americ....pdf
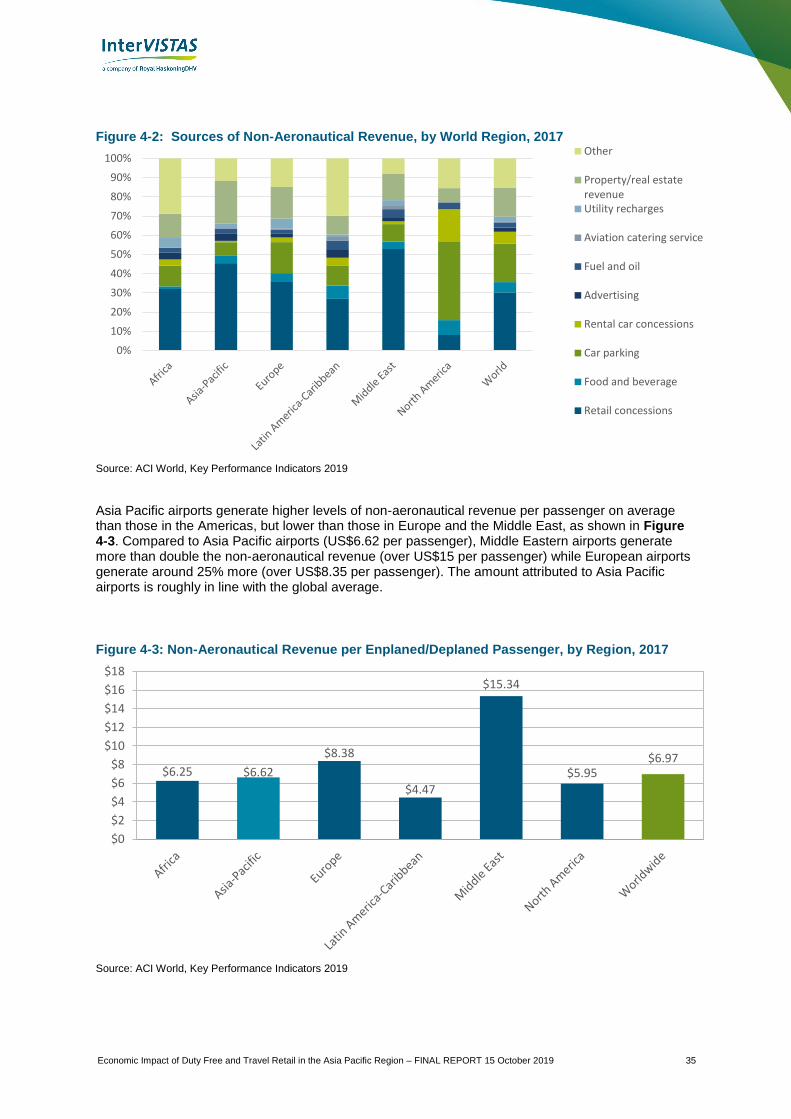
Economic Impact of Duty Free and Travel Retail in the Asia Pacific Region – FINAL REPORT 15 October 2019 35
Figure 4-2: Sources of Non-Aeronautical Revenue, by World Region, 2017
Source: ACI World, Key Performance Indicators 2019
Asia Pacific airports generate higher levels of non-aeronautical revenue per passenger on average than those in the Americas, but lower than those in Europe and the Middle East, as shown in Figure 4-3. Compared to Asia Pacific airports (US$6.62 per passenger), Middle Eastern airports generate more than double the non-aeronautical revenue (over US$15 per passenger) while European airports generate around 25% more (over US$8.35 per passenger). The amount attributed to Asia Pacific airports is roughly in line with the global average.
Figure 4-3: Non-Aeronautical Revenue per Enplaned/Deplaned Passenger, by Region, 2017
Source: ACI World, Key Performance Indicators 2019
0%
10%
20%
30%
40%
50%
60%
70%
80%
90%
100%Other
Property/real estaterevenueUtility recharges
Aviation catering service
Fuel and oil
Advertising
Rental car concessions
Car parking
Food and beverage
Retail concessions
$6.25 $6.62
$8.38
$4.47
$15.34
$5.95$6.97
$0
$2
$4
$6
$8
$10
$12
$14
$16
$18

36 Economic Impact of Duty Free and Travel Retail in the Asia Pacific Region – FINAL REPORT 15 October 2019.
Airport Retail Revenues105
The role of retail at Asia Pacific airports is more pronounced than in most world regions, with retail revenues producing more than 20% of total airport revenues, compared to the global average of 12%. On a per passenger basis, airports in the Asia Pacific region generate retail concessions revenue at higher levels than North American and Latin America-Caribbean airports, and at similar levels to European airports. For example, Asia Pacific airports average US$3.01 of retail concessions revenue per passenger, compared to only US$0.48 per passenger for North American airports, and US$2.99 for European airports. Figure 4-4 and Figure 4-5 provide more detail. All else equal, average retail revenues collected by airports may differ across regions (and individual airports) given potential discrepancies in the fee rates charged by airports to their concessionaires. Average retail yields may be higher for airports in the Middle East than in other regions which could in turn drive higher average retail revenue to these airports. Conversely, some airports in emerging markets in Asia may charge below-average fees to attract duty free and travel retail operators, suggesting that average airport revenues for the region could be higher.106
Figure 4-4: Terminal Retail Revenue as a Share of Total Airport Revenue, by Region, 2017
Source: ACI World, Key Performance Indicators 2019.
105 Airport retail revenue refers exclusively to revenue generated from concessions by airports. Individual airports will have different agreements with regards to revenue generated through these concessions (e.g., through a percentage of sales collected), this revenue does not represent the total concession retail sales at an airport. 106 To preserve confidentiality, ACI does not disclose which airports contributed to individual responses in the survey, nor does it collect data on concessions yields generated by the airports. As a result, it cannot be determined how the revenue figures in the ACI data may be impacted by differences in concessionaire fees charged by airports.
8.3%
20.2%
13.5%
8.0%
25.2%
3.0%
11.8%
0%
5%
10%
15%
20%
25%
30%

Economic Impact of Duty Free and Travel Retail in the Asia Pacific Region – FINAL REPORT 15 October 2019 37
Figure 4-5: Retail Concessions Revenue per Enplaned/Deplaned Passenger, by Region, 2017
Source: ACI World, Key Performance Indicators 2019.
Airport Retail Infrastructure
Asia Pacific airports have on average a greater number of retail stores (58) than all other world regions, though the amount of retail area, after accounting for traffic levels, is on par with the worldwide average as summarised in Figure 4-6. European, Latin America-Caribbean, and Middle Eastern airports offer roughly half of the number of retail stores compared to Asia Pacific airports, but they all allocate more retail space on a per passenger basis. While the retail concessions revenues per passenger in Europe and Asia are roughly similar, $2.99 and $3.01, respectively in 2017, airports in the Asia Pacific region have less retail area on average (despite the higher number of stores), with 0.37 square metres of retail area per 1,000 passengers compared to 0.51 square metres of retail area per 1,000 passengers in Europe.
Retail space at Asia Pacific airports is the most productive of all world regions generating on average over US$11,900 per square metre, more than three times that of North American airports (US$3,500 per square metre) and more than twice that of Europe, as shown in Figure 4-7. This high average revenue generation by a limited amount of retail space, compared to other regions, suggests Asia Pacific airports could benefit from allocating more area for retail.
$2.00$3.01 $2.99
$1.20
$8.11
$0.48
$2.11
$0$1$2$3$4$5$6$7$8$9
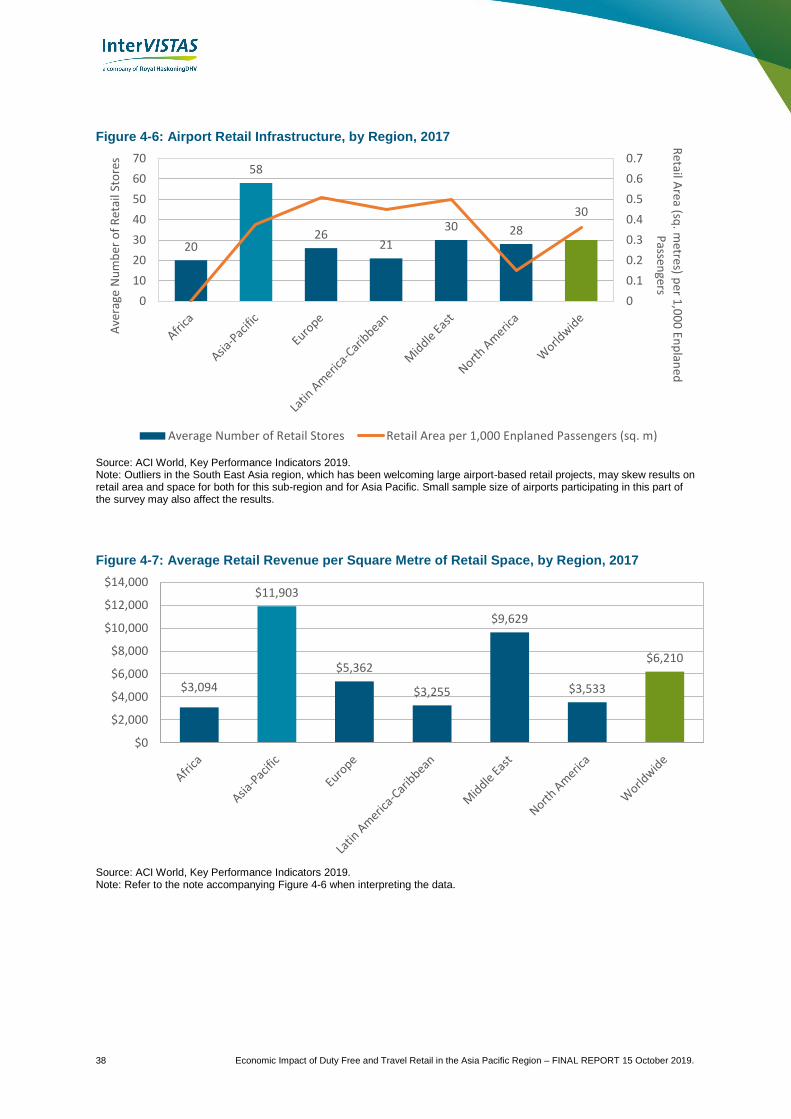
38 Economic Impact of Duty Free and Travel Retail in the Asia Pacific Region – FINAL REPORT 15 October 2019.
Figure 4-6: Airport Retail Infrastructure, by Region, 2017
Source: ACI World, Key Performance Indicators 2019. Note: Outliers in the South East Asia region, which has been welcoming large airport-based retail projects, may skew results on retail area and space for both for this sub-region and for Asia Pacific. Small sample size of airports participating in this part of the survey may also affect the results.
Figure 4-7: Average Retail Revenue per Square Metre of Retail Space, by Region, 2017
Source: ACI World, Key Performance Indicators 2019. Note: Refer to the note accompanying Figure 4-6 when interpreting the data.
20
58
2621
30 28
30
0
0.1
0.2
0.3
0.4
0.5
0.6
0.7
0
10
20
30
40
50
60
70
Retail A
rea (sq. m
etres) per 1
,00
0 En
plan
ed
Passen
gersA
vera
ge N
um
ber
of
Ret
ail S
tore
s
Average Number of Retail Stores Retail Area per 1,000 Enplaned Passengers (sq. m)
$3,094
$11,903
$5,362
$3,255
$9,629
$3,533
$6,210
$0
$2,000
$4,000
$6,000
$8,000
$10,000
$12,000
$14,000

Economic Impact of Duty Free and Travel Retail in the Asia Pacific Region – FINAL REPORT 15 October 2019 39
Airport Duty Free Revenues107,108
Of the airports that provided data on duty free concessions, the average gross duty free revenue per departing international passenger stood at US$7.22 among Asia Pacific airports (see Figure 4-8). This is the highest figure provided by surveyed airports across all world regions. For all world regions except North America, duty free revenues account for more than half of total retail revenues, as shown in Figure 4-9. 75% of total retail revenues at Asia Pacific airports comes from duty free, compared to 96% in the Middle East and 40% in North America. This compares to the overall global average of 71%. This may, in part, stem from differences in the distribution of international and domestic passenger traffic within each region. For example, passenger traffic at airports in the United States is predominantly domestic, which reduces the potential customer base for duty free spending, subsequently impacting duty free revenues. In contrast, regions home to many key international transiting hubs (such as Dubai International Airport in the Middle East) handle much higher portions of international passenger traffic than domestic, providing a larger customer base to generate duty free revenues. While the Asia Pacific region handles significant international passenger traffic, just over two-thirds of traffic in the region remains domestic.
Figure 4-8: Duty Free Revenue per Departing International Passenger, by Region, 2017
Source: ACI World, Key Performance Indicators 2019. Note: Figures should be interpreted with caution given small sample size of respondents. Differences among regions, as well as differing trends across KPIs and figures shown, may be magnified by differing and limited sample sizes as well.
107 Data specific to duty free concessions was provided by a more limited number of airports than for retail concessions. Given the small sample size, interpretations drawn from this section should be viewed with caution as they may not be fully representative of the trends associated with each world region. 108 Airport duty free retail revenue refers exclusively to revenue generated from duty free by airports. Individual airports will have different agreements with regards to revenue generated through these concessions (e.g., through a percentage of sales collected), this revenue does not represent the total duty free sales at an airport.
$1.88
$7.22
$2.65 $2.70
$7.02
$1.13
$4.54
$0
$1
$2
$3
$4
$5
$6
$7
$8
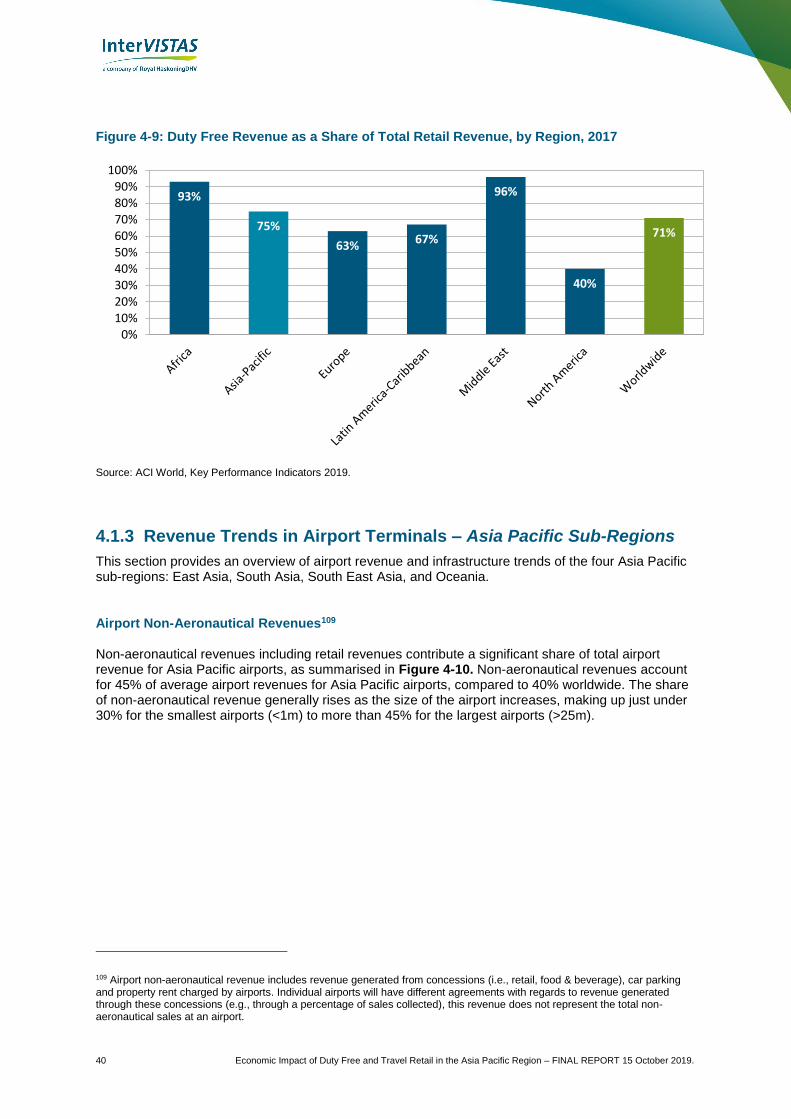
40 Economic Impact of Duty Free and Travel Retail in the Asia Pacific Region – FINAL REPORT 15 October 2019.
Figure 4-9: Duty Free Revenue as a Share of Total Retail Revenue, by Region, 2017
Source: ACI World, Key Performance Indicators 2019.
4.1.3 Revenue Trends in Airport Terminals – Asia Pacific Sub-Regions
This section provides an overview of airport revenue and infrastructure trends of the four Asia Pacific sub-regions: East Asia, South Asia, South East Asia, and Oceania.
Airport Non-Aeronautical Revenues109
Non-aeronautical revenues including retail revenues contribute a significant share of total airport revenue for Asia Pacific airports, as summarised in Figure 4-10. Non-aeronautical revenues account for 45% of average airport revenues for Asia Pacific airports, compared to 40% worldwide. The share of non-aeronautical revenue generally rises as the size of the airport increases, making up just under 30% for the smallest airports (<1m) to more than 45% for the largest airports (>25m).
109 Airport non-aeronautical revenue includes revenue generated from concessions (i.e., retail, food & beverage), car parking and property rent charged by airports. Individual airports will have different agreements with regards to revenue generated through these concessions (e.g., through a percentage of sales collected), this revenue does not represent the total non-aeronautical sales at an airport.
93%
75%
63% 67%
96%
40%
71%
0%10%20%30%40%50%60%70%80%90%
100%
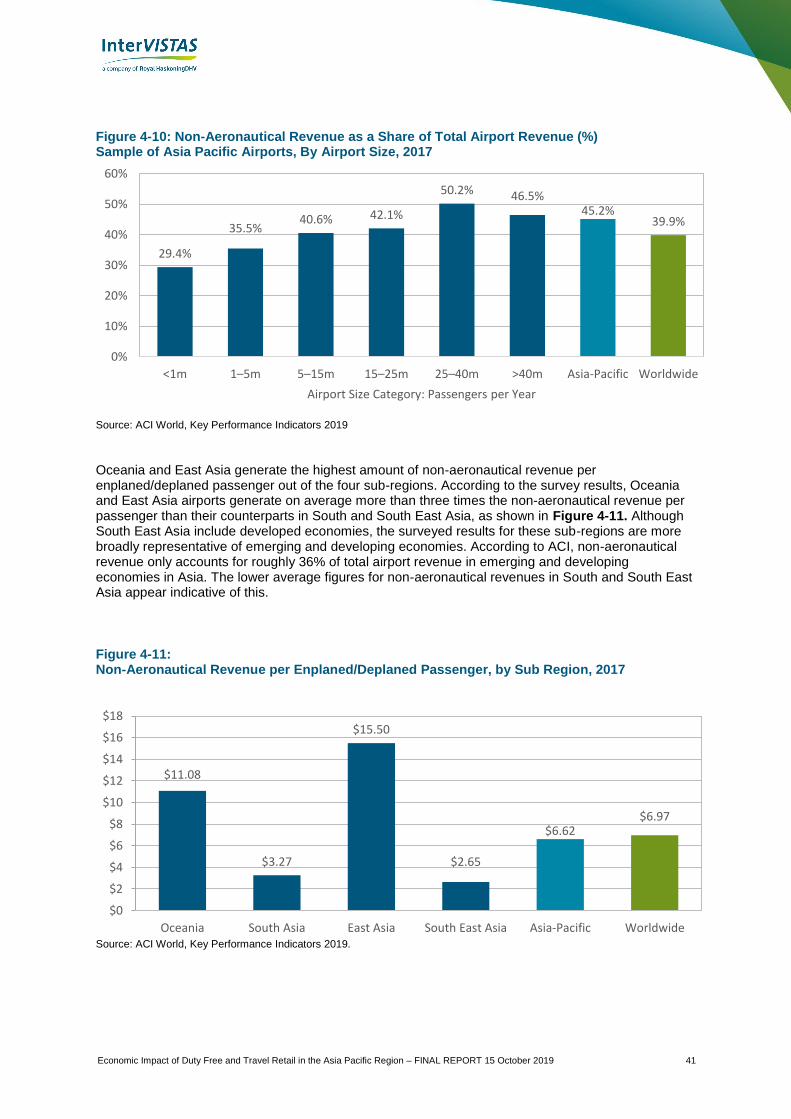
Economic Impact of Duty Free and Travel Retail in the Asia Pacific Region – FINAL REPORT 15 October 2019 41
Figure 4-10: Non-Aeronautical Revenue as a Share of Total Airport Revenue (%) Sample of Asia Pacific Airports, By Airport Size, 2017
Source: ACI World, Key Performance Indicators 2019
Oceania and East Asia generate the highest amount of non-aeronautical revenue per enplaned/deplaned passenger out of the four sub-regions. According to the survey results, Oceania and East Asia airports generate on average more than three times the non-aeronautical revenue per passenger than their counterparts in South and South East Asia, as shown in Figure 4-11. Although South East Asia include developed economies, the surveyed results for these sub-regions are more broadly representative of emerging and developing economies. According to ACI, non-aeronautical revenue only accounts for roughly 36% of total airport revenue in emerging and developing economies in Asia. The lower average figures for non-aeronautical revenues in South and South East Asia appear indicative of this.
Figure 4-11: Non-Aeronautical Revenue per Enplaned/Deplaned Passenger, by Sub Region, 2017
Source: ACI World, Key Performance Indicators 2019.
29.4%
35.5%40.6% 42.1%
50.2% 46.5%45.2%
39.9%
0%
10%
20%
30%
40%
50%
60%
<1m 1–5m 5–15m 15–25m 25–40m >40m Asia-Pacific Worldwide
Airport Size Category: Passengers per Year
$11.08
$3.27
$15.50
$2.65
$6.62$6.97
$0
$2
$4
$6
$8
$10
$12
$14
$16
$18
Oceania South Asia East Asia South East Asia Asia-Pacific Worldwide

42 Economic Impact of Duty Free and Travel Retail in the Asia Pacific Region – FINAL REPORT 15 October 2019.
In line with worldwide trends, the largest source of non-aeronautical revenues for airports in Oceania, South East Asia, and East Asia is retail concessions revenues, as shown in Figure 4-12. In contrast, non-aeronautical revenues for South Asia airports primarily come from the property and real estate segment (47% of total non-aeronautical revenues). Retail concessions revenues make up only 17% of total non-aeronautical revenues for South Asia airports, compared to over 30% in Oceania and South East Asia, and over 60% in East Asia.
Figure 4-12: Sources of Non-Aeronautical Revenue, by Sub-Region, 2017
Source: ACI World, Key Performance Indicators 2019.
Retail Trends
As a component of total airport revenues, retail revenues play a prominent role for Asia Pacific airports, with all but one sub-region (South Asia) performing above the global average, as depicted in Figure 4-13. East Asia airports lead the way, generating on average more than 32% of total airport revenues from this revenue stream, followed by Oceania (16%) and South East Asia (12%). A similar picture is painted when considering retail concessions revenue generated on a per passenger basis, as shown in Figure 4-14. East Asia airports generate an average of nearly US$9.50 per passenger, almost three times that of Oceania airports and more than nine times both South Asia and South East Asia airports. Against the global average of US$2.11 per passenger, East Asia and Oceania airports outperform whereas South and South East Asia airports underperform. As noted above, the average returns on non-aeronautical activities in South and South East Asia are more representative of emerging economies – where demand and infrastructure for non-aeronautical activities, including retail, are still developing.
0%
10%
20%
30%
40%
50%
60%
70%
80%
90%
100%
Oceania South Asia East Asia South EastAsia
Asia-Pacific World
Other
Property/real estate revenue
Utility recharges
Aviation catering service
Fuel and oil
Advertising
Rental car concessions
Car parking
Food and beverage
Retail concessions

Economic Impact of Duty Free and Travel Retail in the Asia Pacific Region – FINAL REPORT 15 October 2019 43
Figure 4-13: Terminal Retail Revenue as a Share of Total Airport Revenue, by Sub-Region, 2017
Source: ACI World, Key Performance Indicators 2019
Figure 4-14: Retail Concessions Revenue per Enplaned/Deplaned Passenger, by Sub-Region, 2017
Source: ACI World, Key Performance Indicators 2019.
Terminal Retail Infrastructure
Terminal retail infrastructure, both in terms of the average number of retail stores and retail space per passenger, varies considerably among sub-regions, as shown in Figure 4-15. East Asia airports have the highest number of retail stores (120) but offer less space per passenger (0.29 sq. m per passenger) than airports in Oceania and South East Asia. In contrast, Oceania airports, while having relatively fewer stores (33), provide more space per passenger (0.72 sq. m per passenger).
As summarised in Figure 4-16, neither the number of stores nor space per passengers are necessarily indicative of the productivity of terminal retail spaces at Asia Pacific airports. For example, East Asia airports, while offering significantly less space per passenger than their counterparts in South East Asia, generate more than thirty times the average revenue per square metre. Furthermore, South Asia airports have on average more than twice the number of stores as airports in Oceania but generate less retail revenue per square metre. With the exception of East Asia, all sub-regions lie below the global average for retail revenue generated per square metre of retail space.
16.1%
6.1%
32.2%
11.9%
20.2%
11.8%
0%
5%
10%
15%
20%
25%
30%
35%
Oceania South Asia East Asia South East Asia Asia-Pacific Worldwide
$3.69
$0.57
$9.47
$0.95
$3.01$2.11
$0
$1
$2
$3
$4
$5
$6
$7
$8
$9
$10
Oceania South Asia East Asia South East Asia Asia-Pacific Worldwide
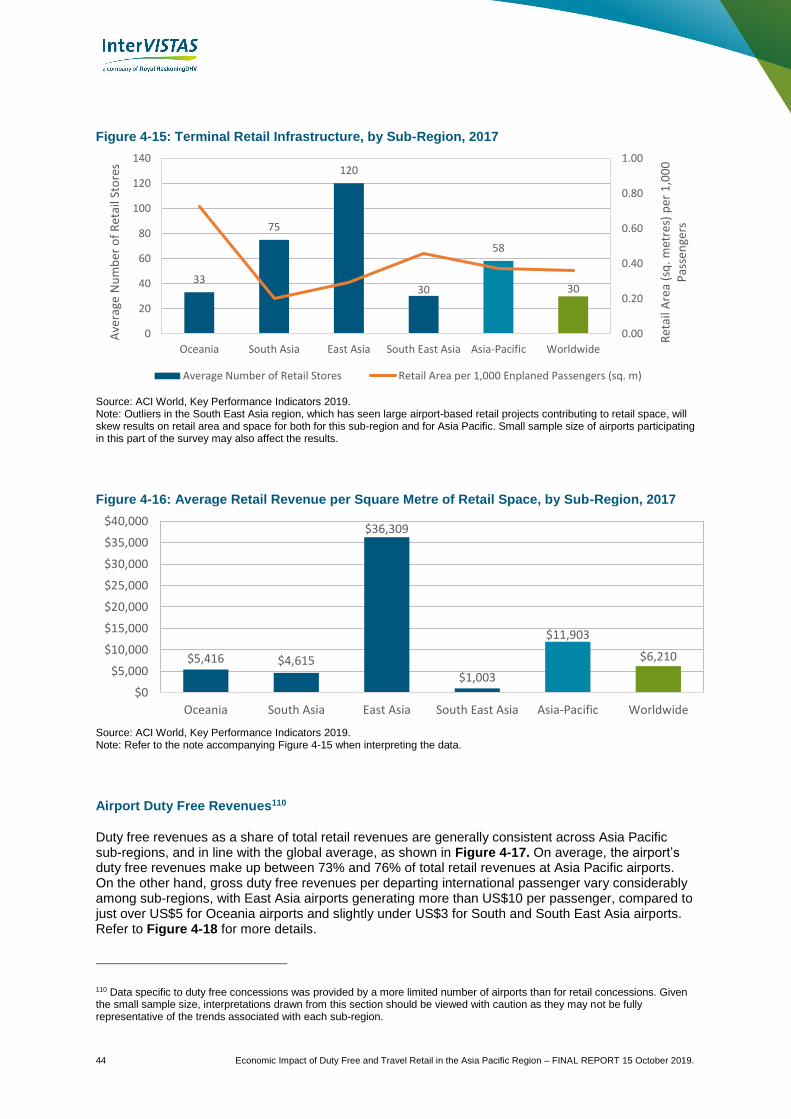
44 Economic Impact of Duty Free and Travel Retail in the Asia Pacific Region – FINAL REPORT 15 October 2019.
Figure 4-15: Terminal Retail Infrastructure, by Sub-Region, 2017
Source: ACI World, Key Performance Indicators 2019. Note: Outliers in the South East Asia region, which has seen large airport-based retail projects contributing to retail space, will skew results on retail area and space for both for this sub-region and for Asia Pacific. Small sample size of airports participating in this part of the survey may also affect the results.
Figure 4-16: Average Retail Revenue per Square Metre of Retail Space, by Sub-Region, 2017
Source: ACI World, Key Performance Indicators 2019. Note: Refer to the note accompanying Figure 4-15 when interpreting the data.
Airport Duty Free Revenues110
Duty free revenues as a share of total retail revenues are generally consistent across Asia Pacific sub-regions, and in line with the global average, as shown in Figure 4-17. On average, the airport’s duty free revenues make up between 73% and 76% of total retail revenues at Asia Pacific airports. On the other hand, gross duty free revenues per departing international passenger vary considerably among sub-regions, with East Asia airports generating more than US$10 per passenger, compared to just over US$5 for Oceania airports and slightly under US$3 for South and South East Asia airports. Refer to Figure 4-18 for more details.
110 Data specific to duty free concessions was provided by a more limited number of airports than for retail concessions. Given the small sample size, interpretations drawn from this section should be viewed with caution as they may not be fully representative of the trends associated with each sub-region.
33
75
120
30
58
30
0.00
0.20
0.40
0.60
0.80
1.00
0
20
40
60
80
100
120
140
Oceania South Asia East Asia South East Asia Asia-Pacific Worldwide
Ret
ail A
rea
(sq
. met
res)
per
1,0
00
P
asse
nge
rs
Ave
rage
Nu
mb
er o
f R
etai
l Sto
res
Average Number of Retail Stores Retail Area per 1,000 Enplaned Passengers (sq. m)
$5,416 $4,615
$36,309
$1,003
$11,903
$6,210
$0
$5,000
$10,000
$15,000
$20,000
$25,000
$30,000
$35,000
$40,000
Oceania South Asia East Asia South East Asia Asia-Pacific Worldwide

Economic Impact of Duty Free and Travel Retail in the Asia Pacific Region – FINAL REPORT 15 October 2019 45
As previously noted, some airports may charge below-average fees to concessionaires which can dampen the duty free (or retail) revenues collected in certain countries or sub-regions. For instance, Thailand’s major international airports (managed by a single operator, Airports of Thailand Plc) currently administer duty free as a single master concession from which the airports collect only 15-18% of the sales generated by the stores – far below the average fees seen elsewhere in the region and worldwide.111 Retailers have called for the airport operator to split the duty free offering into smaller contracts based on product line, which would allow more retailers to partake in airport operations and could collectively generate double the fee rates (30-40%) for the airports, as well as potentially higher sales overall.112
Figure 4-17: Duty Free Airport Revenues as a Share of Total Retail Airport Revenues (%), by Sub-Region, 2017
Source: ACI World, Key Performance Indicators 2019.
Figure 4-18: Gross Duty Free Airport Revenues per Departing International Passenger, by Sub-Region, 2017
Source: ACI World, Key Performance Indicators 2019. Note: Figures should be interpreted with caution given small sample size of respondents. Differences among regions, as well as differing trends across KPIs and figures shown, may be magnified by differing and limited sample sizes as well.
111 Bangkok Post (https://www.bangkokpost.com/thailand/general/1632962/tra-pushes-again-for-duty-free-split). 112 Ibid.
72.8% 72.9% 76% 75% 75% 71%
0%
20%
40%
60%
80%
100%
Oceania South Asia East Asia South East Asia Asia-Pacific Worldwide
$5.22
$2.80
$10.21
$2.80
$7.22
$4.54
$0
$2
$4
$6
$8
$10
$12
Oceania South Asia East Asia South East Asia Asia-Pacific Worldwide
46 Economic Impact of Duty Free and Travel Retail in the Asia Pacific Region – FINAL REPORT 15 October 2019.
Case Study: Changi Airport Group’s Approach to Retail and Airport Infrastructure Design
In general, airports have opted to expand non-aeronautical activities as a means of supplementing their revenue flows. The recent ACI Economics Report affirms the continued importance of non-aeronautical revenues for airports’ future financial sustainability. Over the past decade, airports have supported steady growth in passenger traffic and continue to be economic engines for their communities.
While the industry has continued to grow, airports also face capacity constraints in the medium term, with demand often outstripping an airport’s capacity to handle more passengers. One way an airport can manage the gap between demand and capacity is to continue to “invest, improve and grow”.113 In addition to aeronautical revenues received from airport users, non-aeronautical revenues can be major funding sources that airports can tap into to invest in infrastructure and service improvements.
Singapore Changi Airport (SIN) is one such example of an airport in Asia Pacific that has well developed non-aeronautical revenue streams. In 2018, SIN hosted over 65 million passengers and looks to serve a similar traffic level in 2019. The airport facilitates air services by over 120 airlines to 380 cities in 100 countries, with over 1,000 flights and 179,000 passengers daily. To do this effectively Changi Airport Group (CAG) 114 has developed focused strategies for retail and airport infrastructure development across its four existing terminals (T1-4) and the future T5.115
CAG undertakes a collaborative approach to its airport infrastructure design, as demonstrated in the design of T4. Many of the principles and guidelines used in the development of T4 with respect to the use of technology, and airport efficiency and productivity will be carried forward and improved upon in the T5 development. CAG is actively developing and enhancing its concessions, including duty free operations at SIN, with a focus on delivering a high rate of customer satisfaction.
113 https://aci.aero/news/2019/03/28/aci-economics-report-affirms-the-importance-of-non-aeronautical-revenues-for-airports-financial-sustainability/ 114 Changi Airport Group (CAG) is responsible for the management and day-to-day operation of Changi Airport (SIN). 115 T5’s expected completion is 2030 at a cost of $10 billion. It will increase the airport’s total capacity to 135 million passengers, up from the current 82 million airport handling capacity.

Economic Impact of Duty Free and Travel Retail in the Asia Pacific Region – FINAL REPORT 15 October 2019 47
Changi’s Fast And Seamless Travel (FAST) System at T4
In Oct 2017, T4 opened to the public and Changi Airport unveiled FAST (Fast And Seamless Travel). The intent of FAST is to offer passengers self-service options at various stages of departure from check-in, bag drop, immigration to boarding. Passengers save time going through the FAST process and are able to spend more time resting and relaxing prior to their flight or can shop at T4’s concessions. CAG projects that these initiatives may yield potential manpower savings of 20% in the longer term.116 With greater low cost carrier (LCC) and ultra-low cost carrier (ULCC) traffic, the airport faces continued pressures to increase productivity and efficiency. LCC Air Asia has been supportive, indicating that T4 is consistent with the airline’s vision of becoming a digital airline.117 Air Asia worked closely with Changi Airport Group to automate and innovate T4’s infrastructure. The integration of FAST into T4 and the future T5, along with Changi Airport Group’s focus on the passenger experience and satisfaction is woven into CAG’s planning to create more efficient movement of passengers.
Changi’s Retail Branding and Selection Strategy118
CAG undertakes a deliberate approach to developing the airport’s retail experience. The number of retail outlets at SIN has grown from 12 (1981) to 160 (2017).119 The process of developing the retail mix and brands at SIN first begins with research by CAG to better understand their customers. Primary research is conducted directly with customers to understand their retail needs and the products that would be popular with travellers. Research outside of SIN is also key to the process to better understand product trends in downtown malls and overseas airports.
116 http://www.changiairport.com/corporate/media-centre/newsroom.html#/pressreleases/changi-airport-unveils-upcoming-terminal-4-2080563 117 https://www.airasia.com/mo/en/press-releases/airasia-moving-to-terminal-4-at-singapore-changi-airport.page 118 http://www.changiairport.com/content/cag-corp/en/media-centre/resources/publication/issue-6/how-are-retail-brands-curated.html 119 Source: T4KING FLIGHT, The Changi Airport Terminal 4 Story
“Now, working with CAG, we are
moving on to the digitalisation of our
airport experience. The improved
savings and efficiencies from FAST
align perfectly with our quest to
maintain the lowest cost structure as
well as our vision of seamless
travel, which means lower fares for
our guests and more traffic for
Changi.”
AirAsia Group CEO,
Tan Sri Tony Fernandes
AirAsia Press Release, 16 Nov 2017

48 Economic Impact of Duty Free and Travel Retail in the Asia Pacific Region – FINAL REPORT 15 October 2019.
When selecting brands to join SIN, consideration is given to the existing mix of retail at the airport (and within each terminal) and considering passenger profile and preferences. Chosen concessions must have sound financials and a good track record with service standards and operational capabilities. Beyond this, CAG then considers any special elements that a brand can bring to SIN that could be unique to the airport. Once a concession is selected, CAG ensures that the operation runs smoothly. CAG supports its concessions with training programs, service excellence schemes, marketing programs, and an online platform to allow passengers to make purchases prior to arriving at the airport for pick-up.
CAG emphasizes that travel retail has a natural advantage over downtown retail stores due to being tax free and, for some product categories such as liquor, duty free. The presence of passengers with time on their hands translates into higher footfall compared to stores downtown.
At T4, increased use of technology and streamlined processes have resulted in passengers spending more time in the terminal frequenting T4’s retail, food and beverage offerings. The duty free store at T4, jointly operated by Shilla Duty Free and DFS, is situated for passengers to walk-through after clearing security and immigration. CAG indicates that to have a combined operation, with two different operators, has raised the offerings by both providers to bring the best products and services to passengers. With the anticipation that T5 would come online soon, this was the reason why T4 looked at providing customers with an “integrated duty free zone”.
Conclusion
CAG’s development of its airport infrastructure in conjunction with its retail program has resulted in positive outcomes for passengers. The FAST system at T4 and the future T5 helps to streamline the movement of passengers leaving more time to be spent by passengers in-terminal, including shopping at concessions.
“Both (Shilla Duty Free and DFS)
are excellent operators in their own
right and they will want to raise their
game. They are thinking about how
to maximise passenger spend and
penetration. It’s different from being
a single operator. They need to
collaborate and they have done, in a
tripartite alliance with us as landlord.
We are all looking at how we can
get the customer to enjoy the
environment”
Teo Chew Hoon, CAG Sr VP Airside
Concessions
The Moodie Davitt Report,
May 2017.

Economic Impact of Duty Free and Travel Retail in the Asia Pacific Region – FINAL REPORT 15 October 2019 49
4.2 Airline Sector
In the airline sector, duty free and travel retail is one opportunity in an expanding list of ancillary offerings that carriers use to diversify their revenue stream beyond the airfare and the primary service being provided – transportation. As shown in Figure 4-19, Europe remains the largest market in the airline sector after surpassing US$1 billion in airline duty free sales in 2017 (41% of channel total), followed by Asia Pacific with approximately US$847 million in sales (33% of channel total). The sales generated by airlines are a fraction of those generated by airport stores. In Asia Pacific, airline-generated sales were equivalent to approximately 5% of airport-generated sales in 2017.120
Figure 4-19: Airline Duty Free and Travel Retail Sales by Region, 2017
Source: Generation Research.
Nearly 40% of all inflight duty free sales in Asia Pacific were generated by three airlines – Korean Air, AirAsia Group,121 and Asiana Airlines. These carriers’ share of inflight duty free sales outpaced their share of international air services across all Asian-Pacific carriers. For instance, AirAsia Group collectively accounted for an estimated 7% of the region’s total international seat capacity provided by Asian-Pacific carriers, while its share of inflight duty free sales is estimated at 11%.122 Korean Air’s relative performance in duty free retail is even more pronounced, with 18% of all inflight duty free sales by Asia Pacific airlines yet less than 5% of the region’s total international seat capacity. The airline’s in-flight ancillary revenues make up a very high share of its total ancillary revenues, relative to other airlines. The region’s remaining inflight sales are distributed across roughly two to three dozen carriers, as shown in Figure 4-20.123
120 Generation Research. 121 Includes AirAsia Malaysia, Indonesia, Philippines, Thailand, and India. AirAsia Japan is excluded. AirAsia X is not part of the Group and therefore excluded as well. 122 Based on 2017 scheduled seat capacity from Innovata schedule data per Diio Mi. 123 Generation Research; Moodie Davitt Report; IdeaWorks Company, The 2018 CarTrawler Yearbook of Ancillary Revenue.
Europe$1,055
Asia-Pacific$847
Americas$344
Middle East$261
Africa$54

50 Economic Impact of Duty Free and Travel Retail in the Asia Pacific Region – FINAL REPORT 15 October 2019.
Figure 4-20: Share of Inflight Duty Free Sales - Asia Pacific Carriers, 2017
Note: AirAsia Group includes AirAsia Malaysia, Indonesia, Philippines, Thailand, and India. AirAsia Japan is excluded. AirAsia X is not part of the Group and therefore excluded as well. Sources: The Moodie Davitt Report, IdeaWorks, and Generation Research.
Korean Air is both the regional and world leader for inflight duty free sales, generating a total of US$151 million in duty free revenue in 2017.124 This accounted for 18% of all duty free sales by Asian-Pacific carriers and approximately 1.8% of all duty free sales in South Korea.125 Korean Air’s 2017 result represents a decline of over 10% relative to its 2016 duty free sales of US$168 million; the carrier was similarly impacted by the drop in Chinese tourism in 2017 as downtown and airport duty free stores in Korea.126,127 Initial reports indicate Korean Air’s inflight retail sales continued to drop in 2018, by about 5% to US$143 million, as Chinese tourism to Korea has only just begun to recover and remains well below 2016 levels.128
Korean Air’s inflight retail programme reflects a significant investment to make the sales channel not only an integral source of revenue but also a means differentiating the carrier’s service from its competition. The duty free offering is expansive, with an online platform for pre-orders, retail catalogues available on all international flights, and even headrest stickers saying “Please wake me for duty free”.129 Most notably, Korean Air offers physical duty free storefronts, staffed by full-time sales assistants, on three of its Airbus A380 aircraft. These stores showcase a variety of luxury products in a space that could otherwise be filled by 13 economy seats. The expectation is that the additional sales generated by merchandising high-end products in this space, along with revenue from advertising space in the stores, will exceed the loss in airfares from the sacrificed seating.130 Although the carrier’s newer and future long-haul fleet will be comprised of smaller widebodies that
124 Moodie Davitt Report (https://www.moodiedavittreport.com/korean-air-set-to-post-us151-million-in-2017-duty free-sales/). 125 Korean Air duty free data per The Moodie Davitt Report, with comparison to duty free sales in other channels per Korea Duty Free Association (KDFA). KDFA does not report on airline duty free revenues. 126 Moodie Davitt Report. 127 In early 2017, China’s government imposed a group tour ban after the U.S. military began to use the Terminal High Altitude Area Defense (THAAD) system in South Korea. However, in November 2017, the South Korean government agreed to military constraints and China lifted the travel ban. 128 Moodie Davitt Report (https://www.moodiedavittreport.com/korean-air-set-to-maintain-inflight-retail-top-spot-with-us143-million-in-2018-sales/). 129 Korean Air; Airways Magazine (https://airwaysmag.com/best-of-airways/economy-class-los-angeles-lax-seoul-icn/). 130 Business Traveller (https://www.businesstraveller.com/news/2011/04/18/korean-air-a380-to-feature-in-flight-duty free-store/).
Korean Air18%
AirAsia Group11%
Asiana Airlines9%
Other62%

Economic Impact of Duty Free and Travel Retail in the Asia Pacific Region – FINAL REPORT 15 October 2019 51
likely cannot accommodate on-board stores (Korean Air’s Boeing 787 Dreamliners, for instance, were not equipped with stores), Korean Air could continue to be a leading innovator in inflight retail with advances in other capacities such as e-commerce and product diversification.
The breakdown of Korean Air’s duty free sales, by product category, is shown in Figure 4-21. Duty free products are available for sale on all international flights by Korean Air and include a wide range of offerings. Cosmetics have historically been the largest driver of inflight retail sales for Korean Air, and this category continued to grow its share to more than one-third of total sales in 2017, generating US$54 million. Liquor ranks second with US$43 million in sales and 28% of total inflight duty free revenue, followed by health supplements generating US$20 million in sales.
Figure 4-21: Korean Air Inflight Duty Free Sales - By Product Category, 2017
Source: The Moodie Davitt Report.
Beyond Korean Air, the airline sector in the Asia Pacific region faces challenges related to the viability and growth of the airline duty free sector. On one hand, inflight duty free can be a low-reward service for airlines, and it may be difficult to future-proof against advances in e-commerce and other duty free channels that render inflight purchases relatively inconvenient for shoppers. In some cases, the sacrifice of on-board space and weight for a limited selection of duty free products may not be worthwhile for the airline. For instance, full-service carriers may prefer to rely on conventional sources of revenue (airfares), with ancillary revenues driven by other offerings like loyalty programs and baggage fees rather than on-board sales. As a result, on-board retail may be non-essential for airlines like Qantas, which discontinued inflight duty free retail at the end of 2017.131 This is a similar trend to that seen in some other regions of the world, where major carriers like American Airlines, United Airlines, and most recently KLM have also stopped offering inflight duty free retail.132
At the same time, the high demand for duty free retail in the Asian market could be substantial enough to make the inflight service a lucrative source of revenue for other carriers. This is why in 2017 (the same year that Qantas discontinued its inflight duty free programme), Virgin Australia
131 Qantas’ former inflight retail concessionaire, Alpha Flight Services, noted the added pressure placed on Australian retailers by the growth in online ordering over the past two years, including the launch of Amazon in Australia in 2017 (https://www.dfnionline.com/latest-news/qantas-drop-inflight-duty free-programme-05-12-2017/); Qantas (https://www.qantas.com/ca/en/qantas-experience/onboard/inflight-duty free.html). 132 https://news.klm.com/klm-to-suspend-tax-free-sales-on-board/.
36%
28%
13%
6%
4%4%
3%
2% 2% 1% 1% Cosmetics
Liquors
Health Supplements
Fashion
Chocolate
Perfumes
Electronics
Watches
Pens
Other
Pre-Orders
52 Economic Impact of Duty Free and Travel Retail in the Asia Pacific Region – FINAL REPORT 15 October 2019.
debuted on-board duty free retail for the first time, specifically for its new Melbourne-Hong Kong route.133
The opportunity to capture a share of the Asian duty free market – the fastest growing duty free market in the world – may be particularly appealing for Asia Pacific’s LCCs and ULCCs.134 These carriers depend on ancillary revenues for their bottom line; in turn, their ability to offer a wide variety of ancillary services can be a necessity. In this case, duty free and travel retail can make an important contribution to a carrier’s financial success. For instance, even though Qantas discontinued inflight duty free retail, its wholly owned subsidiary and low-cost brand Jetstar still provides the service on flights to Asia (specifically routes operated by Jetstar Asia and Jetstar Japan).135
Figure 4-22 below summarises the key sources of ancillary revenues for AirAsia Group, an LCC group focused on short-haul service throughout Asia.136 On-board duty free sales by AirAsia Group accounted for 15% of the group’s ancillary revenues, second only to baggage fees and equal to on-board café and Wi-Fi sales combined. This is equivalent to roughly 3% of AirAsia Group’s total revenues.137 Broader breakdowns of ancillary revenues by other LCCs in the region, including Cebu Pacific, HK Express, and Korean carriers Jeju Air and Jin Air, suggest that on-board sales in general can be a key source of additional income for these carriers as well.138
Recent innovations in airline duty free suggest that the sector is indeed robust in Asia. Several carriers in the sub-region have taken steps to improve their offerings to better compete against other duty free sales channels. These developments have centred around promoting online platforms that intercept future passengers before they arrive at the airport, allowing them to shop and pre-order their inflight purchases in advance. For instance, Singapore Airlines recently increased the amount of time in which passengers can place pre-orders online prior to departure, while China Airlines has used promotional campaigns offering discounts specifically for pre-orders.139 Jeju Air advertises its pre-order service as a more convenient alternative to airport shopping, since pre-ordered goods are delivered inflight and eliminate the burden of carrying purchases to the boarding gate.140 Similarly, Malaysian Airlines’ online platform offers the added convenience of home delivery for both Malaysian residents and travellers from overseas.141
AirAsia Group has pushed even further into e-commerce with its recently launched OURSHOP, a digital marketplace that connects passengers with retailers across various channels including airport, downtown, and local speciality stores.142 Delivery methods include not only inflight collection but also designated pick-up points at airport stores (in partnership with concessionaires), as well as plans to
133 https://www.dfnionline.com/latest-news/retail/virgin-australia-offers-duty free-board-first-time-13-07-2017/. 134 A low cost carrier (LCC) is an airline that does not provide all the traditional services in the fare. This results in lower fares and fewer services for the passenger. LCCs will charge passengers for additional services and products, such as food, priority boarding, seat allocation, and baggage. Ultra low cost carriers (ULCCs) are further differentiated from LCCs and will have even less inclusions in the base fare, with a greater number of potential service and product add-ons for which passengers must pay in addition to the base fare. 135 IdeaWorks Company, The 2018 CarTrawler Yearbook of Ancillary Revenue; Jetstar (https://www.jetstar.com/au/en/flights/duty free). 136 Chart data pertains to AirAsia Group’s airline affiliates in Malaysia, Indonesia, Philippines, Thailand and India. Excluded from the data are affiliates in other countries as well as AirAsia X, the long-haul brand which is not formally part of AirAsia Group. IdeaWorks Company, The 2018 CarTrawler Yearbook of Ancillary Revenue. 137 Ibid. 138 Ibid. 139 GlobalData, Airport Retailing Trends May 2019. 140 Jeju Air (https://www.jejuair.net/jejuair/en/serviceinfo/inflight/cabin_sales_service.do). 141 Business Traveller (https://www.businesstraveller.com/business-travel/2017/10/16/malaysia-airlines-launches-flight-shopping-enrich-promotion/). 142 Moodie Davitt Report (https://www.moodiedavittreport.com/this-changes-everything-airasia-unveils-ourshop-digital-marketplace/).
On-board duty free retail presents an opportunity for Asia Pacific’s LCCs and ULCCs to generate additional ancillary revenue.
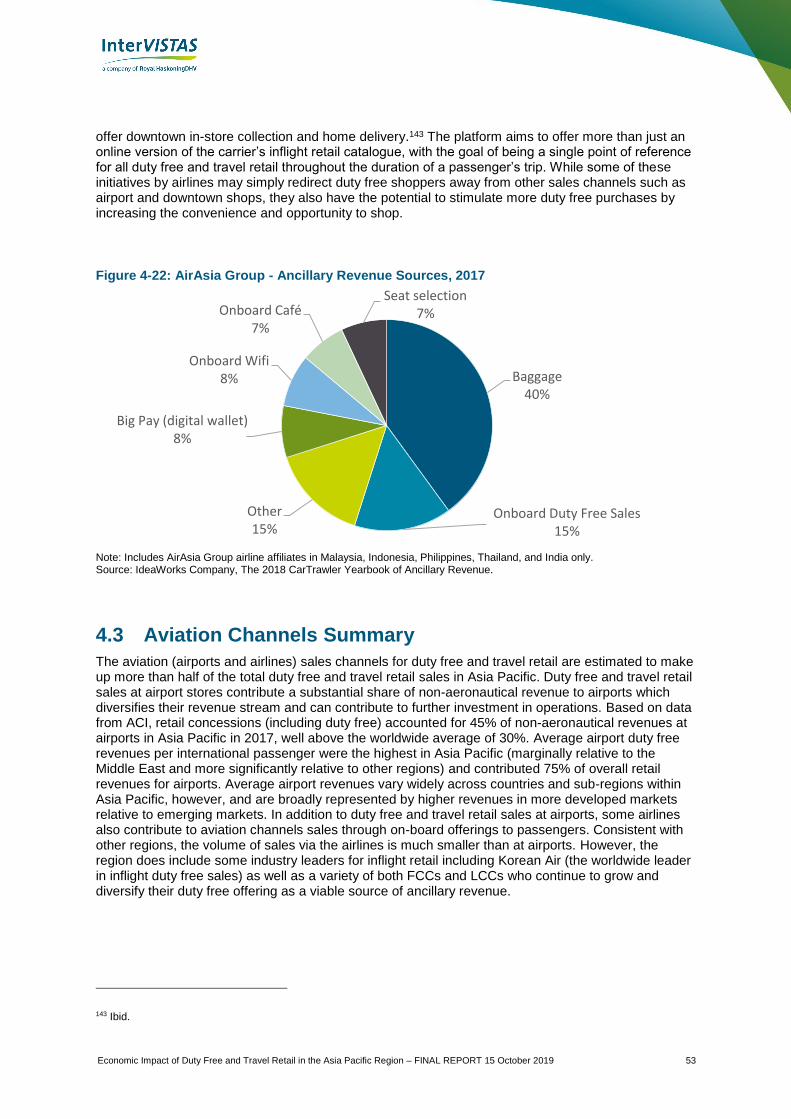
Economic Impact of Duty Free and Travel Retail in the Asia Pacific Region – FINAL REPORT 15 October 2019 53
offer downtown in-store collection and home delivery.143 The platform aims to offer more than just an online version of the carrier’s inflight retail catalogue, with the goal of being a single point of reference for all duty free and travel retail throughout the duration of a passenger’s trip. While some of these initiatives by airlines may simply redirect duty free shoppers away from other sales channels such as airport and downtown shops, they also have the potential to stimulate more duty free purchases by increasing the convenience and opportunity to shop.
Figure 4-22: AirAsia Group - Ancillary Revenue Sources, 2017
Note: Includes AirAsia Group airline affiliates in Malaysia, Indonesia, Philippines, Thailand, and India only. Source: IdeaWorks Company, The 2018 CarTrawler Yearbook of Ancillary Revenue.
4.3 Aviation Channels Summary
The aviation (airports and airlines) sales channels for duty free and travel retail are estimated to make up more than half of the total duty free and travel retail sales in Asia Pacific. Duty free and travel retail sales at airport stores contribute a substantial share of non-aeronautical revenue to airports which diversifies their revenue stream and can contribute to further investment in operations. Based on data from ACI, retail concessions (including duty free) accounted for 45% of non-aeronautical revenues at airports in Asia Pacific in 2017, well above the worldwide average of 30%. Average airport duty free revenues per international passenger were the highest in Asia Pacific (marginally relative to the Middle East and more significantly relative to other regions) and contributed 75% of overall retail revenues for airports. Average airport revenues vary widely across countries and sub-regions within Asia Pacific, however, and are broadly represented by higher revenues in more developed markets relative to emerging markets. In addition to duty free and travel retail sales at airports, some airlines also contribute to aviation channels sales through on-board offerings to passengers. Consistent with other regions, the volume of sales via the airlines is much smaller than at airports. However, the region does include some industry leaders for inflight retail including Korean Air (the worldwide leader in inflight duty free sales) as well as a variety of both FCCs and LCCs who continue to grow and diversify their duty free offering as a viable source of ancillary revenue.
143 Ibid.
Baggage40%
Onboard Duty Free Sales15%
Other15%
Big Pay (digital wallet)8%
Onboard Wifi8%
Onboard Café7%
Seat selection7%

54 Economic Impact of Duty Free and Travel Retail in the Asia Pacific Region – FINAL REPORT 15 October 2019.
Case Study: Kansai Airport: Japan’s growing gateway to China
Over the past several years, Kansai International Airport (KIX) has grown into a major air gateway between Japan and the rest of Asia Pacific. Non-Japanese international passenger traffic at KIX grew 41% between the fiscal year ended March 2016 (Fiscal 2015)144 and March 2019 (Fiscal 2018), reaching a record-high of over 15.5 million foreign visitors in Fiscal 2018 and accounting for 68% of international traffic at KIX, with the remainder comprised of outbound Japanese residents and connecting traffic.145 Air service development has historically included a focus on increasing frequencies to Mainland China and Southeast Asia; passenger traffic to/from these regions grew by 16% and 6%, respectively, between Fiscal 2017 and Fiscal 2018, with Mainland China showing the largest growth of all international regions.146 Although local tourism authorities are making efforts to diversify the foreign visitor base to include more Westerners,147 Mainland China continues to show growth potential for KIX, with incumbent carriers like Air China and Sichuan Airlines still introducing new routes to Mainland China along with new carriers like Hainan Airlines starting operations at KIX in 2019.148 International services by low-cost carriers (LCCs) include several Chinese destinations to the Mainland as well as Hong Kong, and Chinese LCCs Spring Airlines and Hong Kong Express Airways offer year-round service on six different routes.149 Altogether, the air service investment into Chinese markets has made KIX the most frequently used airport by Chinese travellers in Japan.
Figure 1. KIX International Traffic by Destination Region, FY2018
Source: Kansai Airports Group.
144 Fiscal year naming is consistent with that used by Kansai Airports Group. 145 Includes foreign passengers visiting Japan only. Transit passengers are excluded. Kansai Airports Group. 146 Figures pertain to passengers by route, not nationality. Kansai Airports Group, FY2018 Consolidated Financial Results Press Release (http://www.kansai-airports.co.jp/en/news/2019/611/E_190604_PressRelease_FiscalYear2018.pdf). 147 The Japan Times (https://www.japantimes.co.jp/news/2017/01/20/national/record-9-4-million-foreign-tourists-visited-osaka-2016/#.XUNX-pVYahd). 148 Kansai Airports Group Press Releases (http://www.kansai-airports.co.jp/en/news/2018/564/E_190118_PressRelease_HainanAirlines_2.pdf); (http://www.kansai-airports.co.jp/en/news/2019/616/E_190621_PressRelease_HainanAirlines.pdf). 149 Kansai Airports Group (http://www.kansai-airports.co.jp/en/regulations/airlinepartners/updates-and-figures/).
South Korea27%
Mainland China23%
Southeast Asia16%
Taiwan11%
Hong Kong SAR & Macau SAR
12%
Europe3%
North America5%
Oceania & Guam2%
Other1%
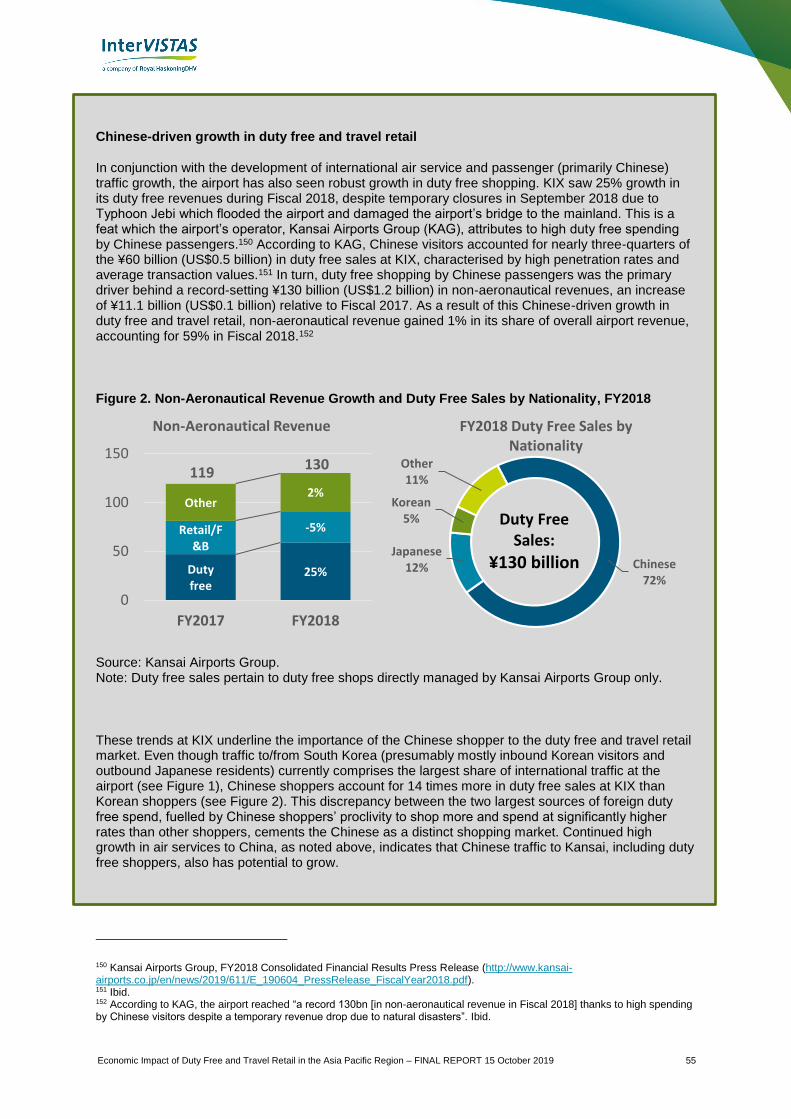
Economic Impact of Duty Free and Travel Retail in the Asia Pacific Region – FINAL REPORT 15 October 2019 55
Chinese-driven growth in duty free and travel retail
In conjunction with the development of international air service and passenger (primarily Chinese) traffic growth, the airport has also seen robust growth in duty free shopping. KIX saw 25% growth in its duty free revenues during Fiscal 2018, despite temporary closures in September 2018 due to Typhoon Jebi which flooded the airport and damaged the airport’s bridge to the mainland. This is a feat which the airport’s operator, Kansai Airports Group (KAG), attributes to high duty free spending by Chinese passengers.150 According to KAG, Chinese visitors accounted for nearly three-quarters of the ¥60 billion (US$0.5 billion) in duty free sales at KIX, characterised by high penetration rates and average transaction values.151 In turn, duty free shopping by Chinese passengers was the primary driver behind a record-setting ¥130 billion (US$1.2 billion) in non-aeronautical revenues, an increase of ¥11.1 billion (US$0.1 billion) relative to Fiscal 2017. As a result of this Chinese-driven growth in duty free and travel retail, non-aeronautical revenue gained 1% in its share of overall airport revenue, accounting for 59% in Fiscal 2018.152
Figure 2. Non-Aeronautical Revenue Growth and Duty Free Sales by Nationality, FY2018
Source: Kansai Airports Group. Note: Duty free sales pertain to duty free shops directly managed by Kansai Airports Group only.
These trends at KIX underline the importance of the Chinese shopper to the duty free and travel retail market. Even though traffic to/from South Korea (presumably mostly inbound Korean visitors and outbound Japanese residents) currently comprises the largest share of international traffic at the airport (see Figure 1), Chinese shoppers account for 14 times more in duty free sales at KIX than Korean shoppers (see Figure 2). This discrepancy between the two largest sources of foreign duty free spend, fuelled by Chinese shoppers’ proclivity to shop more and spend at significantly higher rates than other shoppers, cements the Chinese as a distinct shopping market. Continued high growth in air services to China, as noted above, indicates that Chinese traffic to Kansai, including duty free shoppers, also has potential to grow.
150 Kansai Airports Group, FY2018 Consolidated Financial Results Press Release (http://www.kansai-airports.co.jp/en/news/2019/611/E_190604_PressRelease_FiscalYear2018.pdf). 151 Ibid. 152 According to KAG, the airport reached “a record 130bn [in non-aeronautical revenue in Fiscal 2018] thanks to high spending by Chinese visitors despite a temporary revenue drop due to natural disasters”. Ibid.
Duty free
25%
Retail/F&B
-5%
Other2%
119130
0
50
100
150
FY2017 FY2018
Non-Aeronautical Revenue
Chinese72%
Japanese12%
Korean5%
Other11%
FY2018 Duty Free Sales by Nationality
Duty Free Sales:
¥130 billion
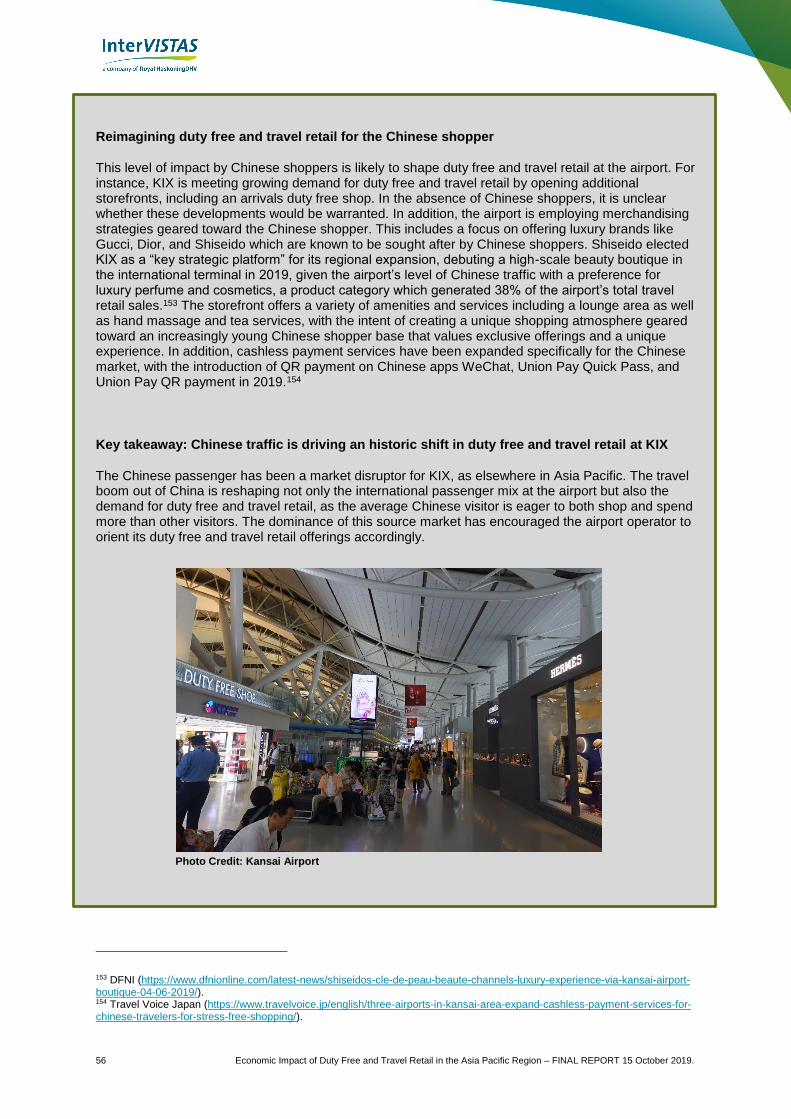
56 Economic Impact of Duty Free and Travel Retail in the Asia Pacific Region – FINAL REPORT 15 October 2019.
Reimagining duty free and travel retail for the Chinese shopper
This level of impact by Chinese shoppers is likely to shape duty free and travel retail at the airport. For instance, KIX is meeting growing demand for duty free and travel retail by opening additional storefronts, including an arrivals duty free shop. In the absence of Chinese shoppers, it is unclear whether these developments would be warranted. In addition, the airport is employing merchandising strategies geared toward the Chinese shopper. This includes a focus on offering luxury brands like Gucci, Dior, and Shiseido which are known to be sought after by Chinese shoppers. Shiseido elected KIX as a “key strategic platform” for its regional expansion, debuting a high-scale beauty boutique in the international terminal in 2019, given the airport’s level of Chinese traffic with a preference for luxury perfume and cosmetics, a product category which generated 38% of the airport’s total travel retail sales.153 The storefront offers a variety of amenities and services including a lounge area as well as hand massage and tea services, with the intent of creating a unique shopping atmosphere geared toward an increasingly young Chinese shopper base that values exclusive offerings and a unique experience. In addition, cashless payment services have been expanded specifically for the Chinese market, with the introduction of QR payment on Chinese apps WeChat, Union Pay Quick Pass, and Union Pay QR payment in 2019.154
Key takeaway: Chinese traffic is driving an historic shift in duty free and travel retail at KIX
The Chinese passenger has been a market disruptor for KIX, as elsewhere in Asia Pacific. The travel boom out of China is reshaping not only the international passenger mix at the airport but also the demand for duty free and travel retail, as the average Chinese visitor is eager to both shop and spend more than other visitors. The dominance of this source market has encouraged the airport operator to orient its duty free and travel retail offerings accordingly.
153 DFNI (https://www.dfnionline.com/latest-news/shiseidos-cle-de-peau-beaute-channels-luxury-experience-via-kansai-airport-boutique-04-06-2019/). 154 Travel Voice Japan (https://www.travelvoice.jp/english/three-airports-in-kansai-area-expand-cashless-payment-services-for-chinese-travelers-for-stress-free-shopping/).
Photo Credit: Kansai Airport
Economic Impact of Duty Free and Travel Retail in the Asia Pacific Region – FINAL REPORT 15 October 2019 57
5 Land Sales Channels
5.1 Introduction
In contrast to other world regions, downtown shops are the dominant component of land sales channels for duty free and travel retail in Asia Pacific. Downtown duty free shops are particularly prevalent in the cities of Seoul, Hong Kong, and Singapore which generate most of the duty free and travel retail sales by land channels for the entire region.155 Aside from downtown storefronts, the land sales channels also include shopping activities at land borders, with travel typically involving transportation by private or commercial vehicle, rail as well as foot traffic. Prior to undergoing screening by customs and border security, eligible travellers can often stop at duty free shops situated at or close to the crossing itself.
The land sales channels are collectively estimated to have generated revenues of US$14.2 billion in the Asia Pacific region in 2017. At a global level, the land sales channels saw an increased market share from 2016 to 2017 of 1.4%, whereas sales in all other channels (airports, airlines, cruise and ferries) saw a decreased market share.156
5.2 Land Borders
Land borders in the Asia Pacific region typically accommodate travellers crossing on foot, by private or commercial vehicle, and by rail. Prior to undergoing screening by customs and border security, eligible travellers can often stop at duty free shops situated at or near the crossing itself.
In Asia Pacific, public land border crossings can be limited due to geography (e.g. several island nations where borders are non-existent, or borders are shaped by topographical features with restricted accessibility, like mountain ranges) as well as political conditions (e.g. Mainland China and India share one of the longest borders in the world, but direct land crossings are unavailable to the public due to territorial disputes). As a result, duty free retail appears centred around key border crossings with consistently high levels of traffic.
155 Downtown shops in Korea and Hainan are estimated to generate revenues of over US$11 billion. 156 Generation Research (2019).
Key Findings
▪ Total estimated duty free and travel retail sales by land channels were US$14.2 billion in 2017.
o The number of direct jobs associated with this sales channel was 42,600.
o The direct GDP associated with this sales channel was US$2.7 billion.
▪ Downtown shops in Korea accounted for the majority of all duty free and travel retail activity by land channels across the entire region, generating nearly US$10 billion in sales in 2017.
▪ Although land channels have not yet surpassed aviation channels in duty free and travel retail sales, operators have identified these channels (predominantly downtown locations) as a source of potential growth.

58 Economic Impact of Duty Free and Travel Retail in the Asia Pacific Region – FINAL REPORT 15 October 2019.
The availability of public rail transport is one indication of where the highest levels of cross-border flows are located. Regular train services are available between Mainland China and its adjacent Special Administrative Regions (Hong Kong and Macau), Mainland China and Vietnam, Thailand and Malaysia, and Malaysia and Singapore. Two of the seven major land border crossings from Hong Kong into Mainland China are rail-based rather than road-based; additionally, passengers can board international trains at two separate stations located away from the border in southern Hong Kong.157 The West Kowloon Station is one such location, serving the high-speed rail line which opened in 2018, with a state-of-the-art facility that includes three duty free stores (two in the departures terminal, one for arrivals) carrying premium product offerings by Dufry.158 Also, in October 2018, the Hong Kong-Zhuhai-Macau bridge opened after a nine year construction period. The 55km long structure is the world’s longest sea crossing and also the longest open-sea fixed link.159 The bridge links Hong Kong, Macau, and Zhuhai, the three main cities in the Pearl River Delta. At the transfer terminal between Hong Kong and Zhuhai, Zhuhai Duty Free has opened duty free retail space totalling over 45,000 square feet that will have a phased opening.
Overall, travel by land can be more affordable than other modes of transport, with the likelihood therefore of attracting more price-conscious shoppers looking for duty free deals, including travellers willing and able to go abroad simply to shop, relative to other sales channels. To give some impression of scale, the Gongbei-Macau border is believed to be China’s busiest land border, with 134 million crossings in 2018.160 Duty and tax free spend at land borders and stations can be stimulated by high travel frequency as well as mismatches in tax or currency conditions between adjacent countries (e.g. high-tax countries with accessible border crossings to low-tax countries). For instance, Malaysia’s 3-month tax holiday in summer 2018 spurred increased outbound traffic from Singapore at the Johor-Singapore Causeway, one of the busiest overland border crossings in the world with over 300,000 crossings daily.161 The Causeway, typically dominated by Malaysian commuters who work in Singapore, saw increased flows of Singaporeans crossing into Malaysia to take advantage of the neighbouring tax break. Although Singapore has since reduced its duty free allowances for returning residents,162 this event exemplifies the potential of a large, price-sensitive market willing to cross the border for a deal.
The following section summarizes duty free shopping trends by Mainland Chinese and Hong Kong travellers – a key shopping demographic – at major land borders in Asia based on Counter Intelligence Retail’s (CiR’s) survey, Asian Duty & Tax Free Border Store Retail 2017.
157 Transport Department, Government of the Hong Kong Special Administrative Region (https://www.td.gov.hk/en/transport_in_hong_kong/land_based_cross_boundary_transport/index.html). 158 DFNI (https://www.td.gov.hk/en/transport_in_hong_kong/land_based_cross_boundary_transport/index.html). 159 A fixed link is defined as a persistent, unbroken road connection across water. 160 According the City of Zhuhai, as reported by Macaubusiness.com (https://www.macaubusiness.com/macau-gongbei-border-crossings-in-2018-highest-ever-in-china-zhuhai-govt/). 161 The Straits Times (https://www.straitstimes.com/asia/se-asia/singaporeans-in-shopping-spree-across-causeway-before-malaysias-tax-holiday-ends-on-aug); Channel News Asia (https://infographics.channelnewsasia.com/interactive/causewayjam/index.html). 162 As of February 2019, residents traveling outside Singapore for fewer than 48 hours are subject to 7% Goods and Services Tax on eligible goods over SG$100 (previously GST was not charged at all on goods less than SG$150). Exemptions for travellers abroad for longer than 48 hours have also been reduced. (https://insideretail.asia/2019/02/19/singapore-duty free-allowances-pared-back/).
Duty and tax free spend at land borders and stations can be stimulated by high travel frequency as well as mismatches in tax or currency conditions. between adjacent countries
Economic Impact of Duty Free and Travel Retail in the Asia Pacific Region – FINAL REPORT 15 October 2019 59
5.2.1 Duty Free Shopping Trends at Land Borders
CiR’s 2017 survey covers Mainland Chinese and Hong Kong shoppers at land borders primarily in China (China/Hong Kong, China/Macau, South China, and North China) as well as Other Asia crossings on the Indochina peninsula, most notably the borders between Thailand and its neighbours Malaysia, Cambodia, and Myanmar.
▪ Of these surveyed crossings, the China-Hong Kong border leads in traffic rates, accounting for 45% of both surveyed visitors and duty free buyers.163 The Lo Wu rail crossing and Lok Ma Chau road crossing handled the largest share of surveyed duty free shoppers (31% and 10% of total surveyed store visitors, respectively). Opportunities for duty free shopping at land and railway crossings for this border, however, have been limited for some Mainlanders since government restrictions enacted in 2015, which limit Shenzhen residents to one visit per week to Hong Kong.164
▪ Figure 5-1 and Figure 5-2 highlight duty free purchase conversion rates by location and product category, respectively. Altogether, 78% of Mainland Chinese/Hong Kong shoppers at duty free border stores made a purchase. As noted, frequent traffic between the Mainland and Hong Kong border constituted the largest share of shoppers as well as buyers. Shoppers at the Hong Kong border accounted for 45% of all surveyed shoppers in all locations, with 76% of those shoppers making a purchase.
▪ Shopping and purchase rates were relatively consistent across other crossings in China (including Macau, the northern borders with Russia and Mongolia, and the southern borders with Myanmar and Vietnam), with conversion rates ranging from 77% to 84%.
▪ Outside of China, the Thailand-Malaysia border was the most frequently visited, although these stores exhibited the lowest conversion rates (57% compared to the regional average of 78%).
▪ Conversely, the remaining Other Asia borders (e.g. Thailand-Myanmar and Thailand-Cambodia) collectively accounted for the highest conversion rate among all survey locations, with 90% of shoppers at these borders going on to make a purchase.
▪ Discrepancies among conversion rates may be driven by a variety of factors such as the particular tax incentives between the two countries (i.e., Thailand appears to have higher limits than in Myanmar and Cambodia),165 the quality and variety of store offerings, and travel characteristics of each crossing such as congestion and commute time.
▪ Across the region, alcohol and fashion/accessories attracted the highest rates of browsers as well as buyers. The largest share of shoppers (49%) browsed for duty free alcohol, while 25% of shoppers purchased duty free alcohol (a conversion rate of 52%). Similarly, 46% of shoppers looked at fashion/accessories products, while 23% went on to make a purchase (a conversion rate of 50%). Jewellery and watches attracted the lowest conversion rate (32%) of all product categories, likely given the nature of the products as high-priced luxury goods which are less frequently shopped for or replaced.
163 CiR Asian Duty & Tax Free Border Store Retail 2017. 164 The policy was implemented to reduce congestion in Hong Kong shopping areas and limit large flows of goods being purchased for resale on the Mainland rather than for personal consumption. Ibid.; Moodie Davitt Report (https://www.moodiedavittreport.com/hong-kong-duty free-border-business-hit-by-new-restrictions-on-chinese-travel/). 165 Appendix E provides a list of duty free limits for selected countries.
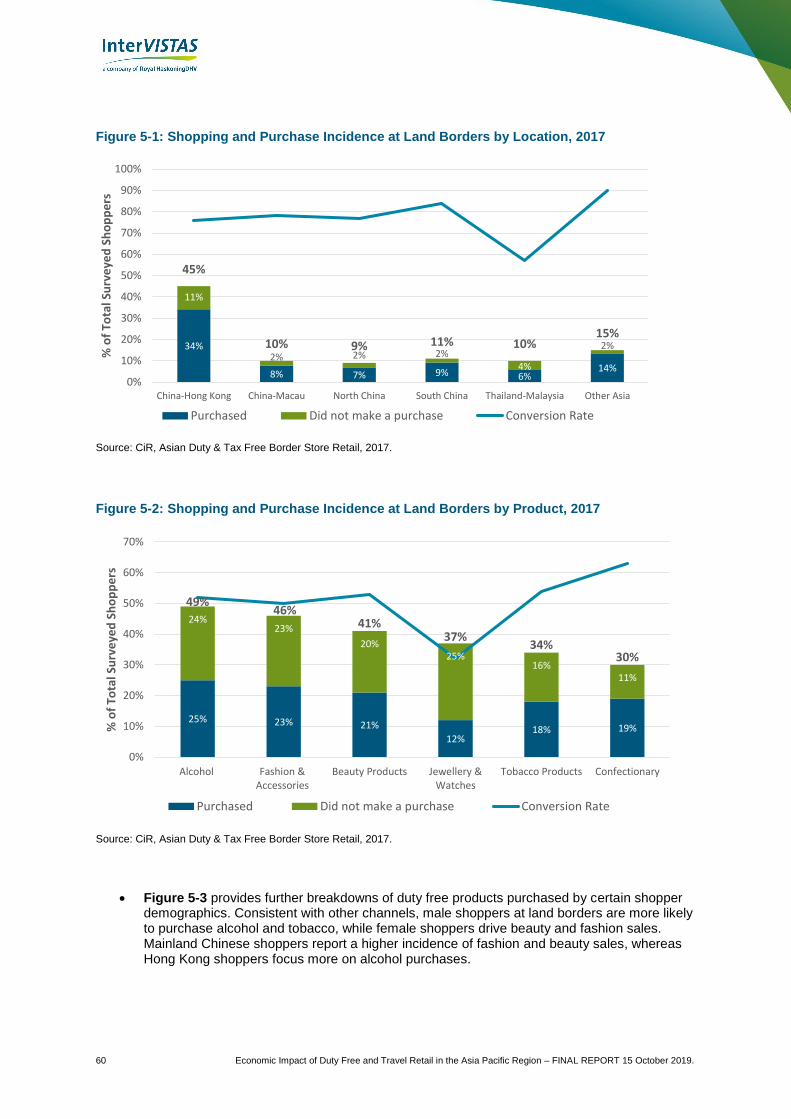
60 Economic Impact of Duty Free and Travel Retail in the Asia Pacific Region – FINAL REPORT 15 October 2019.
Figure 5-1: Shopping and Purchase Incidence at Land Borders by Location, 2017
Source: CiR, Asian Duty & Tax Free Border Store Retail, 2017.
Figure 5-2: Shopping and Purchase Incidence at Land Borders by Product, 2017
Source: CiR, Asian Duty & Tax Free Border Store Retail, 2017.
• Figure 5-3 provides further breakdowns of duty free products purchased by certain shopper demographics. Consistent with other channels, male shoppers at land borders are more likely to purchase alcohol and tobacco, while female shoppers drive beauty and fashion sales. Mainland Chinese shoppers report a higher incidence of fashion and beauty sales, whereas Hong Kong shoppers focus more on alcohol purchases.
34%
8% 7% 9% 6%14%
11%
2% 2% 2%4%
2%
45%
10% 9% 11% 10%15%
0%
10%
20%
30%
40%
50%
60%
70%
80%
90%
100%
China-Hong Kong China-Macau North China South China Thailand-Malaysia Other Asia
% o
f To
tal S
urv
eye
d S
ho
pp
ers
Purchased Did not make a purchase Conversion Rate
25% 23% 21%
12%18% 19%
24%23%
20%25%
16%11%
49%46%
41%37%
34%30%
0%
10%
20%
30%
40%
50%
60%
70%
Alcohol Fashion &Accessories
Beauty Products Jewellery &Watches
Tobacco Products Confectionary
% o
f To
tal S
urv
eye
d S
ho
pp
ers
Purchased Did not make a purchase Conversion Rate

Economic Impact of Duty Free and Travel Retail in the Asia Pacific Region – FINAL REPORT 15 October 2019 61
Figure 5-3: Purchase Incidence at Land Borders by Demographic, 2017
Source: CiR, Asian Duty & Tax Free Border Store Retail, 2017.
• Average duty free spend levels by purchasers are broadly defined by the product category, as shown in Figure 5-4. Alcohol, the most frequently purchased duty free product at land border stores, generated an average of US$167 per purchase in 2017. Product categories consisting of more luxury or specialty goods, such as jewellery and watches, will have higher average per unit prices and therefore attract the highest average spend figures relative to other categories, albeit at lower rates of purchase. Most notably, jewellery and watches commanded by far the highest average spend at US$1,352 per buyer. Fashion and accessories took a distant second with average spend of USD$559 per buyer; however, this category attracted similar levels of shopper traffic and conversion rates as alcohol.
36%
17% 16% 16%
26%
19%19%
26%24%
9%
14%
19%
0%
10%
20%
30%
40%
Alcohol Fashion &Accessories
Beauty Products Jewellery &Watches
Tobacco Products Confectionary
% o
f D
em
ogr
aph
ic W
ho
M
ade
a P
urc
has
e
Male
Female
27%
17%
21%
14%
18% 19%
24%
28%
22%
10%
18% 18%
0%
10%
20%
30%
Alcohol Fashion &Accessories
Beauty Products Jewellery &Watches
Tobacco Products Confectionary
% o
f D
em
ogr
aph
ic W
ho
M
ade
a P
urc
has
e
Under 35
Over 35
21%
31%28%
15% 15%
20%
31%
11% 12%
8%
22%
18%
0%
10%
20%
30%
40%
Alcohol Fashion &Accessories
Beauty Products Jewellery &Watches
Tobacco Products Confectionary
% o
f D
em
ogr
aph
ic W
ho
M
ade
a P
urc
has
e
Mainland Chinese
Hong Kong

62 Economic Impact of Duty Free and Travel Retail in the Asia Pacific Region – FINAL REPORT 15 October 2019.
The CiR study notes certain barriers to duty free purchases at land borders such as limited dwell time, limited product offerings, disadvantageous exchange rates, price sensitivity, and negative perceptions of prices at land border stores.
In addition, certain regulations around tax exemptions and travel limitations for visitors crossing land borders (e.g. Shenzhen limitations noted above) create caps on shopper flows that have otherwise been incentivized by duty and tax savings available across nearby borders. Potential merchandising solutions to these issues facing land border stores include price-based promotions and discount schemes to encourage price appeal and impulse purchasing, as well as expanding on service offerings to increase convenience for shoppers, such as a pre-order service.166
Figure 5-4: Average Duty Free Spend at Land Borders ($US), 2017
Source: CiR, Asian Duty & Tax Free Border Store Retail, 2017.
5.3 Downtown Duty Free Retail
Downtown duty free retail is strong and growing in Korea (Seoul), Hong Kong, and Singapore. However, downtown duty free retail is developing in other cities and countries as a means of boosting sales for duty free operators located in airports. The downtown duty free concept has proven to be so lucrative that Lotte, one of Korea’s major duty free operators, closed its operations at Seoul Incheon Airport and chose to continue further developing its downtown and overseas operations instead.167 Downtown duty free in Japan is also prevalent with stores in Tokyo’s Ginza shopping district and both Japan Duty Free and Lotte having operations.168
166 CiR, Asian Duty & Tax Free Border Store Retail, 2017. 167 https://www.moodiedavittreport.com/closing-time-lotte-duty free-exits-incheon-airport-terminal-1-contracts-sets-its-sights-on-vietnam-expansion/ 168 Shoppers at Japan Duty Free Ginza must depart Japan at either Narita or Haneda airports. Proof of departure must be presented, which includes a passport and air ticket/flight itinerary. Shoppers can then shop on the designated 8th floor. After the purchases are made, the store (accounting department) will issue a voucher that is a confirmation of export of the products purchased, which is required for departure at the airport. Goods are then picked up at the airport by the shopper (at the City Duty Free Shop Delivery Counter) (https://japandutyfree-ginza.jp/service/index.html)
$1,352
$559
$167 $129
$62 $34
$0
$200
$400
$600
$800
$1,000
$1,200
$1,400
$1,600
Jewellery &Watches
Fashion &Accessories
Alcohol BeautyProducts
TobaccoProducts
Confectionary
$U
SD
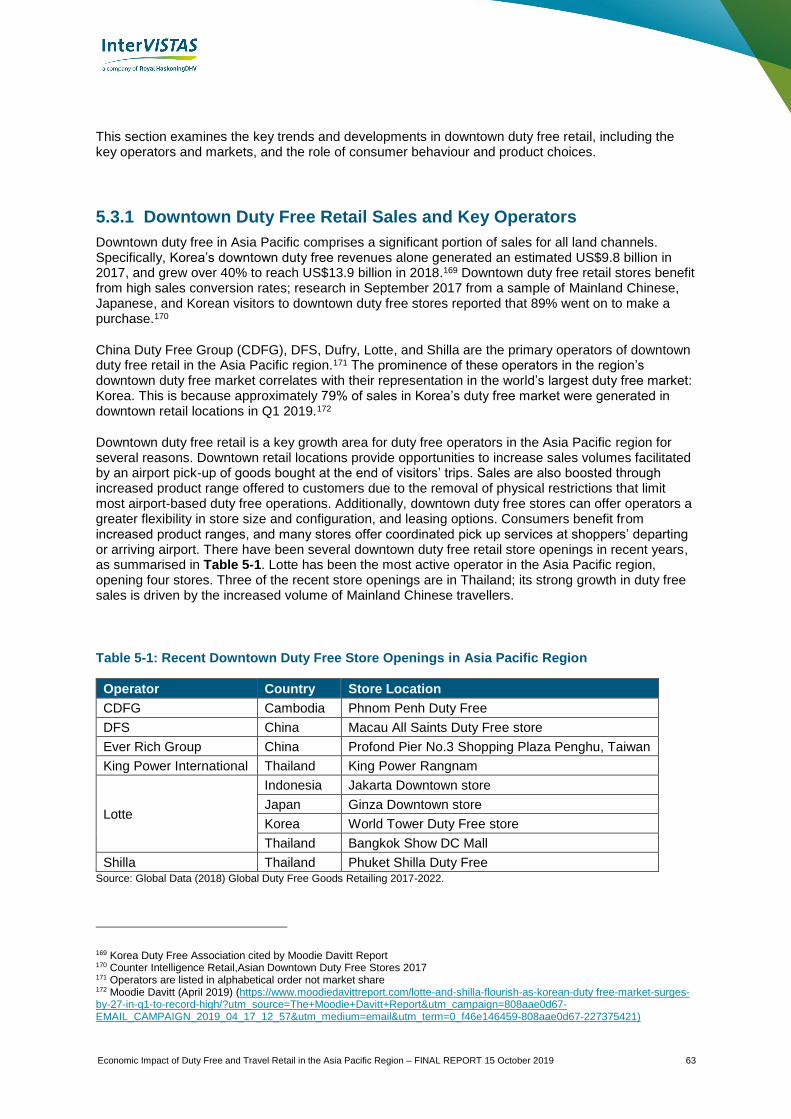
Economic Impact of Duty Free and Travel Retail in the Asia Pacific Region – FINAL REPORT 15 October 2019 63
This section examines the key trends and developments in downtown duty free retail, including the key operators and markets, and the role of consumer behaviour and product choices.
5.3.1 Downtown Duty Free Retail Sales and Key Operators
Downtown duty free in Asia Pacific comprises a significant portion of sales for all land channels. Specifically, Korea’s downtown duty free revenues alone generated an estimated US$9.8 billion in 2017, and grew over 40% to reach US$13.9 billion in 2018.169 Downtown duty free retail stores benefit from high sales conversion rates; research in September 2017 from a sample of Mainland Chinese, Japanese, and Korean visitors to downtown duty free stores reported that 89% went on to make a purchase.170
China Duty Free Group (CDFG), DFS, Dufry, Lotte, and Shilla are the primary operators of downtown duty free retail in the Asia Pacific region.171 The prominence of these operators in the region’s downtown duty free market correlates with their representation in the world’s largest duty free market: Korea. This is because approximately 79% of sales in Korea’s duty free market were generated in downtown retail locations in Q1 2019.172
Downtown duty free retail is a key growth area for duty free operators in the Asia Pacific region for several reasons. Downtown retail locations provide opportunities to increase sales volumes facilitated by an airport pick-up of goods bought at the end of visitors’ trips. Sales are also boosted through increased product range offered to customers due to the removal of physical restrictions that limit most airport-based duty free operations. Additionally, downtown duty free stores can offer operators a greater flexibility in store size and configuration, and leasing options. Consumers benefit from increased product ranges, and many stores offer coordinated pick up services at shoppers’ departing or arriving airport. There have been several downtown duty free retail store openings in recent years, as summarised in Table 5-1. Lotte has been the most active operator in the Asia Pacific region, opening four stores. Three of the recent store openings are in Thailand; its strong growth in duty free sales is driven by the increased volume of Mainland Chinese travellers.
Table 5-1: Recent Downtown Duty Free Store Openings in Asia Pacific Region
Operator Country Store Location
CDFG Cambodia Phnom Penh Duty Free
DFS China Macau All Saints Duty Free store
Ever Rich Group China Profond Pier No.3 Shopping Plaza Penghu, Taiwan
King Power International Thailand King Power Rangnam
Lotte
Indonesia Jakarta Downtown store
Japan Ginza Downtown store
Korea World Tower Duty Free store
Thailand Bangkok Show DC Mall
Shilla Thailand Phuket Shilla Duty Free Source: Global Data (2018) Global Duty Free Goods Retailing 2017-2022.
169 Korea Duty Free Association cited by Moodie Davitt Report 170 Counter Intelligence Retail,Asian Downtown Duty Free Stores 2017 171 Operators are listed in alphabetical order not market share 172 Moodie Davitt (April 2019) (https://www.moodiedavittreport.com/lotte-and-shilla-flourish-as-korean-duty free-market-surges-by-27-in-q1-to-record-high/?utm_source=The+Moodie+Davitt+Report&utm_campaign=808aae0d67-EMAIL_CAMPAIGN_2019_04_17_12_57&utm_medium=email&utm_term=0_f46e146459-808aae0d67-227375421)
64 Economic Impact of Duty Free and Travel Retail in the Asia Pacific Region – FINAL REPORT 15 October 2019.
5.3.2 Key Markets within the Asia Pacific Region
The key markets for downtown duty free operations in the region are described below. The region’s largest downtown operations: Korea (Seoul), Hong Kong and Singapore are discussed in detail in the Case Study Growth of Downtown Duty Free Shopping, located at the end of this chapter.
Mainland China has experienced significant development of its downtown duty free market in recent years. The expansion has come on the back of the CDFG which has either recently opened or plans to open downtown duty free stores in the following locations: Beijing, Shanghai, Dalian, Qingdao, Xiamen, and Hainan Island.173 This targeted growth has placed focus on enhancing China’s duty free footprint through the encouragement of additional tourism spending and maximization of domestic consumption. While the Mainland Chinese are a major source market for duty free spending, most do it outside of Mainland China. The development of duty free shopping on Hainan Island, which permits duty free purchases for Chinese citizens, is a key initiative seeking to buck this trend and keep spending within the country. Hainan Island, which saw the opening of two new downtown duty free stores in January 2019, has continually increased allowances for domestic and international travellers to further encourage spending. These developments in China’s duty free market are aligned with the direction laid out by Chinese President, Xi Jinping, on focussing Hainan as a pilot zone to continue to deepen overall reform and opening-up. One focus area for Hainan will be to develop as an international tourism and consumption centre.174
Macau SAR, China is home to several downtown duty free stores as part of an offering that encourages short stays focused on shopping, eating, gambling, and other entertainment. Macau is known as the Las Vegas of Asia, with many of the hotel brands with a presence in Las Vegas also operate in Macau. For example, within the Venetian hotel, located in downtown Macau, Dufry has extended its contract to operate for another seven years. Dufry has plans to refit and refurbish its offering with improved layout and wider brand selection.175 China Duty Free Group (CDFG) has also recently signed a contract with Sociedade de Jogos de Macau (SJM), which will see the opening of a flagship downtown store at the Grand Lisboa Palace in Macau.176 DFS also has six T Galleria stores in Macau, three more than in Hong Kong.177
Japan, as recently as 2015, had no downtown duty free stores. In late 2015, Japan Duty Free FaSoLa Mitsukoshi Isetan Co joint venture opened the first downtown duty free store in the heart of Tokyo.178 The move into the downtown market was in part a response to new government legislation which eliminated the consumption tax on several categories of Japanese products including food, alcohol, and cosmetics. Aimed at capitalizing on the influx of foreign tourists expected for the 2020 Tokyo Olympics Games, the legislation is designed to increase the number of tax free stores in the city by 10,000 by 2020.179 Unlike duty free stores, tax free stores eliminate only the consumption tax on a specific set of goods, but not the applicable import duties or liquor taxes (for alcohol purchases). Despite the difference, an increase in the number of tax free stores poses competitive challenges for airport duty free retailers, encouraging them to tap into alternate revenue streams such as the downtown duty free market. Whether this legislation will leave a temporary or lasting impact on the downtown duty free market in Japan remains to be seen. However, since its introduction the market has experienced growth. In 2016, Lotte opened its first Japanese downtown duty free store in Tokyo’s upscale Ginza district, with plans for an additional five downtown locations operating in the country within five years.180 Tokyo received another downtown duty free store in 2017 when a joint venture
173 https://www.dfnionline.com/latest-news/cdfg-reveals-locations-planned-downtown-duty free-expansion-06-03-2019/ 174 http://www.xinhuanet.com/english/2018-04/13/c_137109345.htm 175 https://www.dfnionline.com/latest-news/seven-years-dufry-macau-venetian-12-12-2017/ 176 https://www.moodiedavittreport.com/china-duty free-group-signs-macau-duty free-contract-and-opens-downtown-beijing-store/ 177 https://www.dfs.com/en/macau/stores 178 https://www.trbusiness.com/regional-news/Asia Pacific/japan-to-open-multiple-downtown-duty free-shops/79248 179 https://www.moodiedavittreport.com/japanese-airport-retailers-assess-downtown-tax-free-regulations/ 180 https://asia.nikkei.com/Business/Lotte-opens-new-downtown-duty free-shop-in-Japan

Economic Impact of Duty Free and Travel Retail in the Asia Pacific Region – FINAL REPORT 15 October 2019 65
between the Japanese airline All Nippon Airways, Takashimaya Co. Ltd, and Korea’s Hotel Shilla, opened a store in the Shinjuku district.181,182
Australia’s downtown duty free market is more complex for consumers than in other Asia Pacific countries. In addition to downtown duty free stores, Australia offers a popular program known as the Tourist Refund Scheme (TRS) which entitles international travellers to claim a tax refund (after clearing customs on departure from Australia) on tax paid goods purchased at downtown retail stores.183 The refund is subject to certain conditions such as a minimum required spend of A$300 (from a single business entity) with the purchase occurring within 60 days of customers’ scheduled departure from Australia. While other countries exhibit similar schemes, Australia’s version is unique as it allows not only overseas citizens but also Australian citizens to claim a tax refund. The attractiveness of the TRS to both Australian and overseas citizens is compounded as the Australian government levies no fees or commissions on refund claims.
Whether the popularity of the scheme has affected sales at downtown duty free stores is not well documented, as there are both costs and benefits to this method of obtaining duty free goods. Specifically, downtown duty free stores do not require a minimum spend whereas under the TRS the traveller must spend of a minimum of A$300 from a single business entity in order to qualify for a tax refund. The TRS is also not available on traditional duty free products such as alcohol and tobacco.
While downtown duty free stores have more limited – albeit still strong – product offerings than under the TRS which is available at any retail store offering refund eligible goods, they still maintain a presence in several Australian cities. In 2018, Lotte bought JR Duty Free, the operator of a downtown duty free store in Melbourne, as part of an initial expansion into the Oceania region.184 The operator aspires to capitalise on the growing outbound Mainland Chinese tourism market to Australia, anticipating the market will become a vital component of the company’s strategic growth in the region. For their efforts, the Australian Embassy awarded Lotte a certificate of appreciation for improving the country’s tourism infrastructure.185 Elsewhere, DFS operates one of their signature T-Galleria duty free stores in downtown Sydney while Brisbane and Perth each offer a single downtown duty free store.186,187,188
New Zealand’s only downtown duty free store is the T Galleria operated by DFS, located in the central business district of Auckland.189 The reach of the country’s downtown duty free market, however, is not solely limited to this store. In August 2017, Auckland Airport became the first Asia Pacific airport to enhance its customer shopping experience using the global technology company AOE’s OM3 Suite, an innovative omnichannel platform designed to connect on- and off-airport shopping and services.190 At inception, the platform was designed to power e-commerce solutions for on-airport retailers such as those allowing customers to purchase airport products and services online or via mobile devices. Declining retail spending per passenger led to an expression of interest from Auckland Airport to incorporate off-airport retail into the platform. The result was a unique solution that connects customers, off-airport retail outlets, and airport pickup. Through the platform, international passengers are provided with the option of shopping at more than 60 participating retailers in downtown Auckland, while simultaneously being able to avoid the 15% New Zealand Goods and Services Tax (GST) plus additional duty on selected products. Passengers can then pick up their purchase on departure from Auckland Airport.
181 https://www.ana.co.jp/ana_news/en/2017/06/01/20170601-1.html 182 http://www.themoodieblog.com/location-changing-times-japanese-travel-retail/ 183 https://www.abf.gov.au/entering-and-leaving-australia/tourist-refund-scheme/for-travellers 184 https://www.dfnionline.com/lead-stories/lotte-duty free-signs-deal-acquire-jr-duty free-australia-21-08-2018/ 185 https://www.dfnionline.com/latest-news/lotte-recognised-australian-embassy-tourism-efforts-30-04-2019/ 186 https://www.dfs.com/en/sydney 187 https://store.tissotwatches.com/1179015-city-hall-duty free 188 http://www.lookatwa.com.au/Shopping/dutyfree.html 189 https://www.dfs.com/en/auckland 190 https://www.moodiedavittreport.com/case-study-how-auckland-airport-and-aoe-brought-a-new-downtown-tax-free-shopping-solution-to-life/

66 Economic Impact of Duty Free and Travel Retail in the Asia Pacific Region – FINAL REPORT 15 October 2019.
Cambodia is home to three downtown duty free stores operated by China Duty Free Group (CDFG). The most recent store opened in Phnom Penh in 2016, at the Naga World Casino Complex. The two other stores are located in Sihanoukville and Siem Reap. CDFG has plans to continue to boost tourism between China and Cambodia, which is aligned with the Cambodian government’s strategy to increase the number of Chinese tourists to 1 million per annum. The Phnom Penh store attracts a diverse customer base, mainly tourists from Vietnam, Malaysia, Singapore, Thailand, and Mainland China.191 DFS recently opened a T-Galleria in the Cambodian city of Siem Reap. This store even has its own Chinese restaurant, likely added to increase tourists’ dwell time in the store.192 The key
strategy for both of these organizations in the Cambodia market is exposure to foreign tourists, in particular Chinese tourists, given the price points for products offered at these stores are typically not economically sustainable for the majority of the local population.
Thailand has a well-established downtown duty free market which dates back to 1989 when King Power, now the country’s largest duty free retailer, began operations with the opening of a downtown duty free store in Bangkok offering both duty free and duty paid shopping. Travellers who make purchases at this location have the option to pick-up their goods at the airport. Non-travellers can also shop at this store and carry out their purchases.193 Over the past thirty years the retailer has further entrenched itself in the market, now operating a total of five downtown duty free stores across the country – four in Bangkok and one in Phuket. King Power’s dominance in Thailand’s duty free market is most pronounced through its airport locations where it has a monopoly on duty free operations at several of the country’s largest airports.194,195 In contrast to its airport operations, the retailer has begun to face competition in the downtown duty free market in recent years. In 2016, Shilla Duty Free premiered its first overseas downtown duty free store in Phuket, becoming the second store in the city after the King Power location.196 Further, in 2017, Lotte decided to enter Bangkok’s downtown duty free market when it opened a location in the city, with plans in place to expand the store in the coming years.197
Philippines, while having significant airport duty free operations, had no presence in the downtown duty free market until recently. The first foray into the market was made in late 2018 when Duty Free Philippines (DFP) opened the Luxe Duty Free Store in the heart of Manila’s entertainment and shopping district.198 The first of its kind in the Philippines, the store emphasizes upscale travel retail offerings, with specific focus on appealing to travellers from emerging travel markets such as China. Further, the retailer is also collaborating with its parent body, the Department of Tourism, to forge closer relationships with tour operators, particularly in China, to help market the Philippines as a tourist destination. The initial success of the store – in part due to the growth in visits from China (+86% since 2016) – has generated discussion regarding possible expansion of the retailer’s downtown duty free store offerings into some of the country’s more popular tourist destinations, namely Cebu.199,200,201
191 https://www.moodiedavittreport.com/china-duty-free-groups-phnom-penh-duty-free-shop-open-1-august/ 192 Source: https://www.tripadvisor.ca/Attraction_Review-g297390-d10070174-Reviews-T_Galleria_by_DFS_Angkor-Siem_Reap_Siem_Reap_Province.html 193 http://www.moodiereport.com/pdf/tmr_kp_06_9.pdf 194 https://asia.nikkei.com/Business/Companies/Thailand-s-King-Power-wins-bid-to-continue-duty free-monopoly 195 https://www.bangkokpost.com/business/1692632/king-power-wins-another-duty free-shop-deal 196 https://www.trbusiness.com/regional-news/Asia Pacific/shilla-duty free-opens-25000sq-m-phuket-store/112247 197 https://www.trbusiness.com/regional-news/Asia Pacific/lotte-opens-first-bangkok-downtown-duty free-store/121941 198https://www.moodiedavittreport.com/a-world-class-outlet-duty free-philippines-opens-high-end-dfp-luxe-downtown-store/ 199 https://www.moodiedavittreport.com/duty free-philippines-gears-up-for-airport-and-downtown-expansion/ 200 https://www.trbusiness.com/regional-news/Asia Pacific/duty free-philippines-embarks-on-mnl-renovation-project/166547 201 http://ezine.moodiedavittreport.com/philippines-travel-retail-comes-of-age/philippines-travel-retail/

Economic Impact of Duty Free and Travel Retail in the Asia Pacific Region – FINAL REPORT 15 October 2019 67
Malaysia’s downtown duty free shop operated by Dufry and centrally located in Kuala Lumpur began operations in 2018. The store offers world class brands and local Malaysian products and is designed to capture the attention of the Chinese traveller. In 2018, nearly 3 million Chinese tourists visited Malaysia.202
Vietnam’s downtown duty free market includes operations provided by Lotte in downtown Da Nang. Lotte plans to further expand operations in Vietnam opening stores in other tourist locations and Vietnamese cities.203
5.4 Land Channels Summary
The land sales channels which include operations at downtown stores and land borders are substantial in the Asia Pacific region. Altogether, the land sales channels generated approximately 39% (US$14.2 billion) of total duty free and travel retail sales throughout Asia Pacific in 2017, second only to the airport sector. Downtown duty free stores in Korea are the primary driver of sales across all land channels, and the rise of downtown stores more broadly across Korea, Hong Kong, Tokyo, Singapore, and other geographies has helped the industry flourish. The role of the Chinese traveller has been key to the growing revenues generated at both land borders and in downtown stores. The main duty free players in the region including Lotte, Shilla, and DFS have built a presence throughout the Asia Pacific region in a cross-section of cities to serve shoppers.
202 https://www.malaymail.com/news/malaysia/2019/02/21/deputy-minister-increase-in-tourist-arrivals-in-2018-china-visitors-top-lis/1725469 203 http://www.koreaherald.com/view.php?ud=20190728000130
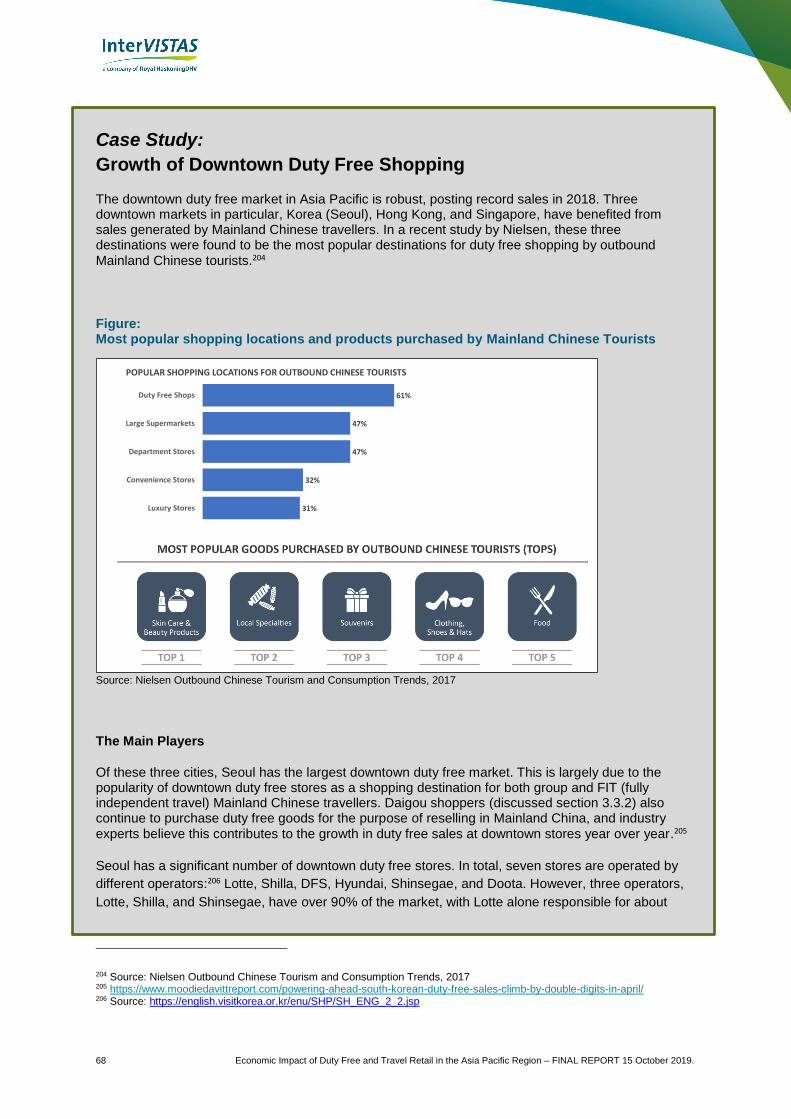
68 Economic Impact of Duty Free and Travel Retail in the Asia Pacific Region – FINAL REPORT 15 October 2019.
Case Study:
Growth of Downtown Duty Free Shopping
The downtown duty free market in Asia Pacific is robust, posting record sales in 2018. Three downtown markets in particular, Korea (Seoul), Hong Kong, and Singapore, have benefited from sales generated by Mainland Chinese travellers. In a recent study by Nielsen, these three destinations were found to be the most popular destinations for duty free shopping by outbound
Mainland Chinese tourists.204
Figure: Most popular shopping locations and products purchased by Mainland Chinese Tourists
Source: Nielsen Outbound Chinese Tourism and Consumption Trends, 2017
The Main Players
Of these three cities, Seoul has the largest downtown duty free market. This is largely due to the popularity of downtown duty free stores as a shopping destination for both group and FIT (fully independent travel) Mainland Chinese travellers. Daigou shoppers (discussed section 3.3.2) also continue to purchase duty free goods for the purpose of reselling in Mainland China, and industry
experts believe this contributes to the growth in duty free sales at downtown stores year over year.205
Seoul has a significant number of downtown duty free stores. In total, seven stores are operated by
different operators:206 Lotte, Shilla, DFS, Hyundai, Shinsegae, and Doota. However, three operators,
Lotte, Shilla, and Shinsegae, have over 90% of the market, with Lotte alone responsible for about
204 Source: Nielsen Outbound Chinese Tourism and Consumption Trends, 2017 205 https://www.moodiedavittreport.com/powering-ahead-south-korean-duty-free-sales-climb-by-double-digits-in-april/ 206 Source: https://english.visitkorea.or.kr/enu/SHP/SH_ENG_2_2.jsp
31%
32%
47%
47%
61%
Luxury Stores
Convenience Stores
Department Stores
Large Supermarkets
Duty Free Shops
POPULAR SHOPPING LOCATIONS FOR OUTBOUND CHINESE TOURISTS

Economic Impact of Duty Free and Travel Retail in the Asia Pacific Region – FINAL REPORT 15 October 2019 69
50%.207 Lotte’s main downtown store in Myeong-dong is the most successful downtown duty free
store in the region with sales topping US$6.6 billion in 2018.208 Contributing factors to its success are
the availability of luxury brands such as Louis Vuitton, Chanel, Hermes, Cartier, Tiffany, Gucci,
Bottega Veneta, and Prada, international beauty brands (Estée Lauder, Lancôme etc.) combined with
popular local brands (e.g. Sulwhasoo), and a floor dedicated to VIP shopping with a number of VIP
lounges.
In Hong Kong and Singapore, downtown duty free stores are operated by DFS as DFS T-Galleria. These stores are found in key shopping districts such as Kowloon’s Tsim Sha Tsui and Singapore’s Orchard Road. The T-Galleria stores are similar to department stores where anyone can shop and carry away their purchases. Duty free sales apply only to liquor and tobacco where the sale of these products is restricted to travellers with a valid boarding card. Products and popular international brands offered in both Hong Kong and Singapore stores are similar but super luxury brands such as
Louis Vuitton and Chanel are only found in Singapore.209
Recently, China Duty Free Group (CDFG) announced it will soon also open a downtown location in
Hong Kong.210 This strategic move is to compete with existing duty free stores by ensuring CDFG also
captures its share of the Chinese travel market. At the same time, a downtown location enables the operator to build on its presence at Hong Kong International Airport.
Traditionally, downtown duty free stores have been tied to airport contracts. Under this model, downtown locations could sell products to travellers who would then pick-up their goods at the airport. By bundling downtown store leases with airport leases, the airport would also receive concession fees on sales at downtown locations. Usually, the concession fees paid at downtown stores would be less than fees paid at the airport, but nonetheless, a percentage of sales was still paid to the airport.
In recent years, due to high competition for limited airport space, duty free operators have increased their rent bids significantly to secure prime airport space. Airports with award-winning terminals, such as Singapore, Hong Kong, and Seoul can command a premium for space.
In 2017, following the company’s loss of its Hong Kong Airport duty free contract, DFS CEO Philippe Schaus was quoted as saying that “the company believes it bid ‘at the right level’”, implying the company would not overbid to win the contract. Instead, DFS is focusing on revamping its downtown stores. In its 2018 annual report, the parent company to DFS, LVMH, lists one of its major strategic objectives as the expansion of DFS, including a plan to expand and enhance its flagship store in Hong Kong.211 Furthermore, industry experts have indicated DFS’ strategy away from airport retail
has been to expand and build “destination stores”
Conclusion
While downtown duty free stores have a track record in Asian cities with a mature tourist market, the presence of downtown stores is still developing in other cities in the region, e.g., Malaysia, Philippines, Vietnam, Cambodia, Thailand (as discussed in section 5.3.2). Altogether, continued growth in the downtown duty free market is likely given the potential to expand the downtown offering into unserved or underserved tourist destinations, along with growing demand from Mainland Chinese travellers.
207 Source: http://www.koreaherald.com/view.php?ud=20190506000105 208 Source: https://www.moodiedavittreport.com/lotte-duty-free-posts-all-time-sales-high-in-2018-as-online-and-daigou-business-soars/ 209 Source: https://www.dfs.com/en/hong-kong/brands https://www.dfs.com/en/singapore/brands 210 Source: https://jingtravel.com/china-duty-free-group-hong-kong/ 211 Source: https://r.lvmh-static.com/uploads/2019/03/rapport-annuel-lvmh-2018_va.pdf (pg. 90-91)

70 Economic Impact of Duty Free and Travel Retail in the Asia Pacific Region – FINAL REPORT 15 October 2019.
6 Maritime Sales Channels
6.1 Cruises
6.1.1 Industry Overview
The ocean cruise sector is a growing contributor to the tourism industry worldwide, with over 26 million passengers generating over US$40 billion in revenues annually.212 According to Business Research & Economic Advisors (BREA), global growth in cruise tourism has exceeded that of land-based tourism in the past decade.213
In Asia Pacific, cruise tourism is a nascent industry with substantial growth potential. Ocean cruise passengers in Asia surpassed 4 million (15% of the worldwide total) in 2017, while passengers in Oceania (Australia/New Zealand/Pacific Islands) totalled nearly 1.3 million (5%).214 In terms of capacity, the overall Asia Pacific region accounts for 16% of global ocean cruise capacity, as shown in Figure 6-1. Asia currently contributes 10% of global cruise capacity but is the fastest growing sub-region in the world. Capacity in Asia has grown at an annual rate of 41% over the last five years and grew 18% in 2016/2017 alone, relative to a global average rate of 4%. Oceania grew at a more modest 2% in 2016/2017, comprising around 6% of total global capacity; however, its five-year CAGR of 13% is second only to the growth in Asia. (See Figure 6-2).
Beyond ocean cruising, river cruises have also impacted cruise tourism worldwide, with further growth potential in some sub-regions of Asia. According to a 2018 Cruise Lines International Association (CLIA) survey of travel agents, river cruising is a growing trend in the cruise market, with 79% of travel agents stating that river cruises are a good way to introduce new customers (such as those in new
212 Cruise Market Watch (https://cruisemarketwatch.com/market-share/). 213 Cruise traffic has increased by 69% compared to land-based tourism at 42% over the last ten years. Source: BREA, The Global Economic Contribution of Cruise Tourism 2017 (prepared for Cruise Lines International Association). 214 Cruise Lines International Association (CLIA), CLIA one reSource 2016 and 2017 Quarterly Global Report.
Key Findings
▪ Total estimated duty free and travel retail sales in the maritime sales channels were US$0.8 billion in 2017.
o The number of direct jobs associated with this sales channel was 3,200.
o The direct GDP associated with this sales channel was US$0.2 billion.
▪ Asia represents a nascent but growing market for ocean cruises. Given high average spend rates by Asian shoppers, cruises in Asia are a key expansion market for duty free and travel retail concessionaires.
▪ International ferry traffic is limited to certain sub-regions in Asia Pacific, and duty free and travel retail on-board ferries is either infeasible or likely to serve as a supplement to more developed sales channels that travellers encounter on their trip.
▪ Duty free and travel retail offerings on-board cruise and ferry ships may be further complemented by port storefronts, which have seen recent developments at several major ports throughout Asia Pacific.

Economic Impact of Duty Free and Travel Retail in the Asia Pacific Region – FINAL REPORT 15 October 2019 71
markets like Asia) to cruising.215 Although the river market share is dominated by European itineraries, most travel agents also indicated growing or steady bookings for certain river cruises in Asia including Vietnam and Myanmar (Mekong, Red, Irrawaddy and Chindwin rivers) as well as China (Yangtze River).216
Cruise travel can be an opportunity to more comprehensively tour Asia Pacific, a massive and diverse region where traversing multiple locations by other modes of transport can be logistically difficult or expensive. Cruise itineraries in Asia often span multiple countries; the most visited Asian countries by cruisers, in terms of port calls, include Japan, Mainland China, Thailand, Vietnam, and Malaysia, with many ships visiting several of these locations in a single trip.217 Each cruise and its associated offerings, including duty free and travel retail, can therefore attract greater tourism distributed more broadly across several different countries in the region rather than one destination alone.
Figure 6-1: Share of Ocean Cruise Capacity, by Key Region Worldwide, 2017
Note: Cruise capacity as measured in passenger bed days. Source: Cruise Lines International Association (CLIA), 2018.
215 CLIA, Travel Agent Cruise Industry Outlook – Ninth Edition, December 2018. 216 Ibid. 217 CLIA Asia Cruise Trends 2018 Edition.
Caribbean34.8%
Mediterranean16.4%
All Other14.9%
Non-Mediterranean Europe11.0%
Asia10.4%
Oceania6.0%
Alaska4.3%
South America2.2%

72 Economic Impact of Duty Free and Travel Retail in the Asia Pacific Region – FINAL REPORT 15 October 2019.
Figure 6-2: Annual Growth (%) in Ocean Cruise Capacity Asia Pacific vs. World, 2013-2017
Note: Cruise capacity as measured in passenger bed days. Source: Cruise Lines International Association (CLIA), 2018.
In Asia Pacific, as with other regions in the world, source markets for cruises are closely aligned with destination markets in the same region. That is, passengers tend to predominantly cruise within their home region and comprise the majority of that region’s passenger base, in turn driving cruise behaviour and shopping patterns. For instance, 91% of all Asian cruisers sailed on a cruise within Asia in 2017, making up 91% of all passengers on cruises in Asia (or 70% of passengers on cruises in Asia Pacific, including Oceania).218 Similarly, 77% of Australian cruisers, and 64% of New Zealander cruisers, sailed within their native Oceania.219 Australians and New Zealanders together accounted for 87% of all cruise passengers within Oceania.
Current characteristics of the region’s cruise industry have been shaped by the fact that Asia is an emerging destination market and Asian travellers, as the region’s largest source market, are relatively new to cruising as well. As noted above, Asia’s share of global cruise capacity (10%)220 is smaller than its share of global passenger traffic (15%)221, in part because the average cruise length in Asia is shorter than in any other world sub-region. The Asian cruise industry is dominated by short-duration itineraries with 79% of passengers taking trips with durations of 2 to 6 nights, The average trip lasted less than 5 days, below the average cruise duration in other markets, as shown in Figure 6-3.
218 CLIA Asia Cruise Trends 2018 Edition. 219 CLIA Cruise Industry Ocean Source Market – Australia 2017; CLIA Cruise Industry Ocean Source Market – New Zealand 2017. 220 Cruise capacity is measured in available passenger bed days. Passenger bed days are a count of the number of days that all lower berths (beds) could be occupied at full occupancy. Bed days are therefore a function of ship size and number, as well as length of trip. 221 Destination traffic, i.e. passengers sailing within Asia.
0%
20%
40%
60%
80%
100%
2013 2014 2015 2016 2017
Asia Oceania Rest of World

Economic Impact of Duty Free and Travel Retail in the Asia Pacific Region – FINAL REPORT 15 October 2019 73
Studies by Counter Intelligence Retail (CiR) and Tax Free World Association (TFWA) suggest that the prevalence of short itineraries in Asia reflects common characteristics among Asian travellers including:222
• Family commitments and the preference to cruise as family units (including children and the elderly), which may limit the availability of holiday time and the affordability of a vacation. Family travel is likely more common on cruises, which are presumably vacation travel only, relative to other modes of transport which also support business and personal travel. TFWA estimates that in the Asian market there are between three and four times more children, as well as more women and elderly, travelling on cruises relative to air travel.
• A work-oriented lifestyle with limited holiday entitlement.
• Little to no previous exposure to cruise travel, and the preference to sample the experience on a shorter itinerary before embarking on a longer trip. For instance, a 2017 TFWA survey on cruises in East Asia found that approximately three-quarters of Chinese passengers and half of Japanese passengers were first-time cruisers.223
Figure 6-3: Average Cruise Length (Days) By Selected Destination, 2017
Source: Cruise Lines International Association (CLIA), 2018
This trend in Asia stands in contrast to cruising in Oceania, where the average itinerary is among the longest in the world and nearly double in length compared to Asia. The most popular itineraries purchased by Australians (the largest source market for Oceania cruises) range between 8 and 13 days.224 Australians represent a source market with more cruising experience than other nationalities; CLIA estimates that Australia has the world’s highest cruise market penetration, with 5.7% of the population (or roughly 1 in every 18 Australians) taking an ocean cruise in 2017.225
222 Counter Intelligence Research (CiR), Asian Cruise Traveller Duty & Tax Free Retail 2015; TFWA East Asia Cruise Study 2017. 223 Ibid. 224 CLIA, Australia Market Report 2017. 225 Ibid.
10.8
9.38.6 8.1 8.1 7.3
6.4 6.4 4.9
02468
1012
Day
s

74 Economic Impact of Duty Free and Travel Retail in the Asia Pacific Region – FINAL REPORT 15 October 2019.
Overall, the largest share of cruise passengers in Asia Pacific – i.e. those on cruises in the Asia sub-region – are travelling on the shortest itineraries (see Figure 6-4). In turn, these passengers’ exposure to duty free shopping opportunities is more limited, albeit indicative of an opportunity for continued robust growth in the region’s travel retail shopping.
Figure 6-4: Comparison of Capacity vs. Passenger Count Asia Pacific, 2017
Source: Cruise Lines International Association (CLIA), 2018.
6.1.2 Duty Free Shopping Behaviour
Duty free and travel retail is a natural component of the often amenity-packed experience of international and high-seas cruise travel. Duty free retail can be available via two main channels during cruises: on-board the ship itself as well as on-land at port stops. In Asia, operators have focused on developing their on-board services and overall experience to meet the expectations of their key source market – the Asian traveller. CiR’s survey research notes that this demographic exhibit high demand for luxury and comprehensive amenities relative to other source markets. As such, many of the 40 cruise line brands operating in Asia are deploying high specification, modern vessels to the region accompanied by amenities designed to appeal to Asian passengers.226 These include immersive high-end and full-service retail experiences. Cruise lines have revamped existing stores with luxury merchandise – including certain brands targeted specifically to Asian consumers, such as the world’s first ever Dior boutique-at-sea227 – while working directly with retailers and duty free concessionaires on the design of retail spaces for new ships destined for the Asian market.228 According to CiR, the goal is to integrate the duty free and travel retail experience as part of the
226 Refer to Error! Reference source not found.. CLIA, Asia Cruise Trends 2018; CiR, Asian Cruise Traveller Duty & Tax Free Retail 2015. 227 DFNI (https://www.dfnionline.com/lead-stories/starboard-expands-dream-cruises-partnership-asia-10-05-2019/). 228 Ibid.
Asia63%
Oceania37%
Bed Days
Asia76%
Oceania24%
Passengers
Asia Pacific’s cruise market is shaped by the strong demand for luxury merchandise and amenities exhibited by Asian travellers.

Economic Impact of Duty Free and Travel Retail in the Asia Pacific Region – FINAL REPORT 15 October 2019 75
broader vacation experience, and this effort is not limited to on-board services, with major onshore travel retail developments even within terminals at major ports including the Singapore Cruise Centre and Port of Shanghai. Refer to the case study in Section 6.3 for further discussion on port terminal stores.
Altogether, this reflects the high demand for shopping opportunities by Asian cruisers. In a 2015 CiR survey of Mainland Chinese, Hong Kong Chinese, Taiwanese, and Singaporean passengers on cruises in Asia, nearly three-quarters of respondents considered on-board shopping to be “very important” to their cruise experience. This response is driven by Mainland Chinese – the single largest source market for the region – with 88% indicating that on-board shopping is “very important”. This compares to just over 50% of passengers surveyed on cruises in the U.S., Canada, and the Caribbean (the largest destination market for cruises) who indicated that on-board duty free shopping was “very important” to their cruise experience.229
Figure 6-5 provides additional breakdowns of shopping behaviour by Asian passengers from the CiR survey, by demographic group, for both on-board and on-land duty free retail. Duty free shopping awareness, browsing, and purchasing levels are somewhat consistent across gender, age, and nationalities and generally characterised by high purchase conversion rates among all shoppers. The propensity to make a duty free purchase is highest among Taiwanese passengers and travellers under 40, while Singaporean passengers and travellers over 40 exhibit the lowest purchase rates. Singaporean passengers are as aware of duty free offerings as other demographic groups but are less likely to shop or make a purchase.
Figure 6-5: Incidence of Duty Free Purchases by Cruise Passengers, by Demography Asia, 2015
Source: CiR, Asian Cruise Traveller Duty & Tax Free Retail 2015.
Among all groups, 93% of those who browse at duty free shops also end up making a purchase, either on-board or on-land.230 Mainland Chinese passengers have the highest conversion rate of all
229 CiR Asian Cruise Traveller Duty & Tax Free Retail 2015. 230 Ibid.
85% 84%
89%
77%
82%
88%85%
88%
80%78%
83%
70%
78%
83%
74%
83%
75%
71%
77%
65%
76%
71%
64%
78%
50%
55%
60%
65%
70%
75%
80%
85%
90%
95%
100%
Male Female Under 40 Over 40 ChineseMainland
ChineseHong Kong
Singaporean Taiwanese
% o
f D
em
ogr
aph
ic G
rou
p
Awareness Browsing Purchasing

76 Economic Impact of Duty Free and Travel Retail in the Asia Pacific Region – FINAL REPORT 15 October 2019.
Asian nationalities interviewed, with 97% of shoppers making a purchase. On-board purchasing tends to be more prevalent relative to on-land purchasing, as shown in Figure 6-6. Of those who make a purchase, 72% do so on-board while 66% so do on-land (38% make purchases both on-board and on-land).
Figure 6-6: Duty Free Purchase Rates by Location, by Demography Asia, 2015
Source: CiR, Asian Cruise Traveller Duty & Tax Free Retail 2015. Note: Includes those who make a purchase both on-board and on-land (15-30% of total travellers in each demographic group).
Shopping and purchase behaviour for key product categories is shown in Figure 6-7. For instance, 40% of Asian passengers (on Asian cruises) browsed for alcohol at a duty free store, while 12% of Asian passengers actually purchased duty free alcohol. Fashion, watches and jewellery, and souvenirs attract the highest number of Asian duty free shoppers. Worldwide average browsing rates are higher than those for Asian passengers (on Asian cruises), except for confectionery, electronics, and tobacco.231 Similarly, conversion rates are generally higher on a worldwide average basis, with a larger share of shoppers deciding to make a purchase relative to Asian shoppers. However, Asian shoppers who do decide to make a purchase spend significantly more than their global counterparts.
231 Caution is advised when comparing the Asia vs. Global results, noting that the Asia results are derived from a 2015 survey whereas the Global results are based on a 2018 survey.
54%
50%
55%
48%
58%
42%
46%
53%
48% 48%
53%
40%
53%
43%
38%
53%
30%
35%
40%
45%
50%
55%
60%
65%
70%
75%
80%
Male Female Under 40 Over 40 ChineseMainland
ChineseHong Kong
Singaporean Taiwanese
% o
f D
em
ogr
aph
ic G
rou
p
On-Board On-Land
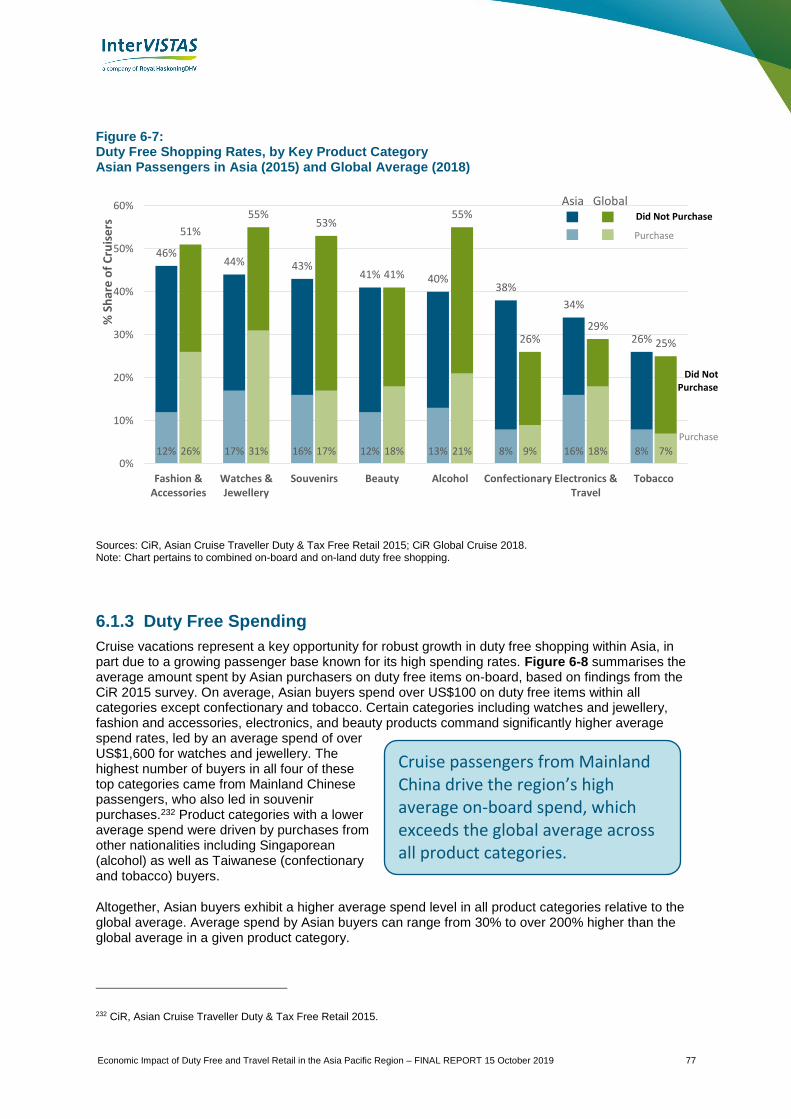
Economic Impact of Duty Free and Travel Retail in the Asia Pacific Region – FINAL REPORT 15 October 2019 77
Figure 6-7: Duty Free Shopping Rates, by Key Product Category Asian Passengers in Asia (2015) and Global Average (2018)
Sources: CiR, Asian Cruise Traveller Duty & Tax Free Retail 2015; CiR Global Cruise 2018. Note: Chart pertains to combined on-board and on-land duty free shopping.
6.1.3 Duty Free Spending
Cruise vacations represent a key opportunity for robust growth in duty free shopping within Asia, in part due to a growing passenger base known for its high spending rates. Figure 6-8 summarises the average amount spent by Asian purchasers on duty free items on-board, based on findings from the CiR 2015 survey. On average, Asian buyers spend over US$100 on duty free items within all categories except confectionary and tobacco. Certain categories including watches and jewellery, fashion and accessories, electronics, and beauty products command significantly higher average spend rates, led by an average spend of over US$1,600 for watches and jewellery. The highest number of buyers in all four of these top categories came from Mainland Chinese passengers, who also led in souvenir purchases.232 Product categories with a lower average spend were driven by purchases from other nationalities including Singaporean (alcohol) as well as Taiwanese (confectionary and tobacco) buyers.
Altogether, Asian buyers exhibit a higher average spend level in all product categories relative to the global average. Average spend by Asian buyers can range from 30% to over 200% higher than the global average in a given product category.
232 CiR, Asian Cruise Traveller Duty & Tax Free Retail 2015.
46%44% 43%
41% 40%38%
34%
26%
51%
55%53%
41%
55%
26%29%
25%
12% 17% 16% 12% 13% 8% 16% 8%26% 31% 17% 18% 21% 9% 18% 7%0%
10%
20%
30%
40%
50%
60%
Fashion &Accessories
Watches &Jewellery
Souvenirs Beauty Alcohol Confectionary Electronics &Travel
Tobacco
% S
har
e o
f C
ruis
ers
Purchase
Did Not Purchase
Did Not Purchase
Purchase
Asia Global
Cruise passengers from Mainland China drive the region’s high average on-board spend, which exceeds the global average across all product categories.

78 Economic Impact of Duty Free and Travel Retail in the Asia Pacific Region – FINAL REPORT 15 October 2019.
Figure 6-8: Average On-Board Duty Free Spend, by Product Category Asian Passengers in Asia (2015) and Global Average (2018)
Sources: CiR, Asian Cruise Traveller Duty & Tax Free Retail 2015; CiR Global Cruise 2018. Note: All figures expressed in 2017 U.S. dollars. Global average spend data for souvenirs and electronics was not available.
However, average spend levels are not homogenous across Asian nationalities. The CiR findings suggest there are differences in spending levels across the nationalities most responsible for purchases in each product category, with the most expensive product categories dominated by Chinese shoppers as previously noted. A 2017 TFWA survey of Chinese and Japanese cruisers in East Asia shows a similar trend, with Chinese buyers spending eight times more, on average, than Japanese buyers.233
However, high average spending levels by Asian (primarily Chinese) buyers are offset in part by other characteristics of this source market. Most notably, the tendency to cruise with the entire family means that 1) there are often only 1-2 adults shopping on behalf of the party, and 2) the relative share of non-buying cruisers (such as infants/children and non-shopping elderly) is larger.234 The implication is that, while the Asian source market includes buyers with worldwide-leading levels of spending, the demographic also includes more non-buying cruisers on-board who effectively lower the average spend per capita. Other factors influencing duty free spending include the shorter itineraries prevalent throughout Asia (which limit the available time to shop) and the high rate of first-time cruisers who, according to TFWA, tend to have lower duty free spending rates than repeat cruisers. For instance, on-board spending by Chinese passengers was nearly 40% lower for first timers relative to repeat cruisers. That said, given the high duty free transaction values and the likely continued growth of Chinese cruising, the market will continue to attract significant investment, for example by international retailers such as Dufry and Heinemann moving beyond the boundaries of their airport presence.235
233 TFWA East Asia Cruise Study 2017. 234 Per TFWA, there are as many as three to four times more Asian children travelling via cruise than air. Cruise traffic figures from CLIA indicate that the average age on cruises in Asia are among the lowest worldwide, with 4 out of 10 passengers under the age of 40. TFWA East Asia Cruise Study 2017; CLIA Asia Trends 2018 Overview. 235 TFWA East Asia Cruise Study 2017.
$1,624
$743
$374
$221 $177
$102 $98 $71
$893
$237$154
$103 $76 $45
$0
$200
$400
$600
$800
$1,000
$1,200
$1,400
$1,600
$1,800
Watches &Jewellery
Fashion &Accessories
Electronics &Travel
Accessories
Beauty Alcohol Souvenirs Tobacco Confectionary
$U
SD (
20
17
)
Asia Global

Economic Impact of Duty Free and Travel Retail in the Asia Pacific Region – FINAL REPORT 15 October 2019 79
As a whole, the characteristics of the Asia Pacific cruise market are indicative of an emerging duty free and travel retail channel with the potential to grow by several orders of magnitude. Factors that currently limit duty free sales, such as short trip length and high levels of groups and first-timers who tend to spend less, may be resolved as the passenger market gains more experience with cruise travel and operators develop their retail offerings for key demographics, such as families. Further, the high value already placed on shopping by Asian cruise passengers in the region, coupled with their high propensity to spend, indicates that duty free and travel retail is a key component to the cruise tourism experience and likely a significant opportunity for cruise lines to improve and advance their offering.
6.2 Ferries
In the Asia Pacific region, duty free and travel retail sales on ferries amounted to a modest (compared to other sales channels) US$9.8 million in 2017.236 Most ferry operations are located within East Asia.
Domestic travel by ferry is common in the Asia Pacific region, particularly in the Philippines, Indonesia, and Thailand, where ferries are relied on as a primary means of transportation between each country’s numerous islands. On the other hand, international ferry travel is more limited, typically involving low-frequency services and often targeted at tourists seeking a unique way to travel between countries. While on-board duty free items may be available for purchase, the low frequency of the services means that the overall impact on total duty free sales for the Asia Pacific region is inevitably limited.
In general, cross-border ferry services are more integral to transportation networks in coastal regions with large population centres in close geographic proximity to one another. Few areas in the Asia Pacific region fall into this category. One of the key exceptions is the Hong Kong – Macau – Shenzhen triangle, where high-frequency cross border ferry services are a critical component of the regional transportation network. As part of the Pearl River Delta, the most populous metropolitan region in the world, Hong Kong, Macau, and Shenzhen have a combined population of more than 20 million people.237,238,239 Furthermore, the shortest distance between Hong Kong (and Shenzhen) and Macau is directly across the Pearl River Estuary (~ 65 km).240 These factors, combined with regional movement challenges arising from road congestion, have aided the development of ferry travel in the region. In 2018, 10.3 million visitors arrived in Macau through one of two ferry terminals.241 Travellers have the opportunity to purchase duty free goods at the ferry terminals in Macau, Hong Kong, or Shenzhen, depending what is most convenient for their travel schedule.
TurboJET, a Hong Kong based high-speed ferry operator, offers an average of 83 daily trips each way between Hong Kong and Macau, 30 daily between Macau and Shenzhen, and 15 daily between Hong Kong and Shenzhen.242 Trip times range from 50 – 70 minutes depending on the route. On-board duty free purchases are available on all services.
236 Generation Research. 237 World Bank (http://www.worldbank.org/en/news/press-release/2015/01/26/world-bank-report-provides-new-data-to-help-ensure-urban-growth-benefits-the-poor). 238 United Nations estimates from 2015. Hong Kong and Macau only. 239 Shenzhen Municipal Bureau of Statistics (https://web.archive.org/web/20180223171434/http://www.sztj.gov.cn/xxgk/tjsj/tjfx/201802/t20180201_10762739.htm). 240 Google Maps estimate for distance. 241 Macao Government Tourism Office (https://dataplus.macaotourism.gov.mo/document/CHT/Book/MarketPerformance/2018/Market%20Performance%202018.pdf). 242 https://ca.directferries.com/turbojet.htm
Asia Pacific’s cruise market represents an emerging duty free and travel retail channel primed for continued growth.
80 Economic Impact of Duty Free and Travel Retail in the Asia Pacific Region – FINAL REPORT 15 October 2019.
In 2003, TurboJET, in partnership with Hong Kong International Airport, premiered a seamless sea-air inter modal system for international travellers. This system is primarily deployed between the Macau Outer Harbour Ferry Terminal and Hong Kong International Airport and provides upstream immigration and check-in procedures.243 For example, a Macau-originating passenger with a flight departing from Hong International Airport, can check-in (including baggage tag and drop) and clear immigration formalities prior to boarding the ferry in Macau. Upon arrival at Hong Kong International Airport, passengers can proceed directly to their designated departure gate. This streamlined process encourages the use of cross-border airports for both Macau and Hong Kong based residents. For example, a Macau originating passenger who typically departs from Macau International Airport may opt to depart from Hong Kong International Airport using the direct ferry service. Travellers may decide to purchase duty free goods on their TurboJET service or wait to shop at Hong Kong International Airport itself. Given competing cross-channel offerings between the ferry and the airport, duty free and travel retail operations by the ferry are more likely to capture impulse purchases whereas the airport will attract shoppers looking for a wider selection and service. In some other instances, ferry operators may elect not to offer on-board duty free purchases, probably because of competition from land based duty free operations (i.e. duty free stores in ferry terminals). For example, Singapore – Batam Island (Indonesia) sees an average of 67 daily trips each way by three different ferry operators,244 none of which indicate they offer on-board duty free purchases. Most of these trips originate from the HarbourFront Centre Ferry Terminal in Singapore which houses a large departure and arrival duty free store.245 The relatively small contribution of ferry duty free and travel retail to overall duty free and travel retail in Asia Pacific reflects in part the intrinsic modesty of the sector described above but also the very strong contribution made by other channels. However, it still contributes to the strength of the region’s duty free and travel retail sales.
6.3 Maritime Channels Summary
The maritime sales channels have historically generated much less revenue in Asia Pacific compared to the aviation and land sales channels, amounting to an estimated US$0.8 billion in 2017. However, ocean cruising is an emerging sector in Asia, with capacity growing at an annual rate of 41% over the last five years as the fastest growing sub-region in the world. Ocean cruising has gained popularity particularly among Asian tourists in recent years, with potential to generate significantly more duty free and travel retail revenue as cruise itineraries in the sub-region continue to develop.
Cruise lines are actively investing in the enhancement of on-board product offerings, and duty free operators are seeing the cruise channel as a growth opportunity. Given that Asian passengers comprise approximately 70% of all passengers on ocean cruises in Asia Pacific (including Oceania) and are likely to drive future demand growth, cruise ship and port store offerings are increasingly geared toward the Asian shopper, with storefronts being revamped with luxury brands and expanded with more space to accommodate additional amenities that provide an all-inclusive, high-quality service to shoppers.
243 https://www.turbojet.com.hk/en/airport-ferry-services/hong-kong-airport.aspx. A similar expedited process is available from Hong Kong to Macau International Airport. 244 https://ca.directferries.com/singapore.htm 245 https://www.dfnionline.com/latest-news/dfs-opens-island-inspired-singapore-cruise-centre-duty free-shops-02-08-2017/
Asia Pacific ferry operations serve as a supplementary sales channel oriented towards capitalizing on passengers’ impulse purchasing tendencies, amounting to nearly $10 million in sales in 2017.

Economic Impact of Duty Free and Travel Retail in the Asia Pacific Region – FINAL REPORT 15 October 2019 81
Case Study: Cruise and Ferry Port Stores in Asia
Asia is home to several high-traffic cruise/ferry terminals including Port of Shanghai’s three cruise terminals, Japan’s Fukuoka, Okinawa, and Nagasaki terminals, Singapore Cruise Centre (SCC) (includes an international passenger terminal ranking as the ninth largest homeport cruise terminal in the world), and Thailand’s Phuket and Bangkok terminals, among others.246 In the duty free and travel retail space, operators must balance the opportunity to serve millions of international cruise and ferry passengers transiting their terminals each year, against the competitive challenges arising from the more conventional channels where travellers choose to shop.
Challenges for Asian port stores
Port stores face competition from other port stores (i.e. at other calling points during a cruise or ferry trip)247 as well as with other channels. These include duty free stores available on-board the ships (which have the added benefit of longer dwell times from “captive” passengers) as well as nearby downtown shops or other locations available during a passenger’s transit. For instance, SCC’s Tanah Merah Ferry Terminal, which serves ferry traffic to/from the Riau Islands in Indonesia and offers duty free shopping, is connected by a direct shuttle bus to Changi Airport.248 The fly-ferry traffic is more likely to shop at Changi given its wider selection, amenities, and convenience. Hong Kong’s Kai Tak Cruise Terminal faces similar challenges with nearby train and downtown stores – channels which are well-known to travellers as places to do their duty free and travel retail shopping. Trevor Moore, former Managing Director of Kai Tak Cruise Plaza, has previously acknowledged these issues for port shops and noted the need to increase awareness and promote product offerings, since “nobody expects to see a travel retail store in a cruise terminal.”249
Opportunities for Asian port stores
However, port terminal stores can also complement other retail channels. Port shops may be the first onshore retail location that cruisers see when disembarking at a new port of call, and they have an opportunity to showcase a uniquely local product offering that differs from what may be carried by on-board stores. Cross-channel partnerships can extend beyond the cruise ship as well. For instance, DFS’ HarbourFront stores at SCC are 10 minutes’ walk from the country’s largest shopping mall, VivoCity. VivoCity and HarbourFront jointly offer a foreign visitor privilege program where foreign tourists are eligible for admissions rebates on local attractions as well as shopping discounts and free items if they spend a minimum amount at either shopping location.250 This
246 CLIA Asia Cruise Trends 2018 Edition; Singapore Cruise Centre (https://www.singaporecruise.com.sg/index.php/terminals/sccharbourfront/). 247 According to a 2015 survey by CiR, Asian cruisers will often shop at port stores but are not likely to visit a store at every port they visit, suggesting that port stores face competition with stores at other ports of call on the passenger’s itinerary. CiR Asian Cruise Traveller Duty & Tax Free Retail 2015. 248 Moodie Davitt Report (https://www.moodiedavittreport.com/new-shuttle-bus-service-connects-tanah-merah-ferry-terminal-and-changi-airport/). 249 Trevor Moore speaking at the TFWA Asia Pacific Conference 2015, cited in CiR Asian Cruise Traveller Duty & Tax Free Retail 2015. 250 Visit Singapore (https://www.visitsingapore.com/editorials/where-to-shop-duty-free/); VivoCity (https://www.vivocity.com.sg/tourist-privileges/).
DFS Duty Free at Singapore Cruise Centre Source: The Moodie Davitt Report
82 Economic Impact of Duty Free and Travel Retail in the Asia Pacific Region – FINAL REPORT 15 October 2019.
allows the mall (which does not offer duty free retail) to attract foreign traffic while HarbourFront leverages the partnership with the mall to offer benefits to its customers that extend beyond its storefronts.
The growth potential for port stores is significant enough to warrant recent expansions and investments at major terminals throughout Asia including DFS’ redevelopment and expansion of storefronts at SCC, a new duty free store announced for Baoshan Port in Shanghai, and China’s first cruise arrivals duty free store, a 1,000 square metre space scheduled to open in Shanghai in late 2019.251 Duty free and travel retail will also debut at Swettenham Pier Cruise Terminal in Penang, Malaysia, when the first of several planned stores begins operation in 2019.252
Swettenham Pier Cruise Terminal: Encouraging tourism and retailing local products
Swettenham’s debut into the duty free and travel retail market is considered a stepping stone in the evolution of the international port and its role in the community. The impending duty free store at the cruise terminal, which was mandated by the Malaysia Finance Minister in the country’s 2019 budget, has been described as an opportunity that could offer “a double boost to Penang’s tourism sector.”253 The retail space will be an added amenity to welcome passengers ashore, incentivising them to disembark their ship, spend more time on land and go into the city. In turn, the port operator’s CEO believes that the duty free offering will encourage cruise operators to use Penang as a port of call more often.254
The port intends to use the retail venture to showcase local products and the culture of Penang. According to Jeffrey Chew, Chairman of the Penang Port Commission, “duty free is just part of the service offered to international tourists. We look at the retail space as an opportunity to sell more local products…The duty free store will complement the [port] expansion, but there are plans in place to have bigger retail outlets within the port vicinity. These include duty free elements as well as selling locally made products to tourists arriving at the port.”255
251 Moodie Davitt Report (https://www.moodiedavittreport.com/singapore-cruise-centre-awards-first-master-duty-free-concession-to-dfs-group/); (https://www.moodiedavittreport.com/shanghai-to-open-chinas-first-cruise-duty-free-arrivals-store-in-november/). Shanghai Daily (https://www.shine.cn/news/metro/1808220853/). 252 TR Business (https://www.trbusiness.com/regional-news/asia-pacific/swettenham-pier-cruise-terminal-to-open-new-df-store-in-june/162690). 253 The Star (https://www.thestar.com.my/metro/metro-news/2018/11/08/dutyfree-shops-to-draw-in-tourists-exco-man-new-incentive-and-cruise-terminal-expansion-will-spur-pe). 254 Ibid. 255 TR Business (https://www.trbusiness.com/regional-news/asia-pacific/swettenham-pier-cruise-terminal-to-open-new-df-store-in-june/162690).
Economic Impact of Duty Free and Travel Retail in the Asia Pacific Region – FINAL REPORT 15 October 2019 83
Serving the onshore cruise shopper
Port shops can help serve cruise passengers who prefer to shop on-land rather than on-board the ship. Although cruisers in Asia tend to shop more often and spend higher amounts on the ship relative to port shops,256 onshore shopping still attracts notable flows of cruiser traffic. In a 2015 survey, CiR found that 51% of Asian passengers on Asian cruises shopped at an on-land duty free store located in or near a port terminal, with most of them ultimately making a purchase as well.257 The leading drivers for shopping on land include the desire to find souvenirs as well as local products.258 Port stores may therefore have an opportunity to support “niche” or souvenir shoppers who are less prioritised by on-board offerings geared toward mass flows of shoppers incentivised by price and a particular duty free shopping experience. CiR’s findings indicate a distinction between on-land and on-board duty free and travel retail wherein both can flourish at the same time.259
Takeaway: Port stores show potential to enhance the duty free market throughout Asia
As growth in the cruise and ferry market in Asia outpaces other regions, operators are investing in duty free port stores across several major maritime terminals. Port stores face the challenge of relatively limited dwell time from its transiting traffic and the risk of adding redundancy to more established channels for duty free and travel retail. However, port stores can provide a differentiated offering that fills potential gaps left by other channels and stimulates the duty free market overall. Most notably, port shops can be a key first stop for passengers transitioning from the ship to the city, offering a transition into the local culture and its unique offerings that may not available in a cruise liner store.
In turn, port stores can help develop the brand of individual ports in Asia as they accommodate growing flows of passenger traffic, with additional economic opportunities for the entire port city as cruise passengers see more reasons to spend time onshore.
256 CiR Asian Cruise Traveller Duty & Tax Free Retail 2015. 257 Survey results for on-land shopping refer to duty or tax free offerings “at or in the vicinity of cruise ports at the start of the passenger’s trip, at a location port during the trip, or at a port at the end of the trip”. CiR Asian Cruise Traveller Duty & Tax Free Retail 2015. 258 Ibid. 259 Ibid.
“To drive success operators must
fully realise the potential of the
on-board and on-land channel and
treat the two as separate entities to
offer a compelling yet differentiated
proposition to travellers.”
Counter Intelligence Retail Ltd.,
Asian Cruise Traveller Duty & Tax
Free Retail, 2015.
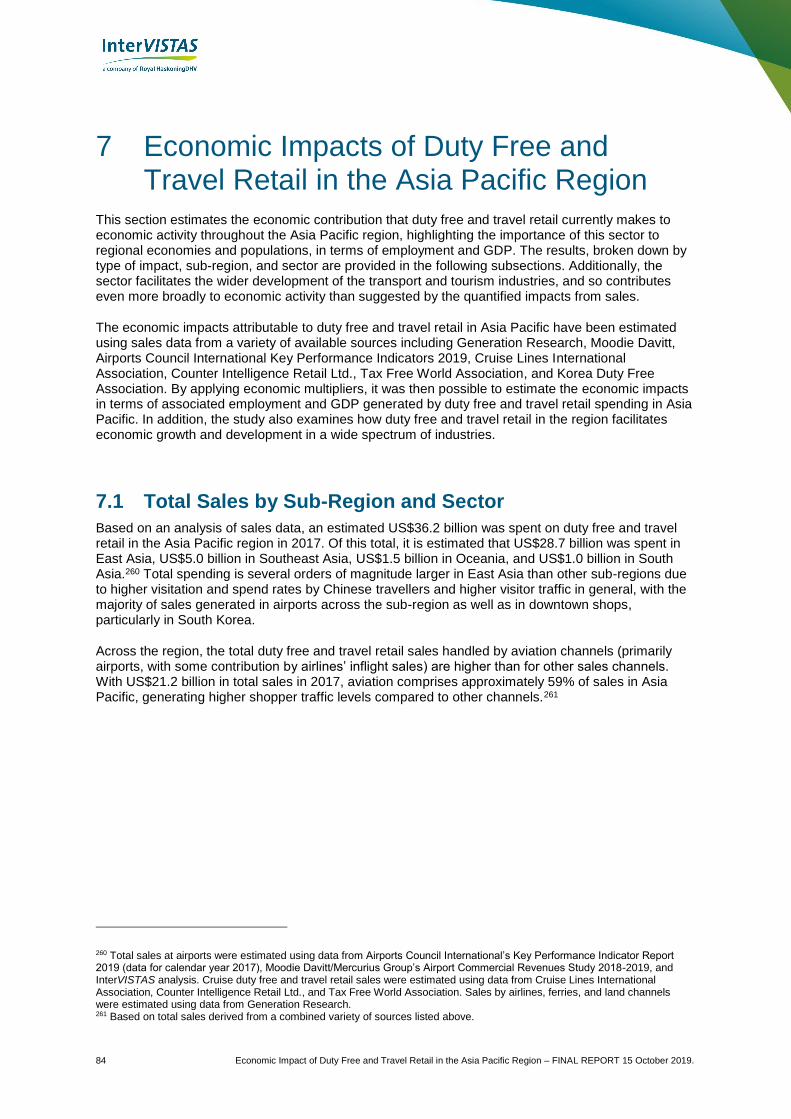
84 Economic Impact of Duty Free and Travel Retail in the Asia Pacific Region – FINAL REPORT 15 October 2019.
7 Economic Impacts of Duty Free and Travel Retail in the Asia Pacific Region
This section estimates the economic contribution that duty free and travel retail currently makes to economic activity throughout the Asia Pacific region, highlighting the importance of this sector to regional economies and populations, in terms of employment and GDP. The results, broken down by type of impact, sub-region, and sector are provided in the following subsections. Additionally, the sector facilitates the wider development of the transport and tourism industries, and so contributes even more broadly to economic activity than suggested by the quantified impacts from sales.
The economic impacts attributable to duty free and travel retail in Asia Pacific have been estimated using sales data from a variety of available sources including Generation Research, Moodie Davitt, Airports Council International Key Performance Indicators 2019, Cruise Lines International Association, Counter Intelligence Retail Ltd., Tax Free World Association, and Korea Duty Free Association. By applying economic multipliers, it was then possible to estimate the economic impacts in terms of associated employment and GDP generated by duty free and travel retail spending in Asia Pacific. In addition, the study also examines how duty free and travel retail in the region facilitates economic growth and development in a wide spectrum of industries.
7.1 Total Sales by Sub-Region and Sector
Based on an analysis of sales data, an estimated US$36.2 billion was spent on duty free and travel retail in the Asia Pacific region in 2017. Of this total, it is estimated that US$28.7 billion was spent in East Asia, US$5.0 billion in Southeast Asia, US$1.5 billion in Oceania, and US$1.0 billion in South Asia.260 Total spending is several orders of magnitude larger in East Asia than other sub-regions due to higher visitation and spend rates by Chinese travellers and higher visitor traffic in general, with the majority of sales generated in airports across the sub-region as well as in downtown shops, particularly in South Korea.
Across the region, the total duty free and travel retail sales handled by aviation channels (primarily airports, with some contribution by airlines’ inflight sales) are higher than for other sales channels. With US$21.2 billion in total sales in 2017, aviation comprises approximately 59% of sales in Asia Pacific, generating higher shopper traffic levels compared to other channels.261
260 Total sales at airports were estimated using data from Airports Council International’s Key Performance Indicator Report 2019 (data for calendar year 2017), Moodie Davitt/Mercurius Group’s Airport Commercial Revenues Study 2018-2019, and InterVISTAS analysis. Cruise duty free and travel retail sales were estimated using data from Cruise Lines International Association, Counter Intelligence Retail Ltd., and Tax Free World Association. Sales by airlines, ferries, and land channels were estimated using data from Generation Research. 261 Based on total sales derived from a combined variety of sources listed above.
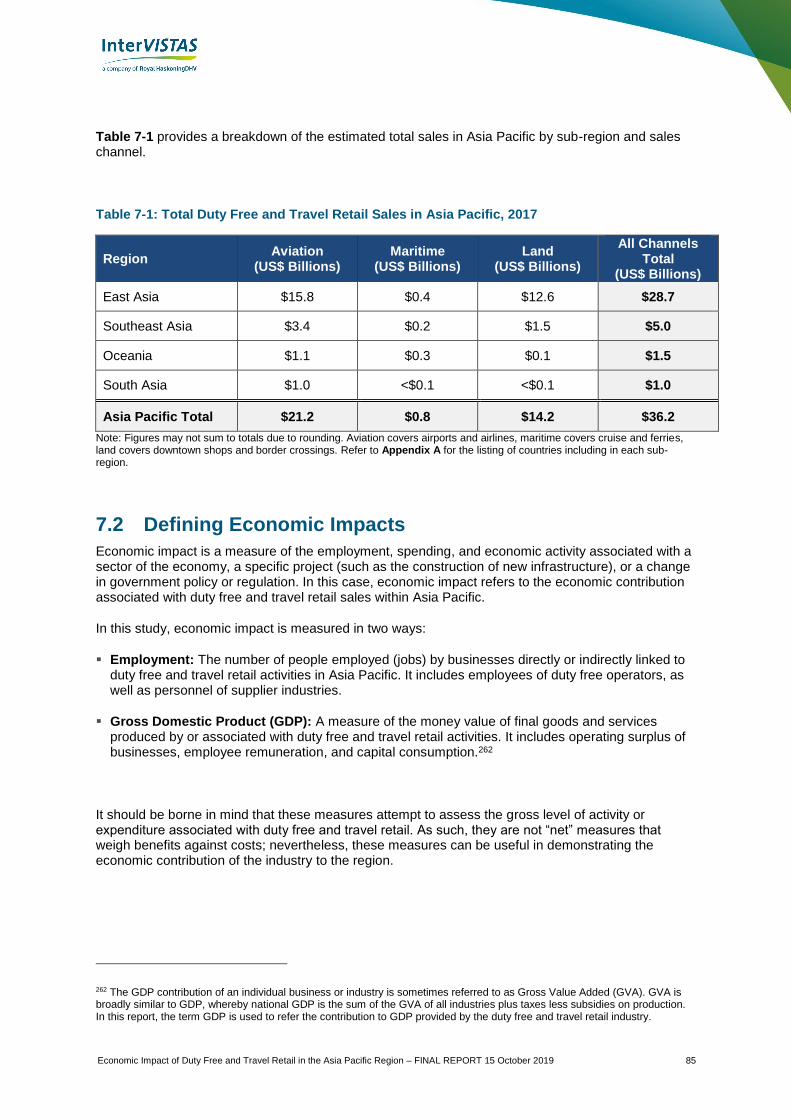
Economic Impact of Duty Free and Travel Retail in the Asia Pacific Region – FINAL REPORT 15 October 2019 85
Table 7-1 provides a breakdown of the estimated total sales in Asia Pacific by sub-region and sales channel.
Table 7-1: Total Duty Free and Travel Retail Sales in Asia Pacific, 2017
Region Aviation
(US$ Billions) Maritime
(US$ Billions) Land
(US$ Billions)
All Channels Total
(US$ Billions)
East Asia $15.8 $0.4 $12.6 $28.7
Southeast Asia $3.4 $0.2 $1.5 $5.0
Oceania $1.1 $0.3 $0.1 $1.5
South Asia $1.0 <$0.1 <$0.1 $1.0
Asia Pacific Total $21.2 $0.8 $14.2 $36.2
Note: Figures may not sum to totals due to rounding. Aviation covers airports and airlines, maritime covers cruise and ferries, land covers downtown shops and border crossings. Refer to Appendix A for the listing of countries including in each sub-region.
7.2 Defining Economic Impacts
Economic impact is a measure of the employment, spending, and economic activity associated with a sector of the economy, a specific project (such as the construction of new infrastructure), or a change in government policy or regulation. In this case, economic impact refers to the economic contribution associated with duty free and travel retail sales within Asia Pacific.
In this study, economic impact is measured in two ways:
▪ Employment: The number of people employed (jobs) by businesses directly or indirectly linked to duty free and travel retail activities in Asia Pacific. It includes employees of duty free operators, as well as personnel of supplier industries.
▪ Gross Domestic Product (GDP): A measure of the money value of final goods and services produced by or associated with duty free and travel retail activities. It includes operating surplus of businesses, employee remuneration, and capital consumption.262
It should be borne in mind that these measures attempt to assess the gross level of activity or expenditure associated with duty free and travel retail. As such, they are not “net” measures that weigh benefits against costs; nevertheless, these measures can be useful in demonstrating the economic contribution of the industry to the region.
262 The GDP contribution of an individual business or industry is sometimes referred to as Gross Value Added (GVA). GVA is broadly similar to GDP, whereby national GDP is the sum of the GVA of all industries plus taxes less subsidies on production. In this report, the term GDP is used to refer the contribution to GDP provided by the duty free and travel retail industry.

86 Economic Impact of Duty Free and Travel Retail in the Asia Pacific Region – FINAL REPORT 15 October 2019.
7.2.1 Categories of Economic Impact
There are three distinct types or categories of economic impact associated with duty free and travel retail, as described below.
▪ Direct Economic Impact: This is the employment and GDP associated with the operation and management of activities in the duty free and travel retail sector. This includes activities by the duty free operators, such as employment of sales staff at a duty free shop.
▪ Indirect Economic Impact: This is the employment and GDP generated by down-stream industries that supply and support the activities in the duty free and travel retail sector. For example, these could include wholesalers providing goods for inflight sales. Indirect employment is generated in industries that supply or provide services to those firms that directly serve the duty free and travel retail sector in Asia Pacific.
▪ Induced Economic Impact: This captures the economic activity generated by the employees of firms directly or indirectly connected to the duty free and travel retail sector spending their wages and salaries in their national economy. For example, a duty free shop employee might spend his/her wages and salaries on groceries, restaurants, child care, dental services, home renovations, and other items which, in turn, generate employment in a wide range of sectors of the general economy. This is often referred to as the “household spending” effect.
7.3 Direct Economic Impacts
Economic multipliers were applied to the total estimated duty free and travel retail sales in the region. A collection of country level multipliers was used to calculate economic impacts in the region and each sub-region. This was shaped by the availability of Input Output tables from national statistical agencies and the Asian Development Bank, as well availability and robustness of information regarding spending levels in each sub-region.263 It is worth noting that economic multipliers vary significantly from one country to another, due to different compositions in the economy, labour availability, and wages. There is significant diversity in the Asia Pacific region in terms of size and development stage of economies.
Using these multipliers, the direct employment and GDP generated by duty free and travel retail spending in Asia Pacific are estimated. The resulting direct economic impact estimates are provided in Table 7-2 and Table 7-3 below by sub-region and sales channel. Duty free and travel retail spending in Asia Pacific directly accounts for an estimated 140,900 jobs and US$7.6 billion in GDP.264 The greatest impacts are in East Asia where duty free and travel retail spending is estimated to generate 103,600 jobs and US$5.9 billion in GDP. Spending throughout the rest of Asia supports approximately 33,700 jobs and US$1.4 billion in GDP. Spending in Oceania accounts for the region’s remaining 3,600 jobs and US$0.3 billion in GDP.
Table 7-4 shows the average amount spent on duty free and travel retail per direct job in each sub-region and sales channel. There is significant variation in the estimated sales per direct job across the sub-regions in Asia Pacific. This is predominantly driven by the different development stages of economies in each sub-region; more developed economies generate fewer jobs per sales compared
263 Further details on the economic multipliers used in the study are available in Appendix B. 264 This study estimates the impact of duty free and travel retail only. It cannot be directly compared to the results in the Duty Free World Council economic impact study for Europe (Section 6), as that study includes the impact of all retail and other in-airport terminal services (such as car hire and food and beverage services). The ratio of sales revenue to direct jobs and direct GDP is different in the duty free and travel retail sales sector compared to other retail and in-airport terminal sectors because of the higher value of goods sold at duty free shops. Fewer employees would be needed to handle US$1 million of sales of high-end value duty free products, while more employees per US$1 million would be needed for other lower value products and services.
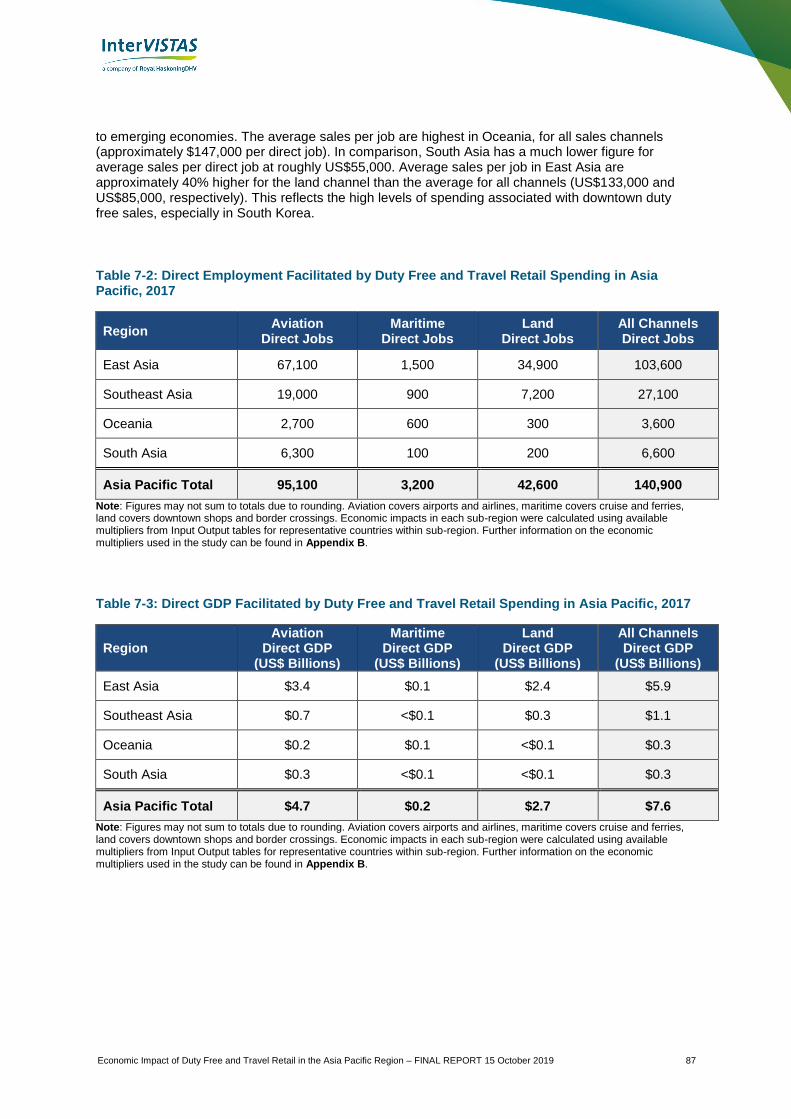
Economic Impact of Duty Free and Travel Retail in the Asia Pacific Region – FINAL REPORT 15 October 2019 87
to emerging economies. The average sales per job are highest in Oceania, for all sales channels (approximately $147,000 per direct job). In comparison, South Asia has a much lower figure for average sales per direct job at roughly US$55,000. Average sales per job in East Asia are approximately 40% higher for the land channel than the average for all channels (US$133,000 and US$85,000, respectively). This reflects the high levels of spending associated with downtown duty free sales, especially in South Korea.
Table 7-2: Direct Employment Facilitated by Duty Free and Travel Retail Spending in Asia Pacific, 2017
Region Aviation
Direct Jobs Maritime
Direct Jobs Land
Direct Jobs All Channels Direct Jobs
East Asia 67,100 1,500 34,900 103,600
Southeast Asia 19,000 900 7,200 27,100
Oceania 2,700 600 300 3,600
South Asia 6,300 100 200 6,600
Asia Pacific Total 95,100 3,200 42,600 140,900
Note: Figures may not sum to totals due to rounding. Aviation covers airports and airlines, maritime covers cruise and ferries, land covers downtown shops and border crossings. Economic impacts in each sub-region were calculated using available multipliers from Input Output tables for representative countries within sub-region. Further information on the economic multipliers used in the study can be found in Appendix B.
Table 7-3: Direct GDP Facilitated by Duty Free and Travel Retail Spending in Asia Pacific, 2017
Region Aviation
Direct GDP (US$ Billions)
Maritime Direct GDP
(US$ Billions)
Land Direct GDP
(US$ Billions)
All Channels Direct GDP
(US$ Billions)
East Asia $3.4 $0.1 $2.4 $5.9
Southeast Asia $0.7 <$0.1 $0.3 $1.1
Oceania $0.2 $0.1 <$0.1 $0.3
South Asia $0.3 <$0.1 <$0.1 $0.3
Asia Pacific Total $4.7 $0.2 $2.7 $7.6
Note: Figures may not sum to totals due to rounding. Aviation covers airports and airlines, maritime covers cruise and ferries, land covers downtown shops and border crossings. Economic impacts in each sub-region were calculated using available multipliers from Input Output tables for representative countries within sub-region. Further information on the economic multipliers used in the study can be found in Appendix B.

88 Economic Impact of Duty Free and Travel Retail in the Asia Pacific Region – FINAL REPORT 15 October 2019.
Table 7-4: Average Duty Free and Travel Retail Sales per Direct Job in Asia Pacific, 2017
Region Aviation
Sales per Direct Job (US$ Thousands)
Maritime Sales per Direct Job (US$ Thousands)
Land Sales per Direct Job (US$ Thousands)
All Channels Sales per Direct Job (US$ Thousands)
East Asia $87 $84 $133 $102
Southeast Asia $65 $62 $76 $68
Oceania $147 $149 $146 $147
South Asia $57 $54 $60 $57
Asia Pacific Total $82 $90 $123 $95
Note: Figures may not sum to totals due to rounding. Aviation covers airports and airlines, maritime covers cruise and ferries, land covers downtown shops and border crossings. Economic impacts in each sub-region were calculated using available multipliers from Input Output tables for representative countries within sub-region. Further information on the economic multipliers used in the study can be found in Appendix B.
7.4 Indirect and Induced Economic Impacts
As noted previously, the economic impact of duty free and travel retail does not end with the direct impacts. Other sectors of the economy benefit from duty free and travel retail operations. This includes indirect impacts in businesses that supply the goods and services to the direct activities linked to duty free and travel retail, and induced impacts resulting from direct and indirect employees spending their wages in the general economy. The indirect and induced impacts were estimated using economic multipliers derived from government data and the Asian Development Bank, as detailed in Appendix B.
Based on the application of economic multipliers, it is estimated that 179,200 indirect and induced jobs are related to duty free and travel retail spending in Asia Pacific. Broken down further, 85,000 indirect jobs are generated in industries that supply the businesses directly related to the duty free and travel retail sector. A further 94,200 induced jobs are supported by demand for goods and services generated by wages and salaries of those directly or indirectly linked to duty free and travel retail.265
An estimated indirect and induced contribution of US$7.1 billion in GDP is made each year by the duty free and travel retail sector in Asia Pacific. Separately, the indirect and induced GDP contributions are estimated at US$4.3 billion and US$2.8 billion per annum, respectively.266
Table 7-5 and Table 7-6 below summarise the indirect and induced employment and GDP attributable to ongoing duty free and travel retail activities in Asia Pacific in 2017, by sub-region and sales channel.
265 Indirect and induced employment impacts may not sum due to rounding. 266 Indirect and induced GDP impacts may not sum due to rounding.

Economic Impact of Duty Free and Travel Retail in the Asia Pacific Region – FINAL REPORT 15 October 2019 89
Table 7-5: Indirect and Induced Employment Economic Impacts in Asia Pacific, 2017
Region Aviation
Indirect & Induced Jobs
Maritime Indirect & Induced
Jobs
Land Indirect & Induced
Jobs
All Channels Indirect & Induced
Jobs
East Asia 84,500 1,900 35,300 121,700
Southeast Asia 29,500 1,400 12,100 43,000
Oceania 3,100 700 400 4,200
South Asia 9,900 100 300 10,400
Asia Pacific Total 127,000 4,100 48,200 179,200
Note: Figures may not sum to totals due to rounding. Aviation covers airports and airlines, maritime covers cruise and ferries, land covers downtown shops and border crossings. Economic impacts in each sub-region were calculated using available multipliers from Input Output tables for representative countries within sub-region. Further information on the economic multipliers used in the study can be found in Appendix B.
Table 7-6: Indirect and Induced GDP Economic Impacts in Asia Pacific, 2017
Region Aviation
Indirect & Induced GDP (US$ Billions)
Maritime Indirect & Induced GDP (US$ Billions)
Land Indirect & Induced GDP (US$ Billions)
All Channels Indirect & Induced GDP (US$ Billions)
East Asia $3.3 $0.1 $2.1 $5.5
Southeast Asia $0.7 <$0.1 $0.3 $1.1
Oceania $0.2 $0.1 <$0.1 $0.3
South Asia $0.2 <$0.1 <$0.1 $0.2
Asia Pacific Total $4.5 $0.2 $2.5 $7.1
Note: Figures may not sum to totals due to rounding. Aviation covers airports and airlines, maritime covers cruise and ferries, land covers downtown shops and border crossings. Economic impacts in each sub-region were calculated using available multipliers from Input Output tables for representative countries within sub-region. Further information on the economic multipliers used in the study can be found in Appendix B.

90 Economic Impact of Duty Free and Travel Retail in the Asia Pacific Region – FINAL REPORT 15 October 2019.
7.5 Total Economic Impacts
Adding the activity directly related to the sales channel to the indirect and induced impacts that flow from that, the total economic impact of duty free and travel retail in Asia Pacific is an estimated 320,200 jobs and US$14.7 billion in GDP. The combined total impacts of duty free and travel retail in Asia Pacific is summarised in Table 7-7 and Table 7-8 below.
The spending on duty free and travel retail in East Asia is estimated to generate a total of 225,300 jobs and US$11.3 billion in GDP, with the remainder of Asia generating a combined total of 87,100 jobs and US$2.7 billion in GDP. Duty free and travel retail activities in Oceania support approximately 7,800 jobs and US$0.7 billion in GDP.
Table 7-7: Total Employment Economic Impacts in Asia Pacific, 2017
Region Aviation
Total Jobs
Maritime
Total Jobs
Land
Total Jobs
All Channels
Total Jobs
East Asia 151,600 3,400 70,200 225,300
Southeast Asia 48,400 2,300 19,300 70,000
Oceania 5,800 1,300 700 7,800
South Asia 16,300 200 600 17,100
Asia Pacific Total 222,100 7,300 90,800 320,200
Note: Figures may not sum to totals due to rounding. Aviation covers airports and airlines, maritime covers cruise and ferries, land covers downtown shops and border crossings. Economic impacts in each sub-region were calculated using available multipliers from Input Output tables for representative countries within sub-region. Further information on the economic multipliers used in the study can be found in Appendix B.
Table 7-8: Total GDP Economic Impacts in Asia Pacific, 2017
Region Aviation
Total GDP (US$ Billions)
Maritime Total GDP
(US$ Billions)
Land Total GDP
(US$ Billions)
All Channels Total GDP
(US$ Billions)
East Asia $6.7 $0.1 $4.5 $11.3
Southeast Asia $1.5 $0.1 $0.6 $2.2
Oceania $0.5 $0.1 $0.1 $0.7
South Asia $0.5 <$0.1 <$0.1 $0.5
Asia Pacific Total $9.2 $0.3 $5.2 $14.7
Note: Figures may not sum to totals due to rounding. Aviation covers airports and airlines, maritime covers cruise and ferries, land covers downtown shops and border crossings. Economic impacts in each sub-region were calculated using available multipliers from Input Output tables for representative countries within sub-region. Further information on the economic multipliers used in the study can be found in Appendix B.

Economic Impact of Duty Free and Travel Retail in the Asia Pacific Region – FINAL REPORT 15 October 2019 91
8 Conclusions and Key Messages
The duty free and travel retail industry is a fast-growing sector of the Asia Pacific economy that comprises the sale of goods to international travellers.267 Duty free and travel retail is available for purchase at airports and on airlines, on cruises and ferries, and also at downtown duty free shops and land border crossings. In addition to duty free, full-retail shops (referred to as travel retail) are also available to travellers. These non-duty free offerings can include convenience stores, book stores, and specialty stores selling fully taxable goods or services located post-security in airports or on cruise and ferry ships.
The duty free and travel retail sector contributes significantly to the economic development of countries in the Asia Pacific region through the employment and activity it generates. Furthermore, it supports and facilitates wider economic activity in other industry sectors, such as aviation, maritime travel, and tourism, supporting the growth and development of economies in the region.
267 Duty Free World Council (http://dfworldcouncil.com/what-is-duty free-travel-retail/). The Duty Free World Council, the DFWC, is the industry association representing the interests of the global duty free and travel retail channel and has the overall objective of creating the optimal operating environment for the industry that will allow it to achieve its full potential.
Key Findings
▪ In 2017, US$36.2 billion was spent on duty free and travel retail in the Asia Pacific region. The principal components included the following:
o Airports and airlines accounted for nearly US$21.2 billion in duty free and travel retail sales, of which 75% occurred in the sub-region of East Asia.
• Non-aeronautical revenues such as duty free and travel retail provide airports with the funds needed to continue to invest in airport infrastructure and service improvements.
o Land and maritime duty free and travel retail sales amounted to approximately US$15 billion.
o 79% of all duty free and travel retail sales in the region occurred in East Asia.
▪ Duty free and travel retail spending in the Asia Pacific region accounted for an estimated 140,900 direct jobs and US$7.6 billion in direct GDP.
▪ Together with the businesses that supply the goods and services (indirect impacts) and spending of employees in the wider economy (induced impacts), duty free and travel retail in Asia Pacific is estimated to support a total of 320,200 jobs and US$14.7 billion in GDP.

92 Economic Impact of Duty Free and Travel Retail in the Asia Pacific Region – FINAL REPORT 15 October 2019.
8.1 Key Attributes of Asia Pacific’s Duty Free and Travel Retail Industry
The Asia Pacific region accounts for roughly 60% of the world’s population. The global duty free and travel retail industry had sales estimated to total US$69 billion in 2017. According to Generation Research, the Asia Pacific region is estimated to account for approximately 45% of global sales, or approximately US$32 billion.268 Based on an analysis that re-estimates airport sales in the region using other industry sources, InterVISTAS estimates that duty free and travel retail sales in Asia Pacific could be even higher, at approximately US$36 billion in 2017.
The region is home to many different countries, cultures, political systems, and stages of economic development. Asia Pacific’s duty free and travel retail sector has the following key attributes:
• Continuing Duty Free and Travel Retail Sector Growth. The region is the global leader in duty free and travel retail sales and its growth trajectory will continue to be positive. From 2000-2017, the region’s sector grew at an average of 13% per annum. This compares to the global average of 8% per annum. Europe and the Americas had lower annual average growth rates over the same time frame at 4% and 5%, respectively. The Asia Pacific region has vast potential for continued future growth due to the region’s large population base and growing economies which are resulting in rising incomes, increasing buying power and appetite for products, and an increasing desire and propensity to travel. These are all key ingredients for the continued growth and development of the duty free and travel retail sector in the region.
• Increasing Propensity to Travel by Chinese Travellers. Mainland China accounts for 36% of the Asia Pacific region’s population and over 40% of its estimated GDP. The development of Chinese travel and tourism has been and will continue to be vital to the growth of the region’s duty free and travel retail sector. With improving living standards, Mainland Chinese residents have shown a growing propensity to travel, and due to their numbers and purchasing power, they have a significant impact on the duty free and travel retail sector throughout the region and beyond. The sector has had to cater to Chinese shoppers’ product demands (e.g., availability of luxury brands) and service requirements (e.g., availability of mobile payment technologies like WeChat Pay or AliPay). Korean duty free sales have been a major beneficiary of Chinese demand, which is largely supported by the daigou trade.269
• Potential for Increased Travel by Indian Travellers. The growth of the Indian economy and of its middle class has increased the desire to travel, with airports in the country building up their duty free and travel retail offerings as a result. Currently, locals are the main customers, with many ordering their duty free goods for delivery or pick-up after they have arrived home from their international travel.
• Increasing Presence of Downtown Shops. In Asia Pacific, and especially Korea, there has been a proliferation of downtown duty free shops. These shops provide travellers with opportunities to purchase goods at any time during their trip, rather than just before departure (e.g., at the airport). Many duty free and travel retail operators in the region have operations at both downtown and airport locations (e.g., DFS at Hong Kong International Airport and in Causeway Bay/Tsim Sha Tsui (main shopping districts in Hong Kong/Kowloon)). The presence of downtown shops can therefore be complementary to an operator’s airport operations, though in other circumstances there is likely to be competition between airport and downtown locations and between operators.
268 Generation Research figures listed in this report incorporate the Indian Subcontinent as part of the Asia Pacific region. This is in contrast to the conventional regional breakdowns used by Generation Research, which include the Indian Subcontinent as part of the Middle East region. 269 “Daigou” or “surrogate shopping” involves buying products abroad (usually luxury goods) and selling to customers located in China. This is discussed in more detail in Sections 3.3.1 and 3.3.2.

Economic Impact of Duty Free and Travel Retail in the Asia Pacific Region – FINAL REPORT 15 October 2019 93
• More Asians are Cruising. Cruising is a relatively new travel experience for Asians but is growing in popularity. In comparison to more established cruise markets, Asians prefer cruises of shorter duration (e.g., 4 to 5 days) and to travel in larger party sizes that include extended family and multiple generations. This has implications for on-board duty free and travel retail sales; there is less time to shop and potentially fewer active shoppers in family groups. Nevertheless, Asian travellers’ increased propensity to cruise is reflected in the expansion and tailoring of cruise ship duty free offerings to this growing market.
• Growing Importance of E-Commerce. The Asia Pacific region is the global leader in the development, diffusion, and use of e-commerce and related technologies. Duty free and travel retail operators have developed apps designed to attract and entice customers to buy products by offering discounts and other incentives (e.g., Red by Dufry). Airports in the Asia Pacific region also have well-developed internet and e-commerce platforms to service their customers, with several airports providing visitors with the ability to purchase goods online which are then available for pick-up at the airport.
8.2 Estimated Duty Free and Travel Retail Sales in Asia Pacific
Total duty free and travel retail sales in the Asia Pacific region are estimated as high as US$36 billion
in 2017.270 Nearly 60% of revenues are attributable to aviation sales channels at over US$21 billion.
The remaining US$15 billion in sales revenues are handled through the cruise, ferry, land border, and
downtown shops. East Asia dominates with the lion’s share of sales revenue across all sales
channels at nearly US$29 billion. Table 8-1 summarizes the estimated duty free and travel retail sales
in the Asia Pacific region in 2017.
270 This figure incorporates InterVISTAS’ estimates of duty free and travel retail sales at airports, using data from ACI and Moodie Davitt, which are higher than airport sales reported by Generation Research. These figures are used as the basis for the economic impact analysis for airports, presented in Section 7. Bottom-line sales figures for airlines, ferries, and “other” sales channels are consistent with information from Generation Research and used in the computations of economic impact that are displayed in Section 7.
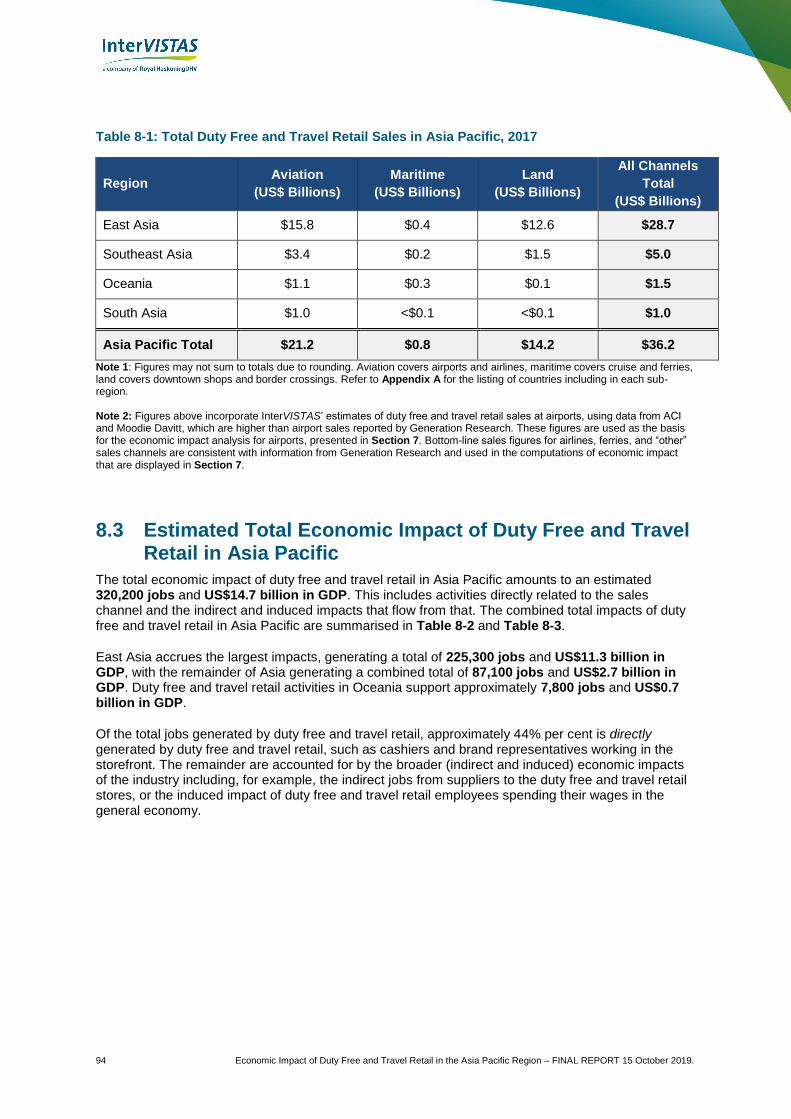
94 Economic Impact of Duty Free and Travel Retail in the Asia Pacific Region – FINAL REPORT 15 October 2019.
Table 8-1: Total Duty Free and Travel Retail Sales in Asia Pacific, 2017
Region Aviation
(US$ Billions)
Maritime
(US$ Billions)
Land
(US$ Billions)
All Channels
Total
(US$ Billions)
East Asia $15.8 $0.4 $12.6 $28.7
Southeast Asia $3.4 $0.2 $1.5 $5.0
Oceania $1.1 $0.3 $0.1 $1.5
South Asia $1.0 <$0.1 <$0.1 $1.0
Asia Pacific Total $21.2 $0.8 $14.2 $36.2
Note 1: Figures may not sum to totals due to rounding. Aviation covers airports and airlines, maritime covers cruise and ferries, land covers downtown shops and border crossings. Refer to Appendix A for the listing of countries including in each sub-region. Note 2: Figures above incorporate InterVISTAS’ estimates of duty free and travel retail sales at airports, using data from ACI and Moodie Davitt, which are higher than airport sales reported by Generation Research. These figures are used as the basis for the economic impact analysis for airports, presented in Section 7. Bottom-line sales figures for airlines, ferries, and “other” sales channels are consistent with information from Generation Research and used in the computations of economic impact that are displayed in Section 7.
8.3 Estimated Total Economic Impact of Duty Free and Travel Retail in Asia Pacific
The total economic impact of duty free and travel retail in Asia Pacific amounts to an estimated 320,200 jobs and US$14.7 billion in GDP. This includes activities directly related to the sales channel and the indirect and induced impacts that flow from that. The combined total impacts of duty free and travel retail in Asia Pacific are summarised in Table 8-2 and Table 8-3.
East Asia accrues the largest impacts, generating a total of 225,300 jobs and US$11.3 billion in GDP, with the remainder of Asia generating a combined total of 87,100 jobs and US$2.7 billion in GDP. Duty free and travel retail activities in Oceania support approximately 7,800 jobs and US$0.7 billion in GDP.
Of the total jobs generated by duty free and travel retail, approximately 44% per cent is directly generated by duty free and travel retail, such as cashiers and brand representatives working in the storefront. The remainder are accounted for by the broader (indirect and induced) economic impacts of the industry including, for example, the indirect jobs from suppliers to the duty free and travel retail stores, or the induced impact of duty free and travel retail employees spending their wages in the general economy.

Economic Impact of Duty Free and Travel Retail in the Asia Pacific Region – FINAL REPORT 15 October 2019 95
Table 8-2: Total Employment Economic Impacts in Asia Pacific, 2017
Region Aviation
Total Jobs
Maritime
Total Jobs
Land
Total Jobs
All Channels
Total Jobs
East Asia 151,600 3,400 70,200 225,300
Southeast Asia 48,400 2,300 19,300 70,000
Oceania 5,800 1,300 700 7,800
South Asia 16,300 200 600 17,100
Asia Pacific Total 222,100 7,300 90,800 320,200
Note: Figures may not sum to totals due to rounding. Aviation covers airports and airlines, maritime covers cruise and ferries, land covers downtown shops and border crossings. Economic impacts in each sub-region were calculated using available multipliers from Input Output tables for representative countries within sub-region. Further information on the economic multipliers used in the study can be found in Appendix B.
Table 8-3: Total GDP Economic Impacts in Asia Pacific, 2017
Region
Aviation
Total GDP
(US$ Billions)
Maritime
Total GDP
(US$ Billions)
Land
Total GDP
(US$ Billions)
All Channels
Total GDP
(US$ Billions)
East Asia $6.7 $0.1 $4.5 $11.3
Southeast Asia $1.5 $0.1 $0.6 $2.2
Oceania $0.5 $0.1 $0.1 $0.7
South Asia $0.5 <$0.1 <$0.1 $0.5
Asia Pacific Total $9.2 $0.3 $5.2 $14.7
Note: Figures may not sum to totals due to rounding. Aviation covers airports and airlines, maritime covers cruise and ferries, land covers downtown shops and border crossings. Economic impacts in each sub-region were calculated using available multipliers from Input Output tables for representative countries within sub-region. Further information on the economic multipliers used in the study can be found in Appendix B.
In addition to these quantified economic impacts, duty free and travel retail is a key part of the financing of associated transport infrastructure. In particular, the business case for airport development (with associated benefits in terms of enhanced connectivity and resulting economic growth and passenger service) will take account of the potential for retail revenues. In their absence airport charges would have to be higher or development delayed.
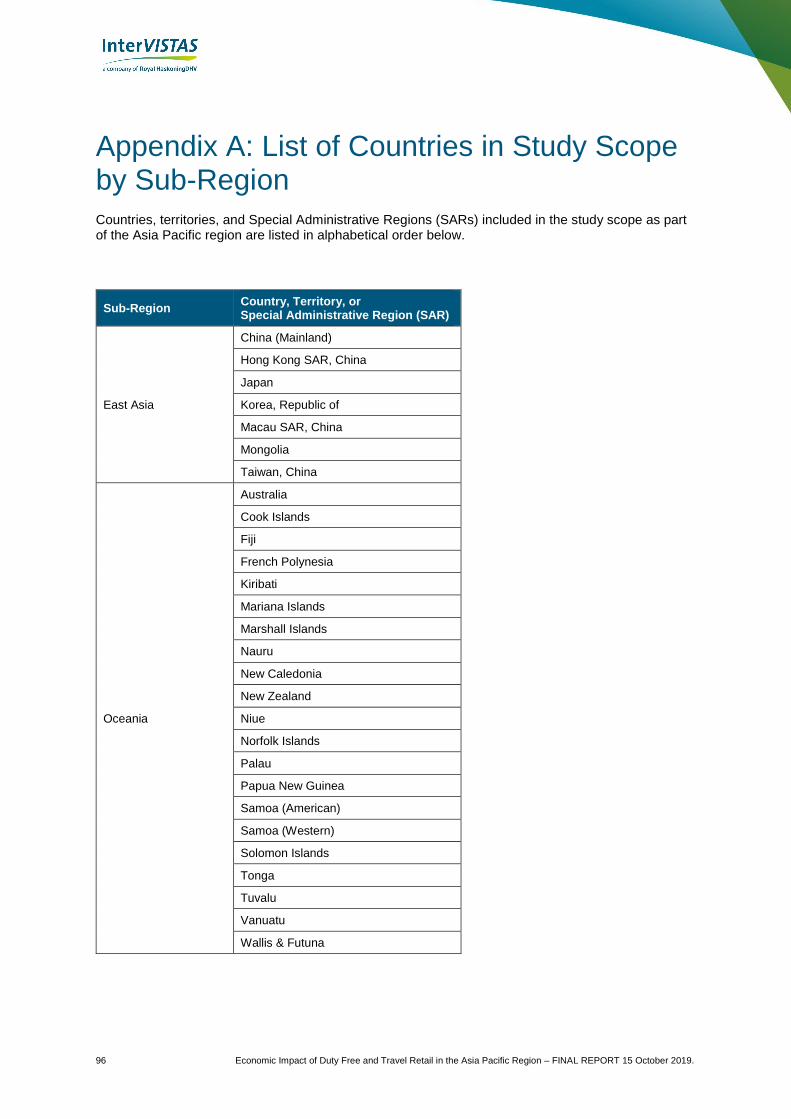
96 Economic Impact of Duty Free and Travel Retail in the Asia Pacific Region – FINAL REPORT 15 October 2019.
Appendix A: List of Countries in Study Scope by Sub-Region
Countries, territories, and Special Administrative Regions (SARs) included in the study scope as part of the Asia Pacific region are listed in alphabetical order below.
Sub-Region Country, Territory, or Special Administrative Region (SAR)
East Asia
China (Mainland)
Hong Kong SAR, China
Japan
Korea, Republic of
Macau SAR, China
Mongolia
Taiwan, China
Oceania
Australia
Cook Islands
Fiji
French Polynesia
Kiribati
Mariana Islands
Marshall Islands
Nauru
New Caledonia
New Zealand
Niue
Norfolk Islands
Palau
Papua New Guinea
Samoa (American)
Samoa (Western)
Solomon Islands
Tonga
Tuvalu
Vanuatu
Wallis & Futuna
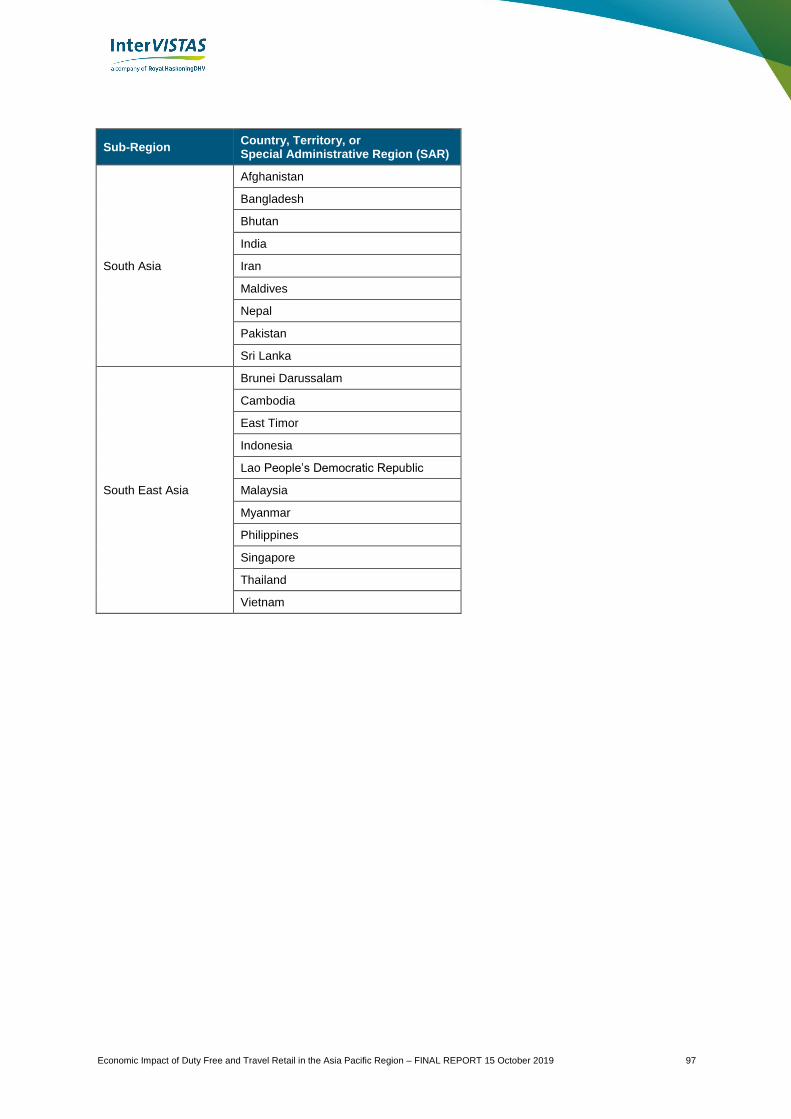
Economic Impact of Duty Free and Travel Retail in the Asia Pacific Region – FINAL REPORT 15 October 2019 97
Sub-Region Country, Territory, or Special Administrative Region (SAR)
South Asia
Afghanistan
Bangladesh
Bhutan
India
Iran
Maldives
Nepal
Pakistan
Sri Lanka
South East Asia
Brunei Darussalam
Cambodia
East Timor
Indonesia
Lao People’s Democratic Republic
Malaysia
Myanmar
Philippines
Singapore
Thailand
Vietnam

98 Economic Impact of Duty Free and Travel Retail in the Asia Pacific Region – FINAL REPORT 15 October 2019.
Appendix B: Economic Multipliers and Input-Output Tables
Economic multipliers were applied to the total sales figures to estimate the associated direct employment and GDP contribution impacts. Indirect and induced effects were also estimated using economic multipliers, as is common practice for economic impact studies.
These multipliers were based on Input-Output models of the national economy in each country in the Asia Pacific region. An Input-Output model is a representation of the flows of economic activity within a region or country. The model captures what each business or sector must purchase from every other sector in order to produce a dollar’s worth of goods or services. Using such a model, flows of economic activity associated with any change in spending may be traced either forwards (spending generating income which induces further spending) or backwards (for example visitor purchases of meals leads restaurants to purchase additional inputs: groceries and utilities, etc.).
By tracing these linkages between sectors, Input-Output models can estimate indirect and induced impacts. These indirect and induced impacts are represented by economic multipliers, normally expressed as a ratio of total impacts (direct plus indirect plus induced) to direct impacts. Using the Input-Output model, multipliers can be produced for employment and GDP contribution, normally expressed in terms of a unit of direct impact, such as per direct job.
The size of these economic multipliers is a function of a number of factors:
• The nature of the industry or economic sector under consideration. Multipliers vary across different industries within the economy based on the mix of labour and other inputs, and the propensity of each industry to buy goods and services from within the economy. Some industries require large amounts of goods and services from other sectors of the economy, and therefore, have large multiplier impacts. Other sectors are more labour intensive and require fewer inputs from other sectors of the economy, resulting in smaller multiplier impacts.
• The amount of imports needed as an input to production. Industries or economic sectors that require large amount of imports have lower multiplier impacts as this part of the spending goes outside of the national economy (in essence, this part of the multiplier impact is occurring in another country).
• Propensity to consume domestic goods. The spending patterns of consumers in the national economy will affect the induced impacts. The greater the propensity to consume domestically produced goods and services, the greater is the multiplier effect. Similarly, higher spending on imports or higher savings rates will dampen the induced multiplier.
• Government taxation and spending has a complex influence on the size of the multiplier impacts. Higher taxation rates can dampen multiplier impacts, although this can be offset by how the government chooses to spend these tax revenues.
As with any model of a complex economy, Input-Output models have their limitations. Nevertheless, Input-Output models are the most widely accepted and well-established means for estimating indirect and induced impacts and are based on real data unparalleled in its detail and breadth.
It was not possible to obtain Input-Output tables for all countries in the Asia Pacific region. For those countries, multipliers were used from the country that most closely matched the GDP per capita of the country with missing data. Table B-1 summarises the multipliers used in the study, based on the availability of Input-Output tables.

Economic Impact of Duty Free and Travel Retail in the Asia Pacific Region – FINAL REPORT 15 October 2019 99
Table B-1: Summary of Input-Output Tables
Country Sub-Region Year(s) data
relates to Source
Australia Oceania 2015-16 Australian Bureau of Statistics
Cambodia South Eastern Asia 2010-17 Asia Development Bank
China East Asia 2010-17 Asia Development Bank
Hong Kong East Asia 2010-17 Asia Development Bank
India South Asia 2010-17 Asia Development Bank
Indonesia South Eastern Asia 2010-17 Asia Development Bank
Japan East Asia 2010-17 Asia Development Bank
Malaysia South Eastern Asia 2010-17 Asia Development Bank
New Zealand Oceania 2013 Statistics New Zealand
Republic of Korea East Asia 2010-17 Asia Development Bank
Singapore South Eastern Asia 2014 Singapore Department of Statistics
Sri Lanka South Asia 2010-17 Asia Development Bank
Thailand South Eastern Asia 2010-17 Asia Development Bank
Vietnam South Eastern Asia 2010-17 Asia Development Bank
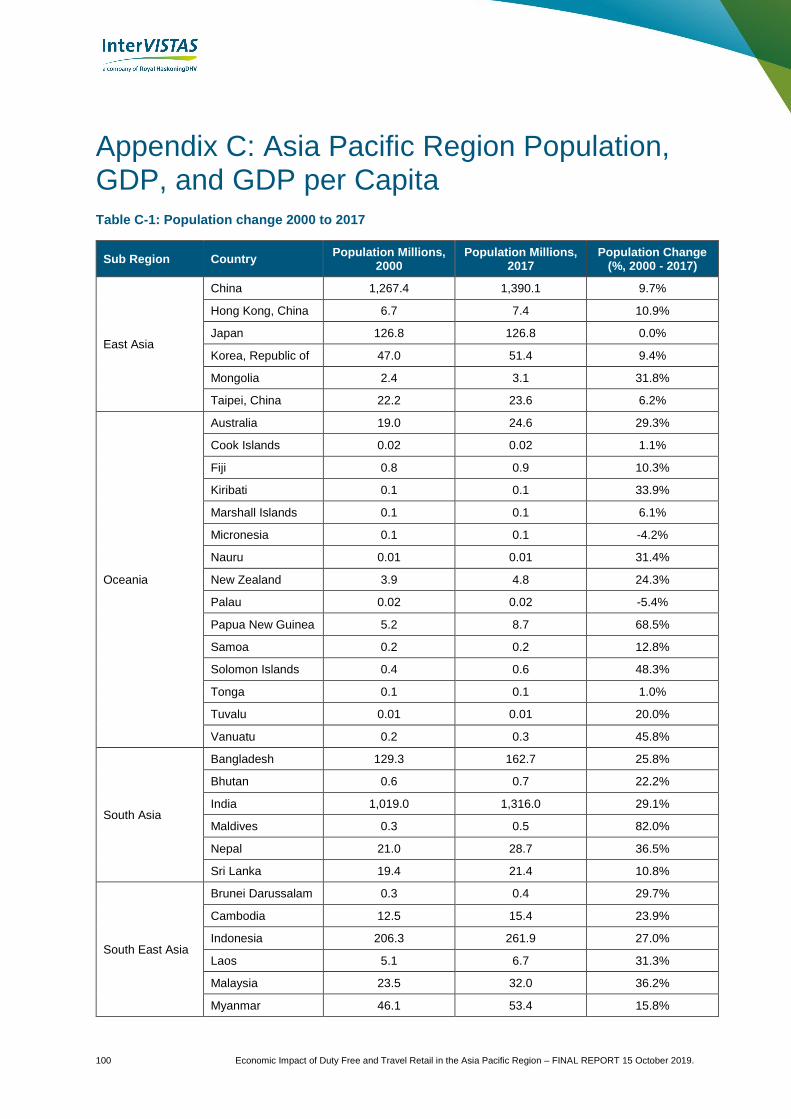
100 Economic Impact of Duty Free and Travel Retail in the Asia Pacific Region – FINAL REPORT 15 October 2019.
Appendix C: Asia Pacific Region Population, GDP, and GDP per Capita
Table C-1: Population change 2000 to 2017
Sub Region Country Population Millions,
2000 Population Millions,
2017 Population Change
(%, 2000 - 2017)
East Asia
China 1,267.4 1,390.1 9.7%
Hong Kong, China 6.7 7.4 10.9%
Japan 126.8 126.8 0.0%
Korea, Republic of 47.0 51.4 9.4%
Mongolia 2.4 3.1 31.8%
Taipei, China 22.2 23.6 6.2%
Oceania
Australia 19.0 24.6 29.3%
Cook Islands 0.02 0.02 1.1%
Fiji 0.8 0.9 10.3%
Kiribati 0.1 0.1 33.9%
Marshall Islands 0.1 0.1 6.1%
Micronesia 0.1 0.1 -4.2%
Nauru 0.01 0.01 31.4%
New Zealand 3.9 4.8 24.3%
Palau 0.02 0.02 -5.4%
Papua New Guinea 5.2 8.7 68.5%
Samoa 0.2 0.2 12.8%
Solomon Islands 0.4 0.6 48.3%
Tonga 0.1 0.1 1.0%
Tuvalu 0.01 0.01 20.0%
Vanuatu 0.2 0.3 45.8%
South Asia
Bangladesh 129.3 162.7 25.8%
Bhutan 0.6 0.7 22.2%
India 1,019.0 1,316.0 29.1%
Maldives 0.3 0.5 82.0%
Nepal 21.0 28.7 36.5%
Sri Lanka 19.4 21.4 10.8%
South East Asia
Brunei Darussalam 0.3 0.4 29.7%
Cambodia 12.5 15.4 23.9%
Indonesia 206.3 261.9 27.0%
Laos 5.1 6.7 31.3%
Malaysia 23.5 32.0 36.2%
Myanmar 46.1 53.4 15.8%
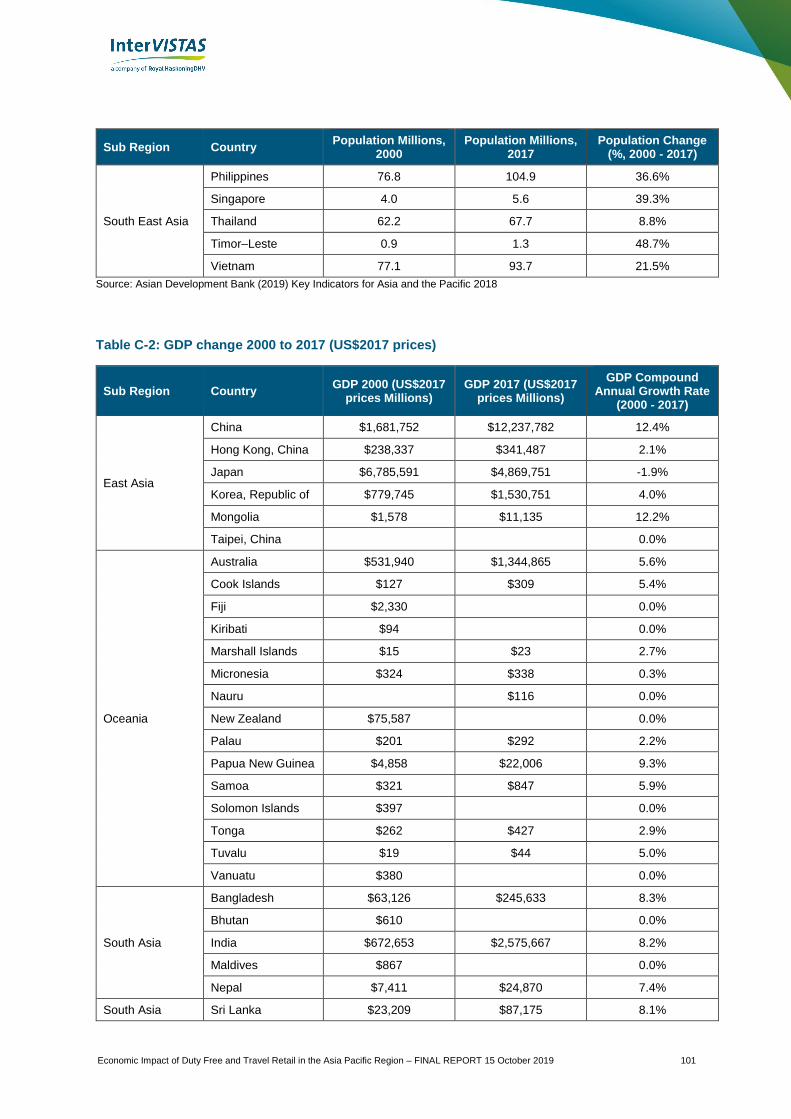
Economic Impact of Duty Free and Travel Retail in the Asia Pacific Region – FINAL REPORT 15 October 2019 101
Sub Region Country Population Millions,
2000 Population Millions,
2017 Population Change
(%, 2000 - 2017)
South East Asia
Philippines 76.8 104.9 36.6%
Singapore 4.0 5.6 39.3%
Thailand 62.2 67.7 8.8%
Timor–Leste 0.9 1.3 48.7%
Vietnam 77.1 93.7 21.5%
Source: Asian Development Bank (2019) Key Indicators for Asia and the Pacific 2018
Table C-2: GDP change 2000 to 2017 (US$2017 prices)
Sub Region Country GDP 2000 (US$2017
prices Millions) GDP 2017 (US$2017
prices Millions)
GDP Compound Annual Growth Rate
(2000 - 2017)
East Asia
China $1,681,752 $12,237,782 12.4%
Hong Kong, China $238,337 $341,487 2.1%
Japan $6,785,591 $4,869,751 -1.9%
Korea, Republic of $779,745 $1,530,751 4.0%
Mongolia $1,578 $11,135 12.2%
Taipei, China 0.0%
Oceania
Australia $531,940 $1,344,865 5.6%
Cook Islands $127 $309 5.4%
Fiji $2,330 0.0%
Kiribati $94 0.0%
Marshall Islands $15 $23 2.7%
Micronesia $324 $338 0.3%
Nauru $116 0.0%
New Zealand $75,587 0.0%
Palau $201 $292 2.2%
Papua New Guinea $4,858 $22,006 9.3%
Samoa $321 $847 5.9%
Solomon Islands $397 0.0%
Tonga $262 $427 2.9%
Tuvalu $19 $44 5.0%
Vanuatu $380 0.0%
South Asia
Bangladesh $63,126 $245,633 8.3%
Bhutan $610 0.0%
India $672,653 $2,575,667 8.2%
Maldives $867 0.0%
Nepal $7,411 $24,870 7.4%
South Asia Sri Lanka $23,209 $87,175 8.1%
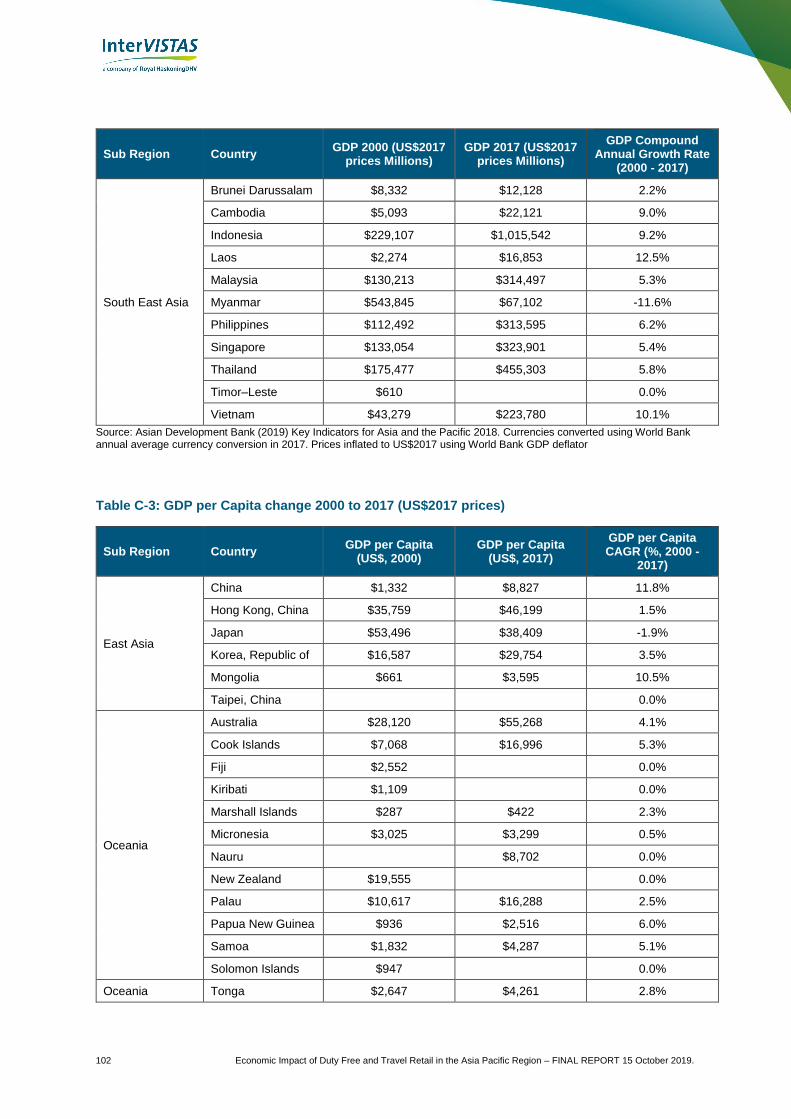
102 Economic Impact of Duty Free and Travel Retail in the Asia Pacific Region – FINAL REPORT 15 October 2019.
Sub Region Country GDP 2000 (US$2017
prices Millions) GDP 2017 (US$2017
prices Millions)
GDP Compound Annual Growth Rate
(2000 - 2017)
South East Asia
Brunei Darussalam $8,332 $12,128 2.2%
Cambodia $5,093 $22,121 9.0%
Indonesia $229,107 $1,015,542 9.2%
Laos $2,274 $16,853 12.5%
Malaysia $130,213 $314,497 5.3%
Myanmar $543,845 $67,102 -11.6%
Philippines $112,492 $313,595 6.2%
Singapore $133,054 $323,901 5.4%
Thailand $175,477 $455,303 5.8%
Timor–Leste $610 0.0%
Vietnam $43,279 $223,780 10.1%
Source: Asian Development Bank (2019) Key Indicators for Asia and the Pacific 2018. Currencies converted using World Bank annual average currency conversion in 2017. Prices inflated to US$2017 using World Bank GDP deflator
Table C-3: GDP per Capita change 2000 to 2017 (US$2017 prices)
Sub Region Country GDP per Capita
(US$, 2000) GDP per Capita
(US$, 2017)
GDP per Capita CAGR (%, 2000 -
2017)
East Asia
China $1,332 $8,827 11.8%
Hong Kong, China $35,759 $46,199 1.5%
Japan $53,496 $38,409 -1.9%
Korea, Republic of $16,587 $29,754 3.5%
Mongolia $661 $3,595 10.5%
Taipei, China 0.0%
Oceania
Australia $28,120 $55,268 4.1%
Cook Islands $7,068 $16,996 5.3%
Fiji $2,552 0.0%
Kiribati $1,109 0.0%
Marshall Islands $287 $422 2.3%
Micronesia $3,025 $3,299 0.5%
Nauru $8,702 0.0%
New Zealand $19,555 0.0%
Palau $10,617 $16,288 2.5%
Papua New Guinea $936 $2,516 6.0%
Samoa $1,832 $4,287 5.1%
Solomon Islands $947 0.0%
Oceania Tonga $2,647 $4,261 2.8%

Economic Impact of Duty Free and Travel Retail in the Asia Pacific Region – FINAL REPORT 15 October 2019 103
Sub Region Country GDP per Capita
(US$, 2000) GDP per Capita
(US$, 2017)
GDP per Capita CAGR (%, 2000 -
2017)
Tuvalu $2,013 $3,837 3.9%
Vanuatu $1,988 0.0%
South Asia
Bangladesh $493 $1,519 6.8%
Bhutan $1,024 0.0%
India $660 $1,957 6.6%
Maldives $3,209 0.0%
Nepal $352 $866 5.4%
Sri Lanka $1,199 $4,065 7.4%
South East Asia
Brunei Darussalam $25,652 $28,787 0.7%
Cambodia $409 $1,432 7.7%
Indonesia $1,111 $3,878 7.6%
Laos $447 $2,522 10.7%
Malaysia $5,543 $9,828 3.4%
Myanmar $11,798 $1,257 -12.3%
Philippines $1,460 $2,989 4.3%
Singapore $33,033 $57,713 3.3%
Thailand $2,819 $6,725 5.2%
Timor–Leste $700 0.0%
Vietnam $561 $2,389 8.9%
Source: Asian Development Bank (2019) Key Indicators for Asia and the Pacific 2018. Currencies converted using World Bank annual average currency conversion in 2017. Prices inflated to US$2017 using World Bank GDP deflator

104 Economic Impact of Duty Free and Travel Retail in the Asia Pacific Region – FINAL REPORT 15 October 2019.
Appendix D: Air Travel Patterns within the Asia Pacific Region
Table D-1: Origin-Destination Passenger Traffic (millions of passengers in 2017)
Country/Region Total Within Asia
Pacific Rest of World
% Outside Asia Pacific Region
Mainland China 623.0 592.8 30.3 4.9%
Japan 180.8 162.6 18.2 10.0%
India 166.5 125.0 41.6 25.0%
Indonesia 137.2 131.4 5.8 4.3%
Thailand 95.3 82.4 12.9 13.6%
South Korea 93.8 81.4 12.4 13.2%
Australia 93.3 80.7 12.6 13.5%
Malaysia 64.8 60.2 4.6 7.1%
Vietnam 52.2 47.9 4.2 8.1%
Philippines 50.7 41.6 9.2 18.1%
Hong Kong SAR 50.3 42.5 7.9 15.7%
Taiwan 48.6 44.9 3.7 7.6%
Singapore 45.0 40.2 4.8 10.6%
New Zealand 25.3 21.7 3.6 14.3%
Bangladesh 11.0 5.5 5.5 50.1%
Cambodia 8.5 7.8 0.7 7.7%
Myanmar 8.3 7.9 0.5 5.6%
Sri Lanka 7.0 3.3 3.7 52.7%
Macau SAR 7.0 6.9 0.0 0.6%
Nepal 5.5 3.5 2.0 36.8%
Papua New Guinea 2.8 2.8 0.1 2.6%
Laos 2.6 2.4 0.1 5.2%
Bhutan 0.4 0.4 0.0 0.1%
North Korea 0.1 0.1 0.0 20.2%

Economic Impact of Duty Free and Travel Retail in the Asia Pacific Region – FINAL REPORT 15 October 2019 105
Figure D-2: Origin-Destination Passenger Traffic in the Asia Pacific Region
Source: Sabre AirVision Market Intelligence 2017 Data (Accessed February 2019), InterVISTAS analysis

106 Economic Impact of Duty Free and Travel Retail in the Asia Pacific Region – FINAL REPORT 15 October 2019.
Appendix E: Duty Free Limits within Asia Pacific Region
Table E-1: Duty free allowances of countries in the Asia Pacific Region
Country Total Value Alcohol Tobacco Other Limits / Restrictions
Source
Australia A$900 (US$690) for adults 18+ (A$450 (US$350) for <18)
2.25l alcohol 25g tobacco in
any form
Australian Government
Bangladesh 2 bottles of spirits (not exceeding a
total of 2l)
200 cigarettes, or 50 cigars, or
225g of tobacco
BDT3000 (US$35) Jewellery
Bangladesh Government
Bhutan US$1,000 2 bottles of
alcohol (1l max per bottle)
Electronics
limited to one item
Bhutan Government
Cambodia 2l wine 400 cigarettes or
400g tobacco HK Express
China
¥5000 (US$740) (for residents)
¥2000 (US$295) (for non-residents)
1.5l of alcohol (<12%)
400 cigarettes, 100 cigars, 500g
tobacco
Chinese Government
Hong Kong - China
1l alcohol (>30%) 19 cigarettes/1
cigar/25g tobacco
Residents must have spent more
than 24 hours outside of Hong
Kong
Hong Kong Government
India 2l wine or liquor 100 cigarettes, or
25 cigars, or 125g tobacco
0.25l perfume Indian
Government
Indonesia 1l alcohol 200 cigarettes, or
25 cigars, or 100g tobacco
US$250 personal goods per passenger
(US$1000 per family)
IATA Travel Centre
Japan JP¥200,000 (US$1,780)
3 bottles of alcohol (760ml per bottle max)
400 locally manufactured cigarettes and
400 foreign manufactured
cigarettes
59ml of perfume HK Express
Korea 1 litre alcohol 200 cigarettes or 20 cigars or 250g
tobacco 60ml perfume HK Express
Laos 2l liquor or wine,
or 5l beer
200 cigarettes, or 500 cigars, or 250g tobacco
1 item of perfume IATA Travel
Centre
Macau -China
MOP$5,000 (US$625)
1l alcohol (>30%) 19 cigarettes, or 1 cigar, or 25g
tobacco
IATA Travel Centre
Malaysia RM$400 (US$93) (excludes alcohol
and tobacco) 1l alcohol
200 cigarettes, or 50 cigars, or 225g tobacco
Residents must have spent more
than 72 hours outside Malaysia
Malaysian Government
Myanmar 2l alcohol 400 cigarettes, 50 cigars, 250g
tobacco 0.15l perfume
IATA Travel Centre

Economic Impact of Duty Free and Travel Retail in the Asia Pacific Region – FINAL REPORT 15 October 2019 107
Country Total Value Alcohol Tobacco Other Limits / Restrictions
Source
Nepal
Whisky or wine not exceeding
1.15l or 12 cans of beer
250 cigarettes, 50 cigars, 20g
tobacco
IATA Travel Centre
New Zealand
NZ$700 (US$495) total goods
(excludes alcohol and tobacco)
4.5l wine or beer, 3 bottles of spirits (1.125l per bottle)
50 cigarettes or 50g cigars /
tobacco
New Zealand
Government
North Korea N/A N/A N/A N/A N/A
Pakistan Prohibited 200 cigarettes, or
50 cigars, or 500g tobacco
Gifts totalling ₨2,000 (US$19),
₨1,000 (US$9.50), ₨0 (US$0) for 1st,
2nd, 3rd (and any subsequent
visits) within one calendar year
IATA Travel Centre
Papua New Guinea
K1,000 (US$310) for adults 18+ (K500 (US$155) for <18)
2l alcohol 250 cigarettes, or
250g tobacco 1l perfume
Papa New Guinea
Government
Philippines 2 bottles of
alcohol (1l max per bottle)
400 cigarettes, or 50 cigars, or 250g tobacco
Duty free allowance only
once per passenger per
year
Philippine Government
Singapore
S$150 (US$110) Goods and Services Tax relief if less than
48 hours outside Singapore, S$600
(US$435) GST relief if 48+ hours outside
Singapore
1l each of spirits, wine, beer (or 2l wine/1l beer or 2l
beer/1l wine)
Singapore
Government
Sri Lanka
US$187.50 if <90 days abroad,
US$625 if >90 days, US$1,750 if >365
days
2 regular sized bottles of wine, 1.5l of spirits
0.25l perfume, value not exceeding US$250
Sri Lankan Government
Taiwan NT$20,000 (US$630)
1l alcohol 200 cigarettes, or
25 cigars, or 500g of tobacco
Taiwanese
Government
Thailand ฿80,000 (US$2,350) 1l alcohol 200 cigarettes or
250g cigars / tobacco
Thai
Government
Vietnam 1.5l alcohol (>20% or 2l
<20% or 3l beer)
200 cigarettes or 250g tobacco
Other items with a total value over VN₫10,000,000
(US$450)
Vietnamese Government
Note: US$ comparison based on World Bank official annual average exchange rates for 2017. Taiwan dollar exchange rate based on IRS 2017 annual estimate of 31.683 TWD to 1US$. N/A indicates information was unavailable.

Prepared by
InterVISTAS Consulting Inc.
Airport Square – Suite 550 1200 West 73rd Avenue Vancouver, BC Canada V6P 6G5
Telephone: +1-604-717-1800 Facsimile: +1-604-717-1818
www.intervistas.com