asiaexjapanequity templetonasiangrowthfund 31.07 · franklin templeton investment funds - templeton...
TRANSCRIPT
Franklin Templeton Investment Funds
Templeton Asian Growth FundAsia ex Japan Equity
31.07.2018
Fund Fact Sheet
E-Mail Web
[email protected] www.franklintempleton.com.hk
For the source and calculation basis of Fund information, please refer to the *Explanatory Notes section.
Risk Considerations
The Fund invests in emerging market securities which are exposed to higher risk of economic, political and regulatorychanges that may pose additional risk to the Fund.The Fund's value may be affected by exchange control regulations and changes in exchange rates.The Fund may at its discretion pay dividends out of the capital or out of gross income of the Fund while paying all or part of
the Fund s fees and expenses out of the capital of the Fund, which results in effectively paying dividends out of capital.Payment of dividends out of capital amounts to a return or withdrawal of part of an investor s original investment or from any
capital gains attributable to that original investment.Any distributions involving payment of dividends out of the Fund s capital or payment of dividends effectively out of the
Fund s capital (as the case may be) may result in an immediate reduction of the net asset value per share.This investment involves risks which may result in loss of part or entire amount of your investment.Before you decide to invest, you should make sure the intermediary has explained to you that the Fund is suitable to you.Investors should not only base on this marketing material alone to make investment decisions.
Performance*
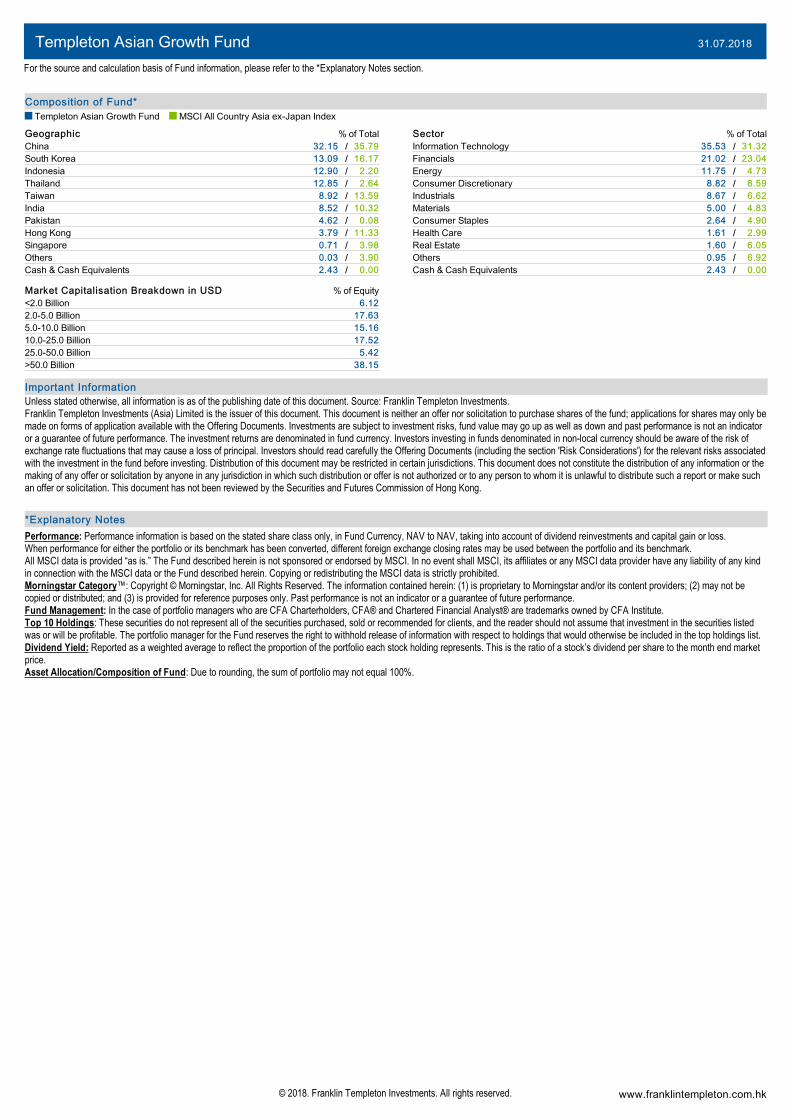
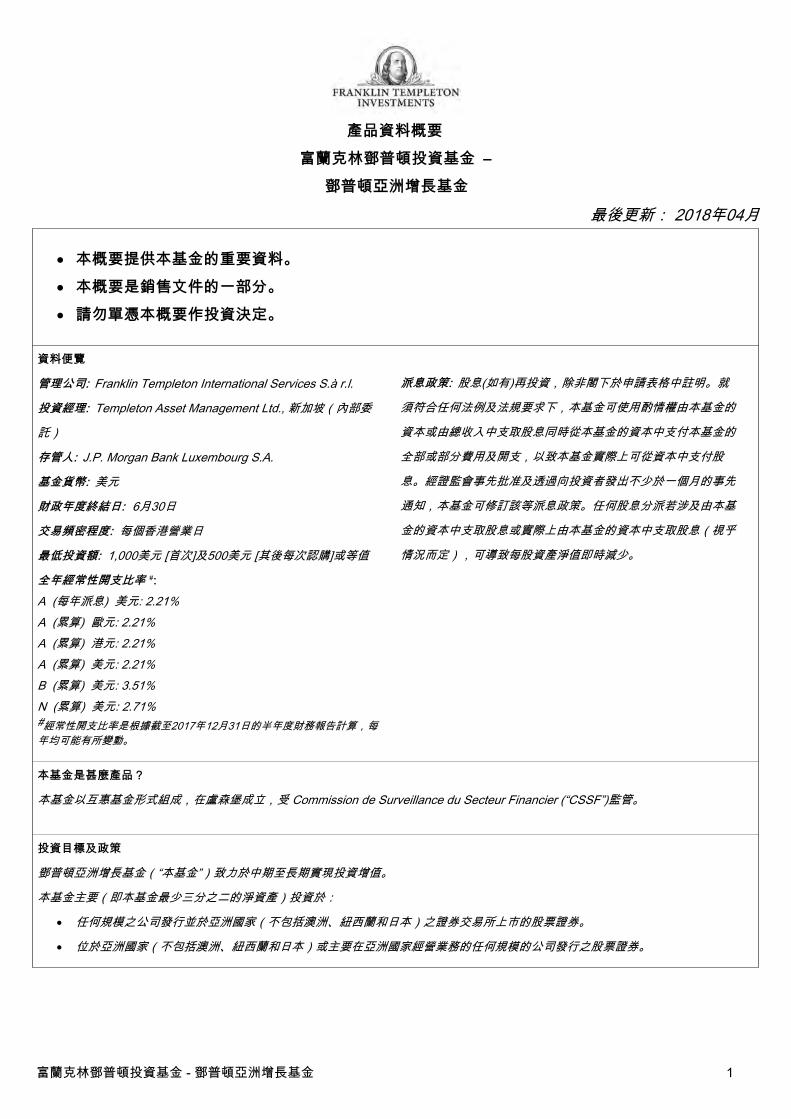
Performance over 5 Years in Share Class Currency (%)
Templeton Asian Growth Fund A (Ydis) USD
60
80
100
120
140
Fund Overview
Base Currency for Fund USD
Total Net Assets (USD) 3.74 billion
Fund Inception Date 16.04.1991
Number of Issuers 51
Benchmark MSCI All Country Asia
ex-Japan Index
Morningstar Category * Asia ex Japan Equity
07/13 01/14 07/14 01/15 07/15 01/16 07/16 01/17 07/17 01/18 07/18
Performance in Share Class Currency (%)
Cumulative
3 Mths YTD 1 Yr 3 Yrs 5 Yrs 10 Yrs Since Incept
A (Ydis) USD -6.47 -8.91 -3.47 18.89 10.26 55.17 286.02
Benchmark in USD -5.12 -3.77 5.50 33.13 48.76 83.86 659.64
Summary of Investment Objective
The Fund aims to achieve long-term capital appreciation
by investing primarily in equity securities listed in Asia
(excluding Australia, New Zealand and Japan).
Calendar Year Performance in Share Class Currency (%)
2017 2016 2015 2014 2013
A (Ydis) USD 29.60 19.46 -26.82 7.21 -7.78
Benchmark in USD 42.08 5.76 -8.90 5.11 3.33
Fund Management*
Sukumar Rajah: Singapore
Eric Mok, CFA: Hong Kong
Top Ten Holdings (% of Total)
Issuer Name
ALIBABA GROUP HOLDING LTD 9.60
SAMSUNG ELECTRONICS CO LTD 7.88
TAIWAN SEMICONDUCTOR MANUFACTURING CO LTD 6.81
BANK DANAMON INDONESIA TBK PT 6.29
TENCENT HOLDINGS LTD 4.86
BRILLIANCE CHINA AUTOMOTIVE HOLDINGS LTD 3.88
PTT EXPLORATION & PRODUCTION PCL 3.72
ALUMINUM CORP OF CHINA LTD 3.45
KASIKORNBANK PCL 3.28
OIL & GAS DEVELOPMENT CO LTD 3.21
Fund Measures
Price to Earnings (12-mo
Trailing)
13.86x
Price to Book 1.65x
Price to Cash Flow 6.86x
Dividend Yield 2.68%
Standard Deviation (5 Yrs) 14.25%
Asset Allocation*
%
Equity 97.57
Cash & Cash Equivalents 2.43
Offering Documents
Share Class Information
Fees Dividends Fund Identifiers
Share Class Incept Date NAV TER (%)
Max. Sales
Charge (%)
Mgmt.
Fee (%)
Max. Maint.
Charge (%)
Max. Serv.
Charge (%)
Last Paid
Date
Last Paid
Amount ISIN
A (Ydis) USD 30.06.1991 USD 32.72 2.21 5.00 1.35 0.50 N/A 09.07.2018 0.0990 LU0029875118
A (acc) EUR 25.10.2005 EUR 30.74 2.21 5.00 1.35 0.50 N/A N/A N/A LU0229940001
A (acc) HKD 30.09.2010 HKD 10.90 2.21 5.00 1.35 0.50 N/A N/A N/A LU0543330483
A (acc) USD 14.05.2001 USD 36.02 2.21 5.00 1.35 0.50 N/A N/A N/A LU0128522157
B (acc) USD 14.02.2007 USD 14.63 3.52 N/A 1.35 0.75 1.06 N/A N/A LU0285260591
Templeton Asian Growth Fund 31.07.2018
For the source and calculation basis of Fund information, please refer to the *Explanatory Notes section.
© 2018. Franklin Templeton Investments. All rights reserved. www.franklintempleton.com.hk
Composition of Fund*
Templeton Asian Growth Fund MSCI All Country Asia ex-Japan Index
Geographic % of Total
China 32.15 / 35.79
South Korea 13.09 / 16.17
Indonesia 12.90 / 2.20
Thailand 12.85 / 2.64
Taiwan 8.92 / 13.59
India 8.52 / 10.32
Pakistan 4.62 / 0.08
Hong Kong 3.79 / 11.33
Singapore 0.71 / 3.98
Others 0.03 / 3.90
Cash & Cash Equivalents 2.43 / 0.00
Sector % of Total
Information Technology 35.53 / 31.32
Financials 21.02 / 23.04
Energy 11.75 / 4.73
Consumer Discretionary 8.82 / 8.59
Industrials 8.67 / 6.62
Materials 5.00 / 4.83
Consumer Staples 2.64 / 4.90
Health Care 1.61 / 2.99
Real Estate 1.60 / 6.05
Others 0.95 / 6.92
Cash & Cash Equivalents 2.43 / 0.00
Market Capitalisation Breakdown in USD % of Equity
<2.0 Billion 6.12
2.0-5.0 Billion 17.63
5.0-10.0 Billion 15.16
10.0-25.0 Billion 17.52
25.0-50.0 Billion 5.42
>50.0 Billion 38.15
Important Information
Unless stated otherwise, all information is as of the publishing date of this document. Source: Franklin Templeton Investments.Franklin Templeton Investments (Asia) Limited is the issuer of this document. This document is neither an offer nor solicitation to purchase shares of the fund; applications for shares may only bemade on forms of application available with the Offering Documents. Investments are subject to investment risks, fund value may go up as well as down and past performance is not an indicatoror a guarantee of future performance. The investment returns are denominated in fund currency. Investors investing in funds denominated in non-local currency should be aware of the risk ofexchange rate fluctuations that may cause a loss of principal. Investors should read carefully the Offering Documents (including the section 'Risk Considerations') for the relevant risks associatedwith the investment in the fund before investing. Distribution of this document may be restricted in certain jurisdictions. This document does not constitute the distribution of any information or themaking of any offer or solicitation by anyone in any jurisdiction in which such distribution or offer is not authorized or to any person to whom it is unlawful to distribute such a report or make suchan offer or solicitation. This document has not been reviewed by the Securities and Futures Commission of Hong Kong.
*Explanatory Notes
Performance: Performance information is based on the stated share class only, in Fund Currency, NAV to NAV, taking into account of dividend reinvestments and capital gain or loss.When performance for either the portfolio or its benchmark has been converted, different foreign exchange closing rates may be used between the portfolio and its benchmark.All MSCI data is provided as is. The Fund described herein is not sponsored or endorsed by MSCI. In no event shall MSCI, its affiliates or any MSCI data provider have any liability of any kindin connection with the MSCI data or the Fund described herein. Copying or redistributing the MSCI data is strictly prohibited.Morningstar Category : Copyright © Morningstar, Inc. All Rights Reserved. The information contained herein: (1) is proprietary to Morningstar and/or its content providers; (2) may not becopied or distributed; and (3) is provided for reference purposes only. Past performance is not an indicator or a guarantee of future performance.Fund Management: In the case of portfolio managers who are CFA Charterholders, CFA® and Chartered Financial Analyst® are trademarks owned by CFA Institute.Top 10 Holdings: These securities do not represent all of the securities purchased, sold or recommended for clients, and the reader should not assume that investment in the securities listedwas or will be profitable. The portfolio manager for the Fund reserves the right to withhold release of information with respect to holdings that would otherwise be included in the top holdings list.Dividend Yield: Reported as a weighted average to reflect the proportion of the portfolio each stock holding represents. This is the ratio of a stock s dividend per share to the month end marketprice.Asset Allocation/Composition of Fund: Due to rounding, the sum of portfolio may not equal 100%.

Franklin Templeton Investment Funds - Templeton Asian Growth Fund 1
Product Key Facts
Franklin Templeton Investment Funds –
Templeton Asian Growth Fund
Last updated: April 2018
· This statement provides you with key information about this product.
· This statement is a part of the offering document.
· You should not invest in this product based on this statement alone.
Quick facts
Management company: Franklin Templeton International
Services S.à r.l.
Investment manager: Templeton Asset Management Ltd.,
Singapore (internal delegation)
Depositary: J.P. Morgan Bank Luxembourg S.A.
Base currency: USD
Financial year end of this Fund: 30 June
Dealing frequency: Every Hong Kong Business Day
Minimum Investment: USD 1,000 [initial] and USD 500
[subsequent purchases] or equivalent
Ongoing charges over a year
#
:
Class A (Ydis) USD: 2.21%
Class A (acc) EUR: 2.21%
Class A (acc) HKD: 2.21%
Class A (acc) USD: 2.21%
Class B (acc) USD: 3.51%
Class N (acc) USD: 2.71%
#
The ongoing charges figures are based on the semi-annual financial
statements for the period ended 31 December 2017. These figures may
vary from year to year.
Dividend policy: Dividends, if declared, will be reinvested unless
indicated by you in the application form to be paid out. Subject to
any legal and regulatory requirements, the Fund may at its
discretion pay dividends out of the capital or out of gross income
of the Fund while paying all or part of the Fund’s fees and
expenses out of the capital of the Fund, which results in
effectively paying dividends out of capital. The Fund may amend
such distribution policy subject to the SFC’s prior approval and by
giving not less than one month’s prior notice to investors. Any
distributions involving payment of dividends out of the Fund’s
capital or payment of dividends effectively out of the Fund’s
capital (as the case may be) may result in an immediate reduction
of the net asset value per share.
What is this product?
This is a fund constituted in the form of a mutual fund. It is domiciled in Luxembourg and its home regulator is Commission de
Surveillance du Secteur Financier (“CSSF”).
Investment Objective and Policy
Templeton Asian Growth Fund (the “Fund”) aims to increase the value of its investments over the medium to long term.
The Fund invests principally (that is, at least two-thirds of the Fund’s net assets) in:
· equity securities issued by companies of any size traded on stock exchanges in Asian countries (excluding Australia, New
Zealand and Japan)
· equity securities issued by companies of any size located in, or doing significant business in, Asian countries (excluding
Australia, New Zealand and Japan)

Franklin Templeton Investment Funds - Templeton Asian Growth Fund 2
In exceptional market circumstances (such as extreme volatility) and on a temporary basis only, 100% of the Fund’s net assets may
be invested in liquid assets, with due regard to the principle of risk spreading.
The Fund can invest on an ancillary basis in:
· other types of transferable securities, including debt securities
· China A-Shares (through Shanghai-Hong Kong Stock Connect and/or Shenzhen-Hong Kong Stock Connect) and China
B-Shares (limited to 10% of the Fund’s net assets)
The investment team uses in-depth financial analysis to select individual securities that it believes will provide the best opportunities for
increased value over the long term.
The Fund does not intend to invest extensively or primarily in financial derivative instruments for investment purposes.
What are the key risks?
Investment involves risks. Please refer to the offering document for details including the risk factors.
· Market risk: The market values of securities owned by the Fund will tend to go up or down, sometimes rapidly or
unpredictably, due to factors affecting individual issuers, particular industries or sectors within securities markets, or because of
general market conditions. During a general downturn in the securities markets, multiple asset classes (including different
sectors of the same asset class) may decline in value at the same time. Similarly, when markets perform well, there can be no
assurance that securities held by the Fund will participate in the advance. Because the securities the Fund holds fluctuate in
price in this manner, the Fund’s value may go down as well as up and investors may be adversely affected.
· Equity risk: Equity and equity-linked securities are subject to significant price movements due to various economic, political,
market and issuer-specific factors. Such changes may adversely affect the value of equities regardless of issuer-specific
performance. Additionally, different industries, financial markets and securities can react differently to these changes. Such
fluctuations of the Fund’s value are often exacerbated in the short-term. Financial markets trends (including feared or actual
failures in the banking system) may also cause large fluctuations in the prices of such securities. As a result, the Fund may be
adversely affected.
· Emerging markets risk: The Fund may invest in, or be exposed to, emerging markets, which may involve increased risks and
special considerations not typically associated with investment in more developed markets. The risks of investing in emerging
markets, which can adversely affect and/or result in a substantial loss to the Fund, may include: liquidity risks, currency
risks/control, political and economic uncertainties, legal and taxation risks, settlement risks, custody risk and the likelihood of a
high degree of volatility.
· Frontier markets risk: Investments in frontier markets involve risks similar to investments in emerging markets but to a greater
extent since frontier markets are even smaller, less developed, and less accessible than other emerging markets. Frontier
markets may also experience greater political and economic instability and may have less transparency, less ethical practices,
and weaker corporate governance compared to other emerging markets. Such markets are also more likely to have
investment and repatriation restrictions, exchange controls and less developed custodial and settlement systems than other
emerging markets. As a result, the Fund/investors may be adversely impacted.
· Foreign currency risk: The Fund will typically invest to a significant degree in securities that are denominated in currencies
other than the base currency of the Fund, exposing its investments to changes in foreign exchange rates and the possibility of
exchange control regulations. Changes in currency exchange rates may adversely affect the value of the Fund, and also may
affect the income earned by the Fund and gains and losses realized by the Fund. Furthermore, the total return for a share
class that is denominated in a different currency (the “alternative currency”) from the base currency of the Fund may be
affected, either positively or negatively, by changes in the exchange rate between the Fund’s base currency and the
alternative currency.

Franklin Templeton Investment Funds - Templeton Asian Growth Fund 3
· Liquidity risk: The Fund may not be able to easily sell securities due to adverse market conditions or reduced value or
creditworthiness of issuers in which it invests. The inability of the Fund to sell securities or positions may also impede the ability
of the Fund to meet redemption requests in a timely manner. Certain securities may also be illiquid due to limited trading
markets or contractual restrictions on their resale. Reduced liquidity due to these factors may have an adverse impact on the
net asset value of the Fund.
· Regional market risk: By being concentrated in one region (i.e., Asia), the Fund could suffer greater volatility compared to
funds that follow a more diversified policy. The value of the Fund may be more susceptible to adverse economic, political,
policy, foreign exchange, liquidity, tax, legal or regulatory events affecting the Asian region and the Fund/investors may be
adversely impacted.
· Value stocks risk: The Fund invests in stocks selected using a bottom-up, long-term, value-oriented approach, which may
underperform other approaches. To the extent that the markets fail to recognize their expected value, investment may
underperform other stock selection approaches and the Fund/investors may be adversely impacted.
· Counterparty risk: The Fund may be exposed to risks arising from the solvency of its counterparties and the Fund/investors
may be adversely impacted.
· Dividend policy risk: The Fund’s dividend policy allows for payment of dividends out of capital or effectively out of capital.
Where this is done, it amounts to a return or withdrawal of part of an investor’s original investment or from any capital gains
attributable to that original investment. Any distributions involving payment of dividends out of the Fund’s capital or payment of
dividends effectively out of the Fund’s capital (as the case may be) may result in an immediate reduction of the net asset value
per share.
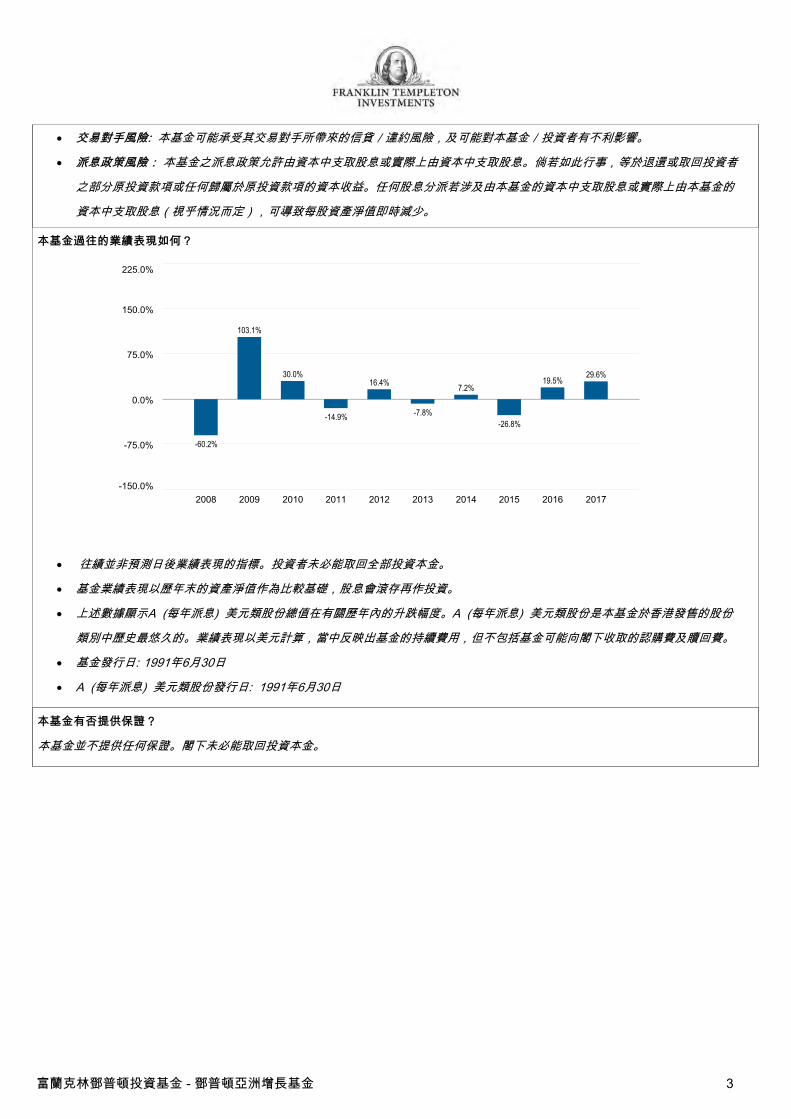
How has the Fund performed?
2008 2009 2010 2011 2012 2013 2014 2015 2016 2017
-150.0%
-75.0%
0.0%
75.0%
150.0%
225.0%
-60.2%
103.1%
30.0%
-14.9%
16.4%
-7.8%
7.2%
-26.8%
19.5%
29.6%
· Past performance information is not indicative of future performance. Investors may not get back the full amount invested.
· The computation basis of the performance is based on the calendar year end, NAV-to-NAV, with dividends reinvested.
· These figures show by how much class A (Ydis) USD increased or decreased in value during the calendar year being shown.
Class A (Ydis) USD is the share class available in Hong Kong with the longest history in the Fund. Performance data has
been calculated in USD, including ongoing charges and excluding subscription fee and redemption fee you might have to pay.
· Fund launch date: 30 June 1991
· Class A (Ydis) USD launch date: 30 June 1991
Is there any guarantee?
Franklin Templeton Investment Funds - Templeton Asian Growth Fund 4
This Fund does not have any guarantees. You may not get back the full amount of money you invest.
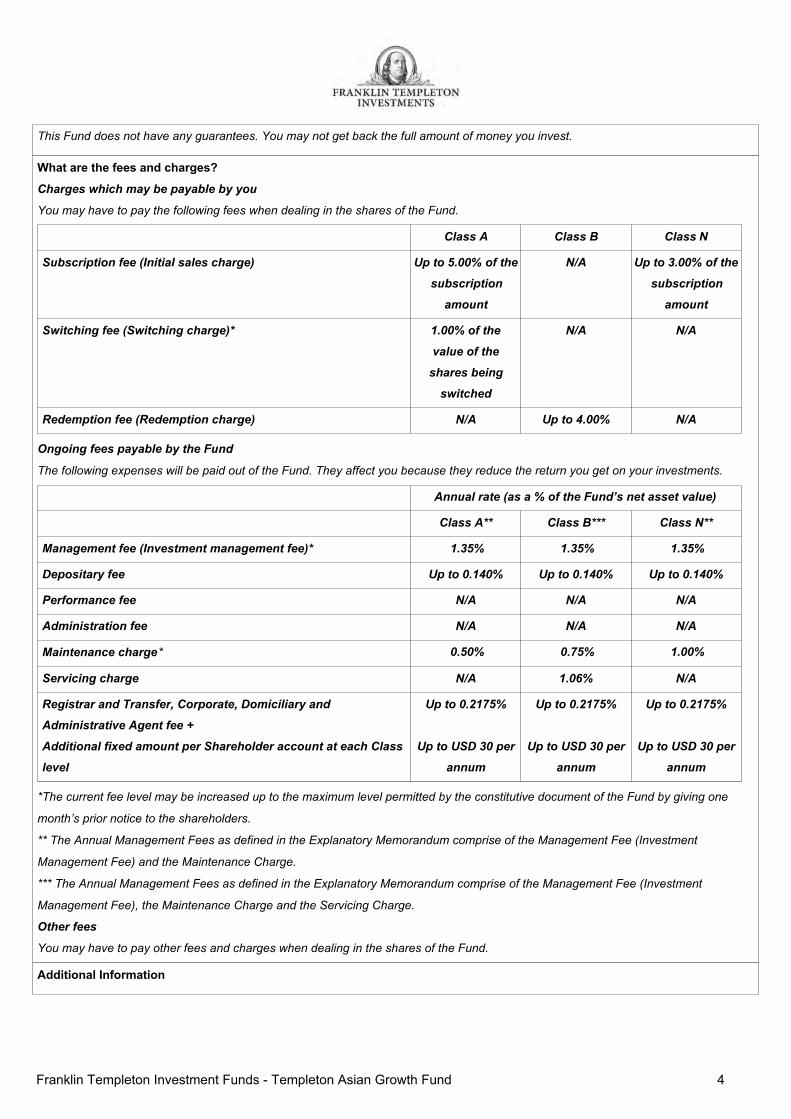
What are the fees and charges?
Charges which may be payable by you
You may have to pay the following fees when dealing in the shares of the Fund.
Class A Class B Class N
Subscription fee (Initial sales charge) Up to 5.00% of the
subscription
amount
N/A Up to 3.00% of the
subscription
amount
Switching fee (Switching charge)* 1.00% of the
value of the
shares being
switched
N/A N/A
Redemption fee (Redemption charge) N/A Up to 4.00% N/A
Ongoing fees payable by the Fund
The following expenses will be paid out of the Fund. They affect you because they reduce the return you get on your investments.
Annual rate (as a % of the Fund’s net asset value)
Class A** Class B*** Class N**
Management fee (Investment management fee)* 1.35% 1.35% 1.35%
Depositary fee Up to 0.140% Up to 0.140% Up to 0.140%
Performance fee N/A N/A N/A
Administration fee N/A N/A N/A
Maintenance charge*
0.50% 0.75% 1.00%
Servicing charge N/A 1.06% N/A
Registrar and Transfer, Corporate, Domiciliary and
Administrative Agent fee +
Additional fixed amount per Shareholder account at each Class
level
Up to 0.2175%
Up to USD 30 per
annum
Up to 0.2175%
Up to USD 30 per
annum
Up to 0.2175%
Up to USD 30 per
annum
*The current fee level may be increased up to the maximum level permitted by the constitutive document of the Fund by giving one
month’s prior notice to the shareholders.
** The Annual Management Fees as defined in the Explanatory Memorandum comprise of the Management Fee (Investment
Management Fee) and the Maintenance Charge.
*** The Annual Management Fees as defined in the Explanatory Memorandum comprise of the Management Fee (Investment
Management Fee), the Maintenance Charge and the Servicing Charge.
Other fees
You may have to pay other fees and charges when dealing in the shares of the Fund.
Additional Information
Franklin Templeton Investment Funds - Templeton Asian Growth Fund 5
· You generally buy and redeem shares at the Fund’s next determined net asset value (NAV) after the Hong Kong
Representative, Franklin Templeton Investments (Asia) Limited, receives your request in good order on or before 4:00 p.m.
(Hong Kong time) being the dealing cut-off time. Certain intermediaries may impose an earlier dealing cut-off time.
· The net asset value of this Fund is calculated and the price of shares is published on each business day. Information about
prices is available online at www.franklintempleton.com.hk.
· The compositions of the dividends (i.e. the relative amounts paid out of (i) net distributable income and (ii) capital) for the last
12 months are made available by the Hong Kong Representative on request and are also available online at
www.franklintempleton.com.hk.
· Investors may obtain the past performance information of other share classes offered to Hong Kong investors from the Hong
Kong Representative's website at www.franklintempleton.com.hk .
· Investors may obtain information on the intermediaries by calling the Hong Kong Representative at (852)2877-7733 or visiting
the Hong Kong Representative's website at www.franklintempleton.com.hk.
· The website mentioned above has not been reviewed by the Securities and Futures Commission (“SFC”).
Important
If you are in doubt, you should seek professional advice.
The SFC takes no responsibility for the contents of this statement and makes no representation as to its accuracy or completeness.
31.07.2018
[email protected] www.franklintempleton.com.hk
*
*
5 ( ) (%)
A
60
80
100
120
140
( ) 3.74
16.04.1991
51
*
07/13 01/14 07/14 01/15 07/15 01/16 07/16 01/17 07/17 01/18 07/18
( ) (%)
3 1 3 5 10
A -6.47 -8.91 -3.47 18.89 10.26 55.17 286.02
-5.12 -3.77 5.50 33.13 48.76 83.86 659.64
( )
( ) (%)
2017 2016 2015 2014 2013
A 29.60 19.46 -26.82 7.21 -7.78
42.08 5.76 -8.90 5.11 3.33
*
Sukumar Rajah:
Eric Mok, CFA:
* ( %)
ALIBABA GROUP HOLDING LTD 9.60
SAMSUNG ELECTRONICS CO LTD 7.88
TAIWAN SEMICONDUCTOR MANUFACTURING CO LTD 6.81
BANK DANAMON INDONESIA TBK PT 6.29
TENCENT HOLDINGS LTD 4.86
BRILLIANCE CHINA AUTOMOTIVE HOLDINGS LTD 3.88
PTT EXPLORATION & PRODUCTION PCL 3.72
ALUMINUM CORP OF CHINA LTD 3.45
KASIKORNBANK PCL 3.28
OIL & GAS DEVELOPMENT CO LTD 3.21
12 13.86x
1.65x
6.86x
2.68%
(5 ) 14.25%
*
%
97.57
2.43
(%) (%) (%) (%) (%) ISIN
A 30.06.1991 32.72 2.21 5.00 1.35 0.50 09.07.2018 0.0990 LU0029875118
A 25.10.2005 30.74 2.21 5.00 1.35 0.50 LU0229940001
A 30.09.2010 10.90 2.21 5.00 1.35 0.50 LU0543330483
A 14.05.2001 36.02 2.21 5.00 1.35 0.50 LU0128522157
B 14.02.2007 14.63 3.52 1.35 0.75 1.06 LU0285260591

31.07.2018
*
Copyright © 2018 www.franklintempleton.com.hk
*
%
32.15 / 35.79
13.09 / 16.17
12.90 / 2.20
12.85 / 2.64
8.92 / 13.59
8.52 / 10.32
4.62 / 0.08
3.79 / 11.33
0.71 / 3.98
0.03 / 3.90
2.43 / 0.00
%
35.53 / 31.32
21.02 / 23.04
11.75 / 4.73
8.82 / 8.59
8.67 / 6.62
5.00 / 4.83
2.64 / 4.90
1.61 / 2.99
1.60 / 6.05
0.95 / 6.92
2.43 / 0.00
( ) %
<2.0 6.12
2.0-5.0 17.63
5.0-10.0 15.16
10.0-25.0 17.52
25.0-50.0 5.42
>50.0 38.15
( )
*
:
: Copyright © Morningstar, Inc. (1) Morningstar, Inc. (2) (3)
CFA® Chartered Financial Analyst®
:
:
/ 100%
- 1
2018 04
·
·
·
: Franklin Templeton International Services S.à r.l.
: Templeton Asset Management Ltd.,
: J.P. Morgan Bank Luxembourg S.A.
:
: 6 30
:
: 1,000 [ ] 500 [ ]
#:
A ( ) : 2.21%
A ( ) : 2.21%
A ( ) : 2.21%
A ( ) : 2.21%
B ( ) : 3.51%
N ( ) : 2.71%# 2017 12 31
: ( )
Commission de Surveillance du Secteur Financier ( CSSF )
·
·
- 2
100%
·
· A B 10%
· :
·
· :
· :
· :
·
·
·
- 3
· :
·
2008 2009 2010 2011 2012 2013 2014 2015 2016 2017
-150.0%
-75.0%
0.0%
75.0%
150.0%
225.0%
-60.2%
103.1%
30.0%
-14.9%
16.4%
-7.8%
7.2%
-26.8%
19.5%29.6%
·
·
· A ( ) A ( )
· : 1991 6 30
· A ( ) : 1991 6 30

- 4
A B N
( )
5.00% 3.00%
( ) *
1.00%
( ) 4.00%
( )
A ** B *** N **
( )* 1.35% 1.35% 1.35%
0.140% 0.140% 0.140%
* 0.50% 0.75% 1.00%
1.06%
+ 0.2175%
30
0.2175%
30
0.2175%
30
*
**
***
· ( ( ) )
· www.franklintempleton.com.hk
· i ii
www.franklintempleton.com.hk
· www.franklintempleton.com.hk

- 5
· (852) 2877 7733 www.franklintempleton.com.hk
·