asian development bank ppa: nep 18030 project … · ppar – project performance audit report ta...
TRANSCRIPT
ASIAN DEVELOPMENT BANK PPA: NEP 18030
PROJECT PERFORMANCE AUDIT REPORT
ON THE
FIFTH AND SIXTH POWER PROJECTS (Loans 670 and 708-NEP[SF])
IN
NEPAL
December 1999
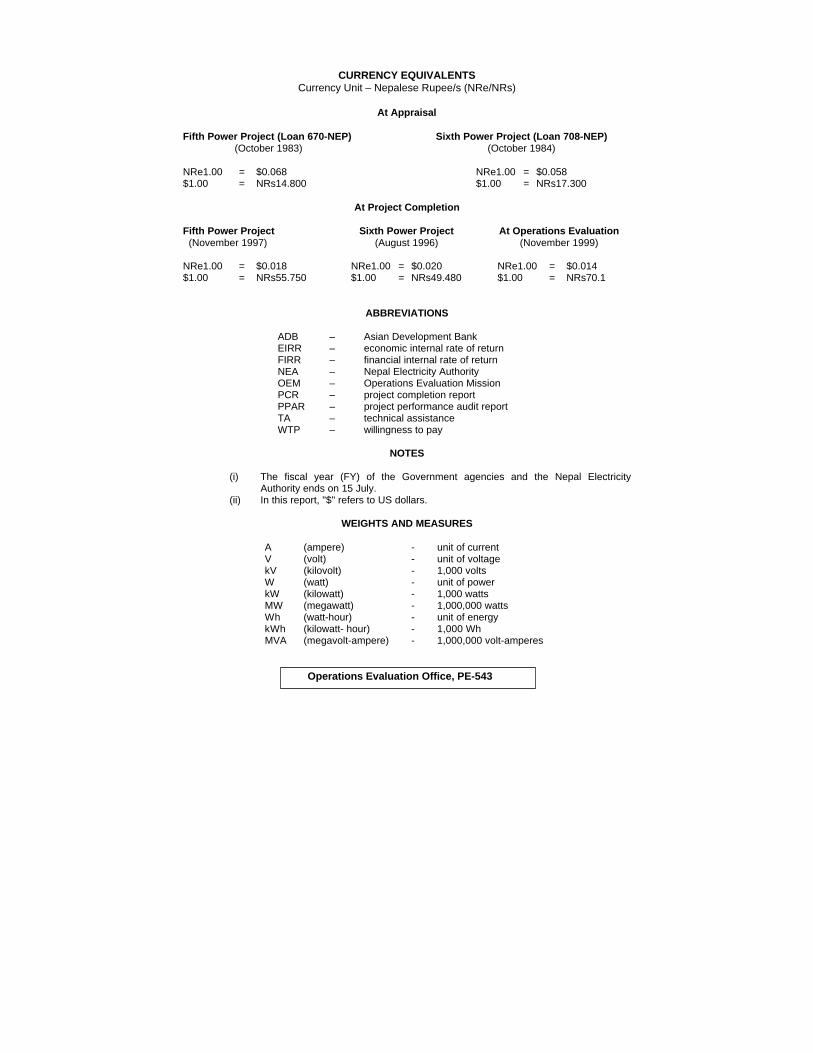
CURRENCY EQUIVALENTS Currency Unit – Nepalese Rupee/s (NRe/NRs)
At Appraisal
Fifth Power Project (Loan 670-NEP)
(October 1983) Sixth Power Project (Loan 708-NEP)
(October 1984)
NRe1.00 = $0.068 NRe1.00 = $0.058 $1.00 = NRs14.800 $1.00 = NRs17.300
At Project Completion
Fifth Power Project (November 1997)
Sixth Power Project (August 1996)
At Operations Evaluation (November 1999)
NRe1.00 = $0.018 NRe1.00 = $0.020 NRe1.00 = $0.014 $1.00 = NRs55.750 $1.00 = NRs49.480 $1.00 = NRs70.1
ABBREVIATIONS
ADB – Asian Development Bank EIRR – economic internal rate of return FIRR – financial internal rate of return NEA – Nepal Electricity Authority OEM – Operations Evaluation Mission PCR – project completion report PPAR – project performance audit report TA – technical assistance WTP – willingness to pay
NOTES
(i) The fiscal year (FY) of the Government agencies and the Nepal Electricity Authority ends on 15 July.
(ii) In this report, "$" refers to US dollars.
WEIGHTS AND MEASURES
A (ampere) - unit of current V (volt) - unit of voltage kV (kilovolt) - 1,000 volts W (watt) - unit of power kW (kilowatt) - 1,000 watts MW (megawatt) - 1,000,000 watts Wh (watt-hour) - unit of energy kWh (kilowatt- hour) - 1,000 Wh MVA (megavolt-ampere) - 1,000,000 volt-amperes
Operations Evaluation Office, PE-543

CONTENTS
Page BASIC DATA ii EXECUTIVE SUMMARY iv MAPS Error! Bookmark not defined. I. BACKGROUND 1
A. Rationale 1 B. Formulation 1 C. Objectives and Scope at Appraisal 1 D. Financing Arrangements 2 E. Completion 3 F. Operations Evaluation 3
II. IMPLEMENTATION PERFORMANCE 1
A. Design 1 B. Contracting, Construction, and Commissioning 2 C. Organization and Management 3 D. Actual Cost and Financing 4 E. Implementation Schedule 4 F. Technical Assistance 5 G. Compliance with Loan Covenants 5
III. PROJECT RESULTS 7
A. Operational Performance 7 B. Institutional Development 9 C. Performance of Asian Development Bank 9 D. Financial Performance 10 E. Economic and Financial Reevaluation 10 F. Socioeconomic Results 11 G. Gender and Development 12 H. Environmental Impact and Control 12 I. Sustainability 13
IV. KEY ISSUES FOR THE FUTURE 1 V. CONCLUSIONS 1
A. Overall Assessment 1 B. Lessons Learned 1 C. Follow-Up Actions 2
APPENDIXES 3

BASIC DATA Fifth Power Project (Loan 670-NEP[SF])
PROJECT PREPARATION/INSTITUTION BUILDING TA No. Project Title Type Amount ($) Approval Date 478-NEP Formulation of Fifth Power PPTA1 50,000 23 Aug 1982 KEY PROJECT DATA ($ million)
As Per ADB
Loan Documents
Actual Total Project Cost 25.70 23.75 Foreign Exchange Cost 18.40 23.10 Local Currency Cost 7.30 0.65 ADB Loan Amount/Utilization ($) 20.00 23.75 (SDR million) 18.88 17.73 ADB Loan Amount/Cancellation ($) — 1.60 (SDR million) 1.15 KEY DATES Expected Actual Fact-Finding 14–18 Mar 1983 Appraisal 28 May–9 Jun 19832 Loan Negotiations 7–10 Nov 1983 Board Approval 14 Dec 1983 Loan Agreement 19 Dec 1983 Loan Effectiveness 19 Mar 1984 18 Sep 1984 First Disbursement 30 Jul 1985 Project Completion 31 Mar 1988 31 Dec 1996 Loan Closing 31 Dec 1988 23 Jun 1997 Months (Effectiveness to Completion) 42 147 KEY PERFORMANCE INDICATORS (%)
Appraisal (1983)
PCR (1997)
PPAR (1999)
Economic Internal Rate of Return 13.0 29.2 15.3 Financial Internal Rate of Return 12.3 8.3 7.7 Borrower The Kingdom of Nepal Executing Agency Nepal Electricity Authority MISSION DATA Type of Mission No. of Missions Person-Days Fact-Finding 1 5 Appraisal 1 14 Project Administration - Special Loan Administration 1 4 - Review 12 62 - Project Completion Review 1 9 Operations Evaluation 1 34
ADB = Asian Development Bank, PCR = project completion report, PPAR = project performance audit report. 1 Project preparatory technical assistance. 2 A Follow-Up Mission was fielded from 28 September to 6 October 1983.

iii
BASIC DATA Sixth Power Project (Loan 708-NEP[SF])
KEY PROJECT DATA ($ million)
As Per ADB
Loan Documents
Actual Total Project Cost 41.70 53.80 Foreign Exchange Cost 28.60 36.98 Local Currency Cost 13.10 16.82 ADB Loan Amount/Utilization ($) 28.10 37.05 (SDR million) 28.13 27.47 ADB Loan Amount/Cancellation ($) — 0.99 (SDR million) — 0.66
KEY DATES Expected Actual
Appraisal 14-28 Jul 1984 Loan Negotiations 11-13 Oct 1984 Board Approval 20 Nov 1984 Loan Agreement 17 Jan 1986 Loan Effectiveness 17 Apr 1986 15 Apr 1986 First Disbursement 25 Jun 1986 Project Completion 30 Nov 1988 26 May 1996 Loan Closing 30 Jun 1989 16 Nov 1995 Months (Effectiveness to Completion) 32 121 KEY PERFORMANCE INDICATORS (%)
Appraisal (1984)
PCR (1996)
PPAR (1999)
Economic Internal Rate of Return n.c.1 12.4-13.35 15.3 Financial Internal Rate of Return n.c. 4.2 7.7 Borrower The Kingdom of Nepal Executing Agency Nepal Electricity Authority MISSION DATA Type of Missions No. of Missions Person-Days Fact-Finding 1 36 Appraisal 1 90 Project Administration - Review 12 46 - Project Completion Review 1 26 Operations Evaluation 1 34
1 n.c. = overall rate of return was not calculated.

EXECUTIVE SUMMARY
Asian Development Bank (ADB) assistance for the Fifth and Sixth Power projects in
Nepal were designed to meet increased demand for electricity (outside the Kathmandu valley) until the mid-1990s, improve the quality and reliability of power supply, reduce energy losses, and reduce oil imports, so as to support economic growth and improve the standard of living, particularly in the rural areas. The principal components of the Fifth Power Project (Fifth Project) as approved in 1983 comprised: Part A (i) construction of a 132-kilovolt (kV) line and substations, (ii) subtransmission (33kV) distribution system rehabilitation and extension; (iii) consulting services for project implementation, and staff training in construction work; and Part B (i) institution building of the Nepal Electricity Authority, Executing Agency (EA) of the Project. On the other hand, the follow-up Sixth Power Project (Sixth Project) was directed at transferring full energy output from the 69-megawatt (MW) Marsyangdi hydropower station to the main 132 kV grid, in addition to, reinforcing and expanding the subtransmission and distribution networks in secondary towns and rural areas adjacent to the main grid.
The rationale and mix of components for both projects were sound. During project appraisal, there was a need to transmit the hydropower generated in the central area to the Terai region to replace imported power from India and power derived from isolated diesel sets. The 132 kV extensions and the 33 kV lines under the Fifth Project provided the means to transmit hydropower and to supply load centers which earlier utilized other modes of power generation. Rehabilitation of the existing distribution system and the increased power supply to more rural areas under the Sixth Project attracted additional consumers and established the potential to enhance the living standards in those areas. Further to this, several components were modified based on reassessments of evolving sector requirements. In October 1991, envisaged training assistance under Part B of the Fifth Project was modified to include the installation and commissioning of a computerized billing system. A year later, the Project was again modified to provide consultant inputs for preparing the Kali Gandaki "A" Hydropower Project (Part C). Correspondingly, an added objective to the Sixth Project following a change in scope approved in November 1990, was to expand the hydropower generating capacity in Marsyangdi.
Actual ADB assistance for both projects amounted to $60.8 million equivalent. The cost of the Fifth Project at appraisal was estimated at $25.7 million of which $18.4 million was in foreign currency. To meet the foreign currency requirement, ADB provided a loan equivalent to SDR1 18.9 million ($20 million) in December 1983. At loan closing, the resulting dollar equivalent of the loan was about $25.4 million, of which about $23.8 million was disbursed. The cost of the Sixth Project at appraisal totaled to $41.7 million equivalent, of which $28.6 million was in foreign currency. During project implementation, the value of the dollar again depreciated against the SDR, and at loan closure, the resulting dollar equivalent of the loan was about $38.0 million, of which about $37.0 million had been disbursed. Part A of the Fifth Project, scheduled to be completed by April 1988, was completed only in September 1991, more than three years after the target completion date. Part B was completed ahead of schedule, but only the first of three phases was actually carried out. The additional work under Part C was completed only in December 1996. Submission of the final
1 special drawing rights.

v
detailed engineering design for Kali Gandaki was submitted at the end of February 1997 for a further 27 months. The Sixth Project was significantly delayed by about eight years. Implementation schedules are detailed in Appendix 1. Despite the significant delays, overall implementation of the two projects can be considered successful. A notable exception is the commissioning of certain facilities, especially the substations, which was poorly carried out. Construction quality was generally good with the exception of the work of the contractor for the 33 kV substations under the Fifth Project and four of the nine contractors for the Tatopani hydropower extensions under the Sixth Project. The Government complied with majority of the loans' covenants. At loan closing, the exceptions covered two common conditions: (i) a reduction on energy losses to 20 percent or less, and (ii) an annual rate of return of not less than 6 percent. A rate of return of 8.5 percent had been achieved (in FY1995 following project completion), but electricity losses continue to remain above 20 percent through FY1999.
Both projects generated economic opportunities within areas served by the transmission and distribution network. Increased access to electricity allowed cottage-type industries to develop and helped improve living standards (e.g., use of household appliances). The joint economic internal rate of return (based on a time slice analysis) for the two projects is recalculated at 15.3 percent. This is lower than estimates at project appraisal and completion due to a scaled down benefit stream focussing on the spatial location of beneficiary users connected to the grid in the Terai area in both Eastern and Western regions. The reestimated financial internal rate of return is also lower due to uneconomical tariffs charged for power sales, combined with a reduced scale of beneficiary user groups. In addition, the longer-than-expected completion period contributed to reducing both internal rates of return relative to the appraisal estimates.
Sustainability of project facilities under the Fifth and Sixth projects depends primarily on the (i) financial and technical adequacy of future maintenance and upgrading efforts, principally of the subtransmission and distribution facilities; and (ii) general level of maintenance at some, if not all, of the 33-11 kV, substations which is currently very substandard. At present, the Operations Evaluation Mission considers the physical sustainability of the transmission poles and substations as very much in doubt. Lack of tools and maintenance manuals, and the inadequate or dangerous repair techniques all further contribute to compromising the integrity of the transmission system. Overall, the sustainability of the current network, therefore, appears weak in several respects, but it is not beyond redress if given a greater allocation of maintenance effort. In retrospect, the two projects were successfully implemented and the transmission and distribution system is operational, although with severe constraints in the subtransmission gear. Both projects have generated positive socioeconomic impacts and an acceptable economic internal rate of return even though financially, the results were less robust. Keeping in mind the aforementioned sustainability risks related to several ADB-funded components of the transmission network, the Fifth and Sixth projects are nevertheless rated generally successful on account of the significant economic benefits generated by an adequate power supply for a rapidly growing consumer base.
Project experience demonstrated the need to constantly monitor maintenance efforts of the EA once a project is completed. This issue has already been emphasized in past observations with regard to ADB-funded projects, but both ADB and the EA must still exercise greater vigilance in ensuring strict adherence to minimum maintenance standards and practices as a precondition for further investments in the expansion of the system. Another lesson is the necessity for the EA to have a more rigorous accountability in carrying out rural electrification

vi
programs as evidenced by the absence of adequate monitoring data on project achievements for this major component of the Sixth Project. Equally important is the application of an objective criteria of either cost-effectiveness considerations and/or economic feasibility for the socioeconomic evaluation of rural electrification schemes.

I. BACKGROUND
A. Rationale
1. The rationale for the two projects was sound. At appraisal, there was a need to extend hydropower generated in the central area to the areas of the Terai to replace power imported from India and from isolated diesel sets. The 132-kilovolt (kV) extensions under the Fifth Project provided the means to transmit hydropower, the 33 kV lines supplied the load centers previously utilizing other modes of generation, and the rehabilitation of the existing distribution system and the increased power supply to more rural areas pursued under the Sixth Project attracted additional consumers and established a potential to enhance the living standards in those areas. 2. The projects were designed to help meet the increasing demand for electricity in the country until the mid-1990s, improve the quality and reliability of the power supply, reduce energy losses, and reduce oil imports, with the view to supporting economic growth and improving the standard of living, particularly in the rural areas.
B. Formulation
3. The Fifth Project was designed in response to an assessment carried out by Nepal Electricity Authority’s (NEA’s) predecessor, the Electricity Department,1 which felt the need to extend the transmission and distribution network of the national grid to reach out to the outlying areas of the country, following an initial significant buildup of generation capacity, initially earmarked for the Kathmandu Valley area. The projects were formulated in clear recognition of the need to expand the transmission and distribution system for development of the grid.2
C. Objectives and Scope at Appraisal
4. The overall objective of the Fifth Power Project was to (i) reinforce and expand the transmission and distribution network in main load centers outside the Kathmandu Valley, (ii) reduce losses and improve the quality of supply, and (iii) meet the load forecast up to 1993.
(i) Transmission and distribution design. For the procurement and installation of the transmission and distribution facilities, Asian Development Bank (ADB)-funded consultants prepared an extensive design manual complete with a listing of major equipment. For the rehabilitation of four urban distribution systems and
1 The Nepal Electricity Authority (NEA) was founded in 1985 by merging the Electricity Department and Nepal
Electricity Corporation. 2 It should be noted that the preparatory technical assistance (TA) project did not formally provide for a least-cost
master plan design for expansion of the national network.

2
establishment of a new distribution system (at Damak), the consultants also prepared a satisfactory design report of the proposed work and a market study so as to estimate the growth to be met by the installed facilities. A review of these reports indicates that the designs were generally well-prepared and suitable for the intended works.
(ii) Computerized billing component. This addressed two of the objectives of the
Project: reducing nontechnical systems losses and improving the quality of electricity supply.
(iii) Engineering services for Kali Gandaki “A” hydroelectric project. The ADB-
financed component of the Kali Gandaki hydropower generation facility consisted of the preparation of designs and tender documents for the generating plant.
5. The main objectives of the Sixth Power Project were to (i) transfer the full output of energy from the 69 megawatt Marsyangdi hydropower station to the main 132 kV grid, and (ii) reinforce and expand the subtransmission and distribution networks in various secondary towns and rural areas adjacent to the main grid. Subsequently, ADB approved a change in scope of Part B to include two additional components: the 33-kilowatt Lahan-Jaljale transmission line (approved in February 1989) and addition of four 250 kW generating units at the Tatopani hydropower station, including an expansion of the local distribution network and connection to the main grid (approved in November 1990). An added objective, following a change in scope approved in November 1990, was to expand the hydropower generating capacity at Marsyangdi. 6. The Rural Electrification Program under the Sixth Project consisted of six rural electrification schemes in the Terai, targeting approximately 500 villages in the region.
D. Financing Arrangements
7. The overall project cost of the Fifth Power Project was estimated at $25.70 million, of which $18.40 million was in foreign currency and $7.30 million equivalent in local currency3 (Appendix 1). To meet the foreign currency requirement, ADB approved a loan of SDR18.88 million ($20 million) in December 1983. At the closure of the accounts on 23 June 1997, the resulting dollar equivalent of the loan was about $25.4 million, of which about $23.8 million had been disbursed and $1.60 million (SDR1.15 million) was canceled. The Sixth Power Project was estimated to cost $41.70 million equivalent, of which $28.60 million was in foreign currency and $13.10 million equivalent in local currency. During project implementation, the value of the dollar depreciated against the SDR, and at loan closure in November 1995 the dollar equivalent of the loan was about $38.0 million, of which about $37.05 million had been disbursed and about $0.99 million (equal to SDR0.66 million) was canceled. Previous ADB involvement in the development of the national electricity sector amounted to $55.3 million in loans, and $3.81 million in technical assistance (TAs). Subsequent to the Fifth and Sixth Power projects, ADB extended further loans to the NEA under the Seventh Power Project. The total sector assistance to date amounts to $189.5 million.
3 As the NEA did not provide the local cost it actually disbursed, actual local cost includes only the portion disbursed
by ADB under the loan.

3
E. Completion
8. Part A of the Fifth Power Project was scheduled to be completed by March 1988, but was significantly delayed. The final component was completed in October 1991, more than three years after its target completion date. Part B was completed ahead of schedule, but only the first of three phases scheduled for completion was actually carried out. The consulting services originally allocated for the implementation of all three phases of the Project were thus used for the implementation of the pilot system alone. Due to appreciable changes in the scope of services, the work planned for Part C was completed only in December 1996 and the final version of the detailed engineering design for Kali Gandaki was submitted at the end of February 1997, representing an additional 27-months delay. The Sixth Project was delayed by eight years (Appendix 2). 9. The project completion reports (PCRs) were prepared by ADB’s Infrastructure Energy Division (West) and circulated to the Board in August 1996 (Sixth Power Project) and November 1997 (Fifth Power Project), respectively. The PCRs were based on a comprehensive assessment of completed works, with a detailed account of the scope, costs, implementation, and operational aspects of the projects at that stage. For the Fifth Power Project, the recalculated financial rate of return (FIRR) was 8.3 percent and the economic internal rate of return (EIRR) was at 29.2 percent; the corresponding figures for the Sixth Project were 4.2 percent and 13.35 percent, respectively. Both projects were rated as generally successful. The Operations Evaluation Mission (OEM) found the PCRs to be straightforward in their assessment of the project implementation and physical achievements as well as underlying shortcomings during the implementation cycle.
F. Operations Evaluation
10. The project performance audit report assesses the projects’ effectiveness in terms of appropriateness of formulation and design, progress and quality of implementation, degree of achievement of their objectives, and sustainability. It presents the findings of the OEM that visited project sites in Nepal from 27 October to 13 November 1999. The PPAR is based on a review of the appraisal reports (for the Fifth and Sixth Power projects), the corresponding PCRs, and materials from ADB’s files, and those at NEA.

II. IMPLEMENTATION PERFORMANCE
A. Design
1. Kali Gandaki
11. Consultants from Finland, Norway, and the United States selected in accordance with ADB’s Guidelines on the Use of Consultants, performed the engineering services for the Kali Gandaki hydropower station design and tendering. Despite minor problems due to replacement of expert personnel during project implementation, the performance of the consultants during project preparation is rated as generally satisfactory. The items of design unforeseen prior to implementation are noted in the consultant’s report (Appendix 3). The Kali-Gandaki design has proven to be adequate and implementation of the works is under way and cofinanced under ADB Loan 1452-NEP(SF).1
1 Loan 1452-NEP(SF): Kali-Gandaki A Hydropower Station, for $160 million, approved on 23 July 1996.

2
2. Computerized Billing System
12. The attempts of the selected software supplier to develop a custom software for the billing system resulted in long delays and prevented the original scope of works—extending the pilot program to additional branch offices—to be implemented. At design, the consultants had assumed the use of a commercially available software. It could not have been foreseen that the successful bidder would propose to develop a custom software. 13. While the covenants of the loans included a reduction system losses to less than 20 percent, no design feature other than the computerized billing system and the rehabilitation of some villages included in the projects would tend to reduce losses. The previous losses were at least 26.3 percent. It is not reasonable to expect that more than 6 percent of the entire system losses were to be found in the combination of rehabilitation and computerized billing implementation.2 The design of the projects should have included the means to enable the Executing Agency (EA) to meet technical conditions. 14. At the time of the Mission, computerized billing pilot program had been in operation for about two years. The system is functioning well and start-up problems in hardware and software have been rectified. Customer satisfaction is perceived to be higher than at the other offices. Software developmental problems of database errors and those associated with changes in procedures have been addressed.
3. Rural Electrification Program
15. Implementation of the Rural Electrification Program, the largest financial component of the Sixth Project, was plagued by significant delays, requiring more than seven years to complete instead of the three and a half years initially envisaged. The reasons for the delay include the trade blockade between India and Nepal and the alleged mismatch between the supply and construction contracts. In the end, important achievements did occur by way of line installation and consumer connections and, according to the NEA PCR prepared in 1995, the following outputs were produced: (i) 33 kV lines: 279.5 kilometers (km) compared with the 240 km envisaged; (ii) 11 kV lines: 986 km compared with 530 km; (iii) .4/.23 kV lines: 1,212 km compared with 530 km; and (iv) electrification of 511 villages and rehabilitation of four major towns in addition to smaller areas.
B. Contracting, Construction, and Commissioning
16. Materials procurement under international competitive bidding for the Fifth Power Project was mostly satisfactory, with 26 packages awarded for the transmission, distribution, rehabilitation, and generation facilities. Local competitive bidding was utilized for vehicles and
2 The project covenanted target for loss reduction implied a corresponding effort by NEA to reduce system losses
above and beyond what was achievable through the computerized billing component alone. The issue of nontechnical loss reduction is being further addressed by a component of Loan 1452-NEP (footnote 3).

3
office equipment for the pilot project. The contract for the erection of the 132 kV substations and transmission line was awarded on a turnkey basis. The balance of the transmission and distribution facilities and the rehabilitation work were covered through the separate installation and procurement of materials. 17. The Mission observed that commissioning of the facilities especially the substations was poor. Some relaying installations were never put into service and there is a total lack of records, manuals, as-built drawings, circuit diagrams, etc. for much of the equipment installed. As no records or anecdotal evidence could be located, it is not known if the problem originated at commissioning or if all such missing items were merely lost since. On the other hand, the pilot computerized billing system was successfully commissioned, and all necessary manuals are on hand. 18. Quality control during procurement was not effective in preventing substandard materials, i.e., steel poles and 11 kV class circuit breakers, from being utilized.3 Construction quality was partly satisfactory. NEA personnel cited the poor work of the contractor for the 33 kV substations under the Fifth Project and four of the nine contractors for the Tatopani hydropower additions. 19. Tatopani Hydroelectric. The project component, implemented under the Sixth Power Project, provided for the addition of four generating units at the Tatopani site, an associated distribution system, and a grid connection. Previous construction had provided for these units to be added to the site. The consultant was selected according to the ADB guidelines for detailed design and assisted the NEA during tendering. The design separated the procurement into 12 tender packages to decrease the weight of each shipment to the remote site. Most of the reported4 shortcomings of the facility do not seem to be solely due to the design or specification of equipment procured by the Sixth Project, but first and foremost to prior civil design and other station features. Units 5 and 7, which were provided by the Sixth Project have had long outages due to mechanical problems. Quality control for the procurement or the commissioning process may have been less than required for this application.
C. Organization and Management
20. Prior to 1985, planning for power generation and construction of transmission systems in Nepal were the responsibility of the Electricity Department. The operation of facilities after completion and all distribution functions were under the Nepal Electricity Corporation. To improve the management of the electrical system, the NEA was created in 1985 after many years of policy dialogue and delay. Although improvements were made, many problems remained. These included long delays in project implementation, weak financial controls, and poor planning. The failure of NEA’s new management to establish an efficient workforce during the coincident early years of the projects contributed to the delays encountered.5 3 The Mission was not able to determine if this resulted primarily from inadequate quality control or from specification
weakness. 4 This site had been reviewed by an ADB OEM on the Small Hydroelectric Project. 5 The Fifth Project loan was approved in December 1983, the loan agreement was delayed to September 1984, and
the consultant for the initial works appointed in July 1985. The Sixth Project loan was approved in November 1984, became effective in April 1986, and the initial consultant appointed in September 1986.

4
21. NEA’s problems with project management procedures contributed to (i) delays in procurement, (ii) lack of details as to disbursement categories, and (iii) lack of records of installed facilities utilization. These problems were encountered both by the Review Mission as well as the PCR team. The NEA’s PCRs are not adequate to reconstruct the expenditures by location, which compromises the evaluation of results. Considering the foregoing, the management of both projects can be considered substandard.
D. Actual Cost and Financing
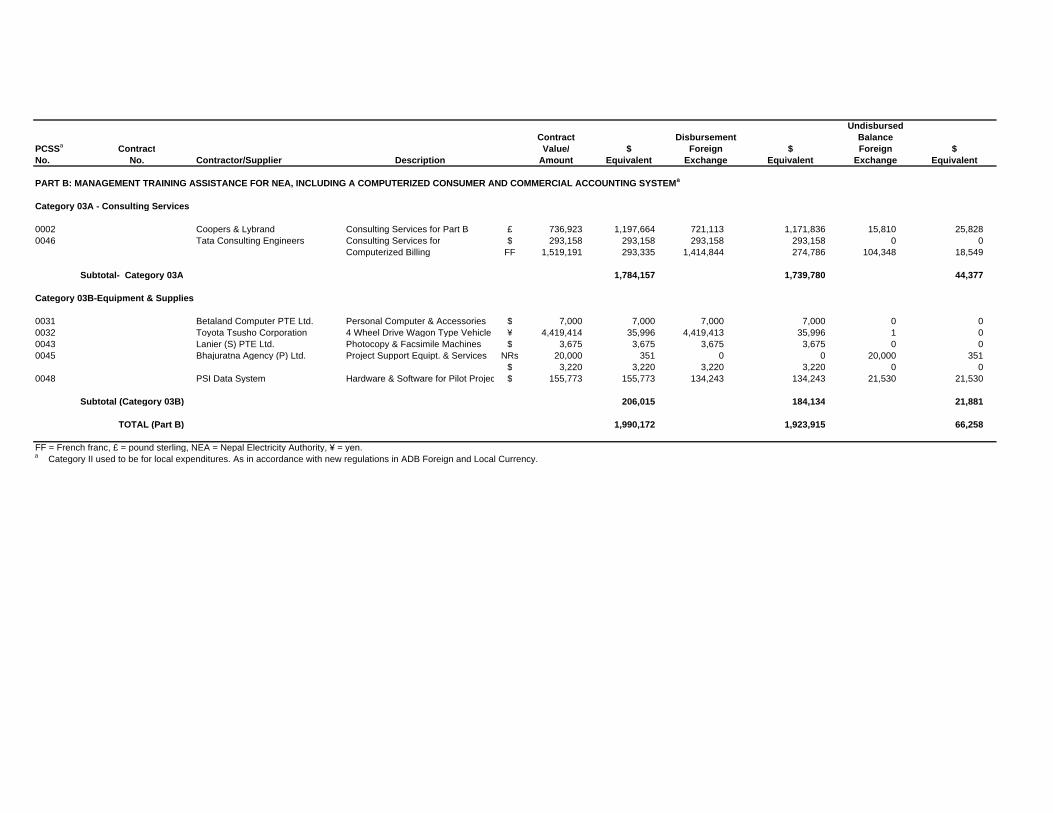
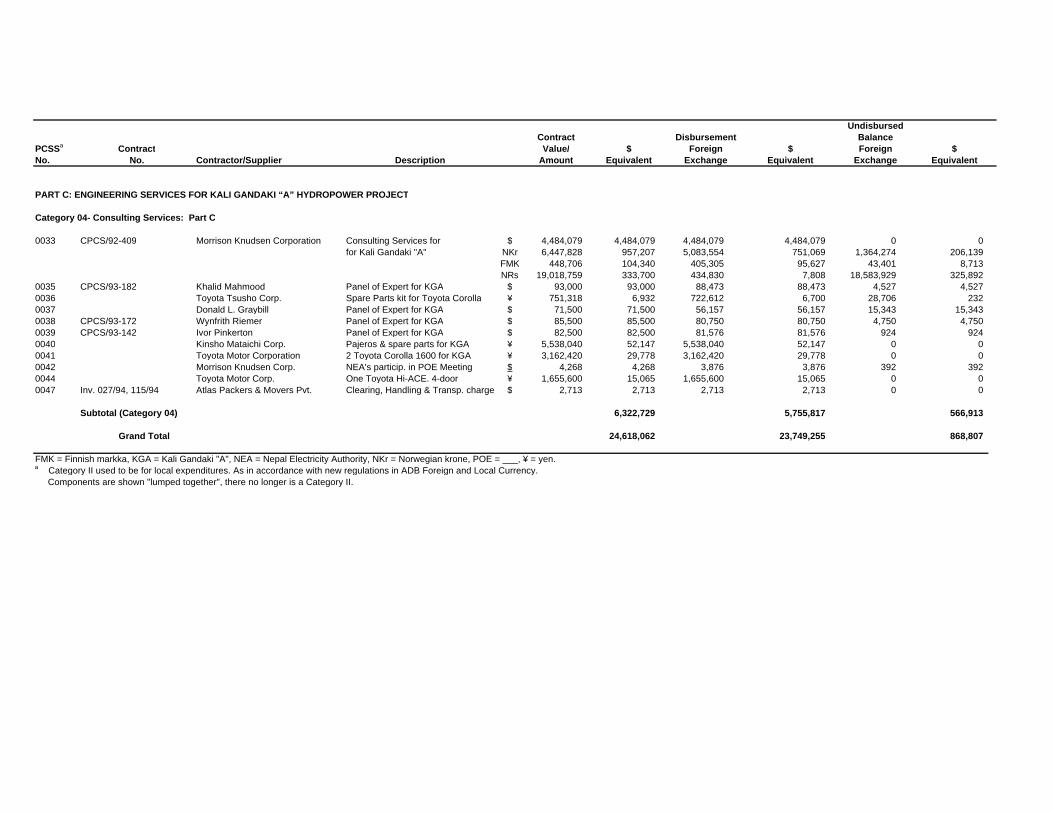
22. The appraised cost (foreign plus local cost) of the combined projects was $67.4 million equivalent with changes and additions increasing the estimated final cost to $82.493 million equivalent. At closing, the actual cost was $77.545 million, of which ADB-financed $60.795 million. Under the Fifth Project, $1.60 million was undisbursed. Details on each major component are in Table 1. A summary of the contracts per loan category is given in Appendix 1.
Table 1: Estimated and Actual Cost ($ million)
Estimated Actual
Item
FX
LC Total Cost
FX
LC
Total Cost
A. Procurement and Construction of
Transmission Lines and Substations, Including Distributiona
18.00 7.10 25.10 15.40 0.70 16.10
B. Management Training Assistance for NEA, Including a Computerized Consumer and Commercial Accounting System
na na 1.70 1.90 0.00 1.90
C. Engineering Services for Kali Gandaki “A” Hydroelectric Project
5.00 0.80 5.80 5.80 0.00 5.80
FX = foreign exchange, LC = local cost, na = not available, NEA = Nepal Electricity Authority. a appraisal.
23. Given the total disarray of NEA’s records, ADB’s efforts in preparing the PCR were commendable. Future loans to Nepal involving the NEA should covenant a more acceptable method and performance in maintaining records of expenditures as to category and amounts.
E. Implementation Schedule
24. For the Fifth Project, the schedule according to the project appraisal report included loan approval in November 1983, and completion of construction and training in March 1988 for a

5
duration of some 52 months. The loan was approved in December 1983, but became effective in September 1984. Construction and training for the 132 kV works were completed in July 1990, and that for distribution in October 1991 about 43 months later than expected. The primary reasons for these delays were (i) the initial delay for the consultancy, (ii) delays in tendering, and (iii) a blockade of customs entry points between India and Nepal. The delay due to the blockade was beyond the control of the NEA, but other delays were due to internal processes in the NEA. 25. In November 1991, at the request of His Majesty’s Government, ADB approved the inclusion of the computerized consumer billing system in the Project. Due to a delay in appointing the consultants, this component was not initiated until April 1994. Implementation of the pilot program was delayed by the software supplier to the point that only the pilot installation was completed. 26. Loan savings from the Fifth Project were utilized to finance the engineering services for the Kali Gandaki subproject. These services were added to the loan as of December 1992 and extended up to December 1996. With the loan modification, the estimated term of services was to extend to the end of July 1994 or for some 20 months. Due to appreciable changes in the scope of work as the Project became better defined, the term was extended by 27 months. Several valid reasons were advanced for the additional time. Among these were the changes found in geology, unforeseen environmental considerations addressed, and the need to evaluate bids received from 36 prospective contractors. 27. The Sixth Project was also delayed, in this case by about eight years. Initial delays were due to the delays caused by the creation of the NEA and the resulting tendering delays, the trade dispute with India, the addition of another 33 kV line with two substations, and the addition of the Tatopani generating units and local distribution system in January 1991. The Sixth Project loan was closed on 16 November 1995 (the original closing data was 30 June 1989).
F. Technical Assistance
28. The Fifth Project was preceded by a project preparatory TA; however, no mention is made of the outputs of the TA in any of the project planning, implementation, or completion reports. The ongoing TA 1267-NEP: Institutional Support for Distribution Planning and Commercial Operations in NEA,6 served as the catalyst for the addition of the computerized consumer and commercial accounting system.
G. Compliance with Loan Covenants
29. Each loan contained several key conditions and covenants: 12 for the Fifth and 14 for the Sixth. 30. At closing, two common conditions had not been fully met. These were to reduce losses to 20 percent or less and to produce an annual rate of return of not less than 6 percent. Per the
6 For $780,000, approved on 11 January 1990.

6
(unaudited) NEA financial statement for FY1995, the rate of return was 8.5 percent. Therefore, the condition was achieved, after the project was effectively completed. However, electricity losses, although decreasing, have remained greater than 20 percent through FY1999.

7
III. PROJECT RESULTS
A. Operational Performance
1. Transmission Lines
31. Construction of the 132 kV transmission lines reviewed by the OEM appears to be of good quality and the line is sustainable for its expected life—provided adequate (normal) preventive maintenance of the towers and adjacent right-of-way continues (Appendix 3). The installation of the 132 kV facilities7 appears to have been designed and with good workmanship. The towers are in good condition and have no broken insulators. 32. The 33 kV lines are in generally good condition and should perform up to their expected life or to the point where their load reaches capacity with normal maintenance practices. The 33-11 kV substations, on the other hand, suffer from poor maintenance and their ability to sustain service without rehabilitation is questionable. Their condition is similar to those of the Fifth Power Project (para. 31). Rehabilitation of the substations is required to prevent near-term outages. In their present condition, most are not sustainable.
2. Subtransmission Lines
33. The 11 kV feeder breakers have also suffered premature failures and need replacement to ensure sustainability of the transmission system. Technical details regarding the condition of the lines are provided in Appendix 3. 34. The 33-11 kV distribution substations constructed under the Sixth Project were well designed, but suffer from numerous common problems. These include inoperative air conditioners, inoperative relaying, never commissioned relaying, lack of spare parts, inoperative meters, problems with the breakers (Pokhara), inadequate gravel cover, failed carrier systems, etc. Many examples of dangerous repair techniques were noted. 35. Line personnel have demonstrated a high level of adaptability to the lack of equipment and tools even to the point of transporting poles by bicycle and installing transformers with pulleys, but these techniques inevitably compromise the levels of maintenance and expansion that the distribution system needs to become viable in scope and revenue-generation potential.8 36. The general level of maintenance at the substations is very poor. For the most part, the personnel are willing to perform maintenance and repair and have demonstrated a high degree 7 Based on observations of the line in the vicinity of Balaju. 8 Except for Pokhara, the substations are operating without the full complement of 11 kV circuit breakers and they
have no spare parts and no manuals. The remaining breakers though still serviceable will probably fail after interrupting a few faults and/or after an indeterminable number of open/close operations.

8
of ingenuity in maintaining the service with few spare parts, no tools, no manuals, and a very low level of funding for maintenance activities. In their present condition, the 11 kV substation switchgear cannot support any significant additional distribution expansion. 37. The Fifth Power Project-funded 132-11 kV substation in Pokhara reviewed by the Mission has a peak demand that is equal to the installed transformer capacity. Continued operation requires installation of additional capacity or moving the distribution load supply to an alternative substation.9 The station is sustainable at present loading, assuming adequate maintenance is provided and the current problems are rectified. 38. Rehabilitation initiatives undertaken under the Fifth Project have been overshadowed by subsequent projects and further area expansion or rehabilitation efforts, and are difficult to discern. The resulting growth has engendered 11 kV feeders that are much too long to serve future increases in load, as are many of the 400/230 circuits. The 400/230-volt distribution feeders also suffer from the same excessive length problem as their 11 kV counterparts. They should be limited to about 300 meters. 39. Proper tools for maintenance of the distribution facilities are lacking. ‘’Hot sticks’’ are mostly absent and, where used, are too short for safety and effective operation. As protection from unintended reenergizing and from induced voltages, grounding jumpers, installed with hot sticks, should be used on all de-energized lines while overhead work is being performed. 40. Vehicle availability must be increased in the distribution offices to maintain the lines so as to retain the normal life of the equipment, maximize service, and reduce losses. The lack of vehicles will eventually lead to a collapse of service in the more remote regions as there will be no means of addressing multiple failures of lines and distribution transformers.
3. Rural Electrification Program
41. The operational performance of the rural electrification component is difficult to assess in empirical or economic terms, given the absence of either a baseline survey or project monitoring data over the entire project implementation cycle. Moreover, candidate schemes for rural electrification were not systematically selected according to formal socioeconomic criteria as was the case for a similar rural electrification scheme recently carried out for Sri Lanka (Power System Expansion).10 Discussions with various NEA officials also revealed that political considerations were not uncommon in the selection of zones slated for electrification, and the criterion of cost-effectiveness was clearly not retained—as evidenced by the Mission observation of a very low customer base for some locations. 42. The NEA PCR, however, mentions that the full quota of 55,000 consumer connections envisaged during project inception has not materialized. At project completion, only 30,000 new consumers had been connected. The shortfall can be partially attributable to the relatively onerous start-up connection charges and expenses (meter acquisition and connection fees in
9 The Kali Gandaki “A” Hydroelectric Project includes a 132 kV line to the vicinity of Pokhara. If timely, the resulting
substation could include distribution (11 kV) facilities to serve the area loads. 10 Source: PCR:SRI 21201: Power System Expansion Project, May 1990.

9
particular), which have dissuaded a large contingent of potential new customers located in the vicinity of the distribution lines developed under the rural electrification scheme. 43. The NEA kept the records of outputs from this component in Kathmandu, and very little information pertaining to the results of the rural electrification component were made available to the OEM during their Mission’s visits to various locations serviced by the Project.
B. Institutional Development
44. The NEA was created in 1985, following extensive policy dialogue with ADB. Although a number of institutional improvements had been made, much still remains to be done within the NEA. Long delays in project implementation have persisted, financial performance and control are weak, and planning has been carried out largely on an ad hoc basis. Consequently, although the Fifth Project loan was approved in December 1983, the loan agreement became effective only in September 1984, and the consultant for transmission and distribution work was appointed only in July 1985. However, problems persisted and in 1987, after the joint mission of the International Development Association and ADB for power subsector review visited Nepal, a matrix of issues11 was developed and discussed with the Government. The failure of NEA's new management to establish a cohesive and efficient workforce during the initial years of the Project contributed to the delays. 45. Through successive ADB and World Bank projects initiated after the Fifth and Sixth Power projects, the NEA has made progress toward becoming a more efficient utility. Financial covenants were met in FY1995, tariffs were increased in FY1994 in anticipation of the Arun III Project (which did not materialize). Audited accounts were submitted on time. Systems losses, however, did not decrease to the covenanted 20 percent. To assist the NEA, ADB included a nontechnical loss reduction component costing $2.3 million in Loan 1452-NEP (footnote 4). ADB and other external agencies have been actively involved in providing TA to strengthen the NEA's institutional capability as it moves toward becoming a commercially oriented utility. To improve the NEA's operational performance and to introduce modern utility management practices, a twinning arrangement was established with Electricité de France in October 1989. Staff retrenchments brought the total down from 9,775 in 1991 to 7,457 in 1995. In February 1994, a revised organization structure was approved. Under an ADB TA,12 consulting services were provided to improve the NEA's distribution planning capability and to enhance its commercial operations. However, the OEM feels that much still remains to be done to effectively reorient NEA management practices and corporate culture toward a fully commercialized approach in providing cost-effective services.
C. Performance of the Asian Development Bank
11 The main elements raised included overstaffing, lack of well-defined corporate goals, and shortage of technical
manpower. 12 TA 1267-NEP: Institutional Support for Distribution Planning and Commercial Operations, for $780,000, approved
on 11 January 1990.
10
46. ADB cooperated well with the Borrower and the EA in formulating the Project and processing the loan. During implementation, ADB closely monitored and supported the Project, thus contributing significantly to its successful completion. 47. ADB controllers, however, did not properly book contracts financed under the Sixth Power Project to loan categories, which severely hampered PCR preparation. ADB may not have properly reviewed the periodic status and progress reports submitted by the NEA project manager. Such submissions could have alerted ADB to the fact that certain records were not being maintained. 48. Regular missions from ADB staff during the various phases of implementation appreciated the different problems faced during implementation, and provided advice and solutions. Regular monthly meetings in the Nepal Resident Mission in Kathmandu also provided valuable support to the NEA. Because these meetings were attended by project managers of various ADB-assisted projects, the exchange of experiences, and discussions of problems and solutions were very helpful. Apart from these meetings, the Nepal Resident Mission was always available for further advice and support. A training program in ADB procedures, conducted in Kathmandu under Part B of the loan, was deemed very helpful in the administration of the Project.
D. Financial Performance
49. The financial profile of the NEA is presented in Appendix 4. The profit and loss statement presented its annual report indicates a marked improvement in the financial performance of the utility: operating losses/deficits registered during the early 1990s converted to net surpluses beginning in 1993 onward. The principal financial indicators pertaining to the utility’s performance indicate a gradual improvement in the key ratios.
E. Economic and Financial Reevaluation
50. The Fifth and Sixth projects constituted a major portion of the NEA’s capital investment program for transmission and distribution in the areas of the grid located outside the Kathmandu Valley (notably the Terai region) for the period 1985-1991. Since this component is a relatively small portion of the overall investment program, it was decided to perform a time/area slice analysis of the NEA’s national investment program over the period of project implementation. This approach is similar to what was used for the PCR for both the Fifth and Sixth projects. However, the consumer base used for projecting financial and economic benefits is limited to power consumption and revenue generation outside the Kathmandu Valley (Eastern, Western, and Far Western Regions). 51. The capital costs of the investment program were assumed as the actual costs less interest during construction for the financial analysis. Operation and maintenance costs were assumed at 1.5 percent of capital costs for transmission and distribution investments and 1 percent of the capital cost for generation investments. For the economic analysis, taxes and

11
duties were excluded, and local capital costs were converted to border prices at a standard conversion factor of 0.9.13 52. For the financial analysis, the benefits were in terms of incremental sales revenues for 1985-1996 as provided by the NEA, and then adjusted to constant mid-1999 price levels (Appendix 5). The projected growth of revenues beyond 1999 was based on a more moderate expansion of the consumer base than what was observed in the recent past. 53. For the economic analysis, the benefits from electricity consumption for each major consumer category were based on (i) the alternative economic costs of other energy sources such as kerosene lighting or diesel generator sets that will be displaced by the use of electricity, and (ii) valuing the additional or induced energy consumption at the estimated average willingness to pay for electricity based on a weighted average of the alternative costs of providing similar energy-related services, and the current electricity tariff. The benefits valued on the basis of resource cost savings for the diverted market and consumers’ willingness to pay for the generated market. Further details on the valuation methodology are in Appendix 5. 54. A summary of the results of the sensitivity analysis is in Table 2, and the cost/benefit cash flows are in Appendix 5. The resulting base case EIRR is 15.3 percent, which is above the 20 percent opportunity cost of capital in Nepal.
Table 2: FIRR and EIRR Sensitivity Analysis
Item
FIRR (%)
EIRR (%)
Base Case 7.7 15.3 Incremental Sales less 10 percent 6.7 13.7 Incremental Sales less 20 percent 5.7 12.0
EIRR = economic internal rate of return, FIRR = financial internal rate of return. 55. The FIRR of the projects—using NEA's overall investment program as the cost stream within the time-slice approach—is 7.7 percent. This poor result is largely a reflection of the impact of low electricity tariffs during the early years of the project when financial covenants were not being met. However, subsequent pressure from ADB and other external funding agencies resulted in tariff increases that allowed the NEA to meet its financial covenants, although still insufficient to generate a financially acceptable FIRR.14
F. Socioeconomic Results
13 For purposes of evaluation throughout the economic analysis, all local costs were assumed to be nontraded goods
and services. Separate shadow wage rate factors were not available at the time of evaluation. 14 Average tariff was increased by 20 percent in 14 May 1996. The most recent increase was 27.6 percent, which took
effect in 17 November 1999.

12
56. The primary socioeconomic impact of both projects is the generation of economic opportunities for cottage-type industries located within the areas serviced by the transmission and distribution network. The primary vector for increased socioeconomic activity is the rural electrification program; increased access to power allowed cottage industries to develop as well as provided for increased use of household amenities such as electric appliances that were hitherto unavailable. The absence of socioeconomic data documenting the changes that have occurred in the impacted areas following implementation of the rural electrification component of the Sixth Power Project prevents any meaningful analysis of the quantitative impacts generated.
G. Gender and Development
57. There was no specific effort to gauge the projects’ effect on women. However, as the women of Nepal perform much of the water gathering, rice milling, etc., the advent of electric power facilitated and lessened the physical demands, and time requirements of these activities.
H. Environmental Impact and Control
58. The environmental impacts of the distribution and rural electrification components of the Fifth and Sixth projects were minor or insignificant. 59. While land was acquired for the substation construction, the affected land was minimal. Most of the right-of-way for the 33 kV lines is still in productive use. The incremental impact of the 11 kV lines was slight because they generally follow existing roadways. Concrete and steel poles were utilized in lieu of wood. 60. The NEA does not utilize herbicides for vegetation control in its substations or along the rights-of-way. Its tree-trimming activities are so infrequent and so minimal in the amount of limb growth removed that the consequence to the environment is marginal. 61. The design and specification of the Kali Gandaki “A” Hydroelectric facility had the potential for significant environmental impact. This potential was addressed by an extensive Environmental Impact Assessment study15 and comprehensive planning for monitoring and abatement of any adverse effects or impacts. In addition, an ADB TA-financed the strengthening of NEA’s Environmental Division.16 This division is participating in monitoring and mitigation of adverse project effects. 62. The other activities of the projects had no discernible environmental impact.
15 The Environmental Impact Assessment was per Nepal’s and ADB’s guidelines. 16 TA 2613-NEP: Institutional Strengthening of NEA’s Environmental Division, for $534,000, approved on 23 July
1996.

13
I. Sustainability
63. The 132 kV lines can be sustained with attention to recommended periodic maintenance practices. Rehabilitation of the distribution in the secondary towns can be effective and sustainable with proper maintenance and upgrading at adequate levels. 64. On the other hand, failure to properly measure loading and take appropriate steps to add transformers and upgrade conductor capacity will cause the losses to remain high and even increase. The full impact of several of the upgrades is not being realized for lack of meters for additional connections. Some areas17 have initiated meter repair and procurement to effectively utilize the additional capacity. 65. The distribution steel poles and pin insulators procured under the Sixth Power Project are superior to those of the previous projects, and are much more sustainable. 66. With increased maintenance, the rural area distribution schemes constructed by the Sixth Power Project are sustainable—provided they are not extended beyond their design capacity and length by the NEA or by subsequent assistance projects. 67. The tubular steel poles used in the Fifth Power Project for 11 kV lines were extremely prone to corrosion; many have already failed and all need to be replaced.18 To the extent that the 33 kV lines utilize these poles,19 this is a major problem in the sustainability of these facilities. This problem is being partially redressed through a pole replacement program undertaken by the regional divisions of the NEA. 68. The computerized billing pilot system is sustainable as a stand-alone system with routine repair/replacement of the hardware, provision of consumable supplies, and database and software maintenance. Replacements of personnel will require training and competent maintenance personnel must be retained as the system ages. However, the system software is not standard and the database included is outmoded. As the remaining offices receive a standardized system, the pilot facility will be nonstandard in the NEA system, and will require significant software changes at a minimum to remain viable when these offices are networked. 69. The equipment of the Sixth Project (Tatopani units 5-8) is sustainable provided (i) preventive maintenance procedures (as per the manufacturer’s recommendations) are followed, (ii) training in operation and maintenance techniques is obtained, and (iii) rocks and other debris due to rack failure are not allowed to strike the turbines. 70. The transmission/distribution line at the local Tatopani area has a very high rate of outages due to momentary contact with trees, bamboo, etc. This condition can be cured and sustainability enhanced by a simple right-of-way clearing and/or a recloser installation.
17 Nepalganj town and surrounding areas. 18 These poles have corroded to the point of collapse, which is a public safety concern as well as a potential cause of
extended wide-area outages in the distribution system. While several area offices have initiated repair by extending the concrete foundation, this will only delay the failure, and is not a permanent repair.
19 The pervasive failure of the steel poles used for 11 kV installations were not noted on the 33 kV lines.

14
71. The most likely scenario for a complete failure of the transmission and distribution lines would arise from the lack of protection for faults as no sectionalizing fusing has been installed.

IV. KEY ISSUES FOR THE FUTURE
72. The project management skills of the NEA, and its personnel must be improved further to prevent delays in procurement and project implementation. Similarly, project reporting formats and record maintenance practices need to be rigorously implemented. 73. The NEA needs to carefully consider the capacity of existing facilities before embarking on future expansion. It is not proper to extend distribution if the existing system cannot support such. The Mission clearly recognizes that certain vital components of the existing distribution system are unsustainable, especially if of use of the line network were further expanded or intensified. 74. To ensure the financial sustainability of operations, tariffs must be maintained at levels that will support adequate maintenance as well as comply with the financial covenants. This activity should include the active maintenance of an accurate cost-of-service determination and its update at least on a quarterly basis. 75. The NEA should be ready to periodically submit the tariffs required to meet its current cost of service and targeted rate of return to the regulatory body. The latter body should be made aware of gaps in tariff implementation even if revision applications are denied. 76. The planning1 abilities of the NEA and the facilities required, i.e., software, hardware, mapping, etc., must be developed to the point where planning can be pursued internally and continually updated.
1 In both least-cost system plans and distribution design.

V. CONCLUSIONS
A. Overall Assessment
77. Exception for delays beyond the control of the NEA and the cancellation of phases 2 and 3 of the computerized billing component, the Fifth Project was implemented successfully. The Project has a positive impact on Nepal’s economy because it facilitated the provision of a power supply to the load centers through the construction of transmission and subtransmission lines from the main grid. The benefits from the Sixth Project as reassessed after its completion also indicate that the Project has a positive impact on Nepal's economy, bearing in mind the lower-than-expected outcomes but subsequent positive impacts of the rural electrification component. Both projects can be considered generally successful on the basis of the consolidated EIRR. The sustainability of the system is a real concern, but ultimately the project components are deemed sustainable in a “status-quo” scenario where no further additions are made to the distribution capacity; otherwise, further efforts at major rehabilitation are indispensable to ensure the functioning of the expanded systems.
B. Lessons Learned
1. Project Implementation
78. Delays in project implementation resulted in losses of revenue and deviations from the originally planned project scope. These delays were perhaps due to the NEA’s difficulties in following ADB’s procurement procedures and in a possible lack of foresight by ADB of the difficulties of project implementation given the local institutional context of Nepal. It is recommended that NEA’s senior personnel participate in training courses at ADB, and that when planning projects, NEA managers take a broader view, thus minimizing the likelihood of difficulties. 79. The EA’s recognition of the need for rigorous maintenance needs enhancement. Adherence to minimum maintenance standards and practices should be a pre-condition for further investments in the expansion of the system. 80. Another lesson is the need to provide for more rigorous accountability in carrying out rural electrification programs as evidenced by the absence of adequate monitoring data on project achievements for this significant component of the Sixth Project. Equally important is the application of proper screening criteria based on either cost-effectiveness considerations and/or economic feasibility, where warranted, for the socioeconomic evaluation of rural electrification schemes.

2
C. Follow-Up Actions
81. Problems related to a lack of adequate funding, priorities, and training give rise to deficiencies in general maintenance and avoidable1 nontechnical loss problems in the NEA distribution system. Such issues require monitoring and training to improve the situation. 82. NEA technical staff should conduct an exhaustive review of the status and conditions regarding the operational status and long-term sustainability of the transmission and distribution components funded by the Fifth and Sixth projects. This review should be carried out on a priority basis to prepare a rehabilitation and/or equipment replacement plan. Implementation of this rehabilitation program should constitute a precondition for future aid agency involvement in the country’s power sector development. 83. Several items of additional assistance that the NEA needs are being addressed through various ongoing loans and TA projects.2 Computerized billing is to be implemented under a current pending loan. In addition, the NEA recognizes the need for TA for strengthening its capacity in the environmental and social areas, and for upgrading its system planning capability to formulate a comprehensive power system master plan. 84. Particular care should be taken for ADB to monitor and supervise future loans more closely during implementation, and for contracts with contractors and suppliers to be carried out in accordance with the description of the various categories of the loans. Issues and problems surrounding the implementation of procurement and their quality control should be more effectively addressed by prequalification of suppliers or short-listing during the international competitive bidding.3
85. The issue of conformity with the loan covenant on systems losses that has still to be satisfied by the NEA must be pursued under the current and forthcoming ADB loans to the power sector.
1 For example, lack of metering at the consumer and distribution feeder levels. 2 TA 1746-NEP: Enhancement of Project Implementation Efficiency, for $366,000, approved on 18 August 1992. The
TA was to support Government efforts at strengthening overall implementation capacity. It sought to identify the constraints at the national, sectoral and individual project level, and suggest remedial measures.
3 This aspect was discussed at length with NEA management and former project managers who were in agreement on the potential benefit.
3
APPENDIXES
Number
Title
Page
Cited on (page, para.)
1 Project Costs 18 2, 7
2 Implementation Schedule 22 3, 8
3 Consultant’s Report on Operational Performance
28 3,11
4 Nepal Electricity Authority: Financial Highlights 1988/89
31 11,49
5 Economic and Financial Evaluation attachments\pe543-app5a.xls attachments\pe543-app5b.xls
33 11,52
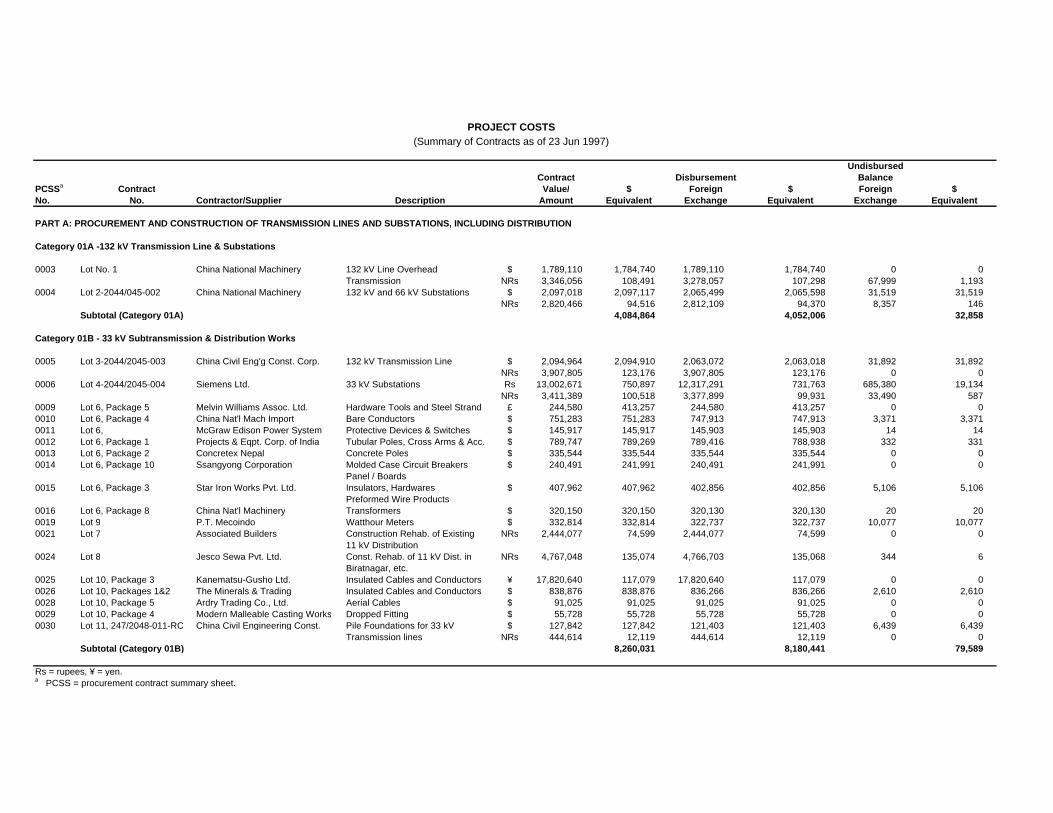
ContractPCSSa Contract Value/No. No. Contractor/Supplier Description Amount
PART A: PROCUREMENT AND CONSTRUCTION OF TRANSMISSION LINES AND SUBSTATIONS, INCLUDING DISTRIBUTION
Category 01A -132 kV Transmission Line & Substations
0003 Lot No. 1 China National Machinery 132 kV Line Overhead $ 1,789,110 1,784,740 1,789,110 1,784,740 0 0Transmission NRs 3,346,056 108,491 3,278,057 107,298 67,999 1,193
0004 Lot 2-2044/045-002 China National Machinery 132 kV and 66 kV Substations $ 2,097,018 2,097,117 2,065,499 2,065,598 31,519 31,519NRs 2,820,466 94,516 2,812,109 94,370 8,357 146
Subtotal (Category 01A) 4,084,864 4,052,006 32,858
Category 01B - 33 kV Subtransmission & Distribution Works
0005 Lot 3-2044/2045-003 China Civil Eng'g Const. Corp. 132 kV Transmission Line $ 2,094,964 2,094,910 2,063,072 2,063,018 31,892 31,892NRs 3,907,805 123,176 3,907,805 123,176 0 0
0006 Lot 4-2044/2045-004 Siemens Ltd. 33 kV Substations Rs 13,002,671 750,897 12,317,291 731,763 685,380 19,134NRs 3,411,389 100,518 3,377,899 99,931 33,490 587
0009 Lot 6, Package 5 Melvin Williams Assoc. Ltd. Hardware Tools and Steel Strand £ 244,580 413,257 244,580 413,257 0 00010 Lot 6, Package 4 China Nat'l Mach Import Bare Conductors $ 751,283 751,283 747,913 747,913 3,371 3,3710011 Lot 6, McGraw Edison Power System Protective Devices & Switches $ 145,917 145,917 145,903 145,903 14 140012 Lot 6, Package 1 Projects & Eqpt. Corp. of India Tubular Poles, Cross Arms & Acc. $ 789,747 789,269 789,416 788,938 332 3310013 Lot 6, Package 2 Concretex Nepal Concrete Poles $ 335,544 335,544 335,544 335,544 0 00014 Lot 6, Package 10 Ssangyong Corporation Molded Case Circuit Breakers $ 240,491 241,991 240,491 241,991 0 0
Panel / Boards0015 Lot 6, Package 3 Star Iron Works Pvt. Ltd. Insulators, Hardwares $ 407,962 407,962 402,856 402,856 5,106 5,106
Preformed Wire Products0016 Lot 6, Package 8 China Nat'l Machinery Transformers $ 320,150 320,150 320,130 320,130 20 200019 Lot 9 P.T. Mecoindo Watthour Meters $ 332,814 332,814 322,737 322,737 10,077 10,0770021 Lot 7 Associated Builders Construction Rehab. of Existing NRs 2,444,077 74,599 2,444,077 74,599 0 0
11 kV Distribution0024 Lot 8 Jesco Sewa Pvt. Ltd. Const. Rehab. of 11 kV Dist. in NRs 4,767,048 135,074 4,766,703 135,068 344 6
Biratnagar, etc.0025 Lot 10, Package 3 Kanematsu-Gusho Ltd. Insulated Cables and Conductors ¥ 17,820,640 117,079 17,820,640 117,079 0 00026 Lot 10, Packages 1&2 The Minerals & Trading Insulated Cables and Conductors $ 838,876 838,876 836,266 836,266 2,610 2,6100028 Lot 10, Package 5 Ardry Trading Co., Ltd. Aerial Cables $ 91,025 91,025 91,025 91,025 0 00029 Lot 10, Package 4 Modern Malleable Casting Works Dropped Fitting $ 55,728 55,728 55,728 55,728 0 00030 Lot 11, 247/2048-011-RC China Civil Engineering Const. Pile Foundations for 33 kV $ 127,842 127,842 121,403 121,403 6,439 6,439
Transmission lines NRs 444,614 12,119 444,614 12,119 0 0Subtotal (Category 01B) 8,260,031 8,180,441 79,589
Rs = rupees, ¥ = yen.a PCSS = procurement contract summary sheet.
(Summary of Contracts as of 23 Jun 1997)PROJECT COSTS
$Equivalent
DisbursementForeign
Exchange
UndisbursedBalanceForeign
Exchange$
Equivalent$
Equivalent

ContractPCSSa Contract Value/No. No. Contractor/Supplier Description Amount
$Equivalent
DisbursementForeign
Exchange
UndisbursedBalanceForeign
Exchange$
Equivalent$
Equivalent
Category 01C - Equipment & Materials & Vehicles
0007 Lot 5, 044/45 ADB V-1 Hyosung Corp. Distribution Materials (Package A&B) $ 971,005 966,290 971,005 966,290 0 00008 Lot 5, 044/45 ADB V-2 Toyota Tsusho Corp. Crane Auger Truck, Crane Truck, ¥ 73,946,800 589,173 73,946,800 589,173 0 0
Pickup (D)0020 Lot 5 (C), Package C LGZ Landis & Gyr Zug Corp. Watthour Meter (Transformer rated) SwF 229,059 143,144 229,059 143,144 0 00023 Lot 5, Package A P.T. Mecoindo 600 V Current Transformers $ 7,758 7,758 7,758 7,758 0 00027 Lot 5(C), Package D Dongfang Electric Co. Inst. Transformer for Metering Unit $ 405,913 405,913 405,913 405,913 0 0
Subtotal- Category 01C 2,112,278 2,112,278 0
Category 01D - Consulting Services
0001 Hyundai Engineering Co. Consulting Services for Part A $ 1,842,970 1,843,626 1,720,442 1,721,098 122,528 122,528
Subtotal (Category 01D) 1,843,626 1,721,098 122,528
Category 01E - Training for Trade Staff
0017 M. Tuladhar Travel Expenses RM 1,343 535 1,343 535 0 00018 M. Tuladhar Travel Expenses $ 227 227 227 227 0 0
0034 Rabin Shrestha Training $ 3,600 3,600 2,940 2,940 660 660
Subtotal (Category 01E) 4,362 3,702 660
TOTAL (Part A) 16,305,161 16,069,524 235,636
RM = ringgit, SwF= Swiss franc, ¥ = yen.
ContractPCSSa Contract Value/No. No. Contractor/Supplier Description Amount
$Equivalent
DisbursementForeign
Exchange
UndisbursedBalanceForeign
Exchange$
Equivalent$
Equivalent
PART B: MANAGEMENT TRAINING ASSISTANCE FOR NEA, INCLUDING A COMPUTERIZED CONSUMER AND COMMERCIAL ACCOUNTING SYSTEMa
Category 03A - Consulting Services
0002 Coopers & Lybrand Consulting Services for Part B £ 736,923 1,197,664 721,113 1,171,836 15,810 25,8280046 Tata Consulting Engineers Consulting Services for $ 293,158 293,158 293,158 293,158 0 0
Computerized Billing FF 1,519,191 293,335 1,414,844 274,786 104,348 18,549
Subtotal- Category 03A 1,784,157 1,739,780 44,377
Category 03B-Equipment & Supplies
0031 Betaland Computer PTE Ltd. Personal Computer & Accessories $ 7,000 7,000 7,000 7,000 0 00032 Toyota Tsusho Corporation 4 Wheel Drive Wagon Type Vehicle ¥ 4,419,414 35,996 4,419,413 35,996 1 00043 Lanier (S) PTE Ltd. Photocopy & Facsimile Machines $ 3,675 3,675 3,675 3,675 0 00045 Bhajuratna Agency (P) Ltd. Project Support Equipt. & Services NRs 20,000 351 0 0 20,000 351
$ 3,220 3,220 3,220 3,220 0 00048 PSI Data System Hardware & Software for Pilot Project $ 155,773 155,773 134,243 134,243 21,530 21,530
Subtotal (Category 03B) 206,015 184,134 21,881
TOTAL (Part B) 1,990,172 1,923,915 66,258
FF = French franc, £ = pound sterling, NEA = Nepal Electricity Authority, ¥ = yen.a Category II used to be for local expenditures. As in accordance with new regulations in ADB Foreign and Local Currency.
ContractPCSSa Contract Value/No. No. Contractor/Supplier Description Amount
$Equivalent
DisbursementForeign
Exchange
UndisbursedBalanceForeign
Exchange$
Equivalent$
Equivalent
PART C: ENGINEERING SERVICES FOR KALI GANDAKI “A” HYDROPOWER PROJECT
Category 04- Consulting Services: Part C
0033 CPCS/92-409 Morrison Knudsen Corporation Consulting Services for $ 4,484,079 4,484,079 4,484,079 4,484,079 0 0for Kali Gandaki "A" NKr 6,447,828 957,207 5,083,554 751,069 1,364,274 206,139
FMK 448,706 104,340 405,305 95,627 43,401 8,713NRs 19,018,759 333,700 434,830 7,808 18,583,929 325,892
0035 CPCS/93-182 Khalid Mahmood Panel of Expert for KGA $ 93,000 93,000 88,473 88,473 4,527 4,5270036 Toyota Tsusho Corp. Spare Parts kit for Toyota Corolla ¥ 751,318 6,932 722,612 6,700 28,706 2320037 Donald L. Graybill Panel of Expert for KGA $ 71,500 71,500 56,157 56,157 15,343 15,3430038 CPCS/93-172 Wynfrith Riemer Panel of Expert for KGA $ 85,500 85,500 80,750 80,750 4,750 4,7500039 CPCS/93-142 Ivor Pinkerton Panel of Expert for KGA $ 82,500 82,500 81,576 81,576 924 9240040 Kinsho Mataichi Corp. Pajeros & spare parts for KGA ¥ 5,538,040 52,147 5,538,040 52,147 0 00041 Toyota Motor Corporation 2 Toyota Corolla 1600 for KGA ¥ 3,162,420 29,778 3,162,420 29,778 0 00042 Morrison Knudsen Corp. NEA's particip. in POE Meeting $ 4,268 4,268 3,876 3,876 392 3920044 Toyota Motor Corp. One Toyota Hi-ACE. 4-door ¥ 1,655,600 15,065 1,655,600 15,065 0 00047 Inv. 027/94, 115/94 Atlas Packers & Movers Pvt. Clearing, Handling & Transp. charge $ 2,713 2,713 2,713 2,713 0 0
Subtotal (Category 04) 6,322,729 5,755,817 566,913
Grand Total 24,618,062 23,749,255 868,807
FMK = Finnish markka, KGA = Kali Gandaki "A", NEA = Nepal Electricity Authority, NKr = Norwegian krone, POE = ___, ¥ = yen.a Category II used to be for local expenditures. As in accordance with new regulations in ADB Foreign and Local Currency. Components are shown "lumped together", there no longer is a Category II.

Appendix 3, page 1
CONSULTANT’S REPORT ON OPERATIONAL PERFORMANCE A. Transmission Lines 1. The construction of the 132-kilovolt (kV) transmission line from Dubi to Anarmani (approximately 75 kilometers [km]) substations appears to be of good quality, and the line is sustainable for its expected life if adequate (normal) preventive maintenance for the towers and right-of-way is provided. Various spare parts are available at Anarmani. No damaged insulators or corrosion of the lattice works was noted. Ground resistance of the tower footings should be checked on a regular basis because of the changing pattern of land use and subsequent moisture levels around the towers. 2. The 132 kV facilities1 appear to have been installed as designed and have good workmanship. The towers are in good condition and no broken insulators were observed. 3. The Anarmani facility includes spare 132 kV parts but few tools, and has problems with the installed metering as few of them are functioning. The major equipment is maintainable and receives routine testing periodically. The current peak demand was recorded as 12.0 megawatts with an installed transformer capacity of about 12.75 megavolt-ampere (MVA).2 Continued operation without load shedding will require additional transformer capacity and/or reactive correction in the very near future. 4. The present Pokhara 132-11 kV substation peak demand is equal to the installed transformer capacity. Continued operation requires the additional capacity be installed or that the distribution load supply be moved to an alternative substation.3 The station also has problems with the SF6 circuit breaker and relaying. The station is sustainable at present loading, assuming adequate maintenance is provided, and the current problems are rectified, especially the circuit breaker gas leaks and nonuniform pole opening. 5. The capacity of the Marsyangdi-Bharatpur 132 kV circuit should be confirmed by load-flow studies to assess the need for increases depending on the timing and location of additional generation facilities and for load center increases. 6. The 33 kV lines are in generally good condition and should perform up to their expected life or to the point where their load reaches capacity with normal maintenance practices. The 33-11 kV substations suffer from poor maintenance and their ability to sustain service without rehabilitation is questionable. Their condition is similar to those of the Fifth Project. Rehabilitation is required to prevent near-term outages. In their present condition, most are not sustainable. B. Subtransmission Lines 7. The 11 kV feeder breakers are in a condition similar to those of the Fifth Project. They have also suffered premature failures and need replacement to ensure the sustainability of the transmission system.
1 Based on observations of the line in the Balaju vicinity. 2 Assuming a power factor of 0.85 with nameplate capacity of 15 MVA (2 x 7.5 MVA units) 3 The Kali Gandaki Hydroelectric Project includes a 132 kV line to the Pokhara vicinity. If timely, the resulting
substation could include distribution (11 kV) facilities to serve area loads.

Appendix 3, page 2
8. The 33-11 kV distribution substations constructed under the Sixth Project were well designed, but suffer from numerous common problems. These include inoperative air conditioners, inoperative relaying, never commissioned relaying, lack of spare parts, inoperative meters, problems with the SF6 breakers (Pokhara), inadequate gravel cover, failed carrier systems, etc. Many examples of dangerous repair techniques were noted, including the use of wire to bypass failed breakers and combining feeders onto single breakers. 9. The most pressing problem is the 11 kV feeder circuit breakers, regardless of the Project. In most of the areas visited (Pokhara being an exception), the majority of these breakers have failed to the point that the few surviving feeder breakers are now supplying several circuits. The breakers suffer from poor phase separation, which has resulted in flashover, fragile arc chambers made of glass, lack of spare parts (except at Pokhara), and lack of manuals. In fact, there appears to be no manuals for any of the substation equipment anywhere. This should be a correctable problem that the Nepal Electricity Authority should immediately address. Equipment of this nature cannot be properly maintained without manuals. 10. The general level of maintenance at the substations is very poor. The personnel are, for the most part, willing to perform maintenance and repair, and have demonstrated a high degree of ingenuity in maintaining service with few spare parts, no tools, no manuals, and a very low level of funding for maintenance activities.4 In their present condition, the 11 kV substation switchgear cannot support any significant additional distribution expansion. 11. As in the substations, the line personnel have demonstrated a high level of adaptability to the lack of equipment and tools even to the point of transporting the PSC poles by bicycle and installing transformers with pulleys, but these techniques inevitably compromise the levels of maintenance and expansion that the distribution system needs to become viable in scope and revenue-generation potential.5 12. The distribution circuit rehabilitation6 appears to have been adequately implemented. These efforts have expanded to the point that rehabilitation initiatives undertaken under the Fifth Project have been overshadowed by subsequent projects and further area expansion or rehabilitation efforts, and are therefore difficult to discern. The resulting growth has, however, engendered 11 kV feeders, which are much too long (many are over 12 km and some are over 25 km) to serve future increases in load as are many of the 400/230 circuits.7 The typical long 11 kV feeder serves only about 350 kV at present, which effectively disguises the fact that they are much too long to be economical and technically sound.8 13. The 400/230-volt distribution feeders also suffer from the same excessive length problem as their 11 kV counterparts. These should be limited to about 300 meters. Several
4 As an example of precarious maintenance and repair procedures, some of the “spot” repairs are dangerous to
personnel and have increased the probability of catastrophic failure of the 11 kV system in the event of a close in fault, which the paralleled equipment would not be able to interrupt.
5 Except for Pokhara, the substations are operating without the full complement of 11 kV circuit breakers, and have no spare parts and no manuals. The remaining breakers, though still serviceable, will probably fail after interrupting a few faults and/or after an indeterminable number of open/close operations.
6 The Fifth Project included the rehabilitation of four existing distribution systems, and the creation of a new system at Damak.
7 The 11 kV feeders would normally be limited to about 12 km with “Dog” conductor for proper voltage regulation and optimization of losses.
8 These overly long feeders are typically installed as a result of political and social pressures to provide electricity to outlying areas. As a result, these long 11 kV lines are consuming resources and generating losses, the costs of which far exceed the resulting revenue.

Appendix 3, page 3
examples of a kilometer or more were observed while one was about 3 km. These resulted from poor planning and a lack of analysis in distribution design more than the pressures to serve as on the 11 kV feeders. Training should be provided to ensure proper distribution circuit design, connection techniques,9 phase balance of connections, etc.10 Increased loading on these feeders will not be sustainable without significant levels of rehabilitation and improvements. 14. There is a pressing need for a distribution software to be utilized to design the extensions to the system and for analysis. At present, there has been no analysis of the existing 33/11/0.4 kV circuits for capacity, technical losses, reactive components, fault duties, phase balance, or economical conductor selection. If the expansions of the distribution go on in an essentially unplanned form, the inherent inefficiencies will reach a level where they cannot be sustained given the limited resources of the Nepal Electricity Authority. 15. There are no proper tools for maintenance of the distribution facilities. ‘’Hot sticks’’ are mostly absent and, where used, are too short for safety and effective operation. As protection from unintended reenergizing and from induced voltages, grounding jumpers, installed with hot sticks, should be used on all de-energized lines while overhead work is being performed. These are rarely used. In addition, proper connection of ACSR conductor requires the use of compression connectors and the related tool and dies. Some of these were observed, but they are rare and the connectors and tools are not available to the maintenance personnel. Similarly, the observed wide use of galvanized iron wire for wrapped or twisted connections in lieu of the compression type is a potential source of losses and frequent outages. 16. Vehicle availability must be increased in the distribution offices to allow line maintenance so as to retain the normal life of the equipment, maximize service, and reduce losses. The lack of vehicles will eventually lead to a collapse of service in the more remote regions as there will be no means of addressing multiple failures of lines and distribution transformers.
9 Some use of the correct compression connectors was noted, but the majority of connections are made with wire-
wraps which should be replaced. 10 Such training was a part of the initial scope of the Fifth Project, but was evidently not performed.

PROFIT AND LOSS FOR THE YEAR ENDED JULY 15
Particulars 1999** 1998* 1997 1996 1995 1994 1993 1992 1991 1990
RevenueNet Sale of Electricity 5,420.6 5,082.5 4,767.3 3,728.9 3,218.5 2,437.4 1,786.8 1,440.4 960.9 760.1 Income from Other Services 186.1 157.6 135.0 111.2 99.9 13.8 8.6 5.6 18.2 15.9 Interest and Other Income 163.3 192.6 181.3 172.0 145.1 160.5 109.0 68.2 13.5 9.4
Total-A 5,770.0 5,432.7 5,083.6 4,012.1 3,463.5 2,611.7 1,904.4 1,514.2 992.6 785.4
Operation and Maintenance ExpenditureOperation and Maintenance and General 1,679.4 1,554.5 1,049.4 942.0 838.3 697.1 604.8 499.3 379.7 291.0
ExpensesPower Purchase 897.1 845.6 659.5 359.6 340.0 214.1 162.1 111.3 50.5 171.5 Provision of Expenses 25.0 109.3 80.5 45.9 7.7 8.5 7.0 8.7 - 48.8 Bad Debts Written Off - - - - - - - - 0.3 0.2 Royalty 396.7 348.9 268.8 227.0 186.8 - - - - 0.3 Depreciation 1,650.0 1,544.9 1,482.2 1,455.3 1,296.0 1,202.4 1,026.0 953.6 879.7 683.9 Deferred Expenditure Written Off 158.7 175.3 188.7 204.4 162.0 66.5 53.6 45.1 56.6 56.6
Total-B 4,806.9 4,578.5 3,729.1 3,234.2 2,830.8 2,188.6 1,853.5 1,618.0 1,366.8 1,252.3
Net Operating Surplus (Deficit) (A-B) 963.1 854.2 1,354.5 777.9 632.7 423.1 50.9 (103.8) (374.2) (466.9)
Loss of Capital Assets - - - - 35.8 - - - - - Interest on Long-Term Loans (1,312.2) (1,317.2) (1,207.5) (813.5) (797.0) (716.6) (625.5) (632.2) (635.1) (129.0) Profit and (Loss) before Prior Year's Income (349.1) (463.0) 147.0 (35.5) (164.2) (329.3) (574.6) (736.0) (1,009.0) (575.7)
and Expense AdjustmentPrior Year Income/Expenses Adjustment (50.0) 11.3 (176.6) (99.0) (397.0) (411.7) (48.8) 75.6 15.4 41.4 Profit and (Loss) after Prior Year's Adjustment (399.1) (451.7) (29.6) (134.5) (561.4) (741.0) (623.4) (660.4) (993.6) (637.1) Transfer from Reevaluation Surplus 950.0 843.4 883.3 907.5 671.6 869.2 729.6 610.0 568.9 522.0 Excess Provision Corporate Tax - - - - 10.4 - - - - -
written back (1993-94)Net Profit (Loss) Before Tax 550.9 391.7 853.7 773.0 120.6 128.2 106.2 (50.4) (424.7) (115.1) Interest Tax - 5.0 5.0 7.7 3.9 2.4 - - - - Corporate Tax 167.1 31.1 141.3 66.7 10.4 27.2 - - - - Net Profit (Loss) After Tax 383.8 355.6 707.4 698.6 106.3 98.6 106.2 (50.4) (424.7) (115.1) Transfer to Insurance Fund 20.0 20.0 20.0 20.0 80.0 - - - - - Net Profit/(Loss) after Appropriation 363.8 335.6 687.4 678.6 26.3 98.6 106.2 (50.4) (424.7) (115.1)
* = subject to final audit, ** = provisional figures, + = internal, ++ = on revalued assets

Appendix 4, page 1
Description 1999 a 1998 b Amount Percent
Total Revenue Net (NRs million) 5,770.00 5,432.70 337.30 6.21 Net Sale of Electricity (NRs million) 5,420.60 5,082.50 338.10 6.65 Income from Other Services (NRs million) 349.40 350.20 (0.80) (0.23) Operating Expenses,Including Depreciation (NRs million) 4,806.90 4,578.50 228.40 4.99 Depreciation (NRs million)c 1,650.00 1,544.90 105.10 6.80 Net Income, After Interest Before Tax (NRs million) 550.90 391.70 159.20 40.64 Interest on Long-Term Loans (NRs million) 1,312.20 1,317.20 (5.00) (0.38) Long-Term Loans (NRs million) 25,982.60 20,848.90 5,133.70 24.62 Net Fixed Assets (NRs million) 30,988.00 30,063.60 924.40 3.07
Number of Customers 620,000.00 574,849.00 45,151.00 7.85 Total Sales of Electricity (GWh) 1,112.89 1,051.43 61.46 5.85 Internal Sale (GWh) 1,052.89 984.02 68.87 7.00 Average Consumer's Consumption (kWh)d 1,698.20 1,711.78 (13.58) (0.79) Average Price of Electricity (NRs/kWh)d 5.07 5.05 0.02 0.40
Peak Load Interconnected System (MW) 326.40 317.00 9.40 2.97 Total Available Electric Energy (GWh) 1,475.00 1,373.17 101.83 7.42 Hydro Generation (GWh) 1,046.51 971.96 74.55 7.67 Purchased Energy (GWh) India 232.39 210.29 22.10 10.51
BPC 77.28 83.47 (6.19) (7.42) Exported Energy (GWh) 60.00 67.41 (7.41) (10.99) Thermal Generation (GWh) 118.82 107.45 11.37 10.58 Net System Losses (Percentage) 22.95 23.40 (0.45) (1.92)
GWh = gigawatt-hour, kWh = kilowatt-hour, MW = megawatt.a Provisional figures.b Subject to final audit.c Internal.d On revalued assets.
Increase/Decrease
Table A4.1: Highlights for 1998/99
NEPAL ELECTRICITY AUTHORITY: FINANCIAL HIGHLIGHTS
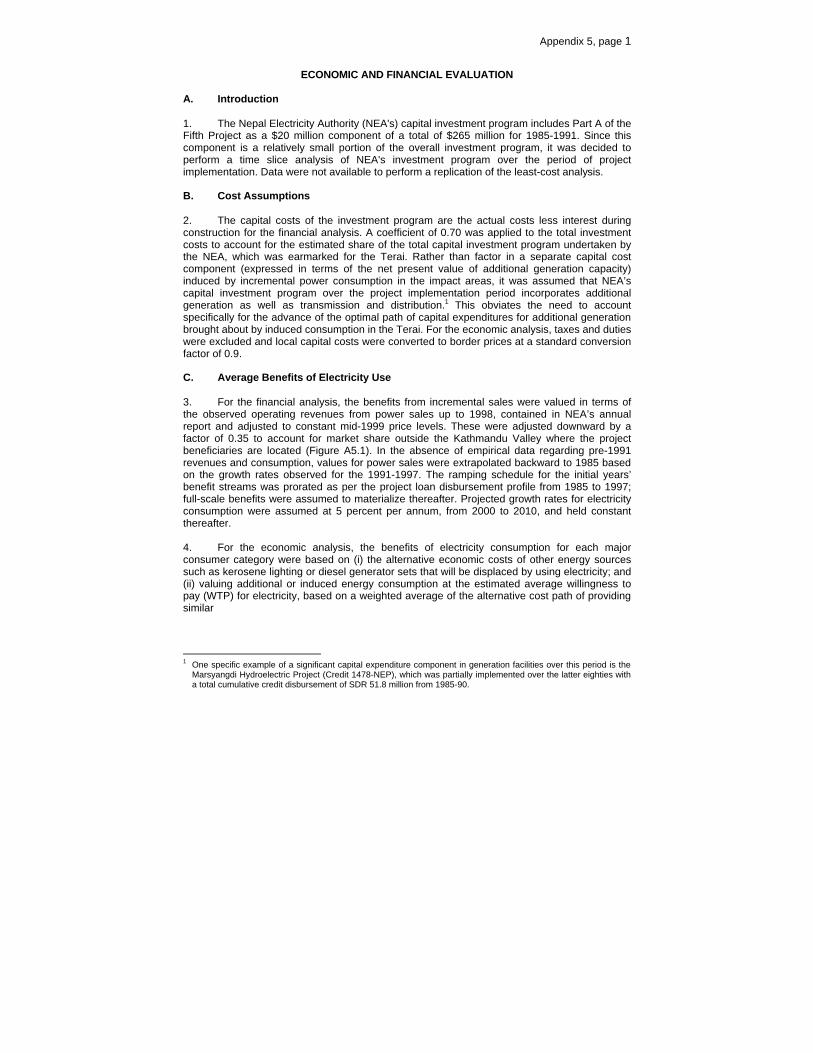
Appendix 5, page 1
ECONOMIC AND FINANCIAL EVALUATION A. Introduction 1. The Nepal Electricity Authority (NEA's) capital investment program includes Part A of the Fifth Project as a $20 million component of a total of $265 million for 1985-1991. Since this component is a relatively small portion of the overall investment program, it was decided to perform a time slice analysis of NEA's investment program over the period of project implementation. Data were not available to perform a replication of the least-cost analysis. B. Cost Assumptions 2. The capital costs of the investment program are the actual costs less interest during construction for the financial analysis. A coefficient of 0.70 was applied to the total investment costs to account for the estimated share of the total capital investment program undertaken by the NEA, which was earmarked for the Terai. Rather than factor in a separate capital cost component (expressed in terms of the net present value of additional generation capacity) induced by incremental power consumption in the impact areas, it was assumed that NEA’s capital investment program over the project implementation period incorporates additional generation as well as transmission and distribution.1 This obviates the need to account specifically for the advance of the optimal path of capital expenditures for additional generation brought about by induced consumption in the Terai. For the economic analysis, taxes and duties were excluded and local capital costs were converted to border prices at a standard conversion factor of 0.9. C. Average Benefits of Electricity Use 3. For the financial analysis, the benefits from incremental sales were valued in terms of the observed operating revenues from power sales up to 1998, contained in NEA’s annual report and adjusted to constant mid-1999 price levels. These were adjusted downward by a factor of 0.35 to account for market share outside the Kathmandu Valley where the project beneficiaries are located (Figure A5.1). In the absence of empirical data regarding pre-1991 revenues and consumption, values for power sales were extrapolated backward to 1985 based on the growth rates observed for the 1991-1997. The ramping schedule for the initial years’ benefit streams was prorated as per the project loan disbursement profile from 1985 to 1997; full-scale benefits were assumed to materialize thereafter. Projected growth rates for electricity consumption were assumed at 5 percent per annum, from 2000 to 2010, and held constant thereafter. 4. For the economic analysis, the benefits of electricity consumption for each major consumer category were based on (i) the alternative economic costs of other energy sources such as kerosene lighting or diesel generator sets that will be displaced by using electricity; and (ii) valuing additional or induced energy consumption at the estimated average willingness to pay (WTP) for electricity, based on a weighted average of the alternative cost path of providing similar
1 One specific example of a significant capital expenditure component in generation facilities over this period is the
Marsyangdi Hydroelectric Project (Credit 1478-NEP), which was partially implemented over the latter eighties with a total cumulative credit disbursement of SDR 51.8 million from 1985-90.

Appendix 5, page 2
energy-related services and ending with the current electricity tariff at the lower end of the value spectrum. This evaluation is described briefly in the following paragraphs for the three major consumer categories, calculated in 1996 prices and then discounted to 1991 prices for the purpose of this analysis.
Figure A5.1: Nepal Electricity Authority Power Sales and Revenues
5. Residential consumers, who account for 38 percent of NEA's energy sales (Figure A5.2) use electricity primarily for lighting, and to a lesser extent for radios, fans, and other electrical appliances. The economic benefits of residential electricity consumption are based on the alternative costs of kerosene that would or could be used for lighting in the absence of electricity. The methodology used to estimate these benefits can be explained with the help of Figure A5.3, which shows the estimated demand curve for residential electricity use.
Figure A5.2: Nepal Electricity Authority Energy Sales and Revenues
0
100,000,000
200,000,000
300,000,000
400,000,000
500,000,000
600,000,000
700,000,000
1994 1995 1996 1997 1998
Gen
erat
ion
ou
tpu
t (K
Wh
)
0
500,000,000
1,000,000,000
1,500,000,000
2,000,000,000
2,500,000,000
3,000,000,000
3,500,000,000
Rev
enu
es (
NR
s)
CentralEasternFar W esternW esternCentralEasternFar W esternW estern
0.E+00
1.E+08
2.E+08
3.E+08
4.E+08
5.E+08
1994 1995 1996 1997 1998
kWh
0.E+00
5.E+08
1.E+09
2.E+09
2.E+09
3.E+09
3.E+09
NR
s
Domestic Industrial
Institutional Commercial
Domestic Institutional
Commercial Industrial

Appendix 5, page 3
6. In Figure A5.3, point A represents the quantity of electricity used to displace existing average levels of lighting with kerosene wick lamps. The average kerosene use for lighting in non-electrified households is about 6 liters per month, at an economic cost of about $0.21/liter. For kerosene wick lamps, 3 liters of kerosene fuel provide the same lighting as 1 kilowatt-hour (kWh) of electricity with incandescent bulbs. Consequently, this level of lighting can be provided by only 2 kWh of electricity, resulting in a relatively high average value for this first small block of consumption of about $0.64/kWh. The marginal WTP for additional use continues at point B, which is based on the financial cost of kerosene of $0.17/liter rather than its economic cost, and which is further adjusted by converting local prices to border prices by the standard conversion factor 0.9. This results in an incremental economic value of $0.46/kWh at point B. For much higher levels of lighting, represented by point C, more efficient pressured kerosene lamps can be used, with an equivalence factor 0.7 liters of kerosene lighting equal to 1 kWh of electric incandescent lighting. The value of electricity for displacing such lighting is estimated to be about $0.14/kWh. The final point D on the demand curve represents the average actual total usage of 58 kWh/month for residential consumers at the average residential tariff level of 4.75 rupees/kWh. This is equivalent to $0.076/kWh when converted to border prices with the standard conversion factor and the current exchange rate. To approximate a continuous demand curve with concave slopes, it was also assumed that the average incremental value between adjacent points is only 40 percent of the difference, rather than the 50 percent corresponding to a piece-wise linear demand function. The resulting average value of residential power consumption is estimated to be $0.182/kWh.
Figure A5.3: Economic Benefits of Residential Power
7. Using the same methodological approach as described in para. 6, based on a combination of WTP (as measured by the average economic cost of alternative captive generation) and the average industrial tariff for induced consumption, the resulting average value of industrial power consumption is $0.125/kWh. For commercial and other users, the corresponding average economic value of power consumption is estimated to be $0.199/kWh. 8. Benefits are ramped up according to the same schedule as per the financial analysis.
0
0.1
0.2
0.3
0.4
0.5
0.6
0.7
2 20 58Total Consumption (kWh/month/consumer)
Mar
gin
al V
alu
e ($
/kW
h)
B
A
C
D
Appendix 5, page 4
D. Results of Financial and Economic Analysis 9. At appraisal, the financial internal rate of return (FIRR) for the time slice was 6.9 percent without a tariff increase in October 1984. With a tariff increase of 65 percent in October 1984, the FIRR would have been 12.3 percent. At project completion, the corresponding FIRR was computed at 8.3 percent. The results of the evaluation assessment establish the FIRR at around 7.7 percent (Table A5.1). A direct comparison with the results of the project completion report (PCR) is not rendered possible owing to the absence of empirical data in the PCR regarding the computation of benefits contained in the analysis. 10. At appraisal, the economic internal rate of return (EIRR) computes at 13 percent. At PCR stage, the corresponding EIRR (using a time-slice analysis) was 29.2 percent. The project performance audit report adopts the same parameters as in the PCR when it comes to the average WTP for the major consumer segments of the market. However, the scale of beneficiaries has been reduced in scale to reflect the geographic impact of the project namely, in the Terai region. This scaling down of benefits and a different ramping schedule for the coming onstream of benefits over the project implementation period have resulted in EIRR of 15.3 percent which is comfortably above the opportunity cost of capital for Nepal (Table A5.2). This result is, however, very conservative given the scaling down of the benefit streams as per the above description, while the total capital costs for the entire NEA investment program over the initial project implementation period remain unchanged. E. Results of the Sensitivity Analysis 11. The sensitivity analysis was carried out on the benefits stream for both the financial and economic evaluation. Reducing the benefits by 10 percent yields an FIRR of 6.7 percent and EIRR of 13.7 percent. Reducing the benefits by 20 percent would reduce the FIRR to 5.7 percent and the EIRR to 12 percent. Hence, the project would still be considered generally successful even under the most pessimistic scenario adopted in the sensitivity analysis. 12. A further test was incorporated into the analysis by simulating, although in a crude manner, the adverse effects of partial unsustainability of some of the key operational components of the project. Recognizing the difficulty at correlating specific sustainability weaknesses of the various components of the Project because of the diverse and geographically dispersed nature of the components, the Mission nonetheless factored a 50 percent reduction in the benefit streams beginning in year 2005 through to the end of the project benefit life cycle. The result is a reduction in the EIRR to 14 percent, which is still satisfactory. It would be too subjective or unrealistic to consider a more radical cut in benefits in the wake of the sustainability issue since it can be naturally assumed that any defective components compromising the integrity of the system would perforce be corrected by the NEA because of the sheer necessity of preserving or replacing the vital core assets required to maintain system integrity.

Net Capital Total Total Cash
Year Costs Costs Benefits Flow
1985 1,881 9 29 1,919 23 (1,896)1986 767 10 40 818 41 (777)1987 1,759 5 67 1,832 65 (1,767)1988 1,652 6 91 1,750 282 (1,468)1989 733 37 102 871 780 (91)1990 1,391 6 123 1,520 1,014 (506)1991 9,580 5 233 9,818 679 (9,139)1992 23 5 230 258 862 6041993 66 5 231 302 1,018 7171994 49 5 230 284 730 4461995 37 5 230 272 1,634 1,3621996 96 5 231 332 1,832 1,5001997 - 5 230 235 2,057 1,8221998 - 5 230 235 1,903 1,6681999 - 5 230 235 2,117 1,8822000 - 5 230 235 2,058 1,8232001 - 5 230 235 2,001 1,7662002 - 5 230 235 1,945 1,7102003 - 5 230 235 1,891 1,6562004 - 5 230 235 1,839 1,6042005 - 5 230 235 1,787 1,5532006 - 5 230 235 1,877 1,6422007 - 5 230 235 1,971 1,7362008 - 5 230 235 2,069 1,8342009 - 5 230 235 2,173 1,9382010 - 5 230 235 2,281 2,0472011 - 5 230 235 2,281 2,0472012 - 5 230 235 2,281 2,0472013 - 5 230 235 2,281 2,0472014 - 5 230 235 2,281 2,0472015 - 5 230 235 2,281 2,0472016 - 5 230 235 2,281 2,0472017 - 5 230 235 2,281 2,0472018 - 5 230 235 2,281 2,0472019 - 5 230 235 2,281 2,0472020 - 5 230 235 2,281 2,0472021 - 5 230 235 2,281 2,0472022 - 5 230 235 2,281 2,0472023 - 5 230 235 2,281 2,0472024 - 5 230 235 2,281 2,0472025 - 5 230 235 2,281 2,047
7.7%Financial Internal Rate of Return
Time Slice Analysis
Costs
Table A5.1: Financial Internal Rate of Return
(in constant 1999 prices, NRs million)
Fuel Costs
O&MCosts

23456789101112131415161718192021222324252627282930313233343536373839
A B C D E F G H I J K L M NStatement of Sales, Revenues, and Collection
Region Year Units Sold Revenues Units Sold Revenues Units Sold Revenues Units Sold Revenues Units Sold Revenues Units Sold Revenues
Central1994 16,452,430 66,386,777 2,403,404 13,416,225 3,741,010 19,745,283 14,699,557 54,615,531 891,806 2,279,005 40,155,497 161,241,111 1995 18,103,645 73,376,837 2,836,618 15,650,331 4,576,136 23,770,910 16,094,151 63,786,952 985,173 2,423,003 45,881,434 188,271,534 1996 19,384,128 94,368,762 2,920,205 19,452,433 5,009,254 31,225,013 19,648,108 80,706,629 1,122,707 3,453,153 51,882,715 241,041,393 1997 20,364,855 102,996,082 3,071,620 20,657,679 5,031,042 32,666,897 20,047,518 92,970,690 1,005,004 3,581,640 53,710,812 264,873,640 1998 255,365,017 1,299,191,841 39,886,155 269,114,854 58,603,100 384,974,124 235,231,264 1,098,223,907 17,459,749 59,711,425 624,536,115 3,179,754,583
Eastern1994 1,057,148 3,861,132 185,791 929,423 147,055 699,405 4,098,021 15,211,719 72,327 232,228 5,676,680 21,277,266 1995 3,238,265 12,305,975 442,407 2,266,232 368,561 1,959,431 9,365,015 36,362,027 558,532 1,345,661 14,772,558 59,595,491 1996 3,688,044 17,316,786 530,569 3,318,423 270,771 2,261,212 7,246,535 36,096,514 516,272 1,778,522 12,908,763 62,772,163 1997 4,695,100 22,037,027 1,114,722 7,109,637 561,859 3,399,959 9,681,936 46,940,128 576,280 1,920,909 17,600,698 84,205,284 1998 47,791,703 219,166,082 6,441,352 40,462,898 4,055,252 23,423,000 123,212,559 592,507,373 6,982,470 23,424,079 192,007,520 903,997,715
Far Western1994 1,311,661 5,114,849 345,730 1,923,992 171,843 901,934 866,980 3,486,097 72,457 229,948 2,857,059 11,948,906 1995 1,583,274 6,182,505 385,271 2,039,098 178,191 1,003,943 990,926 4,009,646 102,222 271,272 3,386,633 13,897,319 1996 1,768,231 8,321,573 400,887 2,595,294 132,064 1,367,627 1,237,702 5,943,752 90,297 330,108 3,743,660 19,120,101 1997 1,849,441 8,852,243 360,153 2,340,402 213,401 1,512,121 1,376,545 6,809,112 113,638 424,364 4,069,777 20,541,368 1998 22,968,336 106,490,437 4,873,725 31,501,566 2,538,909 12,211,191 17,534,214 86,142,439 996,053 3,985,513 51,230,730 249,491,345
Western1994 3,200,734 12,010,681 531,834 2,875,406 312,077 1,734,801 2,800,150 11,156,422 202,811 796,708 5,361,889 20,042,207 1995 3,483,634 13,356,236 507,655 2,504,233 359,255 2,021,172 2,565,449 10,382,342 249,263 668,960 7,764,832 30,629,563 1996 4,065,887 18,566,599 630,716 3,990,169 497,942 3,892,716 3,507,263 15,867,877 297,046 961,350 9,199,907 44,006,548 1997 4,181,247 19,741,816 637,577 4,199,351 562,865 3,825,936 3,142,069 15,527,011 363,764 1,296,876 10,116,258 48,356,689 1998 52,272,898 242,991,336 7,980,231 52,460,470 6,142,942 42,440,798 39,330,172 194,236,411 11,655,764 40,719,958 126,900,608 592,039,999
Total 1994 22,021,973 756,506,000 648,613,500 54,051,125 214,509,490 1995 26,408,818 824,587,000 861,665,484 71,805,457 292,393,907 1996 28,906,290 936,696,000 932,820,540 77,735,045 366,940,205 1997 31,090,643 1,010,600,000 1,025,970,540 85,497,545 417,976,981 1998 378,397,954 1,051,429,000 994,674,973 994,674,973 4,925,283,642
Water Supp. & Irrigation TotalDomestic Institutional Commercial Industrial

FiscalYear
O&MCost
FuelCost
Total Cost Sales
Total Benefits
Net Cash Flow
1985 974 14.6 4.9 994 6 6 -9881986 397 20.6 5.32 423 12 12 -4111987 911 34.1 2.8 948 22 22 -9261988 856 46.4 3.22 906 106 106 -7991989 380 51.7 18.97 450 327 327 -1231990 721 62.3 3.22 786 471 471 -3151991 4964 118.4 2.59 5084 345 345 -47391992 12 117.0 2.59 132 523 523 3911993 34 117.2 2.59 154 682 682 5281994 25 117.1 2.59 145 525 525 3801995 19 117.0 2.59 139 1,249 1249 11111996 50 117.4 2.59 170 1,511 1511 13411997 116.8 2.59 119 1,837 1837 17181998 116.8 2.59 119 1,746 1746 16261999 116.8 2.59 119 2,117 2117 19972000 116.8 2.59 119 2,222 2222 21032001 116.8 2.59 119 2,334 2334 22142002 116.8 2.59 119 2,450 2450 23312003 116.8 2.59 119 2,573 2573 24532004 116.8 2.59 119 2,701 2701 25822005 116.8 2.59 119 2,837 2837 27172006 116.8 2.59 119 2,978 2978 28592007 116.8 2.59 119 3,127 3127 30082008 116.8 2.59 119 3,284 3284 31642009 116.8 2.59 119 3,448 3448 33282010 116.8 2.59 119 3,620 3620 35012011 116.8 2.59 119 3,801 3801 36822012 116.8 2.59 119 3,991 3991 38722013 116.8 2.59 119 4,191 4191 40712014 116.8 2.59 119 4,400 4400 42812015 116.8 2.59 119 4,620 4620 45012016 116.8 2.59 119 4,851 4851 47322017 116.8 2.59 119 5,094 5094 49752018 116.8 2.59 119 5,349 5349 52292019 116.8 2.59 119 5,616 5616 54972020 116.8 2.59 119 5,897 5897 57772021 116.8 2.59 119 6,192 6192 60722022 116.8 2.59 119 6,501 6501 63822023 116.8 2.59 119 6,826 6826 67072024 116.8 2.59 119 7,168 7168 70482025 116.8 2.59 119 7,526 7526 7407
IRR= 14.58%
CapitalCost
Financial Internal Rate of Return Adjusted Time Slice Analysis (NRs Million)

Economic Internal Rate of Return Adjusted Time Slice Analysis (NRs Million)FiscalYear
O&MCost
FuelCost
Total Cost
Total Benefits
Net Cash Flow
1985 917 13.8 4.9 936 15 -9211986 375 19.4 5.32 399 28 -3711987 854 32.1 2.8 889 48 -8401988 766 43.5 3.22 812 221 -5911989 342 48.4 18.97 409 643 2341990 652 58.3 3.22 714 876 1621991 4565 112.2 2.59 4680 1063 -36161992 11 110.9 2.59 125 1173 10481993 32 111.2 2.59 146 1154 10081994 24 111.1 2.59 138 1322 11841995 18 111.0 2.59 132 1544 14121996 47 111.3 2.59 161 1940 17791997 111.3 2.59 114 2180 20661998 111.3 2.59 114 2245 21311999 111.3 2.59 114 3085 29712000 111.3 2.59 114 3262 31482001 111.3 2.59 114 3448 33342002 111.3 2.59 114 3645 35312003 111.3 2.59 114 3853 37392004 111.3 2.59 114 4074 39602005 111.3 2.59 114 4306 41922006 111.3 2.59 114 4552 44392007 111.3 2.59 114 4813 46992008 111.3 2.59 114 5088 49742009 111.3 2.59 114 5378 52642010 111.3 2.59 114 5686 55722011 111.3 2.59 114 5686 55722012 111.3 2.59 114 5686 55722013 111.3 2.59 114 5686 55722014 111.3 2.59 114 5686 55722015 111.3 2.59 114 5686 55722016 111.3 2.59 114 5686 55722017 111.3 2.59 114 5686 55722018 111.3 2.59 114 5686 55722019 111.3 2.59 114 5686 55722020 111.3 2.59 114 5686 55722021 111.3 2.59 114 5686 55722022 111.3 2.59 114 5686 55722023 111.3 2.59 114 5686 55722024 111.3 2.59 114 5686 55722025 111.3 2.59 114 5686 5572
IRR= 20.80%
CapitalCost

Exchange Rates and Conversion Factors
Implicit Local Cost Implicit Implicit Foreign Interntional FX growth World Bank World Bank World Bank
GDP Deflator Escalation GDP Deflator GDP Deflator Exchange Inflation MUV Index MUV Index MUV Index
1984/85=100 Factor 1998/99=100 1990/91=100 Rate
1985=100 1999=100 1991=100 Pd Avg. 1990=100 1991=100 1999=100
1985 100 26.2 51.5 18.2 68.61 67.11 65.46
1986 114.4 29.9 58.9 21.2 80.89 79.13 77.17
1987 128.9 33.7 66.3 21.8 88.84 86.90 84.75
1988 144.1 37.7 74.2 23.3 95.31 93.23 90.93
1989 160.4 42.0 82.6 27.2 94.65 92.59 90.30
1990 177.6 46.5 91.4 29.4 100 97.82 95.40
1991 194.3 50.8 100.0 37.3 102.23 100.00 97.53
1992 231.8 60.7 119.3 42.7 106.64 104.31 101.74
1993 255.9 67.0 131.7 48.6 106.33 104.01 101.44
1994 274.9 71.9 141.5 49.4 110.21 107.81 105.14
1995 292.2 76.5 150.4 51.9 119.21 116.61 113.73
1996 315.1 82.5 162.2 56.7 113.99 111.50 108.75
1997 341.4 89.3 175.7 58.0 108.38 106.02 103.40
1998 350.6 91.7 180.4 66.0 104.19 101.92 99.40
1999 382.2 9 100.0 196.7 70.1 2.7 6.3 104.82 102.53 100.00
2000 412.7 8 108.0 212.4 73.8 2.7 5.3 106.5 104.18 101.60
2001 445.7 8 116.6 229.4 77.8 2.7 5.3 109.13 106.75 104.11
2002 481.4 8 126.0 247.8 81.9 2.7 5.3 111.89 109.45 106.74
2003 519.9 8 136.0 267.6 86.2 2.7 5.3 114.71 112.21 109.44
2004 561.5 8 146.9 289.0 90.8 2.7 5.3 117.61 115.04 112.20
2005 606.4 8 158.7 312.1 95.6 2.7 5.3 120.58 117.95 115.04
2006 606.4 8 158.7 312.1 95.6 120.58 117.95 115.04
2007 606.4 158.7 312.1 95.6 120.58 117.95 115.04
2008 606.4 158.7 312.1 95.6 120.58 117.95 115.04
2009 606.4 158.7 312.1 95.6 120.58 117.95 115.04
2010 606.4 158.7 312.1 95.6 120.58 117.95 115.04
2011 606.4 158.7 312.1 95.6 120.58 117.95 115.04
2012 606.4 158.7 312.1 95.6 120.58 117.95 115.04
2013 606.4 158.7 312.1 95.6 120.58 117.95 115.04
2014 606.4 158.7 312.1 95.6 120.58 117.95 115.04
2015 606.4 158.7 312.1 95.6 120.58 117.95 115.04
2016 606.4 158.7 312.1 95.6 120.58 117.95 115.04
2017 606.4 158.7 312.1 95.6 120.58 117.95 115.04
2018 606.4 158.7 312.1 95.6 120.58 117.95 115.04
2019 606.4 158.7 312.1 95.6 120.58 117.95 115.04
2020 606.4 158.7 312.1 95.6 120.58 117.95 115.04
2021 606.4 158.7 312.1 95.6 120.58 117.95 115.04
2022 606.4 158.7 312.1 95.6 120.58 117.95 115.04
2023 606.4 158.7 312.1 95.6 120.58 117.95 115.04
2024 606.4 158.7 312.1 95.6 120.58 117.95 115.04
2025 606.4 158.7 312.1 95.6 120.58 117.95 115.04
0.00

Year Financial GDP Financial Economic GDP EconomicBenefits Deflator Benefits Benefits Deflator BenefitsCurrent 1999=100 1999 Prices Current 1999=100 1999 Prices
1985 6.1 26.2 23.4 15 26.2 57.5 1986 12.2 29.9 40.8 28.4 29.9 94.8 1987 21.9 33.7 64.9 48.1 33.7 142.6 1988 106.4 37.7 282.2 221.1 37.7 586.3 1989 327.4 42.0 780.1 643.4 42.0 1,532.9 1990 471.1 46.5 1,013.7 875.5 46.5 1,883.9 1991 345.5 50.8 679.5 1,063.5 50.8 2,091.6 1992 523.1 60.7 862.4 1,172.5 60.7 1,933.1 1993 681.7 67.0 1,018.1 1,154.4 67.0 1,724.0 1994 525.3 71.9 730.2 1,321.9 71.9 1,837.6 1995 1,249.5 76.5 1,634.1 1,543.8 76.5 2,019.1 1996 1,510.8 82.5 1,832.3 1,940.4 82.5 2,353.4 1997 1,837.2 89.3 2,056.6 2,180.1 89.3 2,440.3 1998 1,745.5 91.7 1,902.6 2,245.1 91.7 2,447.1 1999 2,116.6 100.0 2,116.6 3,085.4 100.0 3,085.4 2000 2,222.5 108.0 2,057.8 3,261.7 108.0 3,020.1 2001 2,333.6 116.6 2,000.7 3,448.1 116.6 2,956.2 2002 2,450.3 126.0 1,945.1 3,645.1 126.0 2,893.6 2003 2,572.8 136.0 1,891.1 3,853.4 136.0 2,832.4 2004 2,701.4 146.9 1,838.5 4,073.6 146.9 2,772.4 2005 2,836.5 158.7 1,787.5 4,306.4 158.7 2,713.8 2006 2,978.3 158.7 1,876.9 4,552.5 158.7 2,868.8 2007 3,127.2 158.7 1,970.7 4,812.6 158.7 3,032.8 2008 3,283.6 158.7 2,069.2 5,087.7 158.7 3,206.1 2009 3,447.8 158.7 2,172.7 5,378.4 158.7 3,389.3 2010 3,620.2 158.7 2,281.3 5,685.7 158.7 3,583.0 2011 3,620.2 158.7 2,281.3 5,685.7 158.7 3,583.0 2012 3,620.2 158.7 2,281.3 5,685.7 158.7 3,583.0 2013 3,620.2 158.7 2,281.3 5,685.7 158.7 3,583.0 2014 3,620.2 158.7 2,281.3 5,685.7 158.7 3,583.0 2015 3,620.2 158.7 2,281.3 5,685.7 158.7 3,583.0 2016 3,620.2 158.7 2,281.3 5,685.7 158.7 3,583.0 2017 3,620.2 158.7 2,281.3 5,685.7 158.7 3,583.0 2018 3,620.2 158.7 2,281.3 5,685.7 158.7 3,583.0 2019 3,620.2 158.7 2,281.3 5,685.7 158.7 3,583.0 2020 3,620.2 158.7 2,281.3 5,685.7 158.7 3,583.0 2021 3,620.2 158.7 2,281.3 5,685.7 158.7 3,583.0 2022 3,620.2 158.7 2,281.3 5,685.7 158.7 3,583.0 2023 3,620.2 158.7 2,281.3 5,685.7 158.7 3,583.0 2024 3,620.2 158.7 2,281.3 5,685.7 158.7 3,583.0 2025 3,620.2 158.7 2,281.3 5,685.7 158.7 3,583.0
Financial Economic
Calculation of Project Benefits(NRs million)

Net Year Capital Fuel O&M Total Total Cash
Costs Costs Costs Costs Benefits Flow
1985 1,684 9 27 1,721 58 (1,663)1986 688 10 38 736 95 (641)1987 1,567 5 63 1,636 143 (1,493)1988 1,406 6 86 1,498 586 (911)1989 627 37 95 759 1,533 7741990 1,197 6 115 1,318 1,884 5661991 8,381 5 221 8,607 2,092 (6,515)1992 21 5 218 244 1,933 1,6891993 60 5 219 283 1,724 1,4411994 44 5 218 267 1,838 1,5701995 33 5 218 257 2,019 1,7621996 87 5 219 311 2,353 2,0431997 - 5 219 224 2,440 2,2161998 - 5 219 224 2,447 2,2231999 - 5 219 224 3,085 2,8612000 - 5 219 224 3,020 2,7962001 - 5 219 224 2,956 2,7322002 - 5 219 224 2,894 2,6702003 - 5 219 224 2,832 2,6082004 - 5 219 224 2,772 2,5482005 - 5 219 224 2,714 2,4902006 - 5 219 224 2,869 2,6452007 - 5 219 224 3,033 2,8092008 - 5 219 224 3,206 2,9822009 - 5 219 224 3,389 3,1652010 - 5 219 224 3,583 3,3592011 - 5 219 224 3,583 3,3592012 - 5 219 224 3,583 3,3592013 - 5 219 224 3,583 3,3592014 - 5 219 224 3,583 3,3592015 - 5 219 224 3,583 3,3592016 - 5 219 224 3,583 3,3592017 - 5 219 224 3,583 3,3592018 - 5 219 224 3,583 3,3592019 - 5 219 224 3,583 3,3592020 - 5 219 224 3,583 3,3592021 - 5 219 224 3,583 3,3592022 - 5 219 224 3,583 3,3592023 - 5 219 224 3,583 3,3592024 - 5 219 224 3,583 3,3592025 - 5 219 224 3,583 3,359
15.3%Economic Internal Rate of Return
Table A5.2: Economic Internal Rate of Return
(in constant 1999 prices, NRs million)
Costs
Time Slice Analysis

NEPAL ELECTRICITY AUTHORITY 0 0Statement of Sales, Revenues, and Collection 0 0
0 0Water Supp. & Irrigation Total 0
Region Year Units Sold Revenues Units Sold Revenues Units Sold Revenues Units Sold Revenues Units Sold Revenues Units Sold Revenues
Central 0 0 0 0 0 0 0 0 0 0 0 0 00 1994 230270175 766122126 33638329 154827019 52359623 227866133 205736755 630278628 12481823 26300360 481865964 19348933320 1995 207895485 821765927 32574660 175272052 52550634 266216489 184819208 714366357 11313358 27135829 550577208 22592584080 1996 233575927 975169990 35188046 201013858 60360783 322667109 236756847 833990835 13528456 35683537 622592580 28924967160 1997 240717116 1195148328 36307232 239708055 59468036 379060898 236966122 1078815452 11879371 41560717 644529744 31784836800 1998 255365017 1299191841 39886155 269114854 58603100 384974124 235231264 1098223907 17459749 59711425 624536115 3179754583
Eastern 0 0 0 0 0 0 0 0 0 0 0 0 00 1994 14795970 44558552 2600353 10725803 2058199 8071331 57356391 175547527 1012297 2679977 68120160 2553271920 1995 37187024 137817755 5080436 25380111 4232417 21944168 107544328 407227622 6413972 15070401 177270696 7151458920 1996 44440394 178944914 6393279 34291289 3262751 23366483 87319694 373007301 6221003 18378553 154905156 7532659560 1997 55497126 255713766 13176262 82498971 6641298 39452523 114442637 544684948 6811758 22289888 211208376 10104634080 1998 47791703 219166082 6441352 40462898 4055252 23423000 123212559 592507373 6982470 23424079 192007520 903997715
Far Western0 1994 18358164 59026800 4838878 22203410 2405135 10408573 12134356 40230542 1014117 2653665 34284708 1433868720 1995 18181726 69239452 4424308 22836379 2046279 11243414 11379423 44905049 1173879 3038044 40639596 1667678280 1996 21306927 85991891 4830630 26818756 1591352 14132524 14914129 61420416 1088066 3411207 44923920 2294412120 1997 21860804 102719863 4257089 27157611 2522447 17546385 16271068 79011732 1343226 4924245 48837324 2464964160 1998 22968336 106490437 4873725 31501566 2538909 12211191 17534214 86142439 996053 3985513 51230730 249491345
Western 0 0 0 0 0 0 0 0 0 0 0 0 01994 44797855 138606645 7443612 33182996 4367867 20020093 39191234 128748256 2838567 9194235 64342668 2405064841995 40004749 149579896 5829720 28045545 4125550 22635621 29460656 116274498 2862443 7491854 93177984 3675547561996 48993348 191859995 7600036 41232851 6000129 40225809 42262010 163972454 3579361 9934216 110398884 5280785761997 49423270 229080543 7536302 48728527 6653190 44395485 37139955 180172691 4299771 15048720 121395096 5802802681998 52272898 242991336 7980231 52460470 6142942 42440798 39330172 194236411 11655764 40719958 126900608 592039999
Total 1994 308,222,164 1,008,314,123 48,521,173 220,939,229 61,190,824 266,366,130 314,418,736 974,804,952 17,346,804 40,828,237 648,613,500 2,574,113,880 1995 303,268,984 1,178,403,031 47,909,124 251,534,086 62,954,879 322,039,692 333,203,616 1,282,773,527 21,763,653 52,736,128 861,665,484 3,508,726,884 1996 348,316,595 1,431,966,789 54,011,992 303,356,754 71,215,015 400,391,926 381,252,680 1,432,391,005 24,416,886 67,407,513 932,820,540 4,403,282,460 1997 367,498,316 1,782,662,500 61,276,884 398,093,164 75,284,971 480,455,291 404,819,782 1,882,684,822 24,334,126 83,823,571 1,025,970,540 5,015,723,772 1998 378,397,954 1,867,839,696 59,181,463 393,539,788 71,340,203 463,049,113 415,308,209 1,971,110,130 37,094,036 127,840,975 994,674,973 4,925,283,642
IndustrialCommercialDomestic Institutional

Consumers 1985 1986 1987 1988 1989 1990 1991 1992 1993 1994 1995 1996 1997 1998Domestic 190170 206448 224119 243302 264128 286736 304480 337715 371975 404452 436631 471599 503330 548110Institutional 1972 2123 2219 2212 2229 2292 2218 2517Commercial 639 482 538 647 703 757 854 923Industrial 2934 3190 3358 3758 4018 4315 4525 4922Water Supp. & Irr. 189 223 208 261 279 311 316 343
ConsumptionDomestic 177,928,965 188,096,592 198,845,240 210,208,113 222,220,308 234,918,933 261,399,000 275248000 259833000 275,050,000 301,611,000 328,730,000 355,118,000 378,778,000 InstitutionalCommercial 22,450,407 24,607,167 26,971,122 29,562,176 32,402,147 35,514,948 36,640,000 45200000 47607000 48988000 58574000 62916000 67606000 71471000Industrial 125,957,041 138,316,488 151,888,698 166,792,672 183,159,088 201,131,448 206,881,000 246374000 273753000 303991000 328316000 358672000 376742000 413738000Water Supp. & Irr.Others (incl. Commercial) 131,935,611 139,769,308 147,924,252 156,395,580 165,175,118 174,250,844 201,120,000 215,730,000 175,799,000 177,465,000 194,660,000 249,294,000 278,740,000 258,913,000
Total 435,821,617 466,182,388 498,658,191 533,396,365 570,554,515 610,301,225 669,400,000 737352000 709385000 756506000 824587000 936696000 1010600000 1,051,429,000
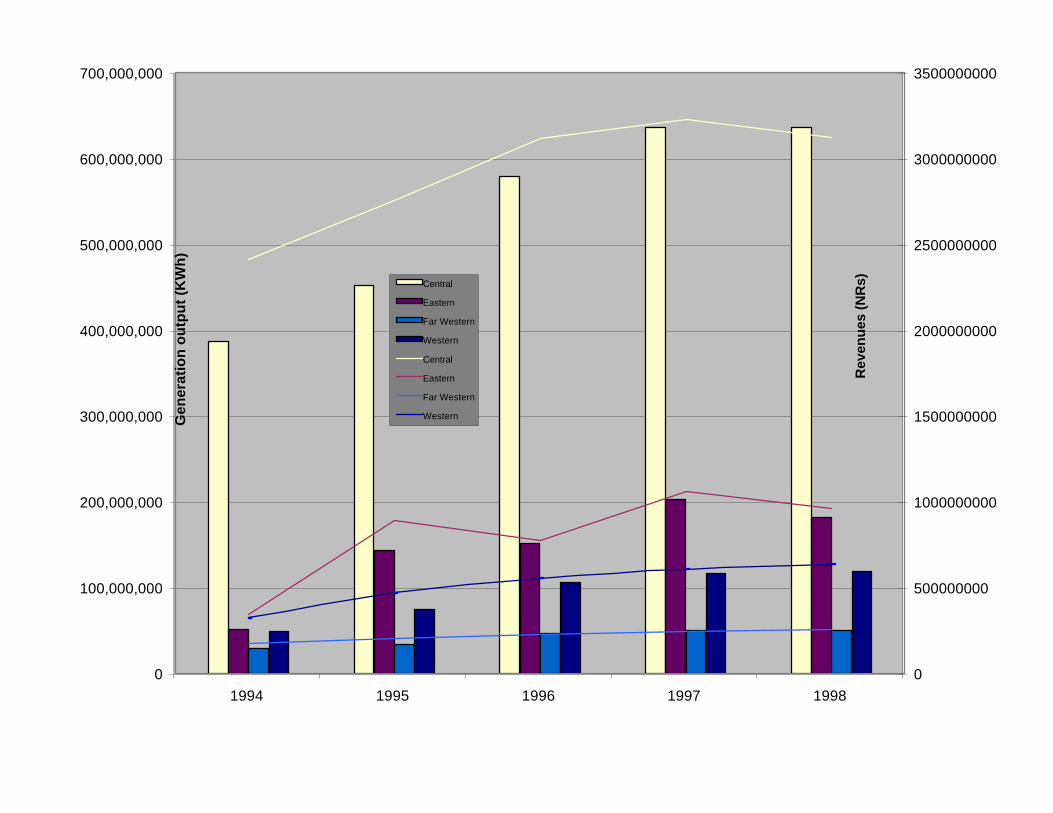
0
100,000,000
200,000,000
300,000,000
400,000,000
500,000,000
600,000,000
700,000,000
1994 1995 1996 1997 1998
Gen
erat
ion
ou
tpu
t (K
Wh
)
0
500000000
1000000000
1500000000
2000000000
2500000000
3000000000
3500000000
Rev
enu
es (
NR
s)Central
Eastern
Far Western
Western
Central
Eastern
Far Western
Western

Energy Sales & RevenuesNEA
0.E+00
1.E+08
2.E+08
3.E+08
4.E+08
5.E+08
1994 1995 1996 1997 1998
KW
h
0.E+00
5.E+08
1.E+09
2.E+09
2.E+09
3.E+09
3.E+09
NR
S
Domestic Industrial
Institutional Commercial
Domestic Institutional
Commercial Industrial

-
50,000,000
100,000,000
150,000,000
200,000,000
250,000,000
300,000,000
350,000,000
400,000,000
1985 1986 1987 1988 1989 1990 1991 1992 1993 1994 1995 1996 1997 1998
0
100000
200000
300000
400000
500000
600000
ConsumptionConsumersExpon. (Consumers)Expon. (Consumption)