asian development outlook 2015 - financing asia's future growth
DESCRIPTION
Why worry about financial development? The remarkable story ofgrowth in developing Asia is well known. Yet, other than in the financialcenters of Singapore and Hong Kong, China, the region’s financialsystems—its commercial banks and its bond and equity markets—remainrelatively backward. Despite considerable widening and deepening sincethe Asian financial crisis of 1997–1998, developing Asia’s financial sectorlags well behind the advancing frontier of global finance. The starkcontrast between Asia’s dynamic real sector and its backward financialsector begs the question why now is the time for policy makers to turntheir attention toward the sector.TRANSCRIPT

This chapter was written by Donghyun Park with Gemma Esther Estrada, Minsoo Lee, and Arief Ramayandi, all from the Economic Research and Regional Cooperation Department. It draws on the background papers listed at the end of the chapter. Background materials from Noritaka Akamatsu, Christopher Edmonds, and Joshua Greene are gratefully acknowledged.
2.1.1 Aggregate GDP growth rates in developing Asia, 2000–2016
Average2000−2007 Average
2008−2016
%
0
3
6
9
12
2000 2002 2004 2006 2008 2010 2012 2014 2016
Source: Asian Development Outlook database.
Financing Asia’s future growth
Why worry about fi nancial development? The remarkable story of growth in developing Asia is well known. Yet, other than in the fi nancial centers of Singapore and Hong Kong, China, the region’s fi nancial systems—its commercial banks and its bond and equity markets—remain relatively backward. Despite considerable widening and deepening since the Asian fi nancial crisis of 1997–1998, developing Asia’s fi nancial sector lags well behind the advancing frontier of global fi nance. The stark contrast between Asia’s dynamic real sector and its backward fi nancial sector begs the question why now is the time for policy makers to turn their attention toward the sector.
Moreover, the global fi nancial crisis of 2008–2009 made many suspicious of unfettered fi nancial development and innovation. To many observers, the global crisis was the result of too much fi nancial innovation and too many sophisticated products like mortgage-backed securities and collateralized debt obligations that profi ted only a narrow group of fi rms while exposing the entire fi nancial system—and ultimately the real sector—to excessive risk. Although developing Asia is a long way from that state of fi nancial sophistication, the extent of the global crisis has engendered a certain caution toward the sector.
Yet there are a number of reasons why a sound and effi cient fi nancial system matters more than ever for developing Asia. First, Asia’s growth slowed in the wake of the global crisis (Figure 2.1.1), but a robust fi nancial sector can help allocate resources more effi ciently, fostering a dynamic private sector to reignite growth. Second, fi nancial development can be inclusive, but this outcome cannot be taken for granted. Action is needed to ensure that fi nancial development aligns with social equity goals. Finally, safeguarding fi nancial stability must be a cornerstone of the fi nancial development agenda. Financial instability, especially fi nancial crisis, can derail growth and harm the poor, wiping out the benefi ts from fi nancial deepening.
Thus the convergence of three strategic challenges—reigniting economic growth, tackling rising inequality, and maintaining fi nancial stability—adds urgency to the long-standing task of building sound and effi cient fi nancial systems in developing Asia.

2 Asian Development Outlook 2015
The case for financial sector deepening
The region’s financial system appears to be in much better shape today than it was during the Asian financial crisis of 1997–1998. While that crisis had multiple causes, inefficient financial systems that failed to allocate capital inflows to productive uses lay at the heart of it. The consequent deterioration in the quality of investments eventually precipitated capital outflows and the outbreak of the crisis. Extensive reform and restructuring greatly improved the health of the region’s banking system after that financial debacle (Figure 2.1.2).
The impression remains that finance is relatively backward in developing Asia, but the data suggest otherwise. The financial sector in the region compares well with those of its developing economy peers outside Asia. Yet it clearly lags far behind financial sectors in the advanced economies. Should policy makers be concerned about this gap? The answer depends on the extent that financial development supports the economy’s broader development goals. Turning to the evidence will help make the case that closing the gap is important for future growth in the region.
The state of Asian financial systems Evaluating the state of developing Asia’s financial systems entails benchmarking the region against financial development in other parts of the world. To get a clear view of the issues, one must factor in wide heterogeneity within the region. Using the latest data from the World Bank’s financial structure database, Table 2.1.1 shows the size of banking system deposits, stock markets, and public and private bond markets, all measured as a percentage of GDP for each region of the world and each subregion within Asia.
Developing Asia has on average a banking system that equals 60% of GDP, stock market capitalization at 71% of GDP, public bond markets at 26% of GDP, and private bonds markets at 20%. Comparing developing Asia with other developing regions around the world, its financial system—whether measured by bank deposits or stock and bond market size—is larger than those of other developing regions, and also larger than those of high-income economies that are not members of the Organisation for Economic Co-operation and Development (OECD). On the other hand, compared with OECD members, developing Asia has a banking system and especially bond markets that are quite small.
Asia has two subregions whose financial systems are quite underdeveloped: Central Asia and the Pacific. More specifically, the financial systems of these economies are heavily dominated by banks,
2.1.2 Bank capital to total assets in crisis-hit Asian countries
%
Indonesia Republicof Korea
Malaysia Philippines Thailand
20002013
0
3
6
9
12
15
Source: World Bank, World Development Indicators online database (accessed 15 September 2014).

Financing Asia’s future growth 3
and the bond and stock markets remain underdeveloped (Annex table, page ??). Thus, funding in Central Asia and the Pacific comes largely through the banking system. Within Central Asia, Kazakhstan has the largest financial system, with a banking system amounting to 27% of GDP and a stock market at 28%. The financial systems of other economies in the region are much smaller by comparison.
In the Pacific, Papua New Guinea is the only economy with a stock market, which is large relative to GDP, at 80%. Banking systems in the region are rather small except in Vanuatu, where it equals 73% of GDP. The financial sectors in the three other Asian subregions—East Asia, Southeast Asia, and South Asia—are much more developed. Variation exists within each region, but on average financial sectors are larger than those in Central Asia and the Pacific.
As the comparison in Table 2.1.1 shows, developing Asia’s financial sectors compare well with those in other parts of the developing world. However, much of this comes from the relatively advanced state of financial institutions in East Asia and Southeast Asia—especially those in Singapore and Hong Kong, China, which have become global financial centers. Cross-country variation reveals that some economies in the region suffer a financial sector gap in comparison with even other developing economies (Annex table, page ??).
Relative financial backwardness has consequences for the cost of capital. Businesses in economies with lower financial development generally have to pay a higher premium over the deposit rate than those operating in financially advanced economies. Looking at the
2.1.1 Financial structure around the world, 2011
Economy/Subregion Banking system Stock market Public bonds Private bondsDeveloping Asia 60.0 71.0 25.7 20.4 Central Asia 23.1 25.0 0.0 0.0 East Asia 60.1 73.4 25.9 27.8 South Asia 57.0 60.3 27.0 4.0 Southeast Asia 67.9 77.7 28.3 11.8 The Pacific 44.5 54.1 0.0 0.0Rest of the developing world 43.5 50.2 18.4 8.5 Europe and Central Asia 42.7 25.4 17.5 0.8 Latin America and the Caribbean 41.9 47.3 25.2 13.5 Middle East and North Africa 67.4 40.1 1.9 0.0 Sub-Saharan Africa 38.4 103.5 8.7 5.2High income 104.3 82.0 78.7 53.0 OECD members 110.2 84.7 85.3 57.6 Others 41.2 49.3 2.8 0.0
OECD = Organisation for Economic Co-operation and Development.Notes: Banking systems are measured by the amount of deposits, stock markets by capitalization, and public and private bond markets by bonds outstanding, all expressed as a percentage of GDP. Regional averages are weighted by GDP. The OECD consists of Australia, Austria, Belgium, Canada, Czech Republic, Denmark, Estonia, Finland, France, Germany, Greece, Iceland, Ireland, Israel, Italy, Japan, Luxembourg, Netherlands, New Zealand, Norway, Poland, Portugal, the Slovak Republic, Slovenia, Spain, Sweden, Switzerland, United Kingdom, and United States. Other high-income economies cover Antigua and Barbuda; Aruba; Bahamas; Bahrain; Barbados; Bermuda; Croatia; Cyprus; Equatorial Guinea; Kuwait; Latvia; Lithuania; Macao, China; Malta; Monaco; Oman; Puerto Rico; Qatar; Russian Federation; Saudi Arabia; Trinidad and Tobago; United Arab Emirates; and Uruguay.Source: ADB estimates based on data from Beck et al. (2000, 2009) and Cihak et al. (2012).

4 Asian Development Outlook 2015
average interest rate spread, developing Asia again compares well with Latin America but faces a considerable funding disadvantage against the advanced economies (Figure 2.1.3).
Somewhat contrary to the conventional wisdom of financial backwardness, the review above finds Asia’s financial development comparing favorably with that of other parts of the developing world, though it is still well behind the advanced economies. But purely quantitative measures of financial development—such as the ratio of bank deposits or liquid liabilities to GDP—are far from perfect, as comparisons of sector size do not always capture differences in quality or efficiency. For example, Dekle and Pundit (forthcoming) points out financial development indicators should ideally encompass access and efficiency in addition to depth. And, according to Aizenman, Jinjarak, and Park (2015), the quality of finance, evident in the direction of credit to the most productive sectors of the economy, matters at least as much as the quantity of finance. However, greater liquid liabilities (a measure of financial development) often mean a tighter lending–deposit spread (a measure of financial efficiency), suggesting a positive relationship between the two (Figure 2.1.4).
As noted above, the case for a sound and efficient financial sector in Asia rests on three pillars. First, financial sector development can yield a growth dividend in light of the large gap that still separates the region from the advanced economies. Second, financial access must be expanded and broadened to achieve more inclusive growth. Third, the region must safeguard its financial stability even as it develops its financial sector. The next three sections examine each pillar in turn.
Financial development and growthA robust and efficient financial system promotes growth by channeling resources to their most productive uses, thereby fostering more efficient resource allocation. A stronger and better financial system can buoy growth by boosting aggregate savings and investment rates, thereby speeding the accumulation of physical capital. Financial development further promotes growth by strengthening competition and stimulating innovation, thereby fostering dynamic efficiency.
Does the evidence support a positive link between finance and growth? Many studies have shown—using cross-country data, panel data that span time and economies, corporate data, or country case studies—that financial system depth significantly facilitates growth. In particular, higher growth is often associated with having a bigger financial system, as measured by liquid liabilities, private credit, and stock market capitalization.
Revealing cross-country regression studies include King and Levine (1993), which finds that financial depth positively influences growth in income, capital stock, and productivity in a sample of
2.1.4 Liquid liabilities and lending–deposit spread
Liquid liabilities (% of GDP)
0
100
200
300
400
0 20 40 60 80Lending−deposit spread (%)
199020002011Developing Asia (1980, 1990, 2000, and 2011)
1980
Sources: Beck et al. 2000, 2009; Cihak et al. 2012.
2.1.3 Lending–deposit spreads, 2011%
0
5
10
15
20
Developing Asia Latin America andthe Caribbean
OECD
OECD = Organisation for Economic Co-operation and Development.Sources: Beck et al. 2000, 2009; Cihak et al. 2012.

Financing Asia’s future growth 5
77 countries during 1960–1989; Levine and Zervos (1998), which finds that banking development and stock market liquidity positively predict these same three variables even after controlling for political factors; and Beck and Levine (2004), which reexamines the issue by applying panel econometric techniques to new data and finds stock markets and banks positively influencing economic growth. More recently, Cihak et al. (2013) replicates the model of King and Levine (1993), using an updated version of the World Bank Global Financial Development Database and confirms the growth-enhancing effects of financial development previously cited.
Despite numerous studies that have explored the relationships between finance and growth, weaknesses remain in measures of financial development (Demirguc-Kunt and Levine 2008). Unfortunately, no existing indicator adequately captures these financial services, so empirical studies continue to rely on traditional measures of financial development (Levine and Zervos 1998, Demirguc-Kunt and Levine 2008).
Like measures of financial development, causality is the other issue that clouds understanding of the finance–growth relationship. Because fast-growing economies require more finance, it may be that growth promotes finance, rather than the other way round. A seminal study by Rajan and Zingales (1998) is one of the very few papers that effectively addresses causality. To mitigate the issue of endogeneity, or two-way causality, the empirical analysis in this section generates estimates using generalized method of moments.
Analysis in this section further assesses the empirical relationship between financial development and economic growth. Building upon the large body of existing research, it has three noteworthy features. First, it updates the sample period to 2011. Second, it looks at how country characteristics—such as advanced versus developing status—affect the finance–growth nexus. Third, it incorporates new variables, distinguishing in particular between fixed and flexible exchange rate regimes. Box 2.1.1 explains the data and methodology used for the econometric analysis.
Several interesting findings emerge from the empirical analysis (Table 2.1.2). The most important is that, regardless of the structure of the financial system, financial development benefits economic growth (model 1). The results clearly show that, regardless of the relative importance of banks versus capital markets (as the financial system in some economies may be dominated by banks, while capital markets play a bigger role in others), the development of the financial system as a whole has a positive and significant effect on economic growth. Larger shares of banking sector (model 2) and stock market activity (model 3) relative to GDP are both positively associated with higher economic growth. The positive effect of financial development on growth is especially evident in developing economies, and even more so in developing Asia. This finding is consistent with studies that find financial development having an effect on growth that is not linear (e.g., Ju and Wei 2011). Estrada, Park, and Ramayandi (forthcoming) offers a comprehensive discussion of all empirical results, including those pertaining to developing countries.

6 Asian Development Outlook 2015
2.1.1 Data and methodology for analyzing the relationship between financial development and economic growth
A new study by Estrada, Park, and Ramayandi (forthcoming) explores the impact of financial development on economic growth. Following the general approach in the literature, econometric techniques are applied to examine the relationship between financial development and growth, with the following basic structure:
xi,t = α + β1[FD]i,t + γ[ER] + λ[Other]i,t + εi,t
where a number of financial sector development indicators [FD], the exchange rate regime [ER], and a number of financial and nonfinancial control variables [Other] are assumed to affect economic growth (x).
For measures of economic growth, the paper uses a series of non-overlapping 5-year averages of GDP growth per capita for each of the sample countries.
Three indicators of financial development are used in this study:
(i) Total liquid liabilities relative to GDP. This measures the relative size and depth of the financial sector, consisting of currency plus demand and the interest-bearing liabilities of banks and nonbank financial intermediaries. This is the broadest measure of financial intermediation activity, as it covers all banks, central banks, and nonfinancial intermediary activities.
(ii) Private credit from deposit money banks relative to GDP. This measure isolates the impact of the banking sector.
(iii) Stock market capitalization relative to GDP. This gauges the size of an equity market relative to the economy.
Data on liquid liabilities are obtained from the Financial Development and Structure Dataset of Beck, Demirguc-Kunt, and Levine (2000, 2009) and Cihak et al. (2012), updated in November 2013. Data on private credit and stock market capitalization are taken from the World Bank’s World Development Indicators online database.
Representation of exchange rate regimes considers both the de facto classification and the International Monetary Fund official classification constructed by Reinhart and Rogoff (2004) and updated by Ilzetski, Reinhart, and Rogoff (2011).
A number of variables are included to control for other factors affecting growth, represented by [Other] in the behavioral equation. The choice of these variables closely follows those used in many growth regression analyses done previously (Beck, Levine, and Loayza 2000; Edison et al. 2002; Levine and Zervos 1998).
In addition, the present study includes three measures of financial openness, two de facto and one de jure. Financial openness is included because it is related to financial development yet distinct from it, and it may influence growth.
The full sample of the GDP per capita growth regression is a cross-country panel data set covering 108 economies (of which 20 are in developing Asia) with five non-overlapping 5-year periods from 1977 to 2011. A full treatment of data and methodology is in Estrada, Park, and Ramayandi (forthcoming).
2.1.2 The impact of financial development on growth
Variables
(1) (2) (3) (4) (5) (6)Ilzetski, Reinhart, and Rogoff de facto International Monetary Fund de jure
Total flows L and M-F Chinn and Ito Total flows L and M-F Chinn and ItoModel 1 Liquid liabilities, % of GDP 2.723** 2.778* 3.033** 2.612** 2.854* 2.797*
(1.360) (1.534) (1.484) (1.296) (1.485) (1.434)Model 2 Private credit, % of GDP 1.509* 1.507* 1.608** 1.525* 1.748** 1.745**
(0.821) (0.774) (0.715) (0.837) (0.832) (0.729)Model 3 Stock market capitalization, % of GDP 1.485* 1.341* 2.252*** 3.028*** 2.400*** 3.516***
(0.796) (0.792) (0.752) (0.530) (0.439) (0.656)
Note: Total flows, Lane and Milesi-Ferretti (L and M-F, 2007), and Chinn and Ito (2008) refer to different measures of financial openness. Ilzetski, Reinhart, and Rogoff (2011) de facto and International Monetary Fund de jure refer to different definitions of foreign exchange rate regime. Robust standard errors in parentheses; *** p < 0.01, ** p < 0.05, * p < 0.1. Estimations were done through the generalized method of moments, with the following control variables: initial income per capita, government spending, inflation, years of schooling, trade openness, foreign exchange rate regime, and period indicators. Source: Estrada, Park, and Ramayandi (forthcoming).

Financing Asia’s future growth 7
The results for the example of developing Asia illustrate the potential size of the effect on economic growth. For example, boosting developing Asia’s average ratio to GDP of liquid liabilities—currency plus checking and interest-bearing accounts in financial institutions—from 65% to 75% adds almost 0.4 percentage points to average annual GDP growth per capita.1 Also, on average, an increase of 10 percentage points in developing Asia’s average ratio of private credit to GDP (an alternative measure of financial depth) is associated with higher growth in GDP per capita by 0.3 percentage points per year. These numbers are far from definitive but do give us a rough, first-order indication of the effect of finance on growth.
Interestingly, analysis does not yield any robust results about the effect of the exchange rate regime on growth or the finance–growth nexus. While many Asian economies have moved toward more flexible exchange rates since the Asian financial crisis, evidence suggests that more flexible exchange rates do not necessarily promote economic growth.
The finance–inclusion link The role of financial development in tackling inequality has received much less attention than, say, that of fiscal policy. So how exactly does financial development influence income inequality? Economic theory provides conflicting predictions.2 On the one hand, by making financial services more available to the poor, financial development can narrow income inequality. Financial services can enhance opportunities for the poor to pursue more education, for example, or start a new business. On the other hand, if financial development largely benefits senior finance professionals and other wealthy individuals, with little benefit for the poor, it may exacerbate income inequality.
The relationship between financial development and income inequality can be through indirect channels. Demirguc-Kent and Levine (2009) argue that financial development can affect income inequality indirectly by changing the composition of labor demand. If expanded financial services boost demand for low-skilled workers, wages for low-skill workers increase, mitigating income inequality. On the other hand, if increased financial services raise demand for high-skilled workers and hence their wages, income inequality can worsen.
As conceptual grounds exist for both beneficial and adverse effects, the nexus between financial development and inequality is ultimately an empirical issue that must be settled by empirical analysis. Such an exercise is performed here, analyzing the factors possibly affecting the extent to which financial development influences income inequality, using the data and methodology outlined in Box 2.1.2.
From the empirical analysis, financial development has a U-shaped effect on income inequality (Table 2.1.3). As the financial system develops, inequality improves until it approaches the mean level of financial development, but then tends to deteriorate as the financial system continues to develop. To test the robustness of the results, two additional analyses—instrumental variables estimation and growth form regression—are performed to address possible endogeneity issues. By and large, the results of both analyses are consistent with earlier results.

8 Asian Development Outlook 2015
2.1.2 Data and methodology for analyzing the relationship between financial development and income inequality
This box describes the data and econometric methodology used to explore the impact of financial development and income inequality. Financial development is measured using three ratios: liquidity liabilities to GDP, private credit from deposit money banks to GDP, and stock market capitalization to GDP. The analysis applies data obtained from the World Bank’s Global Financial Development Database for financial development indicators. The summary statistics are reported in Park and Shin (forthcoming a).
The exercise uses panel regression with fixed effects because it is essential when investigating the causal effect of financial development to control for unobserved variables specific to individual economies. The analysis experiments with two alternative measures of income inequality: the Gini coefficient of market income and the Gini coefficient of disposable income. In light of the well-known nonlinear relationship between per capita GDP and income inequality—the Kuznets curve—the linear, square, and cube terms of per capita GDP are included in the regressions. Nonlinearity in financial development is similarly taken into account.
A number of other factors expected to affect income inequality have likewise been added: economic openness, the share of high technology exports in manufacturing exports, the share of agriculture in employment, and government size.
Two significant drivers of income inequality are globalization (here interpreted as trade openness and measured by the ratio of the sum of exports and imports to GDP) and progress in acquiring and deploying technological skills (see for example, Jaumotte, Lall, and Papageorgiou (2013) and the literature surveyed in the paper.). Trade influences income inequality by widening the wage gap between high- and low-skilled workers. Skills-biased technological progress raises the wages of highly skilled workers more than of low-skill workers, which widens income inequality. A higher share of agriculture in employment is expected to worsen income inequality as agricultural workers tend to earn low wages. Finally, government size, measured as the share of government expenditure in GDP, is included as some government expenditure redistributes wealth.
While the panel regression results are suggestive, they do not prove causal relation running from financial
development to income inequality. To overcome this problem, two additional analyses are performed. The first uses instrumental variables estimation. The second entails transforming regression into its growth form. As the regressions are based on panel regression with fixed effects, one cannot use legal origins or latitude as an instrumental variable because they do not vary over time. Analysis uses, instead, data on law and order collected from the International Country Risk Guide, which assesses law separately from order, each with a score of 0–3 points. The law score captures the strength and impartiality of the legal system, while the order score considers popular observance of the law.
Factors that influence how much financial development affects income inequality are investigated, with the following being of particular interest:
(i) Ratio of primary schooling. A main channel by which financial development influences income inequality is through the provision of opportunities for the poor to build human capital. If the rich and the poor had similar stocks of human capital, the impact of financial development on equity would be lower.
(ii) Institutions. Stronger institutions and better governance encourage financial institutions to lend on the basis of commercial merit rather than personal or business connections, which provides more opportunities to the poor.
(iii) Macroeconomic stability. Macroeconomic stability multiplies the benefits of financial development.
To get the ratio of primary schooling, average years of primary schooling is divided by average years of total schooling, based on data collected from Barro and Lee (2013). While this ratio does not directly capture the education gap between the rich and the poor, a high ratio implies there is more scope for the poor to receive additional education. The quality of institutions is measured by law and order. Finally, macroeconomic stability is measured by the inflation rate. Park and Shin (forthcoming a) explain in more depth the data and methodology.

Financing Asia’s future growth 9
With respect to the impact of financial development on income inequality, an interesting and natural follow-up question is to ask what factors influence the degree of the impact. That is, what are the factors that determine whether or not financial development will have a significant effect on income inequality? To answer this, one needs to look at three factors for which there are conceptual grounds for an effect on the finance–inequality nexus: the ratio of primary schooling to total schooling, law and order, and macroeconomic stability.
As expected, the empirical evidence indicates that when the ratio of primary schooling increases and law and order improves, financial development becomes more effective at reducing inequality. On the other hand, macroeconomic stability does not affect the relationship. The findings imply that an important channel for the pro-equity effect of financial development is education, reaffirming the potential of education as an equalizing force. The education channel can be strengthened by policies that make it easier for the poor to finance their education by borrowing from financial institutions.
The salient policy implication of the empirical analysis for developing Asia is that financial development per se does not automatically reduce income inequality. In fact, the empirical evidence is mixed and does not point to a clear, definite relationship between the two. Empirical ambiguity thus mirrors theoretical ambiguity. Intuitively, reduced inequality is more likely the product of financial inclusion than of financial development. It would therefore be worthwhile to include financial inclusion as an additional independent variable in the empirical analysis—if only the data were available. There is, however, negative correlation between the Gini coefficient and financial inclusion, which supports the conjecture (Figure 2.1.5). Financial development must be accompanied by financial inclusion to foster inclusive growth.
2.1.3 Gini coefficient and financial development
Variables
GINI index (market income) GINI index (disposable income)
1 2 3 4 5 6Liquid liabilities –0.080 –0.209** –0.224 –0.107* –0.251*** -0.234* (% of GDP) [0.050] [0.099] [0.138] [0.059] [0.091] [0.128]Square of liquid liabilities 0.012 0.027* 0.034* 0.015* 0.034** 0.034** (% of GDP) [0.008] [0.014] [0.018] [0.009] [0.013] [0.017]Observations 3,475 1,961 1,524 3,475 1,961 1,524Adjusted R-squared 0.034 0.161 0.107 0.009 0.091 0.074Number of groups 153 131 121 153 131 121
Note: In columns 1, 2, and 3, the dependent variable is the Gini index of market income, while in columns 4, 5, and 6 the dependent variable is the Gini index of disposable income. Each column refers to a different specification, with a different set of independent variables. The ratio of liquid liabilities to GDP is used as a proxy for financial development. The regression results are from a panel regression with fixed effects. Numbers in parentheses are standard errors. The statistical significance at the 1%, 5%, and 10% levels is denoted by ***, **, and *. Control variables not reported above are openness, share of agriculture in total employment, government expenditure, and high technology exports.Source: Park and Shin, forthcoming a.
2.1.5 Income inequality and financial inclusion, 2011Gini index of inequality in equivalizedhousehold disposable income
y = −0.364x + 39.264[0.170] [1.842]
10
20
30
40
50
60
0 10 20 30 40Loan from a financial institution in the past year,
income, bottom 40% (% of age 15+)
Source: Park and Shin, forthcoming a.

10 Asian Development Outlook 2015
Issues surrounding financial stability However beneficial financial development, innovation, and liberalization generally are, they sometimes destabilize financial systems. While these virtues strengthen and improve the financial system in the long run, they may jeopardize stability in the short run. Yet financial instability in general and financial crisis in particular can have huge repercussions on growth. The global financial crisis of 2008–2009 quickly spilled over from the financial sector into the real economy and almost brought the world to its knees. In 2009, global output stood virtually still—its worst performance in the postwar era—and the volume of world trade fell by over 10%. The global crisis sparked widespread fears of a repeat of the Great Depression, which also had its origins in the financial markets. Furthermore, the damage that a financial crisis inflicts on growth can be long lived. The world economy did not fully recover from the Great Depression until World War II; it is still struggling to shake off the effects of the global economic crisis more than half a decade later.
Closer to home, the devastating Asian financial crisis of 1997–1998 brought the East Asian Miracle to a rude halt. The result of a toxic combination of large capital inflows and financial underdevelopment that eroded the quality of investment, the Asian financial crisis inflicted on several high-flying miracle economies real GDP contraction as it peaked in 1998: Indonesia by 13%, the Republic of Korea by 6%, Malaysia by 7%, and Thailand by 11%—in each case a sharp drop from the period immediately before the crisis (Figure 2.1.6). While the sky-high pre-crisis growth rates may have partly reflected unsustainably high investment rates, the legacy effects of the crisis itself may have contributed to the long-term decline in growth since then. It is therefore of paramount importance for Asia that the financial system itself does not generate growth-crippling instability or crisis.
Financial instability not only harms growth but also exacerbates poverty and inequality. Intuitively, financial instability adversely affects inclusive growth because the poor are disproportionately defenseless against financial crises. For example, the sharp increase in the unemployment rate that often accompanies crisis-induced recessions has a bigger impact on the poor because, by definition, they have less financial and real wealth to tide them over the hard times. After the global financial crisis, the unemployment rate doubled in many European Union economies—and tripled in the hardest hit (Figure 2.1.7). During the Asian financial crisis, many households were hurt by unemployment and reduced earnings made all the worse by rising prices. Lacking in assets and social protection, the poor and near-poor were the worst hit. Suryahadi, Sumarto, and Pritchett (2003) showed that the poverty rate in Indonesia more than doubled from about 15% at the onset of the
2.1.6 Growth rates before and after the Asian financial crisis, selected Asian economies
Indonesia Republic of Korea Malaysia Thailand
%
−15
−10
−5
0
5
10
1990−19961998
Source: International Monetary Fund, World Economic Outlook Database, October 2014.
2.1.7 Unemployment rates before and after the global financial crisis, selected European Union economies
%
2000−20072008−2013
Greece Ireland Portugal Spain0
5
10
15
20
25
Source: International Monetary Fund, World Economic Outlook Database, October 2014.

Financing Asia’s future growth 11
crisis in mid-1997 to a high of 33% near the end of 1998, pushing some 36 million into poverty. Knowles, Pernia, and Racelis (1999) showed that income distribution worsened during the crisis in Thailand and the Philippines.
The need for financial development To sum up, developing Asia now compares favorably with other parts of the developing world in terms of financial depth, but it still lags the advanced economies by a wide margin. Because financial depth has a significant and positive effect on economic growth, this finding suggests that the region can reap a growth dividend from further financial development. But financial development does not necessarily promote more inclusive growth. Further, the region does not visibly outperform other developing regions in terms of financial inclusion. This means that developing Asia has scope for extending access for the poor to financial services, which currently leave them underserved. Finally, the high costs of financial crises on growth and equity calls for continued vigilance against financial instability—all the more so as external and homegrown risks to stability lurk in the background, notwithstanding the improved health of the region’s financial system.

12 Asian Development Outlook 2015
Financial development for growth
Four key areas of Asia’s financial development will matter greatly for sustaining growth in the coming years. First, the region will require efficient finance to continue channeling affordable credit to firms in adequate amounts and support much-desired investment. Second, banks in particular have to be kept well-tuned, as they remain an essential component of robust financial systems in the region. Third, the mounting importance of productivity growth as a driver of growth in Asia highlights the need to knock down barriers to long-term finance, especially for infrastructure and innovation. Finally, to deepen the pool of long-term capital, it is important that the region continue to develop domestic bond markets, building on the considerable progress already made in this area.
Credit, investment, and growth in AsiaHigh rates of investment, fueled by high saving rates, helped developing Asia rapidly build up its stock of productive capital. This capital contributed greatly in turn to the region’s outstanding growth record in recent decades. Today, productivity growth is due to take a bigger role in sustaining the region’s growth. Even so, investment remains an important factor. The distinction between the two is in truth sometimes blurred. Investment in infrastructure such as roads, ports, and power plants, for instance, can improve the productivity of all firms and industries.
The most immediate and direct contribution of the financial system to economic growth in Asia would therefore be to channel credit to firms and industries for investment and productivity. In this regard, the biggest challenges would be to increase the availability of funds and to lower their cost. To date, the region still struggles with inefficient finance, especially in lower-income economies, where financial sectors are largely underdeveloped (see Banking sector development, credit, and investment on page XX). The narrow availability and high cost of credit traces largely to inefficiency in the financial sector, which is indicated by high interest rate spreads and sometimes excessive allocation of credit to state-owned firms at the expense of the more dynamic private sector.
Financial sector efficiency and creditAs financial systems become more efficient, the availability of credit rises and its cost goes down. A widely used indicator of financial sector efficiency is the interest rate spread, or the gap between the lending rate and the deposit rate. While it is an imperfect measure, affected by such factors as government-imposed interest rate controls, it nevertheless indicates comparative efficiency, with a narrower spread showing

Financing Asia’s future growth 13
greater competitiveness and, therefore, efficiency. Data for developing Asia show a tighter interest rate spread associated with a higher share of private credit in GDP (Figure 2.2.1) and credit at lower cost (Figure 2.2.2). This suggests that a more efficient financial sector can indeed unlock more affordable credit in the region.
Credit for state and private enterpriseIn some Asian economies, the government directs banks to funnel a substantial share of credit to state-owned enterprises (SOEs). This is especially true if the banks themselves are owned by the state. But SOEs tend to be less efficient than private firms. They are subject to government interference and are less driven by the profit motive. As credit to SOEs siphons credit away from the more efficient private sector, it weakens productivity across the entire economy. The People’s Republic of China (PRC) is perhaps the most widely recognized example of an economy facing such problems.
Several studies provide evidence that resource misallocation by imperfect financial markets can substantially reduce productivity and growth in the PRC. One by Hsieh and Klenow (2009) finds that reallocating capital and labor within the manufacturing sector to equalize marginal products (or make the most efficient use of inputs) to the extent observed in the US could increase total factor productivity by 30%–50% in the PRC and by 40%–60% in India. Another study by Dollar and Wei (2007) finds that transferring some of the capital employed by SOEs to the private sector to equalize the marginal revenue product of capital could raise GDP by 5%, and still others by Brandt, Tombe, and Zhu (2013) and Song, Storesletten, and Zilibotti (2011) find that credit extended to SOEs significantly retards economic growth.
Banking sector development, credit, and investmentBanks underlie sound and efficient financial systems in developing Asia. Even with the rapid growth of capital markets in middle-income countries, they continue to dominate the financial landscape across the region. For that reason, a well-functioning banking sector that efficiently channels resources to investment and other productive activities remains indispensable for economic growth.
Vibrant capital markets complement sound and efficient banks but do not substitute for them. Financially advanced economies such as the US and United Kingdom have large and sophisticated banks in addition to deep and liquid equity and bond markets. It therefore makes sense for middle-income Asian countries to continue developing their banking sectors even as they nurture their bond markets. However, for
2.2.1 Private credit and lending–deposit spread, developing Asia
Private credit (% of GDP)
1980199020002011
0 10 20 30 40Lending−deposit spread, percentage points
0
50
100
150
200
250
Source: World Bank, World Development Indicators online database (accessed 15 September 2014).
2.2.2 Real lending rate and lending–deposit spread, developing Asia
Real lending rate (%)
1980199020002011
−20
0
20
40
0 10 20 30 40Lending−deposit spread, percentage points
Source: World Bank, World Development Indicators online database (accessed 15 September 2014).

14 Asian Development Outlook 2015
2.2.1 Banks in the Pacific
The availability of commercial banking services in the Pacific is generally low, and customers in most countries have few choices. Kiribati and Tuvalu have only one commercial bank each, while in the Republic of the Marshall Islands and the Federated States of Micronesia have two, one domestic bank and one a branch of a US bank. No commercial bank has operated in Nauru since 2006, when the Bank of Nauru went bankrupt.
Bank coverage in the Pacific appears to be in line with that found in other less-developed regions. The Pacific banking system’s total assets as a proportion of GDP is comparable with the proportion in low-income economies in Asia, and banks are generally well capitalized. Rising mobile phone usage has opened up opportunities for mobile banking and is expanding financial inclusion, particularly in remote rural areas.
The number of depositors is more or less comparable with numbers found in other low- and middle-income economies. However, the relatively small number of borrowers suggests there may be excess liquidity (box figure). Large public institutional investors—provident or trust funds—provide a large portion of deposits in many banking systems in the Pacific, which may partly explain the gap between bank deposits and lending in the region.
Lending in the Pacific is hindered by the difficulty of using land as collateral because of customary systems of communal land ownership. To alleviate this, Pacific governments are working with development partners on reform to secured transactions that will facilitate the use of such movable property as crops, machinery, vehicles, and future earnings as collateral for commercial loans.
Meanwhile, limited opportunities for productive private investment constrain demand for credit. Another constraint on demand is the high cost of credit, as interest rate spreads in the Pacific are generally wider than in other developing regions. High lending rates reflect not only heightened political and macroeconomic risks, but also the high transaction costs of catering to a small and dispersed clientele.
1 Commercial bank deposits and loans in Singapore and the Pacific
Per 1,000 adults
Kiribati PapuaNew
Guinea
Samoa SolomonIslands
Timor−Leste
Singapore
%
0
15
30
45
0
600
1,200
1,800
2,400
DepositorsBorrowers
Borrower−to−depositor ratioAverage interest rate spread
60
Sources: People’s Bank of China quarterly survey of production capacity utilization, National Bureau of Statistics (www.stats.gov.cn), and ADB estimates.
lower-income Asian countries such as the Pacific island states, where banks are the predominant form of finance, bank reform remains the overriding challenge of financial sector development (Box 2.2.1).
In Asian economies where banks and capital markets are currently underdeveloped, more efficient finance can ratchet up investment by channeling cheaper credit to firms and thereby boosting productive capacity and growth potential. Data from a sample of major countries in developing Asia and Latin America, where banks are often the main source of financing for firms, highlight the nexus between finance and investment as well as that between investment and growth. Figure 2.2.3 shows a positive relationship between the ratio of bank assets (and particularly loans) to GDP and the ratio of investment to GDP, and Figure 2.2.4 displays a positive relationship between the investment rate and economic growth. Together, the two figures show that countries with larger banking sectors invest more and grow faster.
When comparing Asian and Latin American economies, an interesting and significant pattern emerges. The positive relationship between the banking sector and investment on the one hand, and between investment and economic growth on the other, appears more pronounced in Asia.

Financing Asia’s future growth 15
This suggests that financial development matters more for economic growth in Asia than in the rest of the world. Figure 2.2.5 shows the relationship between private credit and investment, and it confirms the tighter link between financial sector development and investment in developing Asia than elsewhere. An important caveat, however, is that the evidence presented are correlations that do not necessarily indicate causation, so it is possible that countries that invest more have greater demand for financing.
Long-term finance for productivity-led growth Developing Asia’s strong economic growth over the past 3 decades has been the envy of the world, dented only during the Asian financial crisis of 1997–1998 and the global financial crisis of 2008–2009. The impressive growth record, largely credited to investment and capital accumulation, not only raised incomes and reduced poverty but also expanded the region’s global influence. While capital deepening continues to be important, the region will need to rely increasingly on higher productivity growth to sustain rapid growth (Box 2.2.2).
Reform offers, however, no single path to productivity growth. Rather, reform needs to create a mix of virtues, including better infrastructure and human capital, more open trade, an efficient and well-developed financial system, and economic institutions that promote competition and encourage entrepreneurship and innovation.3 Only an appropriate set of targeted and interlocking reforms can achieve structural change, improve resource allocation, and increase technology transfer. Reform priorities will have to vary depending on income group targeted and how technologically advanced the economy is.
2.2.4 Investment and economic growth, 2000–2013
Average economic growth (%)
Developing AsiaLatin America
ARG
BRACHL
COL
MEX
PER
VEN
PRC
IND
INO
KOR
MALPHISRI
THA
VIE
10 20 30 40 50Investment to GDP (%)
0
3
6
9
12
ARG = Argentina, BRA = Brazil, CHL = Chile, COL = Colombia, IND = India, INO = Indonesia, KOR = Republic of Korea, MAL = Malaysia, MEX = Mexico, PER = Peru, PHI = Philippines, PRC = People’s Republic of China, SRI = Sri Lanka, THA = Thailand, VEN = Venezuela, VIE = Viet Nam.Source: International Monetary Fund 2014.
2.2.3 Banking sector and investment
Bank assets to GDP (%)
ARG
BRA CHI
COLMEX
PER
VEN
PRC
INDINO
KORMAL
PHI
SRI
THA
VIE
0
100
200
300
20 30 40 50Investment to GDP (%)
Developing AsiaLatin America
10
ARG
BRA CHICOL
MEX
PERVEN
PRC
INDINO
KORMAL
PHISRI
THAVIE
Bank loans to GDP (%)
0
50
100
150
200
10 20 30 40Investment to GDP (%)
50
ARG = Argentina, BRA = Brazil, CHL = Chile, COL = Colombia, IND = India, INO = Indonesia, KOR = Republic of Korea, MAL = Malaysia, MEX = Mexico, PER = Peru, PHI = Philippines, PRC = People’s Republic of China, SRI = Sri Lanka, THA = Thailand, VEN = Venezuela, VIE = Viet Nam.Note: Data on bank assets and bank loans refer to December 2013 or March 2014, while data on investment refer to 2000–2013 average.Source: Cline (forthcoming).

16 Asian Development Outlook 2015
2.2.2 Asia’s long-term growth prospects and the role of productivity
Asia’s admirable economic growth and transformation has been the subject of many empirical studies. Lee and Hong (2010) and Park and Park (2010) apply a growth accounting framework to find that growth in capital accumulation has been a key factor behind developing Asia’s remarkable economic expansion, especially in the 1980s and 1990s. The analysis in Lee and Hong (2010) and Park and Park (2010) covers the People’s Republic of China; Hong Kong, China; India; Indonesia; the Republic of Korea; Malaysia; Pakistan; the Philippines; Singapore; Taipei,China; Thailand; and Vietnam, which together account for 95% of developing Asia’s GDP, thus making this group representative of regional trends. Their results show as well the other side of the coin: that the contribution of labor, education, and total factor productivity to real GDP growth has been only moderate. The Park and Park (2010) study, however, finds an important structural shift in the pattern of developing Asia’s economic growth in around 2002, when total factor productivity began to play a larger role in regional growth.
Projections by Lee and Hong (2010) address the central question of whether developing Asia’s rapid growth can continue in the next 2 decades. They suggest that, without significant reform, future growth will tend to be lower than
historical performance in most of the Asian economies analyzed. In particular, as these economies have already registered high rates of capital accumulation in the past 3 decades, the marginal productivity of capital appears set to decline. Furthermore, for many economies the demographic dividend is projected to wane, constraining the contribution to growth from labor. Park and Park (2010) reaches a similar conclusion and highlights the importance of policy makers pursuing supply-side policies that foster productivity growth to sustain developing Asia’s future growth.
The common conclusion of various studies of Asia’s historical growth record and future prospects is that growth will need to rely increasingly on improvements in productivity growth and less on capital deepening. Although investment and factor accumulation will still be important drivers of growth in low-income countries, and in middle-income countries with large infrastructure gaps, productivity will need to become a more important driver of growth in developing Asia. Although there is no single reform path to spur productivity growth, and though policy needs vary across income groups, financial system deepening remains central to a more efficient allocation of capital across sectors and crucial for facilitating innovation and technology transfer.
2.2.5 Investment and private credit, 2012
Investment to GDP (%)
Developing AsiaRest of the world
NEP
TAJ ARM
PRC
PAK
BANGEO
AZE MAL
IND
VIE HKGSRI KOR
INOSIN
BRU
MON
TON
KAZAFG
BHU
0
20
40
60
80
0 50 100 150 200 250Private credit to GDP (%)
THA
PHI
Investment to GDP (%)
NEP
TAJ ARM
PRC
PAK
BANGEO
AZE MAL
IND
VIE HKGSRI KOR
INOSIN
BRU
MON
TON
KAZAFG
BHU
0
20
40
60
80
0 50 100 150 200 250Private credit to GDP (%)
THA
PHI
AFG = Afghanistan; ARM = Armenia; AZE = Azerbaijan; BAN = Bangladesh; BHU = Bhutan; BRU = Brunei Darussalam; GEO = Georgia; HKG = Hong Kong; China; IND = India; INO = Indonesia; KAZ = Kazakhstan; KOR = Republic of Korea; MAL = Malaysia; MON = Mongolia; NEP = Nepal; PAK = Pakistan; PHI = Philippines; PRC = People’s Republic of China; SIN = Singapore; SRI = Sri Lanka; TAJ = Tajikistan; THA = Thailand; TON = Tonga; VIE = Viet Nam.Source: World Bank, World Development Indicators online database.
Yet, despite differences between economies in the set of productivity-enhancing reforms they need, the common need is to build a strong domestic financial system, one able to provide long-term finance to match the long-term investments desired (see Chopra, forthcoming). As developing Asia has an infrastructure deficit that hampers productivity, particular attention has to be placed on funding infrastructure needs.

Financing Asia’s future growth 17
When finance and investment are for the long term, they enhance the productive capacity of an economy. They cover a wide range of tangible assets—energy, transport and communication infrastructure, factories, commercial buildings, hospitals, and new housing—that generates returns for society, as well as intangible assets such as education and research and development, which store up prospects for future innovation and competitiveness (Asian Development Bank 2015, European Commission 2013, Group of Thirty 2013).
Being less procyclical than short-term finance, long-term finance exerts a stabilizing influence on the financial system and may be more supportive of sustained long-term growth.4 This improves the quality of intermediation, not just its quantity. Long-term capital is important for financing innovation in particular, as innovation is inherently uncertain and hard to keep to deadline.
Long-term finance flows from the providers—households, corporations, and governments—through the intermediation process to the end users (Figure 2.2.6). Except in the case of self-financing, finance flows through financial institutions such as banks, insurance companies, and pension funds, or else it gets channeled through capital markets. Under this framework, investors with long time horizons and financial instruments with long maturities are evidently needed for long-term investment.
But even with the large pool of savings in developing Asia, the region’s range of instruments for long-term financing remains narrow (Didier and Schmukler 2014). Banks still dominate the financial sector in Asia, as they do in Europe—and in contrast with the US, where equity and bond markets play a larger role. However, commercial bank loan
2.2.6 Framework for the provision of finance for long-term investment
USERS OF FUNDS
InfrastructureBanks
Insurance companies
Pension funds
Other asset managers
Sovereign wealth funds
Alternative investment vehicles
Equity
Bonds
Other
Corporateretained earnings
Domestic� Households� Corporations� Government
Foreign� Households� Corporations� Government
Governmenttax receipts
Householdincome/wealth
Commercialreal estate
Property, plant,and equipment
Equipmentand software
Education
Research anddevelopment
Maintenance ofphysical capital
New stock ofresidential real state,
for emerging economies
INTERMEDIATION SYSTEMSPROVIDERS OF FUNDS
Financial intermediariesSources of funds Long-term investment
Self-financing instrumentsCapital markets
Source: Group of Thirty (2013) and McKinsey Global Institute.

18 Asian Development Outlook 2015
2.2.7 Debt financing of nonfinancial corporations by region, year-end 2011
Securitizedloans
(% of GDP)
68%
3%
13%
4%
0%
2%
0%
0%
0%
0%
($ trillion)100%
11.6
3.3
13.2
0.8
0.8
5.6
8.6
1.2
0.8
1.5
0 20 40 60 80 100%
Central and EasternEurope and CIS
India
Middle East and Africa
People’s Republic of China
Japan
Latin America
Other developing Asia
Western Europe
Other developed
United States
Corporate loansBonds
CIS = Commonwealth ofIndependent States.Source: McKinsey Global Institute as cited in Group of Thirty (2013).
maturities average only 2.8 years in emerging economies and 4.2 years in developed economies, which is much shorter than bond maturities (Group of Thirty 2013). Moreover, although many countries in developing Asia have improved the size and liquidity of their bond markets in recent years, these markets remain dominated by low-risk issues, especially from governments.
In addition to a lagging corporate bond market, developing Asia has underdeveloped securitization and equity markets despite possessing a rising share of the world’s wealth (Figure 2.2.7). Long-term institutional investors such as pension funds and insurance companies, whose liabilities have long dates, do not contribute sufficiently to the development of local markets, preferring to put the bulk of their portfolios in government bonds and deposits.5
This “trap,” as it is decried in Didier and Schmukler (2014), keeps Asian investors out of local capital markets and keeps the markets underdeveloped. The situation in Asia leaves considerable scope for policy action to help channel available funds and foster local markets for long-term financing. Policy requirements to address barriers to long-term finance are inevitably multifaceted, but the following are worth highlighting for Asia.6
First, policy should help investors adopt a long-term horizon for their investment decisions. This will require national and international regulatory bodies to remove short-term biases when allocating the assets of investors willing to invest for the long term. National regulatory and accounting treatment that favors short-term horizons should be reconsidered, weighing the pros and cons of gradually removing from insurance and bank regulations the preferential treatment accorded sovereign debt (Group of Thirty 2013).
Second, policy should further efforts to develop debt and equity capital markets to widen the spectrum of financing instruments. Although local-currency bond markets have grown in Asia over the past decade, the region’s continued heavy reliance on bank financing tends to make long-term investment decisions dependent on risky and volatile maturity transformation, or the funding of longer-term commitments with shorter-term deposits or investments. Policies should therefore aim to build deeper and more liquid bond markets, especially for corporate bonds, as this could reduce risk premiums and lower the cost of capital, as well as enhance financial stability.7
Third, policy should facilitate the building of a broader and more diverse long-term investor base, in part by promoting institutional investors and foreign participation. It is essential to generate stable sources of finance. The region lags the advanced economies by a wide margin in its development of long-term institutional investors such as pension funds (Figure 2.2.8). Long-term pension and insurance-based savings could be fostered by, for instance, setting up compulsory auto-enrollment saving programs (Group of Thirty 2013). Such institutions would aggregate more savings into funds with long investment horizons, especially where household wealth is concentrated in bank deposits and other short-term instruments.

Financing Asia’s future growth 19
Finally, policy needs to take into account how important cross-border capital flows are for the efficient allocation of capital to long-term investment on a global scale. Policy makers should enhance their understanding of the regional and global perspectives they will need to effectively address stiffening regulatory and supervisory challenges as financial systems deepen and become more integrated and complex (Group of Thirty 2013, Zhu 2014). In particular, as regulators and supervisors encourage prudent financial innovation, they will need to ensure that they have good cross-border cooperation and adequate regulatory powers to act and stay alert to risks.
Bond market development in AsiaBond markets are important features of diversified financial systems and have an important role in building a pool of long-term financing to benefit the wider economy. On a macro level, financial development has been consistently linked to higher economic growth and greater poverty reduction (Levine 2005, 2008). In the context of emerging market economies (EMEs), including those in developing Asia, the growth of local-currency bond markets has improved financial stability by reducing currency mismatches and vulnerability to currency crises.
The positive effect likely extends to the global economy, as it was the lack of reliable financial instruments in EMEs that drove capital to developed markets and helped spark the global financial crisis (Caballero, Fahri, and Gourinchas 2008). The development of local-currency bond markets thus strengthens financial stability not only in individual countries, but also globally. Bond market development also supports financial inclusion, as the factors that enable debt markets are, at core, the same as those that enable borrowing and lending within an economy (Burger and Warnock 2006).
Bond market structure in developing Asia and the worldGlobal bond markets have seen impressive growth over the past decade, almost tripling in size from $30 trillion in 2001 to $83 trillion in 2011. Although rapid progress has been seen across regions, bond markets in advanced economies remain much larger than those in developing Asia, equaling 164% of GDP in advanced economies but only 41% in developing Asia (Table 2.2.1).
A fundamental change in global financial structure has been the growth of local-currency bond markets in EMEs. As a result, the share of EME bonds denominated in foreign currency more than halved from 25% in 2001 to 13% in 2011 (Table 2.2.2). The trend has been particularly striking in Latin America. In 2001, slightly more than half of Latin American bonds were denominated in foreign currency, but by 2011 local currency bond markets had grown such that only a quarter of bonds in the region were issued in foreign currency. Improvement in macroeconomic stability and institutional factors such as rule of law have contributed to bond market development in EMEs (Box 2.2.3).
2.2.8 Ratio of pension assets to GDP in selected economies, 2013
%
0
20
40
60
80
100
Hon
g Kon
g, Ch
ina
Repu
blic
of K
orea
Thail
and
Indo
nesia
Peop
le’s R
epub
lic o
f Chi
na
Indi
a
Pakis
tan
Mex
ico
Braz
il
Uni
ted
King
dom
Aust
ralia
Uni
ted
Stat
es
Note: Data for India refer to 2012 and for Indonesia 2011.Source: OECD 2015.

20 Asian Development Outlook 2015
2.2.1 Bond market characteristics: summary statistics by region, 2011
Total Local currency denominated$ billion $ billion % GDP % total % govt.
Advanced economies Total 74,371 67,912 164 91 49Euro area 22,106 20,147 157 91 39Other 22,857 19,134 140 84 72US 29,409 28,630 191 97 40
Emerging market economies Total 8,119 7,070 32 87 59Europe 699 500 24 72 89Latin America 1,406 1,053 22 75 80Asia 5,667 5,260 41 93 50Other 347 255 11 74 75
Source: Burger, Warnock, and Warnock (forthcoming).
2.2.2 Bond market development
Local currency denominatedTotal 2011 2006 2001
$ billion $ billion % of GDP % of total % of GDP % of total % of GDP % of totalAdvanced economies 74,371 67,912 164 91 134 91 107 93Euro area advanced economies 22,106 20,147 157 91 133 91 94 89Other advanced economies 22,857 19,134 140 84 104 81 84 87United States 29,409 28,630 191 97 158 96 131 98
Emerging market economies 8,119 7,070 32 87 31 83 26 75Europe 699 500 24 72 30 77 25 76Latin America 1,406 1,053 22 75 20 70 19 54Asia 5,667 5,260 41 93 39 90 33 88China, People’s Rep. of 2,956 2,938 40 99 27 98 18 95Hong Kong, China 116 45 18 39 19 53 15 54India 515 489 26 95 30 95 25 97Indonesia 113 84 10 74 15 87 27 96Korea, Rep. of 1,265 1,117 100 88 94 91 85 91Malaysia 260 233 81 90 59 79 57 77Pakistan 34 32 15 94 15 90 22 96Philippines 101 63 28 62 26 50 21 48Singapore 130 90 37 69 40 60 35 69Thailand 175 170 49 97 37 89 28 80Other emerging market economies 347 255 11 74 11 69 10 50Russian Federation 156 91 5 59 3 41 2 13South Africa 191 164 40 86 39 90 32 87
Source: Burger, Warnock, and Warnock (forthcoming).

Financing Asia’s future growth 21
2.2.3 Why some emerging markets have bigger bond markets
The development of local-currency bond markets in EMEs has clearly been remarkable, but each economy varies in its ability to develop its bond markets. Why is it that some EMEs have larger local-currency bond markets than others? If the answer were “original sin,” then the reason would simply be that some countries are naturally larger than others. If nothing other than sheer country size distinguishes one economy from another, bond markets in smaller economies would be inconsequential forever.
But the original sin hypothesis falls apart in the real world. As some studies have shown, economies can put in place institutions and policies that foster the development of debt markets, and have done so (e.g., Burger and Warnock 2006). Economies with better historical inflation performance—an outcome of creditor-friendly policies—have generally more developed local bond markets, both private and government, and rely less on foreign currency debt. Creditor-friendly laws seem to matter. Strong rule of law correlates with deep local bond markets, while countries with better creditor rights have been able to issue a higher share of bonds in their local currency.
Stronger institutions, less volatile exchange rates, and more competitive banking sectors have positively influenced bond market development (Eichengreen and Luengnaruemitchai 2006). The size of government bond markets in particular positively associates with deeper domestic financial systems, low inflation, larger fiscal deficits, stronger legal origin, and more open capital accounts (Claessens et al. 2007).
An updated study on local-currency markets in EMEs confirms earlier findings that economies with less volatile inflation and stronger legal rights tend to have more developed local bond markets (Burger, Warnock, and Warnock 2012; see box figure). Over the past decade, some countries with historically high and volatile inflation, such as Mexico and Brazil, have made the necessary policy adjustments to bring inflation under control, allowing local-currency bond markets to flourish. Other EMEs, including Argentina, the Russian Federation, and Pakistan, have had less success in bringing inflation under control. As a result, their local-currency bond markets continue to be less developed and attractive.
1 Some determinants of local bond market development
TUR
RUS
CZESVK
HUN
HRV
POL
BRACHL
COL
MEX
PER
ZAFIND
IND
MAL
PHI
THA
PRC
Local bond market (% of GDP)
0
20
40
60
80
0 5 10 15 20Inflation volatility
Developing AsiaOther economies
Local bond market (% of GDP)
0
20
40
60
80
2 4 6 8 10Legal rights for borrowers and lenders
TUR
RUS
CZESVK
HUN
HRVPOL
BRA
CHL
COL
MEX
PERVEN
ZAF
ARG
IND
INO
MAL
PAK
PHI
THA
PRC
ARG = Argentina, BRA = Brazil, CHL = Chile, COL = Colombia, CZE = Czech Republic, HRV = Croatia, HUN = Hungary, INO = Indonesia, IND = India, MAL = Malaysia, MEX = Mexico, PAK = Pakistan, PER = Peru, PHI = Philippines, POL = Poland, PRC = People’s Republic of China, RUS = Russian Federation, SVK = Slovakia, THA = Thailand, TUR = Turkey, VEN = Venezuela, and ZAF = South Africa.Note: Inflation volatility is the standard deviation of quarterly year-over-year inflation computed over the period 2004–2013. The legal rights for both borrowers and lenders are from the World Bank’s Doing Business 2015 report and range from 0 (poor rights) to 12 (best rights).Source: Burger, Warnock, and Warnock (forthcoming).

22 Asian Development Outlook 2015
2.2.4 Lessons for Asia from Thailand’s bond market
Concerted efforts in Thailand to develop its bond markets after the Asian crisis have met success and may offer lessons for the region (box figure). The crisis caused businesses and financial institutions to fail across Thailand. To finance the losses and sustain the economy, the Ministry of Finance needed to swiftly issue B500 billion worth of government bonds, then equal to about 10% of its GDP. While tackling the urgent need to place these issues, the ministry recognized a clear opportunity to develop a local currency bond market in Thailand.
In 1999, the ministry established the Domestic Bond Market Committee to focus on the bond market. Within its bureaucracy, the ministry mobilized the participation of the Fiscal Policy Office, Comptroller General’s Department, Office of Insurance Commission, and Revenue Department. In the initial phase, parts of Fiscal Policy Office and the Comptroller General’s Department were carved out and merged to form the Public Debt Management Office, which subsequently played a leading role in the effort of the Domestic Bond Market Committee, particularly while the emphasis was placed on the government bond market.
The committee drew up a comprehensive roadmap to concentrate the efforts of members around the following pillars:
(i) building comprehensive public debt management capacity;
(ii) enhancing the primary bond market;(iii) enhancing the secondary bond market;(iv) enhancing the clearance and settlement of bond
trades;(v) rationalizing bond taxation;(vi) enhancing bond market information technology
infrastructure; and(vii) standardizing bond market business practices.
Policy actions have to be appropriately sequenced, as certain reforms and developments must take place first for other reforms to be effective. The committee focused on the government bond market, which differs significantly from a corporate bond market in terms of credit, liquidity, instrument design and diversity, and prudential rules—and, therefore, the investor base.
Over time, the committee revised the pillars to shift the focus toward a corporate bond market. However, the establishment of a well-functioning government bond market clearly laid a solid foundation for market sustainability and facilitated the subsequent development of a corporate bond market. Success came partly because the government bond market was large, liquid, and able to generate transaction volume high enough to ensure the viability of sophisticated market infrastructure such as trading and settlement systems. A corporate bond market can benefit from such market infrastructure, though it cannot by itself support them because it is too diverse, fragmented, and illiquid. Banks also gained experience in investing in fixed income instruments while managing their liquidity and interest rate risks.
Thailand still needs to work on further developing its corporate bond market. With a significant and growing contractual savings and asset management sector, Thailand should be prepared to tackle this challenge even in the face of the tighter prudential requirements for banks today.
1 Thailand’s local currency bonds outstanding
% of GDP
0
20
40
60
80
1995 1997 1999 2001 2003 2005 2007 2009 2011 2013 2014
TotalCorporateGovernment
Source: Asian Development Bank, Asian Bonds Online (accessed 4 March 2015).
Among Asian EMEs, improvement in the currency structure of bond markets has been rapid, with the proportion of foreign-currency bonds falling from 10% around 2000 to just 4% in 2013. In the PRC, India, Malaysia, Pakistan, and Thailand, more than 90% of bonds are now denominated in local currency. However, some economies still have a high proportion of foreign-currency bonds, such as the Philippines with 38% and Indonesia with 26%.
It should be noted that big differences exist across Asia, and bond markets in many financially underdeveloped countries are still

Financing Asia’s future growth 23
embryonic or nonexistent (Annex table). Further, in the region as a whole, the market for corporate bonds remains less developed than the market for sovereign bonds. This remains true in economies such as Thailand that have made good progress in bond market development (Box 2.2.4). On the whole, the region has made a lot of progress, but considerable scope remains to further develop bond markets, especially corporate bond markets.
Country-specific paths to financial development Policies to improve productivity and growth performance must be designed to specific contexts. They must take into account on an economy’s distance from the global technology frontier, which defines its productivity gap with the rest of the world (Aghion and Howitt 2006 and 2009). In a recent empirical study, Dabla-Norris, Ho, and Kyobe (2013) confirmed that reforms to drive productivity growth operate with differing force across groups of economies depending on their distance from the technology frontier, as approximated by a country’s real per capita GDP or productivity gap with the US. In the area of financial sector reform to spur productivity growth, the general policy priorities they highlight are as follows for different income groups (see also Dabla-Norris et al. 2013).
Low-income and lower-middle-income countries. As economies in this group tend to have financial systems heavily based on banks, they stand to benefit most from further bank reform.8 Reform in these economies should aim to mobilize domestic savings, lower the cost of credit to improve access, and promote the allocation of financial resources to the most productive sectors. In addition, where financial repression is still present, reducing restrictions on the price or quantity of credit can help resources find the most productive uses within and across sectors. To prevent excessive risk taking and to promote the quality of intermediation over its quantity, however, reform must be complemented by strong prudential policies. Batten et al. (forthcoming) discusses the key challenges to financial sector development in five low-income and lower-middle-income Asian countries.
Upper-middle-income countries. Empirical results suggest that upper-middle-income countries can reap significant productivity gains by further deepening their capital markets (Dabla-Norris, Ho, and Kyobe 2013).9 Policies that encourage the formation and development of markets for equity, securities, and bonds, particularly local-currency bonds, can be particularly effective at increasing total factor productivity and labor productivity by lowering the cost of capital and facilitating the financing of new capital and innovation. Although many large EMEs have achieved significant capital market development in terms of generating a larger menu of financial instruments, improving market infrastructure, and diversifying their investor base, capital markets in upper-middle-income countries still lag those in advanced economies in size, turnover, liquidity, and the development of institutional investors.
The need to tailor financial sector development to the country context is especially evident in developing Asia, home to a great deal

24 Asian Development Outlook 2015
of diversity in stages of development, both financial and economic. In particular, the more financially developed economies of the region have a good mix of banks and capital markets, while the less financially developed ones remain heavily reliant on banks. Nevertheless, regardless of the development and composition of their financial systems, all Asian economies must strengthen the governance of both banks and capital markets toward maximizing the positive impact of finance on growth.
Governance for banks and capital markets that promote growthThe glue that links finance and growth is good governance in financial institutions and markets. Good governance makes capital more likely to flow to productive investments that contribute to growth and reduces the risk that it will be wasted or misallocated to unproductive ventures.
Banks and capital markets alike are susceptible to bad governance. Owners, managers, and directors can breach their fiduciary duties to depositors and shareholders by using their positions to benefit themselves at the expense of their institutions and those who rely on the institutions financially. Owners, directors, and managers of banks, for example, can arrange loans for themselves, family members, or friends on unusually favorable terms or disregard norms for prudent lending.
Similarly, bank holding companies and industrial combines that include banks can instruct wholly owned bank subsidiaries to finance projects that would otherwise fail to meet lending standards. In capital markets, owners, managers, and shareholders can use inside information to buy or sell company shares to their own advantage at the expense of others. They can manipulate corporate rules to restrict the rights of minority shareholders or fail to disclose material information when issuing bonds or stock.
Experience has shown repeatedly that neither companies nor markets can be expected to police themselves sufficiently to ensure satisfactory governance at banks and other financial institutions. Appropriate regulations are therefore needed to limit governance problems. For banks, regulations can limit or prohibit so-called “connected lending” to owners, directors, and managers. In addition, many countries limit the maximum size of individual loans to a certain percentage of the bank’s paid-in capital. Regulations can bar banks from lending to other firms in a conglomerate or bank holding company.
For capital markets, regulations can prohibit owners and managers from trading shares on the basis of inside information. They can stipulate certain rights for minority shareholders. In addition, regulations can require the disclosure of key information for firms listed on stock markets or attempting to issue stock or bonds. They can establish rules for trading shares and bonds on exchanges, including regulations designed to limit how much a market may move up or down during a single trading day.

Financing Asia’s future growth 25
Financial access for inclusion
Policy makers around the world have placed financial inclusion—or ready access for households and firms to reasonably priced financial services—at the top of the development agenda. This policy direction is backed by a growing body of research that shows significant benefits from financial systems that cater to the low end of the market. Although financial development generally promotes growth, it does not necessarily promote equality. Growth from financial development can be inclusive only by meeting the financing needs of households and firms, even the underprivileged.
In the absence of inclusive financial systems, poor people must rely on their own resources to meet their financial needs and cope with income shocks, while small enterprises rely on their earnings to pursue promising growth opportunities (Demirguc-Kunt et al. 2008). However, the poor in developing Asia have limited access to financial services (Figure 2.3.1). Unfortunately, the broader consequences are the perpetuation of income inequality and slower economic growth.
Financially developed economies generally provide financial access to a greater number of households and firms, but not always. While developing Asia performs better than other developing regions in terms of financial development, it does not do so regarding financial inclusion, either for households or firms.
Household access to financeOne indicator of financial inclusion is household access to finance. This can be measured by account penetration, defined as the percentage of adults who have an individual or joint account at a formal financial institution such as a bank, credit union, cooperative, post office, or microfinance institution. Based on the Global Findex database, which culls information from survey interviews, the median worldwide for this measure is 36.7% (Demirguc-Kunt and Klapper 2013).10 With account penetration of 26.7%, developing Asia fares better than other developing areas, such as sub-Saharan Africa and the Middle East and North Africa, but still falls below the global median (Figure 2.3.2).
Wide diversity exists within developing Asia (Figure 2.3.3). While account penetration is nearly universal in Singapore and the Republic of Korea, it is much lower in other economies: less than 1% in Turkmenistan, and less than 5% in Cambodia, the Kyrgyz Republic, and Tajikistan.
2.3.1 Adults with an account at a formal financial institution, bottom 40 percentile by income, 2011
%0 20 40 60 80 100
TurkmenistanAfghanistan
Kyrgyz RepublicCambodiaTajikistan
PakistanIndonesia
PhilippinesViet Nam
AzerbaijanArmenia
NepalLao PDR
UzbekistanGeorgia
IndiaBangladeshKazakhstan
People’s Republic of ChinaMalaysiaSri LankaThailandMongolia
Hong Kong, ChinaRepublic of Korea
Singapore
Lao PDR = Lao People’s Democratic Republic.Source: Estrada, Noland, Park, and Ramayandi (forthcoming) based on data from Demirgüç-Kunt and Klapper (2013).
2.3.2 Formal account penetration across the world, 2011% of adults with an accountat a formal financial institution
Global median: 37%
0
20
40
60
80
100
High−income Europe LAC DevelopingAsia
MENA SSA
LAC = Latin America and the Caribbean, MENA = Middle East and North Africa, SSA = Sub-Saharan Africa.Source: Ayyagari and Beck (forthcoming) based on data from Demirgüç-Kunt and Klapper (2013).

26 Asian Development Outlook 2015
Household access varies across economies in developing Asia as well by demographic detail (Figure 2.3.4). In South Asia, where the gender gap is widest, 43% of men are likely to have an account but only 30% of women. In East Asia, where account penetration is highest, 85% of adults in the top 60 percentile of the income distribution report having an account but only 67% do in the bottom 40 percentile. The gap by income is smallest in Central Asia, where 22% of the top group and 16% of the bottom group report having an account. Meanwhile, across developing Asia, adults with at least secondary education, and adults aged 25 and older, are more likely to have access to finance than adults with primary education or less and those aged 15–24.
A complementary picture emerges if one looks at indicators from the supply side of finance such as the number of commercial bank branches per 100,000 adults and the number of ATMs per 100,000 adults. Based on a survey on financial access conducted in 2011 by the International Monetary Fund, the median in developing Asia is the lowest except in sub-Saharan Africa (Figure 2.3.5). Within the region, again, large differences exist across countries. The number of ATMs per 100,000 adults ranges from over 75 in Brunei Darussalam and Thailand to fewer than 5 in Afghanistan, Bangladesh, the Marshall Islands, Pakistan, and Uzbekistan (data are unavailable for the Republic of Korea).
2.3.3 Formal account penetration in developing Asia, 2011
% of adults with an account at a formal financial institution0 20 40 60 80 100
TurkmenistanTajikistan
CambodiaKyrgyz Republic
AfghanistanPakistan
AzerbaijanArmenia
IndonesiaVietnam
UzbekistanNepal
PhilippinesLao PDRGeorgia
IndiaBangladeshKazakhstan
People’s Republic of ChinaMalaysiaSri LankaThailandMongolia
Hong Kong, ChinaRepublic of Korea
Singapore
Lao PDR = Lao People’s Democratic Republic.Source: Ayyagari and Beck (forthcoming) based on data from Demirgüç-Kunt and Klapper (2013).
2.3.4 Account penetration in developing Asia by demographic variable, 2011
Central Asia East Asia South Asia Southeast Asia
% of adults
0
20
40
60
80
Central Asia East Asia South Asia Southeast Asia0
20
40
60
80
100
Central Asia East Asia South Asia Southeast Asia0
20
40
60
80
100
Central Asia East Asia South Asia Southeast Asia0
20
40
60
80
100
MaleFemale
% of adults
Bottom 40% of incomeTop 60% of income
% of adults
Young adults (15−24)Old adults (25+)
% of adults
Primary education or lessSecondary education or more
Source: Ayyagari and Beck (forthcoming) based on data from Demirgüç-Kunt and Klapper (2013).

Financing Asia’s future growth 27
2.3.5 ATMs and bank branches per 100,000 adults
ATMs per 100,000 adults
0 20 40 60 80
AfghanistanBangladesh
Marshall IslandsUzbekistan
PakistanKiribati
CambodiaNepal
TajikistanFSMIndia
Solomon IslandsKyrgyz Republic
BhutanSri Lanka
IndonesiaPhilippines
Viet NamMaldives
TongaSamoa
VanuatuAzerbaijan
MongoliaFiji
ArmeniaGeorgia
Hong Kong, ChinaMalaysia
SingaporeKazakhstan
ThailandBrunei Darussalam
High income Europe LAC MENA Developing Asia SSA
Per 100,000 adults
0
30
60
90
Bank branchesATMs
Source: LAC = Latin America and the Caribbean, MENA = Middle East and North Africa, SSA = Sub-Saharan Africa.Source: Ayyagari and Beck (forthcoming) based on data from the 2011 Financial Access Survey.
Barriers to households’ use of financeMultiple barriers limit financial inclusion across the world, some of them supply factors such as physical distance and high transaction costs for banks when operating in remote locations, and others demand factors such as lack of financial literacy, erratic cash flow, or low income.
In developing Asia, the most frequently mentioned reasons for not having a bank account, according to the Global Findex Survey, are the lack of money at 76.2%, cost at 21.9%, and travel distance at 21.8% (Figure 2.3.6). Clearly, the fixed costs associated with opening and maintaining an account impede access to finance. This helps explain the success of social banking programs such one in India from 1969 to 1990 that aimed to improve for the poor physical access to finance by emphasizing branch expansion into unbanked rural locations. Physical barriers have been quite high in developing Asia, which is at the low end of the spectrum in terms of bank branching and ATM density.
Lack of documentation is a reason cited by 17.5%. In other parts of the world, these barriers are overcome by technology and such alternative delivery channels as mobile banking, e-finance, and phone finance, but such channels do not seem to be very prevalent in developing Asia. For instance, the median percentage of respondents who paid bills used wire transfers or online payment, or shopped online using money from their accounts, was only 2.1% in developing Asia, compared with 44.8% in the high-income group. Table 2.3.1 shows the relative importance of physical access, affordability, and eligibility as barriers to deposit services in selected Asian economies.
Firms’ access to financeFinancial constraints affect firms in developed and developing countries alike, and this is an active area of research in corporate finance. Research has shown that the lack of access to finance is a critical constraint on growth and innovation. As small firms are the most adversely affected, they are likely to benefit the most from financial and institutional deepening.
World Bank Enterprise Surveys from 2006 to 2014 sampled firms formally registered in over 100 economies to study business climate constraints on private sector growth and performance.11 Regional comparisons show that the proportion of firms in developing Asia with a checking or savings account is 84.2% (Table 2.3.2). This is comparable to the percentage of firms with a checking or savings account in sub-Saharan Africa (83.9%), but lower than in Latin America and the Caribbean (88.8%) or emerging Europe (92.1%).
Similarly, the proportion of firms that have a credit line or loan from a financial institution in developing Asia is
2.3.6 Barriers to account penetration in developing Asia, 2011
% adults reporting barriers as a reasonfor not having an account
0 20 40 60 80
Religious reasonsLack of trust
Lack of documentationFamily member already has one
Too far awayToo expensiveLack of money
Note: Respondents were allowed more than one response. The data for lack of money reports the percentage of adults who reported only this reason.Source: Ayyagari and Beck (forthcoming) based on data from Demirgüç-Kunt and Klapper (2013).
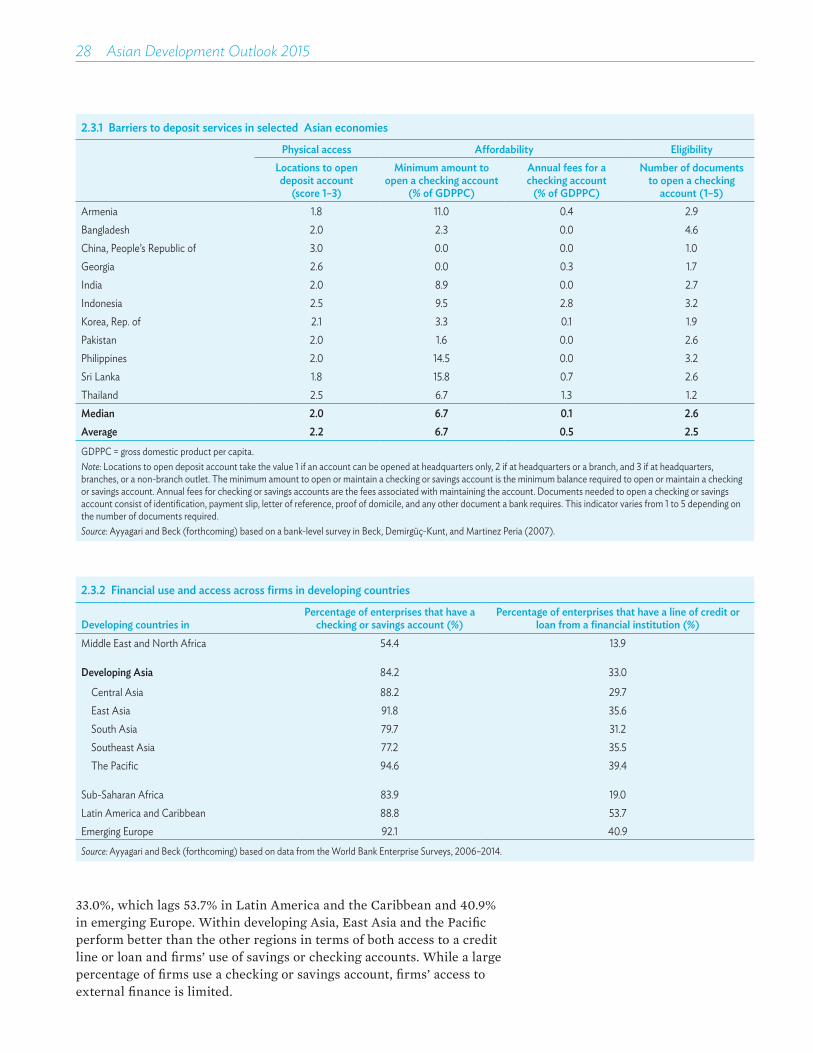
28 Asian Development Outlook 2015
2.3.1 Barriers to deposit services in selected Asian economies
Physical access Affordability EligibilityLocations to open
deposit account (score 1–3)
Minimum amount to open a checking account
(% of GDPPC)
Annual fees for a checking account
(% of GDPPC)
Number of documents to open a checking
account (1–5)Armenia 1.8 11.0 0.4 2.9Bangladesh 2.0 2.3 0.0 4.6China, People’s Republic of 3.0 0.0 0.0 1.0Georgia 2.6 0.0 0.3 1.7India 2.0 8.9 0.0 2.7Indonesia 2.5 9.5 2.8 3.2Korea, Rep. of 2.1 3.3 0.1 1.9Pakistan 2.0 1.6 0.0 2.6Philippines 2.0 14.5 0.0 3.2Sri Lanka 1.8 15.8 0.7 2.6Thailand 2.5 6.7 1.3 1.2Median 2.0 6.7 0.1 2.6Average 2.2 6.7 0.5 2.5GDPPC = gross domestic product per capita.Note: Locations to open deposit account take the value 1 if an account can be opened at headquarters only, 2 if at headquarters or a branch, and 3 if at headquarters, branches, or a non-branch outlet. The minimum amount to open or maintain a checking or savings account is the minimum balance required to open or maintain a checking or savings account. Annual fees for checking or savings accounts are the fees associated with maintaining the account. Documents needed to open a checking or savings account consist of identification, payment slip, letter of reference, proof of domicile, and any other document a bank requires. This indicator varies from 1 to 5 depending on the number of documents required.Source: Ayyagari and Beck (forthcoming) based on a bank-level survey in Beck, Demirgüç-Kunt, and Martinez Peria (2007).
2.3.2 Financial use and access across firms in developing countries
Developing countries in Percentage of enterprises that have a
checking or savings account (%)Percentage of enterprises that have a line of credit or
loan from a financial institution (%)Middle East and North Africa 54.4 13.9
Developing Asia 84.2 33.0
Central Asia 88.2 29.7 East Asia 91.8 35.6 South Asia 79.7 31.2 Southeast Asia 77.2 35.5 The Pacific 94.6 39.4
Sub-Saharan Africa 83.9 19.0Latin America and Caribbean 88.8 53.7Emerging Europe 92.1 40.9
Source: Ayyagari and Beck (forthcoming) based on data from the World Bank Enterprise Surveys, 2006–2014.
33.0%, which lags 53.7% in Latin America and the Caribbean and 40.9% in emerging Europe. Within developing Asia, East Asia and the Pacific perform better than the other regions in terms of both access to a credit line or loan and firms’ use of savings or checking accounts. While a large percentage of firms use a checking or savings account, firms’ access to external finance is limited.

Financing Asia’s future growth 29
2.3.7 Percentage of firms with a line of credit or loan in developing Asia, by firm size
% of firms with access to a line of credit or loan0 20 40 60 80 100
AfghanistanPakistan
MyanmarTimor−Leste
PRCUzbekistan
IndonesiaKazakhstanAzerbaijan
Lao PDRTajikistan
Kyrgyz RepublicPhilippines
BangladeshFiji
GeorgiaSri Lanka
NepalArmenia
FSMBhutan
Viet NamVanuatu
SamoaMongolia
Tonga
Small (<20)Medium (20−99)Large (100+)
FSM = Federated States of Micronesia, Lao PDR = Lao People’s Democratic Republic, PRC = People’s Republic of China.Source: Ayyagari and Beck (forthcoming) based on data from the World Bank Enterprise Surveys, 2006–2014.
2.3.8 Sources of working capital in developing Asia, by firm size
%
0
20
40
60
80
100
Small (<20) Medium (20−99) Large (100+)
BanksNonbank financial institutionsTrade creditOthers
Internal funds/Retained earnings
Source: Ayyagari and Beck (forthcoming) based on data from the World Bank Enterprise Surveys, 2006–2014.
Focusing on firm size, one finds that in each of the countries in developing Asia, the percentage of small firms with 5–19 employees that report having a line of credit or loan from a financial institution is much lower than the percentage of medium-sized firms with 20–99 employees or large firms with more than 100 employees (Figure 2.3.7). Across firm size, retained earnings finance over 75% of working capital on average (Figure 2.3.8). The share of working capital sourced from banks is another important indicator and varies from 8.2% for small firms to 17.1% for large firms. The findings suggest that, in developing Asia, small firms’ access to credit is particularly constrained.
Barriers to firms’ use of finance In developing Asia, weak access to finance is not the only obstacle to firms’ growth, but it is the most constraining (Figure 2.3.9). As shown above, bank finance is the largest external source of working capital in the region, yet a large percentage of firms have no access to bank loans or credit lines. The data suggest that, while some firms in the region are excluded from bank finance because of high interest rates, collateral requirements, and/or onerous paperwork, a majority of 55.4% simply have no need to borrow because they have no good projects to finance (Table 2.3.3). Other reasons firms cite for not applying for loans are unfavorable interest rates at 14.8%, complex application procedures at 10.8%, and collateral requirements at 8.2%.
These numbers hide a great deal of variation across countries. For instance, the percentage of firms that report stringent collateral requirements is as high as 18% in Indonesia and Afghanistan. Secured loans are the most common type of loans in the formal financial sector across the world, with three-fourths of firms reporting that their most recent loan or credit line required some form of collateral. This number is highest in developing Asia, at 88% (Figure 2.3.10).
A complementary picture arises from the supply side using bank data collected in 2005–2006 (Beck, Demirgüc-Kunt, and Martinez Peria 2008). The data on physical access to loans (operationally, the number of locations where a loan application can be submitted, with a maximum of five) suggest that banks in developing Asia do not encourage the use of alternative channels, as the median across the sample of developing countries in Asia is way below five (Table 2.3.4). With regard to affordability, the fees associated with loans are as high as 6.5% for a typical business loan and 2.6% for a typical loan to a small- or medium-sized enterprise (SME) in Bangladesh. However, the median in the sample of 12 economies for which data are available is only 0.9% for a typical business loan or SME loan.

30 Asian Development Outlook 2015
2.3.3 Why firms not apply for loans
Developing Asia Emerging EuropeLatin America and
the CaribbeanMiddle East and
North AfricaSub-Saharan
AfricaNo need 55.4 64.8 65.4 48.3 37.2Unfavorable interest rates 14.8 19.8 12.3 11.7 19.3Complex application procedures 10.8 7.1 5.8 9.6 17.4Collateral requirements 8.2 4.9 4.6 7.6 11.6Size of loan and maturity are insufficient 3.4 1.1 1.1 3.8 2.3Did not think it would be approved 3.2 0.4 2.4 3.0 6.1Other 4.3 1.8 8.4 15.9 6.3
Source: Ayyagari and Beck (forthcoming) based on data from the World Bank Enterprise Surveys, 2006–2014.
2.3.9 Constraints faced by firms in developing Asia
0.0 0.5 1.0 1.5Business constraint
Labor regulations
Courts
Business licensing and permits
Customs and trade regulations
Street crime
Transportation
Access to land
Tax administration
Inadequately educated workforce
Informal sector competitors
Corruption
Access to finance
Political instability
Tax rates
Electricity
Note: The figure shows the mean response of firm managers who were asked to what extent various issues constitute an obstacle to the growth and operation of their businesses, on a scale of 0 (no obstacle) to 4 (very severe obstacle). Source: Ayyagari and Beck (forthcoming) based on data from the World Bank Enterprise Surveys, 2006–2014.
2.3.10 Financing requiring firms to pledge collateral% of firms reporting thatfinancing required collateral
0
20
40
60
80
100
LAC Europe MENA SSA Developing Asia
LAC = Latin America and the Caribbean, MENA = Middle East and North Africa, SSA = sub-Saharan Africa.Source: Ayyagari and Beck (forthcoming) based on data from the World Bank Enterprise Surveys, 2006–2014.
Policy options to improve financial inclusion Fixed costs and high risk are the two main hurdles to expanding access to financial services to rural and low-income segments of the population. The fixed costs that come with traditional finance often make financial services for the poor prohibitively expensive. High risk is inherent for those who would provide credit and insurance to clients who do not have formal or steady income, are subject to high income shocks, or lack formal property titles or often even personal identification. Innovations and policies have to address these two barriers.
Microcredit. Microcredit has long been seen as an important tool for financial inclusion and poverty reduction. Bangladesh was one of the first countries to see a large expansion of microcredit institutions, several of which, notably BRAC, Grameen Foundation, branched out beyond financial services. Distinguishing themselves from conventional banks, microfinance institutions have introduced such innovations as joint liability for a group of borrowers to facilitate their outreach to the poor and marginalized, especially women. The evidence indicates that microcredit has a positive but limited effect on household welfare and enterprise growth.
Microsavings. Experience across Asia and the rest of the developing world has shown the importance of looking beyond credit to other financial services, including savings, insurance, and payments. As discussed in the survey by Karlan, Ratan, and Zinman (2014), low-income individuals and households face different barriers to formal savings services, some of which mirror similar barriers to other financial services and some more specific to savings. Having a savings account appears to help a household manage its resources better and prioritize expenditure categories such as education and food consumption more effectively.

Financing Asia’s future growth 31
2.3.4 Indicators of barriers to business and SME loans
Physical access Affordability EligibilityLocations to submit
loan applications (out of 5)
Fee business loan (% of min. loan
amount)
Fees SME loan (% of min. loan
amount)
Days to process business loan applications
Days to process SME loan applications
Armenia 2.0 0.2 0.0 9.9 7.6Bangladesh 2.1 6.5 2.6 34.6 43.3PRC 2.0 0.0 0.0 50.0 40.0Georgia 2.5 1.0 1.1 5.0 5.6India 2.4 0.9 0.8 20.0 10.8Indonesia 3.1 0.9 1.5 16.6 9.7Korea, Rep. of 3.8 0.3 0.3 2.7 2.7Pakistan 3.1 0.1 0.2 32.0 33.6Philippines 2.4 1.4 1.4 44.1 33.3Sri Lanka 3.0 2.3 2.1 15.6 10.0Thailand 2.0 0.6 0.9 22.5 23.7Median 2.4 0.9 0.9 20.0 10.8Average 2.6 1.3 1.0 23.0 20.0PRC = People’s Republic of China, SME = small or medium-sized enterprise.Note: Data are weighted by country averages. Locations to submit loan applications take the value 1 if the application can be submitted at headquarters only; 2 if at headquarters or a branch; 3 if at headquarters, branches, or non-branch outlets; 4 if at headquarters, branches, non-branch outlets, or electronically; and 5 if at headquarters, branches, non-branch outlets, electronically, or over the phone. Fees for business or SME loans are expressed as a share of gross domestic product per capita. The last two columns show the number of days banks take to process a typical business or SME loan application.Source: Ayyagari and Beck (forthcoming) based on a bank-level survey in Beck, Demirgüç-Kunt, and Martinez Peria (2007).
Microinsurance. Many households and enterprises in developing countries face significantly higher risks and volatility than their peers in more developed countries. Insurance that can cushion income or expenditure shocks and their effects on consumption are therefore important. The provision of formal insurance products is hampered by high risks and costs, including costs to screen prospective policyholders and to verify claims. Products need to be designed to pay out fairly soon and often to engender trust in potential users. To create trust, rapid payouts are important, as clients’ liquidity constraints are often binding.
Other policies and innovations. One important constraint on financial inclusion is physical access to bank outlets. One important policy tool has been regulations on branches as in India, where such regulations caused 30,000 new rural branches to open from 1977 to 1990 and thereby increased deposit and credit volume. Financial literacy programs have so far had only very limited effect on financial behavior, including savings, but fine-tuning such programs may allow them to reach out to individuals, especially the young, as they make financial decisions. Finance that complies with sharia restrictions can attract Asian Muslims who are averse to conventional finance. Meanwhile, biometric identification initiatives, such as Aadhaar (foundation) in India, can provide to the poor the proper identification they need to open an account and conduct financial transactions.
Financial institutions in general have made few efforts to reach low-income segments of the population because the transactions they require are too small to be profitable. A response has been a trend

32 Asian Development Outlook 2015
toward delivery channels that are more cost-effective—famously mobile phones but also banking agents, who are local retailers that handle banking services on behalf of banks. The focus has been mostly on providing payment and savings services, which may explain their successful proliferation. Using data across 10 countries, McKay and Pickens (2010) report that so-called branchless banking is 19% cheaper for clients on average than comparable banking products offered through traditional channels. Saving can be even larger—half of costs—for medium-term savings and paying bills. Another policy option to expand access to formal financial services is public–private partnership, which has allowed the digitalization of government payments in Pakistan.
Policy focus on small and medium-sized enterprisesTransaction costs and information asymmetries hinder access to external finance for SMEs. Fixed transaction costs for credit assessment and loan processing and monitoring fall per unit as the size of the loan increases, which makes small loans to SMEs relatively costly. Meanwhile, managing risk is a greater challenge in lending to SMEs because, compared with larger firms, their dealings are opaque, their collateral poor, and their financial statements rarely audited. Moreover, if a given sector has few participating SMEs, financial institutions cannot benefit from economies of scale or risk diversification. Some policy reforms to ease SMEs’ financing constraints are discussed below.
Credit registries or bureaus. Constraints on SME financing demand general reform to the business environment and institutions, not necessarily specific to the SME lending market. One institution that can have a positive impact on lending to SMEs is a credit registry or bureau. Brown, Jappelli, and Pagano (2009) found in a sample of economies in transition in Central and Eastern Europe that the introduction or upgrade of credit registries in the 2000s significantly eased constraints on SME financing. Credit registries can expand bank outreach by either increasing competition among them or facilitating the entry of new players. As with policies that help push the financial system toward the frontier, improved access to external finance for SMEs has only indirect effects on economic growth and poverty reduction, so benefits should not be expected in the short term.
Roles of foreign banks and relationship banking. One controversial issue in SME finance has been the role of foreign-owned banks. The empirical evidence is mixed. Firms of all sizes report lower barriers to finance in economies with a higher share of foreign banks (Clarke, Cull, and Martinez Peria 2006). This positive effect can be direct or indirect. Foreign banks can bring in the knowhow and scale that encourage the introduction of new transaction and lending techniques. Further, by competing with domestic banks for a limited field of large corporate clients, they can force domestic banks to go down market to serve smaller companies, where they enjoy a local advantage catering to SMEs (de Haas and Naaborg 2005). The flip side of this is the

Financing Asia’s future growth 33
evidence that foreign banks are less likely than domestic banks to lend to small companies with opaque operations (Mian 2006, Gormley 2010). This observation echoes the traditional view that SME finance revolves around relationships and long-term connections between a bank and its borrowers.
Partial credit guarantees. To address the problem of many SMEs being able to offer only poor collateral, partial credit guarantees feature prominently in activist policies for the credit market. While private guarantees exist, governments and their development partners in particular have been aggressively pushing to establish guarantees to widen SME access to bank credit. In this regard, issues of pricing, funding, and institutional structure are important. While such schemes can be self-sustainable, they often require significant subsidies and contingent fiscal liabilities to cover losses. While it is difficult to compute such costs in advance, it is even more difficult to measure the benefits, which include adding new borrowers that would not have gained access to finance if not for partial credit guarantees. Only a few studies have rigorously assessed the impact of the guarantees, but those few point to a somewhat positive effect.
Equity finance. Equity finance has not received sufficient emphasis as a source of financing for SMEs. This form of finance can be beneficial when debt finance is not an option or a firm has reached its leverage limit. Although some developing countries have set up second-tier stock exchanges for SMEs, most such exchanges lack the necessary scale, demand, and infrastructure. For example, the over-the-counter exchange of India was established in 1992 as a platform to allow SMEs to generate equity capital, but it had only 60 companies listed as of March 2012. One barrier is the lack of institutional participation (Nair and Kaicker 2009). Private equity might therefore be a more promising route than public toward providing SMEs with access to equity finance. Private equity funds and venture capitalists, including angel financiers, can help. The main constraint on private equity investment in many developing countries, however, is limited scale.
Final thoughts on financial access for inclusion The lessons from the recent literature on financial inclusion have important policy repercussions for developing Asia. While external finance is critical for SME development, credit might not be the most urgent financial service for previously unbanked individuals. Payment and savings services can help low-income households smooth the effects of income shocks, income fluctuation, and sudden or lumpy consumption needs—and, ultimately, help them better integrate into the modern market economy. In terms of policy repercussions, the message therefore favors the careful expansion of credit with a greater focus on innovation to extend access to savings and payment services to the previously unbanked population. Competition and a favorable regulatory framework are critical. Finally, as Mylenko and Park (forthcoming) point out, more and better data on financial inclusion will help inform and guide the efforts of policy makers to broaden financial access.

34 Asian Development Outlook 2015
Financial stability to safeguard inclusive growth
While financial development can contribute to economic growth, it can also pose risks to financial stability, undermining both growth and equity. Liberalizing tightly regulated financial systems—as, for example, the PRC is attempting as it moves from a state-controlled system to a more competitive and market-oriented system—ultimately leaves sounder and more efficient financial intermediation. However, in the short run, it may acerbate volatility.
The challenge for the region is therefore to maintain financial stability even as it develops and liberalizes its financial system. During the global financial crisis of 2008–2009, the world saw the importance of strong and effective prudential regulation. In developing Asia, the regulatory challenges seem even more daunting, as regulators have to maintain financial stability while also encouraging growth-promoting financial development.
Asia’s financial systems are fortunately much healthier today, owing largely to reforms that followed the Asian financial crisis of 1997–1998. Even so, external shocks can unsettle local markets. Such an event happened in May 2013, during the so-called taper tantrums, when news of a possible change in US monetary policy decimated Asian stock prices and currency values (see Figure 2.4.1). Home-grown risks still lurk in the background, in the form of large shadow banking systems in some economies and unrestrained household debt expansion in others.
The point of departure for a financial regulatory framework that is strong yet nimble must be adequate prudential regulation and supervision of banks, which still dominate financial systems in developing Asia. Banking regulation is the primary safeguard against financial instability, but it should be supplemented by macroprudential policies and other new policy instruments now available to regulatory authorities.
Banking regulation in Asia As economies in developing Asia are quite diverse in population, demographics, and per capita GDP, it is no surprise that they vary widely in the size, structure, and complexity of their banking systems. They all have a common need, however, for supervision and regulation to keep their banking systems safe and sound. This means ensuring that their inevitable problems are manageable and that their bank failures, when unavoidable, are not large or systemic. Meanwhile, banks must remain able to meet credit needs.
2.4.1 Nominal rate changes against the US dollar during the taper tantrum, 23 May–30 June 2013
%
−6
−4
−2
0
India Indonesia Republicof Korea
Malaysia Philippines Thailand
Note: Decline means depreciation.Source: Estrada, Noland, Park, and Ramayandi (forthcoming).

Financing Asia’s future growth 35
Given the huge role of banks in Asia and the crippling effect of banking crises on growth, regulatory authorities’ first line of defense against financial stability is naturally the sound prudential supervision and regulation of these institutions (Table 2.4.1). In addition, regulatory authorities in the region need to follow guidelines set by Basel III core principles for bank regulation, which were recently introduced to strengthen global regulatory standards in the aftermath of the global financial crisis.
Southeast Asia in particular has unique regulatory and supervisory challenges arising from ongoing regional financial integration. The past 20 years have seen the emergence and expansion of many large banking conglomerates throughout the region. Some of these conglomerates operate banks that are systemically important in more than one economy. Conglomerate interconnectedness poses potential contagion risk—the possibility that problems arising in one affiliate can spread to other affiliates through various mechanisms such as intercompany transactions.
Bank supervisory authorities in jurisdictions where conglomerates operate subsidiary banks need to ensure timely and effective two-way communication and information-sharing with their foreign counterparts. Coordination among supervisors enables better understanding of the risks and financial soundness of the conglomerate parent and its bank and other subsidiaries, as well as the risks posed by transactions between affiliated organizations.
Basel III in developing AsiaThose who set international standards, such as the Financial Stability Board and the Basel Committee on Banking Supervision, pursue reform agendas intended to reduce the risks of bank failure and to mitigate the cost of failures and thereby preserve public confidence in the banking system when they occur. In particular, Asian banks are now confronted with Basel III and the tightening of the Basel Committee’s core principles for bank supervision agreed in 2011–2012 in response to the global financial crisis. That crisis resulted partly from a serious failure of bank regulation in the advanced economies. Basel III presents voluntary regulatory standards on bank capital adequacy, stress testing,
2.4.1 Banking crisis outcomes, 1970–2011
Output loss
Increase in debt
Monetary expansion Fiscal costs Fiscal costs Duration
Peak liquidity
Liquidity support Peak NPLs
Medians
Country % of GDP% of financial system assets Years
% of deposits and foreign liabilities
% of total loans
All 23.0 12.1 1.7 6.8 12.7 2.0 20.1 9.6 25.0Advanced 32.9 21.4 8.3 3.8 2.1 3.0 11.5 5.7 4.0Emerging 26.0 9.1 1.3 10.0 21.4 2.0 22.3 11.1 30.0Developing 1.6 10.9 1.2 10.0 18.3 1.0 22.6 12.3 37.5
NPL = nonperforming loan.Source: Laeven and Valencia (2012), Table 2, p. 17: data are from authors’ calculations.

36 Asian Development Outlook 2015
and market liquidity due to be implemented by March 2019. The initial Basel principles were agreed in 1988 and revised in 2004 (Basel II). Table 2.4.2 compares Basel II and Basel III, and Table 2.4.3 outlines the implementation table for Basel III.
Adherence to the more stringent Basel III standards will further strengthen Asian banks’ balance sheets and mitigate their vulnerability to shocks. The regulatory framework reduces opportunities for regulatory arbitrage and harmonizes regulatory standards. However, the region must ensure that tightened regulations do not seriously compromise banks’ capacity to fulfill their core function of channeling credit to households and firms for investment and production.
2.4.2 Comparison of Basel II and Basel III capital requirements
% of risk weighted assets Capital requirements Additional macroprudential overlay
Common equity Tier 1 capital Total capitalCounter-cyclical
bufferAdditional
loss-absorbing capacity for systemically
important financial
institutionsMinimumConservation
buffer Required Minimum Required Minimum Required RangeBasel II 2.0 4.0 8.0
Memo:
Equivalent to about 1% of an average international bank under
the new definition
Equivalent to about 2% of an average
international bankBasel III
New definition and calibration
4.5 2.5 7.0 6.0 8.5 8.0 10.5 0.0–2.5 1.0–2.5
10.5–15.5
Source: ADB estimates.
2.4.3 Basel III implementation timetable
Leverage ratio (%)
2011 2012 2013 2014 2015 2016 2017 2018As of 1 January
2019Supervisory monitoring Parallel run with disclosure starting 2015 Migration to Pillar 1
Minimum common equity capital ratio 3.5 4.0 4.5 4.5 4.5 4.5 4.5Capital conservation buffer 0.625 1.25 1.875 2.5Sum of the above 3.5 4.0 4.5 5.125 5.75 6.375 7.0Phase-in of deductions from common
equity tier 1 capital20 40 60 80 100 100
Minimum tier 1 capital 4.5 5.5 6.0 6.0 6.0 6.0 6.0Minimum total capital 8.0 8.0 8.0 8.0 8.0 8.0 8.0Minimum total capital + conservation buffer 8.0 8.0 8.0 8.625 9.25 9.875 10.5Capital instruments that no longer qualify
as non-core tier 1 or 2 capitalTo be phased out over 10 year period starting 2013
Liquidity coverage ratio Observation begins Introduce minimum standardNet stable funding ratio Observation begins Introduce minimum
standard
Source: ADB estimates.

Financing Asia’s future growth 37
Banks in Asia appear sound today even under the new stricter standards of Basel III thanks to earlier efforts to strengthen their capital base, reduce nonperforming loans, and bolster loan loss provisions, especially after the Asian financial crisis of 1997–1998. However, another reason is that the region’s financial markets are underdeveloped and not as exposed to sophisticated instruments as their counterparts in more financially advanced economies. Bank capital, for instance, is mostly held as simple paid-in capital and retained earnings.
Although they preserve financial stability and improve transparency among banks, the new, stringent regulatory standards raise the cost of financial intermediation and limit the availability of bank credit. In upper-middle-income countries, relatively scant and expensive bank finance will encourage the development of bond markets, as their economies already have a core bond market and a growing institutional investor base such as insurance companies. The tight leverage ratio under Basel III will likely limit the supply of bank finance, as banks in these countries often stretch their balance sheets. Moreover, capital requirements will likely constrain the provision of bank finance for SMEs unless efforts are made to enhance secured and unsecured lending and promote nonbank finance for SMEs.
For lower-middle-income countries, the challenges that Basel III pose are somewhat different and more challenging. The new financial standards, particularly liquidity requirements, are likely to constrain the generation of medium- to long-term bank finance because financial systems are heavily dominated by banks. While solvency policies are designed to encourage very long-term investment by insurance companies, insurance industries are often too small in these economies to compensate for the loss of medium- to long-term finance from banks. Therefore, in addition to developing a base of long-term institutional investors such as insurance companies and pension funds, regulators must, in the meantime, induce banks to meet their capital adequacy requirements by expanding their capital, not cutting back their lending.
Lessons from the global financial crisisAccording to Zamorski and Lee (forthcoming), international experience during the global financial crisis provides some valuable lessons for Asian bank regulators. Above all, the crisis underlined that sound and effective bank regulation is vital to financial stability. The crisis reflected the failure of regulatory authorities to keep pace with financial innovation. The sobering lesson for Asia and the rest of the developing world is that even financially advanced economies are susceptible to risks from lax regulation and reckless lending.
Assessments of the global financial crisis of 2008–2009 invariably point to ineffective finance regulation and supervision as the main reasons for the onset of the crisis and its severity. In particular, lapses in banking regulation contributed significantly to the outbreak. Regulators allowed banks to operate with excessive leverage and failed to curtail risky lending, primarily mortgages to subprime homebuyers who were inadequately screened for creditworthiness.

38 Asian Development Outlook 2015
Bank supervision had been weak by any measure. Supervisors did not conduct regular onsite bank inspections or examinations of sufficient depth. They did not properly implement risk-based supervision, and they failed to identify shortcomings in banks’ risk-management methods, governance structures, and risk cultures.
Instead, overemphasis on banks’ historic operating results and static financial conditions in assessing risk, failed to reveal potential vulnerabilities. Meanwhile, offsite surveillance systems rely too heavily on banks’ self-reported data to effectively monitor risk. Regulators failed to understand the risk and policy implications of new bank products and services and changing business models, or to establish effective lines of communication with their counterparts in other economies, through which they could have shared vital information.
Post-crisis analysis by the International Monetary Fund, Financial Stability Board, and Basel Committee on Banking Supervision identify additional aspects of bank supervision that could have helped avoid the global financial crisis:
(i) adequately monitoring and controlling macroprudential risk, and not just individual bank risk, as a buildup of such vulnerabilities could hit a number of institutions simultaneously, posing systemic risk;
(ii) conducting comprehensive stress testing of the banking system and other economic sectors, taking into account highly risky scenarios even if they seemed unlikely;
(iii) paying attention to concentrations of risk and to interdependencies, including cross-border risks; and
(iv) considering risks in the shadow banking industry or cross-sector risks posed by nonbank financial intermediaries.
The last major episode of cross-border financial instability and banking crisis in developing Asia occurred more than 17 years ago. To extend this impressive record of relative calm, bank supervisory authorities in the region need to assess their supervisory systems, infrastructure, and actual practices. The lessons learned in the global financial crisis will be useful to this process. If the assessment reveals that changes, enhancements, or remedial action are needed, a definitive plan should be crafted and implemented in a timely way.
Macroprudential policies in developing AsiaBefore the global financial crisis, bank monitoring focused primarily on prudential risks to individual institutions and failed to consider that a buildup of macroeconomic risks and vulnerabilities could pose systemic risk by severely affecting a number of institutions simultaneously. The global financial crisis highlighted the need for national bank supervisory authorities to improve surveillance systems and better detect early on the buildup of macroeconomic risks that could threaten the financial system. This requires strong macroprudential policy that includes measures to prevent periods of instability or crisis, as well as a rich set of instruments to alleviate financial risks that stem from vulnerabilities building up in the broader financial system, be they related to credit, liquidity, or capital.

Financing Asia’s future growth 39
The Basel Committee on Banking Supervision is increasingly guided by the need for a macroprudential perspective on financial regulation. Although much progress has been made on the regulatory front—especially with Basel III tightening of the rules on the quantity and quality of bank capital, requiring for example a countercyclical capital buffer—regulations apply to only some financial institutions. In contrast, macroprudential policy aims to limit the buildup of risk in the entire financial system and enhance its resilience following shocks. Efforts are mainly to identify systemic threats to financial markets that could affect the real economy, and so avoid another financial crisis.
Macroprudential policy measures fall into the following three broad categories (Lim et al. 2011):
(i) credit controls, including caps on ratios of loan to value and of debt to income and on foreign currency lending, as well as ceilings on credit or credit growth;
(ii) liquidity regulations, which place limits on net open currency positions or currency mismatches and on maturity mismatches, while establishing reserve requirements; and
(iii) capital requirements, including countercyclical capital requirements, time-varying/dynamic provisioning, and restrictions on profit distribution.
Macroprudential tools such as minimum capital ratios and loan-to-value ratios have been used for some time. Compared with some other regions, Asia has long experience in implementing a variety of macroprudential measures to prevent or address asset price bubbles or other threats to financial stability. This experience is derived primarily from dealing with previous threats to financial stability, especially arising from volatile capital flows.
Can macroprudential policies keep Asian financial systems stable?In theory, macroprudential measures can safeguard the stability of the banking system and the broader financial system by mitigating risks that affect the entire financial system and therefore the economy. The question is, as always, whether they actually work in practice. This section presents the basic framework of an empirical analysis to gauge how effectively macroprudential policies control credit growth, leverage growth, and housing price appreciation. The broad contours of the methodology and data are described in Box 2.4.1.
Two significant findings emerge. Broadly, macroprudential policies can indeed promote financial stability in Asia. More specifically, different types of macroprudential policies are more effective against different
2.4.2 Responses to selected macroprudential policies in selected economies
Source: Lee, Asuncion, and Kim (forthcoming).
Impulse response
−4
−2
0
2
4
0 2 4 6 8 10
Lower boundUpper boundResponse of credit growth
Impulse response
Lower boundUpper boundResponse of leverage growth
−8
−4
0
4
0 2 4 6 8 10
Impulse response
Lower boundUpper boundResponse of housing price
−4
−2
0
2
4
0 2 4 6 8 10
Credit growth response to credit-relatedmacroprudential tightening in India
Leverage growth response to liquidity-relatedmacroprudential tightening in Indonesia
Housing growth response to credit-relatedmacroprudential tightening in the
Republic of Korea

40 Asian Development Outlook 2015
types of macroeconomic risks. For example, the results suggest that credit-related macroprudential policy dampens credit growth in India, liquidity-related macroprudential policy reins in leverage growth in Indonesia, and credit-related macroprudential policy helps to control housing price escalation in the Republic of Korea (Figure 2.4.2).
The general pattern across the region suggests that credit-related macroprudential policies can effectively dampen credit expansion and housing price inflation, while liquidity-related macroprudential
2.4.1 Methodology and data
A major innovation of this analysis is defining macroprudential policy as a continuous variable rather than as a binary variable. Tillmann (2014) and Meinusch and Tillmann (2014) recently extended a multivariate dynamic probit model—the qualitative vector autoregression model that Dueker (2005) originally applied to forecast business cycle turning points—to uncover the latent propensity to macroprudential policy tightening from the observed binary policy data. This modified methodology can examine the dynamic effectiveness of macroprudential policy and unconventional monetary policy by addressing the exogenous treatment of binary macroprudential policy indicators that are likely endogenous and by tracing out the dynamic adjustment of the endogenous variables following different macroprudential policy shocks.
The binary macroprudential policy indicators often do not properly represent policy stance that leans toward tightening, easing, or maintaining a neutral stance. One advantage of using the qualitative VAR is to uncover latent and unobservable propensity for macroprudential tightening from the observed binary policy data, which provides an endogenous continuous series reflecting the business cycle. A standard VAR with the generated latent series can provide estimates and dynamic impulse response functions for macroprudential policy shocks. Lee, Asuncion, and Kim (forthcoming) comprehensively describe the empirical methodology.
Data came from varied sources such as the International Monetary Fund’s International Financial Statistics, CEIC Data Company, the Bank for International Settlements, the Economic Intelligence Unit, and government sources. A database of macroprudential policy instruments draws from Lim et al. (2011, 2013), Shim (2013), Zhang and Zoli (2014), documents posted on the websites of central banks such as annual reports and financial stability reports, the Annual Report on Exchange Arrangements and Exchange Restrictions database, and research papers on macroprudential policy in individual economies and the region. The sample period is from the first quarter of 2000 to the fourth quarter of 2013.
The box table shows information about macroprudential instruments that 10 economies have most actively applied in developing Asia during the sample period. In the sample, credit-related macroprudential policy instruments such as ratios of loan to value and of debt to income were used most frequently in Indonesia, the Republic of Korea, Singapore, and Thailand, while liquidity-related macroprudential policy instruments such as reserve requirements and limits on net open currency positions were employed most commonly in the PRC, India, and Indonesia. Capital-related macroprudential policy tools were rarely applied except in India. The tools implemented most often were credit-related macroprudential policy measures.
Specific use of macroprudential policy instruments by economy, 2000–2013
Policy TypeEconomy
Total %HKG IND INO KOR MAL PHI PRC SIN TAP THACredit-relateda 5 6 11 23 6 1 8 13 3 15 92 49.2Liquidity-relatedb 0 18 7 3 3 10 31 0 6 1 79 42.2Capital-relatedc 1 4 1 2 0 6 1 1 0 0 16 8.6Total 6 28 19 28 9 17 41 14 9 16 187 100.0
HKG = Hong Kong, China; IND = India; INO = Indonesia; KOR = Republic of Korea; MAL = Malaysia; PHI = Philippines; PRC = People’s Republic of China; SIN = Singapore; TAP = Taipei,China; THA = Thailand.a Caps on ratios of loan to value and debt to income, caps on foreign currency lending, and ceilings on credit and credit growth.b Limits on net open currency positions and currency mismatch, limits on maturity mismatch, and reserve requirements.c Countercyclical and time-varying capital requirements, time-varying/dynamic provisioning, and restrictions on profit distribution.Source: Lee, Asuncion, and Kim (forthcoming).

Financing Asia’s future growth 41
policy tools moderate leverage growth and housing price escalation. The salient implication for Asian financial regulators is that, while they should explore the use of macroprudential policies, they should assess which exact policies are appropriate for the particular macroprudential risk they face.
Further issues on financial stability for growthThis section discusses three additional approaches relevant for financial stability in Asia. Bank stress tests, which the US and European Union have used extensively since the global financial crisis, offer Asian regulators another potentially useful tool for safeguarding stability. Foreign direct investment and the diversification of external funding sources can reduce the vulnerability of Asian countries to external financial shocks. Finally, the PRC’s efforts to liberalize its financial system without upsetting its financial stability is of historic importance for the PRC and provides some valuable lessons for the rest of Asia.
Bank stress tests and their implications for AsiaBank stress tests assess whether a bank or group of banks are adequately capitalized for stressed economic scenarios. More specifically, stress tests evaluate whether banks have sufficient self-insurance to withstand adverse economic shocks so that a costly banking crisis can be avoided. Bank stress tests have been conducted by the International Monetary Fund since the late 1990s, by central banks and other national regulatory authorities since before that, and even earlier by commercial and investment banks themselves.
What has put bank stress tests in the headlines around the world, however, is of more recent revival. Both the US and European Union have vigorously implemented bank stress tests in the aftermath of the global financial crisis. Although it is difficult to assess the impact of the stress tests because the crisis management effort had many other elements, some evidence suggests that they helped calm the markets.
Three policy implications can be drawn for Asia from the stress tests conducted in the US and the European Union (see Goldstein, forthcoming). First, the credibility of such tests depends in good measure on their institutional framework and design: the legal authority for the test, the independence of the supervisor conducting the tests, and the resources applied. Second, capital shortfalls revealed by stress tests should be remedied in a way that is friendly to economic growth. A higher desired capital ratio should be translated into an absolute amount of capital, rather than allowing banks to achieve the higher capital ratio by cutting back on loans, disposing of assets in fire sales, or manipulating risk weights. Third, because capital ratios that use an unweighted measure of bank assets in the denominator, or leverage ratios, do a much better job from the start of distinguishing sick banks from healthy ones than do risk-based measures of bank capital, a leverage ratio test should be included in all future supervisory-led bank stress tests. Over time, a leverage ratio should become the primary metric for bank stress tests.
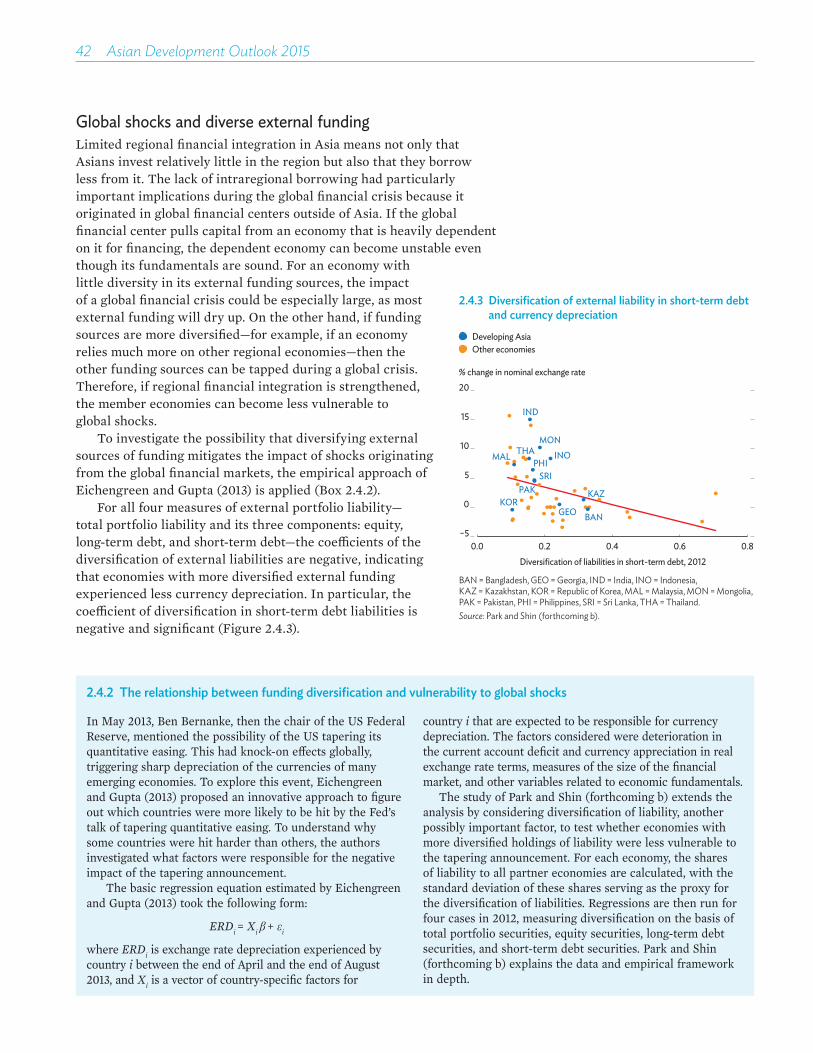
42 Asian Development Outlook 2015
Global shocks and diverse external fundingLimited regional financial integration in Asia means not only that Asians invest relatively little in the region but also that they borrow less from it. The lack of intraregional borrowing had particularly important implications during the global financial crisis because it originated in global financial centers outside of Asia. If the global financial center pulls capital from an economy that is heavily dependent on it for financing, the dependent economy can become unstable even though its fundamentals are sound. For an economy with little diversity in its external funding sources, the impact of a global financial crisis could be especially large, as most external funding will dry up. On the other hand, if funding sources are more diversified—for example, if an economy relies much more on other regional economies—then the other funding sources can be tapped during a global crisis. Therefore, if regional financial integration is strengthened, the member economies can become less vulnerable to global shocks.
To investigate the possibility that diversifying external sources of funding mitigates the impact of shocks originating from the global financial markets, the empirical approach of Eichengreen and Gupta (2013) is applied (Box 2.4.2).
For all four measures of external portfolio liability—total portfolio liability and its three components: equity, long-term debt, and short-term debt—the coefficients of the diversification of external liabilities are negative, indicating that economies with more diversified external funding experienced less currency depreciation. In particular, the coefficient of diversification in short-term debt liabilities is negative and significant (Figure 2.4.3).
2.4.2 The relationship between funding diversification and vulnerability to global shocks
In May 2013, Ben Bernanke, then the chair of the US Federal Reserve, mentioned the possibility of the US tapering its quantitative easing. This had knock-on effects globally, triggering sharp depreciation of the currencies of many emerging economies. To explore this event, Eichengreen and Gupta (2013) proposed an innovative approach to figure out which countries were more likely to be hit by the Fed’s talk of tapering quantitative easing. To understand why some countries were hit harder than others, the authors investigated what factors were responsible for the negative impact of the tapering announcement.
The basic regression equation estimated by Eichengreen and Gupta (2013) took the following form:
ERDi = Xi β + εi
where ERDi is exchange rate depreciation experienced by country i between the end of April and the end of August 2013, and Xi is a vector of country-specific factors for
country i that are expected to be responsible for currency depreciation. The factors considered were deterioration in the current account deficit and currency appreciation in real exchange rate terms, measures of the size of the financial market, and other variables related to economic fundamentals.
The study of Park and Shin (forthcoming b) extends the analysis by considering diversification of liability, another possibly important factor, to test whether economies with more diversified holdings of liability were less vulnerable to the tapering announcement. For each economy, the shares of liability to all partner economies are calculated, with the standard deviation of these shares serving as the proxy for the diversification of liabilities. Regressions are then run for four cases in 2012, measuring diversification on the basis of total portfolio securities, equity securities, long-term debt securities, and short-term debt securities. Park and Shin (forthcoming b) explains the data and empirical framework in depth.
2.4.3 Diversification of external liability in short-term debt and currency depreciation
BAN
SRI
IND
INO
KOR
MAL
PAK
PHITHA
GEO
KAZ
MON
% change in nominal exchange rate
−5
0
5
10
15
20
0.0 0.2 0.4 0.6 0.8Diversification of liabilities in short-term debt, 2012
Other economiesDeveloping Asia
BAN = Bangladesh, GEO = Georgia, IND = India, INO = Indonesia, KAZ = Kazakhstan, KOR = Republic of Korea, MAL = Malaysia, MON = Mongolia, PAK = Pakistan, PHI = Philippines, SRI = Sri Lanka, THA = Thailand.Source: Park and Shin (forthcoming b).

Financing Asia’s future growth 43
Liability related to bank borrowing, as opposed to portfolio liability, also plays an important role in triggering crises. In emerging markets, crises are frequently characterized by twin crises as banking and currency crises occur simultaneously. Performing the type of empirical analysis described in Box 2.4.1 on bank lending data from the Band for International Settlements, Park and Shin (forthcoming b) found that economies with more diversified sources of bank lending were generally less vulnerable to the tapering announcement.
Just as diversifying foreign asset holdings has benefits, so does diversifying foreign liability holdings. In particular, the analysis indicates that it helps to mitigate financial instability caused by shocks from global financial markets. This implies that excessive global financial integration can be undesirable. Deeper regional financial integration can replace excessive dependence on global financial markets for external funding and thus vulnerability to global shocks. The evidence therefore provides some support for the efforts of Asian governments to further deepen regional financial integration.
Foreign direct investment and other determinants of vulnerabilityThere are, of course, other determinants of vulnerability that have been more extensively tested in the literature. In particular, a higher share of foreign direct investment (FDI) in total foreign liability seems to help reduce vulnerability to external financial shocks (e.g., Tong and Wei 2010, Prasad, Rajan, and Subramanian 2007). Intuitively, this is because FDI is geared more toward the long term and hence more stable than other private capital flows. In fact, FDI proved to be remarkably resilient in East Asian economies during the Asian financial crisis of 1997–1998. In sharp contrast, portfolio equity and debt flows—the more short-term flows—suffered large reversals and thus became major causes of volatility. On the other hand, FDI turned out to be less resilient during the global financial crisis, especially in Eastern Europe, where FDI collapsed as sharply as other capital flows. Currently, significant variation exists in the share of FDI in the liabilities of economies in developing Asia (Figure 2.4.4).
Turning from liabilities to assets, currency and maturity mismatches in the balance sheets of banks and other financial institutions can cause financial vulnerability. In fact, the twin mismatches were central catalysts of the Asian financial crisis. Before the crisis struck, banks in some East Asian economies borrowed short-term in US dollars to make long-term loans in their national currencies. Park (2011) found that both mismatches were markedly less pronounced before the global financial crisis than before the Asian financial crisis, which helps to explain much greater resilience during the global crisis. One indicator that broadly captures these types of risks is the ratio of short-term foreign debt to foreign exchange reserves,
2.4.4 Share of foreign direct investment in the foreign liabilities of selected economies, 2012
OTHERECONOMIES
DEVELOPINGASIA
0 20 40 60 80 100%
Brazil
United States
Mexico
People’s Republic of China
Hong Kong, China
Indonesia
Thailand
Philippines
Malaysia
India
Sources: International Monetary Fund, International Financial Statistics online database (accessed 2 November 2014); ADB estimates.

44 Asian Development Outlook 2015
where a lower ratio indicates reduced vulnerability. Across Asia, the ratio is well below the informal but widely used Greenspan–Guidotti threshold of 1 (Figure 2.4.5).
Yet another indicator is the growth of the ratio of the money supply measure M2 to GDP. In the PRC, rapid growth of the ratio has caused some concern about excessive reliance on bank lending. Overall, though, most indicators suggest that the region’s financial system is in relatively good health, though this is no cause for complacency.
Lessons from the PRC on financial development and stabilityA huge strategic challenge confronting the PRC is how to transition toward a more market-based and efficient financial system without disrupting financial stability. Drawing lessons from the PRC experience for the rest of Asia is difficult because of its unique financial system. In particular, the PRC financial system is set apart by having grown very large relative to GDP at an early stage in economic development (Figure 2.4.6).
Nevertheless, as many other Asian economies share with the PRC a quest for smooth and stable financial development, its experiences hold valuable lessons for the rest of the region. And, like the PRC, some Asian economies have achieved relatively high financial development as measured by quantitative indicators but now face the more difficult challenge of improving the quality of financial intermediation.
Several useful lessons can be drawn from the PRC experience to inform other Asian economies implementing financial reform. The first is that it is possible to rapidly improve the efficiency of state-owned banks, which remain important in many Asian countries (Figure 2.4.7). State-owned banks in the PRC went from being technically bankrupt in the late 1990s to earning large profits less than a decade later. The turnaround required a large injection of capital from the central government and indirect support to offload bad loans to asset management companies. But reform went much further than a simple bailout. State-owned banks dramatically retrenched their staff and branches to boost efficiency. An independent banking regulator was established, and a separate body was created to manage the state’s equity interests. The banks brought in strategic foreign investors and sought listings on international exchanges to reinforce improved corporate governance. The result of reform was a dramatic increase in the operational efficiency and profitability of commercial banks in the PRC (Table 2.4.4).
The second lesson from the experience of financial reform in the PRC is that an incremental approach can
2.4.5 Short-term foreign debt to foreign exchange reserves in selected Asian economies, 2013
0.0 0.1 0.2 0.3 0.4 0.5Ratio
Philippines
People’s Republic of China
Malaysia
India
Republic of Korea
Taipei,China
Thailand
Indonesia
Sources: CEIC Data Company and World Bank, World Development Indicators online database (both accessed 3 March 2015); ADB estimates.
2.4.6 Credit to GDP and per capita GDP, 2013
Indonesia
Japan
People’s Republic of China
Thailand
Republic of Korea
Malaysia
Credit to GDP (%)
0
50
100
150
200
250
0 10,000 20,000 30,000 40,000GDP per capita ($)
India
Source: Borst and Lardy (forthcoming) based on data from the Bank for International Settlements and World Bank.
2.4.7 Share of banking assets held by entities more than 50% state-owned, 2010
0 20 40 60 80%
PhilippinesTajikistanThailand
Taipei,ChinaKyrgzy Republic
PakistanRepublic of Korea
KazakhstanBangladesh
IndonesiaBhutan
India
Source: Borst and Lardy (forthcoming) based on data from the World Bank Banking Supervision Survey.

Financing Asia’s future growth 45
have unintended consequences. The authorities in the PRC soundly rejected the big bang approach to financial reform advocated to many developing countries in the 1990s. In the wake of the collapse of many economies following the dissolution of the Soviet bloc, and the turmoil in Asia during the Asian financial crisis, the PRC approach of slow and incremental financial reform seemed vindicated. However, the slow progress of many financial reforms, most notably on exchange rates and the liberalization of interest rates on deposits, has created adverse side effects. The glacial pace of interest rate liberalization has given rise to an unsustainably large increase in credit and the creation of a large shadow banking system. Measured and incremental financial reform may be preferable to overnight liberalization. However, the lack of reform can also create risks within the financial system.
The final lesson to be drawn from the experience of the PRC is the difficulty of rooting out implicit guarantees and moral hazard in a financial system that is dominated by state-owned actors. The PRC has one of the largest banking systems in the world, yet it is only now in the process of creating a deposit insurance system. The Government of the PRC therefore faces a large implicit liability. Even worse, depositors assume that banks will guarantee returns on a variety of other financial products, such as trust and wealth management products, without regard for whether the issuing bank has any legal responsibility to guarantee anything. The government is therefore the ultimate guarantor of these products as well. What is required to meaningfully reduce moral hazard is a paradigm change in the approach of regulators and the introduction of private financial institutions that are allowed to fail.
Final thoughts on safeguarding inclusive growthAs they develop their financial systems, Asian economies must be vigilant about financial stability, as instability harms both growth and equity. Heightened global financial instability since the global crisis—and homegrown risks such as shadow banking in particular—strengthen the case for vigilance. That said, tighter regulations under Basel III complicate the task of Asian bank regulators by potentially limiting finance in bank-dominated economies. Fortunately, the healthy balance sheets of Asian banks give cause for optimism about their ability to balance financial stability and economic growth. Moreover, macroprudential policies and other new tools will help bolster the defense of the region’s financial stability.
2.4.4 Bank performance in the PRC versus the G-20 Aaverage (%)
Return on assets Net interest margin Return on equity Cost/income ratioPRC 1999 0.7 1.9 9.8 65.5PRC 2011 1.1 2.9 18.3 38.3G-20 2011 (Average) 1.2 3.0 13.5 59.3
G-20 = Group of Twenty, PRC = People’s Republic of China.Source: Borst and Lardy (forthcoming).

46 Asian Development Outlook 2015
Financing Asia’s future growth
Financial sector development can make a significant, positive contribution to economic growth. The effect of financial development on growth is larger in developing countries and especially pronounced in developing Asia. Moreover, it is the development of the financial system as a whole, rather than any particular component of the financial system, that has a significant, positive effect on economic growth. While Asia compares favorably with other parts of the developing world in financial development, it still lags advanced economies, which suggests scope for further progress and hence a growth dividend. Therefore, at a time when Asian policy makers are seeking new engines of growth, one overlooked engine may be a sounder and more efficient financial system.
The growth benefits of finance will be even larger if a more competitive financial system better allocates resources according to market principles. The PRC experience suggests, for example, that the participation of foreign banks can enhance both competition and the lending quality of state-owned banks and others in the system. The end result will be lending decisions made to a greater degree on commercial considerations that therefore allocate capital to more productive investments and activities. A closely related point is that sustaining growth ultimately requires a vibrant private sector, and access to adequate, reasonably priced capital is essential to a vibrant private sector. Innovation and productivity growth, which will loom larger as the region becomes increasingly middle income, require a well-developed financial system, especially one with adequate sources of long-term capital.
Financial development generally promotes economic growth, but its impact on equity is uncertain. Financial deepening can either widen the income gap, if its benefits accrue largely to senior financial professionals and other wealthy individuals, or narrow the gap if the poor gain greater access to financial services. Empirical evidence reflects this dichotomy. While financial development tends to alleviate inequality in its early stages, inclusion does not come automatically as financial development deepens. Therefore, since financial development does not necessarily promote equity, Asian policy makers must make a concerted effort to advance financial inclusion by expanding access for the poor to financial services. Doing so will improve the odds of finance becoming an engine of inclusive growth.
The global financial crisis underlined the importance of sound and effective financial regulation to safeguard financial stability, which is vital for both growth and equity. The region’s financial institutions are well placed to meet the more stringent regulatory standards being adopted globally, as many already exceed requirements under Basel III. Regulators will be challenged, however, to find the right balance. They must appreciate how strong regulation protects stability by preventing the accumulation of systemic risks, but they must weigh it against the potential benefits of flexible regulation that promotes

Financing Asia’s future growth 47
investment, productivity, innovation, and economic growth. For both banks and capital markets, the key regulatory challenge is to strengthen governance and thereby minimize crony lending, insider trading, and other inefficient and inequitable practices. Good governance tightens the link between finance and growth by directing capital toward productive investments and activities.
In sum, as the region grapples today with the slowdown of growth momentum since the global financial crisis, the case for further financial sector development in developing Asia has never been stronger. A sound and efficient financial sector is simply an indispensable ingredient for the region’s ongoing quest for a brighter future achieved through growth that is rapid but also stable and inclusive.
Endnotes1 This follows from the multiplication of the log difference of
the liquid liabilities ratio and its relevant coefficient obtained from the regression. See Table 2.1.2. That is 2.72*[ln(63.9+1)-ln(63.9)]=2.72*0.016=0.04, and 0.04*10=0.4.
2 Demirguc-Kent and Levine (2009) survey the literature on theory and evidence on the relationship between financial development and inequality.
3 ADB (2014) has a comprehensive discussion of innovation-led growth in Asia.
4 By contrast, short-term horizons and procyclical investment strategies, such as bank lending that relies on imprudent short-term funding and excessive maturity transformation (or the funding of longer-term commitments with shorter-term deposits or investments) is more prone to instability, as demonstrated by the global financial crisis of 2008–2009.
5 In most East Asian economies, insurance companies are the largest institutional investors, their investments equaling 26% of GDP, while mutual funds average 17% and pension funds 15% (Didier and Schmukler 2014).
6 Group of Thirty (2013) offers a more comprehensive list of policy proposals for advanced and emerging market economies globally. European Commission (2013) details policy proposals more specific to Europe, which, like Asia, has financial sectors heavily dependent on banks. Ding, Lam, and Peiris (2014), Felman et al. (2014), Walsh (2014), and Zhu (2014) offer policy proposals more specific to Asia.
7 A number of initiatives are already under way on this front, including the Asian Bond Fund and the ASEAN+3 Bond Market Initiative, which joins seven members of the Association of Southeast Asian Nations with the People’s Republic of China (including Hong Kong, China), Japan, and the Republic of Korea.
8 Christensen, Schindler, and Tressel (2013) provides empirical evidence that banking system reform is positively and significantly associated with growth in total factor productivity in low- and middle-income countries.

48 Asian Development Outlook 2015
9 For evidence at the level of the firm of a positive relationship between the use of external finance (both debt and equity) and future productivity growth, see Levine and Warusawitharana (2014), which analyzes data from advanced European economies. The study provides evidence against a reverse-causality explanation. For one economy in their sample, the United Kingdom, direct evidence indicates that firms use financing to invest in productivity enhancement.
10 A new version of the database, based on surveys in 2013 and 2014, is expected to be released in April 2015.
11 The data used in this paper were downloaded in September 2014. Several economies have more than 1 year of survey data, and all years of data on each economy were pooled for this analysis.
Background papersAizenman, J., Y. Jinjarak, and D. Park. 2015. Financial Development
and Output Growth in Developing Asia and Latin America: A Comparative Sectoral Analysis. NBER Working Paper No. 20917. National Bureau of Economic Research.
Ayyagari, M. and T. Beck. Forthcoming. Financial Inclusion in Asia: An Overview. ADB Economics Working Paper Series. Asian Development Bank.
Batten, A., M. Bezemer, P. Doung, G. Estrada, J. Hansen, G. Luarsabishvili, M. G. Mortaza, and D. Park. Forthcoming. The Financial Systems of Financially Less Developed Asian Economies: Key Features and Reform Priorities. ADB Economics Working Paper Series. Asian Development Bank.
Borst, N. and N. Lardy. Forthcoming. Maintaining Financial Stability in the People’s Republic of China during Financial Liberalization. Working Paper Series. Peterson Institute for International Economics and Asian Development Bank.
Burger, J., F. Warnock, and V. Warnock. Forthcoming. Bond Market Development in Developing Asia. ADB Economics Working Paper Series. Asian Development Bank.
Chopra, A. Forthcoming. Financing Productivity- and Innovation-Led Growth in Developing Asia: International Lessons and Policy Issues. Working Paper Series. Peterson Institute for International Economics and Asian Development Bank.
Cline, W. Forthcoming. The Financial Sector and Growth in Emerging Asian Economies. Working Paper Series. Peterson Institute for International Economics and Asian Development Bank.
Deckle, R. and M. Pundit. Forthcoming. The Recent Convergence of Financial Development in Asia. ADB Economics Working Paper Series. Asian Development Bank.
Estrada, G., M. Noland, D. Park, and A. Ramayandi. Forthcoming. Financing Asia’s Growth. Working Paper Series. Peterson Institute for International Economics and Asian Development Bank.
Estrada, G., D. Park, and A. Ramayandi. Forthcoming. Financial Development, Financial Openness, and Economic Growth. ADB Economics Working Paper Series. Asian Development Bank.

Financing Asia’s future growth 49
Lee, M., R. C. Asuncion, and J. Kim. Forthcoming. Effectiveness of Macroprudential Policies in Developing Asia: An Empirical Analysis. ADB Economics Working Paper Series. Asian Development Bank.
Mylenko, N. and D. Park. Forthcoming. Financial Inclusion in Developing Asia: Transactional Accounts, Savings, and Borrowings. ADB Briefs. Asian Development Bank.
Park, D. and K. Shin. Forthcoming. Economic Growth, Financial Development, and Income Inequality. ADB Economics Working Paper Series. Asian Development Bank.
———. Forthcoming. Financial Integration in Asset and Liability Holdings in East Asia. ADB Economics Working Paper Series. Asian Development Bank.
Zamorski, M. and M. Lee. Forthcoming. Enhancing Bank Supervision in Asia: Lessons Learned from the Financial Crisis. ADB Economics Working Paper Series. Asian Development Bank.
ReferencesAcemoglu, D., P. Aghion, and F. Zilibotti. 2006. Distance to Frontier,
Selection, and Economic Growth. Journal of the European Economic Association 4(1).
Adams, C. 2008. Emerging East Asian Banking Systems. Ten Years after the 1997/1998 Crisis. Working Paper Series on Regional Economic Integration No. 16. Asian Development Bank.
Aghion, P. and P. Howitt. 2006. Joseph Schumpeter Lecture—Appropriate Growth Policy: A Unifying Framework. Journal of the European Economic Association 4(2–3).
———. 2009. The Economics of Growth. Massachusetts Institute of Technology Press.
Aizenman J., B. Pinto, and V. Sushko. 2013. Financial Sector Ups and Downs and the Real Sector in the Open Economy: Up by the Stairs, Down by the Parachute. Emerging Markets Review 16.
Alesina, A., V. Grilli, and G. M. Milesi-Ferretti. 1994. The Political Economy of Capital Controls. In Leiderman, L. and A. Razin, eds. Capital Mobility: The Impact on Consumption, Investment, and Growth. Cambridge University Press.
Ark, B. V. 1995. Sectoral Growth Accounting and Structural Change in Postwar Europe, GGDC Research Memorandum 199523. Groningen Growth and Development Centre, University of Groningen.
Asian Development Bank. Forthcoming. Making Money Work: Financing a Sustainable Future in Asia and the Pacific.
———. 2014a. Asia Bond Monitor. June.———. 2014b. Innovative Asia: Advancing the Knowledge-Based Economy.Ayyagari, M., A. Demirgüç-Kunt, and V. Maksimovic. 2008. How
Important are Financing Constraints? The Role of Finance in the Business Environment. World Bank Economic Review 22(3).
———. 2011. Firm Innovation in Emerging Markets: Role of Governance and Finance. Journal of Financial and Quantitative Analysis 46.
Bank of England. 2013. A Framework for Stress Testing the UK Banking System. A Discussion Paper.

50 Asian Development Outlook 2015
Barro, R. and J. W. Lee. 2013. A New Data Set of Educational Attainment in the World, 1950–2010. Journal of Development Economics 104.
Bartolini, L. and A. Drazen. 1997. When Liberal Policies Reflect External Shocks, What Do We Learn? Journal of International Economics 42(3–4).
Beck, T., A. Demirgüç-Kunt, L. Laeven, and R. Levine. 2008. Finance, Firm Size, and Growth. Journal of Money Credit and Banking 40 (7).
Beck, T., A. Demirgüç-Kunt, and R. Levine. 2000. A New Database on Financial Development and Structure. World Bank Economic Review 14.
———. 2009. Financial Institutions and Markets Across Countries and over Time: Data and Analysis. World Bank Policy Research Working Paper No. 4943.
Beck, T., A. Demirgüç-Kunt, and V. Maksimovic. 2005. Financial and Legal Constraints to Growth: Does Firm Size Matter? Journal of Finance 60(1).
Beck, T., A. Demirgüç-Kunt, and M. Peria. 2007. Reaching Out: Access to and Use of Banking Services across Countries, Journal of Financial Economics 85.
———. 2008. Banking Services for Everyone? Barriers to Bank Access and Use around the world, World Bank Economic Review 22(3).
Beck, T. and R. Levine. 2004. Stock Markets, Banks and Growth: Panel Evidence. Journal of Banking and Finance 28(3).
Beck, T., R. Levine, and N. Loayza. 2000. Finance and the Sources of Growth. Journal of Financial Economics 58.
Bekaert, G., C. Harvey, and C. Lundblad. 2005. Does Financial Liberalization Spur Growth? Journal of Financial Economies 77(1).
Borio, C., M. Drehmann, and K. Tsatsaronis. 2012. Stress Testing Macro Stress Tests: Does It Live Up to Expectations? BIS Working Paper No. 369. Bank for International Settlements.
Brahmbhatt, M. and C. Otaviano. 2011. Human Rights and Development Practice. Economic Premise No. 50. World Bank.
Brandt, L., T. Tombe, and X. Zhu. 2013. Factor Market Distortions across Time, Space and Sectors in China. Review of Economic Dynamics 16(1).
Brown, M., T. Jappelli, and M. Pagano. 2009. Information Sharing and Credit: Firm-Level Evidence from Transition Countries. Journal of Financial Intermediation 18(2).
Burger, J. D. and F. E. Warnock. 2006. Local Currency Bond Markets. IMF Staff Papers 53 (Special Issue). International Monetary Fund.
Burger, J. D., F. Warnock, and V. Warnock. 2012. Emerging Local Currency Bond Markets, Financial Analysts Journal 68(4).
Caballero, R., E. Farhi, and P. Gourinchas. 2008. An Equilibrium Model of Global Imbalances and Low Interest Rates. American Economic Review 98(1).
Chinn, M. D. and H. Ito. 2008. A New Measure of Financial Openness. Journal of Comparative Policy Analysis 10.
Christensen, L., M. Schindler, and T. Tressel. 2013. Growth and Structural Reforms: A New Assessment. Journal of International Economics 89.
Cihak, M., A. Demirgüç-Kunt, E. Feyen, and R. Levine. 2013. Financial Development in 205 Economies. Journal of Financial Perspectives 1.

Financing Asia’s future growth 51
———. 2012. Benchmarking Financial Systems around the World. World Bank Policy Research Working Paper No. 6175. World Bank.
Claessens, S., D. Klingebiel, and S. L. Schmukler. 2007. Government Bonds in Domestic and Foreign Currency: The Role of Institutional and Macroeconomic Factors. Review of International Economics 15(2).
Claessens, S., A. Kose, and M. Terrones. 2011. Financial Cycles; What? How? When? IMF Working Papers WP/11/76. International Monetary Fund.
Claessens, S. and L. Laeven. 2004. What Drives Bank Competition? Some International Evidence. Journal of Money, Credit and Banking 36(3).
Claessens, S., and N. Van Horen. 2013. Impact of foreign banks, Journal of Financial Perspectives 1(1).
Clarke, G. R. G., R. Cull, and M. S. Martinez-Peria. 2006. Foreign Bank Participation and Access to Credit across Firms in Developing Countries. Journal of Comparative Economics 34(4).
Dabla-Norris, E., G. Ho, K. Kochhar, A. Kyobe, and R. Tchaidze. 2013. Anchoring Growth: The Importance of Productivity-Enhancing Reforms in Emerging Market and Developing Economies. IMF Staff Discussion Note 13/08. International Monetary Fund.
Dabla-Norris, E., G. Ho, and A. Kyobe. 2013. Reforms and Distance to Frontier. International Monetary Fund. http://www.imf.org/external/pubs/ft/sdn/2013/sdn1308tn.pdf
De Haas, R. and I. Naaborg. 2005. Does Foreign Bank Entry Reduce Small Firms’ Access to Credit? Evidence from European Transition Economies. DNB Working Papers 050. Research Department, Netherlands Central Bank.
Demirgüç-Kunt, A. and L. Klapper. 2012. Measuring Financing Inclusion: the Global Findex Database. World Bank Research Working Paper No. 6025. World Bank.
———. 2013. Measuring Financial Inclusion: Explaining Variation in Use of Financial Services across and within Countries. Brookings Papers on Economic Activity. Brookings Institution.
Demirgüç-Kunt, A. and R. Levine. 2009. Finance and Inequality: Theory and Evidence. Annual Review of Financial Economics, Annual Reviews 1(1).
Didier, T. and S. L. Schmukler. 2014. Financial Development in Asia: Beyond Aggregate Indicators. World Bank Policy Research Working Paper No. 6761. World Bank.
Ding, D., W. R. Lam, and S. J. Peiris. 2014. Future of Asia’s Finance: How Can it Meet Challenges of Demographic Change and Infrastructure Needs? IMF Working Paper WP/14/126. International Monetary Fund.
Dollar, D. and S. Wei. 2007. Das (Wasted) Kapital: Firm Ownership and Investment Efficiency in China. NBER Working Paper No. 13103. National Bureau of Economic Research.
Dueker, M. 2005. Dynamic Forecasts of Qualitative Variables: A Qual VAR Model of U.S. Recessions. Journal of Business and Economic Statistics 23.
Edison, J. Hali, M. W. Klein, L. Ricci, and T. Slok. 2004. Capital Account Liberalization and Economic Performance: Survey and Synthesis. IMF Staff Papers 51(2). International Monetary Fund.
52 Asian Development Outlook 2015
Edison, J. Hali, R. Levine, L. Ricci, and T. Slok. 2002. International Financial Integration and Economic Growth. NBER Working Paper No. 9164. National Bureau of Economic Research.
Eichengreen, B. and P. Gupta. 2013. Tapering Talk: The Impact of Expectations of Reduced Federal Reserve Security Purchases on Emerging Markets. World Bank Working Paper No. 6754. World Bank.
Eichengreen, B. and P. Luengnaruemitchai. 2006. Why Doesn’t Asia Have Bigger Bond Markets? Asian Bond Markets: Issues and Prospects 30. Bank for International Settlements.
Eichengreen, B. and K. J. Mitchener. 2003. The Great Depression as a Credit Boom Gone Wrong. BIS Working Paper No. 137. Bank for International Settlements.
European Commission. 2013. Green Paper: Long-Term Financing of the European Economy.
Felman, J., S. Gray, M. Goswami, A. A. Jobst, M. Pradhan, S. Peiris, and D. Seneviratne. 2014. ASEAN-5 Bond Market Development: Where Does it Stand? Where is it Going? Asia-Pacific Economic Literature 28(1).
Goldstein, M. Forthcoming. Bank Stress Tests and Financial Stability: Lessons from the 2009–2014 US- and EU-wide Tests for Asian Emerging Economies. In Park, D. and M. Noland, eds. From Stress to Growth: Strengthening Asia’s Financial Systems in a Post-Crisis World. Peterson Institute for International Economics and Asian Development Bank.
Gormley, T. 2010. The Impact of Foreign Bank Entry in Emerging Markets: Evidence from India. Journal of Financial Intermediation 19(1).
Goyal, R., C. Marsh, N. Raman, S. Wang, and S. Ahmed. 2011. Financial Deepening and International Monetary Stability. IMF Staff Discussion Note 11/16. International Monetary Fund.
Group of Thirty. 2013. Long-term Finance and Economic Growth. Hsieh, C. and P. Klenow. 2009. Misallocation and Manufacturing TFP in
China and India. The Quarterly Journal of Economics 124(4).Ilzetski, E., C. M. Reinhart, and K. S. Rogoff. 2011. The Country
Chronologies and Background Material to Exchange Rate Arrangements into the 21st Century: Will the Anchor Currency Hold? http://personal.lse.ac.uk/ ilzetzki/data/ERA- Country_ Chronologies_ 2011.pdf
Intarakumnerd, P. 2012. How to Effectively Finance Innovations? http://www3.grips.ac.jp/~gist/en/events/document/gistseminar_35.pdf
Intarakumnerd, P. and J. Wonglimpiyart, eds. 2012. Towards Effective Policies for Innovation Financing in Asia. International Development Research Center.
International Monetary Fund. 2013. Key Aspects of Macroprudential Policy–Background Paper. IMF Policy Paper. International Monetary Fund.
Jaumotte, F., S. Lall, and C. Papageorgiou. 2013. Rising Income Inequality: Technology, or Trade and Financial Globalization? IMF Economic Review 61(2). International Monetary Fund.
Financing Asia’s future growth 53
Jeanne, O. and A. Guscina. 2006. Government Debt in Emerging Market Countries: A New Data Set. IMF Working Paper WP/06/98. International Monetary Fund.
Johnston, R. B., and N. T. Tamirisa. 1998. Why Do Countries Use Capital Controls? IMF Working Paper WP/98/181. International Monetary Fund.
Jordà, O., M. Schularick, and A. Taylor. 2011. When Credit Bites Back: Leverage, Business Cycles, and Crises. NBER Working Paper No. 17621. National Bureau of Economic Research.
Ju, J. and S. Wei. 2010. Domestic Institutions and the Bypass Effect of Financial Globalization. American Economic Journal: Economic Policy 2(4).
———. 2011. When is Quality of Financial System a Source of Comparative Advantage? Journal of International Economics 84(2).
Karlan, D., A. Ratan, and J. Zinman. 2014. Savings by and for the Poor: A Research Review and Agenda. Review of Income and Wealth 60(1).
King, R. G. and R. Levine. 1993. Finance, Entrepreneurship, and Growth: Theory and Evidence. Journal of Monetary Economics 32(5).
Knowles, J. C., E. M. Pernia, and M. Racelis. 1999. Social Consequences of the Financial Crisis in Asia. Economic Staff Paper 60. Asian Development Bank.
Lane, P. R. and G. M. Milesi-Ferretti. 2007. The External Wealth of Nations, Mark II: Revised and Extended Estimates of Foreign Assets and Liabilities, 1970–2004. Journal of International Economics 73(2).
La Porta, R., F. Lopez-de-Silanes, A. Shleifer, and R. W. Vishny. 1997. Legal Determinants of External Finance. Journal of Finance 52(3).
Laeven, L., F. Valencia. 2012. Systemic Banking Crises Database: An Update. IMF Working Paper WP/12/163. International Monetary Fund.
Larrain, M. and S. Stumpner. 2013. Financial Reforms and Aggregate Productivity: The Microeconomic Channels. http://papers.ssrn.com/sol3/papers.cfm?abstract_id=2172349
Lee, J.-W. and K. Hong. 2010. Economic Growth in Asia: Determinants and Prospects. ADB Economics Working Paper Series No. 220. Asian Development Bank.
Levine, O. and M. Warusawitharana. 2014. Finance and Productivity Growth: Firm-Level Evidence. Finance and Economics Discussion Series 2014-17. Division of Research & Statistics and Monetary Affairs, Federal Reserve Board.
Levine, R. 2005. Finance and Growth: Theory and Evidence. In Aghion P. and S. H. Durlauf, eds. Handbook of Economic Growth. 1. Elsevier.
Levine, R. 2008. Finance and the Poor. The Manchester School 76(1).Levine, R. and S. Zervos. 1998. Stock Markets, Banks, and Economic
Growth. American Economic Review 88(3).Lim, C., F. Columba, A. Costa, P. Kongsamut, A. Otani, M. Saiyid, T. Wezel,
and X. Wu. 2011. Macroprudential Policy: What Instruments and How to Use them? Lessons from Country Experiences. IMF Working Paper WP/11/238. International Monetary Fund.

54 Asian Development Outlook 2015
McKay, C., and M. Pickens. 2010. Branchless Banking 2010: Who’s Served? At What Price? What’s Next? CGAP Focus Note No. 66. Consultative Group to Assist the Poor.
Mehl, A. and J. Reynaud. 2005. The Determinants of ‘Domestic’ Original Sin in Emerging Market Economies. ECB Working Paper No. 560. European Central Bank.
Meinusch, A. and P. Tillmann. 2014. The Macroeconomic Impact of Unconventional Monetary Policy Shocks. Joint Discussion Paper Series in Economics. The Universities of Aachen, Gießen, Göttingen, Kassel, Marburg, and Siegen. University of Marburg.
Mian, A. 2006. Distance Constraints: The Limits of Foreign Lending in Poor Economies.
Journal of Finance 61(3).Minsky, H. P. 1974. The Modeling of Financial Instability: An Introduction.
In Vogt, W. G. and M. H. Mickle, eds. Proceedings of the Fifth Annual Pittsburgh Conference, Instruments Society of America: Modelling and Simulation 5.
Nair, P. and A. Kaicker. 2009. Secondary Trading Exchange—Feasibility Study for India. http://papers.ssrn.com/sol3/papers.cfm?abstract_id=1448583
Organisation for Economic Co-operation and Development. 2007. Innovation and Growth.
———. 2015. Pension Funds’ Assets (indicator). http://data.oecd.org/pension/pension-funds-assets.htm
Organisation for Economic Co-operation and Development and European Commission. 2013. The Missing Entrepreneurs: Policies for Inclusive Entrepreneurship in Europe.
Park, D. and J. Park. 2010. Drivers of Developing Asia’s Growth: Past and Future. ADB Economics Working Paper Series No. 235. Asian Development Bank.
Park, Y. C. 2011. The Role of Macroprudential Policy for Financial Stability in East Asia’s Emerging Economies. ADBI Working Paper No. 284. Asian Development Bank.
Prasad, E., R. Rajan, and A. Subramanian. 2007. Foreign Capital and Economic Growth, Brookings Papers on Economic Activity 1. Brookings Institution.
Quinn, D., M. Schindler, and A. M. Toyoda. 2011. Assessing Measures of Financial Openness and Integration. IMF Economic Review 59(3). International Monetary Fund.
Quinn, D. P. and A. M. Toyoda. 2008. Does Capital Account Liberalization Lead to Growth? Review of Financial Studies 21.
Rajan, R. G. 2005. Has Financial Development Made the World Riskier? NBER Working Paper No. 11728. National Bureau of Economic Research.
Rajan, R. G., L. Zingales. 1998. Financial Dependence and Growth. American Economic Review 88(3).
Reinhart, C. M. and K. S. Rogoff. 2004. The Modern History of Exchange Rate Arrangements: A Reinterpretation. The Quarterly Journal of Economics 119(1).

Financing Asia’s future growth 55
Rodrik, D. 1998. Who Needs Capital-Account Convertibility? In Fischer, S. et al. eds. Should the IMF Pursue Capital-Account Convertibility? Essays in International Finance No. 207. International Finance Section, Department of Economics, Princeton University.
Schularick, M. and A. M. Taylor. 2009. Credit Booms Gone Bust: Monetary Policy, Leverage Cycles and Financial Crises, 1870–2008. NBER Working Paper No. 15512. National Bureau of Economic Research.
Shim, I., B. Bogdanova, J. Shek, and A. Subelyte. 2013. Database for Policy Actions on Housing Markets. BIS Quarterly Review. September. Bank for International Settlements.
Song, Z., K. Storesletten, and F. Zilibotti. 2011. Growing Like China. American Economic Review 101(1).
Suryahadi, A., S. Sumarto, and L. Pritchett. 2003. The Evolution of Poverty during the Crisis in Indonesia. SMERU Working Paper. SMERU Research Institute.
Tong, H. and S. Wei. 2010. The Composition Matters: Capital Flows and Liquidity Crunch During a Global Economic Crisis. Review of Financial Studies 24(6).
Tillmann, P. 2014. Estimating the Effects of Macroprudential Policy Shocks. Center for Economic Research of Korea, Sungkyunkwan University, and the Korea Economic Research Institute. http://cerk.skku.edu/2014conf/Tillmann_Macroprudential.pdf
Timmer, M. P., G. de Vries. 2007. A Cross-country Database For Sectoral Employment and Productivity in Asia and Latin America, 1950–2005. GGDC Research Memorandum GD-98. Groningen Growth and Development Centre, University of Groningen.
Townsend, R. M. 1995. Consumption Insurance: An Evaluation of Risk-Bearing Systems in Low-Income Economies. Journal of Economic Perspectives 9(3).
Walsh, J. P. 2014. The Future of Asian Finance. Finance and Development 51(2). International Monetary Fund.
Zamorski, M. J. and V. C.-S. Lim. 2013. Financial Stability Insights from Recent IMF/World Bank FSAP Assessments, SEACEN Financial Stability Journal 1 (November). http://www.seacen.org/products/702002-100320-PDF.pdf.
Zhang, L. and E. Zoli. 2014. Leaning against the Wind: Macroprudential Policy in Asia. IMF Working Paper WP/14/22. International Monetary Fund.
Zhu, M. 2014. Asia’s Seismic Shift: How Can the Financial Sector Serve Better? IMFDirect. 21.http://blog-imfdirect.imf.org/2014/07/21/asias-seismic-shift-how-can-the-financial-sector-serve-better/

Subregion/Economy Banking System Stock Market Public Bonds Private BondsDEVELOPING ASIA 60.0 71.0 25.7 20.4
CEN
TRAL
ASI
A
Armenia 18.1 0.3 0.0 0.0Azerbaijan 11.7 ... 0.0 0.0Georgia 21.9 6.8 0.0 0.0Kazakhstan 27.5 28.5 0.0 0.0Kyrgyz Republic ... 2.1 0.0 0.0Tajikistan ... ... 0.0 0.0Turkmenistan ... ... 0.0 0.0Uzbekistan ... ... 0.0 0.0
EAST
ASI
A China, People’s Republic of 49.9 58.8 22.4 23.1Hong Kong, China 301.6 396.8 36.0 15.3Korea, Rep. of 72.1 96.2 44.8 59.3Mongolia 46.5 15.9 0.0 0.0
SOUT
H AS
IA
Afghanistan 15.7 0.0 0.0 0.0Bangladesh 49.5 17.3 0.0 0.0Bhutan 60.1 0.0 0.0 0.0India 62.0 69.7 29.6 4.9Maldives 79.3 0.0 0.0 0.0Nepal 58.7 25.3 0.0 0.0Pakistan 27.5 16.9 30.7 0.0Sri Lanka 31.6 33.8 0.0 0.0
SOUT
HEA
ST A
SIA
Brunei Darussalam 60.4 0.0 0.0 0.0Cambodia 32.0 0.0 0.0 0.0Indonesia 32.0 45.1 10.8 1.4Lao PDR ... 0.0 0.0 0.0Malaysia 120.9 144.1 54.0 58.1Myanmar ... 0.0 0.0 0.0Philippines 51.3 73.9 29.1 1.0Singapore 125.8 148.1 45.4 10.0Thailand 99.7 81.7 49.8 12.7Viet Nam 12.2 15.4 0.0 0.0
THE
PACI
FIC
Fiji 51.8 38.4 0.0 0.0Kiribati ... 0.0 0.0 0.0Marshall Islands ... 0.0 0.0 0.0Micronesia, Fed. States. of ... 0.0 0.0 0.0Palau ... 0.0 0.0 0.0Papua New Guinea 43.1 79.7 0.0 0.0Samoa 44.7 0.0 0.0 0.0Solomon Islands 30.2 0.0 0.0 0.0Timor-Leste 29.1 0.0 0.0 0.0Tonga 38.1 0.0 0.0 0.0Tuvalu ... 0.0 0.0 0.0Vanuatu 73.1 0.0 0.0 0.0
… = data not available.Note: Reported are the size of the banking system (measured as the amount of deposits), stock market capitalization, and public and private bonds outstanding, all expressed as a percentage of GDP. Regional averages are GDP-weighted.Source: ADB estimates based on data from Beck et al. (2000, 2009) and Cihak et al. (2012).
Annex: Financial structure in developing Asia, 2011