asian energy and environmental policy: promoting growth ... · asian energy and environmental...
TRANSCRIPT

Munich Personal RePEc Archive
Asian Energy and Environmental Policy:
Promoting Growth While Preserving the
Environment
Zhang, ZhongXiang
East-West Center
January 2008
Online at https://mpra.ub.uni-muenchen.de/12224/
MPRA Paper No. 12224, posted 19 Dec 2008 00:06 UTC

Asian Energy and Environmental Policy:
Promoting Growth While Preserving the Environment
Dr. ZhongXiang Zhang1 张中祥
美国东西方中心研究部资深研究员、经济学博士 Senior Fellow Research Program East-West Center 1601 East-West Road Honolulu, HI 96848-1601 United States Tel: +1-808-944 7265 Fax: +1-808-944 7298 Email: [email protected]
1 Dr. ZhongXiang Zhang is a senior fellow at the East-West Center, Honolulu, USA. He is also
an affiliate professor of economics at University of Hawaii at Manoa, and an adjunct professor of economics at Chinese Academy of Sciences, Chinese Academy of Social Sciences, and Peking University, Beijing. Currently, he is a co-editor of International Journal of Ecological Economics
& Statistics, and serves on the editorial boards of seven leading international journals (Climate
Policy; Energy Policy; Energy and Environment; Environmental Science and Policy;
International Environmental Agreements; Mitigation and Adaptation Strategies for Global
Change; ScientificWorldJournal). As the author of 160 publications in the fields of energy and environmental economics, trade and the environment, public finance and applied macroeconomic modelling, he authors “The Economics of Energy Policy in China” (New Horizons in Environmental Economics Series, Edward Elgar, 1997), co-authors “International Rules for
Greenhouse Gas Emissions Trading” (United Nations, 1999), and edits “An Economic Analysis of
Climate Policy” (Elsevier, 2004), “Energy Economics and Policy in Mainland China and Taiwan” (China Environmental Science Press, 2006) and “Trade and the Environment in North America” (Springer, 2007). His paper “Estimating the Size of the Potential Market for the Kyoto Flexibility Mechanisms” (Weltwirtschaftliches Archiv, Vol. 136, 2000) is among the three most downloaded (since January 1997) in the areas of international trade, environmental economics, and environmental law and policy at Social Science Research Network. Several his publications are reprinted and are used as teaching materials in several American, Chinese and European universities. Eleven of his publications are cited by IPCC Climate Change 2001: Mitigation and IPCC Climate Change 2007: Mitigation of Climate Change, making him one of the most cited authors in that two extremely comprehensive and authoritative publications on mitigating climate change and the associated costs. His professional services include being requested by Canada’s Minister of the Environment to provide inputs to the 2005 United Nations Climate Change Conference; getting involved in a variety of activities with chief climate negotiators from a dozen key countries; serving as an expert/consultant to many national and international organizations; and being frequently invited to give the keynote address at major international conferences in Asia, Europe and North America.

Abstract
Asia has truly experienced spectacular economic growth over the past 15 years. However, this economic progress has come at a high cost. It has led to unprecedented environmental consequences. The ecological footprint shows that, despite the fact that one-fifth of the population in Asia still lives on less than US$ 1 per day (PPP-adjusted), the region is already living beyond its ecological carrying capacity. The region is facing a dilemma. On the one hand, continued economic growth is needed to alleviate the poverty of the two-thirds of the world’s poor living in this region. On the other hand, that economic growth will further place tremendous strains on the natural environment. In order to extricate itself from this difficult position, the region needs to shift the conventional pattern of “develop first and then treat the pollution” to a different trajectory of sustainable development. To that end, this paper examines a variety of policy responses at national, regional and international levels to deal with growing concerns about the environmental challenges in Asia in order to help to put the region on a more sustainable development path. In the context of national responses, special attention is paid to the following issues: coordination between the central and local governments, market-based environmental instruments and industrial policies, tougher emissions standards for mobile and stationary sources and for fuel quality, policies to promote energy efficiency and the use of clean energy and biofuels, the integration of environmental policies with economic and sectoral policies, and engagement of the private sector through e.g., ecolabelling, green government procurement, corporate ratings and disclosure programs, and drawing the support of financial institutions to promote improved corporate environmental performance. It is concluded that having the right policy mix, coupled with strengthened cooperation at national, local and regional levels, will ensure continuing economic growth in the region without compromising its limited ecological carrying capacity and environmental quality. Keywords: Energy policy; Market-based environmental instruments; Asia 1. Introduction
Asia has truly experienced spectacular economic growth over the past 15 years. Some 270 million people have been raised out of poverty between 1990 and 2004. However, this economic progress has come at a high cost. Asia relies heavily on coal as its main commercial energy. Coal consumption in developing Asian countries accounts for 44% of their total primary energy and 57% of their total commercial energy consumption in 2004, in comparison with the corresponding world average of 25% and 28% (IEA, 2006a). This coal dominance in the energy mix in developing Asia and inefficiencies in production and use of energy and resources, combined with rapid urbanization and motorization, have led to unprecedented environmental consequences. An ongoing study by the Clean Air Initiative for Asian Cities (2006) shows that, despite that the levels of air pollution in Asian cities show downward trends over time, they regularly exceed the World Health Organization (WHO) recommended guidelines as well as national air quality standards (Figure 1). Air pollution levels in the most populated cities in this
2

region are even reported to be among the highest in the world and continue to climb. Developing Asian countries are confronted with indoor air pollution from burning solid fuels as well. The WHO’s first-ever country-by-country analysis shows that indoor air pollution is to blame for a total of about one million deaths in Asia, about 65% of the world’s total (Table 1). Acid rain persists in this region, despite significant efforts towards reducing acidifying gas emissions. Periodic transboundary haze events are also prevalent in Southeast Asia. In this subregion, illegal forest resource exploitation also continues to be a problem. Many Asian countries are experiencing severe and in some cases, accelerating soil erosion, desertification and overgrazing in grasslands. Dust and sandstorms are now occurring more frequently than in the past, and are growing in scope and intensity in Northeast Asia (UNEP, 2004 and 2005). Many developing Asian countries are confronted with water scarcity and water pollution (UNESCAP, 2006). On top of these environmental stresses, projected global climate change is expected to pose the additional threats to Asia (IPCC, 2007). The ecological footprint shows that, despite the fact that one-fifth of the population in Asia still lives on less than US$ 1 per day (PPP-adjusted), this region is already living beyond its ecological carrying capacity. The region is facing a dilemma. On the one hand, continued economic growth is needed to alleviate the poverty of the two-thirds of the world’s poor living in this region. On the other hand, that economic growth will further place tremendous strains on the natural environment. Thus, it is very important for the region to have the right policy mix to ensure continuing economic growth without compromising its environmental quality. Following an introduction, Section 2 discusses major causes for environmental degradation in Asia. Sections 3 and 4 examine responses, both at national and international levels, to deal with growing concerns about the environmental challenges in Asia in order to help to put the region on a more sustainable development path. The final section presents key findings and conclusions. Figure 1 Trends of Major Criteria Air Pollutants (1993-2004)
Source: Clean Air Initiative for Asian Cities (2006).
3

Table 1 Estimated Deaths Caused by Indoor and Outdoor Air Pollution in 2002
Indoor Air Pollution Outdoor Air Pollution
Population using solid fuel (%)
Deaths per year*
Annual PM10 (µg/m3)
Deaths per year
Bangladesh Cambodia China DPR Korea India Indonesia Japan Lao PDR Malaysia Myanmar Nepal Pakistan Philippines Republic of Korea Singapore Sri Lanka Thailand Viet Nam ASIA
89 >95 80
no data 82 72 <5 >95 <5 >95 81 81 45 <5 <5 67 72 70 77
46,000 1,600
380,700 -
407,100 15,300
- 2,400 <100
14,700 7,500 70,700 6,900
- -
3,100 4,600 10,600 971,200
157 51 80 88 84 114 33 25 28 75 161 165 34 43 48 93 77 66
8,200 200
275,600 4,900
120,600 28,800 23,800 <100 500
3,900 700
28,700 3,900 6,800 1,000 1,000 2,800 6,300
517,700
4

WORLD 52 1,497,000 61 865,000
* For a country either with no data on the use of solid fuel or where less than 5% of its population use solid fuels, a national burden of disease assessment from indoor air pollution was not undertaken. In the latter case, that is because the method is not sensitive enough to provide reliable estimates. Sources: WHO (2007a and 2007b). 2. Major Causes of Environmental Degradation in Asia
Much of the environmental degradation in Asia occurs as a result of market failures, inefficiency in production and use of energy and resources, local governments’ inability or non-cooperation, lack of integrated planning, and weak environmental regulatory agencies. The prices of energy resources have been kept low in developing Asian countries, and subsiding fossil fuels is a quite common practice in this region, although the levels of these subsidies have been cut in some countries over the past years. In terms of fuels, the biggest subsidies in absolute (dollar) terms go to oil products in many countries (Figure 2). Iran has the biggest oil subsidies estimated at about US$ 24 billion. This is largely because Iran continues to heavily subsidize transport fuels (i.e. gasoline and diesel), while other countries have significantly cut subsidies to these fuels in percentage terms in recent years (Table 2). This oil subsidy, combined with other energy subsidies, puts the total Iranian subsidies at the estimated US$ 37 billion in 2005, which are equal to about 20% of GDP in 2005 – by far the highest in the world, and are more than all energy subsidies (estimated at US$ 20-30 billion per year) in the OECD countries as a whole (IEA, 2006a and 2006b). Indonesia has the second largest oil subsidies. ADB (2005a) estimates that annual oil subsidies in Indonesia averaged US$ 6 billion between 2000 and 2005. With the increases in world oil prices, oil subsidies in Indonesia were projected to have ballooned to US$ 6.8 billion in 2004 and more than US$ 12 billion in 2005 – equal to 5% of GDP and almost a third of the total government spending (ADB, 2005a; IEA, 2006a and 2006b). In percentage terms, under-pricing is the biggest for natural gas. On average, consumers in the countries listed in Table 2 pay less than half the true economic value of the gas that they use. Electricity subsidies are less prevalent, but are large in some countries (IEA, 2006a). Figure 2 Economic Value of Energy Subsidies in non-OECD Countries in 2005 Source: IEA (2006a).
5

0 5 10 15 20 25 30 35 40 45
CoalElectricityOil products Natural gas
billion dollars
RussiaIran
ChinaSaudi Arabia
IndiaIndonesia
UkraineEgypt
VenezuelaKazakhstan
ArgentinaPakistan
South AfricaMalaysiaThailandNigeriaVietnam
6

Table 2 Consumption Subsidy as Percentage of Reference Energy Price in non-OECD Countries in 2005
Gasoline Diesel Kerosene LPG Light Fuel
Oil
Heavy
Fuel
Oil
Natural
Gas
Coal Electricity
China 5 13 3 18 0 0 45 17 0 Chinese Taipei 0 0 0 9 27 6 0 5 0 India 0 0 47 26 0 0 70 0 5 Indonesia 24 54 58 30 35 n.a. 0 58 13 Malaysia 26 37 0 33 9 0 n.a. n.a. 5 Thailand 0 16 0 35 0 0 65 57 10 Pakistan 0 28 19 n.a. 21 n.a. 59 0 n.a. Philippines 0 0 5 0 34 n.a. n.a. n.a. 0 Vietnam 6 26 5 0 n.a. n.a. n.a. n.a. 14 Iran 82 96 76 67 32 73 66 0 30 Saudi Arabia 51 81 6 n.a. 81 n.a. 89 n.a. 54 Egypt 65 80 88 94 80 71 76 0 4 South Africa 0 0 0 0 0 0 n.a. 0 41 Nigeria 19 17 42 6 n.a. n.a. n.a. n.a. 24 Brazil 0 0 n.a. 0 0 n.a. n.a. n.a. 0 Argentina 20 5 0 0 0 0 58 n.a. 27 Venezuela 90 96 0 82 94 84 n.a. n.a. 25 Russia 0 0 0 0 0 16 57 0 34 Kazakhstan 28 20 n.a. n.a. 49 48 83 86 24 Ukraine 0 23 n.a. n.a. n.a. n.a. 83 36 27
Weighted Average
1
15
27
19
6
10
57
12
8
n.a.: not available. Note: Based on weighted average subsidies and prices across final sectors for each fuel. Cross-subsidies between sectors are, therefore, not included. Source: IEA (2006a).
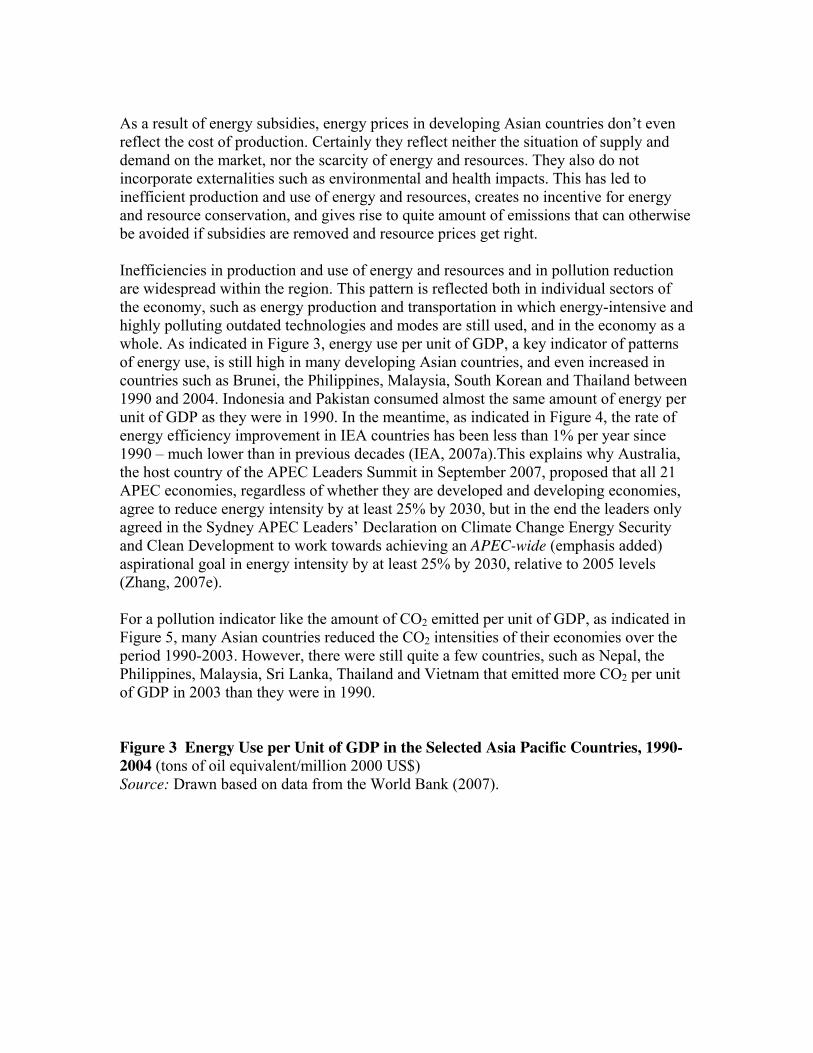
As a result of energy subsidies, energy prices in developing Asian countries don’t even reflect the cost of production. Certainly they reflect neither the situation of supply and demand on the market, nor the scarcity of energy and resources. They also do not incorporate externalities such as environmental and health impacts. This has led to inefficient production and use of energy and resources, creates no incentive for energy and resource conservation, and gives rise to quite amount of emissions that can otherwise be avoided if subsidies are removed and resource prices get right. Inefficiencies in production and use of energy and resources and in pollution reduction are widespread within the region. This pattern is reflected both in individual sectors of the economy, such as energy production and transportation in which energy-intensive and highly polluting outdated technologies and modes are still used, and in the economy as a whole. As indicated in Figure 3, energy use per unit of GDP, a key indicator of patterns of energy use, is still high in many developing Asian countries, and even increased in countries such as Brunei, the Philippines, Malaysia, South Korean and Thailand between 1990 and 2004. Indonesia and Pakistan consumed almost the same amount of energy per unit of GDP as they were in 1990. In the meantime, as indicated in Figure 4, the rate of energy efficiency improvement in IEA countries has been less than 1% per year since 1990 – much lower than in previous decades (IEA, 2007a).This explains why Australia, the host country of the APEC Leaders Summit in September 2007, proposed that all 21 APEC economies, regardless of whether they are developed and developing economies, agree to reduce energy intensity by at least 25% by 2030, but in the end the leaders only agreed in the Sydney APEC Leaders’ Declaration on Climate Change Energy Security and Clean Development to work towards achieving an APEC-wide (emphasis added) aspirational goal in energy intensity by at least 25% by 2030, relative to 2005 levels (Zhang, 2007e). For a pollution indicator like the amount of CO2 emitted per unit of GDP, as indicated in Figure 5, many Asian countries reduced the CO2 intensities of their economies over the period 1990-2003. However, there were still quite a few countries, such as Nepal, the Philippines, Malaysia, Sri Lanka, Thailand and Vietnam that emitted more CO2 per unit of GDP in 2003 than they were in 1990. Figure 3 Energy Use per Unit of GDP in the Selected Asia Pacific Countries, 1990-
2004 (tons of oil equivalent/million 2000 US$) Source: Drawn based on data from the World Bank (2007).

0
250
500
750
1000
1250
1500
1750
2000
1990 1991 1992 1993 1994 1995 1996 1997 1998 1999 2000 2001 2002 2003 2004
Australia
Brunei
China
Hong Kong
India
Indonesia
Japan
Malaysia
Nepal
New Zealand
Pakistan
Philippines
Singapore
South Korea
Sri Lanka
Thailand
Vietnam
Figure 4 The Rates of both Energy Efficiency Improvement and Increase in Energy
Use in IEA Countries, 1973-2004
Source: IEA (2007a).
9

Figure 5 CO2 Emitted per unit of GDP in the Selected Asia Pacific Countries, 1990-
2003
(tons of carbon dioxide per million 2000 US$) Source: Drawn based on data from the World Resources Institute (2007).
0 500 1000 1500 2000 2500 3000 3500
Australia
China
India
Indonesia
Japan
Malaysia
Mongolia
New Zealand
Nepal
Pakistan
Philippines
Singapore
South Korea
Sri Lanka
Thailand
Vietnam
2003
1990
Local governments’ inability, or non-cooperation, has been a major reason for the failure to meet energy efficiency and environmental goals set by the national governments. The national government of China has implemented policies to shut down plants that are inefficient and highly polluting, and to keep the frenzied expansion of offending industries under control. Local officials strongly resist, because these companies provide jobs and create tax revenues as well as personal payoffs. Forcing companies out of business could even trigger local unrest. As an example, September 2006, the National Development and Reform Commission (NDRC), China’s top economic planning agency, ordered provincial governments to raise power tariffs for eight energy-guzzling industries including cement, aluminum, iron and steel, and ferroalloy. However, it is reported that by mid-April 2007, not only had many local governments failed to implement the differentiated tariffs that charge more for companies classified as “eliminated types” or “restrained types” in these industries, but 14 of them even continued to offer preferential power tariffs for such industries (Zhang, 2007a, 2007d and 2007f). Effectively addressing environmental problems not only needs to get local governments involved, but also involves many line ministries and multi-sectors. But the presence of a multitude of institutions with multiple objectives creates coordination problems. As a result of this institutional failure and high transaction costs, environmental goals and
10

performance requirements, even if they were identified, are rarely integrated into the overall economic or sectoral policies, thus undermining their effectiveness during implementation. Weak environmental regulatory agencies also have a large part to play for environmental degradation in this region. On the one hand, environmental protection in the region is regarded as a policy goal to be pursued exclusively within environmental ministries or equivalent agencies. Few countries effectively mobilize other line ministries to this challenging task. On the other hand, although there are so many environmental regulations, they only look good on paper. Environmental ministries or equivalent agencies in the region are often ill-equipped either to enforce existing regulations or to design, implement, monitor, inspect and enforce new effective environmental polices. The State Environmental Protection Agency (SEPA) of China was for years seen as a powerless entity. While China’s environmental regulatory agency was given a new lease on life and was elevated from a lowly vice-ministry rank to full ministerial status, the SEPA still does not have the authority to suspend proposed projects violating environmental laws and regulations or to remove officials who should be held accountable for this non-compliance. It also lacks the authority to manage local environmental bureaus (Zhang, 2007a). In case the SEPA decides to impose a penalty on violators of environmental impact assessment (EIA) laws and regulations, as indicated in Table 3, the maximum fine at its disposal is just 200,000 Yuan (about US$25,000). Even for environmental accidents as serious as the Songhuajing River spill in November 2005 in Northern China, the incident that had unprecedented international implications as well as domestic social, economic and environmental ramifications, the maximum fine by China’s current environmental laws is just one million Yuan, which was actually imposed one year after that incident. Moreover, the fine is only allowed to be imposed once (Zhang, 2007a, 2007d and 2007f). As a result, this low and one-off penalty is hardly a deterrent to environmental offenders. To make things worse, even these weak punishments empowered by current environmental laws are still weakly enforced in China because environmental protection agencies at all levels of the governments are underfunded and inadequately staffed. Table 3 Maximum Fines by Category of Violators of Environmental Laws and
Regulations in China
Applicable Laws Maximum Fines
Allowed (10000 Yuan)
Exceed the pollution limit Air pollution accidents EIA violators, imposed only after the grace period Extraordinarily
Atmosphere Pollution Prevention and Control Act Atmosphere Pollution Prevention and Control Act Environmental Impact Assessment (EIA) Law Water Pollution Prevention and
10
50
20
11

environmental accidents Control Act 100
Sources: Zhang (2007d and 2007f). 3. National Reponses Asia Pacific is less generously endowed with natural resources than other parts of the world. As shown in Table 4, its total biological production capacity per year (termed as biocapacity – nature’s ability of a country to renew depleted resources) on a per capita basis is the lowest of all regions, and is only about 40% of the world’s average. Despite the fact that one-fifth of the population in Asia still lives on less than US$ 1 per day (PPP-adjusted), the ecological footprint, a measure of how much land and water area required to produce all the resources consumed and to absorb all the wastes generated per year under prevailing technology, shows that this region already exceeds its biocapacity. Put another way, the region is already living beyond its ecological carrying capacity. As shown in Figure 6, 13 countries or over 60% of countries in this region already run the ecological deficits (namely, footprint minus biocapacity is negative; if the sign is positive, then country has an ecological reserve). Compared with other regions like North America and European Union which also face ecological deficits but are well developed, Asia has to continue its rapid economic growth in order to alleviate the poverty of the two-thirds of the world’s poor living in this region. This will further place tremendous strains on the natural environment. Thus, it is of paramount importance to the region to cooperate at national, local and regional levels and have the right policy mix to ensure continuing economic growth without compromising its limited ecological carrying capacity and environmental quality. Table 4 Per Capita Ecological Biocapacity, Footprint and Deficits/Reserves by
Region in 2003
Ecological Deficit or Reserve Region Biocapacity
(Hectares) Ecological
Footprint
(Hectares) Value (Hectares) % of
biocapacity
Asia Pacific
Africa Latin America Middle East and Central Asia North America European Union 25 The Rest of Europe
0.7
1.3 5.4
1.0 5.7 2.2 4.6
1.3
1.1 2.0
2.2 9.4 4.8 3.8
-0.6
+0.2 +3.4
-1.2 -3.7 -2.6 +0.8
-86
+15 +62
-120 -65 -118 +17
World 1.8 2.2 -0.5 -28
Notes: + Ecological reserve; - Ecological deficit. Source: Global Footprint Network (2007).
12

Figure 6 Per Capita Ecological Biocapacity, Footprint and Deficits/Reserves in the
Selected Asia Pacific Countries in 2003 (Hectares)
Per capita ecological footprint (2003)
Nepal
New Zealand Pakistan
Papua New Guinea Philippines Sri Lanka Thailand Vietnam
Total
Australia
Bangladesh Cambodia
China
India
Indonesia
Japan
Korea DPR Korea Republic
Laos Malaysia
Mongolia
Myanmar
0 1 2 3 4 5 6 7
Per capita biocapacity (2003)
Nepal
New Zealand Pakistan
Papua New Guinea Philippines Sri Lanka Thailand Vietnam
Total
Australia
Bangladesh Cambodia
China
India
Indonesia
Japan
Korea DPR Korea Republic
Laos Malaysia
Mongolia
Myanmar
0 2 4 6 8
10 12 14 16
13
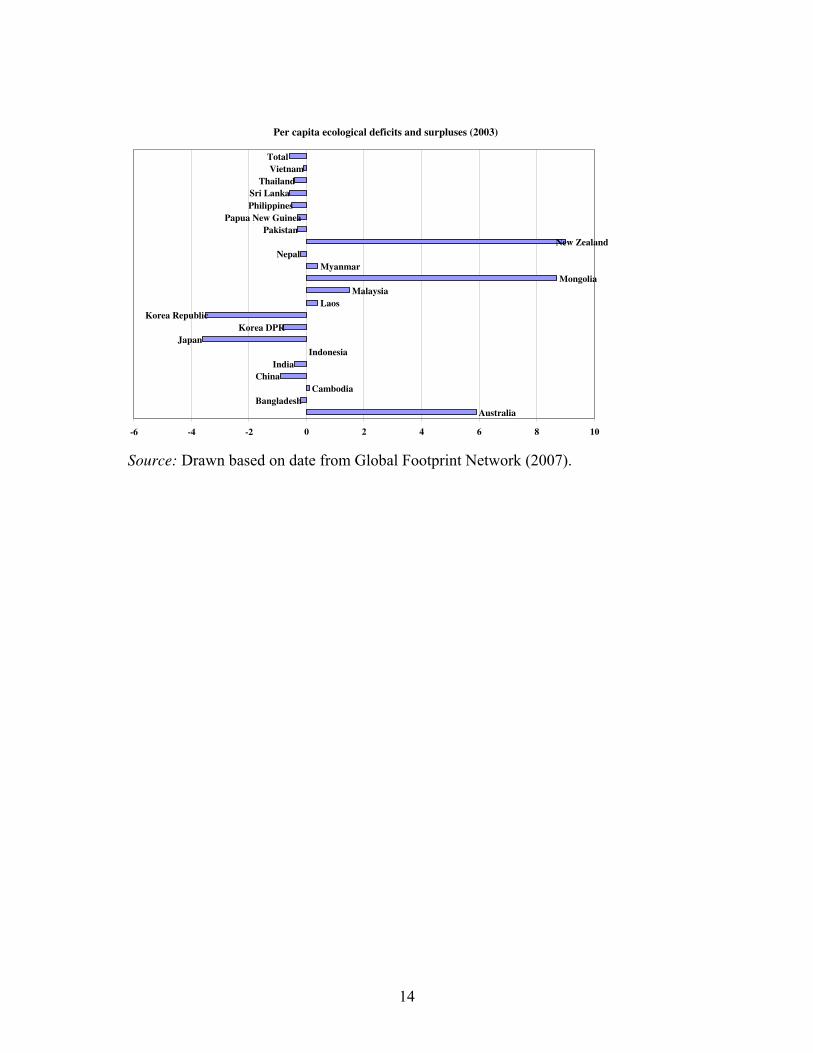
Source: Drawn based on date from Global Footprint Network (2007).
Per capita ecological deficits and surpluses (2003)
Pakistan Papua New Guinea
Philippines
Sri Lanka Thailand
Vietnam Total
New Zealand Nepal
Myanmar
Mongolia Malaysia
Laos
Korea Republic
Korea DPR Japan
Indonesia
China
India
Cambodia
Bangladesh Australia
0 2 4 6 8 10-6 -4 -2
14
3.1 Get Local Governments and Polluting Companies Cooperation Confronted with the rising costs of environmental degradation associated with rapid economic growth, the central governments in Asian countries have gradually recognized that the conventional path of encouraging economic growth at the expense of the environment has to be changed. They are convinced of the need to clean up their countries’ environmental act. Accordingly, they set environmental goals and environmental performance requirements. But they are not adequately equipped with their tasks. As a result, poor compliance and weak enforcement are common in this region. Correcting such a problem requires a major investment in strengthening the institutions of environmental governance to ensure that they have the adequate institutional, financial and technical capabilities to do the job. This is a necessary step, but not enough. We need the full participation of all stakeholders in protecting the environment. In this regard, local government’s cooperation is crucial to the overall outcomes. As often be the case, what the center wants isn’t necessarily what the center gets. An old Chinese saying goes, “The mountains are high, and the emperor is far away”. Central governments need to let go of the notion that they should or even can do it all. Clearly, the central governments need local officials’ cooperation to get these policies implemented. Otherwise, there is no use to set and defend stringent national environmental goals if the central governments are unable to get local governments cooperation. To gain local officials’ cooperation on the environmental issues, incentives need to be provided. Over the past decades, many Asian countries have decentralized in the allocation and responsibility and have shifted control over resources and decision-making to local governments. This devolution of decision-making to local levels has placed environmental stewardship in the hands of local officials who are more concerned with economic growth than the environment. Therefore, effective environmental protection must be placed in this context of government decentralization. Under the current evaluation criterion for officials in China, local officials typically have been promoted based on how fast they expand their local economies. That has created an incentive for officials to tempt to disregard the environmental costs of economic growth. To correct this distorted view of local officials’ accomplishments and to implant environmental consequences in their minds, environmental performance has to be considered as well. If environmental quality does not get improved during the official’s tenure, that official should not be promoted. This will help the local officials realize that they should take their jobs seriously because they have a very real stake in meeting environmental goals. To that end, the central government of China has been using a variety of the tactics to incentivize local governments. Starting in 1997, the SEPA runs a model environmental city program. Any city that meets 32 different SEPA-specified environmental indicators is awarded the title. Out of 661 cities in China, to date, 62 have been placed on the honor roll (Zhang, 2007a, 2007b and 2007f).

To further push local governments on the environmental front, for the first time, on July 13, 2004, the SEPA announced its blacklist of the ten most polluted cities to discourage environmentally irresponsible decisions. That shocked local officials who had always worked on the assumption that “evil deeds” very seldom saw the light of day (Zhang, 2007a and 2007b). This public disclosure works effectively because it puts more pressure on local officials to take responsibility for the health of their people and to take action. Since 2006, the black list is expanded to include cities with air quality below the class III standard designed for industrial areas. According to the latest evaluation on 595 Chinese cities’ environmental quality in 2006, released on June 11, 2007, there were still 39 cities, four less than the number in 2005, on SEPA’s black list, meaning that these cities suffered severe air pollution (SEPA, 2007a). Among the blacklisted cities, seven were in North China’s Shanxi Province, the country’s largest coal supplier, and seven in Northeast China’s Liaoning Province, the base for heavy industries. Aimed to help the general public and officials alike to understand how seriously China confronts the rising costs of environmental degradation associated with its rapid economic growth, in March 2004, the SEPA and the National Bureau of Statistics of China jointly launched the project on the Green GDP Accounting Research, trying to incorporate environmental degradation into the accounting of traditional GDP to give a more realistic picture of the health of the economy. In September 2006, they jointly released the first-ever report on economic costs of pollution. Despite the shortcomings in basic data, methodologies and the coverage of items, this study estimates that the environmental pollution still costs China 511 billion yuan (around US$ 64 billion), or 3.05% of GDP in 2004 (SEPA and NBS, 2006). This sends a warning signal that China’s rampant environmental pollution problem is undermining its long-term economic growth. The SEPA is taking a step further, promoting to use the calculated green GDP instead of traditional GDP as the economic criterion to evaluate the real performance of local officials. The SEPA decided in July 2006 to establish the six regional environmental protection inspection centers. Unlike local environmental protection agencies budgeted by local governments, these regional centers are directly under the leadership of the SEPA, current Ministry of Environmental Protection, and are independent of local governments, both financially and personally. Thus, they can confront local government’s short-term intents to better represent national, long-term and general interests, have the enhanced capability to inspect and coordinate serious environmental disputes cross provincial borders and river basins, correct the distorted information on local environmental quality, and rein in the increasing local protectionists (Sinanet, 2007c). This is another way to coerce cooperation between the central government and local governments as well as cooperation among local governments. To further enhance the environmental awareness of local officials, the SEPA has tightened approval of construction projects by implementing the regional permit restrictions. The so-called regional permit restrictions are based on an ancient Chinese punishment of incriminating relatives and associates related to the main suspect. On January 10, 2007, the SEPA made an unprecedented move, suspending EIA approval of
16

any new construction projects in four cities (Tangshan in Hebei Province, Luliang in Shanxi Province, Liupanshui in Guizhou Province, and Laiwu in Shandong Province) and four major national power-generating groups (Datang International, Huaneng Group, China Huadian Corp, and China Guodian Corp) until they bring their existing facilities into compliance with environmental regulations. Once their EIA approval rights are suspended, no new construction projects are allowed to be built in these cities and by these power-generating groups until all violators are in compliance with environmental regulations. Given that China’s economy is investment-driven, local governments are fully aware of the consequences of the suspension of their right to approve new construction projects. To disregard the environmental problems in their regions now can cost them a lot (Zhang, 2007a). In fact, this is not for the first time for the SEPA to impose administrative measures to punish offenders. Since January 2005, the SEPA has unleashed a series of the so-called environmental protection storms. Its first ever such a storm unleashed on January 18, 2005, blacklisted 30 industrial projects worth 119.7 billion yuan. Many of these projects were considered the so-called “national key projects” approved by the powerful NDRC, China’s top economic planning agency. While these projects themselves were not necessarily highly polluting, the SEPA called for a halt to these industrial projects, on the ground that they had not undergone proper environmental impact assessments. This first environmental protection storm served as a public education campaign, increasing the awareness of the EIA law. In the second environmental storm in 2006, the EIA law is further strengthened, taking it from project level to the deeper level of planning. 163 proposed projects worth 774.6 billion yuan were put on hold on enforcing EIA law alone. But, the restriction of regional permits this time is the strictest administrative measure ever taken by the SEPA in its 30 years of existence (Zhang, 2007a and 2007b). The underlying reason for suspending EIA approval rights is thought to be the desire to promote technology upgrading, industrial restructuring and sustainable development. Whether it becomes an effective means depends on how local governments and companies succeed in changing their attitudes and practices and whether local environmental protection agencies work together with the national agency. Otherwise, suspending the approval rights only has temporary effects, but does not lead to a long-term efficacy (Zhang, 2007a and 2007b). Thus far, the new regional permit restrictions seem to be effective. Only one month after the restrictions suspended approval rights for the four cities, one city, Laiwu, quickly responded to the SEPA warnings and recovered its rights; and only two months after the suspension, Huaneng Group and China Guodian Corp, the two national power-generating groups, came into compliance and recovered their rights (Zhang, 2007a). China launched the bulletin system to release data on energy use per unit of GDP and other indicators by provincial region in 2006 (People’s Daily, 2005). According to the first bulletin on energy use per unit of GDP and other indicators for 2006, which was released in July 2007, among the 31 Chinese provinces or equivalent, only Beijing met that energy-saving goal in 2006, cutting its energy use per unit of GDP by 5.25%,
17

followed by Tianjin, another metropolitan city in China, with the energy intensity reduction of 3.98%, Shanghai by 3.71%, Zhejiang by 3.52% and Jiangsu by 3.50% (NBS et al., 2007).2 In 2007, despite concerted efforts towards energy saving, the country cut its energy intensity by 3.66%. There are still big variations in energy-saving performancamong the 31 Chinese provinces or equivalent. Beijing still took the lead, cutting its energy intensity by 6%, followed by Tianjin by 4.9% and Shanghai by 4.66% (NBS et al., 2008). This clearly indicated the Beijing’s commitments to the 2008 Green Olympic Games. In the meantime, there were 7 provinces whose energy-saving performances were below the national average. The SEPA could use its newly-asserted power to suspend the right to approve new construction projects in those provinces if they continue non-compliance with the energy-saving and environmental goals (Zhang, 2007a).
e
In addition to this distorted evaluation criterion for officials, objectively speaking, the current fiscal system in China plays a part in driving local governments to seek higher GDP growths because that tax-sharing system makes it hard to reconcile the interests of the central and local governments. Since the tax-sharing system was adopted in China in 1994, taxes are grouped into taxes collected by the central government, taxes collected by local governments, and taxes shared between the central and local governments. All those taxes that have steady sources and broad bases and are easily collected, such as consumption tax, tariffs, vehicle purchase tax, are assigned to the central government. VAT and income tax are split between the central and local governments, with 75% of VAT and 60% of income tax going to the central government. As a result, the central government revenue increased by 200% in 1994 relative to its 1993 level. This led the share of the central government in the total government revenue to go up to 55.7% in 1994 from 22.0% in the previous year (see Table 5). In the meantime, the share of the central government in the total government expenditure just rose by 2%. By 2006, local governments only accounted for 47.2% of the total government revenue, but their expenditure accounted for 75.3% of the total government expenditure in China. To enable to pay their expenditure for culture and education, supporting agricultural production, social security subsidiary, etc., local governments have little choice to focus on local development and GDP. That will in turn enable them to enlarge their tax revenue by collecting urban maintenance and development tax, contract tax, arable land occupation tax, urban land use tax, etc. Table 5 Shares of the Central and Local Governments in the Government Revenue
and Expenditure in China
Government Revenue Government Expenditure
Central Government
Local Governments
Central Government
Local Governments
2 Beijing is the first provincial region in China to establish in 2006 the bulletin system to release data on energy use and water use per unit of GDP, quarterly releasing these and other indicators by county. See Zhang (2007a, 2007d and 2007f) for detailed discussion on why Beijing met but the country missed the energy-saving goals.
18

(%) (%) (%) (%)
1993
1994
1995 1996 1997 1998 1999 2000 2001 2002 2003 2004 2005 2006
22.0
55.7
52.2 49.4 48.9 49.5 51.1 52.2 52.4 55.0 54.6 54.9 52.3 52.8
78.0
44.3
47.8 50.6 51.1 50.5 48.9 47.8 47.6 45.0 45.4 45.1 47.7 47.2
28.3
30.3
29.2 27.1 27.4 28.9 31.5 34.7 30.5 30.7 30.1 27.7 25.9 24.7
71.7
69.7 70.8 72.9 72.6 71.1 68.5 65.3 69.5 69.3 69.9 72.3 74.1 75.3
Source: National Bureau of Statistics of China (2007). Another example of the improper tax-sharing scheme in China is related to the aforementioned differentiated tariffs. The NDRC (2006c) ordered provincial governments to raise power tariffs for eight energy-guzzling industries from October 1, 2006 onwards (see Table 6), but many local governments failed to implement the differentiated tariffs that charge more for companies classified as “eliminated types” or “restrained types” in these industries, with 14 of them even continuing to offer preferential power tariffs for such industries (Zhang, 2007a, 2007d and 2007f). The reason for this failure is the lack of incentive for local governments to implement this policy, because all the revenue collected from these additional charges go to the central government (Zhang, 2007f). To provide incentive for local governments, these revenue should be assigned to local governments, but the central government requires local governments to use the revenue specifically for industrial upgrading, energy saving and emissions cutting. Table 6 Differentiated Tariffs for Eight Energy-guzzling Industries in China
Existing Additional Charge (Yuan/kWh)
Additional Charge since October 1, 2006 (Yuan/kWh)
Additional Charge since January 1, 2007 (Yuan/kWh)
Additional Charge since January 1, 2008 (Yuan/kWh)
Eliminated types
0.05 0.10 0.15 0.20 Eight energy-guzzling industries
Restrained types
0.02 0.03 0.04 0.05
19

Source: NDRC (2006c). 3.2 Economic Policies Having the right economic policies is crucial because it sends clear signals to both producers and consumers of energy. Given the widespread use of fossil fuel subsidies in developing Asian region, removing these subsidies is essential to provide incentives for efficient fuel use and adoption of clean technologies that reduce emissions at sources. By definition, a subsidy lowers the cost of production, increases the price received by producers or lowers the price paid by consumers. By lowering the prices of fossil fuels, such fossil fuel subsidies not only are widely considered to distort international trade, but also increase the amount of such fuels consumed and thus the amount of harmful emissions (Zhang and Assunção, 2004). China, Indonesia and Malaysia are among the developing Asian countries that have since 2005 raised domestic energy prices to bring them more into line with international prices. This has led to sharp fall in overall energy subsidies in these countries despite rising international prices. For example, China cut its total energy subsidies to around US$ 11 billion in 2006 (IEA, 2007b). This corresponds to a reduction of 58% compared to its 2005 level of around US$ 26 billion (see Figure 2). Despite this is long-awaited and encouraging, removing such subsidies is but a first step in getting the energy prices right. Further steps include incorporating the costs of resources themselves to reflect their scarcity and internalizing the costs of externalities. For example, current royalties on coal resources in China are based on production. That is, a coal miner pays certain amount of fees for each ton of coal produced. As a result, once a coal miner obtains mining permits, it mines recklessly. This irresponsible mining behavior is very common for small coal mines, and has led to a severe waste of coal resources, even to the destruction of coal resources. As would be expected, the coal recovery rate is reported to be only 10-15% for small coal mines. For the country as a whole, the average recovery rate is about 30%,3 only 60% of the advanced level abroad (He, 2006). To avoid wasteful production of coal, current way in levying royalties on coal resources in China should be changed. The rational royalties on coal resources should be indexed with both the reserves and recovery rate of coal mines. Market-based instruments, such as pollution charges, green taxes, tradeable petmits, and penalties for the infringement of environmental regulations, are common ways to internalize externality costs into the market prices. Many Asian countries have traditionally relied on rigid command-and-control (CAC) approaches. With the poor environmental performance of such approaches and the cost and complexity associated with their implementation, more and more countries in this region are transforming from current reliance on CAC regulations to market-based policy instruments. The added pollution charges will be imposed on polluting companies as a simple cost of doing
3 Coal recovery rates differ with scale of mines, the level of mining technologies, and type of mines. For key state-owned coal mines, the rate is 50%. The corresponding figure for surface mines reaches as high as 95%. But their output only accounts for 4.5% of the national total production (He, 2006).
20

business that can be reduced by cutting pollution. This is seen to increase not only cost-effectiveness but also flexibility in complying with the set environmental regulations. By amending the 1987 Atmospheric Pollution Prevention and Control Act in August 1995, which newly added SO2 emissions from coal combustion as the regulated pollutant, China has since 1996 started levying the charges for SO2 emissions in the so-called Two Control Zones4 based on the total quantity of emissions and at the rate of 0.20 Yuan per kilo of pollution equivalent (Qian and Zhang, 1998; Yu, 2006). As indicated in Table 7, since July 1, 2003, this charge was applied nationwide and the level of this charge was raised step by step. From July 1, 2005 onwards, the charge was applied at the level of 0.60 Yuan per kilo of pollution equivalent. The pollutants that are subject to pollution charges are broadened to include NOx as well, which is charged at the rate of 0.60 Yuan per kilo of pollution equivalent since July 1, 2004 (SDPC et al., 2003). To help to meet the energy-saving and environmental control goals set for the 11th Five-Year Economic Plan, the Chinese government recently plans by three steps to double the charges for SO2 emissions from current level to 1.2 Yuan per kilo of pollutant equivalent within the next three years (The State Council, 2007). Local governments are allowed to raise pollution charges above the national levels. Since 1999, Beijing levied charges 1.2 Yuan per kilo of pollution equivalent for SO2 emissions from coals of high sulfur content (SDPC et al., 2003). Jiangshu Province raised charges for SO2 emissions from current level of 0.6 to 1.2 Yuan per kilo of pollution equivalent from July 1, 2007 onwards, three years ahead of the national schedule (People Net, 2007; Sinanet, 2007a). Table 7 Levels of Charges for Atmospheric Pollutants in China
Pollutants Staring Time Levels of Charge
(Yuan/kilo pollution
equivalent)
SO2 emissions
July 1, 2003 July 1, 2004 July 1, 2005 July 1, 2010
0.2 0.4 0.6 1.2
NOx emissions July 1, 2003 July 1, 2004
0 0.6
Sources: SDPC et al. (2003); The State Council (2007). No doubt, economic instruments such as pollution charges increase the costs of production, and thus provide positive incentives to abate emissions. However, these
4 The so-called Two Control Zones refer to acid rain control zone and SO2 control zone. The former mainly covers the southern and southwestern parts of China where precipitation is acid most of the time, whereas the latter covers the northeastern and eastern parts of the country where SO2 emissions are very intensive but the acid rain is not apparent partly because of the alkaline soils in these areas.
21

economic instruments don’t work to their full potential, although they have a solid economic foundation. In theory, cost-conscious managers will generally tolerate pollution up to the point where the expected penalty for pollution becomes greater than the cost of controlling emissions. However, if the charges and fines are set too low as have been the case in many developing countries,5 many polluting companies see their compliance costs higher than the fines, and accordingly choose to pay the fines rather than to reduce their pollution. As discussed in Section 2, the low penalty is hardly a deterrenenvironmental offenders in China. To change this situation, pollution charges should be raised to reflect the cost of abating pollution, and the fines for offenders should be set higher than the abatement cost.
t to
6 This two together will really create incentive for pollution reduction. In addition to market-based environmental instruments, governments are exploring industrial policies to promote industrial upgrading and energy conservation. With surge in energy use in heavy industry, China’s Ministry of Finance and the State Administration of Taxation started levying export taxes from November 2006 on energy and resource-intensive products to discourage exports that rely heavily on energy and resources and to save scarce energy and resources. This includes a 5% export tax on oil, coal and coke, a 10% tax on to non-ferrous metals, some minerals and 27 other iron and steel products, and a 15% tax charged on copper, nickel, aluminum and other metallurgical products. Simultaneously, imports tariffs on a range of items, including 26 energy and resource products such as oil, coal and aluminum were cut from their current levels of 3-6% to 0-3% (Agence France-Presse, 2006). From July 1, 2007, China’s Ministry of Finance and the State Administration of Taxation (2007) eliminated or cut export tax rebates for 2831 exported items. This is considered as the boldest move to rein in exports since China joined the World Trade Organization in December 2001. Among the affected items, which account for 37% of all traded products, are 553 “highly energy-consuming, highly-polluting and resource-intensive products”, such as cement, fertilizer and non-ferrous metals, whose export tax rebates were completely eliminated. This policy will help to enhance energy efficiency and rationalize energy and resource-intensive sectors as well as to control soaring exports and deflate the ballooning trade surplus. In October 2007, China’s Ministry of Commerce and the SEPA (2007) were in an unusual collaboration to jointly issue the antipollution circular. Targeted at its booming export industry, this new regulation would suspend the rights of those enterprises that don’t meet their environmental obligations to engage foreign trade in the period of more than one year and less than three years. A significant portion of China’s air pollution can be traced directly to the production of goods that are exported. In the Pearl River Delta, a major manufacturing region in Southern China, as indicated in
5 Even for the aforementioned case of Jiangshu Province, where the charges for SO2 emissions at 1.2 Yuan per kilo of pollution equivalent were levied from July 1, 2007 onwards, three years ahead of China’s national schedule, this charge is still less than half of the real abatement cost, which is reported to be 3 Yuan per kilo of pollution equivalent for abating SO2 emissions from coal-fired power plants (Sinanet, 2007a). 6 The NDRC, the top planning agency in China, plans to raise pollution charges equivalent to the cost of pollution treatment in three years (China News Net, 2007).
22
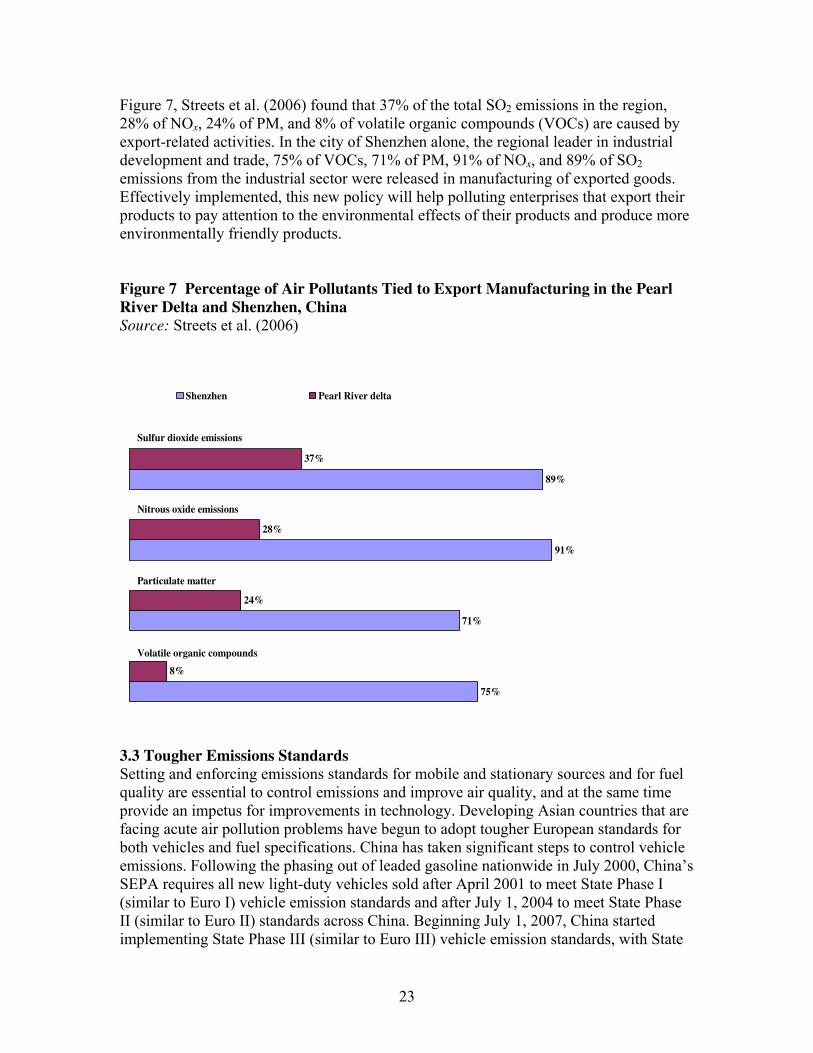
Figure 7, Streets et al. (2006) found that 37% of the total SO2 emissions in the region, 28% of NOx, 24% of PM, and 8% of volatile organic compounds (VOCs) are caused by export-related activities. In the city of Shenzhen alone, the regional leader in industrial development and trade, 75% of VOCs, 71% of PM, 91% of NOx, and 89% of SO2 emissions from the industrial sector were released in manufacturing of exported goods. Effectively implemented, this new policy will help polluting enterprises that export their products to pay attention to the environmental effects of their products and produce more environmentally friendly products. Figure 7 Percentage of Air Pollutants Tied to Export Manufacturing in the Pearl
River Delta and Shenzhen, China
Source: Streets et al. (2006)
75%
71%
91%
89%
8%
24%
28%
37%
Shenzhen Pearl River delta
Sulfur dioxide emissions
Nitrous oxide emissions
Particulate matter
Volatile organic compounds
3.3 Tougher Emissions Standards Setting and enforcing emissions standards for mobile and stationary sources and for fuel quality are essential to control emissions and improve air quality, and at the same time provide an impetus for improvements in technology. Developing Asian countries that are facing acute air pollution problems have begun to adopt tougher European standards for both vehicles and fuel specifications. China has taken significant steps to control vehicle emissions. Following the phasing out of leaded gasoline nationwide in July 2000, China’s SEPA requires all new light-duty vehicles sold after April 2001 to meet State Phase I (similar to Euro I) vehicle emission standards and after July 1, 2004 to meet State Phase II (similar to Euro II) standards across China. Beginning July 1, 2007, China started implementing State Phase III (similar to Euro III) vehicle emission standards, with State
23
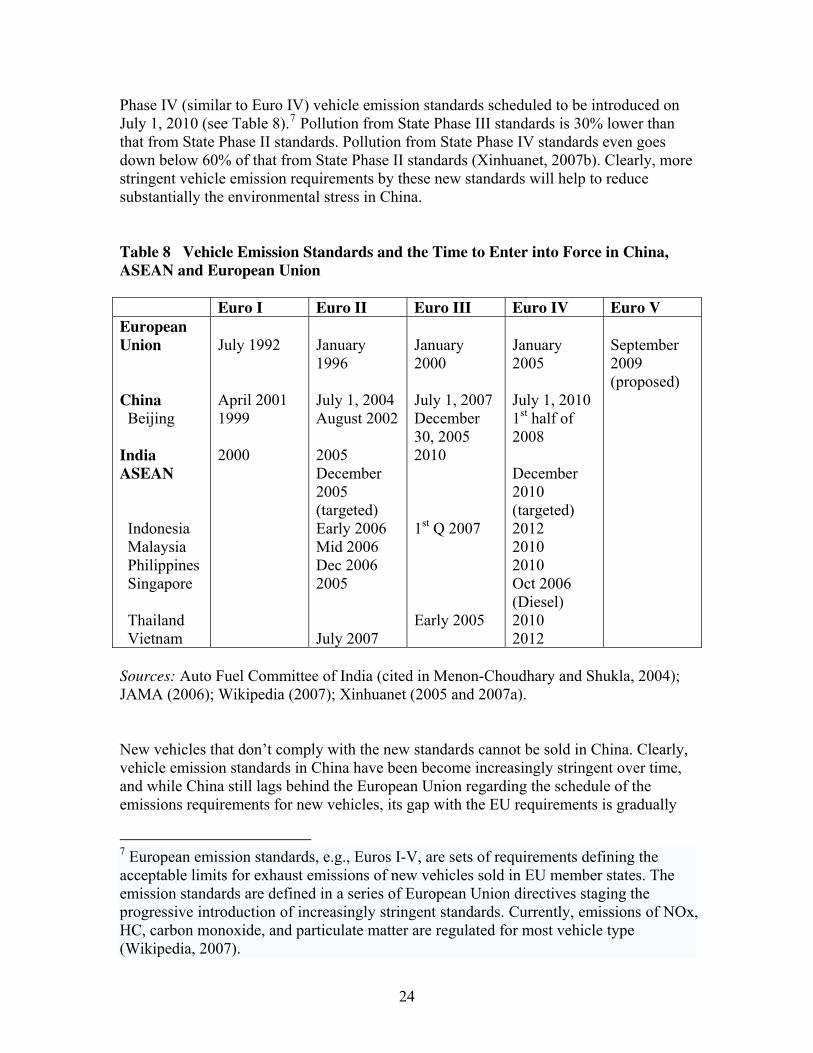
Phase IV (similar to Euro IV) vehicle emission standards scheduled to be introduced on July 1, 2010 (see Table 8).7 Pollution from State Phase III standards is 30% lower than that from State Phase II standards. Pollution from State Phase IV standards even goes down below 60% of that from State Phase II standards (Xinhuanet, 2007b). Clearly, more stringent vehicle emission requirements by these new standards will help to reduce substantially the environmental stress in China. Table 8 Vehicle Emission Standards and the Time to Enter into Force in China,
ASEAN and European Union
Euro I Euro II Euro III Euro IV Euro V
European
Union
China
Beijing India
ASEAN
Indonesia Malaysia
Philippines Singapore Thailand Vietnam
July 1992 April 2001 1999 2000
January 1996 July 1, 2004 August 2002 2005 December 2005 (targeted) Early 2006 Mid 2006 Dec 2006 2005 July 2007
January 2000 July 1, 2007 December 30, 2005 2010 1st Q 2007 Early 2005
January 2005 July 1, 2010 1st half of 2008 December 2010 (targeted) 2012 2010 2010 Oct 2006 (Diesel) 2010 2012
September 2009 (proposed)
Sources: Auto Fuel Committee of India (cited in Menon-Choudhary and Shukla, 2004); JAMA (2006); Wikipedia (2007); Xinhuanet (2005 and 2007a). New vehicles that don’t comply with the new standards cannot be sold in China. Clearly, vehicle emission standards in China have been become increasingly stringent over time, and while China still lags behind the European Union regarding the schedule of the emissions requirements for new vehicles, its gap with the EU requirements is gradually
7 European emission standards, e.g., Euros I-V, are sets of requirements defining the acceptable limits for exhaust emissions of new vehicles sold in EU member states. The emission standards are defined in a series of European Union directives staging the progressive introduction of increasingly stringent standards. Currently, emissions of NOx, HC, carbon monoxide, and particulate matter are regulated for most vehicle type (Wikipedia, 2007).
24

reduced from about nine yeas in 2001 to five and a half years in 2010. With the population of registered vehicles reaching to 148 million by the end of March 2007 in China (Xinhuanet, 2007b) and continuing its explosive growth, and the emissions from vehicles as the main source of air pollution in many Chinese cities, these cities have been proactive in controlling vehicle emissions. With the largest population of registered vehicles in China (Xinhuanet, 2005),8 Beijing took the lead. China’s capital started a pilot program to stop sales of leaded gasoline by July 1997, three years ahead ofnationwide ban, and enforces State Phase II standards two years ahead of the national schedule and State Phase III standards one and a half years ahead of the national schedule. By enforcing State Phase III standards ahead of the national schedule and speeding up the eliminating of existing vehicles with lower standards, total pollution from vehicles in Beijing is estimated to be cut by 20% by 2008, compared with the existing level of pollution (Xinhuanet, 2005). As commitments to the Green Olympic Games, Beijing introduced State Phase IV fuel standards on January 1, 2008, and required all pump stations to supply State Phase IV fuel by March 1, 2008. Cars with State Phase IV vehicle emission standards and powered by State Phase IV fuel can cut pollution in half, relative to cars with State Phase III vehicle emission standards and powered by State Phase III fuel (People Net, 2008b). China’s capital also introduced State Phase IV vehicle emission standards in the first half of 2008, prior to the Beijing Olympic Games on August 8, 2008 (Xinhuanet, 2007a).
the
In terms of vehicle emission regulations, India and most ASEAN (Association of Southeast Asian Nations) countries are at about the same levels as China, but, as indicated in Table 8, their time schedules to implement these regulations somewhat lag behind China. Based on the Auto Fuel Committee appointed by the Government of India in 2000 (cited in Menon-Choudhary and Shukla, 2004), India implemented Euro I and Euro II vehicle emission standards for the entire country in 2000 and 2005, respectively. Euro III standards are set to be implemented nationwide in 2010. Most ASEAN countries are examining the harmonization of fuel quality and vehicle emissions standards. The time schedule to ban leaded gasoline and introduce Euro II emission standards with the corresponding fuel properties was targeted at the end of 2005, while Euro IV standards are currently envisioned to be implemented by all ASEAN countries by 2010 except for Indonesia and Vietnam that set 2012 as their implementation date (JAMA, 2006). As indicated in Table 8, except for Singapore and Thailand, all other ASEAN countries didn’t meet their 2005 target set for the introduction of Euro II vehicle emission standards. This delay raises the question of whether the ASEAN will be able to introduce Euro IV standards under the timeframe as specified above. The introduction of stringent vehicle emission standards has led to significant benefits. The Auto Fuel Committee of India estimates significant reductions in annual health costs with the implementation of Euro II in 2001, Euro III in 2005 and Euro IV vehicle
8 It took 48 years for the population of registered vehicles in Beijing reached to one million in February 1997 from 2300 in the early 1950s. It took six and a half years to reach two millions in August 2003. But it took only 3 years and 9 months to reach three millions on May 27, 2007, much quicker than what experts expected (Xinhuanet, 2007c).
25

emission standards targeted in 2010 in Delhi. As shown in Table 9, annual health costs reduce as emission norms become more stringent. The costs can be reduced further if all vehicles meet the new standards, which are applicable only for new vehicles and do not apply to vehicles already on the roads. To motivate auto manufacturers to produce more environmentally friendly vehicles, the State Administration of Taxation and the Ministry of Finance in China have cut consumption tax bill by 30% for those manufacturers whose products have met State Phases II, III and IV emission standards ahead of the national schedules. Table 9 Annual Health Costs with Pre Euro and Euro Vehicle Emission Standards
in Delhi (in Crores at 2000-01 Prices)
Pre Euro Euro II Euro III Euro IV
Annual health costs 228 30 22 15
Source: Auto Fuel Committee of India (cited in Menon-Choudhary and Shukla, 2004). Tightening of vehicle emission standards has led to improvements in vehicle technologies and exhaust systems. This is helpful, but not enough to ensure that the new vehicles actually comply with emission standards as the quality of fuels is inextricably linked to the vehicle emissions. This at least requires a parallel improvement in fuel quality. In fact, most countries would ensure the availability of fuel prior to the introduction of its corresponding emission regulation. It is reported that the national schedule of implementing State Phase III vehicle emission standards in China will be delayed to December 30, 2009, mainly because the Chinese big oil corporations are only able to provide nationwide fuel whose quality is line with State Phase III emission standards by then (Xinhuanet, 2007b). With about 24000 vehicles every day added to already congested roads in China, delaying in the implementation of State Phase III standards will further place the environmental stress on air quality. Clearly, there is increasing emergency to bring fuel quality standards into line with vehicle emission standards. Along with setting and enforcing progressively stringent emissions standards for vehicles, many cities in Asian countries have shifted vehicle fleets to cleaner fuels to significantly reduce pollution from vehicles. In 1999, China introduced the National Clean Vehicle Action Plan to promote the use of alternative fuels, in particular CNG (compressed natural gas) and LPG (liquefied petroleum gas), for urban bus and taxi industries firstly. This Plan was piloted in the 12 Chinese demonstration cities. Now, CNG and LPG vehicles account for a large portion of urban buses and taxis in China. For example, by the end of 2006, 27 gas stations to fill LPG had been established in Guangzhou, and 6,400 buses and 16,000 taxis had made use of LPG, accounting for 80% and 100% of their corresponding total numbers in this Chinese mega-city (Wang, 2007). Prior to the 2008 Olympic Games, Beijing plans that 90% of public transport has use of CNG as a fuel (Sinanet, 2007b). Delhi faced severe air pollution, about 70% from vehicle emissions. To control vehicle emissions, the Supreme Court directive in 1998 called for the introduction of CNG as a fuel for all public transport in Delhi. This led to the
26

implementation of CNG program. Now Delhi boasts of the world’s largest fleet of over 15,000 CNG buses, with substantial benefits for air quality (Hatwal, 2004). Growing Asian cities are implementing demand-side traffic management measures to reduce congestion and urban air pollution. These cities are prioritizing public transport and are promoting efficient public transport systems, such as dedicated-lane bus rapid transit (BRT) systems. BRT systems have been highly successful in such cities as Curitiba, Brazil and Bogota, Colombia, and are able to move people with subway-like efficiency at only about 5% of the cost of subway systems (He, 2003). Bangkok and Jakarta have a BRT network to complement their existing public transport systems and reduce traffic congestion (Schwela et al., 2006). Since 1989, Taipei has been operating a BRT system that has been expanded to have dedicated bus lanes on 10 streets connecting 4 MRT lanes and having total length of 57 km (Chang, 2003). The first BRT in China were put into full operation in Beijing on December 30, 2005. It has total length of 16 km with 17 bus stops (BRT China, 2006). The second BRT in China were put into operation in Hangzhou, Zhejiang Province on April 26, 2006. It has total length of 28 km with 33 bus stops, and has a daily ridership of 45300. During the first year of operation, its total ridership amounts to 16.06 million passengers (Hangzhou Public Transport Daily, 2007). Clearly, these constructed BRT systems are beginning to make a useful contribution to improving public transportation and urban air quality in the cities of their operation. But to make dramatic improvements, much more BRT systems need to be constructed in Asian cities. While such prospect of dramatic increases remains to be seen, there are encouraging signs that other Asian cities have begun very seriously to examine the potential of BRT systems in improving public transportation and urban air quality. 3.4 Increasing Energy Efficiency and the Use of Clean Energy As the standards of living improve, just like other parts of the world, there is increasing demand for electronic appliances, comfortable living space and the associated heating and cooling services, and vehicles in Asia as well. This will put great pressure on energy demand and at the same time, provides an opportunity to increase energy efficiency through improved demand-side management. To encourage investments in energy efficiency improvements and accelerate energy efficiency gains on the demand side, many Asian countries have designed and promulgated efficiency standards for appliances and industrial equipments, building codes and new vehicle fuel economy standards, coupled with appropriate energy-pricing policies (World Bank, 2006; IEA, 2006a). This way of improving energy efficiency is the cheapest, fastest and most effective way to address environmental concerns in the short term. In the meantime, improved energy efficiency increases overall air quality, reduces greenhouse gas emissions and improves energy security. Given that many developing Asian countries suffer frequently from energy shortages, increasing energy efficiency reduces the need to invest in energy-supply infrastructures but brings energy needs and supplies into balance. Moreover, because many Asian economies are exports-oriented, reducing energy use through greater efficiency will reduce energy costs and thus enhance their international competitiveness. There are encouraging signs that Asian countries are taking unprecedented efforts to improve energy efficiency.
27

While China has been calling for energy saving since the early 1980s, this country has set for the first time the goal of cutting energy use per unit of GDP by 20% in its current five-year economic plan. While China achieved a quadrupling of its GDP with only a doubling of energy consumption between 1980 and 2000, as indicated in Figure 3, China has experienced since 2001 faster energy consumption than economic growth (Zhang, 2005). Clearly, this is very challenging goal in light of the recent increase in energy intensity in China. Meeting this goal could cut China’s energy use in 2010 by 10% below the baseline policy scenario (Lin et al., 2006). Because more low or zero-carbon energy is used by then, CO2 emissions in China will be cut by at least 10% relative to its baseline policy scenario.9 Given that industry consumes about 70% of the country’s total energy consumption (Zhang, 2003), this sector is crucial for China to meet its own set goal. This has led China to establish the “Top 1000 Enterprises Energy Conservation Action Program”. This program covers 1008 enterprises in nine key energy-supply and consuming industrial subsectors. Each of them on the list consumed at least 0.18 million tons of coal equivalent (tce) in 2004, and all together consumed 33% of the national total and 47% of industrial energy consumption in 2004. The program aims to save 100 million tce cumulatively during the period 2006-10, thus making a significant contribution to China’s overall goal of 20% energy-intensity improvement (NDRC, 2006a). Empowered by the State Council, the powerful NDRC signed energy-saving responsibility agreements with these enterprises. To ensure the goal to be met, making energy efficiency improvements has been considered a criteria for job performance evaluations of heads of these enterprises. This will help them realize that they should take their jobs seriously because they have a very real stake in meeting energy-saving goals. The first-year’s results of the program’s implementation are encouraging. More than 95% of these enterprises appointed energy mangers, and with the energy saving of 20 million tce in 2006, the top-1000 program is right on track to meet its 2010 target (NDRC and NBS, 2007). For residential buildings, China has taken the three steps to improve energy efficiency. The first step requires a 30% cut in energy use relative to typical Chinese residential buildings designed in 1980-1981. Next, China requires that new buildings have to be 50% more efficient by 2010. Then, the third step is to increase the energy-saving goal to 65% for new buildings by 2020 (Lang, 2004; Zhang, 2005). Tianjin is the first metropolitan city in China to embark on reform for heat supply and charge. As indicated in Table 10, by the end of 2006, 73.49 million m2 energy-efficient residential buildings were built in this city, accounting for 47.8% of the total residential buildings (Zheng and You, 2007). In Beijing, the building sector consumed 28% of its total energy use in 2004. By the end of 2004, 175.2 million m2 energy-efficient residential buildings were built in China’s capital, 37.1% of which met with the 30% more energy-efficient standards and the remaining 62.9% met with the 50% more energy-efficient standards (see Table 10). All these energy-efficient buildings in Beijing accounted for 65.1% of its total residential buildings. Beijing plans that all new residential buildings have to meet with the 65% more energy-efficient standards by 2010, one decade ahead of the national schedule (BMCDR, 2006).
9 The Chinese government projects that meeting this energy intensity goal will cut China’s CO2 emissions by 10% below its baseline level in 2010 (Brahic, 2007).
28

Table 10 Residential Buildings by Energy Efficient Standards in Beijing and
Tianjin, China
Region Non-Energy-Efficient Buildings
Energy-Efficient Buildings in the First Step
Energy-Efficient Buildings in the Second Step
Energy-Efficient Buildings in the Third Step
Beijing by 2004
Tianjin by 2006
35%
52%
24%
23%
41%
15%
0%
10%
Sources: BMCDR (2006); Zheng and You (2007). In the transport sector, on March 21, 2006, the China’s Ministry of Finance and the State Administration of Taxation issued the joint circular enacting to adjust the existing levels of consumption taxes levied on a variety of products. The big adjustment has been for the excise tax for vehicles. The existing excise tax levied at the time of purchase was introduced in 1994 when China reformed its taxing system, and the rate increases with the size of engines, setting at 3% for cars with engines of 1.0 liter or less, 8% for cars with engines of more than 4 liters, and 5% for cars with engines in between. This tax rates for cars had since remained unchanged. The new vehicle excise tax has broadened the tax base from the existing range of 3-8% to 3-20%, and has broken down the size of engines into the six categories instead of the existing three ones. Since April 1, 2006, the rate for small cars with engines of 1.0 to 1.5 liters decreases to 3%, two percentage points lower than before. Cars with engines of 1.5 to 2.0 liters continue to enjoy a tax rate of 5%, and consumers who buy cars with engines of no less than 2 liters but no larger than 4 liters are required to pay a consumption tax of 9–15%. In the meantime, the tax on cars with engines of larger than 4 liters more than doubles from 8% to 20% (see Table 11). To further rein in the production and use of gas-guzzler cars and promote the production and use of energy-efficient small cars, China announced on August 13, 2008 that since September 1, 2008, the rate for small cars with engine of 1.0 liter or less further decreases to 1%, whereas the rate for cars with engines of no less than 3 liters but no larger than 4 liters goes up to 25%, 10% higher than the existing rate. Cars with engines of larger than 4 liters are now taxed at the highest rate of 40%, 20% higher than the existing level.10
10 China lost its first-ever dispute with WTO on July 18, 2008, when a panel on the WTO compliance of its auto part tariffs found in favor of the complainants - Canada, the EU and the U.S.. China imposed in 2005 a 25% tariff on imported auto parts, if the parts made up 60% or more of the value of a whole vehicle (Sinanet, 2008). This tariff rate equals the duty that China applies on imported automobiles but exceeds its 10% tariff ceiling on imported auto parts. China had contended that the higher tariff was necessary to prevent tax evasion by companies that import whole cars as spare parts and then assemble them together inside China to avoid the higher tariffs applicable to entire
29

This big upward adjustment in consumption tax for gas-guzzler cars clearly reflects that the Chinese government’s determination to use consumption taxation as an important economic instrument to promote the production and use of energy-efficient small cars and enhance its policy guidance on energy conservation and environmental protection. and enhance its policy guidance on energy conservation and environmental protection. Table 11 Consumption Tax Rates for Cars in China
Engine (liters) Excise Tax Since 1 January 1994 (%)
Excise Tax Since 1 April 2006 (%)
Excise Tax Since 1 September 2008 (%)
1.0 or less 1.0 < engine ≤ 1.5 1.5 < engine ≤ 2.0 2.0 < engine ≤ 2.5 2.5 < engine ≤ 3.0 3.0 < engine ≤ 4.0 Greater than 4
3 5 5 5 5 5 8
3 3 5 9 12 15 20
1 3 5 9 12 25 40
Sources: Sinanet (2006); People Net (2008a). China has set even more stringent fuel economy standards for its rapidly growing passenger vehicle fleet than those in Australia, Canada, California and the United States, although they are less stringent than those in Japan and the European Union (see Figure 8). Implemented in the two phases, the standards classify vehicles into 16 weight classes, covering passenger cars, SUVs and multi-purpose vans. Converted to the U.S. CAFF (Corporate Average Fuel Economy) test cycle, the average fuel economy standards of new vehicles in China are projected to reach 36.7 miles per gallon in 2008 (An and Sauer, 2004). Even Japan, one of the world’s most efficient energy-consuming countries, which improved its overall energy efficiency by 37% over the period 1973-2003, sets the goal of further improving its energy efficiency by at least 30% by 2030, relative to its 2003 level (METI, 2006). As a policy measure, the country will speed up the introduction of
automobiles. However, the three complainants in the case maintained that these higher charges unfairly discriminate against the use of foreign auto parts and effectively subsidize domestic production. The complainants argued that the tariff not only discouraged auto manufactures in China from using the imported parts, but also that the higher tariff put pressure on foreign producers of auto parts to relocate manufacturing facilities to China. Given the fact that Chinese auto manufactures tend to produce cars with engines smaller than 2.5 liters and an amazing coincidence of timing (Time to decide to introduce this green tax is less than a month after China lost its WTO dispute), this big upward adjustment in consumption tax for gas-guzzler cars may be seen as a way for China to cut car imports without offending the WTO.
30

the Top Runner Program, which was introduced in 1998. Such a Program identifies the most energy-efficient residential/office appliances and light-duty vehicles in each category and requires future models to meet a level of energy consumption close to the current (or expected future) best. This Program improves average energy efficiency by encouraging both improvements in the worst appliances/vehicles in terms of energy efficiency and continuous improvements in the best (The Government of Japan, 2002; IEA, 2006a). Figure 8 Comparison of Fuel Economy Standards for Vehicles Notes: Dotted lines denote proposed standards; MPG – Miles per gallon. Source: An and Sauer (2004).
EU
Canada
US
Japan
Australia
China California
20
25
30
35
40
45
50
55
2002 2004 2006 2008 2010 2012 2014 2016
MPG:
converted to
CAFE test cycle
However, from a long-term perspective, widespread use of clean energy is a real solution. As indicated in Figure 9, the share of renewable energies (including traditional biomass) in the total primary energy supply in developing Asian countries in 2004 was very high (24%), compared with the OECD (6%) and the world average (14%). However, as indicated in Table 12, the share of hydropower and modern (or new) renewable energies (namely, solar, wind, geothermal, wave and tidal energy) in total renewables is very low in developing Asian countries (9.4% in 2004), in comparison with the OECD (43.8%), although this share of modern renewable energies in the energy mix is growing. Over the past two decades, there have been clear downward trends of renewable energy costs, and these energy sources are becoming less and less costly (UNDP, 2004). However, they are still more costly than conventional sources, in some cases, even several times more costly than that from conventional sources. This limits the penetration of modern renewable energies.
31

Figure 9 Share of Renewables in Total Primary Energy Supply in 2004 (%) Source: Drawn based on date from IEA (2006a).
0
5
10
15
20
25
30
35
40
OECD US EU25 Japan Developing
Asia
China India World
Table 12 Shares of Hydropower and Modern Renewables in Total Renewables in
2004 (%)
Country/Region Hydropower Modern Renewables
OECD US European Union 25 Japan Developing Asia China India World
32.7 21.9 22.8 44.4 7.1 12.0 3.2 16.4
11.1 10.5 9.6 22.2 2.3 0 0
3.9
Source: IEA (2006a). Increasing this share not only enhances energy security, but also is environmentally friendly and conducive to good health. This has created a new impetus for encouraging the use of renewables. As indicated in Table 13, at least 47 economies including all 25 European Union countries have established some kind of policy targets for renewables. These targets are revised and strengthened over time. Developing Asian countries, such
32
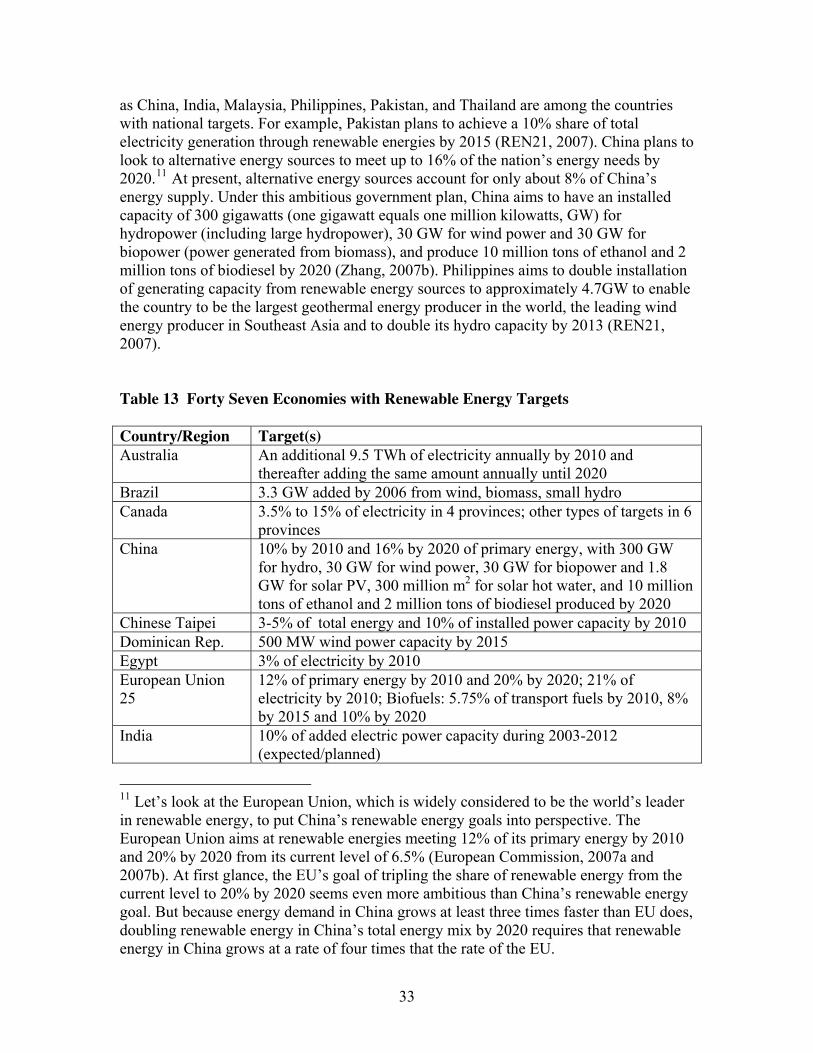
as China, India, Malaysia, Philippines, Pakistan, and Thailand are among the countries with national targets. For example, Pakistan plans to achieve a 10% share of total electricity generation through renewable energies by 2015 (REN21, 2007). China plans to look to alternative energy sources to meet up to 16% of the nation’s energy needs by 2020.11 At present, alternative energy sources account for only about 8% of China’s energy supply. Under this ambitious government plan, China aims to have an installed capacity of 300 gigawatts (one gigawatt equals one million kilowatts, GW) for hydropower (including large hydropower), 30 GW for wind power and 30 GW for biopower (power generated from biomass), and produce 10 million tons of ethanol and 2 million tons of biodiesel by 2020 (Zhang, 2007b). Philippines aims to double installation of generating capacity from renewable energy sources to approximately 4.7GW to enable the country to be the largest geothermal energy producer in the world, the leading wind energy producer in Southeast Asia and to double its hydro capacity by 2013 (REN21, 2007). Table 13 Forty Seven Economies with Renewable Energy Targets
Country/Region Target(s)
Australia An additional 9.5 TWh of electricity annually by 2010 and thereafter adding the same amount annually until 2020
Brazil 3.3 GW added by 2006 from wind, biomass, small hydro
Canada 3.5% to 15% of electricity in 4 provinces; other types of targets in 6 provinces
China 10% by 2010 and 16% by 2020 of primary energy, with 300 GW for hydro, 30 GW for wind power, 30 GW for biopower and 1.8 GW for solar PV, 300 million m2 for solar hot water, and 10 million tons of ethanol and 2 million tons of biodiesel produced by 2020
Chinese Taipei 3-5% of total energy and 10% of installed power capacity by 2010
Dominican Rep. 500 MW wind power capacity by 2015
Egypt 3% of electricity by 2010
European Union 25
12% of primary energy by 2010 and 20% by 2020; 21% of electricity by 2010; Biofuels: 5.75% of transport fuels by 2010, 8% by 2015 and 10% by 2020
India 10% of added electric power capacity during 2003-2012 (expected/planned)
11 Let’s look at the European Union, which is widely considered to be the world’s leader in renewable energy, to put China’s renewable energy goals into perspective. The European Union aims at renewable energies meeting 12% of its primary energy by 2010 and 20% by 2020 from its current level of 6.5% (European Commission, 2007a and 2007b). At first glance, the EU’s goal of tripling the share of renewable energy from the current level to 20% by 2020 seems even more ambitious than China’s renewable energy goal. But because energy demand in China grows at least three times faster than EU does, doubling renewable energy in China’s total energy mix by 2020 requires that renewable energy in China grows at a rate of four times that the rate of the EU.
33

Israel 2% of electricity by 2007; 5% of electricity by 2016
Japan 12.2 TWh, or 1.35% of electricity by 2010, excluding geothermal and large hydro (RPS)
Korea 7% of electricity by 2010, including large hydro, and 1.3 GW of grid-connected solar PV by 2011, including 100,000 homes (0.3 GW)
Malaysia 5% of electricity by 2005; 5% blending for biodiesel by 2008
Mali 15% of energy by 2020
New Zealand 30 PJ of added capacity (including heat and transport fuels) by 2012
Norway 7 TWh from heat and wind by 2010
Philippines Double total renewable energy generating capacity to 4.7 GW and its hydro power capacity by 2013; 25% E10 blending fuel by 2010
Pakistan 10% of power generation by 2015
Singapore 50,000 m2 (~35 MWth) of solar thermal systems by 2012
South Africa 10 TWh added final energy by 2013
Switzerland 3.5 TWh from electricity and heat by 2010
Thailand 8% of total primary energy by 2011 (excluding traditional rural biomass); 3% biodiesel target by 2011
United States 5% to 30% of electricity in 18 states (including DC) by 2010-12
Sources: REN21 (2005, 2006 and 2007); Zhang (2007b); European Commission (2007a and 2007b); Council of the European Union (2007); MOEA Taiwan (2005). For concerns about soaring energy demand and the corresponding pollution, there has been growing interest in biofuels, such as ethanol and biodiesel, as alternative fuels for transport. As indicated in Table 14, China and India are the world’s third and fourth largest producers of ethanol, but their production were fairly stable over the past three years and are far behind the two dominant producers - Brazil and the US. The former had long been the world’s leading ethanol producer until the latter caught up to the former for the first time in 2005 (Renewable Fuels Association, 2007), and its ethanol provided 41% of all non-diesel motor vehicle fuel consumed in Brazil in 2005 (REN21, 2006). They together produce about 70% of the world’s total. China is embarking on a push into biofuels. As indicated in Table 15, ethanol production is currently about 3% of China’s transport fuel use. This share of ethanol is the highest among the 21 APEC economies. China plans to increase its ethanol production to 5% of the country’s transport fuel use by 2010 (Rank, 2006) and further to 10 million tons a year by 2020 (Zhang, 2007b). Other biofuels goals set in developing Asian countries include the Philippines’ proposed 25% E10 blending fuel by 2010 and Thailand’s 3% biodiesel target (REN21, 2007). Table 14 Annual World Ethanol Production by Country (million gallons, all ethanol grades)
Country 2004 2005 2006
Brazil 3,989 4,227 4,491
34
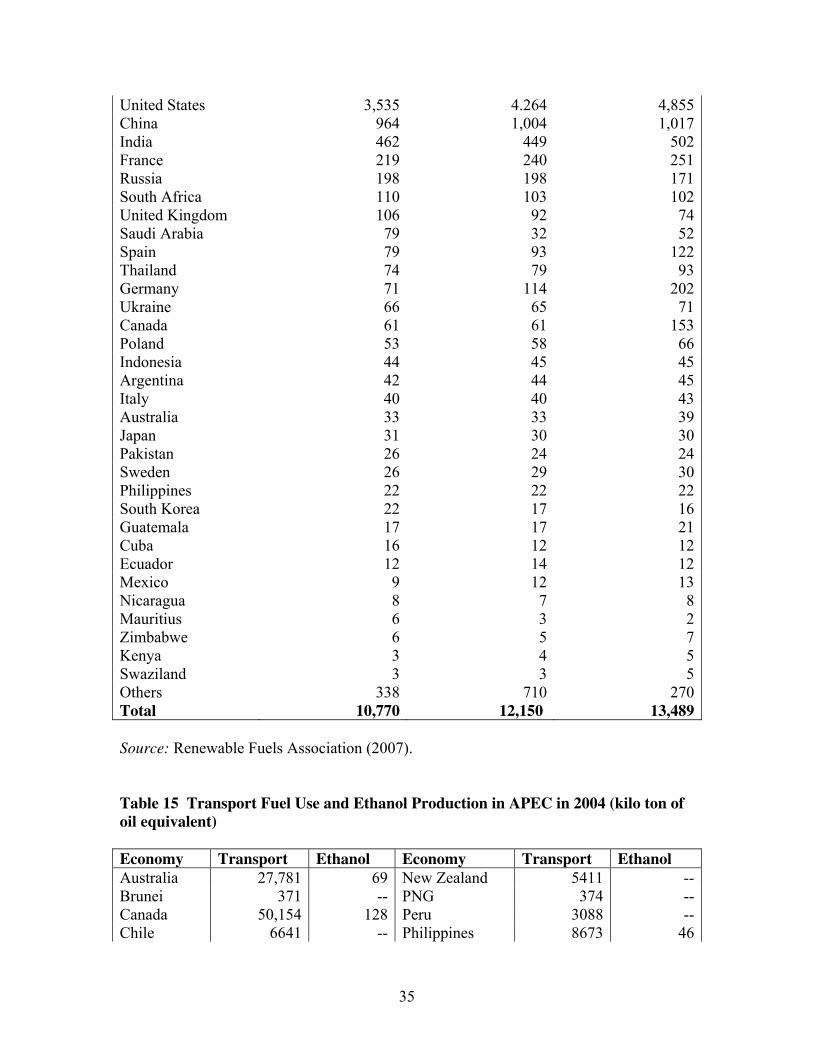
United States 3,535 4.264 4,855China 964 1,004 1,017India 462 449 502France 219 240 251Russia 198 198 171South Africa 110 103 102United Kingdom 106 92 74Saudi Arabia 79 32 52Spain 79 93 122Thailand 74 79 93Germany 71 114 202Ukraine 66 65 71Canada 61 61 153Poland 53 58 66Indonesia 44 45 45Argentina 42 44 45Italy 40 40 43Australia 33 33 39Japan 31 30 30Pakistan 26 24 24Sweden 26 29 30Philippines 22 22 22South Korea 22 17 16Guatemala 17 17 21Cuba 16 12 12Ecuador 12 14 12Mexico 9 12 13Nicaragua 8 7 8Mauritius 6 3 2Zimbabwe 6 5 7Kenya 3 4 5Swaziland 3 3 5Others 338 710 270Total 10,770 12,150 13,489
Source: Renewable Fuels Association (2007). Table 15 Transport Fuel Use and Ethanol Production in APEC in 2004 (kilo ton of
oil equivalent)
Economy Transport Ethanol Economy Transport Ethanol
Australia 27,781 69 New Zealand 5411 --Brunei 371 -- PNG 374 --Canada 50,154 128 Peru 3088 --Chile 6641 -- Philippines 8673 46
35

China 67,531 2,022 Russia 41,063 --Hong Kong 5626 -- Singapore 4224 --Indonesia 20,952 92 Chinese Taipei 12,808 --Japan 84,488 65 Thailand 21,107 155Korea 32,572 46 United States 616,908 7,413Malaysia 14,226 -- Vietnam 5561 --Mexico 61,867 19 TOTAL 1,091,426 10,055
Note: Ethanol in million gallons in Table 14 converted from million gallon into kilo ton of oil equivalent (ktoe) using the conversion factor of 2.097 ktoe/million gallon (= 10**6 gallon * 84000 Btu/gallon *1 ktoe/40.097*10**9 Btu). Sources: Renewable Fuels Association (2007) for ethanol production and Bloyd (2007) for transport fuels. To meet the renewable energy targets, Asian governments need to put in place policies and incentives favorable to the development of renewables. Currently, subsidies for fossil fuels are quite common in developing Asian countries, and the prices of fossil fuels seldom account for the full environmental and social costs of their production, distribution and use. These factors have been significant barriers to the penetration and commercialization of all renewable energies except large hydropower. Thus, governments need to abolish those subsidies and to internalize external costs to level the playing field. This is a helpful step in increasing the cost competitiveness of renewables, but not enough. Governments still need to provide additional support policies to promote widespread use of renewable energies. As indicated in Table 16, at least 48 economies including 14 developing countries have some types of renewable energy promotion policies. Such policies include public research, development and demonstration (RD&D) programs, feed-in tariffs, renewable energy mandates, tax credits for investment/production, preferential loans, accelerated depreciation rates, technology-forcing regulations, reduction on import duty and export facilitation, consumer purchasing incentives and government green purchasing preferences, green certificate trading, and competitive bidding. As indicated in Figure 10, feed-in tariff, which obliges the utilities to purchase electricity from renewable energy sources at a fixed rate, is the most common promotion policy. Since the US enacted a national feed-in law in 1978, at least 32 countries and 9 states/provinces had adopted such policies by early 2006, more than half of which have been enacted since 2002 (REN21, 2005 and 2006). Feed-in tariffs, enacted in 1990, amended in 1998 and replaced with a new law in 2000, have been instrumental in making Germany the world leader. Staring from virtually no renewable energy industry in 1990, installed capacity of wind power in Germany increased more than 200-fold between 1991 and 2002, and PV capacity increased over 60-fold in a similar time frame (UNDP, 2004). India is the first developing country that established feed-in tariffs in 1993, followed by Sri Lanka, Thailand (for small power producers only), Brazil, Indonesia, Nicaragua, and China. Driven by a 2003 national law requiring new state-level polices, the six Indian states have adopted new feed-in tariffs. The state of Maharashtra also updated its 2003 wind power feed-in tariffs to apply to biomass, biogass and small power generation (REN21, 2005 and 2006). Feed-in tariffs enacted in 2005
36

took effect on January 1, 2006 in China. Contrary to the wide expectations, the standard feed-in tariff model did not apply to wind power, only to biomass power.12 Biopower tariffs are set at province-specific average desulfurized coal power tariff plus a subsidy of RMB 0.25 per kWh. From 2010 onwards, the subsidy will decrease by 2% each year and will be cancelled completely after 15 years (NDRC, 2006b). Figure 10 Cumulative Number of Countries/States/Provinces Enacting Feed-in
Tariffs Source: Drawn based on information from REN21 (2007).
12 Wind power industry and policy analysts in China recommended the Chinese government to adopt a feed-in tariff. That will oblige the utilities to purchase electricity from renewable energy sources at a fixed rate. But to the surprise of many who expected a “coal-fired power indexed tariff plus subsidy” as the tariff model for wind power, the Chinese government decided on a competitive bidding mechanism to determine the proposed wind power grid tariff. Simply put, bidding to determine the price at which a unit of electricity will be provided to the grid. The reason for not choosing the expected model is the Chinese government’s belief that under the feed-in tariff model, the wind power tariff in the southeast coastal areas would be almost double those in the western regions of the country because of the higher coal prices in the former, despite the fact that much of the wind resources are located in the western provinces. That would make it unlikely that investors would be interested in the western regions where their return would be much smaller, an outcome that is not beneficial to the country’s overall sustainable development objectives.
37

0 5 10 15 20 25 30 35 40 45
2006
2005
2004
2003
2002
2001
2000
1999
1998
1997
1994
1993
1992
1991
1990
..
1978 United States
Germany
Switzerland
Italy
Denmark, India
Spain, Greece
Sri Lanka
Sweden
Portugal, Norway, Slovenia
Thailand
France, Latvia
Austria, Brazil, Czech Republic, Indonesia, Lithuania
Cyprus, Estonia, Hungary, Korea, Slovak Republic,
India (Maharastra)
Canada (Prince Edward Is.), India (Andra P. and Mahdya P.),
Italy, Israel, Nicaragua
China, Ireland, Turkey, United States (Washington State), India (Karnataka, Uttaranchal,
Uttar Pradesh)Canada (Ontario)
38

Table 16 Renewable Energy Promotion Policies
Country Feed- in tariff
Renewable portfolio standard
Capital subsidies,grants, orRebates
Investmentexcise, or other tax credits
Sales tax, energy tax, VATreduction
Tradable renewable energy certificates
Energy productionpayments/tax credits
Net Metering
Public investment,loans, or financing
Public competitivebidding
Developed and transition countries (34)
Australia X X X X
Canada (*) (*) X X X (*) X (*)
Czech Republic
X X X X X X
Denmark X X X X
France X X X X X X X
Germany X X X X X
Japan (*) X X X X X
Netherlands X X X X X
New Zealand
X X
South Korea
X X X
Spain X X X X
United Kingdom
X X X X
United States
(*) (*) X X (*) (*) X (*) (*) (*)
………….and 21 other developed and transition countries
Developing countries (14)
Argentina X X
Brazil X X
Cambodia X
39
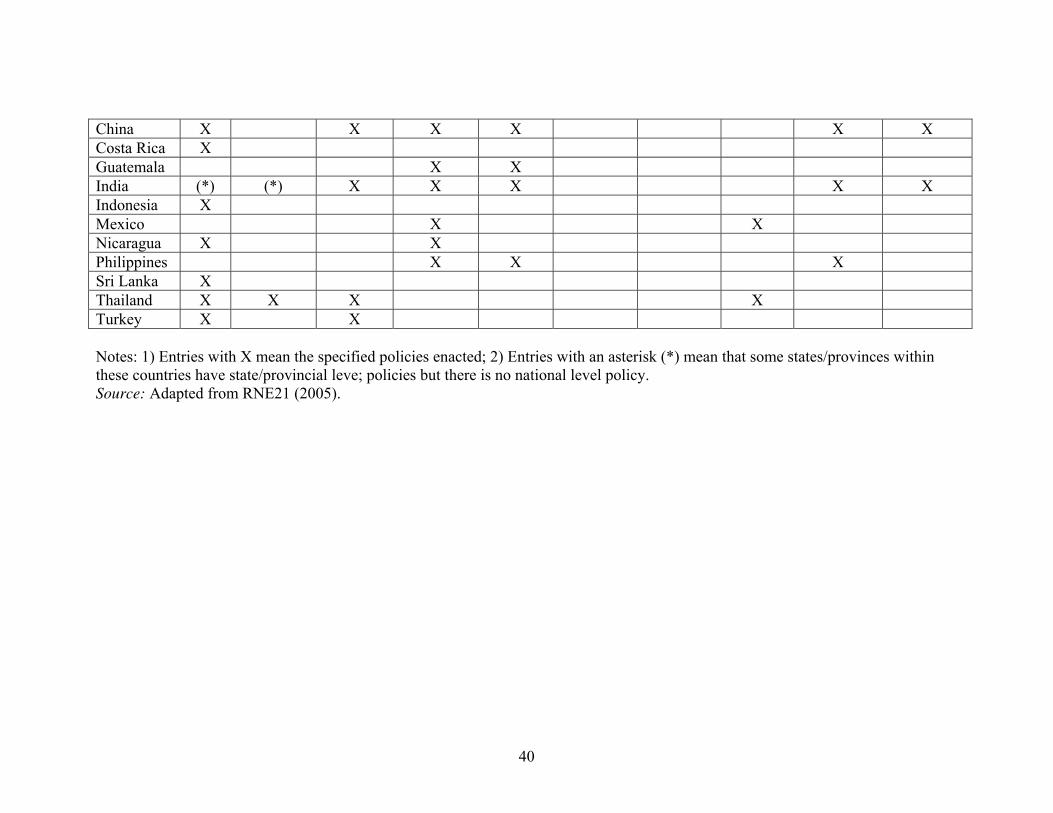
40
China X X X X X X
Costa Rica X
Guatemala X X
India (*) (*) X X X X X
Indonesia X
Mexico X X
Nicaragua X X
Philippines X X X
Sri Lanka X
Thailand X X X X
Turkey X X
Notes: 1) Entries with X mean the specified policies enacted; 2) Entries with an asterisk (*) mean that some states/provinces within these countries have state/provincial leve; policies but there is no national level policy. Source: Adapted from RNE21 (2005).

Renewable energy promotion policy is an essential ingredient in promoting the widespread use of renewable energies. But, the specific form and level of this support will clearly differ in design from technology to technology and from country to country, depending on the overall policy framework in place and the maturity and cost of each technology in each country. For example, Japan enacted renewable portfolio standard (RPS) law in 2003 to aim to the electricity generation of 12.2 TWh from renewable energy sources, or 1.35% of the national electricity supply by 2010. The Japanese government will follow up implementation of RPS for a period of three years after its introduction and, if necessary, will review the scheme for RPS. Every four years, the government will set annual indicators for the generation of electricity from new energy resources by electric retailers based on an eight-year time frame (REN21, 2007). For biomass energy, the Chinese government is deliberating a risk-sharing mechanism to encourage its development. Such a mechanism allows biomass energy companies to reserve risk funds before paying taxes during the period of oil price hikes. Those funds will be used to compensate losses and sustain their operations when oil prices plummet (Zhang, 2007b). For wind power, feed-in tariffs are only applied to small power producers in Thailand. Pakistan initiates limited feed-in tariffs and waives import duties for wind turbines to boost wind power development. In China, the central government has cut by half the value-added tax on wind power from the normal rate of 17% to 8.5%, has lowered the rate of duty on domestic investment in wind power to 6% in comparison with the normal rate of 23%, and has exempted duty on equipments imported for renewable energy technologies in joint venture. Some local governments provide even more favorable policies. For example, Inner Mongolia has levied the value-added tax of 6% on wind power (Zhang, 2007b). These wind power policies are helpful, but not enough to ensure that China will meet its ambitious target, which requires adding almost 2 GW per year from the current level of 1.2 GW. To meet the goal of wind power, China is taking a different policy approach and is implementing it aggressively. Since 2003, China has adopted the so-called Wind Power Concession Program as its primary strategy to further promote wind power development. This government-run program auctions off development rights for wind power projects of 100 MW or above for 25 years, which include a guaranteed tariff for the first 30,000 hours, as well as concession operation agreements. Such on-grid tariff of wind power is decided through a competitive bidding process. If such a tariff is higher than the reference on-grid tariff of desulfurized coal-fired power, then the difference will be shared in the selling price at the provincial and national grid levels. For the remainder of the period (namely, after the first 30,000 hours until the ending of the total concession period of 25 years), the tariff of wind power is set to be equal to the average local on-grid tariff. China completed in 2006 the fourth round of bidding for three wind power concessions projects of total capacity of 700 MW. The Chinese government takes the lessons learned in the bidding processes and is making efforts to ensure that this program works effectively to promote a robust and sizeable wind power industry in China. No doubt, the bidding-based program has introduced competition to both the construction and management of wind farms. However, it is not without its own problems. One is that investors underbid to win a project. For example, the winner in the first round of bidding offered the unprecedented grid tariff of 390 Yuan per 1,000 KWh, whereas the other
41

offers were in the range of 600 to 700 Yuan. Another problem is that the grid tariff is not known until after the bidding, which makes it difficult for firms to secure bank loans as the banks cannot assess the rate of return on the project without knowing the tariff (Zhang, 2005). The Chinese government takes the lessons learned in the bidding processes and is making efforts to ensure that this program works effectively to promote a robust and sizeable wind power industry. To prevent irrational bidding that could endanger overall project quality and investor return, the Chinese government has lowered the weight of the grid tariff in the bidding assessment process and assigned more weight to other factors, such as local content, investment and financial ability, financial plan and technical plan. In the first round of bidding in 2003, the tariff was the only criteria determining the winner. Those who offered the lowest grid tariff won. But, the weight of grid tariff in the overall bidding decision has been declining. It accounted for only 40% by the third round in 2005, and only 25% in the current fifth round of bidding. With these modifications, the bidding tariff is now ranked as the second key criteria under a 100-point bidding evaluation system, after the 70% local content requirement that accounts for 35% in the current round of bidding.13 However, simply lowering the weight of the grid tariff in the bidding process is not the answer because that will simply increase the transaction costs (Zhang, 2005). To lower transaction costs and at the same time ensure project quality, competitive bidding needs to be coupled with a mechanism that would hold bidders accountable for the implementation of project, robust technical standards for design and construction to avoid downward pricing pressure leading to substandard technology and implementation,14 and/or a floor price to prevent unrealistic low bids from jeopardizing the bidding process (Zhang, 2005; Baker & McKenzie et al., 2007). 3.5 The Integration of Environmental Policies with Economic and Sectoral Policies Developing Asian countries are confronted with many other pressing social concerns, such as providing water and sanitation services to the urban poor, improving public transportation and other basic infrastructures, and reducing poverty as well as improving the environment. In this context, in order to address environmental issues effectively and achieve the maximal gains, environmental policies need to be integrated with economic policies, investment policies, energy policies, transportation policies, land-use policies and other urban development policies. This will help countries view environmental policies as not just for tackling potential environmental threats per se, but as an integrated
13 This 70% local content requirement means that wind power projects must have over 70% of their turbine components locally made, and that the wind turbine generator must be assembled in China. The aim is to encourage technology and manufacturing industry for wind turbines in China. This requirement was originally proposed in relation to wind concession farms in China, but was extended to include ordinary wind farm projects as well in 2005. 14 This is the lesson learned in India’s competitive bidding regime. It was a lack of turbine standards or production requirements that led several early projects to poorly perform, despite significant technology advances. As a response, in 2003, certification of design and performance became mandatory in its bidding regime (Baker & McKenzie et al., 2007).
42

framework to tackle these aforementioned concerns, as well as a means of improving energy efficiency, reducing congestions, saving money, and setting pro-active policies to ensure sustainable development. As far as minimizing environmental effect is concerned, it is even better to integrate environmental issues with economic and sectoral policies at the planning stage, rather than at the implementation stage. Strategic environmental assessment (SEA) is a useful tool to bridge the policy divide that separates those government institutions responsible for economic planning from those line industries in charge for environmental protection at the planning stage of any development activity (UNESCAP, 2006). SEA integrates environmental issues into the formulation of plans and programs, thus reducing their overall environmental impacts to a minimum. China and Korea have shown great interest in applying the SEA. Indeed, several provinces in China, including Inner Mongolia, have used the SEA in mapping out their 11th five-year plan running from 2006 to 2010. 3.6 Active Engagement of the Private Sector While governments determine the rules under which businesses act, set environmental goals and commit to international environmental agreements, they count on firms’ full cooperation. After all, the firms themselves are entities that use natural resources, make products and emit pollution. Globally, corporations are responsible for about 60% of the total investment, with developing Asia at the high end of 73% (UNFCCC, 2007). Thus, a sustainable future for Asia is not possible without the active engagement of the private sector (ADB, 2005b). In the mean time, the private sector is facing growing market and public pressures for better environmental performance. As many Asian countries are based on export-oriented economies, globalization and the elimination of trade barriers between and inside countries are placing unprecedented pressures on even their domestic industries to maintain, if not lose, their competitive position through greater efficiency and responsible environmental management. As trade liberalization progresses, companies are facing ever-increasing pressures to be held accountable for their environmental behavior. Along with this market pressure, companies are facing growing public pressures, fueled by increasing environmental awareness, in particular from expanding middle class, and stronger civil societies. All this provides unprecedented opportunity for environmental institutions in developing Asian countries to take advantage of the positive influences of globalization and public pressure to engage the private sector to improve its environmental performance. Ecolabelling is one that creatively harnesses the power of environmentally conscious consumers to promote higher levels of corporate environmental responsibility. By giving the consumer the choice of whether to buy a product contributing to environmental degradation or to buy more environmentally friendly alternative, this scheme aims to promote the production, consumption and disposal of more environmentally friendly products. Its voluntary nature makes ecolabelling an attractive alternative to costly regulatory measures. China, Indonesia, Japan, South Korea and Thailand are among the
43

Asian countries that have established the ecolabelling regimes.15 By supporting innovation in and purchasing environmentally preferable products and services, green government procurement is another way to change environmental behavior of producers. Among the OECD member countries, government procurement expenditures involve extremely diverse products and services and account for 8 to 25% of GDP (OECD, 2000). The potential for public purchasing decisions to affect the environment is therefore considerable.16 Corporate ratings and disclosure programs, a relatively new type of instrument, rely on non-regulatory forces to create incentives for (mainly industrial) facilities to improve environmental performance. Some environmental economists call disclosure programs the third wave in pollution control policy after the first two waves that are legal regulations and market-based instruments, respectively (Tietenberg, 1998). Such programs will motivate polluters to reduce emissions, even in developing countries where regulatory infrastructures are insufficiently developed or are subjected to corruption. Indonesia’s National Pollution Control Agency (BAPEDAL) conceived and launched a program in June 1995, called PROPER – Program for Pollution Control, Evaluation and Rating, for rating and publicly disclosing the environmental performance of Indonesian factories. The PROPER develops color-coded systems to rate corporate environmental performance. The results of the initial ratings are shared with the companies rated, with those of highly environmental performance publicly congratulated. By contrast, those companies that are rated below the average category are privately notified and then given time to improve their ratings. After the grace period is over, the second rating takes place. This time, their ratings are revealed to the public in the presence of the media, officials and stakeholders. In the pilot phase of the PROPER, 187 large water polluters were rated in June 1995. 5 plants rated as GREEN (that is, very good) were publicly congratulated. The 121 firms rated as RED or BLACK, about two-thirds of the total, were privately notified of their ratings and given six-month grace period to clean up before public disclosure. One and a half years later, 5 out of the 6 plants in the worst BLACK category were upgraded to higher categories, and the number of plants rated as RED or BLACK, namely those that failed to comply with the regulations, had gone down from the two-thirds to less than half of the total. As a result, water pollution discharges from the 187 pilot plants fell by 40% (World Bank, 2000). The Indonesian PROPER program has since been expanded, and its success has caught the attention of regulators in other countries. Modelled on Indonesia’s PROPER program with slight modifications, the Philippines introduced the EcoWatch program in 1997, and China introduced the Green Watch program, starting in June 1999 in Zhengjiang, a relatively well-off city in Jiangsu Province. Just like the companies under the PROPER program, the companies under the EcoWatch and Green Watch programs have dramatically changed their corporate environmental behavior. They together have sharply reduced their pollution (World Bank, 2000).
15 See the Global Ecolabelling Network web site at: http://gen.gr.jp. 16 See Zhang and Assunção (2004) for further discussion on ecolabelling and green government procurement and concerns about their potential trade effects.
44

Investors in capital markets can also be an important ally, reacting to the disclosure of environmental performance related to the companies that they invest. Since 1989, the Ministry of the Environment (MOE) of Korea has published the Monthly Violations Report as news material distributed to media reporters. This Report is based on information gathered through monthly government inspections on about 10,000 air- and water-polluting facilities, and reports the names of companies that are in violation of environmental laws and regulations and the nature of enforcement actions by the MOE of Korea. Since November 2000, the Report is publicly disclosed through the ministry’s official web site. Over the period from 1992 to 2002, a total of 3,455 different facilities and a total of 7,073 violation events appeared on a total of 113 violation lists published on a monthly basis, implying that some appeared more than once in such lists. The econometric study using Korean company level data found that companies appearing in this monthly listing of the violators of Korean environmental laws and regulations suffered a reduction in market value of their publicly traded equities. Investors react negatively to the disclosure of such information either for moral reasons or because they believe that those offending companies will face higher clean-up costs and therefore will be less competitive. The average reduction in market value is estimated to be 9.7% (Dasgupta et al., 2004; Hong, 2005). This average reduction in market value is much higher than results obtained in developed countries (Canada and the United States), but of a similar order of magnitude as results obtained in other developing countries (Argentina, Chile, Mexico and the Philippines) (Dasgupta et al., 2001). Moreover, the larger or wider the coverage of the events by newspapers, the larger the reduction in market value, reaching 38% for those events covered by 5 or more newspapers (Dasgupta et al., 2004; Hong, 2005). This clearly demonstrates the power of public information, if communities and capital markets are properly informed. Therefore, environmental regulators in developing Asian countries should explicitly harness the public pressure and market forces by introducing public disclosure programs. As demonstrated in China, Indonesia, the Philippines and South Korea, such programs have created incentives for companies to improve their corporate environmental performance, and are considered as a viable option to complement or supplement traditional enforcement channel of fines and penalties. Drawing the support of financial institutions is also one avenue to promote improved corporate environmental performance. From April 1, 2007, China’s SEPA works with the People’s Bank of China, China’s central bank, on a new credit-evaluation system under which companies’ environmental compliance records are incorporated into the bank’s credit-evaluation system. This information will serve as a reference for commercial banks’ consideration of whether or not to provide loans. The bank could turn down requests for loans from firms with poor environmental records (Zhang, 2007a and 2007d). Clearly, this concerted action by the central bank and the SEPA is expected not only to reduce the risks borne by commercial banks, but also to encourage companies to think about more about the environmental effect of their operation and self-discipline their environmental behavior. In August 2007, the SEPA (2007b) also clearly stipulated that highly polluting enterprises are subject to its auditing of their environmental records in case these enterprises want to list shares in the Chinese stock markets or get re-financed.
45

China Securities Regulation Commission will incorporate information on their environmental auditing into its decision on whether or not to allow these enterprises to be listed or get re-financed. 4. Regional Responses
To address environmental pollution of a cross-border or global nature, it is much more effective for the neighboring countries concerned or all of the countries to act collectively than just acting on its own. To focus only on one or the other, the local or the cross-border pollution sources, will be less effective than acting on both together. Clearly, regional responses serve as a complement, not a substitute for, national responses. The deteriorating air quality in Hong Kong was one of the most contentious issues in the vote for Hong Kong’s chief executive in March 2007. The study examining the primary source of the air pollution, local or cross-border, indicates that, while Hong Kong’s air pollution is primarily caused locally rather than cross-border pollution from its neighboring heavily-industrialized Chinese province of Guangdong, regional sources can influence this territory’s air quality on 36% of the time during the year (Lau et al., 2007). So, Hong Kong needs to rely on the two legs to avoid the air pollution problem worsening before it gets better. Hong Kong should take urgent action on its own to reduce emissions from local vehicles, marine traffic and power plants. In the meantime, Hong Kong needs to establish an agreement with its neighboring Guangdong to undertake a joint study to locate the source of emissions and then take concerted efforts together to remedy the situation. Acting on both together is much effective than focusing only on one or the other. A programme called ABC (Asian Brown Cloud) has been initiated with support from the UNEP. The main aim of the first phase of this programme is to study the impact of the Asian haze on a number of parameters, including monsoon change, water balance, agriculture and health. Scientists plan to establish a network of ground-based monitoring stations throughout Asia to study the composition and seasonal pattern of the haze. The UNEP has pledged to facilitate the continued research programme and, in the longer-term, to help coordinate policy responses to address the problem (UNEP, 2002).
As a response to the 1997 fire event in Indonesia, the ASEAN and the ADB (Asian Development Bank) developed a Regional Haze Action Plan. In 2002, ASEAN adopted the Agreement on Transboundary Haze Pollution,17 which took effect in November 2003. This Agreement is aimed to prevent and monitor transboundary haze pollution as a result of land and/or forest fires and to control sources of fires. Moreover, in recognition of the importance of cities in improving environmental sustainability, the ASEAN adopted the Framework for Environmentally Sustainable Cities. This Framework aims to address environmental sustainability challenges in the areas of clean air, water and land. Specifically, for example, in the area of clean air, the Framework is to achieve ASEAN’s long-term goal of maintaining good ambient air
17 Available at the ASEAN Secretariat’s web site at: http://www.aseansec.org/6086.htm.
46

quality to safeguard public health by addressing emissions from both stationary sources and mobile sources (ASEAN, 2003).
To cope with increasing impact of acid rain, as the first step in joint regional initiative in East Asia, Japan proposed the Acid Deposition Monitoring Network Plan in East Asia, and had hosted a series of expert meetings since 1993. At its First Session of the Intergovernmental Meeting, held in Yokohama in March 1998, it was decided to start the trial operation of the Acid Deposition Monitoring Network in East Asia (EANET) in April 1998 as regional cooperative initiative to promote efforts for environmental sustainability and protection of human health (Japan Environment Agency, 1999). The ten countries participating in the preparatory phase activities, namely, China, Indonesia, Japan, Malaysia, Mongolia, Philippines, Republic of Korea, Russia, Thailand and Viet Nam, concluded at the Second Session of the Intergovernmental Meeting in October 2000 that the preparatory phase activities had been successful and decided to start the EANET activities on a regular basis from January 2001. Cambodia and Lao PDR joined the network in November 2001 and November 2002 respectively, and their monitoring activities started in 2003. Myanmar has attended EANET meetings as an observer since 1999. Myanmar was approved as a member of EANET in November 2005. The EANET aims to create a common understanding of the state of the acid deposition problems in East Asia, to provide useful inputs for decision-making at local, national and regional levels aimed at preventing or reducing adverse impacts on the environment caused by acid deposition, and to contribute to cooperation on the issues related to acid deposition among the participating countries. Since 2001, the data reports on the acid deposition in the East Asian region have been published annually and made available on the web site of the network.18 In South Asia, the Malé Declaration on Control and Prevention of Air Pollution and its likely Transboundary Effects, was adopted by the eight South Asian countries in 1998 (UNEP, 2002). Dust and sandstorms are plaguing Northeast Asia nearly five times as often as they were in the 1950s. Sandstorms that originate in the dry regions of Mongolia and the Northern China plain hit Beijing every spring and then move eastward toward South Korea and Japan. In March 2002, dust levels in Seoul, 1200 kilometers away from their sources, reached 2070 µg/m3 (UNEP, 2004 and 2005). To deal with dust and sandstorms, governments of the region are working together with the Asian Development Bank, the UN Economic and Social Commission for Asia and the Pacific (ESCAP), the UN Convention to Combat Desertification, and the United Nations Environment Programme in monitoring and early warning. A joint project has been set up to create an initial institutional framework and a master plan to guide regional cooperation to control dust and sand storms in Northeast Asia (UNEP, 2004). Asian countries are working together with the rest of the world to combat global climate change under the United Nations Framework Convention on Climate Change and the Kyoto Protocol. As indicated in Table 17, as of September 1, 2008, there are 3819 clean development mechanism (CDM) projects that are registered, in the process of registration
18 See the EANET web site at: http://www.eanet.cc.
47

and at the public validation stage. Asia is the largest host of CDM projects, accounting for about 76% of the world’s total. With 1377 CDM projects at the public validation stage or beyond, China tops the share in the world’s total, which increases significantly from 2.7% in August 2005 to 36.1%. If operated as planned, all these currently known CDM projects in China are projected to generate reduction of 1464 million tons of carbon dioxide equivalents by 2012, accounting for 53.3% of the world’s total estimated carbon credits by 2012 (Zhang, 2006b; UNEP Risoe Center, 2008).19 To put into perspective, this amount of the total emissions reductions by 2012 is more than the current greenhouse gas emissions of Germany and Spain combined (or that of the United Kingdom, Italy and the Netherlands combined), and corresponds to about 30% of the current total emissions in the European Union 25. Coupled with India – the world’s second largest supplier of carbon credits, the two Asian giants are responsible for over two-thirds of the world’s expected entire emissions reductions by 2012, with China well positioned to be the largest supplier of carbon credits, as indicated in Figure 11. In addition, multilateral cooperation on climate control is taking place in this region. Noticeable example is the Asia Pacific Partnership for Clean Development and Climate. Australia, China, India, Japan and South Korea joined with the US to formally launch on January 12, 2006 this new partnership at its inaugural Ministerial meeting in Sydney. This partnership does not incorporate legally binding commitments or targets to reduce greenhouse gas emissions, but aims to promote and create an enabling environment for development, diffusion, deployment and transfer of existing and emerging low or zero emission technologies. It established eight public-private sector task forces (covering cleaner use of fossil energy, renewable energy and distributed generation, power generation and transmission, steel, aluminum, cement, coal mining, and buildings and appliances) to address the challenges of air pollution, energy security and climate change in a way that is designed to promote economic development and reduce poverty. The six countries represent almost half of world GDP, energy consumption, greenhouse gas emissions and population. Given the scale of this group and that technology is a critical ingredient in a climate policy package, theoretically speaking, the partnership has the potential to make a significant impact.20 Table 17 Pipeline of CDM Projects at the Validation Stage or Beyond (as of 1 September 2008)
CDM Projects at
Validation or beyond
Projected Certified
Emission Reductions by
2012
Region
Number % Million
tons CO2
%
19 This is very in line with the economic model-based estimates of Zhang (1999, 2000, 2001, 2004), which show that about 60% of the total CDM flows in 2010 go to China. 20 Based on the current information available, my judgment is that this partnership can contribute the overall efforts, but whether it is going to deliver any substantial outcomes as Australian and the US governments claim remains to be seen. See Zhang (2007c) for further discussion on the partnership.
48

Latin America Asia & Pacific Europe & Central Asia Africa Middle-East Total
757 2899 40 71 3
3819
19.8 75.9 1.0 1.9 0.1
100.0
417.1 2177.2 19.5 94.4 2.9
2744.7
15.2 79.3 0.7 3.4 0.1
100.0
Source: UNEP Risoe Center (2008). Figure 11 Growth of Total Expected Accumulated Certified Emission Reductions
(CERs) by 2012 (as of 1 September 2008) Source: UNEP Risoe Center (2008).
0
200
400
600
800
1000
1200
1400
1600
1800
2000
2200
2400
2600
2800
Dec
-03
Feb
-04
Ap
r-0
4Ju
n-0
4A
ug
-04
Oct
-04
Dec
-04
Feb
-05
Ap
r-0
5Ju
n-0
5A
ug
-05
Oct
-05
Dec
-05
Feb
-06
Ap
r-0
6Ju
n-0
6A
ug
-06
Oct
-06
Dec
-06
Feb
-07
Ap
r-0
7Ju
n-0
7A
ug
-07
Oct
-07
Dec
-07
Feb
-08
Ap
r-0
8Ju
n-0
8A
ug
-08
Mil
lio
n C
ER
"Rest of the
countries
Malaysia
Mexico
South Korea
Brazil
India
China
To build synergies between economic growth and environmental sustainability, the Meeting of Ministers of the 5th Ministerial Conference on Environment and Development in Asia and the Pacific, held from 28 to 29 March 2005, Seoul, adopted the Ministerial Declaration on Environment and Development in Asia and the Pacific. This Declaration from government delegates from 52 member and associate member states of the ESCAP calls upon its members and associate members to seek to improve environmental sustainability, while addressing poverty by reducing the pressure of unsustainable economic growth on the environment and improving environmental performance. This Ministerial Conference also adopted the Regional Implementation Plan for the Sustainable Development in the Asia and the Pacific, 2006-2010. This Plan provides a framework for action to address the key constraints to sustainable development in the context of the needs and priorities of the region (UNESCAP, 2005).
49

Multilateral development banks (MDBs) can play a vital role in promoting clean energy, thus reducing environmental pollution associated with production and use of energy. Clean energy, including renewable energy and energy efficiency, can contribute significantly to achieving the Millennium Development Goals. They offer the double dividend, meeting the energy needs for sustained growth while at the same time preserving the environment. For years, MDBs have been criticized for funding conventional energy projects like coal-fired power plants while largely ignoring energy efficiency and renewable energy. This situation is changing. At the June 2004 World Renewable Energies Conference, the World Bank announced that it planned to increase its lending on clean energy by an average of 20% per year between 2005 and 2009. From July 2005 to June 2006, the Bank committed US$ 490 million to energy efficiency and US$ 190 million to renewable energy projects. This total of the US$ 680 million was an increase of 48% over the commitments a year ago. Jamal Saghir, Director of Energy and Water at the World Bank was quoted as saying that “since 1990, the World Bank Group commitments to renewable energy and efficiency have exceeded US$ 10 billion, with each dollar leveraging another three dollars from other private and public sources” (Cundy, 2006). The ADB is also active in this area. Its Energy Policy, approved in 1995, emphasizes the acceleration of the widespread application of renewable energy and energy efficiency in its developing member countries. This focus was strengthened in ADB’s Energy Policy Review of 2000. As part of its committed efforts in the area of clean energy, in April 2001, the ADB launched the Regional Technical Assistance for the Promotion of Renewable Energy, Energy Efficiency and Greenhouse Gas Abatement to facilitate investment in renewable and energy efficiency in this region (Zhang and Maruyama, 2001). The Bank has increased its annual spending on clean energy to $1 billion this year (Casey, 2007). Its Energy Efficiency Initiative, which started operation in July 2005, expands the ADB’s investment in projects that help developing Asian countries change their patterns of energy use and move towards a low carbon economy. The Carbon Market Initiative (CMI) is another concrete effort to deepen the ADB’s commitment to clean energy and climate change mitigation. The CMI provides co-financing to develop emissions reduction projects under the Clean Development Mechanism, leverages debt financing and fills host country financing gaps (Rhode and Nicholls, 2006). As part of the CMI, the Asia Pacific Carbon Fund (APCF), which became fully operational on May 1, 2007, is designated to provide up-front funding against the purchase of an estimated 25-50% of future carbon credits expected from CDM projects (ADB, 2007a). It is the feature of paying its invested capital upfront that makes the APCF different from other carbon funds. As a result, the APCF helps projects close their financing gap and increases the number of clean energy and energy efficiency projects in Asia. By the time when the acceptance of participation to the APCF was closed on June 30, 2007, it raised $151.8 million from the seven European countries from Belgium, on behalf of the Flemish region, Finland, Luxembourg, Portugal, Spain, Sweden and Switzerland to help develop clean energy projects in the Asia Pacific region and at the same time to help these European countries involved to achieve their carbon emission reduction commitments under the Kyoto Protocol (ADB, 2007b).
Regional cooperation is useful in mitigating potential environmental impacts of foreign direct investment (FDI). FDI is increasingly concentrated in just a few countries,
50

intensifying competition for investment and thereby possibly lowering environmental standards in competing countries. Unlike carbon financing whereby carbon credits are created, which have to be scrutinized and issued by the CDM Executive Board against a set of sustainable development criteria (Zhang, 2006a and 2006b), FDI arrangements between countries are governed primarily by bilateral investment treaties. So, cooperation through regional economic cooperation secretariats, such as ASEAN, and the resulting policy coherence among countries could help countries to reduce the likelihood of weakening environmental standards to attract FDI. 5. Conclusions Asia has been heavily dependent on dirty-burning coal to fuel its rapidly growing economy over the past 15 years. This coal dominance in the energy mix in developing Asia and inefficiencies in production and use of energy and resources, combined with rapid urbanization and motorization, have led to unprecedented environmental consequences. The ecological footprint shows that, despite the fact that one-fifth of the population in Asia still lives on less than US$ 1 per day (PPP-adjusted), this region is already living beyond its ecological carrying capacity. This situation would worsen because Asia needs to continue its rapid economic growth in order to alleviate the poverty of the two-thirds of the world’s poor living in the region. This will further place tremendous pressures on the environment unless vigorous and effective policies are put in place. The good news is that the Asian governments have endorsed an environmentally sustainable economic growth patterns aimed at reducing the pressure of unsustainable economic growth on the environment and improving environmental performance. Along this line, there are encouraging signs that Asian countries are taking unprecedented efforts. To achieve a more sustainable future for Asia, the region needs to further strengthen cooperation at national, local and regional levels and to have the right policy mix to ensure continuing economic growth without compromising its limited ecological carrying capacity and environmental quality. Having the right economic policies is crucial because it sends clear signals to both producers and consumers of energy. This region needs to get rid of energy subsidies, which have been reduced over time but still exist in a number of countries, in order to provide incentives for efficient fuel use and adoption of clean technologies that reduce emissions at sources. But removing such subsidies is but a first step in getting the energy prices right. Further steps include incorporating the costs of resources themselves to reflect their scarcity and internalizing the costs of externalities. Market-based instruments, such as pollution charges, green taxes, tradeable petmits, and penalties for infringing on environmental regulations, are common ways to internalize externality costs into the market prices. Many Asian countries have traditionally relied on rigid command-and-control approaches. With the poor environmental performance of such approaches and the cost and complexity associated with their implementation, an increasing number of countries in this region are implementing market-based policy instruments. The latter are seen to increase not only cost-effectiveness but also flexibility in complying with the set environmental regulations. In addition, governments need to explore industrial policies to promote industrial upgrading and energy conservation. For example, China levied export
51

taxes on energy- and resource-intensive products to discourage exports that rely heavily on energy and resources and to save scarce energy and resources, eliminated or cut export tax rebates for 2831 exported items including 553 “highly energy-consuming, highly polluting and resource intensive products”, and suspends the rights of those enterprises that don’t meet their environmental obligations to engage foreign trade in the period of more than one year and less than three years. There should be better coordination between the central and local governments within countries. Confronted with the rising costs of environmental degradation associated with rapid economic growth, the central governments in Asian countries have gradually recognized that the conventional path of encouraging economic growth at the expense of the environment has to be changed. Accordingly, they set environmental goals and environmental performance requirements. However, environmental ministries or equivalent agencies in the region are often ill-equipped either to enforce existing regulations or to design, implement, monitor, inspect and enforce new effective environmental polices to fulfill their tasks. As a result, poor compliance and weak enforcement are common in this region. Correcting such a problem requires a major investment in strengthening the institutions of environmental governance to ensure that they have the adequate institutional, financial and technical capabilities to do the job. This is a necessary step, but not enough. We also need the full participation of all stakeholders in protecting the environment. In this regard, local government’s cooperation is crucial to the overall outcomes. For example, under the current evaluation criterion for officials in China, local officials typically have been promoted based on how fast they expand their local economies. This distorted incentive system tempts officials to disregard environmental costs of growth. Moreover, objectively speaking, the current fiscal system in China plays a part in driving local governments to seek higher GDP growths because that system makes it hard to reconcile the interests of the central and local governments. Thus, we need to carefully examine those objective and subjective factors that lead to the lack of local official’s cooperation on the environment, and to provide right incentives to get their cooperation. Regulatory policies have a key role to play in reducing emissions. Setting and enforcing emissions standards for mobile and stationary sources and for fuel quality are essential to control emissions and improve air quality, and at the same time provide an impetus for improvements in technology. Developing Asian countries that are facing acute air pollution problems have adopted progressively stringent European standards for both vehicles and fuel specifications over time. This has led to improvements in vehicle technologies and exhaust systems. Many cities in Asian countries have shifted vehicle fleets to cleaner fuels to significantly reduce pollution from vehicles. Through prioritizing public transport and promoting efficient public transport systems, growing Asian cities are also implementing demand-side traffic management measures to reduce congestion and urban air pollution. Developing Asian countries are confronted with many other pressing social pressing concerns such as providing water and sanitation services to the urban poor, improving public transportation and other basic infrastructures, and reducing poverty as well as
52

improving the environment. In this context, in order to address environmental issues effectively and achieve the maximal gains, environmental policies need to be integrated with economic policies, investment policies, energy policies, transportation policies, land-use policies, and other urban development policies. This will help countries view environmental policies as not just for tackling potential environmental threats per se, but as an integrated framework to tackle these aforementioned concerns, as well as a means of improving energy efficiency, reducing congestions, saving money, and setting pro-active policies to ensure sustainable development. Moreover, to minimize environmental effects, such an integration needs to be in place at the planning stage, rather than at the implementation stage. Improving energy efficiency is the cheapest, fastest and most effective way to address environmental concerns in the short term. To encourage investments in energy efficiency improvements and accelerate energy efficiency gains on the demand side, Asian countries need to further design and promulgate efficiency standards for appliances and industrial equipments, building codes and new vehicle fuel economy standards. Improved energy efficiency increases overall air quality, reduces greenhouse gas emissions and improves energy security. Given that many developing Asian countries suffer frequently from energy shortages, increasing energy efficiency will reduce the need to invest in energy-supply infrastructures but will bring energy needs and supplies into balance. Moreover, because many Asian economies are exports-oriented, reducing energy use through greater efficiency will reduce energy costs and thus enhance their international competitiveness. There are encouraging signs that Asian countries are taking unprecedented efforts to improve energy efficiency. However, from a long-term perspective, widespread use of clean energy is a real solution. In comparison with the OECD, the share of renewable energies (including traditional biomass) in the total primary energy supply in developing Asian countries is very high, but their share of hydropower and modern (or new) renewable energies (namely, solar, wind, geothermal, wave and tidal energy) in total renewables is very low, although this share of modern renewable energies in the energy mix is growing in developing Asian countries. Increasing this share not only enhances energy security, but also is environmentally friendly and conducive to good health. Many Asian countries have established national targets for renewable energies. These targets are revised and strengthened over time. To meet these targets, governments need to put in place policies and incentives favorable to the widespread use of renewable energies. Such policies include public RD&D programs, feed-in tariffs, renewable energy mandates, tax credits for investment/production, preferential loans, accelerated depreciation rates, technology-forcing regulations, reduction on import duty and export facilitation, consumer purchasing incentives and government green purchasing preferences, green certificate trading, and competitive bidding. However, the specific form and level of this support will clearly differ in design from technology to technology and from country to country, depending on the overall policy framework in place and the maturity and cost of each technology in each country. Multilateral development banks can play a vital role in promoting clean energy, thus reducing environmental pollution associated with production and use of energy. For years, they have been criticized for funding conventional energy projects like coal-fired power
53

plants while largely ignoring energy efficiency and renewable energy. There are encouraging signs that this situation is changing, but such a change is not at the pace and on the scale that we need. Multilateral development banks need to further strengthen their financial commitments to and technical support for accelerating such a change. The clean development mechanism is an innovative mechanism built into the Kyoto Protocol. The CDM allows industrialized countries to generate emission credits through investment in emission reduction projects in developing countries to meet their Kyoto emission obligations while helping developing countries to meet their sustainable development objectives. Initially, Asia lagged behind Latin America in the CDM market. But thanks to the increasing number of CDM projects in China and India, Asia is now the largest host of CDM projects. While the CDM has emerged as a financing mechanism to mitigate greenhouse gas emissions as the implementation of CDM projects has progressed, it still does not work to full potential scale. To that end, change needs to take place both at national and international levels. At the national level, for those developing Asian countries that have not truly benefited from the CDM, they need to put in place clear institutional structures, streamlined and transparent CDM procedures and sound governance of clearer lines of responsibility and functions to facilitate the smooth implementation of CDM projects in their countries. At the international level, post-Kyoto climate negotiations need to reform the CDM to overcome its current structural limitations and to make it accommodate those players and types of small projects that have been left out to date. When taken together and combined, they will help to expand the number and geographical reach of the CDM, thus spreading its benefits to more countries. The active engagement of the private sector is essential for success, not simply because the expected investment requirements are too massive for the public sector. After all, the firms themselves are entities that use natural resources, make products and emit pollution. Thus, a sustainable future for Asia is not possible without the active engagement of the private sector. Environmental institutions in developing Asian countries need to take advantage of the positive influences of globalization and public pressure to engage the private sector through e.g., ecolabelling, green government procurement, corporate ratings and disclosure programs, and drawing the support of financial institutions to promote long-lasting, improved corporate energy-saving and environmental performance. It should be kept in mind that broad economic reforms can also help to reduce pollution and save energy. As many Asian countries are based on export-oriented economies, greater openness to trade and the elimination of trade barriers between and inside countries can enhance incentives for companies to adopt more efficient and environmentally friendly technologies. As trade liberalization progresses, companies are facing ever-increasing pressures to be held accountable for their environmental behavior. Moreover, state-owned companies in this region are often heavy polluters, so decentralization and privatization to have such companies accountable for their profits and costs can contribute to cleaner production. But economic reforms are no panacea. Governments also need to anticipate and deal with potential environmental effects of such growth-promoting measures before and after they have been taken.
54

Finally, it should be pointed out that, with environmental quality in Asia becoming increasingly affected by pollution from neighboring countries or elsewhere, there is a clear need for better coordination across countries. To address environmental pollution of a cross-border or global nature, it is much more effective either for the neighboring countries concerned or all of the countries to act collectively rather than having each country simply act on its own. To focus on only one or the other, the local or the cross-border pollution sources, will be less effective than acting on both together. Clearly, there also needs to be a template for cooperation on trans-bounder or global environmental issues. Some progress has been made in this area. For example, as a response to the 1997 fire event in Indonesia, the ASEAN and the ADB developed a Regional Haze Action Plan, and in 2002, ASEAN adopted the Agreement on Transboundary Haze Pollution. Moreover, in recognition of the importance of cities in improving environmental sustainability, the ASEAN adopted the Framework for Environmentally Sustainable Cities to address environmental sustainability challenges in the areas of clean air, water and land. Governments of the Asian countries are working together to deal with dust and sandstorms and to cope with the increasing negative impact of acid rain. Asian countries are also working together with the rest of the world to combat global climate change under the United Nations Framework Convention on Climate Change and the Kyoto Protocol. These regional and international responses are not a substitute for national responses. Rather, they serve as a useful complement for national responses. Acknowledgments This paper is built on the keynote address on Sustainable Energy Development in China: Challenges Ahead to 2020 at the International Conference on Staying Ahead of the Energy Scenarios, Bangkok, November 11, 2005; the keynote address on Cutting Carbon Emissions While Making Money: A Wishful Thinking or A Win-Win Opportunity? at the 29th International Association for Energy Economics International Conference, Potsdam, Germany, June 8-10, 2006; the plenary presentation on Greening China: Can Hu and Wen Turn a Test of their Leadership into a Legacy? at the first-ever Harvard College China-India Development and Relations Symposium, New York City, March 30 – April 2, 2007; the invited presentation on Engaging the Developing World at the World Affairs Council Conference on Climate Change and Global Politics, San Francisco, California, September 13, 2007; the invited presentation on Asian Energy and Environment: Productivity and Sustainability at the Conference on Emerging Asian Regionalism: Ten Years after the Crisis, Tokyo, November 1-2, 2007; the plenary presentation on Energy and Environmental Policy in Asia at the First International Association for Energy Economics Asian Conference, Taipei, November 5-6, 2007; the keynote address on Energy and Environmental Policy in Mainland China at the Cross-Straits Conference on Energy Economics and Policy, Taipei, November 7-8, 2007; the invited presentation on China Is not a Christmas Tree to Hang Everybody’s Complaints: Putting its Energy-Saving and Pollutants-Cutting into Perspective at the Conference on China’s Environment: What Do We Know and How Do We Know It?, University of California at Berkeley, December 7-8, 2007 as well as at the invited seminars at the Institute of Policy and Management, Chinese Academy of Sciences, Beijing, November 21, 2007 and the
55

School of Business Administration, China University of Petroleum, Beijing, November 22, 2007. Financial support from the Office of Regional Economic Integration, Asian Development Bank is gratefully acknowledged. The views expressed here are those of the author, and do not necessarily reflect the positions of the Asian Development Bank. The author bears sole responsibility for any errors and omissions that may remain. References
An, F. and A. Sauer (2004), Comparison of Passenger Vehicle Fuel Economy and GHG
Emission Standards around the World, Pew Center on Global Climate Change, Arlington, United States, December, Available at: http://www.pewclimate.org/docUploads/Fuel%20Economy%20and%20GHG%20Standards_010605_110719.pdf. Agence France-Presse (2006), China Slaps Export Duties to Curb Trade Surplus, Preserve Energy, October 31, Available at: http://www.uofaweb.ualberta.ca/chinainstitute/nav03.cfm?nav03=52190&nav02=51046&nav01=43092. Asian Development Bank (ADB, 2005a), Asian Development Outlook 2005, Manila. Asian Development Bank (ADB, 2005b), Asian Environment Outlook 2005 – Making
Profits, Protecting Our Planet, Manila. Asian Development Bank (ADB, 2007a), ADB and Clean Energy, Available at: http://adb.org/Clean-Energy/default.asp. Asian Development Bank (ADB, 2007b), Asia Pacific Carbon Fund Raises More than $150 Million, ADB News and Events, August 7, Available at: http://www.adb.org/Media/Articles/2007/12074-asian-carbon-funds/. Association of Southeast Asian Nations (ASEAN, 2003), Framework for Environmentally Sustainable Cities in ASEAN, Jakarta, Available at: http://www.aseansec.org/framework.htm. Baker & McKenzie, The Renewable Energy Generators of Australia, The Chinese Renewable Energy Industry Association and The Centre for Renewable Energy Development (2007), Renewable Energy Law in China: Issues Paper, June, Sydney. Beijing Municipal Commission of Development and Reform (BMCDR, 2006), The 11th Five-Year Development Program for Energy Conservation in the Building Sector of Beijing Municipal, September 8, Available at: http://www.beijing.gov.cn/zfzx/ghxx/sywgh/t662751.htm.
56

Bloyd, C. (2007), Bio-Fuel Experiences and Priorities, Presented at the Interactive Executive Workshop on Energy Security in the North Pacific, Honolulu, Hawaii, July 31 – August 1. Brahic, C. (2007), China to Promise Cuts in Greenhouse Gases, February 14, Available at: http://environment.newscientist.com/article/dn11184-china-to-promise-cuts-in-greenhouse-gases.html. BRT China (2006), The First BRT Route in Beijing Is in Full Operation, Ridership in the First Day Reaches 100000, January 1, Available at: http://www.brtchina.org/BJBRT1.htm. Casey, M. (2007), Asian Bank Endorses Clean Energy, June 26, Available at: http://news.yahoo.com/s/ap/20070626/ap_on_re_as/asia_clean_energy. Chang, S.K. (2003), Taipei Bus Rapid Transit System, Presented at Bus Rapid Transit System Development Strategy Symposium, Beijing, March 18, Available at: http://www.brtchina.org/ReportC/Taibei.pdf. China News Net (2007), NDRC Says China Will Take Three Years to Increase Pollution Charges Equivalent to the Cost of Pollution Treatment, July 25, Available at: http://news.sina.com.cn/c/2007-07-25/152713525567.shtml. Clean Air Initiative for Asian Cities (2006), Air Qualities in Asian Cities, Available at: http://www.cleanairnet.org/caiasia/1412/articles-59689_AIR.pdf. Council of the European Union (2007), Presidency Conclusions, Brussels, May 2, Available at: http://www.consilium.europa.eu/ueDocs/cms_Data/docs/pressData/en/ec/93135.pdf. Cundy, C. (2006), World Bank Raises Spending, Exceeds Target, on Renewables, Environmental Finance, Vol. 7, No. 10, September, p. 14. Dasgupta, S., Hong, J.H., Laplante, B. and N. Mamingi (2004), Disclosure of Environmental Violations and the Stock Market in the Republic of Korea, Policy Research Working Paper No. 3344, The World Bank, Washington, DC. Available at: http://www-wds.worldbank.org/external/default/WDSContentServer/IW3P/IB/2004/07/23/000112742_20040723144948/Rendered/PDF/wps3344.pdf. Dasgupta, S., Laplante, B. and N. Mamingi (2001), Pollution and Capital Market in Developing Countries, Journal of Environmental Economics and Management, Vol. 42, pp. 310-335.
57
European Commission (2007a), Communication from the Commission to the European Council and the European Parliament: An Energy Policy for Europe, Brussels, COM(2007) 1 Final, January 10, Available at: http://ec.europa.eu/energy/energy_policy/doc/01_energy_policy_for_europe_en.pdf. European Commission (2007b), Energy for a Changing World: An Energy Policy for Europe - the Need for Action, Brussels, Available at: http://ec.europa.eu/energy/energy_policy/doc/2007_03_02_energy_leaflet_en.pdf. Global Footprint Network (2007), Ecological Footprint and Biocapacity, 2006 Edition, Available at: http://www.footprintnetwork.org; Accessed on June 26, 2007. Hangzhou Public Transport Daily (2007), The First BRT Route Carries Ridership of 16.06 Million within a Year, April 30, Available at: http://www.brtchina.org/ReportC/Hangzhou/1.pdf. Hatwal, S.C. (2004), Contribution of Natural Gas Towards Cleaner Air in India, Presented at the Workshop on Better Air Quality in Asia, Agra, India, December 6-8, Available at: http://www.cleanairnet.org/baq2004/1527/article-59089.html. He, D.Q. (2003), Introduction to the China’s Sustainable Energy Program’s Transportation Program, Sinosphere, Vol. 6, No. 1, pp. 13-17. He, Y.G. (2006), Outlook for Coal Industry in Mainland China, in Z.X. Zhang and Y. Bor (eds), Energy Economics and Policy in Mainland China and Taiwan, China Environmental Science Press, Beijing, pp. 56-66. Hong, J.H. (2005), Environmental Regulatory Reform and Public Disclosure Program: Korean Experience, Presented at the First Green Growth Policy Dialogue: Towards Green Growth in Asia and the Pacific: Eco-efficiency through Green Tax and Budget Reform, Seoul, November 8-9, Available at: http://www.unescap.org/esd/environment/mced/tggap/documents/RPD/19_JongHoHong.pdf. IEA (2006a), World Energy Outlook 2006, International Energy Agency (IEA), Paris. IEA (2006b), Carrots and Sticks: Taxing and Subsidising Energy, Working Paper, International Energy Agency (IEA), Paris, January, Available at: http://www.iea.org/textbase/papers/2006/oil_subsidies.pdf. IEA (2007a), Energy Use in the New Millennium - Trends in IEA Countries, International Energy Agency (IEA), Paris. IEA (2007b), World Energy Outlook 2007, International Energy Agency (IEA), Paris.
58

Intergovernmental Panel on Climate Change (IPCC, 2007), Climate Change 2007:
Impacts, Adaptation and Vulnerability, Contribution of Working Group II to the Fourth Assessment Report of the IPCC, Cambridge University Press, Cambridge, New York. JAMA (2006), Newsletter, Vol. 18, February, Japan Automobile Manufacturers Association (JAMA), Available at: http://www.jama-english.jp/asia/news/2006/vol18.pdf. Japan Environment Agency (1999), Quality of the Environment in Japan 1999, Tokyo. Lang, S. (2004), Progress in Energy Efficiency Standards for Residential Buildings in China, Energy and Buildings, Vol. 36, pp. 1191-1196. Lau, A., Lo, A., Gray, J., Z. Yuan and C. Loh (2007), Relative Significance of Local vs.
Regional Sources: Hong Kong’s Air Pollution, Civic Exchange and Hong Kong University of Science and Technology, Hong Kong, Available at: http://www.civic-exchange.org/publications/2007/airmarch.pdf. Lin, J., Zhou, N., Levine, M. and D. Fridley (2006), Achieving China’s Target for Energy Intensity Reduction in 2010: An Exploration of Recent Trends and Possible Future Scenarios, LBNL-61800, Lawrence Berkeley National Laboratory, Berkeley, California, December, Available at: http://china.lbl.gov/publications/lbnl-61800.pdf. Menon-Choudhary, D. and P.R.Shukla (2004), Integrated Approach to Air Quality Management in India, Presented at the Workshop on Better Air Quality in Asia, Agra, India, December 6-8, Available at: http://www.cleanairnet.org/baq2004/1527/articles-59297_menon.doc. Ministry of Commerce of China and the State Environmental Protection Agency (2007), A Circular on Strengthening the Environmental Supervision of Export-Engaged Enterprises, Beijing, October 8, Available at: http://www.gov.cn/zwgk/2007-10/12/content_775030.htm. Ministry of Economic Affairs of Taiwan (MOEA Taiwan, 2005), White Paper on Energy Policy, Bureau of Energy, Taipei, Available at: http://www.moeaboe.gov.tw/policy/EnergyWhitePaper/94/index/index.html. Ministry of Economy, Trade and Industry of Japan (METI, 2006), New National Energy Strategy, Tokyo, May, Available at: http://www.enecho.meti.go.jp/english/newnationalenergystrategy2006.pdf. Ministry of Finance of China and the State Administration of Taxation (2007), A Circular on Lowering Export Tax Rebates for some Products, Beijing, June 18, Available at: http://finance.sina.com.cn/focus/2007tzckts/index.shtml. National Bureau of Statistics of China (2007), China Statistical Yearbook 2007, China Statistics Press, Beijing.
59

National Bureau of Statistic (NBS), National Development and Reform Commission and Office of The National Energy Leading Group (2007), Bulletin on Energy Use per Unit of GDP and other Indicators by Region, Beijing, July 12, Available at: http://hzs.ndrc.gov.cn/newjn/t20070809_152873.htm. National Bureau of Statistic (NBS), National Development and Reform Commission and National Energy Administration (2008), Bulletin on Energy Use per Unit of GDP and other Indicators by Region, Beijing, July 14, Available at: http://www.stats.gov.cn/tjgb/qttjgb/qgqttjgb/t20080714_402491870.htm. National Development and Reform Commission (NDRC, 2006a), The Top 1000 Enterprises Energy Conservation Action Program, NDRC Environment & Resources [2006] No.571, Beijing, April 7, Available at: http://hzs.ndrc.gov.cn/newzwxx/t20060414_66220.htm. National Development and Reform Commission (NDRC, 2006b), Provisional Administrative Measures on Pricing and Cost Sharing for Renewable Energy Power Generation, NDRC PRICE[2006] No.7, Beijing, January 4. National Development and Reform Commission (NDRC, 2006c), Suggestions for Improving the Policy on Differentiated Tariffs, September, Available at: http://www.gov.cn/zwgk/2006-09/22/content_396258.htm. National Development and Reform Commission (NDRC) and National Bureau of Statistic (NBS) (2007), Bulletin on Energy Use of the Top 1000 Enterprises, Beijing, September 18, Available at: http://www.sdpc.gov.cn/zcfb/zcfbgg/2007gonggao/W020071009598162122784.pdf. OECD (2000), Greener Public Purchasing: Issues and Practical Solutions, Paris. People’s Daily (2005), China is Going to Start Implementing the Bulletin System to Release Data on Energy Use per unit of GDP, December 17, Available at: http://news.sina.com.cn/c/2005-12-17/05457728754s.shtml. People Net (2007), Jiangsu Will Raise the Levels of Pollution Charges from July 1, 2007, June 11, Available at: http://politics.people.com.cn/GB/14562/5848072.html. People Net (2008a), Adjustments for Vehicle Excise Taxes Will Take Place Since September 1, Up for Cars with Large Engines and Down for Small Cars to 1%, August 14, Available at: http://auto.people.com.cn/GB/1049/7663221.html. People Net (2008b), Prices of Oil Products Go Up, and Drivers Line up in the Night to Fill, October 7, Available at: http://energy.people.com.cn/GB/8135477.html.
60

Qian, J. and K. Zhang (1998), China’s Desulfurization Potential, Energy Policy, Vol. 26, No. 4, pp. 345-351. Rank, M. (2006), China Turns to Biofuels, Environmental Finance, Vol. 8, No. 2, November, p. 16. Renewable Energy Policy Network for the 21st Century (REN21, 2005), Renewables
2005 Global Status Report, Paris. Renewable Energy Policy Network for the 21st Century (REN21, 2006), Renewables
Global Status Report: 2006 Update, Paris. Renewable Energy Policy Network for the 21st Century (REN21, 2007), International Action Programme Actions and Reports, Paris, Available at: http://www.ren21.org/iap/iap.asp. Renewable Fuels Association (2007), Annual World Ethanol Production by Country, Washington, DC, Available at:http://www.ethanolrfa.org/industry/statistics/#E. Rhode, W. and M. Nicholls (2006), ADB, EBRD Announce Clean Energy Investment Plans, Environmental Finance, Vol. 7, No. 8, June, p. 7. Schwela, D., Hag, G., Huizenga, C., Han, W.-J., Fabian, H. and M. Ajero (2006), Urban
Air Pollution in Asian Cities, Earthscan, London. Sinanet (2006), Special Topic on Paying Close Attention to Adjustments in Consumption Tax Policy, Available at: http://finance.sina.com.cn/focus/gzxfstz/index.shtml. Sinanet (2007a), Jiangshu Will Double the Charges for Atmospheric Pollutants from July 1, June 11, Available at: http://news.sina.com.cn/c/2007-06-11/012711994856s.shtml. Sinanet (2007b), The NDRC Suggests the Control of Loan and Land to Restrict Investment in Energy-intensive Industries, June 15, Available at: http://news.sina.com.cn/c/2007-06-15/114613237504.shtml. Sinanet (2007c), Regional Environmental Protection Inspection System: Today and Future, July 20, Available at: http://finance.sina.com.cn/economist/jingjiguancha/20070720/17203806186.shtml. Sinanet (2008), WTO Rules For the First Time China’s Violation of its Trade Provisions, February 14, Available at: http://news.sina.com.cn/c/2008-02-14/165514939341.shtml. State Development and Planning Commission (SDPC), Ministry of Finance, State Environmental Protection Agency, and State Economic and Trade Commission (2003), Administrative Measures on the Levying Levels of Pollution Charges, Beijing, February 28, Available at: http://www.sepa.gov.cn/epi-sepa/zcfg/w3/ling2003-31.htm.
61

State Environmental Protection Agency of China (SEPA, 2007a), SEPA Released the Latest Evaluation on Cities’ Environmental Quality, Beijing, June 11, Available at: http://www.sepa.gov.cn/xcjy/zwhb/200706/t20070611_104908.htm. State Environmental Protection Agency of China (SEPA, 2007b), SEPA Clearly Stipulates Highly Polluting Enterprises Listed Subject to Auditing, Beijing, August 19, Available at: http://www.gov.cn/banshi/2007-08/20/content_721678.htm. State Environmental Protection Agency of China (SEPA) and the National Bureau of Statistics (NBS) (2006), China Green National Accounting Study Report 2004, Public Version, Beijing, September. Streets, D.G., Yu, C., Bergin, M.H., Wang, X. and G.R. Carmichael (2006), Modeling Study of Air Pollution Due to the Manufacture of Export Goods in China’s Pearl River Delta, Environmental Science and Technology, Vol. 40, No. 7, pp. 2099-2107. The Government of Japan (2002), Japan’s Third National Communication under the United Nations Framework Convention on Climate Change, Tokyo, Available at: http://unfccc.int/resource/docs/natc/japnc3.pdf. The State Council (2007), Comprehensive Work Plan for Energy Saving and Pollution Cutting, Beijing, June 3, Available at: http://news.xinhuanet.com/politics/2007-06/03/content_6191519.htm. Tietenberg, T. (1998), Disclosure Strategies for Pollution Control, Environmental and
Resource Economics, Vol. 11, Nos.3/4, pp. 587-602. United Nations Development Programme (UNDP, 2004), World Energy Assessment
Overview: 2004 Update, New York. United Nations Economic and Social Commission for Asia and the Pacific (UNESCAP, 2005), The 5th Ministerial Conference on Environment and Development in Asia and the Pacific, Seoul, March 28-29, Available at: http://www.unescap.org/mced. United Nations Economic and Social Commission for Asia and the Pacific (UNESCAP, 2006), State of the Environment in Asia and the Pacific 2005: Economic Growth and
Sustainability, Bangkok. United Nations Environment Programme (UNEP, 2002), Global Environment Outlook 3, Earthscan, London. United Nations Environment Programme (UNEP, 2004), North East Asian Dust and Sand Storms Growing in Scale and Intensity, March 31, Available at: http://www.un.org/News/Press/docs/2004/unep216.doc.htm and
62

http://www.unep.org/Documents.Multilingual/Default.asp?DocumentID=389&ArticleID=4401&l=en. United Nations Environment Programme (UNEP, 2005), Global Environment Outlook
Year Book 2004/5, Earthscan, London.
UNEP Risoe Center (2008), CDM and JI Pipelines by September 1, Denmark, Available at: http://www.cdmpipeline.org/Publications/CDMPipeline.xls. UNFCCC (2007), Report on Analysis of Existing and Potential Investment and Financial Flows Relevant to the Development of an Effective and Appropriate International Response to the Climate Change, Dialogue Working Paper No. 8, Prepared for the Fourth Workshop under the Dialogue on Long-Term Cooperative Action to Address Climate Change by Enhancing Implementation of The Convention, Vienna, August 27-29, Available at: http://unfccc.int/files/cooperation_and_support/financial_mechanism/financial_mechanism_gef/application/pdf/dialogue_working_paper_8.pdf. Wang, W.W. (2007), Green Transport Has Bright Future in China, China Economic Net, July 23, Available at: http://en.ce.cn/Insight/200707/23/t20070723_12268912.shtml. Wikipedia (2007), European Emission Standards, Available at: http://en.wikipedia.org/wiki/European_emission_standards; Accessed on August 3, 2007. World Bank (2000), Greening Industry: New Roles for Communities, Markets, and
Governments, Oxford University Press, New York. World Bank (2006), Financing Energy Efficiency Lessons from Recent Experience, with
a Focus on Brazil, China and India, Washington, DC. World Bank (2007), World Development Indicators, Washington, DC.
World Health Organization (WHO, 2007a), Indoor Air Pollution Takes Heavy Toll on Health, Geneva, April 30, Available at: http://www.who.int/mediacentre/news/notes/2007/np20/en/index.html. World Health Organization (WHO, 2007b), Estimated Deaths & DALYs Attributable to Selected Environmental Risk Factors by WHO Member State in 2002, Geneva, January, Available at: http://www.who.int/quantifying_ehimpacts/countryprofilesebd.xls. World Resources Institute (2007), Climate Analysis Indicators Tool (CAIT) Version 4.0, Washington, DC. Xinhuanet (2005), Beijing Starts State Phase III Standards Today, December 30, Available at: http://news.xinhuanet.com/auto/2005-12/30/content_3987678.htm.
63

Xinhuanet (2007a), Beijing Reaffirms the Implementation of State Phase IV Vehicle Emission Standards as Planned, June 8, Available at: http://news.xinhuanet.com/auto/2007-06/08/content_6213918.htm. Xinhuanet (2007b), Delays in the Implementation of State Phase III Vehicle Emission Standards, July 7, Available at: http://auto.sina.com.cn/news/2007-07-07/1015290457.shtml. Xinhuanet (2007c), China Auto Lies in the Turning Point of Being Environmentally-Friendly, and Energy Saving and Pollution Cutting Are Heavy Responsibility and Long Way to Go, June 9, Available at: http://auto.sina.com.cn/news/2007-06-09/0917282702.shtml. Yu, Z.F. (2006), Development and Application of Clean Coal Technology in Mainland China, in Z.X. Zhang and Y. Bor (eds), Energy Economics and Policy in Mainland China
and Taiwan, China Environmental Science Press, Beijing, pp. 67-88. Zhang, Z.X. (1999), Estimating the Size of the Potential Market for all Three Flexibility Mechanisms under the Kyoto Protocol, Prepared for the Asian Development Bank under contract TA-5592-REG, Faculty of Law and Faculty of Economics, University of Groningen, The Netherlands. Zhang, Z.X. (2000a), Can China Afford to Commit itself an Emissions Cap? An Economic and Political Analysis, Energy Economics, Vol. 22, No. 6, pp. 587-614. Zhang, Z.X. (2000b), Estimating the Size of the Potential Market for the Kyoto Flexibility Mechanisms, Weltwirtschaftliches Archiv - Review of World Economics, Vol. 136, No. 3, pp. 491-521. Zhang, Z.X. (2001), An Assessment of the EU Proposal for Ceilings on the Use of Kyoto Flexibility Mechanisms, Ecological Economics, Vol. 37, No. 1, pp. 53-69. Zhang, Z.X. (2003), Why Did the Energy Intensity Fall in China’s Industrial Sector in the 1990s?, The Relative Importance of Structural Change and Intensity Change, Energy
Economics, Vol. 25, No. 6, pp. 625-638. Zhang, Z.X. (2004), Meeting the Kyoto Targets: The Importance of Developing Country Participation, Journal of Policy Modeling, Vol. 26, No. 1, pp. 3-19. Zhang, Z.X. (2005), Sustainable Energy Development in China: Challenges Ahead to 2020, The Keynote Address at the International Conference on Staying Ahead of the Energy Scenarios, Bangkok, November 11. Zhang, Z.X. (2006a), Towards an Effective Implementation of Clean Development Mechanism Projects in China, Energy Policy, Vol. 34, pp. 3691-3701.
64

65
Zhang, Z.X. (2006b), Cutting Carbon Emissions While Making Money: A Wishful Thinking or A Win-Win Opportunity?, The Keynote Address at the Plenary Session on Making Money from Saving Carbon at the 29th International Association for Energy Economics International Conference, Potsdam, Germany, June 8-10. Zhang, Z.X. (2007a), China’s Reds Embrace Green, Far Eastern Economic Review, Vol. 170, No. 5, pp. 33-37. Zhang, Z.X. (2007b), China Is Moving away the Pattern of “Develop first and then Treat the Pollution”, Energy Policy, Vol. 35, No. 7, pp. 3547-3549. Zhang, Z.X. (2007c), China, the United States and Technology Cooperation on Climate Control, Environmental Science & Policy, Vol. 10, Nos.7&8, pp. 622-628. Zhang, Z.X. (2007d), Greening China: Can Hu and Wen Turn a Test of their Leadership into a Legacy?, Presented at the Plenary Session on Sustainable Development at the first-ever Harvard College China-India Development and Relations Symposium, New York City, March 30 – April 2. Zhang, Z.X. (2007e), China Is not a Christmas Tree to Hang Everybody’s Complaints: Putting its Energy-Saving and Pollutants-Cutting into Perspective, Invited Presentation at the Conference on China’s Environment: What Do We Know and How Do We Know It?, University of California at Berkeley, December 7-8. Zhang, Z.X. (2007f), Energy and Environmental Policy in Mainland China, The Keynote Address at the Cross-Straits Conference on Energy Economics and Policy, Organized by the Chinese Association for Energy Economics, Taipei, November 7-8. Zhang, Z.X. and L. Assunção (2004), Domestic Climate Policy and the WTO, The World
Economy, Vol. 27, No. 3, pp. 359-386. Zhang, Z.X. and A. Maruyama (2001), Towards a Private-Public Synergy in Financing Climate Change Mitigation Projects, Energy Policy, Vol. 29, No. 15, pp. 1363-1378. Zheng, X. and S. You (2007), Heat Reform in Tianjin China, Unpublished Manuscript, School of Environmental Engineering, Tianjin University, Tianjin, China.