asian insights sparx covid-19 and the energy transition
TRANSCRIPT

ed: TH/ sa: JC, PY, CS
Analyst
Suvro SARKAR +65 81893144
Jason SUM +65 66823711
Pei Hwa HO +65 6682 3714
William SIMADIPUTRA +62 2130034939
Patricia YEUNG +852 36684189
Tom LI
DBS Group Research . Equity 20 Jul 2020
Asian Insights SparX
COVID-19 and the Energy Transition Landscape Refer to important disclosures at the end of this report
Chance for Change
• Key observation – renewable energy emerges relatively unscathed from the pandemic while
other direct energy sources flounder, demonstrating its investment-worthiness.
• There is no longer any escaping the inevitable for energy industry players as
i) renewable energy is already the cheapest source of power in many countries and hence,
will be the main growth driver for the energy industry in coming years
ii) energy storage solutions are on the cusp of solving intermittency issues
iii) electrification across end-use sectors will continue to expand over the next decade, and
iv) investors are increasingly incorporating “green” features in their investment framework,
rendering access to capital difficult for those who are not aligned.
• Wait and watch for the inflection point is no longer valid. Fossil fuel plays need to adjust
business models to embrace the transition, with M&A being an important consideration.
• Policymakers globally need to take this opportunity to recalibrate their green goals as well,
though Asia has unfortunately been found wanting in this aspect so far.

Asian Insights SparX
ENERGY TRANSITION
Page 2
Contents PAGE
1. KEY OBSERVATIONS: A CHANCE FOR INDUSTRY PLAYERS TO REVAMP THEIR STRATEGIES IN A POST PANDEMIC WORLD 03
2. COVID-19 IMPACT ON DIRECT ENERGY SOURCES - RENEWABLE ENERGY GAINS MARKET SHARE AMID THE PANDEMIC 07
3. THE STARK INEVITABILITY OF RENEWABLE ENERGY IN FUTURE 20
4. TRADITIONAL ENERGY PLAYERS NEED TO DO MORE TO BENEFIT FROM THE TRANSITION 31
5. COVID-19 SHOULD BE THE IMPETUS POLICYMAKERS NEED TO TACKLE THE CLIMATE CRISIS 37
6. OTHER NEAR-TERM CHALLENGES TO THE PACE OF TRANSITION 48
7. APPENDIX 1. SURVEY – WHAT DO INDUSTRY PLAYERS THINK ABOUT THE ENERGY TRANSITION LANDSCAPE? 57
8. APPENDIX 2. RENEWABLES AS PART OF DECARBONISATION STRATEGIES OF INTERNATIONAL OIL MAJORS 64
9. APPENDIX 3. CASE STUDY – FOCUS ON INDONESIA’S STRATEGY TOWARDS ENERGY TRANSITION 67

Asian Insights SparX
ENERGY TRANSITION
Page 3
1. KEY TAKEAWAYS: A CHANCE FOR INDUSTRY PLAYERS TO REVAMP THEIR STRATEGIES IN A POST PANDEMIC WORLD
Renewable energy emerges relatively unscathed from the pandemic; time for a
rethink in investment strategies? The COVID-19 pandemic dented energy
demand severely in the first half of 2020. But while demand for traditional fossil
fuel sources like oil, coal and natural gas are headed for their worst declines in
history in 2020, renewable energy stands out as the most resilient with likely
flatline contribution to the global grid, thereby increasing its share in the overall
energy pie in most countries. The relative resilience of renewable energy could
drive investment into lower-risk lower-return business models typical of the
industry, rather than increasing exposure to more volatile market dynamics of
traditional energy sources.
COVID-19 does not need to accelerate the energy transition, it is already
inevitable. We hit the ground with a comprehensive survey of leading energy
players in Asia over the past month and asked them about their thoughts on
how they are preparing for the energy transition and whether the pandemic will
affect the momentum. While there is mixed outlook on whether COVID-19 will
accelerate the green energy transition – and we agree – it is amply clear that
unlike in the past, a big chunk of industry players in Asia are preparing for the
eventual energy transition scenario and no longer ignoring the repercussions of
not doing so. The reason why we have reached this inflection point is that over
the last decade, the world has made significant technological achievements that
puts us in a much more favourable position to enact sustainable change now:
i) Renewable energy is now a serious contender against fossil fuels, with
solar PV and onshore wind being the most affordable sources of
newbuild generation for at least two-thirds of the world population,
which accounts for 71% of global GDP and 85% of electricity
generation. The Levelised Cost of Energy (LCOE) of solar photovoltaic
system (PV) and onshore wind have fallen radically over the past decade
–by a remarkable 88% and 60% respectively. Hence, renewables are no
longer an exotic high price dream. It is mainstream and does not leave
much scope for excuses.
ii) Intermittency issues inherent in renewable generation should be resolved
in the short-to-medium term, as energy storage technology is quickly
becoming more cost competitive and durable, while vehicle-to-grid
technology would make it possible for us to tap on a burgeoning electric
vehicle fleet to store surplus electricity generated.
iii) Advancement in alternative clean fuels like hydrogen, which could
potentially come into the mainstream by 2030 timeline, and expanded
electrification across end-use sectors (beyond transportation) would spell
more trouble for fossil fuels in the longer term.
iv) With climate change risks now firmly established, there is a growing
chorus among the common people, the experts, the voters, the investors,
the corporates and increasingly, even policymakers to work towards
green and equitable economic growth.
v) Thus, green financing continues to gain momentum and corporates
globally are progressively embracing green energy to boost ESG scores,
as more investors are incorporating ESG considerations in their
investment framework. This will lead to a distinct uptrend in companies
procuring green energy for their operations, as well as companies
producing green energy for sale or captive consumption.

Asian Insights SparX
ENERGY TRANSITION
Page 4
The pandemic will provide opportunity for fossil fuel plays to change business
models to benefit from the energy transition. The long-term growth drivers for
fossil fuels like coal, oil and gas (except LNG) do not look too promising at this
point of time and returns for industry players will mainly depend on supply
discipline, which is tough to enforce in a free market, leading to wild volatility
and uncertainty from time to time. Thus, it might be sensible to diversify into
longer term stable business models, with cheap financing to boot. However, if
we focus on international oil majors, despite the expected growth in
renewables in the primary energy mix, Big Oil only spent less than 2% of its
combined budget on renewables and clean energy investments in recent years.
That too varies widely between regions, with European players leading the
charge while US oil majors remain largely pure hydrocarbon-focused
companies.
Looking forward, we observe Norwegian energy company Equinor is the only
one putting serious money into the energy transition strategy. Thus, we believe
the COVID-19 hard reset could prove to be the catalyst for oil majors to pump
more capital into renewables, acquiring assets, developing skills and nurturing
the capacity to transition beyond petroleum. They would be cutting capex
across overall investment portfolios by 20-25% owing to the fallout arising
from the COVID-19 pandemic, but this can be achieved easily without making
any cuts to renewable projects. The pandemic is creating a number of distressed
sellers and reducing acquisition costs for assets and companies, thereby creating
opportunities for Big Oil to accelerate its energy transition through acquisitions.
With deep cuts in E&P spending announced already and, in some cases,
dividends, oil majors may free up their balance sheets to ramp up their stakes in
renewable investments, facilitated by new mergers and acquisitions. This thesis
holds true not just for Big Oil but other energy companies primarily involved in
the fossil fuel value chain.
Indeed, energy industry participants in Asia are looking to invest more in
renewables, as per our proprietary survey. We also asked survey participants
about their most important sustainability initiatives, the most promising
investments in the energy value chain and about changes to their business
strategy arising from the pandemic fallout. The most prominent insights appear
to be 1) renewable power generation looks the most attractive, followed by
LNG infrastructure and upstream oil & gas at this point, and 2) investing in the
renewables/ clean tech is the key sustainability strategy and an important
business growth strategy, along with M&A activities, amid the pandemic. Both
corroborate our thesis that corporates will tend to diversify their exposure in the
renewables space in order to meet growth targets, climate change targets,
sustainability targets and retain access to financing. We will likely see higher
capex requirements from corporates to invest in or acquire capabilities in lower-
carbon solutions to adjust to the energy transitiontheme, and the financial
industry will thus play an increasingly key role here, in allocating capital to fund
these strategic initiatives.

Asian Insights SparX
ENERGY TRANSITION
Page 5
Key survey findings (details in Appendix 1)
Source: DBS Bank
What COVID-19 can achieve is changing how policy leaders react today.
COVID-19 gave us a brief glimpse of a greener world – global lockdowns and
the shutdown of fossil-fuel burning plants and factories led to clear blue skies
and markedly better air quality, even in the most polluted cities in the world.
And while we will witness the largest decline in global carbon emissions this
year – a record 8% dive in 2020 vs a 2% drop during the GFC, it will likely be
only a fleeting improvement. Even as the world grapples with one of the
steepest recessions it has ever faced in the near term, climate change, although
more gradual and less perceptible than the pandemic, could exacerbate
structural inequality and has a far more disastrous long-term impact on the
global economy. As governments around the globe dole out economic
packages to rescue their economies, well-designed stimulus measures
incentivising returns linked to lower carbon footprint and increase in green
spending are the needs of the hour. Such policies can concurrently solve the
dichotomy of economic growth and climate change concerns, and alleviate
global inequality, but the situation could take a turn for the worse from global
warming in the future, unless remedial steps are taken.
Yes52%
No48%
Do you think that COVID-19 will accelerate the green
energy transition?
0% 10% 20% 30% 40% 50% 60%
Decarbonisation through disposal of carbon-intensive assets
Investing in cleaner / renewable energy
More R&D investments for development ofnew products / services
Cost reduction through enhancement ofenergy efficiency and streamlining of supply…
Strengthening of risk management systemsand compliance of regulations
Others
Which is the most important sustainability initiative / strategy for
your company?

Asian Insights SparX
ENERGY TRANSITION
Page 6
Asia is unfortunately lagging in policy response so far. The world cannot meet
its climate change goals if Asia is not on board, as China (29%), India (7%) and
rest of Asia Pacific (15%) churn out 51% of global carbon emissions, owing to
population concentration, and higher dependence on fossil fuel. As
governments in Asia understandably focus on easing the immediate economic
fallout of the pandemic via the provision of wage subsidies, unemployment
benefits and support to the financial sector, the region is significantly behind in
embracing a “green” economic recovery. Only a few Asian countries have
declared green measures thus far, while general stimulus efforts will likely
support the current “brown” trajectories in countries without sound climate
policies. Given that non-fossil fuel jobs in the energy sector are much more
labour intensive, and employment generation is a key populist goal in many
Asian countries, we believe this is also a critical aspect for policymakers to
consider, while scripting future fiscal stimulus measures to align more closely
with climate change and the necessary energy transition objectives.
There are other near-term challenges to overcome as well, of course. Overall,
even though we believe the long-term uptrend of renewable energy
development will remain intact due to the rapidly decreasing development costs
and the unavoidable need to meet climate change and environment-related
targets for both governments and corporations, we should be aware of
accompanying risks. These include i) current pandemic-related risks -
postponement of projects, lower returns on renewables projects owing to
removal of incentives, and continuing reluctance on the part of policymakers to
effect changes, ii) renewable supply chain concentration in China, which could
lead to unwanted disruptions, iii) the lack of political will to remove fossil fuel
subsidies in many countries, which have distorted the energy sector, iv) the
manpower issues – while green energy transition is likely to lead to positive
employment effects in the longer term, in the interim, there will be supply
mismatch, lack of training facilities, possibility of pay cuts for workers switching
careers and relocation issues, and v) bottlenecks in existing energy infrastructure
which was built based to cater to the fossil fuel industry, and cannot cope with
the high growth of renewable power which is non-dispatchable. The above
challenges will lead to more grid congestion, grid reliability issues and lower-
than-expected renewables project returns.
But where there is a will, there will be a way. The crux of the matter is that
there is no longer any escaping the inevitable. The inflection point is behind us,
a wait and watch policy is no longer valid, and legacy players need to adjust
business models to embrace the transition, or risk falling behind. In addition,
policymakers globally need to take this opportunity to recalibrate their green
goals as well, particularly in Asian countries.

Asian Insights SparX
ENERGY TRANSITION
Page 7
2. COVID-19 IMPACT ON DIRECT ENERGY SOURCES – RENEWABLE ENERGY GAINS MARKET SHARE AMID THE PANDEMIC
Crude oil demand is by far the biggest casualty during 1H20, with global
demand expected to fall by 9% in 2020
• Lockdowns imposed throughout the world to curb the virus crippled
crude oil demand in 1H20, as transportation (road and jet fuels)
accounts for around 53% of global oil consumption.
• Road fuel demand has started to normalise with the lifting of
lockdowns, especially as commuters switch to private car
transportation.
• Jet fuel demand is still severely depressed, and will remain a drag, as
global commercial air traffic is likely to only reach pre-COVID-19 levels
in late 2022-2023, given significantly lower flight capacity and the
retirement of less fuel-efficient planes.
• However, the resurgence in COVID-19 cases underscores the fragility of
the recovery, as it could translate into greater-than-expected downside
for oil demand this year.
COVID-19 will have a lasting impact on oil consumption trends, though peak oil
is not quite here yet
• Oil consumption intensity is likely to decline at a faster pace over the
next few years as consumers alter their behaviour.
• Commuters in major cities like New York, Oslo, Paris and Milan, and
even Jakarta are turning to cycling to avoid public transportation.
• Proliferation of online shopping, especially for groceries during
lockdowns amid COVID-19 may have caused a permanent shift in
consumer preferences.
• Work from home and video conferences, the new normal amid COVID-
19, will likely moderate business travel and travelling to the office when
the pandemic is finally over.
Gas demand to be less affected than coal; gas and coal demand will falter due
to a sharp decline in electricity demand and industrial activity
• Global coal and natural gas demand are expected to decline by around
8% and 4% respectively, based on IEA projections; the decline in coal
consumption in 2020 would be the biggest drop since World War II,
while the reduction in gas demand in 2020 would be more than
double that of the GFC (-2% y-o-y) and the largest decline on record.
• Both coal and gas consumption will be adversely impacted by keen
competition from renewable sources, and weaker demand from the
power sector.
Asian Insights SparX
ENERGY TRANSITION
Page 8
• However, coal will fare worse than natural gas as an abundance of
natural gas has pushed gas prices to the lower end of coal-to-gas
switching range, which suggests that power generation at a less
efficient gas plant will be more affordable than at a more efficient coal
burning plant.
Renewable energy is the only energy fuel expected to see positive demand
growth in 2020
• Despite lower global electricity generation this year, renewable
generation is expected to eke out a modest 0.5% increase.
• Demand growth this year is underpinned by new projects coming on
stream during the year, coupled with renewable energy’s low operating
and maintenance costs and priority access to the grid.
• Renewables continued to exhibit resilience amid the pandemic, steadily
gaining market share in the electricity mix at the expense of traditional
fossil fuels.
• Electricity generation from renewables exceeded coal in the US for the
first time in 130 years, according to the EIA. Similarly, in Europe, the
share of variable renewables (VRE) reached a record high during the
lockdown, with VRE’s share in Germany surpassing the 90% level over
a few weeks.

Asian Insights SparX
ENERGY TRANSITION
Page 9
COVID-19 IMPACT ON CRUDE OIL
Source: BP PLC, DBS Bank
Crude oil is on course for its worst year since the Gulf War
-10.0 -8.0 -6.0 -4.0 -2.0 0.0 2.0
COVID-19 - 2020
Gulf Wars - 1980
Gulf Wars - 1981
Great Financial Crisis -2009
Arab oil embargo - 1974
Invasion of Kuwait - 1991
Asian Financial Crisis - 1998
Dotcom bubble burst - 2001
Average (1971-2019)
Change in crude oil consumption (mmbpd)

Asian Insights SparX
ENERGY TRANSITION
Page 10
COVID-19 IMPACT ON CRUDE OIL
Source: Apple Mobility Data, DBS Bank
Road transportation normalised with the easing of lockdowns; recent sharp increases could indicate shift to private transportation
0
20
40
60
80
100
120
140
160
180
Jan-20 Feb-20 Mar-20 Apr-20 May-20 Jun-20
Brazil France Germany India Japan Russia United States
7-day moving average of driving direction requests on Apple Maps (base = 13 January)

Asian Insights SparX
ENERGY TRANSITION
Page 11
COVID-19 IMPACT ON CRUDE OIL
Source: Apple Mobility Data, DBS Bank
Transit levels are trending up at a slower pace, but remain depressed in countries with rising new COVID-19 cases
0
20
40
60
80
100
120
140
160
Jan-20 Feb-20 Mar-20 Apr-20 May-20 Jun-20
Brazil France Germany Japan Taiwan United States
7-day moving average of transit direction requests on Apple Maps (base = 13 January)

Asian Insights SparX
ENERGY TRANSITION
Page 12
COVID-19 IMPACT ON CRUDE OIL
Source: TomTom Data, DBS Bank
Road congestion levels at most major cities are still below pre-COVID levels, suggesting that road activity has some way to go
0%
10%
20%
30%
40%
50%
60%
We
ek 1
We
ek 4
We
ek 7
We
ek 1
0
We
ek 1
3
We
ek 1
6
We
ek 1
9
We
ek 2
2
We
ek 2
5
We
ek 2
8
New Delhi
Lockdownperiod
Average congestion
0%
10%
20%
30%
40%
50%
60%
We
ek 1
We
ek 4
We
ek 7
We
ek 1
0
We
ek 1
3
We
ek 1
6
We
ek 1
9
We
ek 2
2
We
ek 2
5
We
ek 2
8
BeijingAverage congestion
0%
10%
20%
30%
40%
50%
60%
Week 1
Week 4
Week 7
Week 1
0
Week 1
3
Week 1
6
Week 1
9
Week 2
2
Week 2
5
Week 2
8
ParisAverage congestion
0%
10%
20%
30%
40%
Week 1
Week 4
Week 7
Week 1
0
Week 1
3
Week 1
6
Week 1
9
Week 2
2
Week 2
5
Week 2
8
Berlin
Lockdownperiod
Average congestion
0%
10%
20%
30%
40%
50%
60%
Week 1
Week 4
Week 7
Week 1
0
Week 1
3
Week 1
6
Week 1
9
Week 2
2
Week 2
5
Week 2
8
MoscowAverage congestion
0%
10%
20%
30%
40%
Week 1
Week 4
Week 7
Week 1
0
Week 1
3
Week 1
6
Week 1
9
Week 2
2
Week 2
5
Week 2
8
New YorkAverage congestion

Asian Insights SparX
ENERGY TRANSITION
Page 13
COVID-19 IMPACT ON CRUDE OIL
Flight activity is inching up globally, but continues to be considerably below pre-COVID levels
-100%
-90%
-80%
-70%
-60%
-50%
-40%
-30%
-20%
-10%
0%
0.0
0.5
1.0
1.5
2.0
2.5
3.0
USA
2020 2019 y-o-y decline (RHS)
Traveller throughput 7-day movingaverage (millions)
-100%
-90%
-80%
-70%
-60%
-50%
-40%
-30%
-20%
-10%
0%
0.0
5.0
10.0
15.0
20.0
25.0
30.0
35.0
40.0
Europe
2020 2019 y-o-y decline (RHS)
Total flights 7-daymoving average ('000s)
0
2,000
4,000
6,000
8,000
10,000
12,000
14,000
16,000
18,000
China
Domestic International
Flight departures 7-day moving average ('000s)
Source: BloombergNEF, DBS Bank

Asian Insights SparX
ENERGY TRANSITION
Page 14
COVID-19 IMPACT ON COAL
China climbs out of the abyss; coal consumption plummeted amid displacement by other fuels and a stark decline in electricity generation
-30%
-20%
-10%
0%
10%
0
100
200
300
400
500
600
700
Jan-20 Feb-20 Mar-20 Apr-20 May-20
China
6 Major Coal Power Plants Weekly Burn y-o-y change (RHS)
'000 metric tons
-10.0%
0.0%
10.0%
20.0%
1,550
1,600
1,650
1,700
1,750
1,800
1,850
Jan-20 Feb-20 Mar-20 Apr-20 May-20 Jun-20
India
Daily Coal Requirement y-o-y change (RHS)
'000 metric tons
-35%
-30%
-25%
-20%
-15%
-10%
-5%
0%
20,000
25,000
30,000
35,000
40,000
Jan-20 Feb-20 Mar-20 Apr-20 May-20 Jun-20
US
Coal Consumption y-o-y change (RHS)
'000 metric tons
-50%
-40%
-30%
-20%
-10%
0%
15,000
18,000
21,000
24,000
27,000
30,000
33,000
36,000
Jan-20 Feb-20 Mar-20 Apr-20 May-20 Jun-20
Europe
Coal Power Generation y-o-y change
GWh
Source: Bloomberg Finance L.P., DBS Bank

Asian Insights SparX
ENERGY TRANSITION
Page 15
COVID-19 IMPACT ON COAL
Coal import levels in other countries paint a consistent story
10,000
12,000
14,000
16,000
18,000
Jan Feb Mar Apr May June
Japan
2018 2019 2020
Coal imports ('000 tons)
6,000
7,000
8,000
9,000
10,000
11,000
Jan Feb Mar Apr May June
South Korea
2018 2019 2020
Coal imports ('000 tons)
3,000
3,500
4,000
4,500
5,000
5,500
6,000
Jan Feb Mar Apr May June
Taiwan
2018 2019 2020
Coal imports ('000 tons)
0
500
1,000
1,500
2,000
2,500
Jan Feb Mar Apr May June
Philippines
2018 2019 2020
Coal imports ('000 tons)
0
1,000
2,000
3,000
4,000
5,000
Jan Feb Mar Apr May June
Turkey
2018 2019 2020
Coal imports ('000 tons)
0
500
1,000
1,500
2,000
2,500
Jan Feb Mar Apr May June
Brazil
2018 2019 2020
Coal imports ('000 tons)
Source: Bloomberg Finance L.P., DBS Bank
Asian Insights SparX
ENERGY TRANSITION
Page 16
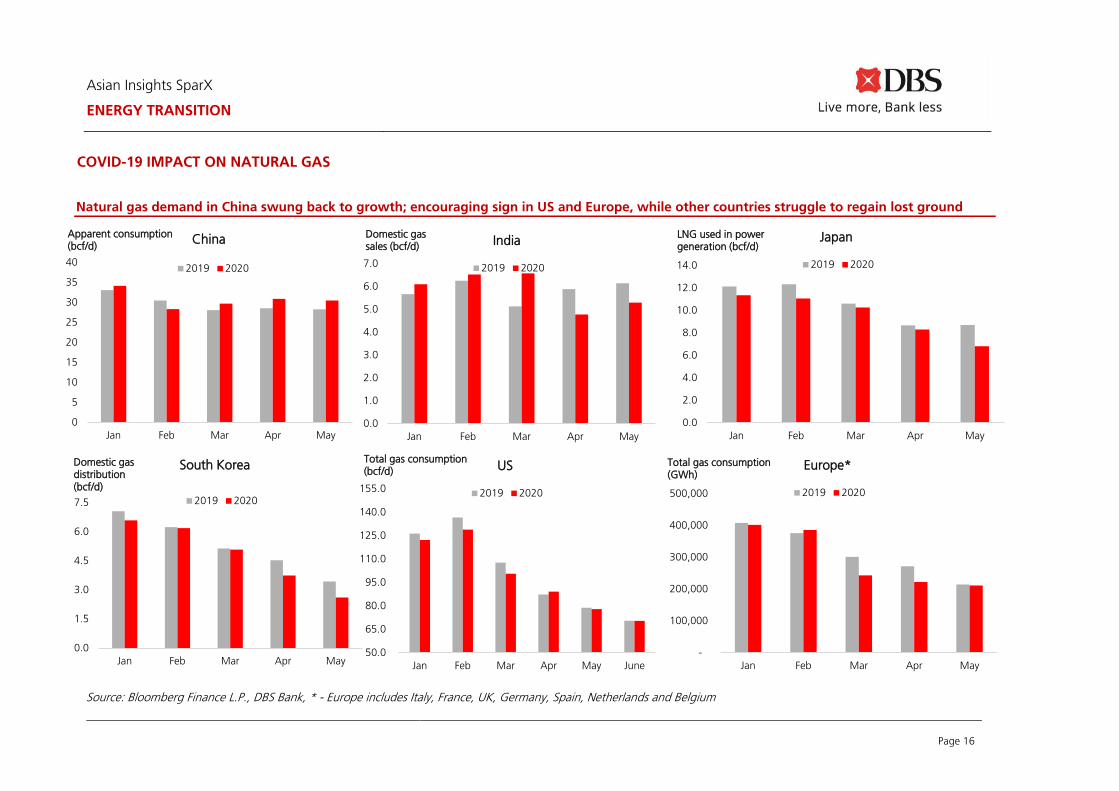
COVID-19 IMPACT ON NATURAL GAS
Natural gas demand in China swung back to growth; encouraging sign in US and Europe, while other countries struggle to regain lost ground
0
5
10
15
20
25
30
35
40
Jan Feb Mar Apr May
China
2019 2020
Apparent consumption (bcf/d)
0.0
1.0
2.0
3.0
4.0
5.0
6.0
7.0
Jan Feb Mar Apr May
India
2019 2020
Domestic gas sales (bcf/d)
0.0
2.0
4.0
6.0
8.0
10.0
12.0
14.0
Jan Feb Mar Apr May
Japan
2019 2020
LNG used in power generation (bcf/d)
Source: Bloomberg Finance L.P., DBS Bank, * - Europe includes Italy, France, UK, Germany, Spain, Netherlands and Belgium
-
100,000
200,000
300,000
400,000
500,000
Jan Feb Mar Apr May
Europe*
2019 2020
Total gas consumption(GWh)
0.0
1.5
3.0
4.5
6.0
7.5
Jan Feb Mar Apr May
South Korea
2019 2020
Domestic gas distribution (bcf/d)
50.0
65.0
80.0
95.0
110.0
125.0
140.0
155.0
Jan Feb Mar Apr May June
US
2019 2020
Total gas consumption (bcf/d)

Asian Insights SparX
ENERGY TRANSITION
Page 17
COVID-19 IMPACT ON NATURAL GAS
Rising LNG imports, coupled with weak demand led to record-high gas storage levels in Europe
0
10
20
30
40
50
60
70
80
90
100
Jan Feb Mar Apr May June July Aug Sep Oct Nov Dec
2015-2018 range 2019
5-year average 2020
% fullNatural Gas Storage Utilisation
20
30
40
50
60
70
80
Jan Feb Mar Apr May June July Aug Sep Oct Nov Dec
2015-2018 range 2019
5-year average 2020
% fullLNG Storage Utilisation
2
3
4
5
6
7
8
9
10
Jan Feb Mar Apr May June July Aug Sep Oct Nov Dec
LNG Imports
2015-2019 range 5-year average
2019 2020
Mn tons
Source: Bloomberg Finance L.P., DBS Bank

Asian Insights SparX
ENERGY TRANSITION
Page 18
COVID-19 IMPACT ON RENEWABLE ENERGY
Electricity demand among the selected countries fell by 5-10% in 1H20
300
350
400
450
500
550
Jan
Feb
Mar
Apr
May
June
July
US Electricity Demand (7-day rolling)
2019 2020
GW
45
50
55
60
65
70
75
80
Jan
Feb
Mar
Apr
May
June
July
Brazil Electricity Demand (7-day rolling)GW
60
70
80
90
100
110
120
130
Jan
Feb
Mar
Apr
May
June
July
Japan Electricity Demand (7-day rolling)GW
40
45
50
55
60
65
Jan
Feb
Mar
Apr
May
June
July
Germany Electricity Demand (7-day rolling)
2019 2020
GW
20
25
30
35
40
Jan
Feb
Mar
Apr
May
June
July
UK Electricity Demand (7-day rolling)GW
35
45
55
65
75
85
Jan
Feb
Mar
Apr
May
June
July
France Electricity Demand (7-day rolling)GW
Source: BloombergNEF, DBS Bank

Asian Insights SparX
ENERGY TRANSITION
Page 19
COVID-19 IMPACT ON RENEWABLE ENERGY
Renewable energy demonstrated the most resilience, garnering market share away from traditional fossil fuels
23% 25%28% 27%
0%
15%
30%
45%
60%
75%
0 1 2 3 4
Month(s) into 2020
China Electricity MixCoal
Renewables
Nuclear
Gas
17% 18%17% 17% 17% 19%
22% 22% 25% 24%28%
0%
15%
30%
45%
60%
75%
90%
0 3 6 9 12 15 18 21
Week(s) into 2020
India Electricity Mix
Coal
Renewables
Nuclear
Gas & oil
38%
44% 45% 46% 47%44%
0%
10%
20%
30%
40%
50%
0 1 2 3 4 5 6Month(s) into 2020
Europe* Electricity MixCoal
Renewables
Nuclear
Gas
Others
19%21% 21%
23% 24%21%
0%
10%
20%
30%
40%
50%
0 1 2 3 4 5 6Month(s) into 2020
US Electricity MixCoal
Renewables
Nuclear
Gas
Others
Source: BloombergNEF, EIA, DBS Bank, * - Europe includes Italy, France, UK, Germany, Spain, Netherlands and Belgium

Asian Insights SparX
ENERGY TRANSITION
Page 20
3. THE STARK INEVITABILITY OF RENEWABLE ENERGY IN FUTURE
Renewable energy is now a serious contender against coal and natural gas;
energy storage technology is quickly becoming more cost-competitive
• The Levelised Cost of Energy (LCOE) of solar photovoltaic system (PV) and
onshore wind have fallen radically over the past decade – based on
estimates by BNEF, global LCOE benchmarks for PV and onshore wind
decreased by a remarkable 88% and 60% from 2H09 to 1H20.
• PV and onshore wind are now the cheapest source of new bulk power
generation in countries that account for 72% of global GDP and 85% of
electricity demand – IRENA estimates that on average, it is cheaper to build
new PV and onshore wind power than continue operating many existing
coal plants. This is substantiated by analysis in a report by the Rocky
Mountain Institute and Carbon Tracker Initiative, which expects the share
of uncompetitive coal plants worldwide to rise to 60% in 2022 and 73% in
2025, from 39% in 2019.
• Costs for battery storage technology declined at a faster pace relative to
renewables – LCOE for a utility-scale battery (4-hour duration) was at
US$150/MWh in 1H20, down 81% from end-2H12. Additionally, it is
already cheaper to install a battery than open-cycle gas turbines and gas-
reciprocating plants in major gas importing regions like Europe, China and
Japan.
• There is scope for further cost reductions as the world continues to learn,
innovate and scale – IRENA projects central LCOE of PV and onshore wind
to see reductions of 58% and 25% respectively between 2018 and 2030.
Offshore wind, while not quite as cost-efficient as traditional fossil fuels
now, will be on par with them by the late 2020s; LCOE of offshore wind is
expected to drop by 55% from 2018-2030.

Asian Insights SparX
ENERGY TRANSITION
Page 21
RENEWABLE ENERGY IS NOW THE CHEAPEST SOURCE OF ENERGY IN MANY PARTS OF THE WORLD
Source: BloombergNEF, DBS Bank
Note: Country borders on maps may be an approximation and do not represent the opinion of the analyst(s) or of DBS Bank Ltd.
Most affordable source of energy by country

Asian Insights SparX
ENERGY TRANSITION
Page 22
CURRENT LCOE OF RENEWABLES IS VASTLY LOWER THAN IT WAS BACK IN THE GFC (2009)
Source: BloombergNEF, DBS Bank
0
100
200
300
400
500
600
700
800
900
2H 2009 2H 2010 2H 2011 2H 2012 2H 2013 2H 2014 2H 2015 2H 2016 2H 2017 2H 2018 2H 2019
Fixed-axis PV
Tracking PV
Onshore wind
Offshore wind
Utility-scale battery (4h)
US$/MWh (real 2019)
Fossil Fuel Range
Historical LCOE of renewables and utility-scale batteries

Asian Insights SparX
ENERGY TRANSITION
Page 23
BATTERY STORAGE STILL HAS SOME WAY TO GO THOUGH
There have been increasing discussions on the possible adoption of a
decentralised power or renewable power system with power storage as a key
solution. Currently, utility-scale battery storage systems are being deployed in
Australia, Germany, Japan, UK, the US and some other European countries. In
the US, a 4MW/40MWh battery storage system is able to reduce almost 400
hours of congestion in the power grid and save up to US$2.03m in fuel costs. It
is also perceived as a solution for peak-shaving. IRENA is projecting energy
storage deployment in emerging markets to increase by over 40% annually
until 2025. By 2030, small-scale battery storage is expected to increase
significantly.
However, issues with battery storage systems remain. Some of the major
problems include:
• Investment returns: This is one of the major concerns. Although LCOE for
battery storage has been dropping fast (see chart below), large-scale
battery storage systems have been deployed mainly as a replacement for
high-cost diesel or where electricity prices are high. In countries with low
electricity prices or narrow differentials in peak-hour and off-peak-hour
electricity prices, investment returns for battery storage systems could be
marginal.
• Storage limitations: Lithium-ion batteries have limits in terms of the amount
of energy they can store.
• Environmental and socio-political concerns: There are increasing concerns
about the environmental costs of mining lithium, recycling or disposal of
expired battery packs and the use of child labour in the cobalt industry in
the Democratic Republic of the Congo.
• Safety issues: Some high-profile safety-related issues in recent years
concerning battery storage have alarmed industry observers. These include
the explosion at the Arizona Public Service facilities in April 2019 and
multiple incidents of storage-related fires in South Korea.
Lithium-ion battery price trends
Source: BloombergNEF, DBS Bank
-
200
400
600
800
1,000
1,200
1,400
2010 2011 2012 2013 2014 2015 2016 2017 2018 2019
US$/kWh

Asian Insights SparX
ENERGY TRANSITION
Page 24
ADVANCEMENTS IN OTHER ALTERNATIVE CLEAN FUELS CONTINUES
Improvement in alternative clean fuels technology like hydrogen, coupled with
expanded electrification across end-use sectors spell even more trouble for
fossil fuels in the longer term
• Similar to renewable energy, the cost of renewable (green) hydrogen
from electrolysis plunged by 60% between 2010 and 2020 to around
US$4/kg today – hydrogen is already cost-competitive in a few
applications, like serving as a feedstock for the production of ammonia
and methanol, in refining, and as a fuel for space-heating in regions
where heat pumps are predominant. A paper by the Hydrogen Council
shows that green hydrogen costs are projected to fall by an additional
60% by end-2030, which will enable it to become viable in more
applications like trucks, buses, taxis likely by the 2030 timeframe.
• The production cost of electric vehicles (EVs) declined considerably
from 2010-2019 on the back of an 87% drop in lithium-ion battery
prices; BNEF expects EVs to reach price-parity without subsidies for
internal combustion vehicles by the mid-2020s.
• Accordingly, passenger EV sales is projected to skyrocket to 54m units
in 2040, from an expected 1.7m units in 2020, or at a 20% CAGR
during the period; commercial EV sales are anticipated to grow at an
even faster CAGR of 24% during the period.
• The sheer growth in EV deployment can greatly augment power grid
flexibility by becoming grid-storage units and reduce curtailment by
regulating electricity demand via smart charging.
• Apart from the electrification of the global vehicle fleet, the
electrification of buildings is a feasible route today because there are
viable and more efficient substitutes to conventional equipment that
are powered by fossil fuels. Heat pumps can replace furnaces or boilers
to heat homes and water, while gas-powered ovens and burners can
be replaced with electric ranges and induction cooktops – BNEF
believes that more than half of energy consumed by buildings in
countries like the UK and Germany could be electrified by 2050.

Asian Insights SparX
ENERGY TRANSITION
Page 25
HYDROGEN ENERGY COULD BE ON THE CUSP OF MAINSTREAM ADOPTION ACROSS VAROUS SECTORS BY 2025-2030
Source: Hydrogen Council
Time line of hydrogen’s viability across different segments

Asian Insights SparX
ENERGY TRANSITION
Page 26
INTRODUCTION OF ELECTRIC VEHICLE-FRIENDLY POLICIES TODAY COULD ACCELERATE ITS GROWTH
Source: BloombergNEF, DBS Bank
BNEF projected global sales of passenger and commercial vehicles
0%
5%
10%
15%
20%
25%
30%
0
5,000
10,000
15,000
20,000
25,000
30,000
35,000
2019 2022 2025 2028 2031 2034 2037 2040
Global commercial vehicle sales
Other FCV
NGV PHEV
BEV Diesel and gasoline vehicles
EV % share (RHS)
'000 units
0%
10%
20%
30%
40%
50%
60%
70%
0
20,000
40,000
60,000
80,000
100,000
120,000
2019 2022 2025 2028 2031 2034 2037 2040
Global passenger vehicle sales
BEV FCV ICE PHEV EV % share (RHS)
'000 units

Asian Insights SparX
ENERGY TRANSITION
Page 27
GREEN FINANCING CONTINUES TO GAIN MOMENTUM
Green financing is likely to continue gaining momentum; corporates globally are
increasingly embracing green energy to boost ESG scores
• Available financing for fossil fuel companies is likely to become scarcer
as investors are increasingly incorporating ESG considerations in their
investment framework; corporates are securing more green energy for
their operations globally.
• According to estimates by the Global Sustainable Investment Alliance,
around US$30.7tn of funds were held in sustainable assets in 2018,
(more than double the amount [US$13.6tn] in 2012), representing
33.3% of total AUM in that year.
• Sustainable debt issuance soared to US$478bn in 2019, from
US$40.5bn in 2014, for an implied 64% CAGR during the period.
• 1,240 institutions including sovereign wealth funds, insurance
companies, pension funds, representing more than US$14.1tn in value
(up from US$52bn in 2014) have pledged to divest from fossil fuels.
• Climate Action 100+, an investor initiative aimed at keeping the world’s
largest greenhouse gas emitters in check, has grown to 450 investors
with over US$40tn in AUM today, from 225 investors with US$26.3tn in
2017.
• There is a distinct uptrend in companies procuring green energy for
their operations - cooperations globally bought 19.6GW of clean energy
in 2019, up 44.1% from 2018, with a total of 52.4GW of clean energy
bought between 2009 and 2019.

Asian Insights SparX
ENERGY TRANSITION
Page 28
THERE IS A SEISMIC SHIFT TOWARDS SUSTAINABLE INVESTING
Source: Global Sustainable Investment Alliance, 350.Org, DBS Bank
Sustainable assets AUM and share of total assets across regions (2018) AUM of institutions committed to divesting fossil fuels
0%
10%
20%
30%
40%
50%
60%
70%
0.0
2.0
4.0
6.0
8.0
10.0
12.0
14.0
16.0
Europe US Japan Canada Aus/NZ
Sustainable assets (LHS) % of total managed assets in country/region
AUM (US$tn)
0.0
2.0
4.0
6.0
8.0
10.0
12.0
2014 2015 2016 2017 2018 2019
AUM (US$tn)

Asian Insights SparX
ENERGY TRANSITION
Page 29
SUSTAINABLE DEBT ISSUANCE IS GOING THROUGH THE ROOF
Source: BloombergNEF, DBS Bank
0
100
200
300
400
500
600
2009 2010 2011 2012 2013 2014 2015 2016 2017 2018 2019
Green Sustainability-linked Sustainability Social
Amount (US$bn)
Growth of sustainable debt from 2009-2019

Asian Insights SparX
ENERGY TRANSITION
Page 30
CORPORATES WANT TO HARNESS CLEAN ENERGY, PPA VOLUMES UNDERPINNED BY TECHNOLOGY GIANTS
Historical growth in corporate PPAs signed by region Corporate PPA composition by company
Others, 27.6
Source: BloombergNEF, DBS Bank
0.0
2.0
4.0
6.0
8.0
10.0
12.0
14.0
16.0
18.0
20.0
2014 2015 2016 2017 2018 2019
America EMEA APAC
MW

Asian Insights SparX
ENERGY TRANSITION
Page 31
4. TRADITIONAL ENERGY PLAYERS NEED TO DO MORE TO BENEFIT FROM THE TRANSITION – FOCUS ON OIL MAJORS
Despite the expected growth in renewables in the primary energy mix, “big oil”
only spent only around 1-1.5% of its combined budget on renewables and
clean energy investments in recent years. That too varies widely between
regions, with European players leading the charge. Royal Dutch Shell, Total, BP,
Eni, and Equinor are among the oil majors that have embarked on their
transition from oil companies to energy companies while US oil majors such as
ExxonMobil, Chevron, and ConocoPhillips largely remain pure hydrocarbon-
focused companies. Smaller European oil players such as Repsol and GALP have
embraced renewables to a larger degree.
Still figuring out the best approach. As oil majors progressively position
themselves for the energy transition, wind and solar are playing an increasingly
important role in the energy industry. However, strategies in this regard are still
quite nascent. Oil firms are still trying to figure out how their current cash cows
can be replaced for the benefit of their own sustainable future.
Why do oil majors need to take energy transition into account in their future
capital investment and growth strategy?
• Mix of primary energy consumption to swing towards renewables
inevitably by 2030 and limit growth options in traditional fossil fuels
industry, and oil majors will need to take this into account while
thinking about returns to stakeholders.
• Globally growing concerns about climate change following the Paris
Agreement provides the main drive for such strategies to hedge against
hardening investor sentiment towards carbon emissions.
• Available financing for fossil fuel companies are likely to become
scarcer as investors are increasingly incorporating ESG considerations in
their investment framework; corporates are securing more green
energy for their operations.
National oil companies (such as Petrobras, Pemex, Lukoil and Chinese majors)
are constrained by stringent government policies and regulatory frameworks.
Among the national companies, Saudi Aramco leads the way with its US$200bn
partnership with Softbank in solar energy. More broadly, Saudi Arabia recently
tripled its renewable energy target and the UAE government launched its
‘Energy Plan 2050’, aiming to cut carbon dioxide emissions by 70% and
improve energy efficiency by 40%. Overall, we believe international oil majors
will have more leeway to adjust to the changing normal.

Asian Insights SparX
ENERGY TRANSITION
Page 32
Overall capex trends by oil majors
Total Capex
US$ bn 2014 2015 2016 2017 2018 2019 2020E
BP 23.3 18.0 18.4 16.5 15.1 15.2 15.5
Chevron 40.3 34.0 22.4 18.8 19.5 20.2 20.0
Exxon 38.5 31.1 19.3 23.1 25.9 31.1 34.0
Shell 44.8 33.9 25.6 23.4 23.8 25.6 25.0
Total 26.4 23.0 17.5 14.4 12.4 14.0 14.5
Equinor 19.6 14.7 10.1 9.4 9.9 10.0 10.5
Eni 15.0 12.0 10.4 10.1 10.1 8.8 9.0
ConocoPhillips 11.5 10.1 4.9 4.5 6.1 6.3 6.5
Global Oil Majors 219.4 176.7 128.6 120.2 122.8 131.3 135.0
Source: Companies, DBS Bank
Estimated renewables spending trends by oil majors as % of total capex
Renewables Capex
US$ m 2014 2015 2016 2017 2018 2019 2020E
BP 1.6% 2.3% 0.7% 0.4% 0.2% 0.9% 1.2%
Chevron 0.1% 0.1% 0.0% 0.0% 0.0% 0.0% 0.0%
Exxon 0.0% 0.0% 0.0% 0.0% 0.0% 0.0% 0.0%
Shell 0.1% 0.2% 0.2% 0.2% 0.1% 0.2% 1.4%
Total 1.3% 2.6% 4.3% 6.3% 5.1% 2.9% 2.4%
Equinor 0.0% 0.0% 0.5% 1.9% 0.2% 0.5% 0.4%
Eni 0.0% 0.0% 0.4% 0.4% 0.2% 2.1% 2.0%
ConocoPhillips 0.0% 0.0% 0.0% 0.0% 0.0% 0.0% 0.0%
Global Oil Majors 0.3% 0.7% 0.8% 1.0% 0.6% 0.8% 1.0%
Source: Companies, Rystad Energy, DBS Bank

Asian Insights SparX
ENERGY TRANSITION
Page 33
As evident from the above, global oil majors can be grouped into two main
categories:
1) Renewable leaders/energy transition companies: Royal Dutch Shell, Total, BP,
Eni, Equinor; and
2) Renewable energy laggards with rather pure hydrocarbon focus and low
activity in terms of renewable strategy: ExxonMobil, Chevron, ConocoPhillips.
There appears to be a strong negative correlation between the oil majors’
proved oil reserves and their renewable energy strategies. Oil majors with
smaller levels of proved oil reserves are moving into the renewable space faster,
whereas those companies with large pools of oil reserves are rather choosing
the strategy to progress at a more moderate speed, with BP being the outlier.
We take a more detailed look at their respective strategies in the following
section.
Summary and brief comparison of oil majors’ strategies so far for the renewables space (more details in Appendix 2)
Shell BP ExxonMobil Chevron TOTAL Eni Equinor ConocoPhillips
Formally articulated renewables
strategy
Yes Yes No No Yes Yes Yes No
Focused renewables division Yes Yes No No Yes Yes Yes No
Renewables capex indicative
annual plan (US$ bn)
~1.0 ~0.5 0 0 ~0.5 ~0.3 1.0-1.5 0
Currently invested in:
Solar Yes Yes No Yes Yes Yes Yes No
Wind Yes Yes No Yes Yes Yes Yes No
Biofuels Yes Yes Yes No Yes Yes No No
Hydro No No No No Yes No No No
Carbon Capture Yes Yes Yes Yes Yes Yes Yes Yes
Energy Storage/ EV Charging Yes Yes No No Yes No Yes No
Renewables focused venture
capital division
Yes Yes No Yes Yes Yes Yes No
Note: The table is meant for illustration of strategic bend and is not an exhaustive list of low carbon solutions/ renewables/ clean tech/ decarbonisation strategies by oil majors
Source: DBS Bank estimates based on our analysis and understanding of public information released by companies mentioned above

Asian Insights SparX
ENERGY TRANSITION
Page 34
A detailed reading of the strategies and trends outlined above reveals that:
• Of the eight oil majors under consideration, five have made reasonable
investments in renewable energy - BP, Shell, TOTAL, Equinor, Eni.
• Notably, all oil majors except ExxonMobil and ConocoPhillips have
developed or are developing solar and wind assets, whereas none of
the oil majors are investing in geothermal energy.
• Hydro power activities are rather limited with only Total having
exposure.
• Biofuels and carbon capture are well represented.
• Energy storage is an increasingly active sector in line with the expected
rise in the penetration of electric vehicles.
• Six out of eight oil majors (Shell, Chevron, TOTAL, BP, Eni, Equinor)
have created a renewable venture capital fund to invest in emerging
renewable technologies and innovative renewables start-ups.

Asian Insights SparX
ENERGY TRANSITION
Page 35
WHAT DOES THE FUTURE LOOK LIKE FOR OIL MAJORS’ RENEWABLE SPENDING?
Projections for capital expenditure on renewables among oil majors in next 5-10 years
Source: Rystad Energy, DBS Bank
Investments in solar and wind energy projects by the world’s oil majors over the
next five years are expected to reach US$17.5bn, according to a Rystad Energy
study. However, the total renewables capex tally of oil majors pales in
comparison to the US$166bn they are forecast to spend on greenfield oil and
gas projects during the same period.
Of the total forecast capex, just one company, Equinor, accounts for the lion’s
share or close to 60% of the projected amount over the next five years, thus
making it the only one putting serious money into the energy transition
strategy. Equinor, the Norwegian state-controlled energy giant, will drive
renewable investment among majors, spending U$6.5bn over the next three
years to build its capital-intensive offshore wind portfolio. We do not expect this
forecast to be heavily affected by the fluctuating oil price or capex cuts, as
much of the company’s renewable portfolio is already committed, such as the
massive Dogger Bank offshore wind project in the UK.
0
1,000
2,000
3,000
4,000
5,000
6,000
2021 2022 2023 2024 2025 2026 2027 2028 2029 2030
Project-specific renewable investments among oil majors
BP ENI GALP Repsol Shell TOTAL Equinor
US$ m

Asian Insights SparX
ENERGY TRANSITION
Page 36
If Equinor is removed from the equation, investments in renewables by major
oil and gas companies would be seen in a very different light, falling over the
next three years. This decline does not even factor in any of the recent capex
cuts announced by the majors. With the notable exceptions of Equinor and
Portuguese player GALP, the investments in renewables by the other oil giants
will not even match the typical capex requirements of a single oil and gas field
in their respective portfolios.
Barriers to further investment in renewables faced by international oil majors:
• Lack of track record and competition from entrenched and full-fledged renewable energy firms which have scale in the business may limit growth options
• Technology obsolescence risks: oil majors have had their hands burnt in the past and have had to write down investments in nascent technologies which
did not realise their full potential
• Changing regulations in renewables market, especially with respect to subsidies and feed-in tariffs create uncertainties for new investors
• Lower returns in the power sector compared to high-risk high-return nature of the fossil fuel business may not fit in to all business models
Can the oil majors think any differently now after the pandemic? M&A will be the way to go from hereon…
• Oil majors would be cutting capex across overall investment portfolios by 20-25%, owing to fallout caused by the COVID-19 pandemic, but this can be
achieved easily without any cuts to renewable projects.
• COVID-19 could also be the catalyst for oil majors to pump more capital into renewables, acquire assets, develop skills and nurture the capacity to
transition beyond petroleum.
• The pandemic is creating a number of distressed sellers and reducing acquisition costs for assets and companies, thereby creating opportunities for oil
majors to accelerate their energy transition through acquisitions.
• With deep cuts in E&P spending already announced and in some cases, dividends, oil majors may free up their balance sheet to ramp up their stakes in
renewable investments, facilitated by new mergers and acquisitions.

Asian Insights SparX
ENERGY TRANSITION
Page 37
5. COVID-19 SHOULD BE THE IMPETUS POLICYMAKERS NEED TO TACKLE THE CLIMATE CRISIS
• There is a growing chorus among policymakers for a green and
equitable recovery, including the UN, the UK, South Korea, Germany,
Austria and Switzerland.
• And investors and corporates. Other important groups share similar
sentiments – in the US, more than 300 companies with combined
market valuation of US$11.5tn are calling on the US Congress to
incorporate climate action in recovery packages. In Europe, investors
managing more than US$12tn of assets are calling for a recovery plan
to be tied to climate goals.
• And voters. Ipsos conducted a survey on climate change involving
28,000 adults which found that the mass population (71%) felt that
climate change in the long-term is as serious a crisis as COVID-19 –
additionally, 65% of respondents showed their preference for a ‘green’
economic recovery, and 57% of them shared that they will be less
inclined to vote for a political party that fails to take climate change
seriously.
• Not reflected yet in economic packages. The vast majority of stimulus
packages introduced thus far have understandably been directed at
easing the immediate economic fallout via the provision of wage
subsidies, unemployment benefits and support to cooperations.
• With the exception of Europe. However, Europe stands out from the
rest of the regions, with a 0.57 green-to-brown spending ratio
(US$0.57 of green spending for every dollar of brown spending), while
Asia is significantly behind at a miniscule 0.01 – only a few Asian
countries have declared green measures thus far. South Korea has
announced commendable stimulus plans with climate objectives.
Although China is not spending on pollution-heavy activities like it did
back in 2009, its comparatively brown sector base and weak
environment policy means that general stimulus efforts will likely
support its current brown trajectory.
• Asian countries may need to do more. Whether COVID-19 marks an
inflection point in the war against climate change hinges on Asia’s
response though. Asia Pacific accounted for more than 50% of global
carbon emissions in 2019, with China and India collectively accounting
for around 33% of global emissions. Hence, progress on climate
change will be stifled unless there are concerted efforts involving Asia.
Although majority of fiscal stimulus in the region thus far is ‘colourless’
(maintaining the current status quo), such flows will likely support a
status quo that is skewed towards adverse climate outcomes. As
governments in the region mull additional stimulus packages to revive
the economy, we are hopeful that they will align fiscal spending with
climate objectives to forge a more sustainable future.

Asian Insights SparX
ENERGY TRANSITION
Page 38
ONLY US$54BN OUT OF US$11TN OF TOTAL STIMULUS MEASURES ARE IDENTIFIED TO BE GREEN THUS FAR
Source: BloombergNEF, DBS Bank
Green and brown stimulus as a share of GDP by region
• IMF estimates that governments around
the world had announced close to
US$11tn of stimulus policies as at early
July. Based on BNEF’s green policy tracker,
we estimate that most of the announced
stimulus thus far are colourless (carbon-
neutral), while around 6.0% of the
quantum are brown (likely to increase
carbon emissions) in nature, which is
more than 10x the amount dedicated to
green measures.
• Europe continues to dominate in green
policy response, with Germany unveiling a
stimulus package worth US$44bn
earmarked for climate-related spending in
June. Over in Asia, South Korea is leading
the way, while other Asian nations are
largely behind. EU leaders are still
finalising a herculean US$2.1tn budget,
of which 25% (US$522bn) will be climate
related.
Asia
Oceania
EUOther EuropeMid-East &
Africa
North AmericaLatin America
-0.2%
0.0%
0.2%
0.4%
0.6%
0.8%
0.0% 0.1% 0.2% 0.3% 0.4% 0.5% 0.6% 0.7% 0.8%
Green stimulus as a share of GDP
Brown stimulus as a share of GDP
Bubble size = volume of GDP
($ billion)

Asian Insights SparX
ENERGY TRANSITION
Page 39
ONLY US$54BN OUT OF US$11TN OF TOTAL STIMULUS MEASURES ARE IDENTIFIED TO BE GREEN THUS FAR
Breakdown of green stimulus (potential to reduce long-run emissions) by sector and country
• More than a third of green spending are to be spent on electrified transportation - Germany is doubling subsidies for electric and hybrid car purchases, from €3,000
to €6,000, until the end of 2021 and mandating all petrol stations to offer EV charging points, while much of the US$8.9bn stimulus extended to the French
transportation sector includes increasing subsidies for EVs until December. China is extending EV car subsidies and tax breaks for New Energy Vehicles by two years
until the end of 2022 and has laid out plans to expand the country’s charging network by 50% in 2020.
• Hydrogen energy has also been prominent in stimulus packages, representing around 20% of green spending tracked by BNEF. Apart from Germany which has
pledged to spend US$7.9bn to boost domestic hydrogen production, transport and use, South Korea has announced that it will increase spending and promote
financing on hydrogen infrastructure as part of the green new deal. Meanwhile in Australia, the Clean Energy Finance Corporation and Australian Renewable Energy
Agency have committed US$189m and US$44m respectively to support funding for the hydrogen sector.
• Other promising sectors include energy efficiency, such as Denmark’s proposed funding for green renovations to social housing, which includes replacing heating
systems that run on fossil fuels, and carbon & climate, which includes carbon capture and storage technology, etc.
Source: BloombergNEF, DBS Bank

Asian Insights SparX
ENERGY TRANSITION
Page 40
BROWN STIMULUS EXCEEDS GREEN STIMULUS BY MORE THAN TEN TIMES
Breakdown of brown stimulus (likely to increase net emissions) by sector and country
• Brown stimulus (without green conditions) were largely introduced to save sectors directly impacted by COVID-19, such as aviation, tourism, oil and gas, including
company bailouts.
• Apart from direct stimulus, we note that some countries have implemented aggressive environmental policies to support their economies – China has accelerated
approvals for coal mining and offered subsidies for fossil fuel vehicles; Indonesia has passed a deregulation bill to ease limitations on the scale of mining operations,
and allows automatic permit extensions for operators for up to 20 years; South Africa restricted renewable power generation and allowed the deferment of carbon
taxes to support fossil fuel power generators; airlines around the world are getting bailouts supported their respective governments, but only a few of them have
green strings attached.
Source: BloombergNEF, DBS Bank

Asian Insights SparX
ENERGY TRANSITION
Page 41
WORLD GDP COULD FALL BY 20% BETWEEN 2020-2100 IF WE STAY ON THE CURRENT CLIMATE TRAJECTORY
Well-designed green policies can concurrently delink economic growth from
climate change, and alleviate global inequality reinforced by global warming
• The long-term impact of global warming will be devastating, but it will
not be felt evenly by countries throughout the world - Oxford
economists found that a 3°C increase in global average temperatures
by 2100 could potentially decimate global GDP by over 20%, with
emerging regions bearing the brunt of the impact.
• The study finds that tropical and subtropical countries whose average
temperatures are already warmer than 15° C today, and where most of
the developing countries in the world lie, face catastrophic economic
degradation from increase in global temperatures, much more than
regions whose average annual temperatures today are cooler than 15°
C, including those in North America and Europe, who even stand to
benefit slightly in the short term from rising temperatures.
• Recent studies performed by the IMF, IRENA, IEA and McKinsey all
suggest that green stimulus packages by governments can effectively
kickstart the economy, and set the world on a far more sustainable
path – 1) in a joint study between the IEA and IMF, IEA calculates that
its proposed medium-term Sustainable Recovery Plan, with an annual
cost of US$1.1tr for the next three years (0.7% of global GDP), can add
1.1% to global GDP each year between 2020 and 2023, 2) not only
are more jobs created by government spending on renewable
technologies and efficient energy compared to fossil fuels, the jobs
created will remain relevant in the New Economy.
• A recent survey conducted by Oxford involving finance ministries,
central banks, and other leading organisations showed that most
experts felt that while most green policies may take longer to deliver
actual results, this is more than compensated by their high long-run
multipliers; five policies were identified to be well-suited to deliver on
economic and climate goals.

Asian Insights SparX
ENERGY TRANSITION
Page 42
WORLD GDP COULD FALL BY 20% BETWEEN 2020 AND 2100 IF WE STAY ON THE CURRENT CLIMATE TRAJECTORY
Source: Oxford Smith School of Enterprise and the Environment
Note: Country borders on maps may be an approximation and do not represent the opinion of the analyst(s) or of DBS Bank Ltd.
Change in GDP per capita in 2100 if global average temperatures rise by 3°C

Asian Insights SparX
ENERGY TRANSITION
Page 43
EXPERTS FEEL POLICIES CENTERED ON ADDRESSING CLIMATE CHANGE ARE TOP PRIORITY
Source: Oxford Smith School of Enterprise and the Environment
• Respondents were asked to rank in a
relative and subjective manner, different
policies on three metrics – speed of
implementation, long-run economic
multiplier, and climate impact potential.
• The results showed that many experts
felt that policies which are beneficial for
the environment can also offer strong
economic returns.
• The five policies located in the top right
quadrant were assessed to be the most
attractive, including i) clean R&D
spending, and ii) clean energy
infrastructure investment.
• While most green policies may take
longer to deliver actual results, it is
more than compensated by their high
long-run multipliers.
Results of global survey of fiscal recovery policies

Asian Insights SparX
ENERGY TRANSITION
Page 44
THE GENERAL POPULATION ALSO SUPPORTS A SUSTAINABLE ECONOMIC GROWTH TRAJECTORY
Source: Ipsos Earth Day 2020 Survey
0% 20% 40% 60% 80% 100%
In the long term, climate change is as serious a crisis as COVID-19 is
It is important that government priortise climate change in the economic recoveryafter COVID-19
I will seek out products that are healthier and better for the environment
The government should focus on helping the economy to recover first andforemost, even if it means taking some actions that are bad for the environment
If the government does not act now to combat climate change, it will be falling thepeople in the country
If a political party's policies don't deal seriously with climate change, this would putme off voting for them
Strongly agree/tend to agree Neutral Tend to disagree/strongly disagree
Summary of Ipsos Earth Day 2020 survey
Questions

Asian Insights SparX
ENERGY TRANSITION
Page 45
NON-FOSSIL FUEL JOBS IN THE ENERGY SECTOR ARE ALSO MUCH MORE LABOUR INTENSIVE
Source: BloombergNEF, McKinsey, DBS Bank
0 1 2 3 4 5 6 7 8
Gas
Coal
Nuclear
Hydro
Wind
Solar
Bioenergy
Workers required for each 1MW of generating capacity in the US
Renewables
0 20 40 60 80 100
Renewable technologies
Energy efficiency
Fossil fuel
Jobs created, directly and indirectly, per US$10m in spending
Labour intensity of jobs in the energy sector in the US (left) and globally (right)

Asian Insights SparX
ENERGY TRANSITION
Page 46
CRUCIALLY, THE WORLD CANNOT MEET CLIMATE CHANGE GOALS IF ASIA IS NOT ON BOARD
Source: BP PLC, DBS Bank
Historical changes in carbon emissions and carbon emissions by country (2019)
-
5,000
10,000
15,000
20,000
25,000
30,000
35,000
40,000
2009 2010 2011 2012 2013 2014 2015 2016 2017 2018 2019
Total carbon emission (Mn tons)

Asian Insights SparX
ENERGY TRANSITION
Page 47
STIMULUS RESPONSE BY MOST ASIAN COUNTRIES SO FAR IS LESS ORIENTED TOWARDS THE ENVIRONMENT
• The Green Stimulus Index by
Vivideconomics measures the
environmental orientation of a
country/region’s stimulus funding
based on 1) the scale of funds
flowing into environmental
intensive sectors, 2) the existing
green orientation of those sectors,
and 3) the efforts which steer
stimulus toward (or away from)
pro-environmental recovery.
• Vivideconomics has been tracking
government stimulus measures
from April. Despite some
improvement over the past few
months, most countries in the
study were still found to have
concerningly negative scores. In
Asia, these countries included
China, Indonesia and India. More
details on Indonesia’s strategy in
Appendix 3.
Source: Vivideconomics, DBS Bank
Vivideconomic’s Green Stimulus Index

Asian Insights SparX
ENERGY TRANSITION
Page 48
6. OTHER NEAR-TERM CHALLENGES TO THE PACE OF ENERGY TRANSITION
Even though we believe the long-term uptrend of renewables
development will remain intact due to rapidly decreasing development
costs and the need to meet targets relating to climate change, we
should be aware of slowdown risks in the short term. Other than the
lack of suitable policy response, some of the other challenges that
should be noted:
PANDEMIC-RELATED RISKS
Post pandemic, many governments are placing priority on boosting
their respective economies at the expense of other equally important
issues such as the move towards cleaner energy sources. The case for
renewable energy has taken a further beating from the economic and
social shocks caused by the ongoing global pandemic on various
countries. Some of the key risk factors include:
• Fall in electricity consumption could lead to postponement of
projects: For example, COVID-19 had led to electricity
consumption dropping 10.3%/3.8% y-o-y in France /UK in the
first four months of the year (4M20). These two countries have
postponed auctions on renewable energy by 2-18 months due
to shrinking power demand.
Fall in electricity consumption could lead to slowdown in new
renewables projects in France and the United Kingdom
Source: CEIC
-12.0%
-10.0%
-8.0%
-6.0%
-4.0%
-2.0%
0.0%
2017 2018 2019 4M20
Electricity consumption growth in select European countries
France United Kingdom

Asian Insights SparX
ENERGY TRANSITION
Page 49
• Higher risks and lower returns: There could also be increased
financing and policy risks for the renewable energy sector
caused by factors such as extreme economic challenges caused
by lockdowns, auction delays and lower feed-in tariff (FiT).
These emerging risks could slow down upcoming projects with
lower internal rate of return (IRR).
• Reluctant policy makers: In many developing countries in Asia,
growth of energy demand remains strong in the long term. But
in view of the high intermittency of renewables, many policy
makers are reluctant to walk away from fossil fuel power
plants, despite potential issues related to climate change. For
example, Indonesia has passed the Coal and Mineral Mining
Law to support the expansion of coal-fired power. Japan and
South Korea are expected to continue financing coal-fired
independent power producers (IPPs) in Indonesia and Vietnam.
According to Bloomberg New Energy Finance (BNEF), in 1H20
the benchmark levelised cost of electricity (LCOE) for solar was
48%/25% higher than coal-fired power plants in Indonesia
and Vietnam respectively. Naturally, financially weaker
countries would prefer to fall back on coal-fired plants with
lower costs to meet most of their power demand growth in
the near term (next 1-2 years).
Unsubsidised benchmark LCOE in Southeast Asia (1H20)
Source: BNEF, DBS Bank
0
20
40
60
80
100
120
140
Indonesia Malaysia Philippines Thailand Vietnam
Coal Gas Onshore wind Solar PV
US$/MWh

Asian Insights SparX
ENERGY TRANSITION
Page 50
RENEWABLE SUPPLY CHAIN VULNERABILITY
Supply chain concentration in China. In 2019, China contributed 71%
of total global solar module supply due to strong cost-competitiveness
and economies of scale. However, after COVID-19 hit the country in
January and February 2020, many local manufacturing facilities were
suspended. China’s solar module exports fell 11%/21% y-o-y, causing
a shortage of solar components and disrupting the whole value chain.
This highlights the solar industry’s over-reliance on China. As solar
power generation plays a vital part in the global energy transition,
discussions are ongoing on developing domestic manufacturing
capabilities for the solar market.
China dominates global solar supply chain
Source: China Photovoltaic Industry Association (CPIA)
67%
97%
79%
71%
0%
20%
40%
60%
80%
100%
120%
0.0
20.0
40.0
60.0
80.0
100.0
120.0
140.0
160.0
Polysilicon (Ton 10k) Wafer (GW) Cell (GW) Module (GW)
Units as specified2019 solar prduction: China vs Global
China Global China % Global

Asian Insights SparX
ENERGY TRANSITION
Page 51
Emerging countries such as Vietnam and India have limited domestic
manufacturing capacity for the solar market with an incomplete supply
chain. Their production technology is far behind their Chinese
counterparts, leading to significant cost disadvantages. To illustrate this
point, even during trade tensions with US and India, Chinese modules
were still much cheaper than their domestic brands. One possible
solution that can both resolve the supply vulnerability and ensure low
costs, is to set up more JVs domestically.
For example, a JV between Vietnam and China operating in Vietnam
may:
1) enjoy lower tariffs and labour costs to lower LCOE of solar
electricity
2) help Vietnam improve its production technology and
labour skills in the solar industry
3) secure domestic supply in Vietnam and boost its
renewable energy mix
The Asian Development Bank may play a crucial support role in getting
more suppliers to build capacity. The Asian Development Bank (ADB)
has suggested that its members play a more active role in the solar
photovoltaic (PV) value chain. The bank will help them build their
manufacturing capacity and human resources. In countries without any
capacity, Dr. Zhai Yongping (Chief of Energy Sector Group of ADB) has
proposed some basic starting points including assembly of solar
modules, and mounting structures as well as operations and
maintenance.
Fall in exports from China could disrupt the global supply chain
Source: Wind
0
1,000
2,000
3,000
4,000
5,000
6,000
Jan Feb
US$mChina solar export in Jan/Feb 2020
2019 2020
-11% y-o-y
-21% y-o-y

Asian Insights SparX
ENERGY TRANSITION
Page 52
THE PREVALENCE OF FOSSIL FUEL SUBSIDIES Fossil fuel subsidies – how long will they exist? In many countries, fossil
fuel subsidies support users in the low-income brackets and lead to
lowering of direct and indirect fuel costs in the industrial sector.
However, disproportionate fossil fuel subsidies have distorted the
energy sector in various ways including:
1) Apart from reducing the cost-competitiveness of other
energy forms particularly renewable energy, fossil fuel
subsidies also reinforce the advantages of fossil fuels in
the energy market.
2) Investment decisions by private sector are also distorted,
leading to a preference for fossil fuel-based technologies
to renewable alternatives.
3) The termination of fossil fuel subsidies has been slow
because it could lead to energy price hikes in the short
term and hence cause political difficulties in the near
term, long before the benefits of cleaner air and long-
term cost reductions in the future are appreciated.
Some relevant data from international agencies showing the disparity
in subsidies for fossil fuels vis-a-vis renewables:
• According to the International Renewable Energy Agency
(IRENA), in 2017 around 70% of total energy subsidies of
US$634bn were for fossil fuels followed by renewable energy
at around 20%.
• According to the International Energy Agency (IEA), in 2019
subsidies for fossil fuel dropped 27% y-o-y to US$317.6bn.
Although subsidies are expected to drop by 43% in 2020, this
is mainly due to the decline in energy consumption amid
COVID-19. In other words, subsidies for fossil fuel might
remain much higher compared to those for renewables.
• According to the International Institute for Sustainable
Development (IISD), only 10-30% of fossil fuel subsidies would
pay for the global energy transition to renewables. The high
subsidies for fossil fuel will diminish the cost competitiveness of
clean energy and distract from green energy investments.

Asian Insights SparX
ENERGY TRANSITION
Page 53
Trends in global fossil fuel subsidies (Real 2019 dollars)
Source: IEA
COVID-19 economic damage may cause rethink even in existing
renewables subsidies. Post COVID-19, renewable energy auctions have
been postponed in many European and American countries. Some
countries have turned more positive about coal-fired projects in
Southeast Asia. Such phenomena might result in a shrinkage in
renewable energy subsidy or even a decrease in the percentage that
renewables take in total energy subsidy. For example, in 2015,
Indonesia’s expenditure on coal subsidies (US$664m) was five times
that on renewable energy subsidies (US$133m). The pandemic-led
collapse of fossil fuel prices, coupled with rising fuel subsidies, will
make coal-generated electricity even cheaper and further deter the
energy transformation in the country.
-40%
-30%
-20%
-10%
0%
10%
20%
30%
40%
0
100,000
200,000
300,000
400,000
500,000
600,000
2011 2012 2013 2014 2015 2016 2017 2018 2019
US$ m
Oil Electricity Natural Gas Coal Total YoY

Asian Insights SparX
ENERGY TRANSITION
Page 54
MANPOWER ISSUES
Green energy transition is likely to lead to positive employment effects,
as projected by many empirical studies:
• In 2018, IRENA estimated that around 11m people worldwide
were employed in the renewables sector, up from 7.3m in
2012. This represented 18% of all energy sector jobs.
• By 2050, IRENA estimates that employment in the renewable
energy sector could reach 42m people worldwide (around four
times that of 2018), under an accelerated “Energy Transition”
scenario that allows a stronger shift to renewable energy.
Under “Current Plans” scenario of energy transition, the
renewable energy sector could employ around 26m people.
• Thus, accelerated “Energy Transition” scenario would expand
employment by >12m people compared to various
governments’ status quo or “Current Plans”, after taking into
account potential job losses in the fossil fuel sector.
• The net increase in global employment under the accelerated
“Energy Transition” scenario in 2050 vs. 2018 is estimated at
72%, compared to 51% under “Current Plans” scenario
despite the potential job losses in the fossil fuel sector.
Global jobs in the energy sector – projections
Source: IRENA
0 20 40 60 80 100 120
Energy flexibility & grid upgrades
Energy efficiency
Renewables
Fossil fuels
Nuclear
Total
Projected job creation in energy sector (millions)
2050 (steeper energy transition) 2050 (current plans) 2017

Asian Insights SparX
ENERGY TRANSITION
Page 55
Percentage difference in regional employment between steeper "Energy Transition" and "Current Plans", 2050
Global +0.2%
North America +1.0%
Latin America -0.2%
European Union +2.4%
Rest of Europe -0.2%
Middle East and North Africa -0.2%
Sub-Saharan Africa 0.0%
East Asia +0.1%
South East Asia -0.1%
Rest of Asia -0.1%
Oceania +0.5%
Source: IRENA
There are various reasons affecting job creation during an energy
transition:
1) Supply mismatch: Most new job opportunities in the
renewable energy sectors are for workers and technicians
particularly in construction and installation. Training and
capacity building are required before skilled workers in fossil
fuels can consider switching careers. There is strong demand
for electrical engineers with skills in clean energy solutions.
However, there is a supply mismatch as most engineers are
currently specialising in different technologies from those
applied in the renewables sector.
2) Lack of training facilities: Some countries such as Indonesia are
heavily reliant on the fossil fuel sector for employment. Having
adequate educational institutions to train the workforce is
often a major issue.
3) Pay gap: Salary differentials between fossil fuels and renewable
energy jobs could lead to possible pay cuts for workers
switching careers.
4) Relocation: Workers could be forced to relocate because
demand for workers in the renewable energy sector and labour
supply from job switching in fossil fuels could be from different
regions.
These factors could hinder workers’ motivation to change jobs. Thus,
policies are required to properly address these misalignments before
governments can move forward with energy transition more
aggressively.
However, the changes in employment will not be evenly
distributed across countries (refer table alongside). Most
new jobs are expected in more developed regions such as
North America and Europe. However, developing countries
are not expected to benefit much. For instance, by 2050
IRENA estimates a marginal increase of 0.7m new jobs
created in China under the steeper “Energy Transition”
scenario, compared with the “Current Plans” scenario.
Furthermore, it also expects job losses outside the energy
sector.

Asian Insights SparX
ENERGY TRANSITION
Page 56
BOTTLENECKS IN EXISTING ENERGY INFRASTRUCTURE
Another roadblock in installing renewable technologies is the limitation
of existing energy infrastructure which was built to cater to the fossil
fuel industry. Some of the key factors include:
• Non-dispatchable: Existing grid infrastructure may not be able to
support the high growth of renewable power which is non-
dispatchable.
• More congestion, lower returns: Grid congestion and instability have
caused delays in the grid connection of renewable power and lower-
than-expected project returns, deterring further investments in new
renewable energy projects.
• Drifting from growth centres: The growth areas of renewable power
have also drifted away from generation and consumption centres.
There are a few major countries that can be useful points of reference:
• Australia: The Australian Energy Market Operator keeps lowering
marginal loss factor (MLF) for renewable projects due to grid
congestion. Grid congestion is particularly serious when more
generation of renewable energy is connected to electrically weak
areas of the network that are remote from the regional reference
node. As the local price of electricity is equal to the regional
electricity price multiplied by MLF, a low MLF will reduce a
generator’s revenue.
• Netherlands: More grid congestion. The country’s PV capacity is
expected to jump from 4.4GW in 2018 to 15GW in 2024. The
Netherlands Environmental Assessment Agency is estimating new
installation of solar power to hit 5GW in 2020. However, grid
congestion in northern Netherlands has caused delays in project
connection, leading to loss of Sustainable Energy Production (SDE+)
renewables incentives and lower project returns for operators.
According to Dutch transmission system operators TenneT and
Enexis, there is limited available capacity for renewable energy
projects at some locations in the northeastern part of the country,
such as Groningen and Drenthe.
• Germany: The success of Germany’s plans to shift from fossil fuels
and nuclear power to 100% renewable energy by 2050 will depend
on the stability of its power grid. Germany is one of Europe’s biggest
industrial economies. Its major industrial hubs are in the south and
west of the country. It is important that German’s renewable power,
which is mainly from wind power generated in the north, can be
transported smoothly to areas where it is most needed. However, the
country’s current power network is too congested to meet these
requirements.
Huge investments are required to extend the existing network with a
more intelligent energy system before robust renewable energy grids
can be installed effectively. The process of power grid extension could
be slower than expected because policy makers and regulators are
facing anti-grid expansion initiatives led by citizens and environmental
organisations. While this can be resolved by underground cables, this
solution is relatively more expensive and could also face objection from
farmers.

Asian Insights SparX
ENERGY TRANSITION
Page 57
7. APPENDIX 1. SURVEY - WHAT DO INDUSTRY PLAYERS THINK ABOUT THE ENERGY TRANSITION LANDSCAPE?
Important to understand the sentiment of industry players across the
energy value chain. As analysts, we can always make judgements to the
best of our abilities, but for the most part, we are still sitting in the
office, or more increasingly at home, and consuming energy rather
than actually being involved in the generation process. Hence, we feel
it is important for us to not only come to a conclusion on how the
energy transition story will play out post COVID-19, both in the near
term and long term, but also to allow actual industry participants to
share their views on our platform.
We asked our survey participants seven simple questions. Over the next
few pages, we will provide you with a good idea of the responses and
the implications, in our view.
1. Do you think that COVID-19 will accelerate the green energy
transition?
2. Do you think that COVID-19 could hasten the timeline for peak
oil demand?
3. Did the COVID-19 outbreak affect your long-term business
strategy and investment plans?
4. Which part/segment of the energy value chain appears the
most attractive to you at this juncture from a new investment
point of view?
5. What is the biggest threat to your organisation arising from
the energy transition?
6. With an increasing proportion of renewable energy in the
generation mix, what is your expectation of average electricity
prices in your country over the next five years?
7. What is the most important sustainability initiative/strategy for
your company?
As Asia’s leading bank, we collected responses from across the region –
Singapore, Hong Kong, Japan, Philippines, Taiwan, India, Indonesia,
China and across the energy value chain – Power Producers, Renewable
Energy Developers, Coal Miners, Downstream Gas, Oil and Gas
Producers, Oil Services, Energy Trading companies.

Asian Insights SparX
ENERGY TRANSITION
Page 58
Question 1: Do you think that COVID-19 will accelerate the green energy transition?
Source: DBS Bank
Question 2: Do you think that COVID-19 could hasten the timeline for peak oil demand?
Source: DBS Bank
• No clear consensus at this stage.
• Mixed outlook could be the result of near-term slowdown expectations inrenewables space owing to lack of positive policy response in Asia.
• However, it is clear that unlike in the past, a big chunk of industry playersin Asia do believe in the accelerated energy transition scenario, and will bepreparing for it.
• Early peak oil believers are marginally the minority.
• A surprising number of participants seem to believe that COVID-19 willcause structural changes to oil demand beyond the one-off impactsexpected in 2020/21.
• We agree that the pandemic may not affect the overall timeline of oildemand growth in the future (we expect oil demand to peak at around2035), but this surely shows the vulnerability of end-user demand for fossilfuels.
• While oil demand growth (relative to pre-COVID-19) will likely resume from2022 onwards, absolute oil demand projections for the next decade willtake a hit owing to the fallout caused by the pandemic.
Yes41%
No59%
Do you think that COVID-19 could hasten the timeline
for peak oil demand?
Yes52%
No48%
Do you think that COVID-19 will accelerate the green
energy transition?

Asian Insights SparX
ENERGY TRANSITION
Page 59
Question 3: Did the COVID-19 outbreak affect your long-term business strategy and investment plans?
Source: DBS Bank
• Most participants do not expect a big shake-up in company
strategy owing to the fallout arising from the COVID-19
pandemic.
• A wait-and-see strategy could be apparent, given that the full
impact of the pandemic has yet to be seen, and there could be
further disruptions in store.
• The other most prominent strategies appear to be 1) increased
investments in the renewables space, and 2) M&A activities,
both of which tend to corroborate our findings that corporates
will tend to diversify their exposure in the renewables space in
order to meet growth targets, climate change targets,
sustainability targets and retain access to financing, and
acquisitions is one way of increasing their presence in this
space.
0% 5% 10% 15% 20% 25% 30% 35% 40% 45%
Our business strategy and investment plans remain unchanged
We plan to increase exposure in conventional energy fuels space
We plan to increase exposure in the renewables space
We plan to spend more on decarbonisation, including carboncapture and storage technologies
We plan to diversify our operations geographically (pleasemention countries in the text box below)
We plan to identify inorganic growth opportunities includingdistressed assets
Did the COVID-19 outbreak affect your long-term business strategy and investment plans?

Asian Insights SparX
ENERGY TRANSITION
Page 60
Question 4: Which part/segment of the energy value chain appears the most attractive to you at this juncture from a new investment point of view?
Source: DBS Bank
• The simple winner here is renewable power generation as the
most sought-after investment opportunity in the energy value
chain, despite the near-term challenges and hiccups we had
identified earlier.
• Volatility in oil and gas prices may be a key reason for the
preference for more stable returns from the renewable energy
space.
• Honourable mention of LNG infrastructure, as LNG demand in
the Asia Pacific region is expected to hold up much better than
other fossil fuels in the near-to-medium term, and many
countries, especially in Southeast Asia, could use LNG as a
bridging fuel to meet the dual needs of lower carbon solutions
and economic growth, while transitioning to more renewable
energy usage in the longer term.
0% 10% 20% 30% 40% 50% 60%
Oil & gas exploration & production
Refining and petrochemicals
Power generation (conventional thermal excluding LNG)
Power generation (LNG)
Power generation (renewables)
Oil & gas services
Midstream and downstream infrastructure for oil and LNG
Others
Which part/segment of the energy value chain appears the most attractive to you at this
juncture from a new investment point of view?

Asian Insights SparX
ENERGY TRANSITION
Page 61
Question 5: What is the biggest threat to your organisation arising from the energy transition?
Source: DBS Bank
• The low prevailing oil and gas prices seem to be on the minds
of most survey participants here, as competition from
renewables and falling LCOEs of renewable sources will limit
the potential of price appreciation of fossil fuels, as consumers
shift to a more electrified future over time.
• Higher capex requirements to invest in or acquire capabilities in
lower carbon solutions to adjust to the energy transition
landscape is another key factor, and financing requirements will
thus play a key role here.
43%
9%9%
17%
22%
What is the biggest threat to your organisation arising from the energy
transition?
Product pricing pressure as due tochanging energy consumption patterns
High costs associated with decarbonisingoperations
Lower access to financing/capital markets
Elevated capital investment requirementsto diversify into low carbon energysolutions
Others

Asian Insights SparX
ENERGY TRANSITION
Page 62
Question 6: With increasing proportion of renewable energy in the generation mix, what is your expectation of average electricity prices in your country over the next 5 years?
Source: DBS Bank
• Electricity prices are expected to remain largely stable or
rangebound in the near-to-medium term, as renewables LCOEs
converge towards coal and gas, and even as storage costs
continue to fall.
• We believe grid congestion and grid stability will be the key
issues to look out for in this respect.
Remain largely stable61%
Decrease by more than 10%
13%
Increase by more than 10%
26%
With increasing proportion of renewable energy in the generation mix,
what is your expectation of average electricity prices in your country over the next 5 years?
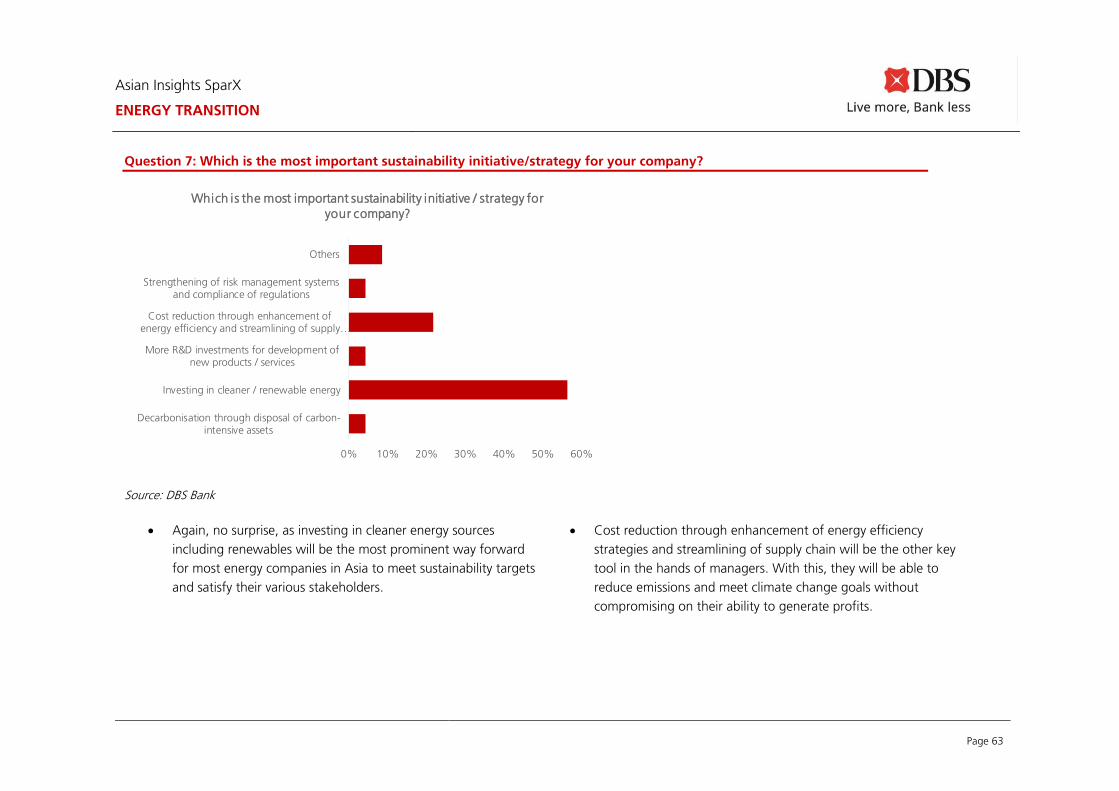
Asian Insights SparX
ENERGY TRANSITION
Page 63
Question 7: Which is the most important sustainability initiative/strategy for your company?
Source: DBS Bank
• Again, no surprise, as investing in cleaner energy sources
including renewables will be the most prominent way forward
for most energy companies in Asia to meet sustainability targets
and satisfy their various stakeholders.
• Cost reduction through enhancement of energy efficiency
strategies and streamlining of supply chain will be the other key
tool in the hands of managers. With this, they will be able to
reduce emissions and meet climate change goals without
compromising on their ability to generate profits.
0% 10% 20% 30% 40% 50% 60%
Decarbonisation through disposal of carbon-intensive assets
Investing in cleaner / renewable energy
More R&D investments for development ofnew products / services
Cost reduction through enhancement ofenergy efficiency and streamlining of supply…
Strengthening of risk management systemsand compliance of regulations
Others
Which is the most important sustainability initiative / strategy for
your company?

Asian Insights SparX
ENERGY TRANSITION
Page 64
8. APPENDIX 2. RENEWABLES AS PART OF DECARBONISATION STRATEGIES OF INTERNATIONAL OIL MAJORS
International
Oil major
Clean energy / Decarbonisation strategy
BP • First oil major to commit significant capital to renewable projects, such as wind and solar, from 1980 onwards.
• Formerly known as the British Petroleum Company, it was rebranded to Beyond Petroleum in 2001 with a look towards other energy sources
beyond oil.
• BP now takes a more measured approach in renewables, as in the aftermath of the 2010 Deep Water Horizon oil spill incident in the Gulf of
Mexico, BP gradually exited and wrote off most of its previous green energy investments portfolio, believed to be worth about US$8-10bn.
• Following the divestment from renewables, BP has not formulated a clear new renewable energy vision but as per CEO Bob Dudley, is scanning and
screening for renewable energy opportunities to plan for a life beyond oil.
• The company still has more than 2,200 megawatts (MW) of legacy onshore wind capacity assets in the US and has started to re-invest in renewables
in recent years.
• BP is prepared to spend around US$500m per year (organic and inorganic investments) to have some skin in the game and enable growth options
for a low carbon future.
• Key recent acquisitions/ investments in clean energy include:
• A 43% stake in Lightsource, which has rebranded to Lightsource BP and is Europe’s largest solar power project developer.
• Investment in StoreDot, an Israeli developer of rapid-charging batteries.
• Investment in US company FreeWire, which makes fast-charging infrastructure for electric vehicles
• acquisition of Chargemaster, the UK’s leading network of charging points
• BP has established a venture capital arm with the name BP Ventures in 2006 and has invested over US$300m into an active portfolio of more than
40 entities comprising emerging and disruptive technologies across upstream, downstream, and green energy.
Chevron • Investments in renewables relatively scarce, with no target in place for a move to cleaner technology.
• Exited most renewables projects by 2016, following low returns on investment compared to its core activities, and the focus thereafter has remained
on its oil and gas business. There remains a small legacy renewables business in the US.
• Managing emissions by improving energy efficiency, reducing flaring, and fixing methane leaks.
• Investing in two of the world's largest carbon dioxide injection projects: Quest CCS project in the Canadian oil sands and Gorgon in Australia.
• Launched a Future Energy Fund in 2018, with an initial commitment of US$100m set aside to invest in breakthrough technologies that will reduce
carbon emissions and provide claner energy.

Asian Insights SparX
ENERGY TRANSITION
Page 65
ExxonMobil • Exxon has also shown very little interest in investing in renewable energy technologies, with no budget or time-scale planned for future projects.
• The company’s strategy revolves around reducing greenhouse gas emissions, advancing biofuels, and carbon capture and storage (CCS). Exxon
holds interests in about a third of the world’s CCS capacity. In 2019, it announced plans to develop carbon capture fuel cell technology, which
produces power and captures and concentrates CO2 for storage – resulting in potential cost reductions.
• With regards to advanced biofuel research, the company funds and conducts research in a broad portfolio approach including algae, non-food-
based biomass feedstock, and agricultural waste.
Shell • Created a strategic framework for resilience regardless of the outcome in terms of future oil prices and renewable energy transition. CEO Mr. Ben
van Beurden told investors recently that Royal Dutch Shell is no longer an oil and gas company, but an energy transition company.
• New Energies division was announced in May 2016, combining its existing low carbon and renewables interests (hydrogen, electric vehicle charging,
biofuels, and renewable power) to jointly focus on long-term energy transition themes as part of its diversification strategy.
• In 2016, revealed a new energy investment budget of US$200m per year, but this was revised to up to US$1bn per year later in 2017, and then to
US$1-2bn per year. Out of this figure, 80% is allocated for the power sector. Thus, Shell’s investment target for green energy projects was set at
US$4-6bn for the period from 2016 until the end of 2020 – but with less than a year to go, the actual sum may be “well below” those figures.
• Acquired UK-based electricity and gas provider First Utility, as well as Europe’s largest electric vehicle charging company NewMotion.
• Bought stakes in US solar power firm Silicon Ranch and in Husk Power Systems, an India-based company that provides renewable power to rural
communities and businesses through distributed off-grid installations.
• Also investing in grid edge and energy storage companies such as GI Energy, Axiom Energy, and Sonnen.
Total • One of the frontrunners among oil majors, along with Equinor and Shell, to transform from traditional oil and gas into a full-fledged energy
company. Strategic rationale of diversifying revenues away from volatile oil prices towards establishing a robust position in future energy growth
markets.
• Total’s plan for renewables is to invest US$500m a year in clean energy technologies. That figure is about 3% of the French oil major’s total capital
expenditure, with plans in place to grow its low carbon asset base (downstream gas, renewable energies, energy storage, energy efficiency, clean
fuels and carbon capture, utilisation, and storage technology) to 20% of its total asset base over the next 20 years.
• Made several strategic investments over last 10 years, which included acquisition of a 60% stake in US solar firm SunPower in 2011.
• Total is aiming to become a global integrated leader in solar power and has 1.6 GW worth of solar capacity and plans to increase that to 5GW.
• Other key recent acquisitions/ investments in renewables/ clean energy space include: i) French battery manufacturer Saft, ii) Belgian green power
utility company Lampiris. iii) A 23% stake in the French renewable company Eren, iv) The French energy efficiency leader GreenFlex v) A 74% stake
in the French electricity retailer Direct Energie and vi) A 25% stake in Clean Energy Fuels Corp
• Established the venture capital arm Total Energy Ventures in 2008 and has invested almost US$200m in over 20 innovative start-ups

Asian Insights SparX
ENERGY TRANSITION
Page 66
Eni • Although not quite up to speed with its rival oil majors, the Italian company has plans in place to invest further in renewable technologies.
• In 2015, established a dedicated energy solutions department to identify and implement renewable growth opportunities. With an eye on growing
its onshore and offshore wind capacity, Eni formed partnerships with France-based GE Renewable Energy and Norwegian energy company Equinor.
• Clean energy sources play a key role in the firm’s corporate strategy and it is targeting to deliver 1GW of installed renewable power capacity
between 2018 and 2021 by investing €1.2bn (US$1.3bn), with a long-term goal of reaching 5GW installed renewable power capacity by 2025.
• Renewable energy projects (photovoltaics, wind, concentrated solar power, biofuels, and green chemicals) will be developed where the company
can leverage technological and geographical synergies with its main core business. Eni targets a project internal rate of return of between 8% and
12% after financing and synergies with upstream operations.
Equinor • To emphasise on its shift in strategy, Statoil, the Norwegian oil major, recently changed its name to Equinor to reflect the change from a focused oil
company to a broad energy company.
• Primary focus historically on offshore wind, leveraging its operational expertise in the North Sea. Wind projects include large-scale conventional
offshore developments such as the world's first floating offshore wind turbine installed in Norway in 2009, with an overall portfolio size of 750 MW.
• In 2015, the New Energy Solutions unit was established as a dedicated business unit to support the company's renewable energy expansion as one
of three cornerstones to help manage the long-term climate roadmap.
• Over the past two years, 3–5% of annual capital expenditure was spent on renewables. Going forward, the capital expenditure share attributed to
low-carbon energies and renewables could rise to between 15% and 20% of the total capital expenditure by 2030.
• In 2017, Equinor acquired a 40% stake in Scatec Solar's 162MW Brazilian Apodi solar assets as well as 50% interest in the project execution
company, giving the company the knowhow to develop and operate large-scale solar PV plants in the future. Also agreed to buy Danish power and
gas trading firm Danske Commodities to strengthen the company's position in power generation from renewable energy. Equinor also acquired a
50% stake in two offshore wind developments in Poland.
• Established a US$200m renewables venture capital fund to invest in innovative renewables start-ups, low-carbon technologies, and associated
business models. The fund has completed four major investments to date, including in wind energy leasing, electric vehicle charging infrastructure,
and energy storage.
ConocoPhillips • Remains very focused on the upstream oil and gas business with no meaningful investment in renewables so far, and no strategy to diversify into a
broader energy play.
Source: Companies, DBS Bank (also adapted from Energy Strategy Reviews 26 (2019) 100370 “The renewable energy strategies of oil majors – From oil to
energy?” by Matthias J. Pickl, King Fahd University of Petroleum and Minerals, University Blvd, Dhahran, 31261, Kingdom of Saudi Arabia, also available on the
website: https://www.sciencedirect.com/science/article/pii/S2211467X19300574)

Asian Insights SparX
ENERGY TRANSITION
Page 67
9. APPENDIX 3. CASE STUDY – FOCUS ON INDONESIA’S STRATEGY TOWARDS ENERGY TRANSITION
Energy transition plans of bigger economies in Asia like China and India
are well known and highlighted by us in our previous reports on Energy
Mix and Natural Gas and LNG. However, it is important to note that
more developing countries must join the energy transition movement in
order to offer a sustainable economic growth story. In this respect, we
have conducted an Indonesia energy transition initiative case study,
based on the Ministry of Energy and Mineral Resources’s (MEMR)
presentation on the National Energy Policy in Indonesia. The MEMR
revealed that despite Indonesia’s commodity-centric energy mix and
overall economy, the transition to renewable energy is in the
government’s mind.
Indonesia is aligning with global initiatives to tackle climate change.
The key energy transition initiative for Indonesia is aimed at not only
strengthening Indonesia’s energy security amid global uncertainties
over the COVID-19 pandemic and geopolitical risks such as the US-
China trade war, but also demonstrating Indonesia’s participation in
sustainable initiatives, such as aligning with global initiatives to tackle
climate change risks via the Paris Agreement. If this programme is
executed well, it could allow Indonesia to reduce its carbon emissions
by 29-41%.
Based on the government’s strategy, Indonesia aims to increase its
renewable energy mix to 23% in 2025, before further increasing this to
31% in 2050. We believe a large chunk of the energy mix transition
towards renewable energy will be driven by the Indonesia biofuel
programme, as the oil energy mix is set to drop simultaneously, from
42% in 2017, to 25% in 2025 before falling further to 20% in 2020.
Execution will be challenging. This programme looks promising, though
the government is aware of the challenges such as Indonesia’s
archipelago landscape – any initiative to move towards renewable
energy from fossil fuel beyond Java island will not be easy due to
logistics issues and potential demand challenges. With regards to
renewable energy R&D, it is uncertain whether Indonesia can afford the
latest technology and facilities that are on par with developing
countries, considering that Indonesia is currently facing GDP
contraction amid the COVID-19 pandemic.
We view Indonesia’s biodiesel programme as a low-hanging fruit. With
an annual CPO production of 40m MT, 10m cars on the road and a
population of 220m, Indonesia can be the world’s largest consumer of
CPO while reducing its oil imports simultaneously. On the other hand,
we expect the reduction of coal consumption to face domestic
challenges, considering that coal prices affect the livelihoods of around
50m people mainly in the ex. Java region. Perhaps, the government will
push for more natural gas power plants and other energy sources if
Indonesia can exploit its trapped natural gas reserves in the eastern part
of the archipelago.
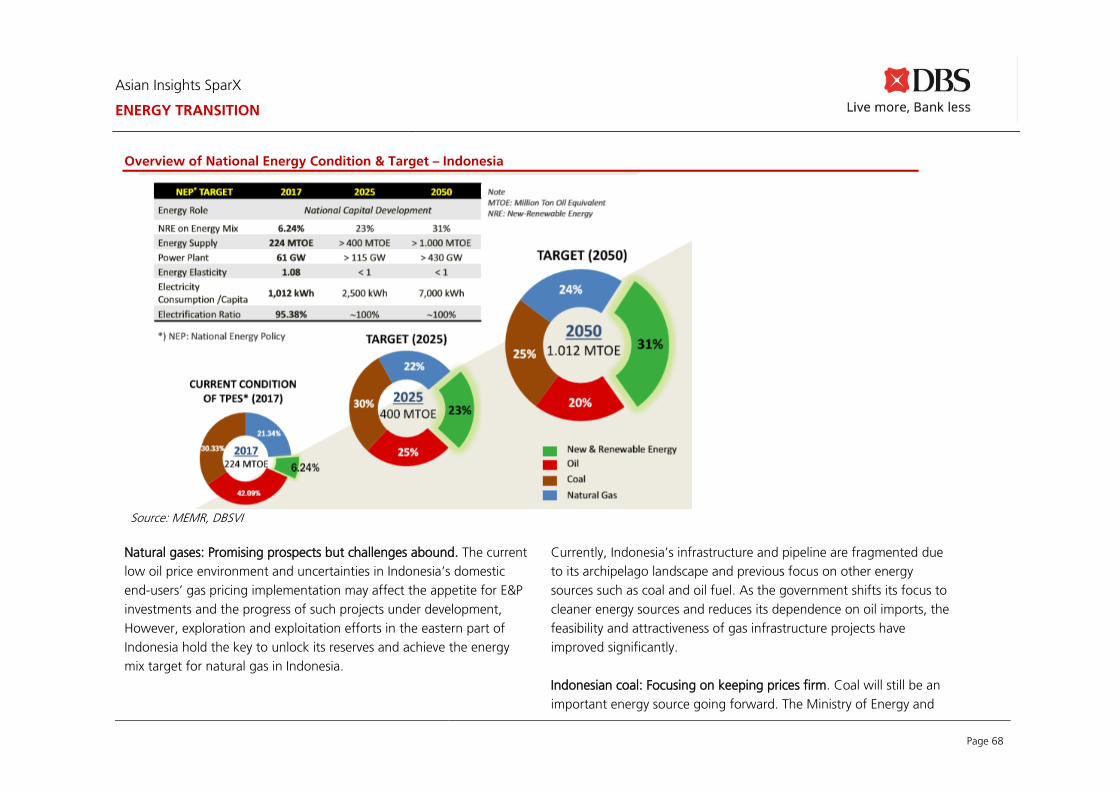
Asian Insights SparX
ENERGY TRANSITION
Page 68
Overview of National Energy Condition & Target – Indonesia
Source: MEMR, DBSVI
Natural gases: Promising prospects but challenges abound. The current
low oil price environment and uncertainties in Indonesia’s domestic
end-users’ gas pricing implementation may affect the appetite for E&P
investments and the progress of such projects under development,
However, exploration and exploitation efforts in the eastern part of
Indonesia hold the key to unlock its reserves and achieve the energy
mix target for natural gas in Indonesia.
Currently, Indonesia’s infrastructure and pipeline are fragmented due
to its archipelago landscape and previous focus on other energy
sources such as coal and oil fuel. As the government shifts its focus to
cleaner energy sources and reduces its dependence on oil imports, the
feasibility and attractiveness of gas infrastructure projects have
improved significantly.
Indonesian coal: Focusing on keeping prices firm. Coal will still be an
important energy source going forward. The Ministry of Energy and

Asian Insights SparX
ENERGY TRANSITION
Page 69
Mineral Resources (MEMR) is committed to ensuring that coal
consumption remains on an uptrend to support the national optimal
electrification rate, driven by coal’s affordability and nationwide
availability. Moreover, coal is one of the most important commodities
for Indonesia’s economy and trade balance. Based on the MEMR’s
energy mix target and forecast of energy consumption in ton
equivalent, Indonesia is poised to absorb 88m tons of coal by 2025,
which is double vs. the 2017 level, and we believe this is mainly due to
the delivery of a 35,000-MW power plant project.
Indonesia will inevitably still rely on coal and needs to keep coal prices
firm to prevent any adverse effect on the ex. Java economy – i.e. coal
price needs to stay above US$60 per ton (Newcastle 6,000kcal/kg
benchmark). In the short term, while waiting for the construction of
domestic power plants to be completed in the next couple of years,
Indonesia is set to cut domestic coal production amid soft coal demand
conditions in overseas markets.
Cutting production in near term. The Indonesian Coal Mining
Association (APBI) is targeting coal production to only 500-550m
tonnes in 2020 vs. 610m tonnes in 2019. We believe that Indonesia is
on track to achieve this new coal output target. The production cut is a
positive move to prevent oversupply in the seaborne coal market which
suffered from the COVID-19 pandemic lockdown in 2Q20. However,
there is a major risk that producers would react to Australia’s stricter
coal imports by producing more coal even at weaker selling prices. So
far, we have not seen any enforcement on coal miners breaching their
initial production targets. Indonesia’s coal production hit 228m tonnes
(as at 5M2020), or less than half of the adjusted annual output target
of 500m tonnes for 2020.
Domestic coal consumption target vs. natural gases Indonesia’s annual coal production (m tons)
Source: MEMR, DBSVI
48
88
243
68
120
253
0
50
100
150
200
250
300
2017 2025 2050
mtoe
Natural gas Coal
392
456 456 461
610
500
228
0
100
200
300
400
500
600
700
2015 2016 2017 2018 2019 2020
m tons
5M20

Asian Insights SparX
ENERGY TRANSITION
Page 70
Biofuel: Greener fuel to inevitably replace oil fuel. The Indonesian
government successfully revitalised its B20 domestic biodiesel blending
programme last year, before striving for B30 (30% biodiesel blend) and
possibly B100 in 2025 at the earliest, thanks to strong support from the
president himself and a new CPO Fund scheme in 2015. This
programme is not only intended to increase crude palm oil (CPO) usage
and keep CPO prices firm, but also to reduce its dependence on
imported oil. Indonesia has also established the CPO Fund, which pools
funds from CPO export levies (Indonesia is collecting US$55 per MT of
export levies for every ton of CPO exports), and uses the fund to bridge
the gap between CPO prices and retail diesel prices.
The biodiesel programme has, however, never been profitable since its
inception – this is underlined by its under-delivery vis-à-vis production
targets and delays since 2013 despite the availability of refining
capacity. CPO price has never stayed below that of crude oil for long,
as CPO is also seeing emerging food-based demand especially at low
price levels – this led to the birth of an incentive scheme based on
export levies in 2015.
Palm oil-gas oil (POGO) spread Estimated CPO Fund balance
Source: MEMR, Indonesia Ministry of Finance, DBSVI
-300
-200
-100
0
100
200
300
Jan-17 Jul-17 Jan-18 Jul-18 Jan-19 Jul-19 Jan-20 Jul-20
US
D/M
T
Rise in POGO spread as a result of the plunge in oil prices
450520
820
1,450
1,050
0
200
400
600
800
1000
1200
1400
1600
2015 2016 2017 2018 2019
US$m

Asian Insights SparX
ENERGY TRANSITION
Page 71
Promoting domestic biodiesel demand is important. Biodiesel accounts
for 20% of CPO demand globally and 80% of this comes from
Indonesia’s biodiesel demand. The promotion of biodiesel is aimed at
reducing Indonesia’s dependence on imported oil, as domestic oil and
gas block expansion plans run behind schedule – this is also reflected in
Indonesia’s renewable energy mix target vis-à-vis oil mentioned earlier.
Export substitution in focus. The programme also incorporates an
alternative solution to absorb any excess supply or counter export
demand weakness (akin to what happened in 2018), especially as CPO
is now facing a crucial time – no thanks to excess supply, demand
pressure from the EU (RED II Initiative) and India’s higher import tax.
Going forward, this programme can also help mitigate any further
downward pressure on CPO demand arising from adverse
developments, such as the RED II Initiative in the EU. The EU accounts
for 20% of global palm oil consumption and there is need to find
alternative sources of demand if the EU decides to phase out CPO
biodiesel completely by 2030.
CPO Fund collects US$500m-1bn of levies every year, depending on
CPO price trends and export tonnage. The fund is deployed to bridge
the gap between the prices of CPO (as the feedstock) and retail fuel in
Indonesia. Currently, we estimate there is US$1bn left in the CPO Fund
in 2020. With the widening price gap between crude oil and CPO, we
estimate that the fund will only cover 2020, (assuming a future levy of
US$18 per MT for 12m MT of CPO exports). If the CPO Fund is not
topped up sufficiently (note that Indonesia’s current export levy is only
US$55 per MT, and the government is likely to abolish export levies if
CPO price drops to below US$500 per MT), Indonesia’s biodiesel future
would be at a crossroads. Will we return to the pre-2017 level when
the execution of the biodiesel programme had been very poor?
Nevertheless, the President is committed to pushing this programme
ahead. From an economic point of view, the programme never seems
to be feasible – as the narrow price spread between CPO and retail
gasoil has never persisted for a sustained period of time – CPO price
tends to rebound when its spread with gasoil narrows. However, we
understand that the biodiesel programme is more than just an
experiment – it also a viable solution for countries to reduce their
dependence on imported oil and fix their current account deficit (CAD).
Note that Indonesia’s oil production is never sufficient to catch up with
the rising demand.
Indonesia has a population of 200m and 10m vehicles to readily absorb
the supply of biodiesel. Given the size of its CPO industry (Indonesia is
the world’s largest producer), Indonesia’s efforts to boost CPO demand
and ensure firm CPO prices are indeed crucial. However, its
dependence on the export market means that Indonesia has never
been in control of CPO prices and can only be a price taker despite its
status as a dominant producer. Supply control is quite an impossible
task, as trees keep producing fruits and the maximum shelf life of palm
oil is only four months.

Asian Insights SparX
ENERGY TRANSITION
Page 72
Summary of country level plans
• Empowering domestic resources. As the world’s largest palm oil and coal producer, with the potential to churn out natural gases in the future, Indonesia is well
positioned to strengthen its energy security even amid lingering uncertainties over the COVID-19 pandemic and geopolitical risks. It will continue to participate in
global initiatives to tackle climate change issues simultaneously via its renewable energy initiatives.
• Increasing renewable energy proportion in energy mix substantially by 2025, mainly lowering crude oil dependence. The Indonesian government plans to forge
ahead with its energy mix transition to a renewable energy composition of 23% by 2025 and 31% by 2050, from only 6% in 2015. This target will be supported by
its biofuel programme, with the goal of cutting its oil energy mix from 42% in 2015 to 25% by 2025. Meanwhile, Indonesia will still utilise its coal and natural gas
resources to fire up the country, as reflected in their stable energy mixes of 30% and 22% respectively, in 2025.
• Biodiesel in the spotlight. Indonesia is striving to increase its biodiesel blending up to B100 and we estimate this to happen in 2025 at the earliest, from the existing
blending of B30 (30% biodiesel). This programme is not only intended to increase CPO usage and keep CPO prices firm, but also to reduce its dependence on
imported oil.
• Support for domestic coal miners, besides natural gas sector. Indonesia will maintain coal in its energy mix as thermal coal can be procured affordably from
domestic miners. Coal price affordability has ensured that domestic demand remains firm, despite the potential expansion of natural gas in the country’s energy
mix. About 80% of its natural gas is set to be unlocked via E&P expansion to the eastern part of Indonesia.
• Execution of renewable energy plans increasingly crucial. Indonesia’s archipelago landscape and current low oil prices pose challenges to renewable energy
execution plans as oil imports have always offered a short cut to meet growing energy demand. But given the weak export demand for commodities, executing this
initiative will become more crucial by the day.

Asian Insights SparX
ENERGY TRANSITION
Page 73
DBS Bank Ltd, DBS HK, DBSVI, recommendations are based on an Absolute Total Return* Rating system, defined as follows:
STRONG BUY (>20% total return over the next 3 months, with identifiable share price catalysts within this time frame)
BUY (>15% total return over the next 12 months for small caps, >10% for large caps)
HOLD (-10% to +15% total return over the next 12 months for small caps, -10% to +10% for large caps)
FULLY VALUED (negative total return, i.e., > -10% over the next 12 months)
SELL (negative total return of > -20% over the next 3 months, with identifiable share price catalysts within this time frame)
*Share price appreciation + dividends
Completed Date: 20 Jul 2020 19:45:33 (SGT)
Dissemination Date: 20 Jul 2020 20:19:13 (SGT)
Sources for all charts and tables are DBS Bank, DBS HK, DBSVI, DBSVTH, AllianceDBS, unless otherwise specified
GENERAL DISCLOSURE/DISCLAIMER
This report is prepared by DBS Bank, DBS Bank (Hong Kong) Limited (“DBS HK”), PT DBS Vickers Sekuritas Indonesia (''DBSVI''). This report is solely intended for the clients of DBS Bank Ltd, its respective
connected and associated corporations and affiliates only and no part of this document may be (i) copied, photocopied or duplicated in any form or by any means or (ii) redistributed without the prior written
consent of DBS Bank, DBS HK, DBSVI.
The research set out in this report is based on information obtained from sources believed to be reliable, but we (which collectively refers to DBS Bank Ltd, its respective connected and associated corporations,
affiliates and their respective directors, officers, employees and agents (collectively, the “DBS Group”) have not conducted due diligence on any of the companies, verified any information or sources or taken into
account any other factors which we may consider to be relevant or appropriate in preparing the research. Accordingly, we do not make any representation or warranty as to the accuracy, completeness or
correctness of the research set out in this report. Opinions expressed are subject to change without notice. This research is prepared for general circulation. Any recommendation contained in this document does
not have regard to the specific investment objectives, financial situation and the particular needs of any specific addressee. This document is for the information of addressees only and is not to be taken in
substitution for the exercise of judgement by addressees, who should obtain separate independent legal or financial advice. The DBS Group accepts no liability whatsoever for any direct, indirect and/or
consequential loss (including any claims for loss of profit) arising from any use of and/or reliance upon this document and/or further communication given in relation to this document. This document is not to be
construed as an offer or a solicitation of an offer to buy or sell any securities. The DBS Group, along with its affiliates and/or persons associated with any of them may from time to time have interests in the
securities mentioned in this document. The DBS Group, may have positions in, and may effect transactions in securities mentioned herein and may also perform or seek to perform broking, investment banking
and other banking services for these companies.
Any valuations, opinions, estimates, forecasts, ratings or risk assessments herein constitutes a judgment as of the date of this report, and there can be no assurance that future results or events will be consistent
with any such valuations, opinions, estimates, forecasts, ratings or risk assessments. The information in this document is subject to change without notice, its accuracy is not guaranteed, it may be incomplete or
condensed, it may not contain all material information concerning the company (or companies) referred to in this report and the DBS Group is under no obligation to update the information in this report.

Asian Insights SparX
ENERGY TRANSITION
Page 74
This publication has not been reviewed or authorized by any regulatory authority in Singapore, Hong Kong or elsewhere. There is no planned schedule or frequency for updating research publication relating to
any issuer.
The valuations, opinions, estimates, forecasts, ratings or risk assessments described in this report were based upon a number of estimates and assumptions and are inherently subject to significant uncertainties
and contingencies. It can be expected that one or more of the estimates on which the valuations, opinions, estimates, forecasts, ratings or risk assessments were based will not materialize or will vary significantly
from actual results. Therefore, the inclusion of the valuations, opinions, estimates, forecasts, ratings or risk assessments described herein IS NOT TO BE RELIED UPON as a representation and/or warranty by the DBS
Group (and/or any persons associated with the aforesaid entities), that:
(a) such valuations, opinions, estimates, forecasts, ratings or risk assessments or their underlying assumptions will be achieved, and
(b) there is any assurance that future results or events will be consistent with any such valuations, opinions, estimates, forecasts, ratings or risk assessments stated therein.
Please contact the primary analyst for valuation methodologies and assumptions associated with the covered companies or price targets.
Any assumptions made in this report that refers to commodities, are for the purposes of making forecasts for the company (or companies) mentioned herein. They are not to be construed as recommendations to
trade in the physical commodity or in the futures contract relating to the commodity referred to in this report.
DBSVUSA, a US-registered broker-dealer, does not have its own investment banking or research department, has not participated in any public offering of securities as a manager or co-manager or in any other
investment banking transaction in the past twelve months and does not engage in market-making.

Asian Insights SparX
ENERGY TRANSITION
Page 75
ANALYST CERTIFICATION
The research analyst(s) primarily responsible for the content of this research report, in part or in whole, certifies that the views about the companies and their securities expressed in this report accurately reflect
his/her personal views. The analyst(s) also certifies that no part of his/her compensation was, is, or will be, directly or indirectly, related to specific recommendations or views expressed in the report. The research
analyst (s) primarily responsible for the content of this research report, in part or in whole, certifies that he or his associate0F
1 does not serve as an officer of the issuer or the new listing applicant (which includes in the
case of a real estate investment trust, an officer of the management company of the real estate investment trust; and in the case of any other entity, an officer or its equivalent counterparty of the entity who is
responsible for the management of the issuer or the new listing applicant) and the research analyst(s) primarily responsible for the content of this research report or his associate does not have financial interests1F
2 in
relation to an issuer or a new listing applicant that the analyst reviews. DBS Group has procedures in place to eliminate, avoid and manage any potential conflicts of interests that may arise in connection with the
production of research reports. The research analyst(s) responsible for this report operates as part of a separate and independent team to the investment banking function of the DBS Group and procedures are in
place to ensure that confidential information held by either the research or investment banking function is handled appropriately. There is no direct link of DBS Group's compensation to any specific investment
banking function of the DBS Group.
COMPANY-SPECIFIC / REGULATORY DISCLOSURES
1. DBS Bank Ltd, DBS HK, DBS Vickers Securities (Singapore) Pte Ltd (“DBSVS”) or their subsidiaries and/or other affiliates do not have a proprietary position in the securities recommended in this report as of30 Jun 2020.
2. Neither DBS Bank Ltd nor DBS HK market makes in equity securities of the issuer(s) or company(ies) mentioned in this Research Report.
Compensation for investment banking services:
3. DBSVUSA does not have its own investment banking or research department, nor has it participated in any public offering of securities as a manager or co-manager or in any other investment banking
transaction in the past twelve months. Any US persons wishing to obtain further information, including any clarification on disclosures in this disclaimer, or to effect a transaction in any security discussed in this
document should contact DBSVUSA exclusively.
Disclosure of previous investment recommendation produced:
4. DBS Bank Ltd, DBS Vickers Securities (Singapore) Pte Ltd (''DBSVS''), their subsidiaries and/or other affiliates may have published other investment recommendations in respect of the same securities /
instruments recommended in this research report during the preceding 12 months. Please contact the primary analyst listed in the first page of this report to view previous investment recommendations
published by DBS Bank Ltd, DBS Vickers Securities (Singapore) Pte Ltd (''DBSVS''), their subsidiaries and/or other affiliates in the preceding 12 months.
1 An associate is defined as (i) the spouse, or any minor child (natural or adopted) or minor step-child, of the analyst; (ii) the trustee of a trust of which the analyst, his spouse, minor child (natural or adopted) or minor
step-child, is a beneficiary or discretionary object; or (iii) another person accustomed or obliged to act in accordance with the directions or instructions of the analyst.
2 Financial interest is defined as interests that are commonly known financial interest, such as investment in the securities in respect of an issuer or a new listing applicant, or financial accommodation arrangement
between the issuer or the new listing applicant and the firm or analysis. This term does not include commercial lending conducted at arm's length, or investments in any collective investment scheme other than an
issuer or new listing applicant notwithstanding the fact that the scheme has investments in securities in respect of an issuer or a new listing applicant.

Asian Insights SparX
ENERGY TRANSITION
Page 76
RESTRICTIONS ON DISTRIBUTION
General This report is not directed to, or intended for distribution to or use by, any person or entity who is a citizen or resident of or located in any locality, state, country or other jurisdiction where
such distribution, publication, availability or use would be contrary to law or regulation.
Australia This report is being distributed in Australia by DBS Bank Ltd, DBSVS or DBSV HK. DBS Bank Ltd holds Australian Financial Services Licence no. 475946.
DBSVS and DBSV HK are exempted from the requirement to hold an Australian Financial Services Licence under the Corporation Act 2001 (“CA”) in respect of financial services provided to
the recipients. Both DBS Bank Ltd and DBSVS are regulated by the Monetary Authority of Singapore under the laws of Singapore, and DBSV HK is regulated by the Hong Kong Securities and
Futures Commission under the laws of Hong Kong, which differ from Australian laws.
Distribution of this report is intended only for “wholesale investors” within the meaning of the CA.
Hong Kong This report has been prepared by a person(s) who is not licensed by the Hong Kong Securities and Futures Commission to carry on the regulated activity of advising on securities in Hong Kong
pursuant to the Securities and Futures Ordinance (Chapter 571 of the Laws of Hong Kong). This report is being distributed in Hong Kong and is attributable to DBS Bank (Hong Kong) Limited,
a registered institution registered with the Hong Kong Securities and Futures Commission to carry on the regulated activity of advising on securities pursuant to the Securities and Futures
Ordinance (Chapter 571 of the Laws of Hong Kong). DBS Bank Ltd., Hong Kong Branch is a limited liability company incorporated in Singapore.
This report is being distributed in Hong Kong by DBS Bank Ltd, DBS Bank (Hong Kong) Limited and DBS Vickers (Hong Kong) Limited, all of which are registered with or licensed by the Hong
Kong Securities and Futures Commission to carry out the regulated activity of advising on securities. DBS Bank Ltd., Hong Kong Branch is a limited liability company incorporated in Singapore.
This report has been prepared by an entity(ies) which is not licensed by the Hong Kong Securities and Futures Commission to carry on the regulated activity of advising on securities pursuant
to the Securities and Futures Ordinance (Chapter 571 of the Laws of Hong Kong). This report is being distributed in Hong Kong and is attributable to DBS Bank (Hong Kong) Limited, a
registered institution registered with the Hong Kong Securities and Futures Commission to carry on the regulated activity of advising on securities pursuant to the Securities and Futures
Ordinance (Chapter 571 of the Laws of Hong Kong). DBS Bank Ltd., Hong Kong Branch is a limited liability company incorporated in Singapore.
For any query regarding the materials herein, please contact Carol Wu (Reg No. 8283) at [email protected]
Indonesia This report is being distributed in Indonesia by PT DBS Vickers Sekuritas Indonesia.

Asian Insights SparX
ENERGY TRANSITION
Page 77
Malaysia This report is distributed in Malaysia by AllianceDBS Research Sdn Bhd ("ADBSR"). Recipients of this report, received from ADBSR are to contact the undersigned at 603-2604 3333 in respect
of any matters arising from or in connection with this report. In addition to the General Disclosure/Disclaimer found at the preceding page, recipients of this report are advised that ADBSR (the
preparer of this report), its holding company Alliance Investment Bank Berhad, their respective connected and associated corporations, affiliates, their directors, officers, employees, agents and
parties related or associated with any of them may have positions in, and may effect transactions in the securities mentioned herein and may also perform or seek to perform broking,
investment banking/corporate advisory and other services for the subject companies. They may also have received compensation and/or seek to obtain compensation for broking, investment
banking/corporate advisory and other services from the subject companies.
Wong Ming Tek, Executive Director, ADBSR
Singapore This report is distributed in Singapore by DBS Bank Ltd (Company Regn. No. 196800306E) or DBSVS (Company Regn No. 198600294G), both of which are Exempt Financial Advisers as
defined in the Financial Advisers Act and regulated by the Monetary Authority of Singapore. DBS Bank Ltd and/or DBSVS, may distribute reports produced by its respective foreign entities,
affiliates or other foreign research houses pursuant to an arrangement under Regulation 32C of the Financial Advisers Regulations. Where the report is distributed in Singapore to a person
who is not an Accredited Investor, Expert Investor or an Institutional Investor, DBS Bank Ltd accepts legal responsibility for the contents of the report to such persons only to the extent
required by law. Singapore recipients should contact DBS Bank Ltd at 6327 2288 for matters arising from, or in connection with the report.
Thailand This report is being distributed in Thailand by DBS Vickers Securities (Thailand) Co Ltd.
United
Kingdom
This report is produced by DBS Bank Ltd which is regulated by the Monetary Authority of Singapore.
This report is disseminated in the United Kingdom by DBS Vickers Securities (UK) Ltd, ("DBSVUK"). DBSVUK is authorised and regulated by the Financial Conduct Authority in the United
Kingdom.
In respect of the United Kingdom, this report is solely intended for the clients of DBSVUK, its respective connected and associated corporations and affiliates only and no part of this document
may be (i) copied, photocopied or duplicated in any form or by any means or (ii) redistributed without the prior written consent of DBSVUK. This communication is directed at persons having
professional experience in matters relating to investments. Any investment activity following from this communication will only be engaged in with such persons. Persons who do not have
professional experience in matters relating to investments should not rely on this communication.
Dubai
International
Financial
Centre
This research report is being distributed by DBS Bank Ltd., (DIFC Branch) having its office at units 608 - 610, 6th Floor, Gate Precinct Building 5, PO Box 506538, DIFC, Dubai, United Arab
Emirates. DBS Bank Ltd., (DIFC Branch) is regulated by The Dubai Financial Services Authority. This research report is intended only for professional clients (as defined in the DFSA rulebook)
and no other person may act upon it.

Asian Insights SparX
ENERGY TRANSITION
Page 78
United Arab
Emirates
This report is provided by DBS Bank Ltd (Company Regn. No. 196800306E) which is an Exempt Financial Adviser as defined in the Financial Advisers Act and regulated by the Monetary
Authority of Singapore. This report is for information purposes only and should not be relied upon or acted on by the recipient or considered as a solicitation or inducement to buy or sell any
financial product. It does not constitute a personal recommendation or take into account the particular investment objectives, financial situation, or needs of individual clients. You should
contact your relationship manager or investment adviser if you need advice on the merits of buying, selling or holding a particular investment. You should note that the information in this
report may be out of date and it is not represented or warranted to be accurate, timely or complete. This report or any portion thereof may not be reprinted, sold or redistributed without our
written consent.
United States This report was prepared by DBS Bank Ltd, DBS HK, DBSVI. DBSVUSA did not participate in its preparation. The research analyst(s) named on this report are not registered as research analysts
with FINRA and are not associated persons of DBSVUSA. The research analyst(s) are not subject to FINRA Rule 2241 restrictions on analyst compensation, communications with a subject
company, public appearances and trading securities held by a research analyst. This report is being distributed in the United States by DBSVUSA, which accepts responsibility for its contents.
This report may only be distributed to Major U.S. Institutional Investors (as defined in SEC Rule 15a-6) and to such other institutional investors and qualified persons as DBSVUSA may
authorize. Any U.S. person receiving this report who wishes to effect transactions in any securities referred to herein should contact DBSVUSA directly and not its affiliate.
Other
jurisdictions
In any other jurisdictions, except if otherwise restricted by laws or regulations, this report is intended only for qualified, professional, institutional or sophisticated investors as defined in the
laws and regulations of such jurisdictions.

Asian Insights SparX
ENERGY TRANSITION
Page 79
DBS Regional Research Offices
HONG KONG
DBS (Hong Kong) Ltd
Contact: Carol Wu
13th Floor One Island East,
18 Westlands Road,
Quarry Bay, Hong Kong
Tel: 852 3668 4181
Fax: 852 2521 1812
e-mail: [email protected]
MALAYSIA
AllianceDBS Research Sdn Bhd
Contact: Wong Ming Tek (128540 U)
19th Floor, Menara Multi-Purpose,
Capital Square,
8 Jalan Munshi Abdullah 50100
Kuala Lumpur, Malaysia.
Tel.: 603 2604 3333
Fax: 603 2604 3921
e-mail: [email protected]
SINGAPORE
DBS Bank Ltd
Contact: Janice Chua
12 Marina Boulevard,
Marina Bay Financial Centre Tower 3
Singapore 018982
Tel: 65 6878 8888
Fax: 65 65353 418
e-mail: [email protected]
Company Regn. No. 196800306E
INDONESIA
PT DBS Vickers Sekuritas (Indonesia)
Contact: Maynard Priajaya Arif
DBS Bank Tower
Ciputra World 1, 32/F
Jl. Prof. Dr. Satrio Kav. 3-5
Jakarta 12940, Indonesia
Tel: 62 21 3003 4900
Fax: 6221 3003 4943
e-mail: [email protected]
THAILAND
DBS Vickers Securities (Thailand) Co Ltd
Contact: Chanpen Sirithanarattanakul
989 Siam Piwat Tower Building,
9th, 14th-15th Floor
Rama 1 Road, Pathumwan,
Bangkok Thailand 10330
Tel. 66 2 857 7831
Fax: 66 2 658 1269
e-mail: [email protected]
Company Regn. No 0105539127012
Securities and Exchange Commission, Thailand