asia/pacific outbound travel - mastercard.com · key: lpo - leisure purpose trips only, ap - all...
TRANSCRIPT
Knowledge Leadership
MasterCard Insights1Q 2014
The Future of Outbound Travel in Asia/Pacificby Desmond Choong and Yuwa Hedrick-Wong
1 MasterCard Insights
The Future of Outbound Travel in Asia/Pacificby Desmond Choong and Yuwa Hedrick-Wong
Introduction
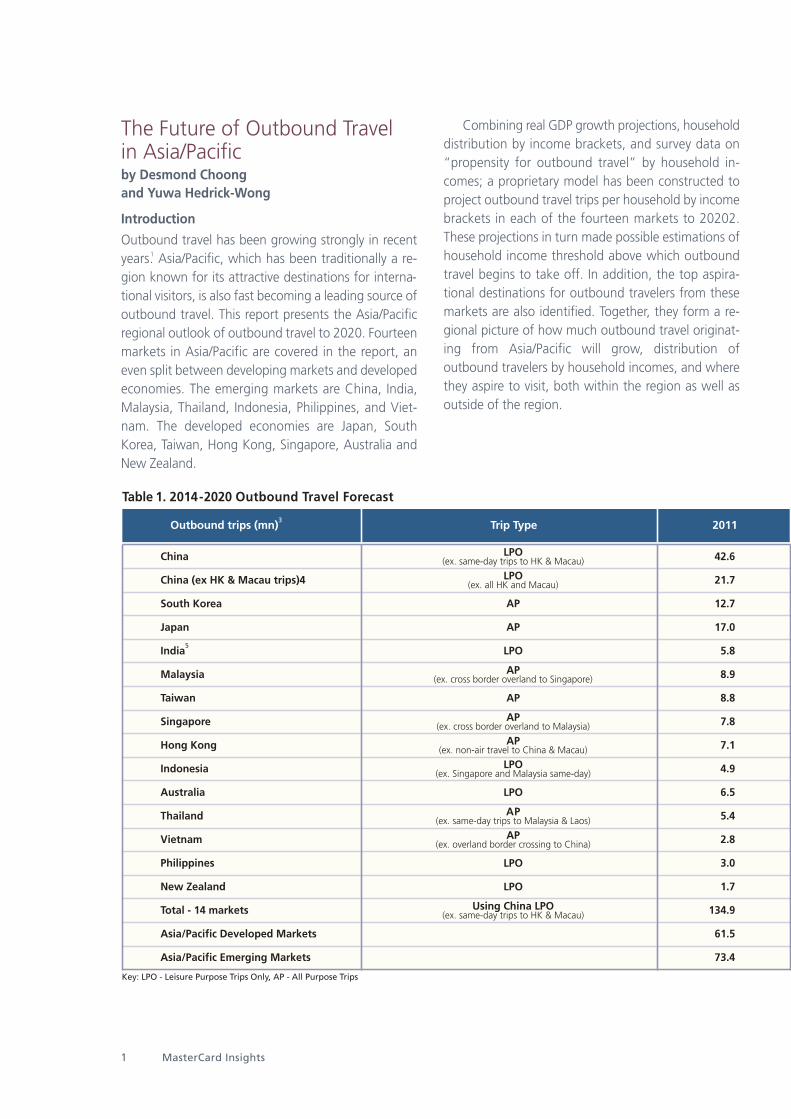
Outbound travel has been growing strongly in recentyears.1 Asia/Pacific, which has been traditionally a re-gion known for its attractive destinations for interna-tional visitors, is also fast becoming a leading source ofoutbound travel. This report presents the Asia/Pacificregional outlook of outbound travel to 2020. Fourteenmarkets in Asia/Pacific are covered in the report, aneven split between developing markets and developedeconomies. The emerging markets are China, India,Malaysia, Thailand, Indonesia, Philippines, and Viet-nam. The developed economies are Japan, SouthKorea, Taiwan, Hong Kong, Singapore, Australia andNew Zealand.
Combining real GDP growth projections, householddistribution by income brackets, and survey data on“propensity for outbound travel” by household in-comes; a proprietary model has been constructed toproject outbound travel trips per household by incomebrackets in each of the fourteen markets to 20202.These projections in turn made possible estimations ofhousehold income threshold above which outboundtravel begins to take off. In addition, the top aspira-tional destinations for outbound travelers from thesemarkets are also identified. Together, they form a re-gional picture of how much outbound travel originat-ing from Asia/Pacific will grow, distribution ofoutbound travelers by household incomes, and wherethey aspire to visit, both within the region as well asoutside of the region.
Table 1. 2014-2020 Outbound Travel Forecast
Trip TypeOutbound trips (mn)3 2011
Key: LPO - Leisure Purpose Trips Only, AP - All Purpose Trips
LPO (ex. same-day trips to HK & Macau)
LPO (ex. all HK and Macau)
AP
AP
LPO
AP (ex. cross border overland to Singapore)
AP
AP (ex. cross border overland to Malaysia)
AP (ex. non-air travel to China & Macau)
LPO (ex. Singapore and Malaysia same-day)
LPO
AP(ex. same-day trips to Malaysia & Laos)
AP (ex. overland border crossing to China)
LPO
LPO
Using China LPO(ex. same-day trips to HK & Macau)
China
China (ex HK & Macau trips)4
South Korea
Japan
India5
Malaysia
Taiwan
Singapore
Hong Kong
Indonesia
Australia
Thailand
Vietnam
Philippines
New Zealand
Total - 14 markets
Asia/Pacific Developed Markets
Asia/Pacific Emerging Markets
42.6
21.7
12.7
17.0
5.8
8.9
8.8
7.8
7.1
4.9
6.5
5.4
2.8
3.0
1.7
134.9
61.5
73.4

Regional OverviewCollectively, the 14 Asia/Pacific markets are expected togrow by an annual growth rate of 7.9% over the fore-cast period of 2014-2020. The largest outbound mar-kets in 2020 will be China, followed by South Koreaand Japan. Even if one excludes all trips to Hong Kongand Macau (which are technically domestic trips as theyare both parts of China), Mainland China outbound re-mains the largest in Asia/Pacific in 2020, more thanfour times of that of South Korea which is the secondlargest market.
Currently Japan outbound is the second largest inthe region but South Korea is projected to overtake itsometime in 2019. Similarly, if the forecasted growthrates persist past 2020, then India will in turn overtakeSouth Korea to be the second largest outbound marketby 2022.
Emerging Asia/Pacific currently has about one and ahalf times more outbound trips than developed Asia/Pa-cific (mostly due to China). And it will also grow bymore than twice as fast as developed Asia (10.1% ver-sus 3.9%) over the forecast period. Table 1 summarizesthe actual growth rates from 2010 to 2013, and thegrowth projections to 2020 for the 14 Asia/Pacific mar-kets.
Q1 2014 2
2012
50.5
27.3
13.7
18.5
6.4
9.6
9.4
8.0
7.8
5.4
6.9
5.7
3.4
3.2
1.7
150.3
66.1
84.1
2013
61.1
34.3
15.0
17.1
7.2
10.4
10.4
8.5
8.6
6.1
7.4
6.0
3.9
3.5
1.8
166.8
68.8
98.1
2014
71.2
40.0
15.5
17.3
7.9
10.9
10.6
8.7
8.7
6.8
8.1
6.2
4.3
3.8
1.9
181.7
70.6
111.1
2020
134.0
84.8
19.2
18.4
16.5
15.2
14.2
11.8
11.6
10.6
10.0
8.7
6.4
6.2
2.3
286.3
88.7
197.5
11.1%
13.3%
3.7%
1.1%
13.0%
5.7%
5.1%
5.3%
4.9%
7.6%
3.7%
5.9%
6.7%
8.7%
3.3%
7.9%
3.9%
10.1%
2014 -2020CAGR (Adjusted)
Note: Due to rounding, numbers presented throughout this document may not add precisely to the totals provided and percentages maynot precisely reflect the absolute figures.
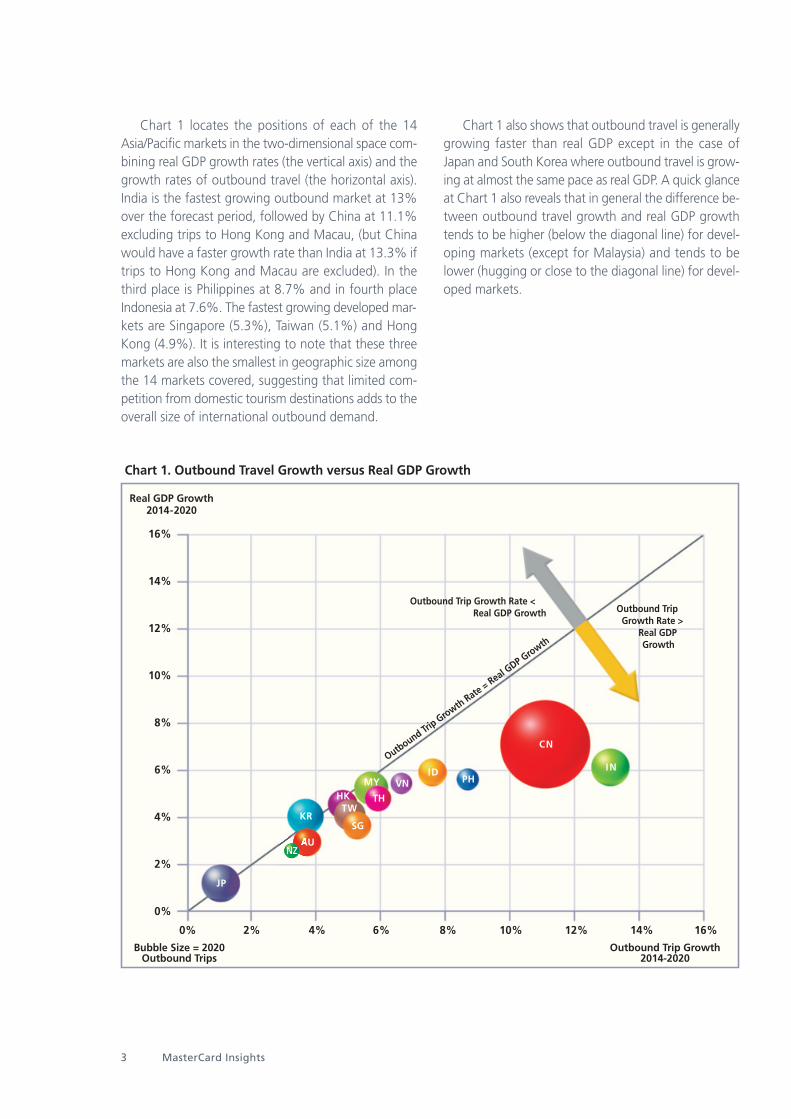
Chart 1 locates the positions of each of the 14Asia/Pacific markets in the two-dimensional space com-bining real GDP growth rates (the vertical axis) and thegrowth rates of outbound travel (the horizontal axis).India is the fastest growing outbound market at 13%over the forecast period, followed by China at 11.1%excluding trips to Hong Kong and Macau, (but Chinawould have a faster growth rate than India at 13.3% iftrips to Hong Kong and Macau are excluded). In thethird place is Philippines at 8.7% and in fourth placeIndonesia at 7.6%. The fastest growing developed mar-kets are Singapore (5.3%), Taiwan (5.1%) and HongKong (4.9%). It is interesting to note that these threemarkets are also the smallest in geographic size amongthe 14 markets covered, suggesting that limited com-petition from domestic tourism destinations adds to theoverall size of international outbound demand.
Chart 1 also shows that outbound travel is generallygrowing faster than real GDP except in the case ofJapan and South Korea where outbound travel is grow-ing at almost the same pace as real GDP. A quick glanceat Chart 1 also reveals that in general the difference be-tween outbound travel growth and real GDP growthtends to be higher (below the diagonal line) for devel-oping markets (except for Malaysia) and tends to belower (hugging or close to the diagonal line) for devel-oped markets.
3 MasterCard Insights
Chart 1. Outbound Travel Growth versus Real GDP Growth
0% 2% 4% 6% 8% 10% 12% 14% 16%
JP
Outbound Trip Growth Rate < Real GDP Growth
16%
14%
12%
10%
8%
6%
4%
2%
0%
Real GDP Growth2014-2020
Outbound Trip Growth2014-2020
Bubble Size = 2020Outbound Trips
Outbound Trip Growth Rate = Real G
DP Growth
Outbound TripGrowth Rate >
Real GDPGrowth
AU
KR
NZ
TWHK
SG
MY
TH
VN PHID
CN
IN

In addition to estimating the overall growth rates ofoutbound travel trips, it is also important to understandthe growth of outbound travel in relation to the dy-namics of changing numbers of households as well ashousehold incomes in these markets. Table 2 summa-rizes the changing ratios of outbound trips to numbersof households in recent years. Apart from Japan, all thedeveloped markets have a ratio of 100% or above in2020. While a ratio of 100% means on average thateach household has one person who makes a tripabroad each year, in practice it is more likely that a cer-tain percentage of households make multiple trips over-seas each year, and the remaining households do notgo abroad at all. The ratios for Singapore, Hong Kongand Taiwan are much larger than 100% and not coin-cidentally are also the fastest growing developed mar-kets for outbound trips.
Among the emerging markets, India’s ratio of 3% ofoutbound leisure trips to total households in 2014 isstartlingly low, even with a forecasted improvement ofalmost double to 5.8% in 2020. The ratio is the lowestin Asia/Pacific and about three times smaller than thenext lowest (Indonesia at 10.7% in 2014 improving to15.6% in 2020). If India had exactly the same ratio asIndonesia, then Indian outbound leisure travel wouldbe 28.2 million trips in 2014 (instead of 7.9 million trips)and 44.4 million trips in 2020 (instead of 16.5 milliontrips). It suggests the enormous potential for Indian out-bound leisure travel over the next 10-20 years as theratio starts to approach those of the other developingmarkets.
Q1 2014 4
Table 2. Number of Outbound Travel Trips as Percentage of Total Number of Households
Trip TypeOutbound trips as % of total households
2011
LPO (ex. same-day trips to HK & Macau)
LPO (ex. all HK and Macau)
AP
AP
LPO
AP (ex. cross border overland to Singapore)
AP
AP (ex. cross border overland to Malaysia)
AP (ex. non-air travel to China & Macau)
LPO (ex. Singapore and Malaysia same-day)
LPO
AP(ex. same-day trips to Malaysia & Laos)
AP (ex. overland border crossing to China)
LPO
LPO
Using China LPO(ex. same-day trips to HK & Macau)
9.9%
5.1%
68.9%
34.4%
2.2%
143.9%
118.2%
548.4%
283.7%
8.1%
75.9%
31.1%
14.5%
16.1%
100.3%
15.0%
68.8%
9.1%
2012
11.7%
6.3%
73.8%
37.4%
2.5%
150.4%
125.8%
546.4%
305.9%
8.6%
78.4%
32.8%
17.2%
16.9%
101.9%
16.6%
73.4%
10.3%
2013
14.0%
7.9%
80.2%
34.7%
2.7%
161.0%
139.3%
562.3%
332.5%
9.7%
83.1%
34.2%
19.5%
17.9%
103.5%
18.2%
76.1%
11.9%
2014
16.3%
9.1%
82.3%
35.0%
3.0%
165.5%
141.0%
566.1%
334.9%
10.7%
89.1%
35.0%
21.4%
19.0%
106.8%
19.7%
78.0%
13.4%
2020
29.7%
18.8%
99.6%
37.7%
5.8%
211.7%
188.2%
696.4%
427.8%
15.6%
102.8%
48.8%
30.0%
28.3%
122.4%
29.7%
96.7%
22.6%
Key: LPO - Leisure Purpose Trips Only, AP - All Purpose Trips
China
China (ex HK & Macau trips)
South Korea
Japan
India
Malaysia
Taiwan
Singapore
Hong Kong
Indonesia
Australia
Thailand
Vietnam
Philippines
New Zealand
Total - 14 markets
A/P Developed Markets
A/P Emerging Markets
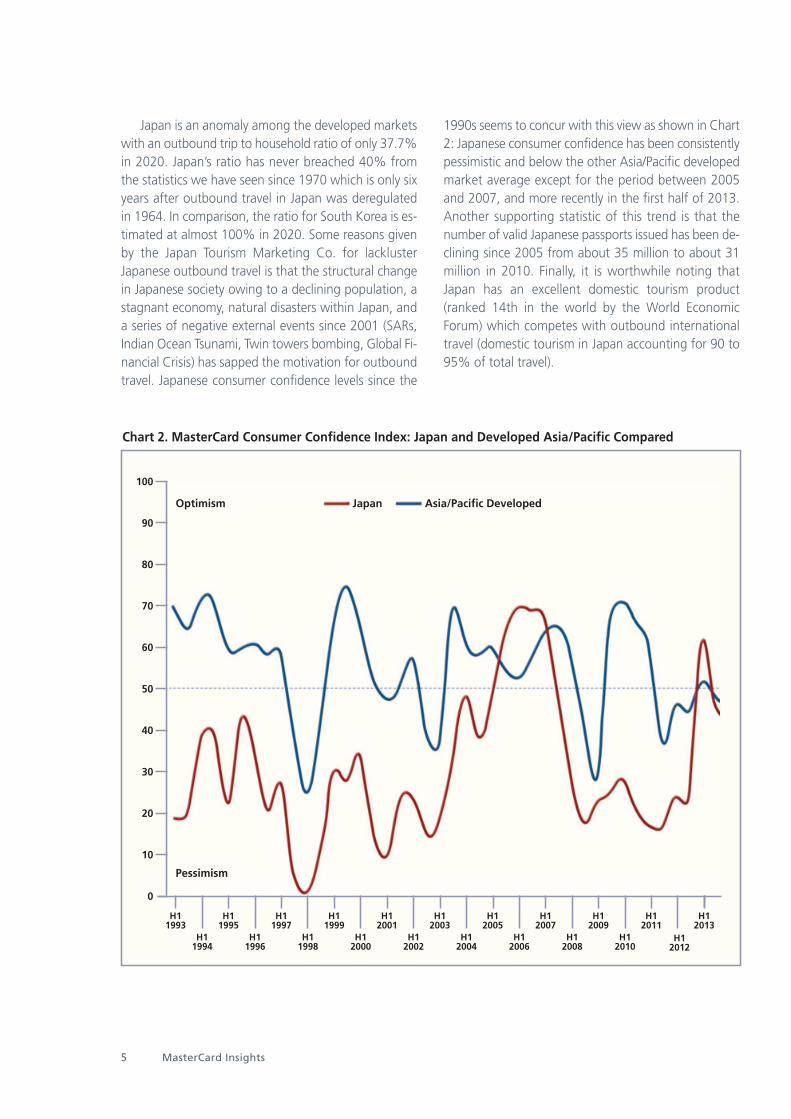
Japan is an anomaly among the developed marketswith an outbound trip to household ratio of only 37.7%in 2020. Japan’s ratio has never breached 40% fromthe statistics we have seen since 1970 which is only sixyears after outbound travel in Japan was deregulatedin 1964. In comparison, the ratio for South Korea is es-timated at almost 100% in 2020. Some reasons givenby the Japan Tourism Marketing Co. for lacklusterJapanese outbound travel is that the structural changein Japanese society owing to a declining population, astagnant economy, natural disasters within Japan, anda series of negative external events since 2001 (SARs,Indian Ocean Tsunami, Twin towers bombing, Global Fi-nancial Crisis) has sapped the motivation for outboundtravel. Japanese consumer confidence levels since the
1990s seems to concur with this view as shown in Chart2: Japanese consumer confidence has been consistentlypessimistic and below the other Asia/Pacific developedmarket average except for the period between 2005and 2007, and more recently in the first half of 2013.Another supporting statistic of this trend is that thenumber of valid Japanese passports issued has been de-clining since 2005 from about 35 million to about 31million in 2010. Finally, it is worthwhile noting thatJapan has an excellent domestic tourism product(ranked 14th in the world by the World EconomicForum) which competes with outbound internationaltravel (domestic tourism in Japan accounting for 90 to95% of total travel).
5 MasterCard Insights
Chart 2. MasterCard Consumer Confidence Index: Japan and Developed Asia/Pacific Compared
100
90
80
70
60
50
40
30
20
10
0
H11993
Optimism Japan Asia/Pacific Developed
Pessimism
H11994
H11995
H11996
H11997
H11998
H11999
H12000
H12001
H12002
H12003
H12004
H12005
H12006
H12007
H12008
H12009
H12010
H12011
H12012
H12013
Optimism
Pessimism
Japan Asia/Pacific Developed
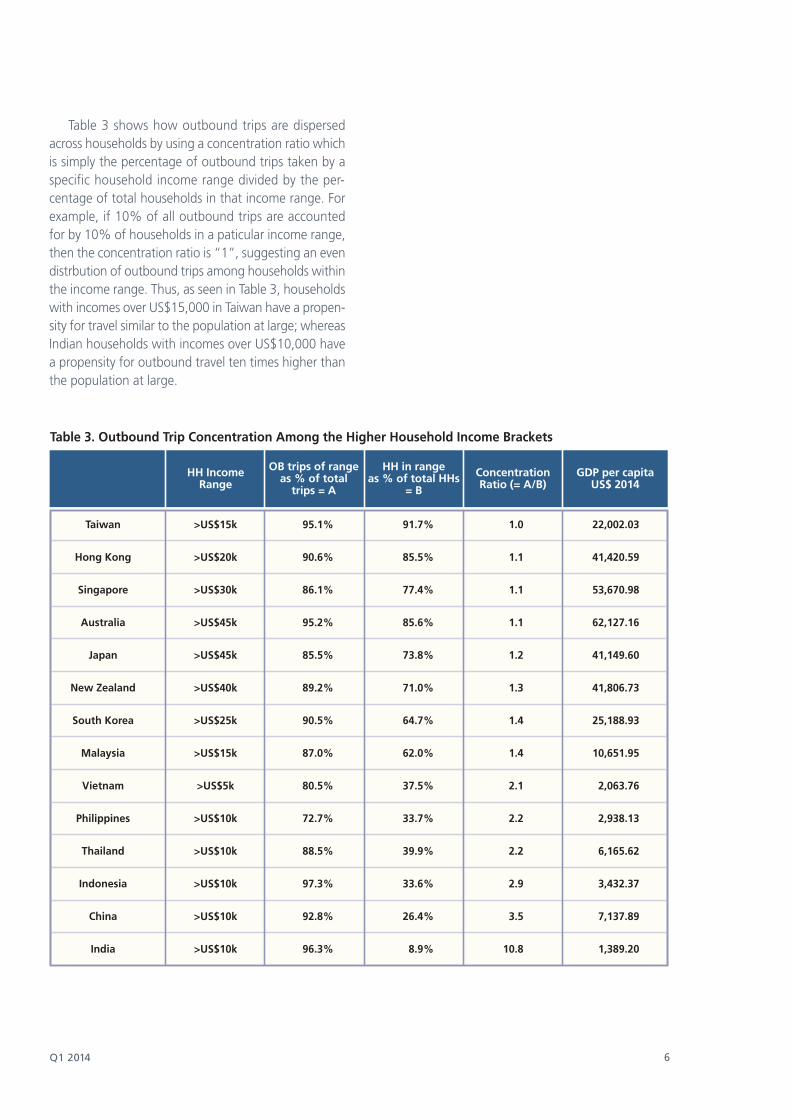
Table 3 shows how outbound trips are dispersedacross households by using a concentration ratio whichis simply the percentage of outbound trips taken by aspecific household income range divided by the per-centage of total households in that income range. Forexample, if 10% of all outbound trips are accountedfor by 10% of households in a paticular income range,then the concentration ratio is “1”, suggesting an evendistrbution of outbound trips among households withinthe income range. Thus, as seen in Table 3, householdswith incomes over US$15,000 in Taiwan have a propen-sity for travel similar to the population at large; whereasIndian households with incomes over US$10,000 havea propensity for outbound travel ten times higher thanthe population at large.
Q1 2014 6
Table 3. Outbound Trip Concentration Among the Higher Household Income Brackets
OB trips of rangeas % of total
trips = A
HH in range as % of total HHs
= B
ConcentrationRatio (= A/B)
GDP per capitaUS$ 2014
HH IncomeRange
Taiwan
Hong Kong
Singapore
Australia
Japan
New Zealand
South Korea
Malaysia
Vietnam
Philippines
Thailand
Indonesia
China
India
>US$15k
>US$20k
>US$30k
>US$45k
>US$45k
>US$40k
>US$25k
>US$15k
>US$5k
>US$10k
>US$10k
>US$10k
>US$10k
>US$10k
95.1%
90.6%
86.1%
95.2%
85.5%
89.2%
90.5%
87.0%
80.5%
72.7%
88.5%
97.3%
92.8%
96.3%
91.7%
85.5%
77.4%
85.6%
73.8%
71.0%
64.7%
62.0%
37.5%
33.7%
39.9%
33.6%
26.4%
8.9%
1.0
1.1
1.1
1.1
1.2
1.3
1.4
1.4
2.1
2.2
2.2
2.9
3.5
10.8
22,002.03
41,420.59
53,670.98
62,127.16
41,149.60
41,806.73
25,188.93
10,651.95
2,063.76
2,938.13
6,165.62
3,432.37
7,137.89
1,389.20
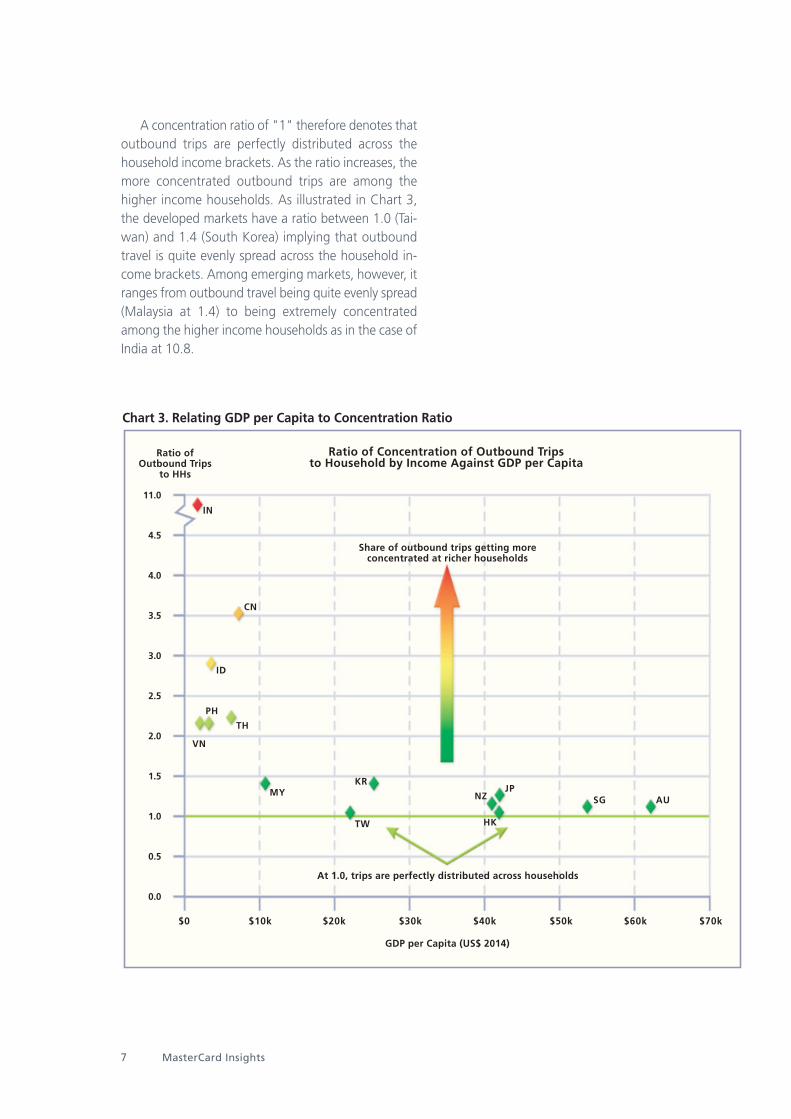
A concentration ratio of "1" therefore denotes thatoutbound trips are perfectly distributed across thehousehold income brackets. As the ratio increases, themore concentrated outbound trips are among thehigher income households. As illustrated in Chart 3,the developed markets have a ratio between 1.0 (Tai-wan) and 1.4 (South Korea) implying that outboundtravel is quite evenly spread across the household in-come brackets. Among emerging markets, however, itranges from outbound travel being quite evenly spread(Malaysia at 1.4) to being extremely concentratedamong the higher income households as in the case ofIndia at 10.8.
7 MasterCard Insights
Chart 3. Relating GDP per Capita to Concentration Ratio
11.0
4.5
4.0
3.5
3.0
2.5
2.0
1.5
1.0
0.5
0.0
$0 $10k $20k $30k $40k $50k $60k $70k
Ratio of Outbound Trips
to HHs
Ratio of Concentration of Outbound Tripsto Household by Income Against GDP per Capita
Share of outbound trips getting moreconcentrated at richer households
At 1.0, trips are perfectly distributed across households
GDP per Capita (US$ 2014)
KR
TW
MY
VN
TH
PH
ID
CN
IN
NZJP
HK
SG AU
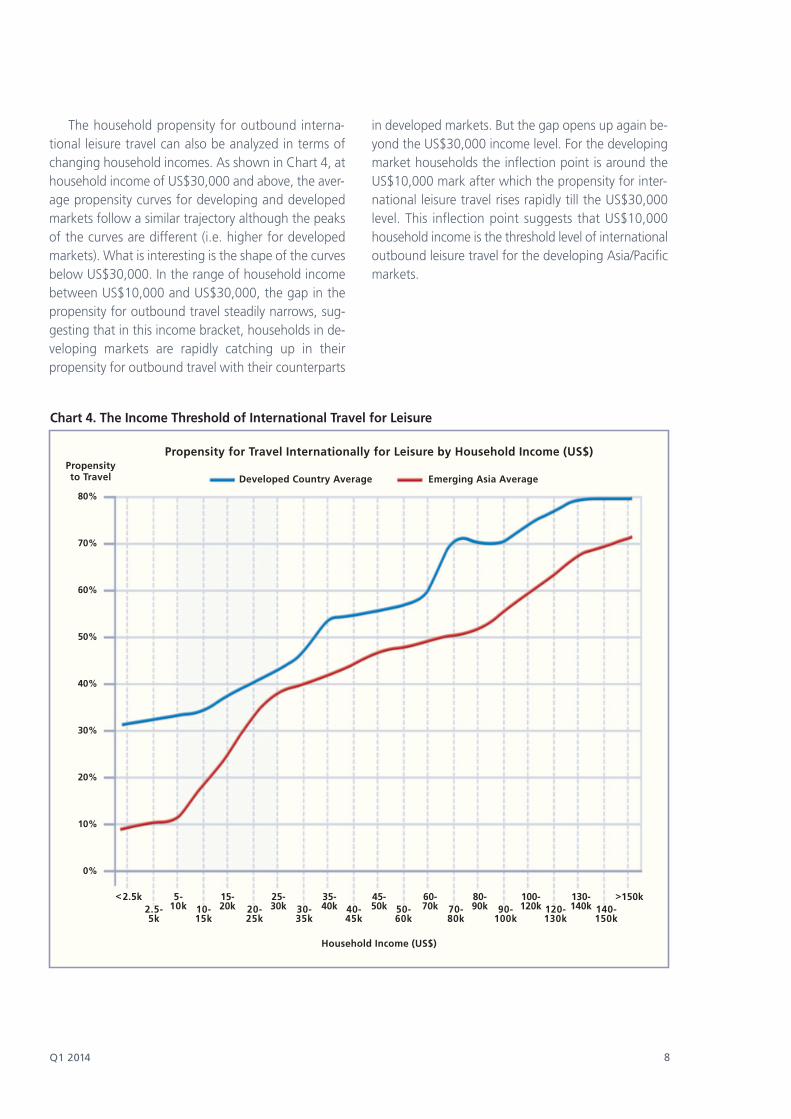
The household propensity for outbound interna-tional leisure travel can also be analyzed in terms ofchanging household incomes. As shown in Chart 4, athousehold income of US$30,000 and above, the aver-age propensity curves for developing and developedmarkets follow a similar trajectory although the peaksof the curves are different (i.e. higher for developedmarkets). What is interesting is the shape of the curvesbelow US$30,000. In the range of household incomebetween US$10,000 and US$30,000, the gap in thepropensity for outbound travel steadily narrows, sug-gesting that in this income bracket, households in de-veloping markets are rapidly catching up in theirpropensity for outbound travel with their counterparts
in developed markets. But the gap opens up again be-yond the US$30,000 income level. For the developingmarket households the inflection point is around theUS$10,000 mark after which the propensity for inter-national leisure travel rises rapidly till the US$30,000level. This inflection point suggests that US$10,000household income is the threshold level of internationaloutbound leisure travel for the developing Asia/Pacificmarkets.
Q1 2014 8
Chart 4. The Income Threshold of International Travel for Leisure
80%
70%
60%
50%
40%
30%
20%
10%
0%
Developed Country Average Emerging Asia Average
140-150k
120-130k
90-100k
70-80k
50-60k
40-45k
30-35k
20-25k
10-15k
2.5-5k
5-10k
<2.5k 130-140k
15-20k
25-30k
35-40k
45-50k
60-70k
80-90k
100-120k
>150k
Propensityto Travel
Propensity for Travel Internationally for Leisure by Household Income (US$)
Household Income (US$)
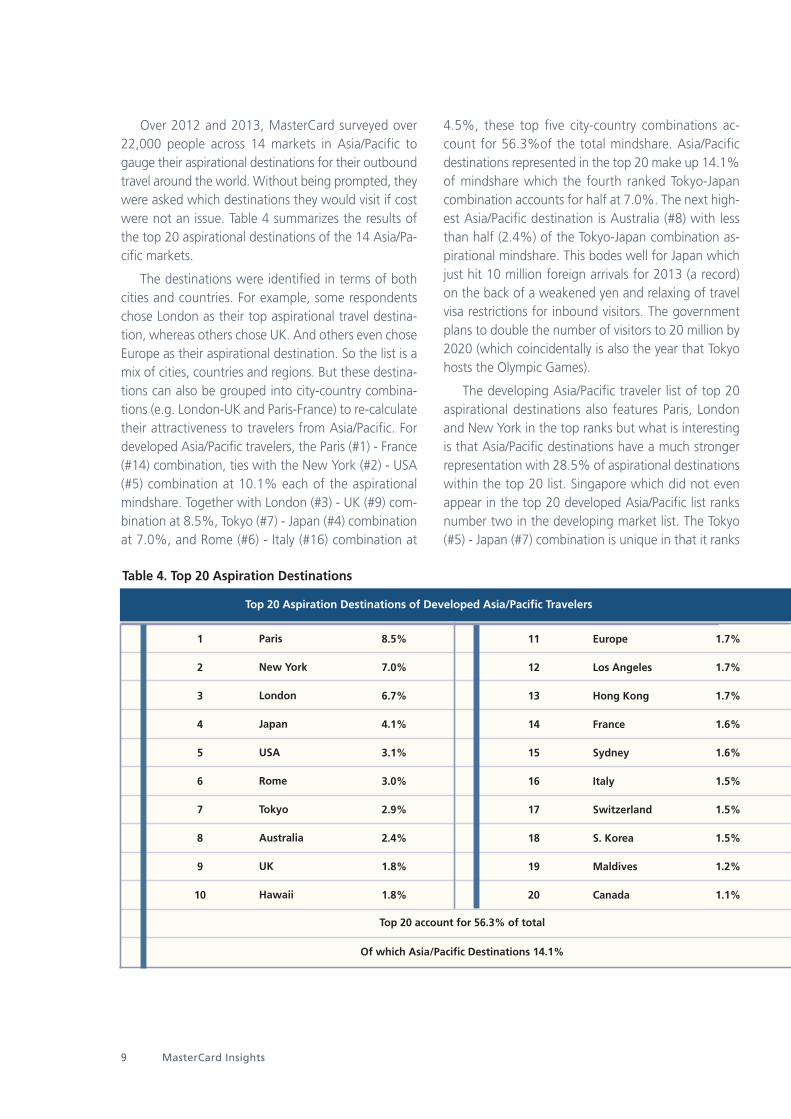
Over 2012 and 2013, MasterCard surveyed over22,000 people across 14 markets in Asia/Pacific togauge their aspirational destinations for their outboundtravel around the world. Without being prompted, theywere asked which destinations they would visit if costwere not an issue. Table 4 summarizes the results ofthe top 20 aspirational destinations of the 14 Asia/Pa-cific markets.
The destinations were identified in terms of bothcities and countries. For example, some respondentschose London as their top aspirational travel destina-tion, whereas others chose UK. And others even choseEurope as their aspirational destination. So the list is amix of cities, countries and regions. But these destina-tions can also be grouped into city-country combina-tions (e.g. London-UK and Paris-France) to re-calculatetheir attractiveness to travelers from Asia/Pacific. Fordeveloped Asia/Pacific travelers, the Paris (#1) - France(#14) combination, ties with the New York (#2) - USA(#5) combination at 10.1% each of the aspirationalmindshare. Together with London (#3) - UK (#9) com-bination at 8.5%, Tokyo (#7) - Japan (#4) combinationat 7.0%, and Rome (#6) - Italy (#16) combination at
4.5%, these top five city-country combinations ac-count for 56.3%of the total mindshare. Asia/Pacificdestinations represented in the top 20 make up 14.1%of mindshare which the fourth ranked Tokyo-Japancombination accounts for half at 7.0%. The next high-est Asia/Pacific destination is Australia (#8) with lessthan half (2.4%) of the Tokyo-Japan combination as-pirational mindshare. This bodes well for Japan whichjust hit 10 million foreign arrivals for 2013 (a record)on the back of a weakened yen and relaxing of travelvisa restrictions for inbound visitors. The governmentplans to double the number of visitors to 20 million by2020 (which coincidentally is also the year that Tokyohosts the Olympic Games).
The developing Asia/Pacific traveler list of top 20aspirational destinations also features Paris, Londonand New York in the top ranks but what is interestingis that Asia/Pacific destinations have a much strongerrepresentation with 28.5% of aspirational destinationswithin the top 20 list. Singapore which did not evenappear in the top 20 developed Asia/Pacific list ranksnumber two in the developing market list. The Tokyo(#5) - Japan (#7) combination is unique in that it ranks
9 MasterCard Insights
Table 4. Top 20 Aspiration Destinations
Paris
New York
London
Japan
USA
Rome
Tokyo
Australia
UK
Hawaii
1
2
3
4
5
6
7
8
9
10
8.5%
7.0%
6.7%
4.1%
3.1%
3.0%
2.9%
2.4%
1.8%
1.8%
Europe
Los Angeles
Hong Kong
France
Sydney
Italy
Switzerland
S. Korea
Maldives
Canada
11
12
13
14
15
16
17
18
19
20
1.7%
1.7%
1.7%
1.6%
1.6%
1.5%
1.5%
1.5%
1.2%
1.1%
Top 20 account for 56.3% of total
Of which Asia/Pacific Destinations 14.1%
Top 20 Aspiration Destinations of Developed Asia/Pacific Travelers
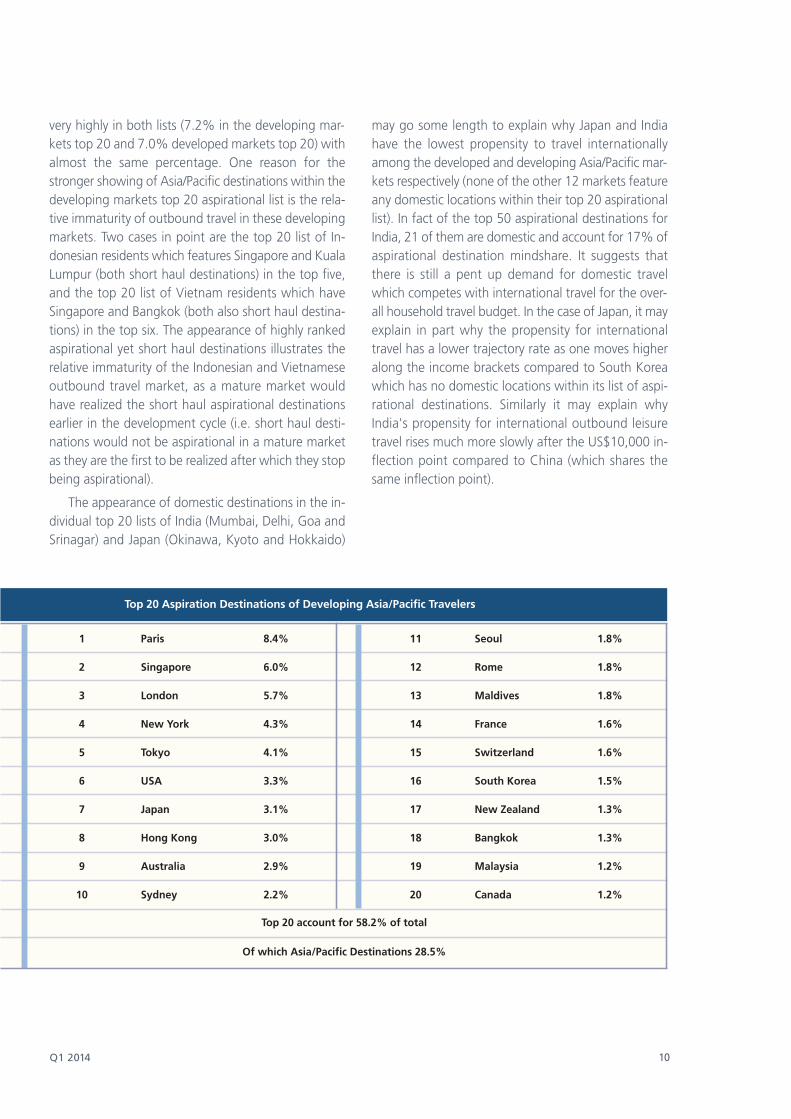
very highly in both lists (7.2% in the developing mar-kets top 20 and 7.0% developed markets top 20) withalmost the same percentage. One reason for thestronger showing of Asia/Pacific destinations within thedeveloping markets top 20 aspirational list is the rela-tive immaturity of outbound travel in these developingmarkets. Two cases in point are the top 20 list of In-donesian residents which features Singapore and KualaLumpur (both short haul destinations) in the top five,and the top 20 list of Vietnam residents which haveSingapore and Bangkok (both also short haul destina-tions) in the top six. The appearance of highly rankedaspirational yet short haul destinations illustrates therelative immaturity of the Indonesian and Vietnameseoutbound travel market, as a mature market wouldhave realized the short haul aspirational destinationsearlier in the development cycle (i.e. short haul desti-nations would not be aspirational in a mature marketas they are the first to be realized after which they stopbeing aspirational).
The appearance of domestic destinations in the in-dividual top 20 lists of India (Mumbai, Delhi, Goa andSrinagar) and Japan (Okinawa, Kyoto and Hokkaido)
may go some length to explain why Japan and Indiahave the lowest propensity to travel internationallyamong the developed and developing Asia/Pacific mar-kets respectively (none of the other 12 markets featureany domestic locations within their top 20 aspirationallist). In fact of the top 50 aspirational destinations forIndia, 21 of them are domestic and account for 17% ofaspirational destination mindshare. It suggests thatthere is still a pent up demand for domestic travelwhich competes with international travel for the over-all household travel budget. In the case of Japan, it mayexplain in part why the propensity for internationaltravel has a lower trajectory rate as one moves higheralong the income brackets compared to South Koreawhich has no domestic locations within its list of aspi-rational destinations. Similarly it may explain whyIndia's propensity for international outbound leisuretravel rises much more slowly after the US$10,000 in-flection point compared to China (which shares thesame inflection point).
Q1 2014 10
Paris
Singapore
London
New York
Tokyo
USA
Japan
Hong Kong
Australia
Sydney
1
2
3
4
5
6
7
8
9
10
8.4%
6.0%
5.7%
4.3%
4.1%
3.3%
3.1%
3.0%
2.9%
2.2%
Seoul
Rome
Maldives
France
Switzerland
South Korea
New Zealand
Bangkok
Malaysia
Canada
11
12
13
14
15
16
17
18
19
20
1.8%
1.8%
1.8%
1.6%
1.6%
1.5%
1.3%
1.3%
1.2%
1.2%
Top 20 account for 58.2% of total
Of which Asia/Pacific Destinations 28.5%
Top 20 Aspiration Destinations of Developing Asia/Pacific Travelers
11 MasterCard Insights
Market Details
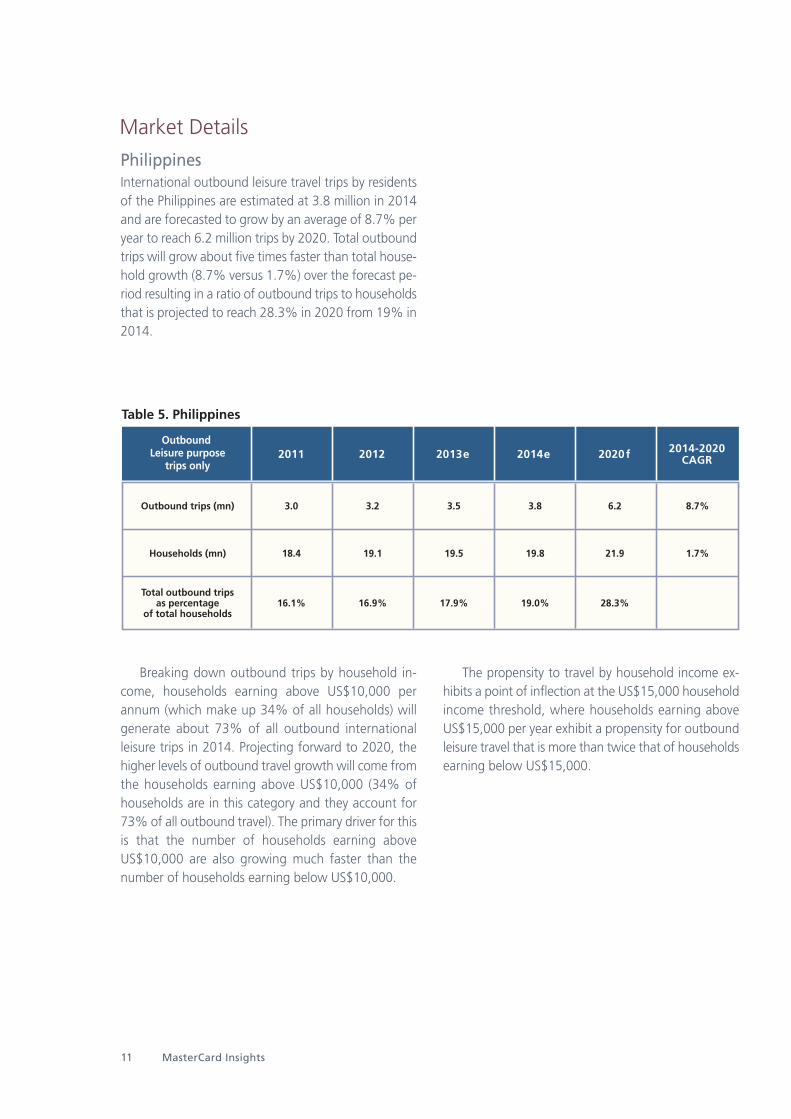
PhilippinesInternational outbound leisure travel trips by residentsof the Philippines are estimated at 3.8 million in 2014and are forecasted to grow by an average of 8.7% peryear to reach 6.2 million trips by 2020. Total outboundtrips will grow about five times faster than total house-hold growth (8.7% versus 1.7%) over the forecast pe-riod resulting in a ratio of outbound trips to householdsthat is projected to reach 28.3% in 2020 from 19% in2014.
Breaking down outbound trips by household in-come, households earning above US$10,000 perannum (which make up 34% of all households) willgenerate about 73% of all outbound internationalleisure trips in 2014. Projecting forward to 2020, thehigher levels of outbound travel growth will come fromthe households earning above US$10,000 (34% ofhouseholds are in this category and they account for73% of all outbound travel). The primary driver for thisis that the number of households earning aboveUS$10,000 are also growing much faster than thenumber of households earning below US$10,000.
The propensity to travel by household income ex-hibits a point of inflection at the US$15,000 householdincome threshold, where households earning aboveUS$15,000 per year exhibit a propensity for outboundleisure travel that is more than twice that of householdsearning below US$15,000.
Table 5. Philippines
Outbound Leisure purpose
trips only 2011 2012 2013e 2014e 2020f 2014-2020
CAGR
Outbound trips (mn)
Households (mn)
Total outbound tripsas percentage
of total households
3.0
18.4
16.1%
3.2
19.1
16.9%
3.5
19.5
17.9%
3.8
19.8
19.0%
6.2
21.9
28.3%
8.7%
1.7%
Q1 2014 12
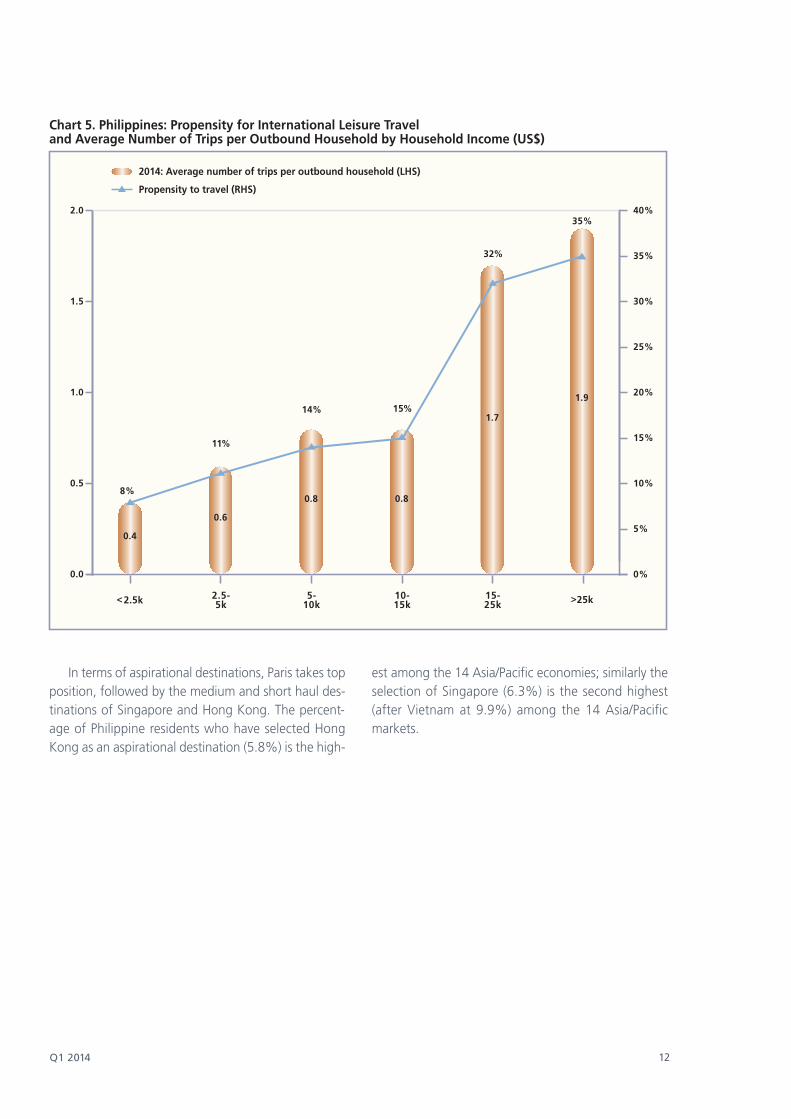
In terms of aspirational destinations, Paris takes topposition, followed by the medium and short haul des-tinations of Singapore and Hong Kong. The percent-age of Philippine residents who have selected HongKong as an aspirational destination (5.8%) is the high-
est among the 14 Asia/Pacific economies; similarly theselection of Singapore (6.3%) is the second highest(after Vietnam at 9.9%) among the 14 Asia/Pacificmarkets.
2.0
1.5
1.0
0.5
0.0
Chart 5. Philippines: Propensity for International Leisure Travel and Average Number of Trips per Outbound Household by Household Income (US$)
32%
15%14%
11%
8%
2014: Average number of trips per outbound household (LHS)
Propensity to travel (RHS)
<2.5k >25k
35%
2.5-5k
5-10k
10-15k
15-25k
0.4
0.6
0.8 0.8
1.7
1.9
40%
35%
30%
25%
20%
15%
10%
5%
0%

13 MasterCard Insights
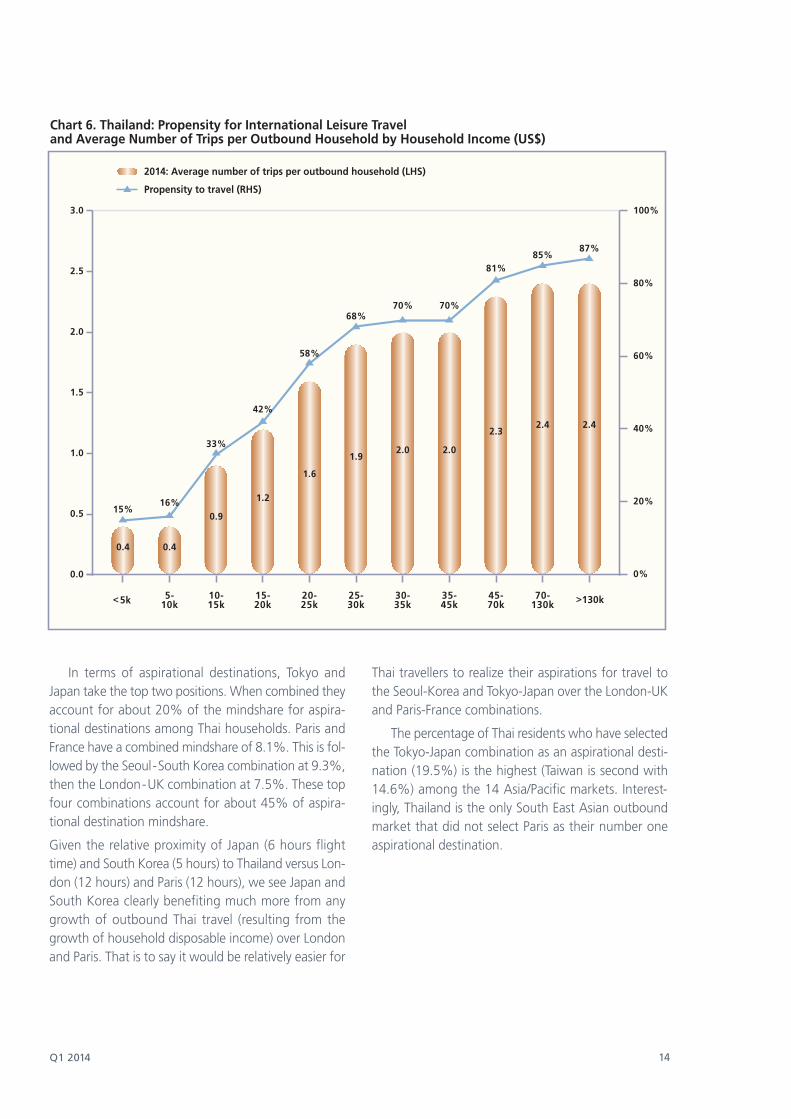
ThailandInternational outbound leisure travel trips by Thai resi-dents are estimated at 6.2 million in 2014, and areforecasted to grow by an average of 5.9% per year toreach 8.7 million trips by 2020. As overall householdgrowth is expected to remain stagnant over the fore-cast period, the ratio of outbound trips to total house-holds is projected to reach 48.8% in 2020 from 35%in 2014.
In Thailand about 88% of outbound trips are ac-counted for by households earning above US$10,000per annum in 2014. This income range accounts forabout 40% of all households. Projecting forward to2020, the higher levels of outbound travel growth willcome from the households earning above US$15,000(25% of households are in this category and they ac-count for 75% of all outbound travel). The primarydriver for this is that the number of households earn-ing above US$15,000 is also growing much faster thanthe number of households earning below US$15,000.
The propensity to travel by household income ex-hibits a point of inflection at US$10,000 household in-come levels at which we see a steeper increase in thepropensity to travel.
Table 6. Thailand
All Purpose Outbound trips(includes same-day
cross-border travel toMalaysia and Laos)
2011 2012 2013e 2014e 2020f 2014-2020CAGR
Outbound trips (mn)
Households (mn)
Total outbound tripsas percentage
of total households
5.4
17.3
31.1%
5.7
17.5
32.8%
6.0
17.5
34.2%
6.2
17.6
35.0%
8.7
17.8
48.8%
5.9%
0.2%
Q1 2014 14
Chart 6. Thailand: Propensity for International Leisure Travel and Average Number of Trips per Outbound Household by Household Income (US$)
In terms of aspirational destinations, Tokyo andJapan take the top two positions. When combined theyaccount for about 20% of the mindshare for aspira-tional destinations among Thai households. Paris andFrance have a combined mindshare of 8.1%. This is fol-lowed by the Seoul-South Korea combination at 9.3%,then the London-UK combination at 7.5%. These topfour combinations account for about 45% of aspira-tional destination mindshare.
Given the relative proximity of Japan (6 hours flighttime) and South Korea (5 hours) to Thailand versus Lon-don (12 hours) and Paris (12 hours), we see Japan andSouth Korea clearly benefiting much more from anygrowth of outbound Thai travel (resulting from thegrowth of household disposable income) over Londonand Paris. That is to say it would be relatively easier for
Thai travellers to realize their aspirations for travel tothe Seoul-Korea and Tokyo-Japan over the London-UKand Paris-France combinations.
The percentage of Thai residents who have selectedthe Tokyo-Japan combination as an aspirational desti-nation (19.5%) is the highest (Taiwan is second with14.6%) among the 14 Asia/Pacific markets. Interest-ingly, Thailand is the only South East Asian outboundmarket that did not select Paris as their number oneaspirational destination.
2014: Average number of trips per outbound household (LHS)
Propensity to travel (RHS)
3.0
2.5
2.0
1.5
1.0
0.5
0.0
0.4 0.4
0.9
1.2
1.6
1.92.0 2.0
2.32.4 2.4
5-10k
10-15k
15-20k
20-25k
25-30k
30-35k
35-45k
45-70k
70-130k<5k >130k
100%
80%
60%
40%
20%
0%
87%85%
81%
70%70%68%
58%
42%
33%
16%15%
15 MasterCard Insights
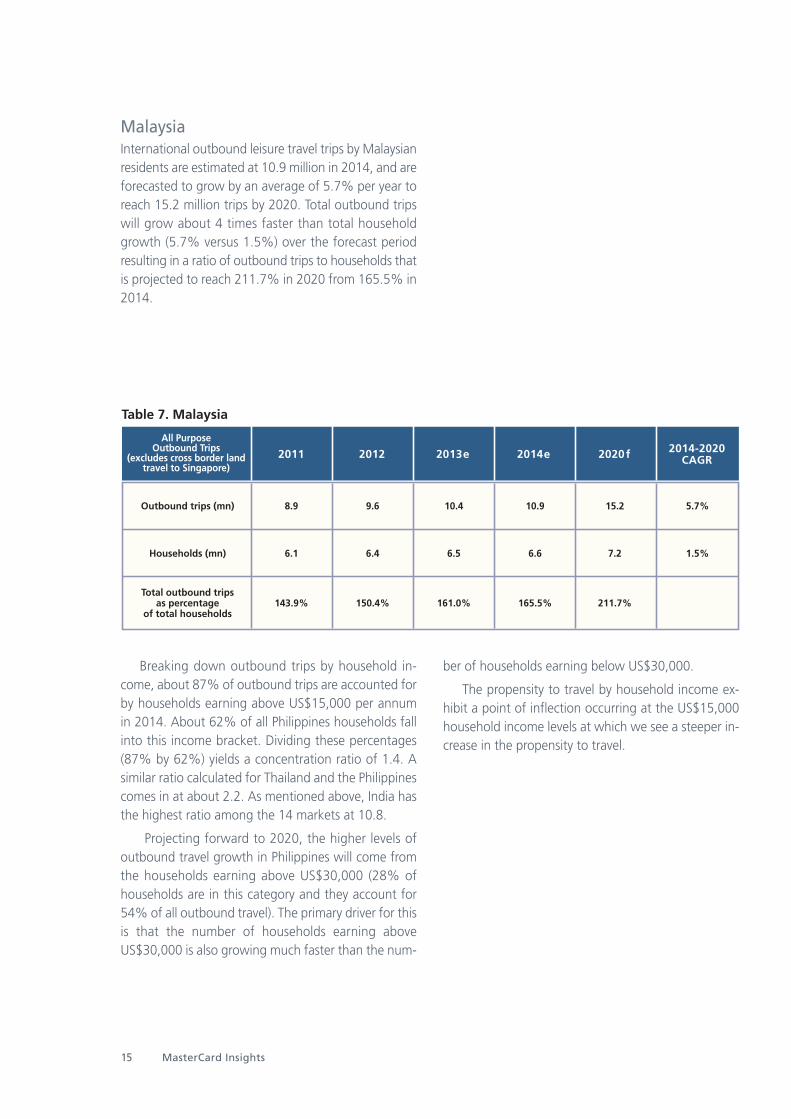
MalaysiaInternational outbound leisure travel trips by Malaysianresidents are estimated at 10.9 million in 2014, and areforecasted to grow by an average of 5.7% per year toreach 15.2 million trips by 2020. Total outbound tripswill grow about 4 times faster than total householdgrowth (5.7% versus 1.5%) over the forecast periodresulting in a ratio of outbound trips to households thatis projected to reach 211.7% in 2020 from 165.5% in2014.
Breaking down outbound trips by household in-come, about 87% of outbound trips are accounted forby households earning above US$15,000 per annumin 2014. About 62% of all Philippines households fallinto this income bracket. Dividing these percentages(87% by 62%) yields a concentration ratio of 1.4. Asimilar ratio calculated for Thailand and the Philippinescomes in at about 2.2. As mentioned above, India hasthe highest ratio among the 14 markets at 10.8.
Projecting forward to 2020, the higher levels ofoutbound travel growth in Philippines will come fromthe households earning above US$30,000 (28% ofhouseholds are in this category and they account for54% of all outbound travel). The primary driver for thisis that the number of households earning aboveUS$30,000 is also growing much faster than the num-
ber of households earning below US$30,000.
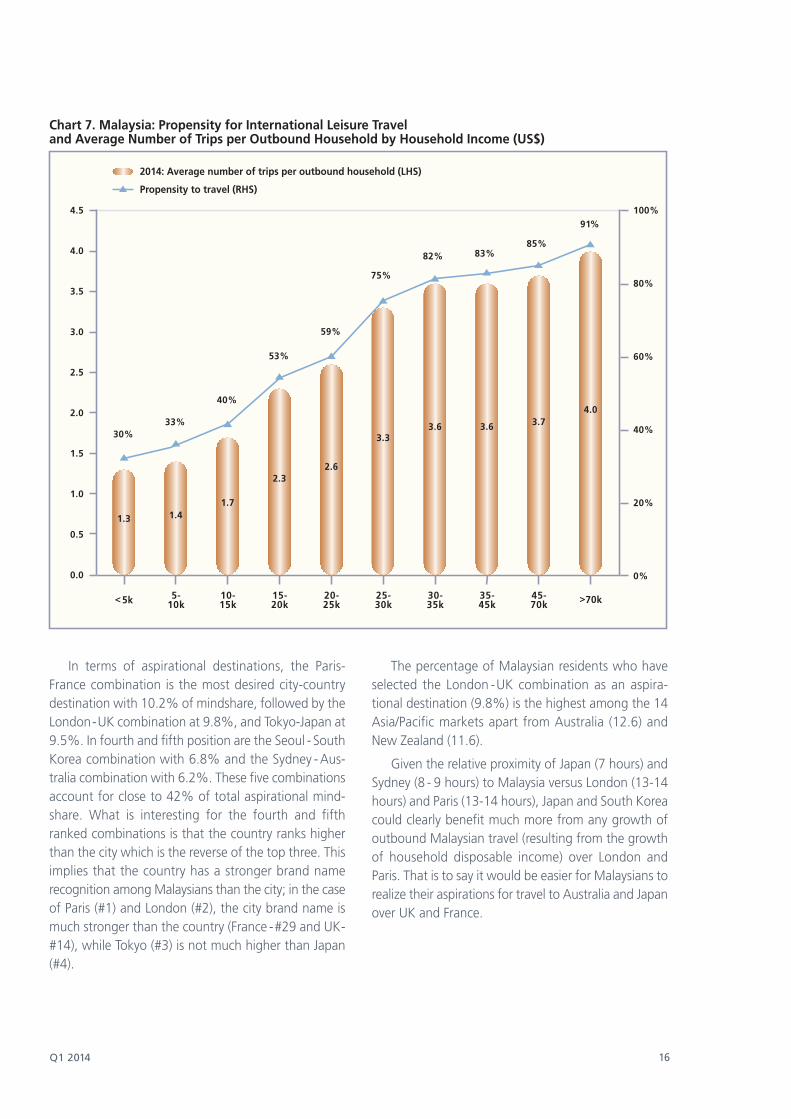
The propensity to travel by household income ex-hibit a point of inflection occurring at the US$15,000household income levels at which we see a steeper in-crease in the propensity to travel.
Table 7. Malaysia
All Purpose Outbound Trips
(excludes cross border landtravel to Singapore)
2011 2012 2013e 2014e 2020f 2014-2020CAGR
Outbound trips (mn)
Households (mn)
Total outbound tripsas percentage
of total households
8.9
6.1
143.9%
9.6
6.4
150.4%
10.4
6.5
161.0%
10.9
6.6
165.5%
15.2
7.2
211.7%
5.7%
1.5%
Q1 2014 16
In terms of aspirational destinations, the Paris-France combination is the most desired city-countrydestination with 10.2% of mindshare, followed by theLondon-UK combination at 9.8%, and Tokyo-Japan at9.5%. In fourth and fifth position are the Seoul - SouthKorea combination with 6.8% and the Sydney - Aus-tralia combination with 6.2%. These five combinationsaccount for close to 42% of total aspirational mind-share. What is interesting for the fourth and fifthranked combinations is that the country ranks higherthan the city which is the reverse of the top three. Thisimplies that the country has a stronger brand namerecognition among Malaysians than the city; in the caseof Paris (#1) and London (#2), the city brand name ismuch stronger than the country (France -#29 and UK-#14), while Tokyo (#3) is not much higher than Japan(#4).
The percentage of Malaysian residents who haveselected the London -UK combination as an aspira-tional destination (9.8%) is the highest among the 14Asia/Pacific markets apart from Australia (12.6) andNew Zealand (11.6).
Given the relative proximity of Japan (7 hours) andSydney (8 - 9 hours) to Malaysia versus London (13-14hours) and Paris (13-14 hours), Japan and South Koreacould clearly benefit much more from any growth ofoutbound Malaysian travel (resulting from the growthof household disposable income) over London andParis. That is to say it would be easier for Malaysians torealize their aspirations for travel to Australia and Japanover UK and France.
4.5
4.0
3.5
3.0
2.5
2.0
1.5
1.0
0.5
0.0
100%
80%
60%
40%
20%
0%
5-10k
Chart 7. Malaysia: Propensity for International Leisure Travel and Average Number of Trips per Outbound Household by Household Income (US$)
<5k >70k
1.3
30%
1.4
33%
10-15k
1.7
40%
15-20k
2.3
53%
20-25k
2.6
59%
25-30k
3.3
75%
30-35k
3.6
82%
35-45k
3.6
83%
45-70k
3.7
85%
4.0
91%
2014: Average number of trips per outbound household (LHS)
Propensity to travel (RHS)

17 MasterCard Insights
SingaporeInternational outbound leisure travel trips by Singa-porean residents are estimated at 8.7 million in 2014,and are forecasted to grow by an average of 5.3% peryear to reach 11.8 million trips by 2020. Total out-bound trips will grow about three times faster thantotal household growth (5.3% versus 1.7%) over theforecast period resulting in a ratio of outbound trips tohouseholds that is projected to reach 696% in 2020from 566.1% in 2014. Singaporean households havethe highest ratio of outbound trips to householdsamong the 14 Asia/Pacific markets. The lack of do-mestic tourism is possibly a strong reason for such high
ratios.International outbound leisure travel trips by Sin-gaporean residents are estimated at 8.7 million in2014, and are forecasted to grow by an average of5.3% per year to reach 11.8 million trips by 2020. Totaloutbound trips will grow about three times faster thantotal household growth (5.3% versus 1.7%) over theforecast period resulting in a ratio of outbound trips tohouseholds that is projected to reach 696% in 2020from 566.1% in 2014. Singaporean households havethe highest ratio of outbound trips to householdsamong the 14 Asia/Pacific markets. The lack of do-mestic tourism is possibly a strong reason for such highratios.
About 86% of outbound trips in Singapore are ac-counted for by households earning above US$30,000per annum in 2014. This range accounts for about77.4% of all households and suggests that outboundtravel is quite evenly spread across income levels. Theconcentration ratio is therefore 1.1 (86% by 77.4%)which is the lowest (tied with Taiwan which is also at1.1) among the 14 Asia/Pacific markets.
Projecting forward to 2020, growth of outboundtravel will come from the households earning aboveUS$100,000 (21% of households are in this categoryand they account for 27% of all outbound travel). Thenumber of households earning above US$100,000 isalso growing much faster than the number of house-holds earning below US$100,000.
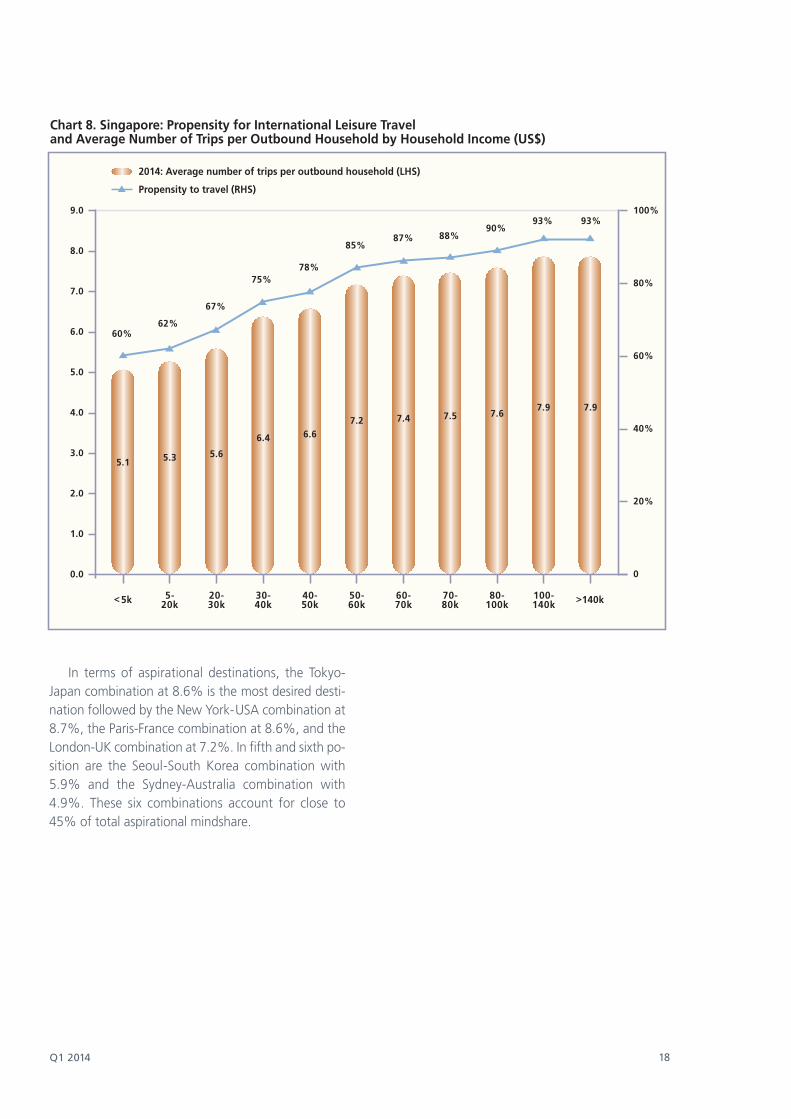
The propensity to travel by household income ex-hibits a linear type curve which is consistent with ourearlier observation that outbound travel by Singa-porean residents is quite evenly spread across incomelevels.
Table 8. Singapore
All Purpose Outbound trips(excludes cross border land
travel to Malaysia)2011 2012 2013e 2014e 2020f 2014-2020
CAGR
Outbound trips (mn)
Households (mn)
Total outbound tripsas percentage
of total households
7.8
1.4
548.4%
8.0
1.5
546.4%
8.5
1.5
562.3%
8.7
1.5
566.1%
11.8
1.7
696.4%
5.3%
1.7%
Q1 2014 18
Chart 8. Singapore: Propensity for International Leisure Travel and Average Number of Trips per Outbound Household by Household Income (US$)
In terms of aspirational destinations, the Tokyo-Japan combination at 8.6% is the most desired desti-nation followed by the New York-USA combination at8.7%, the Paris-France combination at 8.6%, and theLondon-UK combination at 7.2%. In fifth and sixth po-sition are the Seoul-South Korea combination with5.9% and the Sydney-Australia combination with4.9%. These six combinations account for close to45% of total aspirational mindshare.
9.0
8.0
7.0
6.0
5.0
4.0
3.0
2.0
1.0
0.0
100%
80%
60%
40%
20%
0
5-20k
20-30k
30-40k
40-50k
50-60k
60-70k
70-80k
80-100k
100-140k
<5k >140k
87%85%
78%75%
67%
62%60%
7.57.47.26.66.4
5.65.35.1
88%
7.6
90%
7.9
93%
7.9
93%
2014: Average number of trips per outbound household (LHS)
Propensity to travel (RHS)
19 MasterCard Insights
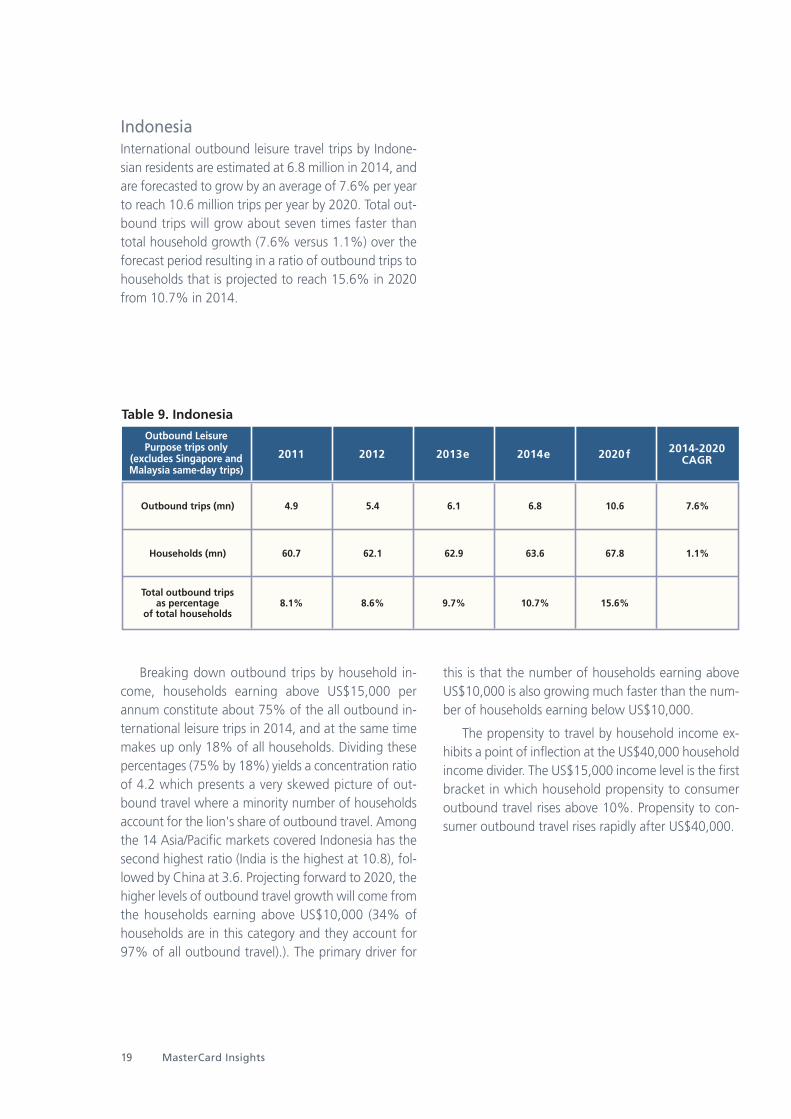
IndonesiaInternational outbound leisure travel trips by Indone-sian residents are estimated at 6.8 million in 2014, andare forecasted to grow by an average of 7.6% per yearto reach 10.6 million trips per year by 2020. Total out-bound trips will grow about seven times faster thantotal household growth (7.6% versus 1.1%) over theforecast period resulting in a ratio of outbound trips tohouseholds that is projected to reach 15.6% in 2020from 10.7% in 2014.
Breaking down outbound trips by household in-come, households earning above US$15,000 perannum constitute about 75% of the all outbound in-ternational leisure trips in 2014, and at the same timemakes up only 18% of all households. Dividing thesepercentages (75% by 18%) yields a concentration ratioof 4.2 which presents a very skewed picture of out-bound travel where a minority number of householdsaccount for the lion's share of outbound travel. Amongthe 14 Asia/Pacific markets covered Indonesia has thesecond highest ratio (India is the highest at 10.8), fol-lowed by China at 3.6. Projecting forward to 2020, thehigher levels of outbound travel growth will come fromthe households earning above US$10,000 (34% ofhouseholds are in this category and they account for97% of all outbound travel).). The primary driver for
this is that the number of households earning aboveUS$10,000 is also growing much faster than the num-ber of households earning below US$10,000.
The propensity to travel by household income ex-hibits a point of inflection at the US$40,000 householdincome divider. The US$15,000 income level is the firstbracket in which household propensity to consumeroutbound travel rises above 10%. Propensity to con-sumer outbound travel rises rapidly after US$40,000.
Table 9. Indonesia
Outbound Leisure Purpose trips only
(excludes Singapore andMalaysia same-day trips)
2011 2012 2013e 2014e 2020f 2014-2020CAGR
Outbound trips (mn)
Households (mn)
Total outbound tripsas percentage
of total households
4.9
60.7
8.1%
5.4
62.1
8.6%
6.1
62.9
9.7%
6.8
63.6
10.7%
10.6
67.8
15.6%
7.6%
1.1%
Q1 2014 20
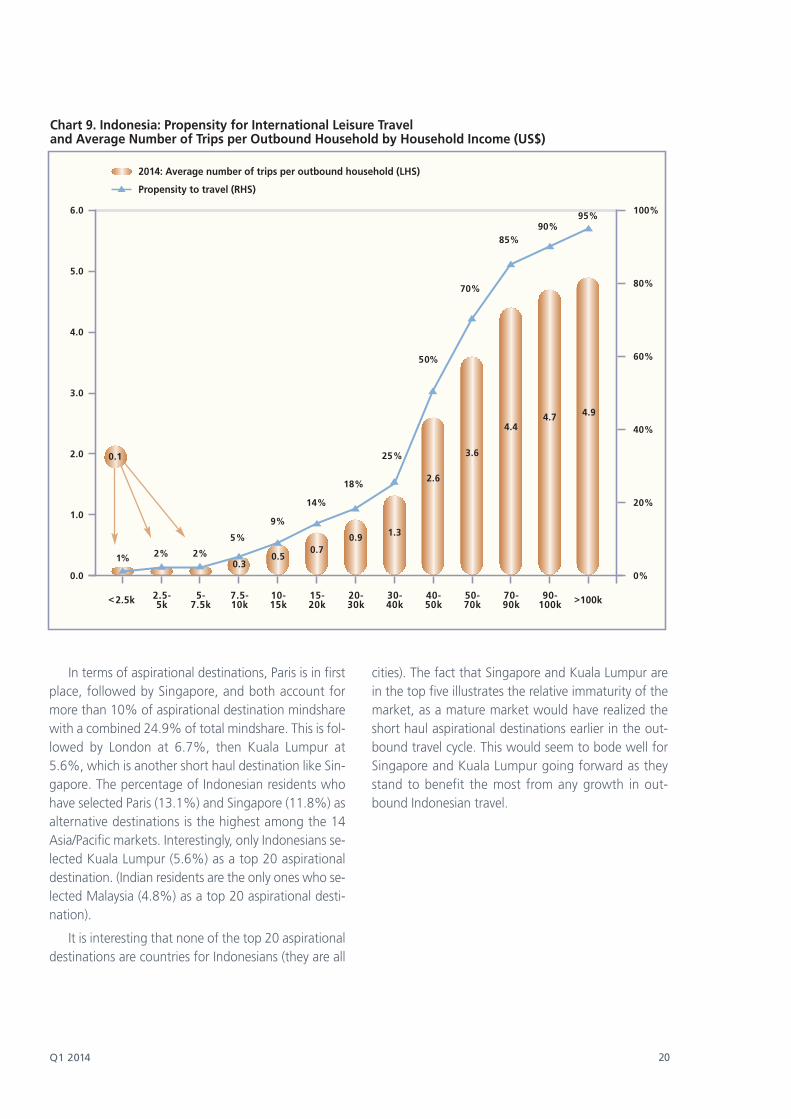
Chart 9. Indonesia: Propensity for International Leisure Travel and Average Number of Trips per Outbound Household by Household Income (US$)
In terms of aspirational destinations, Paris is in firstplace, followed by Singapore, and both account formore than 10% of aspirational destination mindsharewith a combined 24.9% of total mindshare. This is fol-lowed by London at 6.7%, then Kuala Lumpur at5.6%, which is another short haul destination like Sin-gapore. The percentage of Indonesian residents whohave selected Paris (13.1%) and Singapore (11.8%) asalternative destinations is the highest among the 14Asia/Pacific markets. Interestingly, only Indonesians se-lected Kuala Lumpur (5.6%) as a top 20 aspirationaldestination. (Indian residents are the only ones who se-lected Malaysia (4.8%) as a top 20 aspirational desti-nation).
It is interesting that none of the top 20 aspirationaldestinations are countries for Indonesians (they are all
cities). The fact that Singapore and Kuala Lumpur arein the top five illustrates the relative immaturity of themarket, as a mature market would have realized theshort haul aspirational destinations earlier in the out-bound travel cycle. This would seem to bode well forSingapore and Kuala Lumpur going forward as theystand to benefit the most from any growth in out-bound Indonesian travel.
100%
80%
60%
40%
20%
0%
2.5-5k
5-7.5k
7.5-10k
10-15k
15-20k
20-30k
30-40k
40-50k
50-70k
70-90k
90-100k<2.5k >100k
95%90%
85%
70%
50%
25%
18%
14%
9%
5%
0.30.5
0.70.9 1.3
2.6
3.6
4.44.7 4.9
2%2%1%
0.1
2014: Average number of trips per outbound household (LHS)
Propensity to travel (RHS)
6.0
5.0
4.0
3.0
2.0
1.0
0.0
21 MasterCard Insights
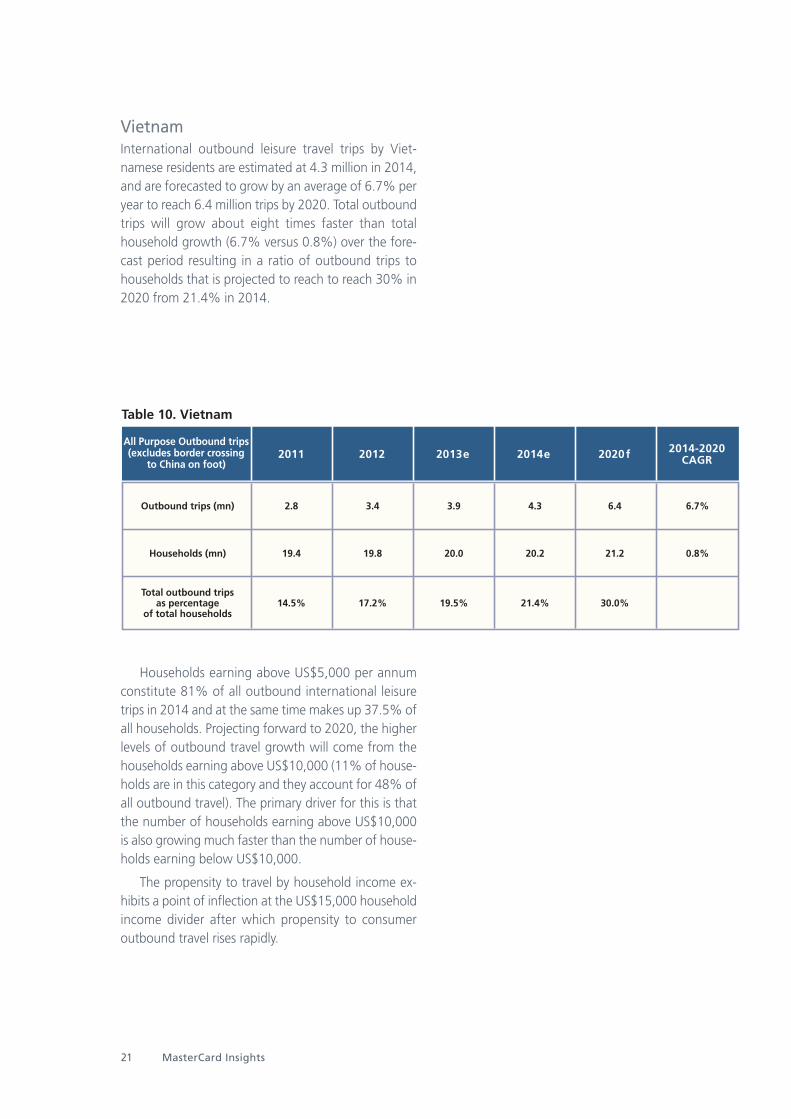
VietnamInternational outbound leisure travel trips by Viet-namese residents are estimated at 4.3 million in 2014,and are forecasted to grow by an average of 6.7% peryear to reach 6.4 million trips by 2020. Total outboundtrips will grow about eight times faster than totalhousehold growth (6.7% versus 0.8%) over the fore-cast period resulting in a ratio of outbound trips tohouseholds that is projected to reach to reach 30% in2020 from 21.4% in 2014.
Households earning above US$5,000 per annumconstitute 81% of all outbound international leisuretrips in 2014 and at the same time makes up 37.5% ofall households. Projecting forward to 2020, the higherlevels of outbound travel growth will come from thehouseholds earning above US$10,000 (11% of house-holds are in this category and they account for 48% ofall outbound travel). The primary driver for this is thatthe number of households earning above US$10,000is also growing much faster than the number of house-holds earning below US$10,000.
The propensity to travel by household income ex-hibits a point of inflection at the US$15,000 householdincome divider after which propensity to consumeroutbound travel rises rapidly.
Table 10. Vietnam
All Purpose Outbound trips(excludes border crossing
to China on foot)2011 2012 2013e 2014e 2020f 2014-2020
CAGR
Outbound trips (mn)
Households (mn)
Total outbound tripsas percentage
of total households
2.8
19.4
14.5%
3.4
19.8
17.2%
3.9
20.0
19.5%
4.3
20.2
21.4%
6.4
21.2
30.0%
6.7%
0.8%
Q1 2014 22
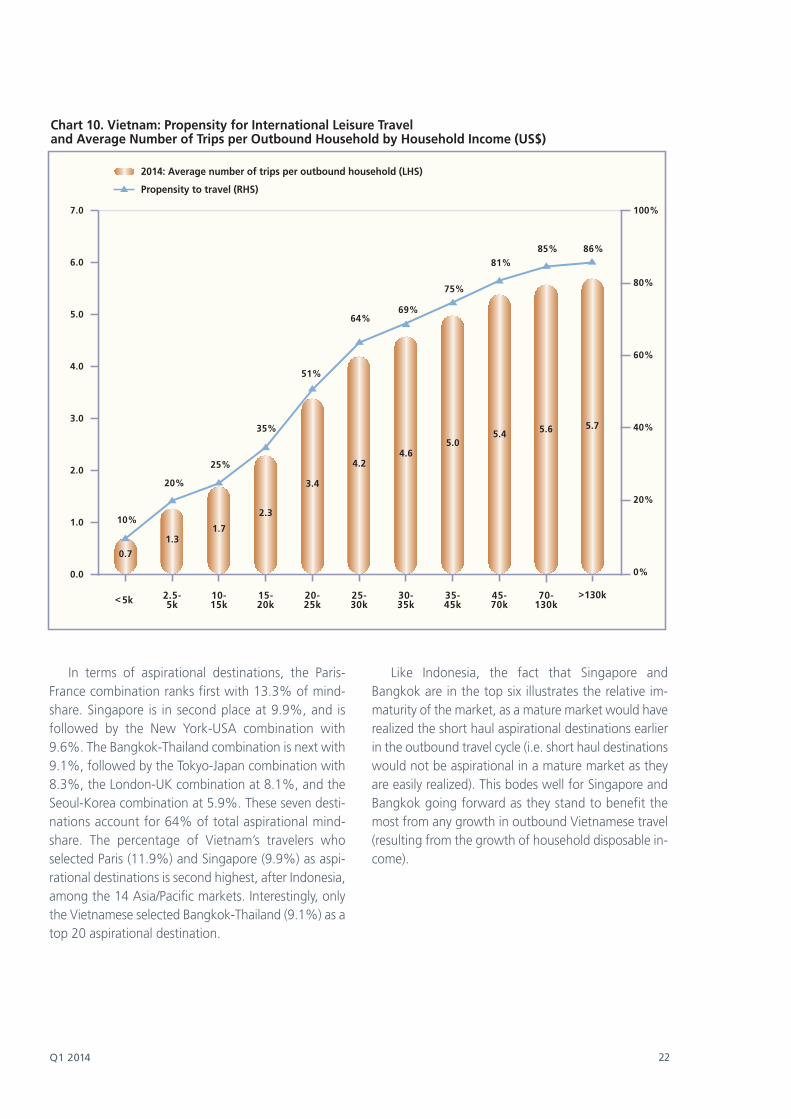
In terms of aspirational destinations, the Paris-France combination ranks first with 13.3% of mind-share. Singapore is in second place at 9.9%, and isfollowed by the New York-USA combination with9.6%. The Bangkok-Thailand combination is next with9.1%, followed by the Tokyo-Japan combination with8.3%, the London-UK combination at 8.1%, and theSeoul-Korea combination at 5.9%. These seven desti-nations account for 64% of total aspirational mind-share. The percentage of Vietnam’s travelers whoselected Paris (11.9%) and Singapore (9.9%) as aspi-rational destinations is second highest, after Indonesia,among the 14 Asia/Pacific markets. Interestingly, onlythe Vietnamese selected Bangkok-Thailand (9.1%) as atop 20 aspirational destination.
Like Indonesia, the fact that Singapore andBangkok are in the top six illustrates the relative im-maturity of the market, as a mature market would haverealized the short haul aspirational destinations earlierin the outbound travel cycle (i.e. short haul destinationswould not be aspirational in a mature market as theyare easily realized). This bodes well for Singapore andBangkok going forward as they stand to benefit themost from any growth in outbound Vietnamese travel(resulting from the growth of household disposable in-come).
100%
80%
60%
40%
20%
0%
2.5-5k
Chart 10. Vietnam: Propensity for International Leisure Travel and Average Number of Trips per Outbound Household by Household Income (US$)
10-15k
15-20k
20-25k
25-30k
30-35k
35-45k
45-70k
70-130k<5k
>130k
69%64%
51%
35%
25%
20%
10%
5.04.6
4.2
3.4
2.3
1.71.3
0.7
75%
5.4
81%
5.6
85%
5.7
86%
2014: Average number of trips per outbound household (LHS)
Propensity to travel (RHS)
7.0
6.0
5.0
4.0
3.0
2.0
1.0
0.0
23 MasterCard Insights
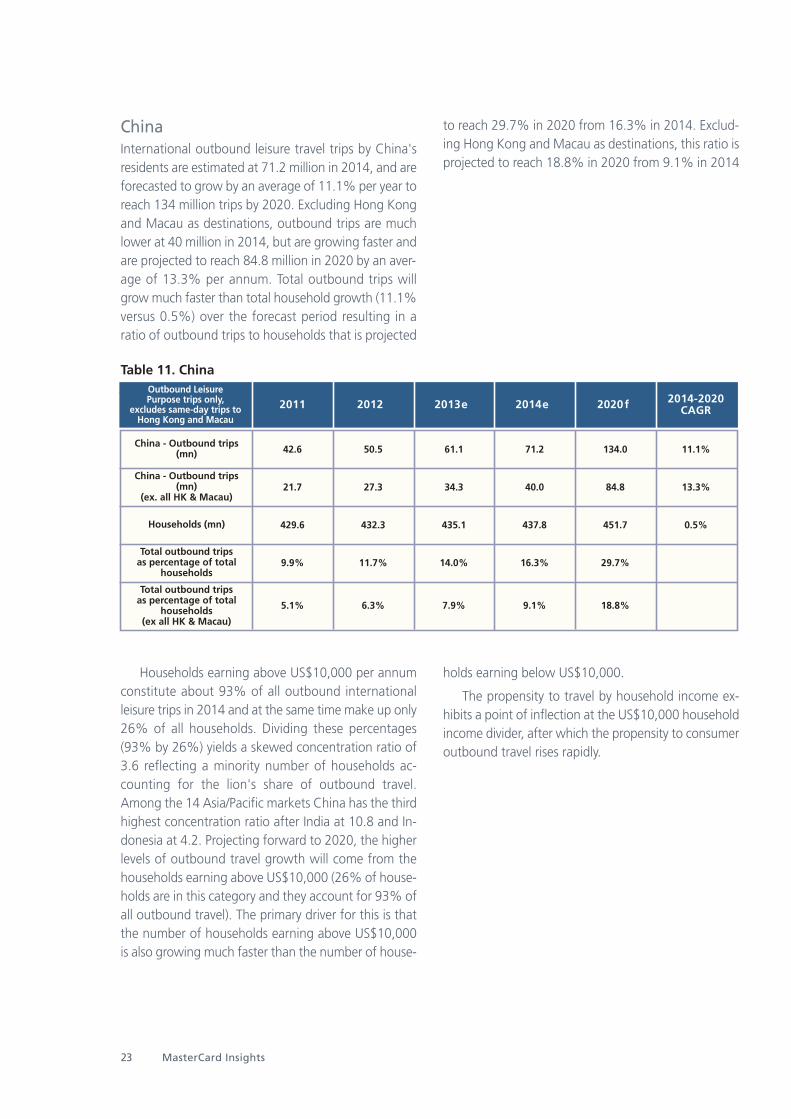
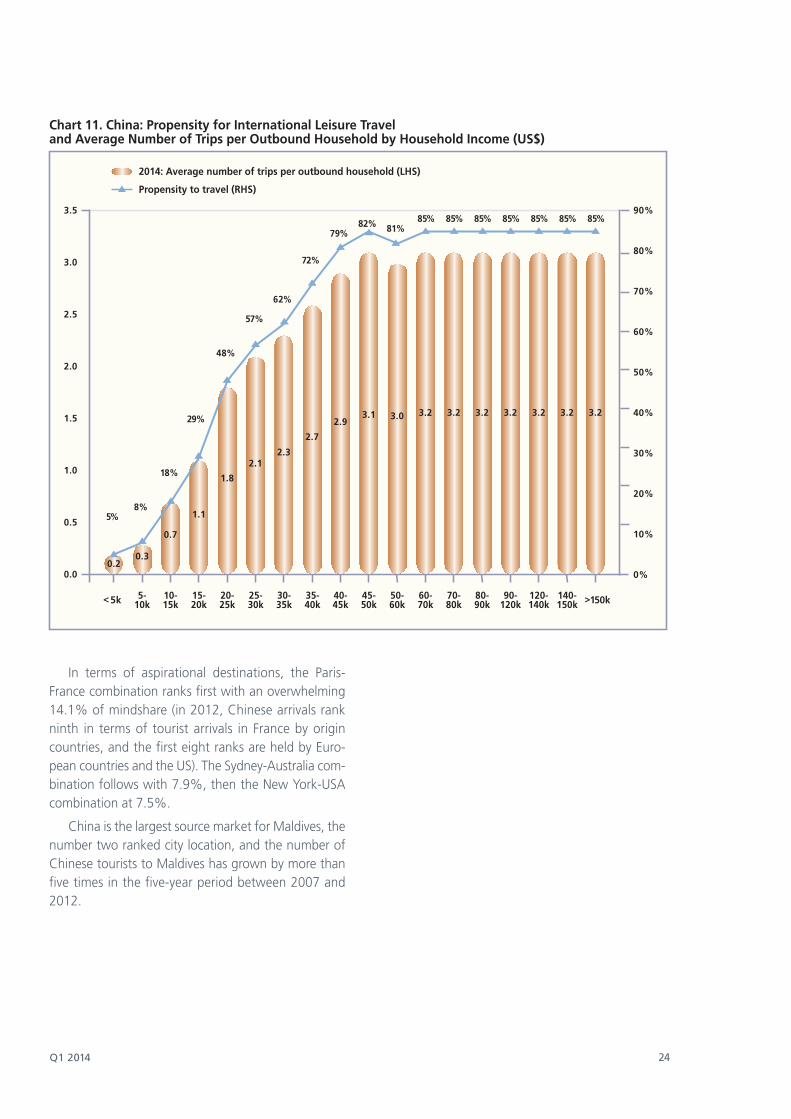
ChinaInternational outbound leisure travel trips by China'sresidents are estimated at 71.2 million in 2014, and areforecasted to grow by an average of 11.1% per year toreach 134 million trips by 2020. Excluding Hong Kongand Macau as destinations, outbound trips are muchlower at 40 million in 2014, but are growing faster andare projected to reach 84.8 million in 2020 by an aver-age of 13.3% per annum. Total outbound trips willgrow much faster than total household growth (11.1%versus 0.5%) over the forecast period resulting in aratio of outbound trips to households that is projected
to reach 29.7% in 2020 from 16.3% in 2014. Exclud-ing Hong Kong and Macau as destinations, this ratio isprojected to reach 18.8% in 2020 from 9.1% in 2014
Households earning above US$10,000 per annumconstitute about 93% of all outbound internationalleisure trips in 2014 and at the same time make up only26% of all households. Dividing these percentages(93% by 26%) yields a skewed concentration ratio of3.6 reflecting a minority number of households ac-counting for the lion's share of outbound travel.Among the 14 Asia/Pacific markets China has the thirdhighest concentration ratio after India at 10.8 and In-donesia at 4.2. Projecting forward to 2020, the higherlevels of outbound travel growth will come from thehouseholds earning above US$10,000 (26% of house-holds are in this category and they account for 93% ofall outbound travel). The primary driver for this is thatthe number of households earning above US$10,000is also growing much faster than the number of house-
holds earning below US$10,000.
The propensity to travel by household income ex-hibits a point of inflection at the US$10,000 householdincome divider, after which the propensity to consumeroutbound travel rises rapidly.
Table 11. ChinaOutbound Leisure Purpose trips only,
excludes same-day trips toHong Kong and Macau
2011 2012 2013e 2014e 2020f 2014-2020CAGR
China - Outbound trips(mn)
China - Outbound trips(mn)
(ex. all HK & Macau)
Households (mn)
Total outbound trips as percentage of total
households
Total outbound trips as percentage of total
households (ex all HK & Macau)
42.6 50.5 61.1 71.2 134.0 11.1%
21.7 27.3 34.3 40.0 84.8 13.3%
429.6 432.3 435.1 437.8 451.7 0.5%
9.9% 11.7% 14.0% 16.3% 29.7%
5.1% 6.3% 7.9% 9.1% 18.8%
Q1 2014 24
In terms of aspirational destinations, the Paris-France combination ranks first with an overwhelming14.1% of mindshare (in 2012, Chinese arrivals rankninth in terms of tourist arrivals in France by origincountries, and the first eight ranks are held by Euro-pean countries and the US). The Sydney-Australia com-bination follows with 7.9%, then the New York-USAcombination at 7.5%.
China is the largest source market for Maldives, thenumber two ranked city location, and the number ofChinese tourists to Maldives has grown by more thanfive times in the five-year period between 2007 and2012.
3.5
3.0
2.5
2.0
1.5
1.0
0.5
0.0
90%
80%
70%
60%
50%
40%
30%
20%
10%
0%
5-10k
10-15k
15-20k
20-25k
25-30k
30-35k
35-40k
40-45k
45-50k
50-60k
60-70k
70-80k
80-90k
90-120k
120-140k
140-150k
Chart 11. China: Propensity for International Leisure Travel and Average Number of Trips per Outbound Household by Household Income (US$)
<5k >150k
5%
0.2
8%
0.3
18%
0.7
29%
1.1
48%
1.8
57%
2.1
62%
2.3
72%
2.7
79%
2.93.1 3.0
82% 81%85% 85% 85% 85% 85% 85% 85%
3.2 3.2 3.2 3.2 3.2 3.2 3.2
2014: Average number of trips per outbound household (LHS)
Propensity to travel (RHS)
25 MasterCard Insights
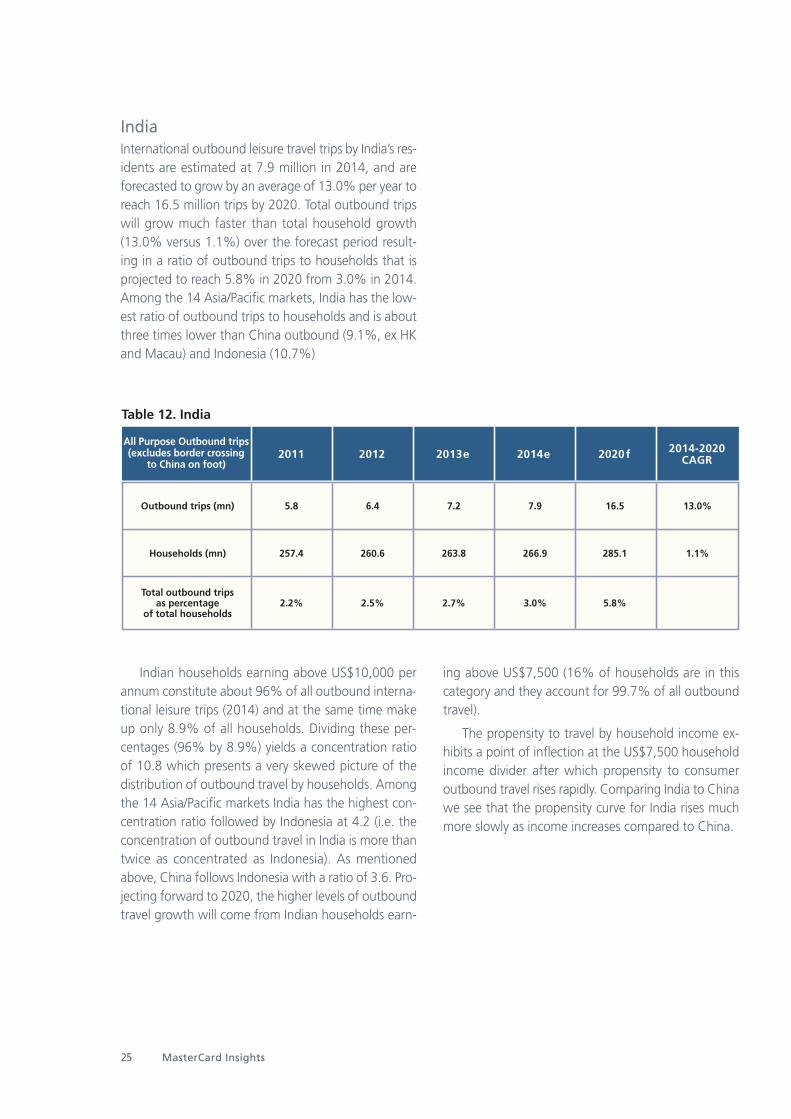
IndiaInternational outbound leisure travel trips by India’s res-idents are estimated at 7.9 million in 2014, and areforecasted to grow by an average of 13.0% per year toreach 16.5 million trips by 2020. Total outbound tripswill grow much faster than total household growth(13.0% versus 1.1%) over the forecast period result-ing in a ratio of outbound trips to households that isprojected to reach 5.8% in 2020 from 3.0% in 2014.Among the 14 Asia/Pacific markets, India has the low-est ratio of outbound trips to households and is aboutthree times lower than China outbound (9.1%, ex HKand Macau) and Indonesia (10.7%)
Indian households earning above US$10,000 perannum constitute about 96% of all outbound interna-tional leisure trips (2014) and at the same time makeup only 8.9% of all households. Dividing these per-centages (96% by 8.9%) yields a concentration ratioof 10.8 which presents a very skewed picture of thedistribution of outbound travel by households. Amongthe 14 Asia/Pacific markets India has the highest con-centration ratio followed by Indonesia at 4.2 (i.e. theconcentration of outbound travel in India is more thantwice as concentrated as Indonesia). As mentionedabove, China follows Indonesia with a ratio of 3.6. Pro-jecting forward to 2020, the higher levels of outboundtravel growth will come from Indian households earn-
ing above US$7,500 (16% of households are in thiscategory and they account for 99.7% of all outboundtravel).
The propensity to travel by household income ex-hibits a point of inflection at the US$7,500 householdincome divider after which propensity to consumeroutbound travel rises rapidly. Comparing India to Chinawe see that the propensity curve for India rises muchmore slowly as income increases compared to China.
Table 12. India
All Purpose Outbound trips(excludes border crossing
to China on foot)2011 2012 2013e 2014e 2020f 2014-2020
CAGR
Outbound trips (mn)
Households (mn)
Total outbound tripsas percentage
of total households
5.8
257.4
2.2%
6.4
260.6
2.5%
7.2
263.8
2.7%
7.9
266.9
3.0%
16.5
285.1
5.8%
13.0%
1.1%
Q1 2014 26
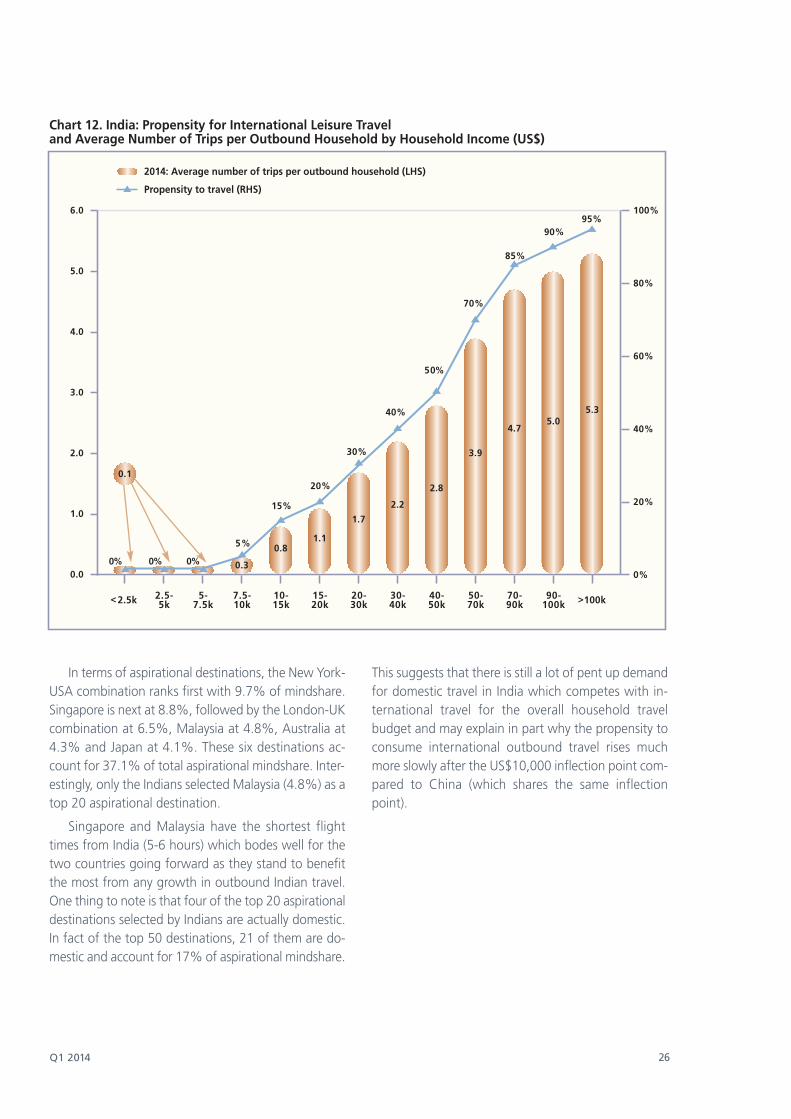
In terms of aspirational destinations, the New York-USA combination ranks first with 9.7% of mindshare.Singapore is next at 8.8%, followed by the London-UKcombination at 6.5%, Malaysia at 4.8%, Australia at4.3% and Japan at 4.1%. These six destinations ac-count for 37.1% of total aspirational mindshare. Inter-estingly, only the Indians selected Malaysia (4.8%) as atop 20 aspirational destination.
Singapore and Malaysia have the shortest flighttimes from India (5-6 hours) which bodes well for thetwo countries going forward as they stand to benefitthe most from any growth in outbound Indian travel.One thing to note is that four of the top 20 aspirationaldestinations selected by Indians are actually domestic.In fact of the top 50 destinations, 21 of them are do-mestic and account for 17% of aspirational mindshare.
This suggests that there is still a lot of pent up demandfor domestic travel in India which competes with in-ternational travel for the overall household travelbudget and may explain in part why the propensity toconsume international outbound travel rises muchmore slowly after the US$10,000 inflection point com-pared to China (which shares the same inflectionpoint).
6.0
5.0
4.0
3.0
2.0
1.0
0.0
100%
80%
60%
40%
20%
0%
2.5-5k
5-7.5k
7.5-10k
10-15k
15-20k
20-30k
30-40k
40-50k
50-70k
70-90k
90-100k
Chart 12. India: Propensity for International Leisure Travel and Average Number of Trips per Outbound Household by Household Income (US$)
<2.5k >100k
95%90%
85%
70%
50%
5% 0.8
2.2
0%0%0%
15%
1.1
30%
20%
1.7
40%
2.8
3.9
4.75.0
5.3
0.3
2014: Average number of trips per outbound household (LHS)
Propensity to travel (RHS)
0.1

27 MasterCard Insights
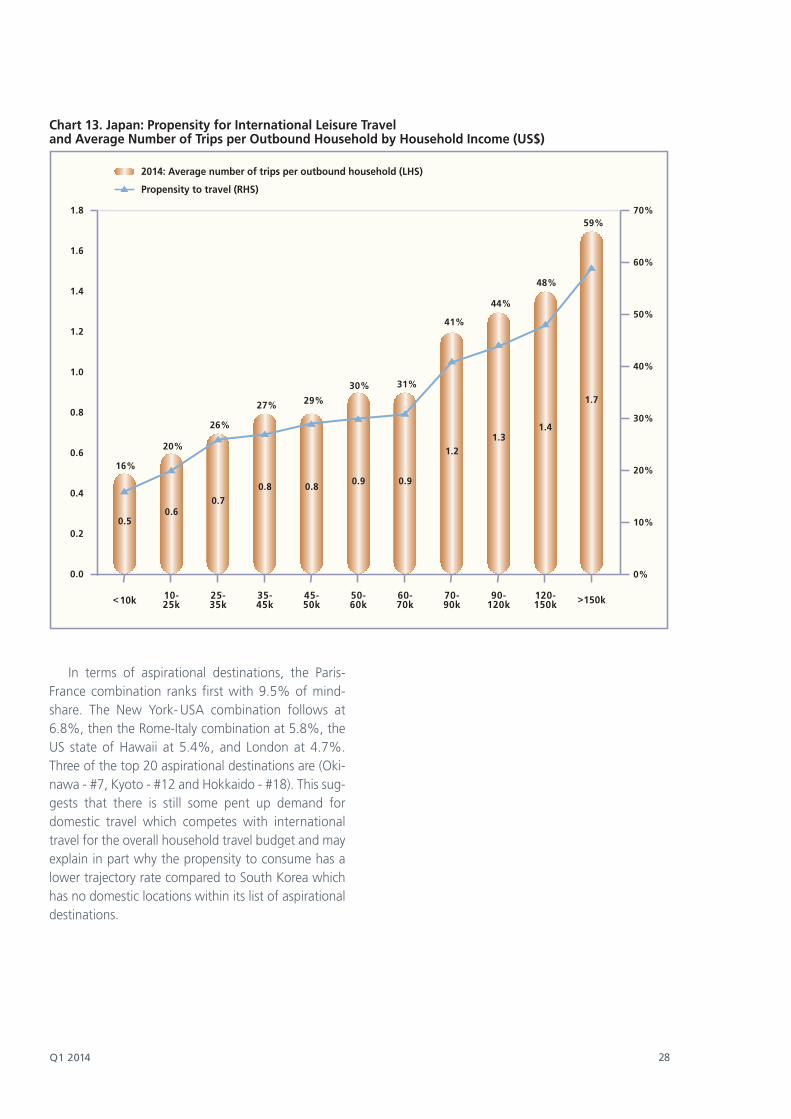
JapanInternational outbound leisure travel trips by Japaneseresidents are estimated at 17.3 million in 2014, and areforecasted to grow by an average of 1.1% per year toreach 18.4 million trips by 2020. Total outbound tripswill grow faster than total household growth which isdeclining (1.1% versus -0.2%) over the forecast periodresulting in a ratio of outbound trips to households thatis projected to reach 37.7% in 2020 from 35.0% in2014. This ratio is the lowest among the seven devel-oped markets in Asia/Pacific covered. The next lowestratio for a developed market is Korea with 82.3%which is more than double Japan's.
About 80% of outbound trips in Japan are ac-counted for by households earning above US$50,000per annum in 2014. This range accounts for about65.4% of all households and suggests that outboundtravel is quite evenly spread across income levels. Pro-jecting forward to 2020, outbound travel growth willcome from the households earning betweenUS$25,000-US$70,000 (62% of households are in thiscategory and they account for 42% of all outboundtravel). The total number of Japanese households isslowly declining but households in this income bracketare still increasing (albeit at a very low rate of growth).
The propensity to travel by household income ex-hibits a point of inflection at the US$70,000 householdincome threshold, above which it rises more rapidly.Despite the inflection point, the overall propensity
curve is still more or less linear. This is consistent withour earlier observation that outbound travel by Japan-ese residents is quite evenly spread across income lev-els.
Table 13. Japan
All PurposeOutbound trips 2011 2012 2013e 2014e 2020f 2014-2020
CAGR
Outbound trips (mn)
Households (mn)
Total outbound tripsas percentage
of total households
17.0
49.4
34.4%
18.5
49.4
37.4%
17.1
49.4
34.7%
17.3
49.3
35.0%
18.4
48.9
37.7%
1.1%
- 0.2%
Q1 2014 28
In terms of aspirational destinations, the Paris-France combination ranks first with 9.5% of mind-share. The New York- USA combination follows at6.8%, then the Rome-Italy combination at 5.8%, theUS state of Hawaii at 5.4%, and London at 4.7%.Three of the top 20 aspirational destinations are (Oki-nawa - #7, Kyoto - #12 and Hokkaido - #18). This sug-gests that there is still some pent up demand fordomestic travel which competes with internationaltravel for the overall household travel budget and mayexplain in part why the propensity to consume has alower trajectory rate compared to South Korea whichhas no domestic locations within its list of aspirationaldestinations.
70%
60%
50%
40%
30%
20%
10%
0%
10-25k
Chart 13. Japan: Propensity for International Leisure Travel and Average Number of Trips per Outbound Household by Household Income (US$)
25-35k
35-45k
45-50k
50-60k
60-70k
70-90k
90-120k
120-150k<10k >150k
0.60.5
1.8
1.6
1.4
1.2
1.0
0.8
0.6
0.4
0.2
0.0
16%
20%
26%
27%
0.70.8 0.8 0.9 0.9
1.21.3
1.4
1.729%
30% 31%
41%
44%
48%
59%
2014: Average number of trips per outbound household (LHS)
Propensity to travel (RHS)
29 MasterCard Insights
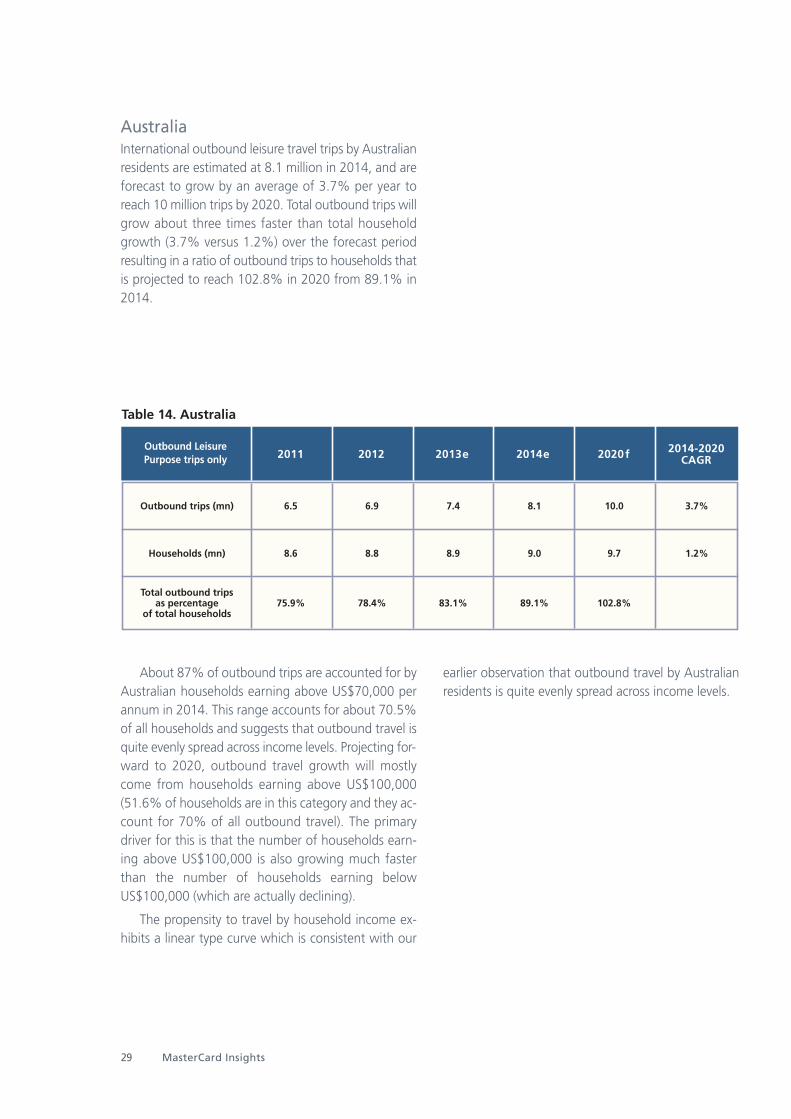
Australia International outbound leisure travel trips by Australianresidents are estimated at 8.1 million in 2014, and areforecast to grow by an average of 3.7% per year toreach 10 million trips by 2020. Total outbound trips willgrow about three times faster than total householdgrowth (3.7% versus 1.2%) over the forecast periodresulting in a ratio of outbound trips to households thatis projected to reach 102.8% in 2020 from 89.1% in2014.
About 87% of outbound trips are accounted for byAustralian households earning above US$70,000 perannum in 2014. This range accounts for about 70.5%of all households and suggests that outbound travel isquite evenly spread across income levels. Projecting for-ward to 2020, outbound travel growth will mostlycome from households earning above US$100,000(51.6% of households are in this category and they ac-count for 70% of all outbound travel). The primarydriver for this is that the number of households earn-ing above US$100,000 is also growing much fasterthan the number of households earning belowUS$100,000 (which are actually declining).
The propensity to travel by household income ex-hibits a linear type curve which is consistent with our
earlier observation that outbound travel by Australianresidents is quite evenly spread across income levels.
Table 14. Australia
Outbound LeisurePurpose trips only 2011 2012 2013e 2014e 2020f 2014-2020
CAGR
Outbound trips (mn)
Households (mn)
Total outbound tripsas percentage
of total households
6.5
8.6
75.9%
6.9
8.8
78.4%
7.4
8.9
83.1%
8.1
9.0
89.1%
10.0
9.7
102.8%
3.7%
1.2%
Q1 2014 30
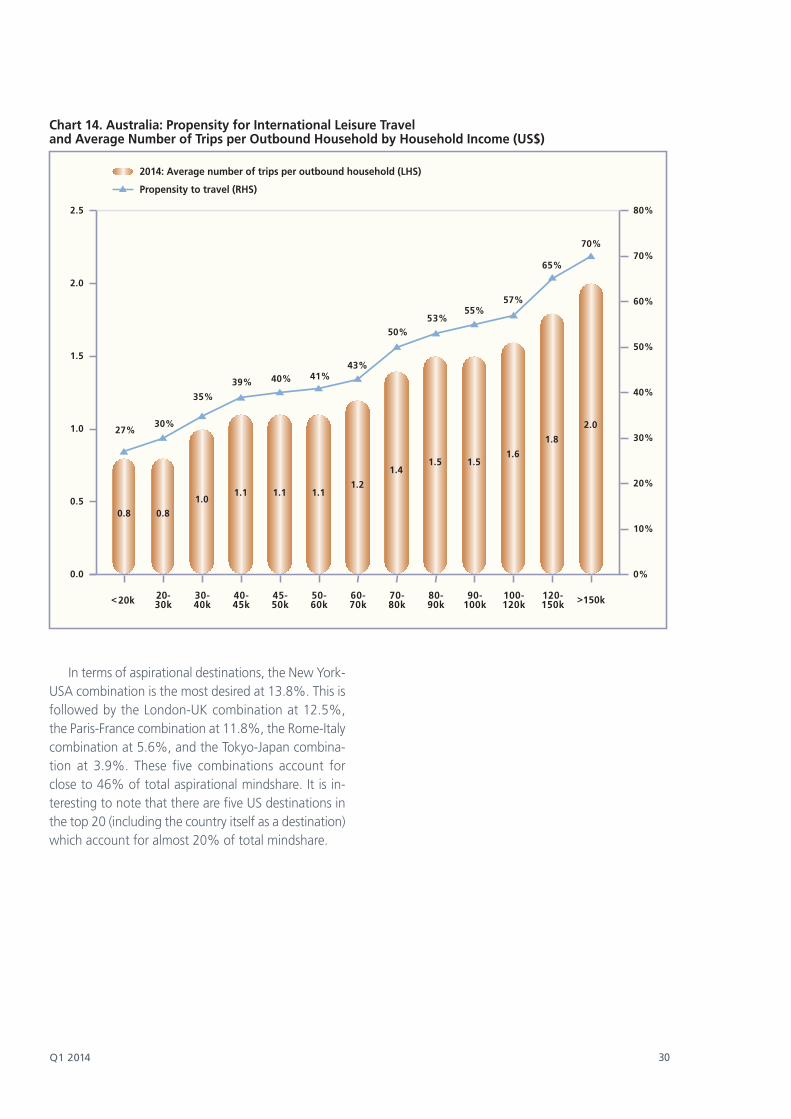
In terms of aspirational destinations, the New York-USA combination is the most desired at 13.8%. This isfollowed by the London-UK combination at 12.5%,the Paris-France combination at 11.8%, the Rome-Italycombination at 5.6%, and the Tokyo-Japan combina-tion at 3.9%. These five combinations account forclose to 46% of total aspirational mindshare. It is in-teresting to note that there are five US destinations inthe top 20 (including the country itself as a destination)which account for almost 20% of total mindshare.
2.5
2.0
1.5
1.0
0.5
0.0
80%
70%
60%
50%
40%
30%
20%
10%
0%
20-30k
30-40k
40-45k
45-50k
50-60k
60-70k
70-80k
80-90k
90-100k
100-120k
120-150k
Chart 14. Australia: Propensity for International Leisure Travel and Average Number of Trips per Outbound Household by Household Income (US$)
<20k >150k
70%
65%
57%55%
53%50%
43%41%40%39%
35%
30%27%
2014: Average number of trips per outbound household (LHS)
Propensity to travel (RHS)
0.8 0.81.0
1.1 1.1 1.11.2
1.41.5 1.5
1.6
1.8
2.0
31 MasterCard Insights
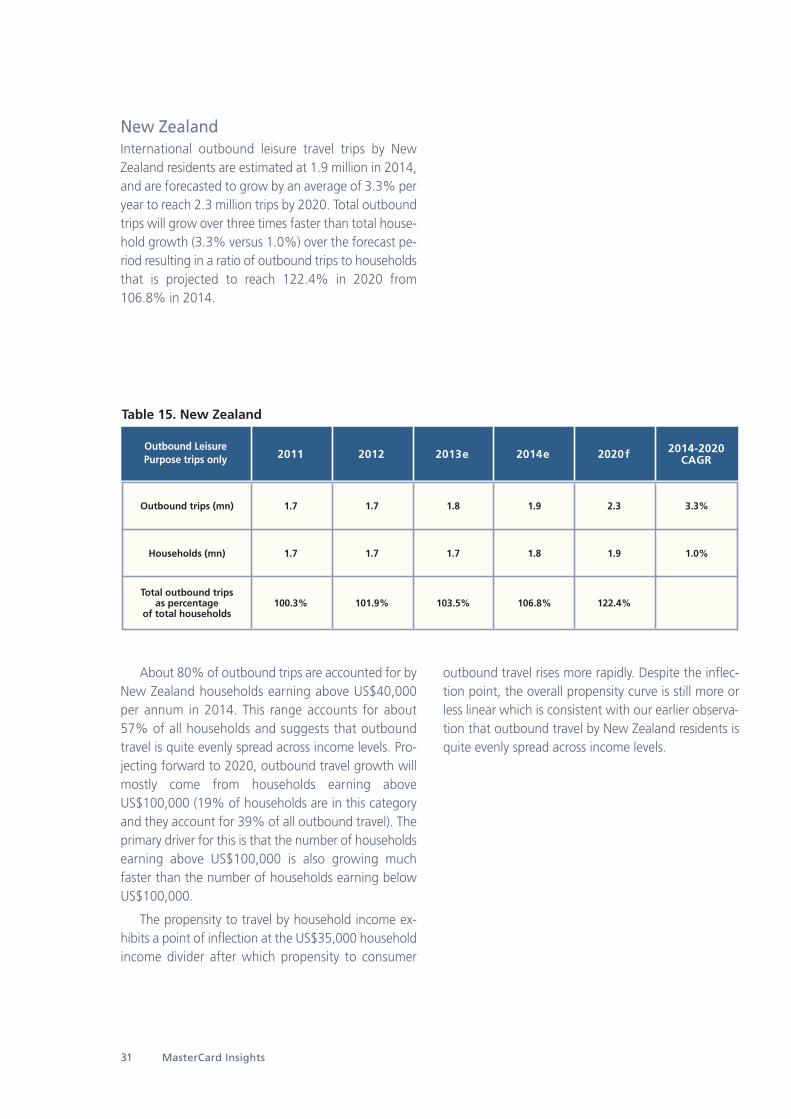
New ZealandInternational outbound leisure travel trips by NewZealand residents are estimated at 1.9 million in 2014,and are forecasted to grow by an average of 3.3% peryear to reach 2.3 million trips by 2020. Total outboundtrips will grow over three times faster than total house-hold growth (3.3% versus 1.0%) over the forecast pe-riod resulting in a ratio of outbound trips to householdsthat is projected to reach 122.4% in 2020 from106.8% in 2014.
About 80% of outbound trips are accounted for byNew Zealand households earning above US$40,000per annum in 2014. This range accounts for about57% of all households and suggests that outboundtravel is quite evenly spread across income levels. Pro-jecting forward to 2020, outbound travel growth willmostly come from households earning aboveUS$100,000 (19% of households are in this categoryand they account for 39% of all outbound travel). Theprimary driver for this is that the number of householdsearning above US$100,000 is also growing muchfaster than the number of households earning belowUS$100,000.
The propensity to travel by household income ex-hibits a point of inflection at the US$35,000 householdincome divider after which propensity to consumer
outbound travel rises more rapidly. Despite the inflec-tion point, the overall propensity curve is still more orless linear which is consistent with our earlier observa-tion that outbound travel by New Zealand residents isquite evenly spread across income levels.
Table 15. New Zealand
Outbound LeisurePurpose trips only 2011 2012 2013e 2014e 2020f 2014-2020
CAGR
Outbound trips (mn)
Households (mn)
Total outbound tripsas percentage
of total households
1.7
1.7
100.3%
1.7
1.7
101.9%
1.8
1.7
103.5%
1.9
1.8
106.8%
2.3
1.9
122.4%
3.3%
1.0%
Q1 2014 32
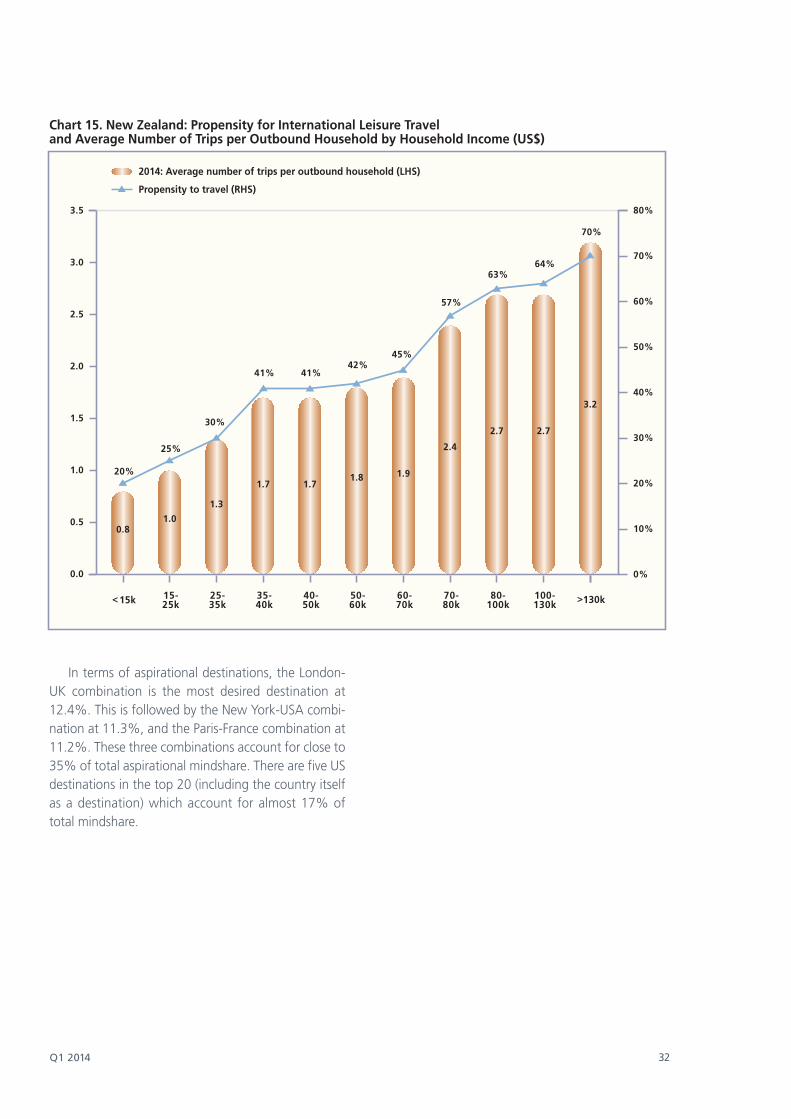
In terms of aspirational destinations, the London-UK combination is the most desired destination at12.4%. This is followed by the New York-USA combi-nation at 11.3%, and the Paris-France combination at11.2%. These three combinations account for close to35% of total aspirational mindshare. There are five USdestinations in the top 20 (including the country itselfas a destination) which account for almost 17% oftotal mindshare.
3.5
3.0
2.5
2.0
1.5
1.0
0.5
0.0
80%
70%
60%
50%
40%
30%
20%
10%
0%
20%
25%
30%
41% 41%42%
45%
57%
63%64%
70%
0.81.0
1.3
1.7 1.71.8 1.9
2.4
2.7 2.7
3.2
15-25k
25-35k
35-40k
40-50k
50-60k
60-70k
70-80k
80-100k
100-130k<15k >130k
Chart 15. New Zealand: Propensity for International Leisure Travel and Average Number of Trips per Outbound Household by Household Income (US$)
2014: Average number of trips per outbound household (LHS)
Propensity to travel (RHS)
33 MasterCard Insights
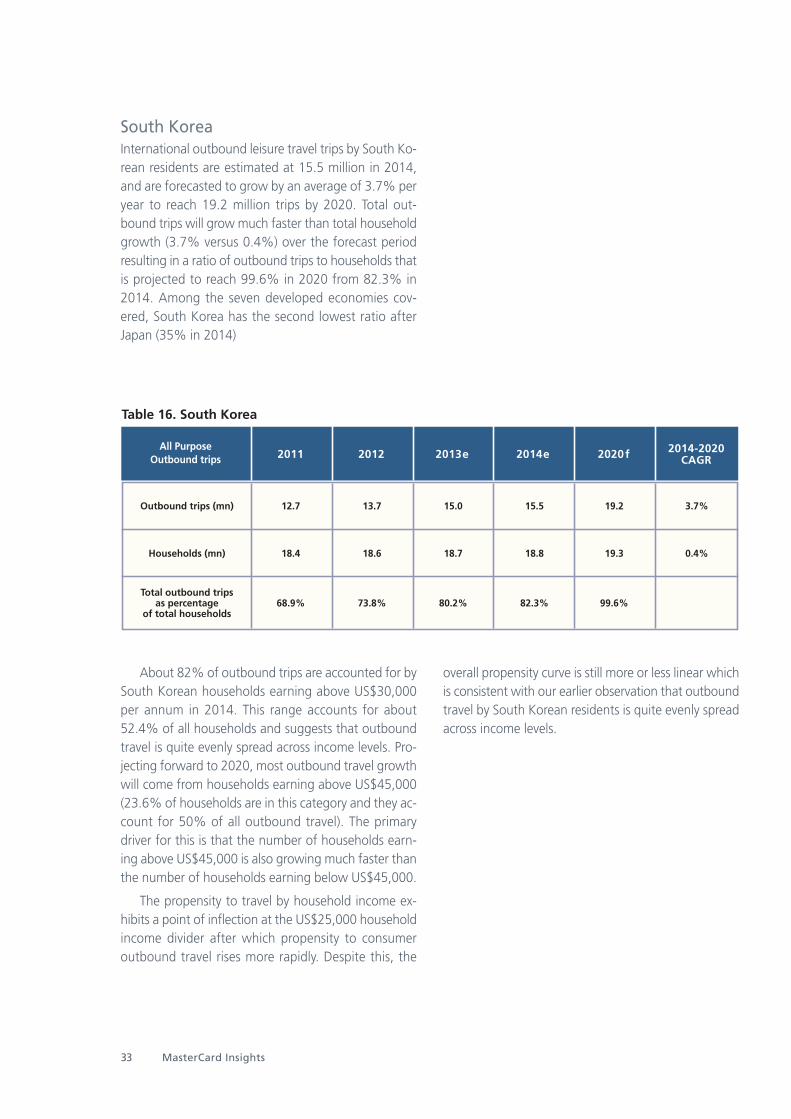
South KoreaInternational outbound leisure travel trips by South Ko-rean residents are estimated at 15.5 million in 2014,and are forecasted to grow by an average of 3.7% peryear to reach 19.2 million trips by 2020. Total out-bound trips will grow much faster than total householdgrowth (3.7% versus 0.4%) over the forecast periodresulting in a ratio of outbound trips to households thatis projected to reach 99.6% in 2020 from 82.3% in2014. Among the seven developed economies cov-ered, South Korea has the second lowest ratio afterJapan (35% in 2014)
About 82% of outbound trips are accounted for bySouth Korean households earning above US$30,000per annum in 2014. This range accounts for about52.4% of all households and suggests that outboundtravel is quite evenly spread across income levels. Pro-jecting forward to 2020, most outbound travel growthwill come from households earning above US$45,000(23.6% of households are in this category and they ac-count for 50% of all outbound travel). The primarydriver for this is that the number of households earn-ing above US$45,000 is also growing much faster thanthe number of households earning below US$45,000.
The propensity to travel by household income ex-hibits a point of inflection at the US$25,000 householdincome divider after which propensity to consumeroutbound travel rises more rapidly. Despite this, the
overall propensity curve is still more or less linear whichis consistent with our earlier observation that outboundtravel by South Korean residents is quite evenly spreadacross income levels.
Table 16. South Korea
All PurposeOutbound trips 2011 2012 2013e 2014e 2020f 2014-2020
CAGR
Outbound trips (mn)
Households (mn)
Total outbound tripsas percentage
of total households
12.7
18.4
68.9%
13.7
18.6
73.8%
15.0
18.7
80.2%
15.5
18.8
82.3%
19.2
19.3
99.6%
3.7%
0.4%

Q1 2014 34
In terms of aspirational destinations, the Paris-France combination is the most desired destination at13.8%. This is followed by the New York-USA combi-nation at 11.0%, and the London-UK combination at6.7%. The Sydney-Australia combination follows with7.9%, and the Rome-Italy combination comes next at5.6%. These five combinations account for close to45% of total aspirational mindshare. There are four USdestinations in the top 20 (including the country itselfas a destination) which account for almost 16% oftotal mindshare.
3.5
3.0
2.5
2.0
1.5
1.0
0.5
0.0
90%
80%
70%
60%
50%
40%
30%
20%
10%
0%
62%
59%
54%
46%
42%
37%
25%
22%21%
65%
70%
72%77%
Chart 16. South Korea: Propensity for International Leisure Travel and Average Number of Trips per Outbound Household by Household Income (US$)
2014: Average number of trips per outbound household (LHS)
Propensity to travel (RHS)
20-30k
30-40k
40-45k
45-50k
50-60k
60-70k
70-80k
80-90k
90-100k
100-120k
120-150k<20k >150k
0.9 0.91.1
1.5
1.8 1.9
2.32.5 2.6 2.7
2.93.0
3.2
35 MasterCard Insights
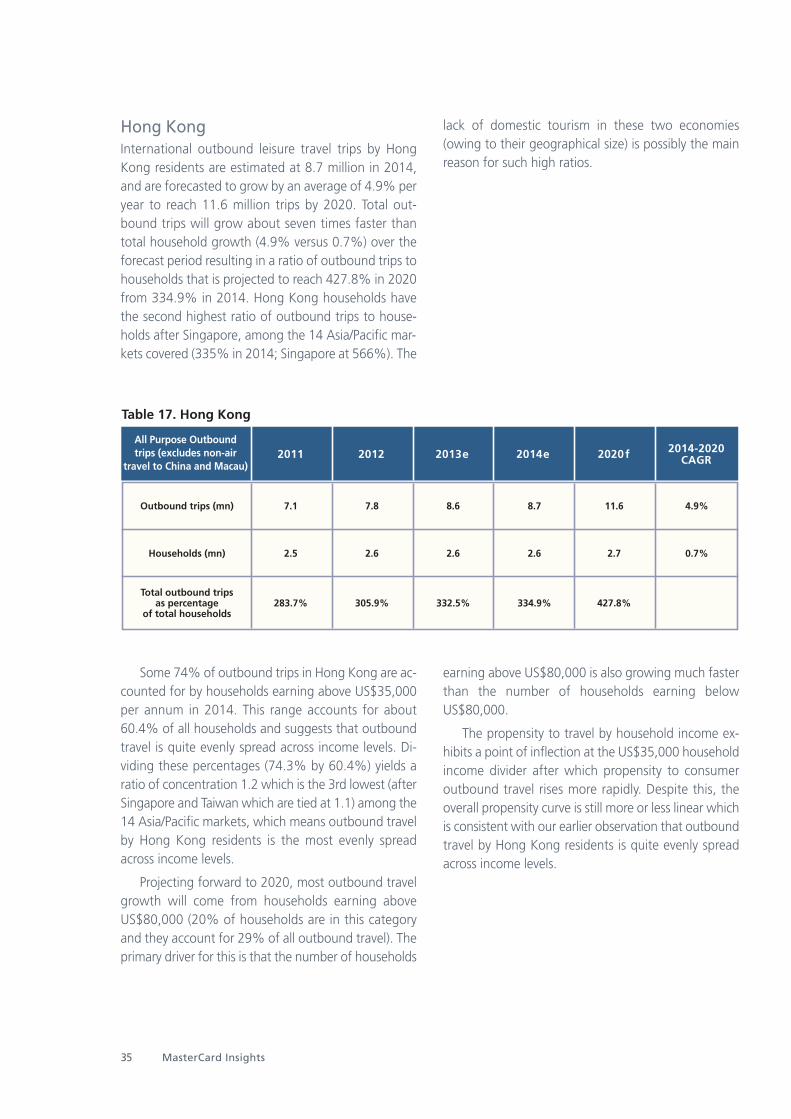
Hong KongInternational outbound leisure travel trips by HongKong residents are estimated at 8.7 million in 2014,and are forecasted to grow by an average of 4.9% peryear to reach 11.6 million trips by 2020. Total out-bound trips will grow about seven times faster thantotal household growth (4.9% versus 0.7%) over theforecast period resulting in a ratio of outbound trips tohouseholds that is projected to reach 427.8% in 2020from 334.9% in 2014. Hong Kong households havethe second highest ratio of outbound trips to house-holds after Singapore, among the 14 Asia/Pacific mar-kets covered (335% in 2014; Singapore at 566%). The
lack of domestic tourism in these two economies(owing to their geographical size) is possibly the mainreason for such high ratios.
Some 74% of outbound trips in Hong Kong are ac-counted for by households earning above US$35,000per annum in 2014. This range accounts for about60.4% of all households and suggests that outboundtravel is quite evenly spread across income levels. Di-viding these percentages (74.3% by 60.4%) yields aratio of concentration 1.2 which is the 3rd lowest (afterSingapore and Taiwan which are tied at 1.1) among the14 Asia/Pacific markets, which means outbound travelby Hong Kong residents is the most evenly spreadacross income levels.
Projecting forward to 2020, most outbound travelgrowth will come from households earning aboveUS$80,000 (20% of households are in this categoryand they account for 29% of all outbound travel). Theprimary driver for this is that the number of households
earning above US$80,000 is also growing much fasterthan the number of households earning belowUS$80,000.
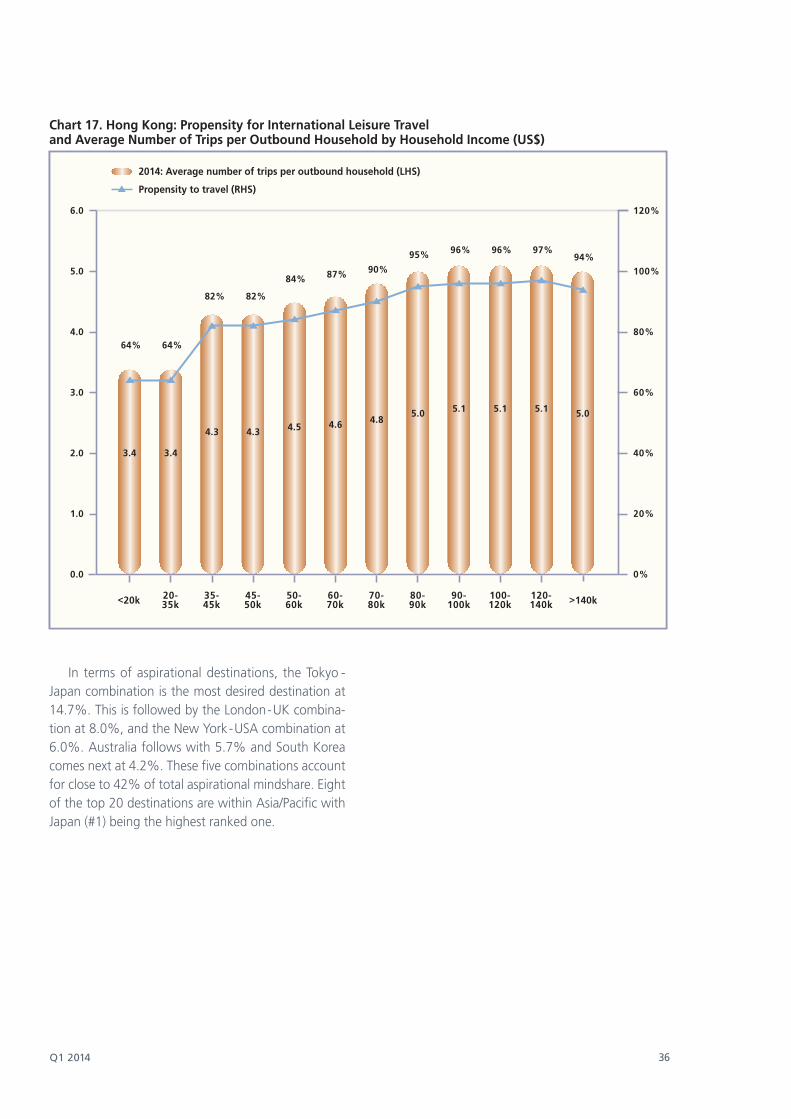
The propensity to travel by household income ex-hibits a point of inflection at the US$35,000 householdincome divider after which propensity to consumeroutbound travel rises more rapidly. Despite this, theoverall propensity curve is still more or less linear whichis consistent with our earlier observation that outboundtravel by Hong Kong residents is quite evenly spreadacross income levels.
Table 17. Hong Kong
All Purpose Outboundtrips (excludes non-air
travel to China and Macau)2011 2012 2013e 2014e 2020f 2014-2020
CAGR
Outbound trips (mn)
Households (mn)
Total outbound tripsas percentage
of total households
7.1
2.5
283.7%
7.8
2.6
305.9%
8.6
2.6
332.5%
8.7
2.6
334.9%
11.6
2.7
427.8%
4.9%
0.7%
Q1 2014 36
In terms of aspirational destinations, the Tokyo -Japan combination is the most desired destination at14.7%. This is followed by the London-UK combina-tion at 8.0%, and the New York-USA combination at6.0%. Australia follows with 5.7% and South Koreacomes next at 4.2%. These five combinations accountfor close to 42% of total aspirational mindshare. Eightof the top 20 destinations are within Asia/Pacific withJapan (#1) being the highest ranked one.
120%
100%
80%
60%
40%
20%
0%
20-35k >140k
Chart 17. Hong Kong: Propensity for International Leisure Travel and Average Number of Trips per Outbound Household by Household Income (US$)
6.0
5.0
4.0
3.0
2.0
1.0
0.0
<20k
64% 64%
82% 82%
84% 87% 90%
95% 96% 96% 97%94%
3.4
35-45k
3.4
45-50k
4.3
50-60k
4.3
60-70k
4.5
70-80k
4.6
80-90k
4.8
90-100k
5.0
100-120k
5.1
120-140k
5.1 5.1 5.0
2014: Average number of trips per outbound household (LHS)
Propensity to travel (RHS)
37 MasterCard Insights
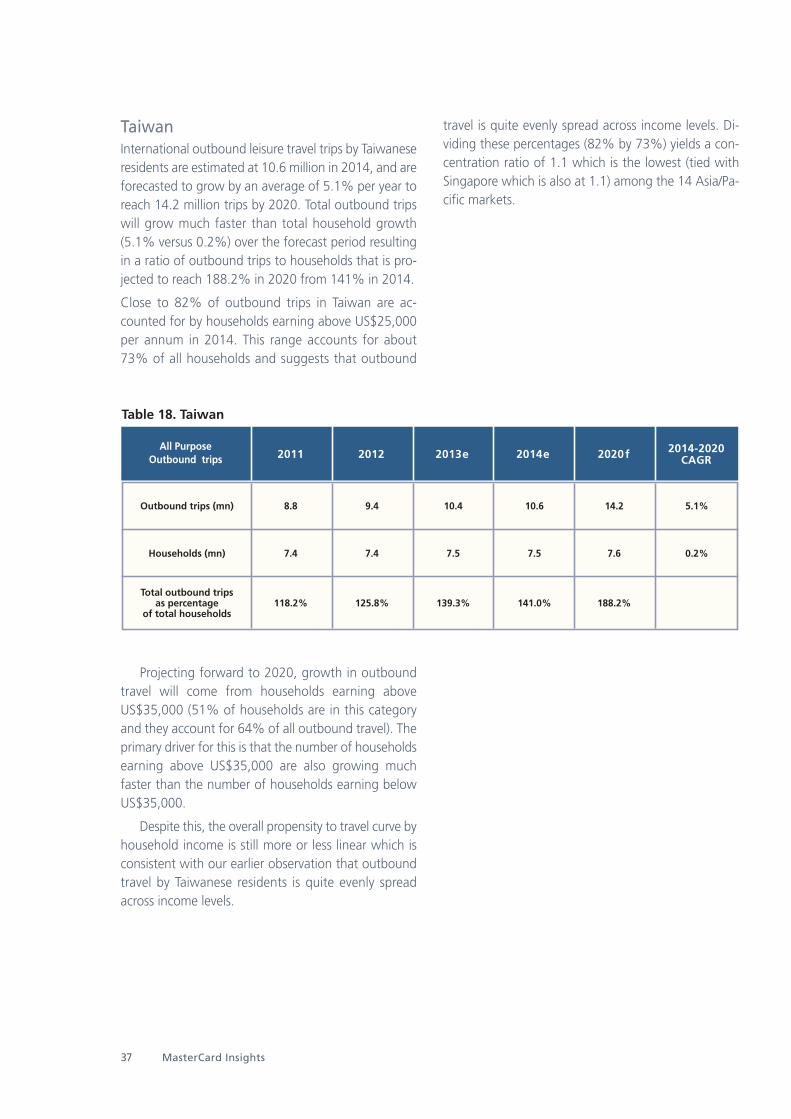
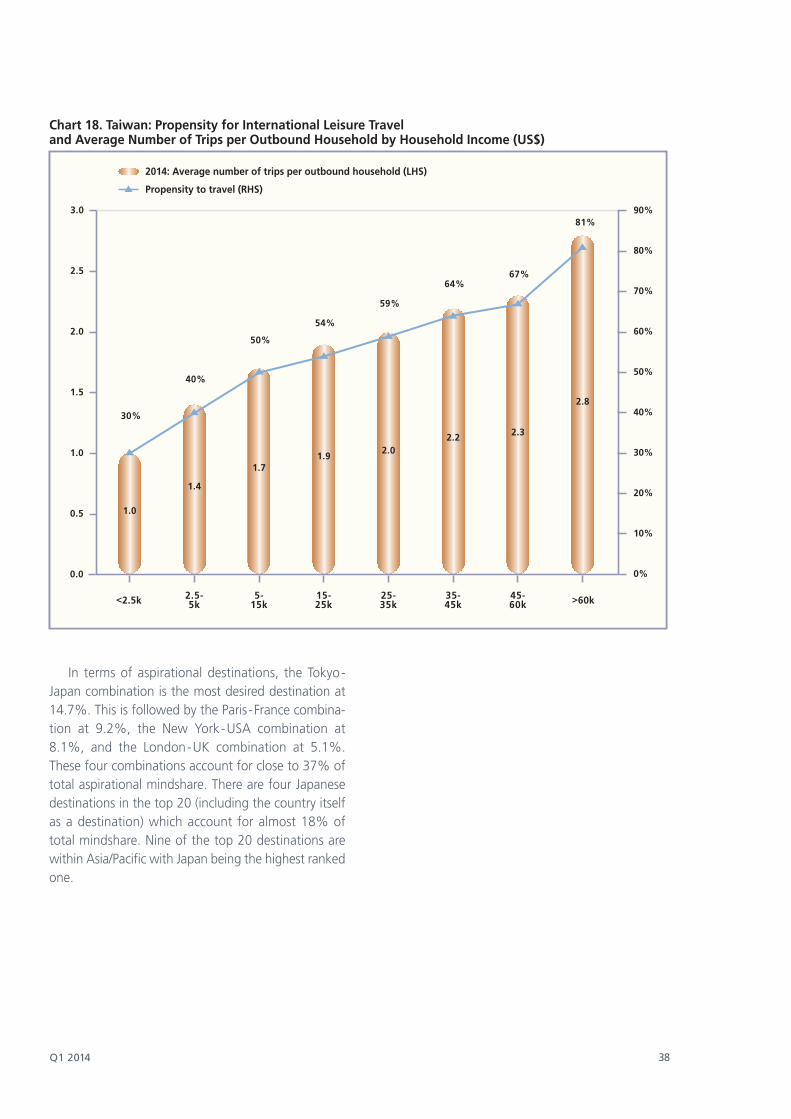
TaiwanInternational outbound leisure travel trips by Taiwaneseresidents are estimated at 10.6 million in 2014, and areforecasted to grow by an average of 5.1% per year toreach 14.2 million trips by 2020. Total outbound tripswill grow much faster than total household growth(5.1% versus 0.2%) over the forecast period resultingin a ratio of outbound trips to households that is pro-jected to reach 188.2% in 2020 from 141% in 2014.
Close to 82% of outbound trips in Taiwan are ac-counted for by households earning above US$25,000per annum in 2014. This range accounts for about73% of all households and suggests that outbound
travel is quite evenly spread across income levels. Di-viding these percentages (82% by 73%) yields a con-centration ratio of 1.1 which is the lowest (tied withSingapore which is also at 1.1) among the 14 Asia/Pa-cific markets.
Projecting forward to 2020, growth in outboundtravel will come from households earning aboveUS$35,000 (51% of households are in this categoryand they account for 64% of all outbound travel). Theprimary driver for this is that the number of householdsearning above US$35,000 are also growing muchfaster than the number of households earning belowUS$35,000.
Despite this, the overall propensity to travel curve byhousehold income is still more or less linear which isconsistent with our earlier observation that outboundtravel by Taiwanese residents is quite evenly spreadacross income levels.
Table 18. Taiwan
All PurposeOutbound trips 2011 2012 2013e 2014e 2020f 2014-2020
CAGR
Outbound trips (mn)
Households (mn)
Total outbound tripsas percentage
of total households
8.8
7.4
118.2%
9.4
7.4
125.8%
10.4
7.5
139.3%
10.6
7.5
141.0%
14.2
7.6
188.2%
5.1%
0.2%
Q1 2014 38
In terms of aspirational destinations, the Tokyo-Japan combination is the most desired destination at14.7%. This is followed by the Paris-France combina-tion at 9.2%, the New York-USA combination at8.1%, and the London-UK combination at 5.1%.These four combinations account for close to 37% oftotal aspirational mindshare. There are four Japanesedestinations in the top 20 (including the country itselfas a destination) which account for almost 18% oftotal mindshare. Nine of the top 20 destinations arewithin Asia/Pacific with Japan being the highest rankedone.
90%
80%
70%
60%
50%
40%
30%
20%
10%
0%
>60k
Chart 18. Taiwan: Propensity for International Leisure Travel and Average Number of Trips per Outbound Household by Household Income (US$)
<2.5k
30%
81%
1.0
2.8
2.5-5k
40%
1.4
5-15k
50%
1.7
15-25k
54%
1.9
25-35k
59%
2.0
35-45k
64%
2.2
45-60k
67%
2.3
3.0
2.5
2.0
1.5
1.0
0.5
0.0
2014: Average number of trips per outbound household (LHS)
Propensity to travel (RHS)

39 MasterCard Insights
Appendix: Research Methodology and Data Sources
Forecasting Methodology
The forecast of outbound travel in Asia/Pacific beginswith real GDP growth from 2014 to 2020. The IMFWEO series of GDP forecasts released in October 2013(for the 2014 to 2018 period) is adopted. It is then ex-tended to 2020 extrapolating the growth trends of2014 to 2018.
The next step is to apply the "propensity to travel"for each household income brackets obtained fromMasterCard surveys from 2012 to 2013 (see datasource below). This is then in turn applied to the esti-mated numbers of households in each income bracketusing estimates from Canback-Danglar, thereby gener-ating estimates of average trips per household by theirannual incomes.
For each household income bracket the total num-ber of outbound trips = average number of trips of thebracket X propensity to travel of the bracket X numberof households in the bracket. Initially the distributionof average number of trips per household across theannual household income brackets follows the propen-sity to travel distribution curve and then was iterativelyadjusted until the sum of total outbound trips acrossall brackets equalizes with the total number of out-bound trips at the national level for each year. Thisprocess was done for 2011,2012 and 2013 to obtainthe average number of trips per household bracket forthe three years. The result is a model that can be ap-plied to estimate the average number of trips perhousehold bracket for the 2014 to 2020 period.
Data Source
The main source of data for this project is the 2012 and2013 editions of MasterCard Worldwide Survey of Pur-chasing Priorities. These surveys have been conductedbi-annually since 1993 on 400 to 800 respondents permarket aged 18 - 64. Coverage extends to 27 coun-tries across Asia/Pacific, Middle East and Africa. Thesurvey is extensive and feature sections on consumerconfidence, travel, dining, luxury shopping, financialbehavior and well-being.
To calculate the number of households within thestated income brackets, data from Canback-Danglarwas used.
Data for outbound travel itself was taken from thenational statistics boards of the relevant markets. Ingeneral we have tried to eliminate same-day excur-sionist travel for all markets (e.g. China to Hong Kong)as these numbers can be so large that they are severaltimes the tourist (i.e. overnight) travel size. Further-more, a sizable portion of these same-day trips areoverland for reasons of day to day shopping or for dayemployment (i.e. cross over for work during the dayand cross back home at night). In cases where same-day excursionist travel are not available to net out fromoverall outbound travel we have used proxies like over-land or non-air travel (e.g. Singapore-Malaysia bothways and Hong Kong to China) This report is focusedon leisure travel and where possible we have tried touse only leisure purpose outbound travel numbers (i.e.extracting business and employment travel where pos-sible). Note that there are some reports that forecastIndia outbound at 50 million by 2020, but these in-variably use all-purpose trips as their forecast base (in-cluding trips for employment purposes). This reportfocuses on leisure travel only where possible. Officialsurveys on outbound travel for India indicate that closeto 60% of all outbound travel is for business or em-ployment purposes and we have adjusted our out-bound numbers accordingly.
Q1 2014 40
41 MasterCard Insights
1. See Global Destination Cities Index by MasterCard World-wide.
2. See Appendix for research methodology.
3. In general we have tried to eliminate same-day excursion-ist travel for all markets (e.g. China to Hong Kong) as thesenumbers can be so large that they are several times thetourist (i.e. overnight) travel size. Furthermore, a sizable por-tion of these same-day trips are overland for reasons of dayto day shopping or for day employment (i.e. cross over forwork during the day and cross back home at night). In caseswhere same-day excursionist travel are not available to netout from overall outbound travel we have used proxies likeover-land or non-air travel (e.g. Singapore-Malaysia bothways and Hong Kong to China) This report is focused onleisure travel and where possible we have tried to use onlyleisure purpose outbound travel numbers (i.e. extractingbusiness and employment travel where possible).
4. China reports its outbound travel inclusive of same daytrips and also trips to Hong Kong and Macau which are partof China. As these are Special Administrative Regions theysit astride the line between domestic travel and internationaltravel for outbound mainland Chinese. As such, we presentboth views here (including and excluding outbound trips toHong Kong and Macau). For both sets of numbers we havestripped out same day travel and estimated overnight travelonly.
5. Note that there are some reports that forecast India out-bound at 50 million by 2020, but these invariably use all-purpose trips as their forecast base (including trips foremployment purposes). This report focuses on leisure travelonly where possible. Official surveys on outbound travel forIndia indicate that close to 60% of all outbound travel is forbusiness or employment purposes and we have adjusted ouroutbound numbers accordingly.
Q1 2014 42
About the Authors
Desmond Choong
Desmond Choong is a Research Economist with theMasterCard Center for Inclusive Growth. In this capac-ity, he sources, reviews and develops research aimed atadvancing the Center's goals. Based in Singapore, he isan economist and business analyst with extensive ex-perience in the Asia/Pacific region and a focus on indexmodeling, market sizing and macroeconomic analysis.He has spent thirteen years consulting for multinationalcompanies across a wide range of industries, includingfinance, resources, and travel and hospitality. Desmondhas taught International Trade at Boston University andholds a B.A. in English/Economics from Boston Collegeand a M.A. in Political Economics from Boston Univer-sity.
Yuwa Hedrick-Wong
Yuwa is currently Chief Economist, MasterCard Centerfor Inclusive Growth, and Global Economic Advisor,MasterCard. He is also HSBC Professor of InternationalBusiness at the University of British Columbia, Canada.
He is an economist with 25 years of experiencegained in over thirty countries. He is a Canadian whogrew up in Vancouver and has spent the last 20 yearsworking in Europe, Sub-Sahara Africa, and Asia/Pacific.He has served as advisor to over fifty leading multina-tional companies.
He is a published author on consumer markets,economic development, trade and international rela-tions. Yuwa studied philosophy, political science, andeconomics at Trent University, and pursued post-grad-uate training at the University of British Columbia andSimon Fraser University in Canada, where he receivedhis Ph.D.
He lives on Salt Spring Island, off the west coast ofCanada, with his wife and their cat; and is an enthusi-astic apprentice in the fine art of gardening.

©2011 MasterCard
www.mastercardworldwide.com
©2014 MasterCard
www.mastercardworldwide.com