asin oriented strategies for co2 enhanced oil … oriented strategies - onsh… · ·...
TRANSCRIPT

BASIN ORIENTED STRATEGIES FOR CO2
ENHANCED OIL RECOVERY:
ONSHORE GULF COAST
February 2006
Prepared for
U.S. Department of Energy
Office of Fossil Energy – Office of Oil and Natural Gas
Prepared by
Advanced Resources International

Disclaimer This report was prepared as an account of work sponsored by an agency of the United States Government. Neither the United States nor the United States Department of Energy, nor any of their employees, makes any warranty, express or implied, or assumes any legal liability or responsibility of the accuracy, completeness, or usefulness of any information, apparatus, product, or process disclosed, or represents that its use would not infringe privately owned rights. The findings and conclusions in this report are those of the authors and do not necessarily represent the views of the Department of Energy.
BASIN ORIENTED STRATEGIES FOR CO2 ENHANCED OIL RECOVERY: ONSHORE GULF COAST REGION OF ALABAMA, FLORIDA, LOUISIANA AND MISSISSIPPI Prepared for U.S. Department of Energy Prepared by Advanced Resources International February 2006

i February 2006
TABLE OF CONTENTS
1. SUMMARY OF FINDINGS 1.1 INTRODUCTION 1.2 ALTERNATIVE OIL RECOVERY STRATEGIES AND SCENARIOS 1.3 OVERVIEW OF FINDINGS 1.4. ACKNOWLEDGEMENTS 2. INTRODUCTION 2.1 CURRENT SITUATION 2.2 BACKGROUND 2.3 PURPOSE 2.4 KEY ASSUMPTIONS 2.5 TECHNICAL OBJECTIVES 2.6 OTHER ISSUES 3. OVERVIEW OF GULF COAST OIL PRODUCTION 3.1 HISTORY OF OIL PRODUCTION 3.2 EXPERIENCE WITH IMPROVED OIL RECOVERY 3.3 THE “STRANDED OIL” PRIZE 3.4 REVIEW OF PRIOR STUDIES 4. MECHANISMS OF CO2-EOR 4.1 MECHANISMS OF MISCIBLE CO2-EOR. 4.2 MECHANISMS OF IMMISCIBLE CO2-EOR 4.3 INTERACTIONS BETWEEN INJECTED CO2 AND RESERVOIR OIL. 5. STUDY METHODOLOGY 5.1 OVERVIEW 5.2 ASSEMBLING THE MAJOR OIL RESERVOIRS DATA BASE 5.3 SCREENING RESERVOIRS FOR CO2-EOR. 5.4 CALCULATING MINIMUM MISCIBILITY PRESSURE 5.5 CALCULATING OIL RECOVERY 5.6 ASSEMBLING THE COST MODEL 5.7 CONSTRUCTING AN ECONOMICS MODEL 5.8 PERFORMING SCENARIO ANALYSES 6. RESULTS BY STATE 6.1 LOUISIANA 6.2 MISSISSIPPI 6.3 ALABAMA 6.4 FLORIDA

ii February 2006
LIST OF FIGURES
Figure 1 Impact of Technology and Financial Conditions on Economically
Recoverable Oil from the Gulf Coast Region’s Major Reservoirs Using CO2-EOR (Million Barrels)
Figure 2 Location of Major Gulf Coast Oil Fields Figure 3 Location of Existing and Planned CO2 Supply Pipelines in Mississippi
and Louisiana Figure 4 Gulf Coast Production since 1950 Figure 5 One-Dimensional Schematic Showing the CO2 Miscible Process Figure 6A Carbon Dioxide, CH4 and N2 densities at 105ºF Figure 6B Carbon Dioxide, CH4 and N2 viscosities at 105ºF Figure 7A Relative Oil Volume vs. Pressure for a Light West Texas Reservoir Fluid Figure 7B Oil Swelling Factor vs. Pressure for a Heavy Oil in Turkey Figure 8 Viscosity Reduction Versus Saturation Pressure Figure 9 Estimating CO2 Minimum Miscibility Pressure Figure 10 Correlation of MW C5+ to Tank Oil Gravity Figure 11 Large Louisiana Oil Fields Figure 12 Large Mississippi Oil Fields Figure 13 Large Alabama Oil Fields Figure 14 Large Florida Oil Fields
LIST OF TABLES
Table 1 Size and Distribution of the Gulf Coast Region’s Oil Reservoirs Data Base
Table 2 The Gulf Coast Region’s “Stranded Oil” Amenable to CO2-EOR Table 3 Technically Recoverable Oil Resources from Miscible and Immiscible
CO2-EOR Table 4 Economically Recoverable Resources - Scenario #1: “Traditional
Practices” CO2-EOR Table 5 Economically Recoverable Resources - Alternative Scenarios Table 6 Potential CO2 Supply Requirements in the Gulf Coast Region: Scenario
#4 (“Ample Supplies of CO2”) Table 7 Matching of CO2-EOR Technology with the Gulf Coast’s Oil Reservoirs Table 8 Crude Oil Annual Production, Ten Largest Gulf Coast Oil Fields, 2000-
2002 (Million Barrels per Year) Table 9 Selected Major Oil Fields of the Gulf Coast Region Table 10 Reservoir Data Format: Major Oil Reservoirs Data Base Table 11 Gulf Coast Oil Reservoirs Screened Amenable for CO2-EOR Table 12 Economic Model Established by the Study Table 13 Recent History of Louisiana Onshore Oil Production Table 14 Status of Large Louisiana Oil Fields/Reservoirs (as of 2002) Table 15 Reservoir Properties and Improved Oil Recovery Activity, Large
Louisiana Oil Fields/Reservoirs Table 16 Economic Oil Recovery Potential Under Two Technologic Conditions,
Louisiana.

iii February 2006
Table 17 Economic Oil Recovery Potential with More Favorable Financial
Conditions, Louisiana Table 18 Recent History of Mississippi Onshore Oil Production Table 19 Status of Large Mississippi Oil Fields/Reservoirs as of 2002 Table 20 Reservoir Properties and Improved Oil Recovery Activity, Large
Mississippi Oil Fields/Reservoirs Table 21 Reservoir Properties and Improved Oil Recovery Activity Potential,
Mississippi “Immiscible-CO2” Oil Fields/Reservoirs Table 22 Economic Oil Recovery Potential Under Two Technologic Conditions,
Mississippi Table 23 Economic Oil Recovery Potential with More Favorable Financial
Conditions, Mississippi Table 24 Recent History of Alabama Onshore Oil Production Table 25 Status of Large Alabama Oil Fields/Reservoirs (as of 2004) Table 26 Reservoir Properties and Improved Oil Recovery Activity, Large Alabama
Oil Fields/Reservoirs Table 27 Economic Oil Recovery Potential Under Two Technologic Conditions,
Alabama Table 28 Economic Oil Recovery Potential with More Favorable Financial
Conditions, Alabama Table 29 Recent History of Florida Onshore Oil Production Table 30 Status of Large Florida Oil Fields/Reservoirs, 2004 Table 31 Reservoir Properties and Improved Oil Recovery Activity, Large Florida
Oil Fields/Reservoirs Table 32 Economic Oil Recovery Potential Under Two Technologic Conditions,
Florida Table 33 Economic Oil Recovery Potential with More Favorable Financial
Conditions, Florida

1-1 February 2006
1. SUMMARY OF FINDINGS
1.1 INTRODUCTION. The onshore Gulf Coast oil and gas producing region of
Louisiana, Mississippi, Alabama and Florida have an original oil endowment of over 44
billion barrels. Of this, nearly 17 billion barrels or 38% will be recovered with primary
and secondary (waterflooding) oil recovery. As such, nearly 28 billion barrels of oil will
be left in the ground, or “stranded”, following the use of traditional oil recovery practices.
A major portion of this “stranded oil” is in reservoirs technically and economically
amenable to enhanced oil recovery (EOR) using carbon dioxide (CO2) injection.
This report evaluates the future CO2-EOR oil recovery potential from the large oil
fields of the onshore Gulf Coast region, highlighting the barriers that stand in the way of
achieving this potential. The report then discusses how a concerted set of “basin
oriented strategies” could help the Gulf Coast’s oil production industry overcome these
barriers helping increase domestic oil production.
1.2 ALTERNATIVE OIL RECOVERY STRATEGIES AND SCENARIOS. The
report sets forth four scenarios for using CO2-EOR to recover “stranded oil” in the
onshore Gulf Coast producing region.
The first scenario captures how CO2-EOR technology has been applied and
has performed in the past. This low technology, high-risk scenario is called
“Traditional Practices”.
The second scenario, entitled “State-of-the-art”, assumes that the technology
progress in CO2-EOR, achieved in recent years and in other areas, is
successfully applied in the Gulf Coast region. In addition, this scenario
assumes that a comprehensive program of research, pilot tests and field
demonstrations help lower the risks inherent in applying new technology to
these complex Gulf Coast oil reservoirs.

1-2 February 2006
The third scenario, entitled “Risk Mitigation,” examines how the economic
potential of CO2-EOR could be increased through a comprehensive strategy
involving state production tax reductions, federal investment tax credits,
royalty relief and/or higher world oil prices that together would add an
equivalent $10 per barrel to the price that the producer uses for making
capital investment decisions for CO2-EOR.
The final scenario, entitled “Ample Supplies of CO2,” assumes that large
volumes of low-cost, “EOR-ready” CO2 supplies are aggregated from various
industrial and natural sources. These low-cost to capture industrial CO2
sources include high-concentration CO2 emissions from hydrogen facilities,
gas processing plants, chemical plants and other sources in the region.
These CO2 sources would be augmented, in the longer-term, from low
concentration CO2 emissions from refineries and electric power plants.
Capture of industrial CO2 emissions could also be part of a national effort for
reducing greenhouse gas emissions.
1.3 OVERVIEW OF FINDINGS. Twelve major findings emerge from the study of
“Basin Oriented Strategies for CO2 Enhanced Oil Recovery: Onshore Gulf Coast Basins
of Alabama, Florida, Louisiana and Mississippi.”
1. Today’s oil recovery practices will leave behind a large resource of “stranded oil” in the onshore Gulf Coast region. The original oil resource in onshore
Gulf Coast reservoirs is 44.4 billion barrels. To date, 16.9 billion barrels of this original
oil in-place (OOIP) has been recovered or proved. Thus, without further efforts, 27.6
billion barrels of the Gulf Coast’s oil resource will become “stranded”, Table 1. To
examine how much of this “stranded oil” could become recoverable, the study
assembled a data base of 239 oil reservoirs (in this four state region) holding 15.9 billion
barrels of “stranded oil.”

1-3 February 2006
Table 1. Size and Distribution of the Gulf Coast Region’s Oil Reservoirs Data Base
Region No. of
Reservoirs OOIP
(Billion Bbls)
Cumulative Recovery/ Reserves*
(Billion Bbls) ROIP
(Billion Bbls)
A. Major Oil Reservoirs
Louisiana 178 20.4 7.9 12.5
Mississippi 34 3.0 1.0 2.0
Alabama 20 1.1 0.4 0.7
Florida 7 1.3 0.6 0.7
Data Base Total 239 25.8 9.9 15.9
B. Regional Total* n/a 44.4 16.9 27.6 *Estimated from state data on cumulative oil recovery and proved reserves, as of the end of 2002 for Louisiana and Mississippi and 2004 for Alabama and Florida. 2. The great bulk of the “stranded oil” resource in the large oil reservoirs
of the Gulf Coast is amenable to CO2 enhanced oil recovery. To further address the
“stranded oil” issue, Advanced Resources assembled a data base that contains 239
major Gulf Coast oil reservoirs, accounting for about 60% of the region’s estimated
ultimate oil production. Of these, 158 reservoirs, with 20 billion barrels of OOIP and
11.9 billion barrels of “stranded oil” (ROIP), were found to be favorable for CO2-EOR, as
shown below by state, Table 2.
Table 2. The Gulf Coast Region’s “Stranded Oil” Amenable to CO2-EOR
Region No. of
Reservoirs OOIP
(Billion Bbls)
Cumulative Recovery/ Reserves
(Billion Bbls) ROIP
(Billion Bbls)
Louisiana 128 16.1 6.7 9.4
Mississippi 20 1.9 0.7 1.2
Alabama 5 0.8 0.3 0.5
Florida 5 1.3 0.5 0.8
TOTAL 158 20.1 8.2 11.9
1-4 February 2006
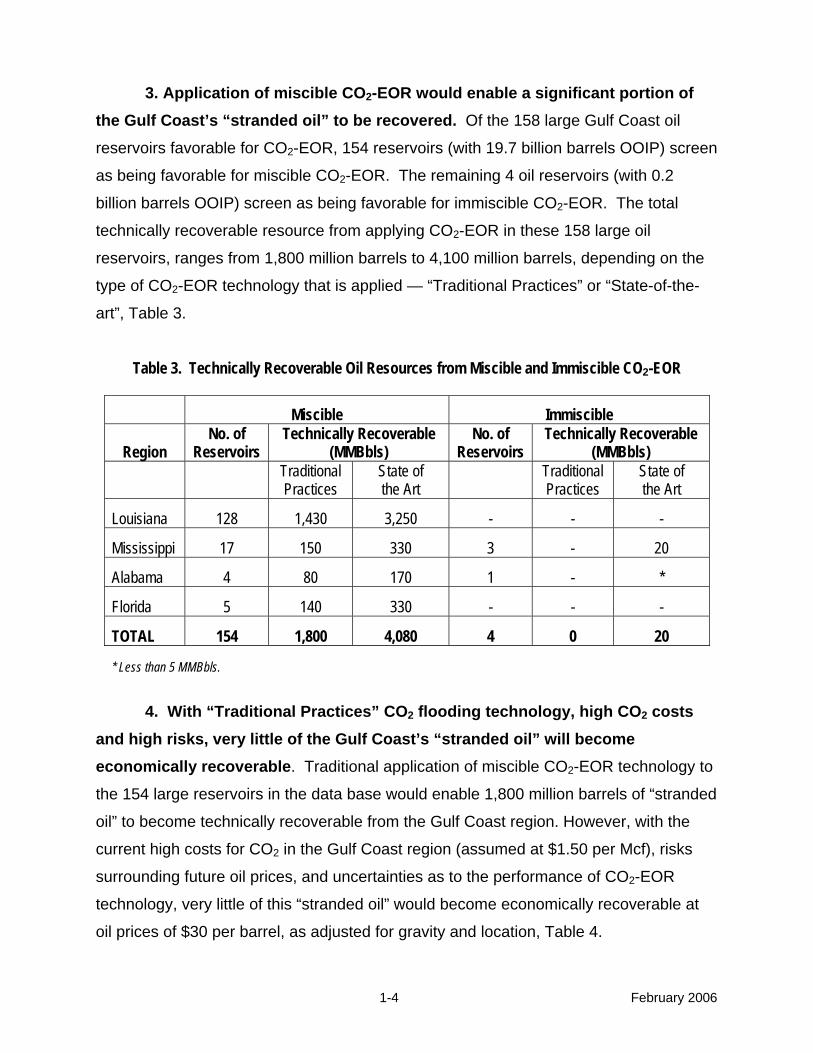
3. Application of miscible CO2-EOR would enable a significant portion of the Gulf Coast’s “stranded oil” to be recovered. Of the 158 large Gulf Coast oil
reservoirs favorable for CO2-EOR, 154 reservoirs (with 19.7 billion barrels OOIP) screen
as being favorable for miscible CO2-EOR. The remaining 4 oil reservoirs (with 0.2
billion barrels OOIP) screen as being favorable for immiscible CO2-EOR. The total
technically recoverable resource from applying CO2-EOR in these 158 large oil
reservoirs, ranges from 1,800 million barrels to 4,100 million barrels, depending on the
type of CO2-EOR technology that is applied — “Traditional Practices” or “State-of-the-
art”, Table 3.
Table 3. Technically Recoverable Oil Resources from Miscible and Immiscible CO2-EOR
Miscible Immiscible
Region No. of
Reservoirs Technically Recoverable
(MMBbls) No. of
Reservoirs Technically Recoverable
(MMBbls)
Traditional Practices
State of the Art
Traditional Practices
State of the Art
Louisiana 128 1,430 3,250 - - -
Mississippi 17 150 330 3 - 20
Alabama 4 80 170 1 - *
Florida 5 140 330 - - -
TOTAL 154 1,800 4,080 4 0 20
* Less than 5 MMBbls.
4. With “Traditional Practices” CO2 flooding technology, high CO2 costs and high risks, very little of the Gulf Coast’s “stranded oil” will become economically recoverable. Traditional application of miscible CO2-EOR technology to
the 154 large reservoirs in the data base would enable 1,800 million barrels of “stranded
oil” to become technically recoverable from the Gulf Coast region. However, with the
current high costs for CO2 in the Gulf Coast region (assumed at $1.50 per Mcf), risks
surrounding future oil prices, and uncertainties as to the performance of CO2-EOR
technology, very little of this “stranded oil” would become economically recoverable at
oil prices of $30 per barrel, as adjusted for gravity and location, Table 4.

1-5 February 2006
5. Introduction of “State-of-the-art” CO2-EOR technology, risk mitigation incentives and lower CO2 costs would enable 2.6 billion barrels of additional oil to become economically recoverable from the Gulf Coast region. With “State-of-the-
art” CO2-EOR technology, and its higher oil recovery efficiency (oil prices of $30/B and
CO2 costs of $1.50/Mcf), 230 million barrels of the oil remaining in the Gulf Coast’s large
oil reservoirs becomes economically recoverable - Scenario #2.
Risk mitigation incentives and/or higher oil prices, providing an oil price equal to
$40 per barrel, would enable 1,420 million barrels of oil to become economically
recoverable from the Gulf Coast’s large oil reservoirs — Scenario #3.
With lower cost CO2 supplies (equal to $0.80 per Mcf, assuming a large-scale
CO2 collection and transportation system) and incentives for capture of CO2 emissions,
the economic potential increases to 2,290 million barrels — Scenario #4 (Figure 1 and
Table 5).
Table 4. Economically Recoverable Resources - Scenario #1: “Traditional Practices” CO2-EOR
Region No. of
Reservoirs OOIP
(Billion Bbls) Economically* Recoverable
(# Reservoirs) (MMBbls)
Louisiana 128 16.1 1 3
Mississippi 17 1.7 - -
Alabama 4 0.8 - -
Florida 5 1.1 - -
TOTAL 154 19.7 1 3 *This case assumes an oil price of $30 per barrel, a CO2 cost of $1.50 per Mcf, and a ROR hurdle rate of 25% (before tax).

1-6 February 2006
Figure 1. Impact of Technology and Financial Conditions on Economically Recoverable Oil from the Gulf Coast Region’s Major Reservoirs Using CO2-EOR (Million Barrels)
30
500
1,000
1,500
2,000
2,500
3,000
3,500Improved Financial ConditionsCurrent Financial Conditions
“TraditionalPractices” “State of the Art” Technology
Millio
n Ba
rrels
of A
dditi
onal,
Ec
onom
ically
Rec
over
able
Oil
210
1,420
2,290
1. High Risk/High Cost CO2/Mod. Oil Price
2. Low Technical Risk/High Cost CO2/Mod. Oil Price
3. Low Technical/ Economic Risk/ High Cost CO2/High Oil Price
4. Low Technical/ Economic Risk/Low Cost CO2/High Oil Price
1. This case assumes an oil price of $30 per barrel, a CO2 cost of $1.50/Mcf and a ROR hurdle rate of 25% (before tax).2. This case assumes an oil price of $30 per barrel, a CO2 cost of $1.50/Mcf and a ROR hurdle rate of 15% (before tax).3. This case assumes an oil price of $40 per barrel, a CO2 cost of $2.00/Mcf and a ROR hurdle rate of 15% (before tax).4. This case assumes an oil price of $40 per barrel, a CO2 cost of $0.80/Mcf and a ROR hurdle rate of 15% (before tax).
Table 5. Economically Recoverable Resources - Alternative Scenarios
Scenario #2: “State-of-the-art”
Scenario #3: “Risk Mitigation”
Scenario #4: “Ample Supplies of CO2”
(Moderate Oil Price/ High CO2 Cost)
(High Oil Price/ High CO2 Cost)
(High Oil Price/ Low CO2 Cost)
Region (# Reservoirs) (MMBbls) (# Reservoirs) (MMBbls) (# Reservoirs) (MMBbls)
Louisiana 4 130 24 1,120 52 1,920
Mississippi 6 80 9 160 13 230
Alabama 0 0 1 110 1 110
Florida - - 1 30 1 30
TOTAL 10 210 35 1,420 67 2,290
1-7 February 2006
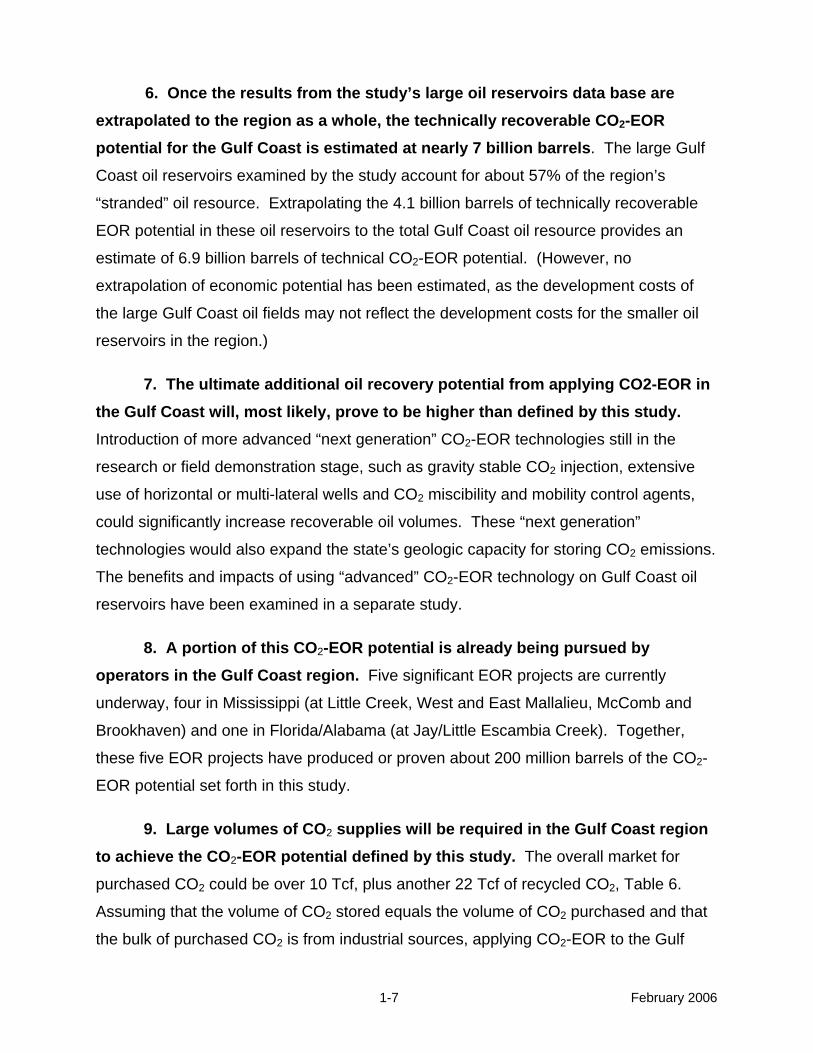
6. Once the results from the study’s large oil reservoirs data base are extrapolated to the region as a whole, the technically recoverable CO2-EOR potential for the Gulf Coast is estimated at nearly 7 billion barrels. The large Gulf
Coast oil reservoirs examined by the study account for about 57% of the region’s
“stranded” oil resource. Extrapolating the 4.1 billion barrels of technically recoverable
EOR potential in these oil reservoirs to the total Gulf Coast oil resource provides an
estimate of 6.9 billion barrels of technical CO2-EOR potential. (However, no
extrapolation of economic potential has been estimated, as the development costs of
the large Gulf Coast oil fields may not reflect the development costs for the smaller oil
reservoirs in the region.)
7. The ultimate additional oil recovery potential from applying CO2-EOR in the Gulf Coast will, most likely, prove to be higher than defined by this study. Introduction of more advanced “next generation” CO2-EOR technologies still in the
research or field demonstration stage, such as gravity stable CO2 injection, extensive
use of horizontal or multi-lateral wells and CO2 miscibility and mobility control agents,
could significantly increase recoverable oil volumes. These “next generation”
technologies would also expand the state’s geologic capacity for storing CO2 emissions.
The benefits and impacts of using “advanced” CO2-EOR technology on Gulf Coast oil
reservoirs have been examined in a separate study.
8. A portion of this CO2-EOR potential is already being pursued by operators in the Gulf Coast region. Five significant EOR projects are currently
underway, four in Mississippi (at Little Creek, West and East Mallalieu, McComb and
Brookhaven) and one in Florida/Alabama (at Jay/Little Escambia Creek). Together,
these five EOR projects have produced or proven about 200 million barrels of the CO2-
EOR potential set forth in this study.
9. Large volumes of CO2 supplies will be required in the Gulf Coast region to achieve the CO2-EOR potential defined by this study. The overall market for
purchased CO2 could be over 10 Tcf, plus another 22 Tcf of recycled CO2, Table 6.
Assuming that the volume of CO2 stored equals the volume of CO2 purchased and that
the bulk of purchased CO2 is from industrial sources, applying CO2-EOR to the Gulf

1-8 February 2006
Coast’s oil reservoirs would enable over 460 million metric tonnes of CO2 emissions to
be stored, greatly reducing greenhouse gas emissions. Advanced CO2-EOR flooding
and CO2 storage concepts (plus incentives for storing CO2) would significantly increase
this amount.
Table 6. Potential CO2 Supply Requirements in the Gulf Coast Region: Scenario #4 (“Ample Supplies of CO2”)
Region No. of
Reservoirs
Economically Recoverable
(MMBbls)
Market for Purchased CO2
(Bcf)
Market for Recycled CO2
(Bcf)
Louisiana 52 1,920 9,040 18,620
Mississippi 13 230 1,000 2,270
Alabama 1 110 485 1,140
Florida 1 30 140 240
TOTAL 67 2,290 10,665 22,270
10. Significant supplies of both natural and industrial CO2 emissions exist in the Gulf Coast region, sufficient to meet the CO2 needs for EOR. The natural
CO2 deposit at Jackson Dome, Mississippi is estimated to hold between 3 and 12 Tcf of
recoverable CO2. In addition, CO2 emissions, from gas processing plants, hydrogen
plants, ammonia plants and ethylene/ethylene oxide plants could provide 1.5 to 2 Bcf
per day of high concentration (relatively low cost) CO2, equal to 10 to 15 Tcf of CO2
supply in 20 years. Finally, almost unlimited supplies of low concentration CO2
emissions (equal to over 100 Tcf of CO2 supply in 20 years) would become available
from the large power plants and refineries in the region, assuming affordable CO2
capture technology is developed.
11. A public-private partnership will be required to overcome the many barriers facing large scale application of CO2-EOR in the Gulf Coast Region’s oil fields. The challenging nature of the current barriers — lack of sufficient, low-cost CO2
supplies, uncertainties as to how the technology will perform in the Gulf Coast’s

1-9 February 2006
complex oil fields, and the considerable market and oil price risks — all argue that a
partnership involving the oil production industry, potential CO2 suppliers and
transporters, the Gulf Coast states and the federal government will be needed to
overcome these barriers.
12. Many entities will share in the benefits of increased CO2-EOR based oil production in the Gulf Coast. Successful introduction and wide-scale use of CO2-
EOR in the Gulf Coast will stimulate increased economic activity, provide new higher
paying jobs, and lead to higher tax revenues for the state. It will also help revive a
declining domestic oil production and service industry.
1.4 ACKNOWLEDGEMENTS. Advanced Resources would like to acknowledge
the most valuable assistance provided to the study by a series of individuals and
organizations in Louisiana, Mississippi, Alabama and Florida.
In Louisiana, we would like to thank the Department of Natural Resources and
particularly Ms. Jo Ann Dixon, Mineral Production Specialist, for help with using the
SONRIS system and accessing data on cumulative oil production. We recognize and
appreciate the considerable assistance provided by Ms. Dixon for assembling data by
oil fields and oil reservoir. We also fully support efforts to upgrade the SONRIS system
as a data source for independent producers seeking to recover the oil remaining in
Louisiana oil reservoirs.
In Mississippi, we would like to thank the Mississippi Oil and Gas Board, and
specifically Ms. Juanita Harper and Mr. Jeff Smith for providing data on statewide
annual oil production and guidance on field and reservoir level oil production and well
counts.
In Alabama, we would like to thank the Alabama State Oil and Gas Board, in
particular Jack Pashin and Richard Hamilton, for providing the state historical oil
production data and information on selected oil reservoirs.

1-10 February 2006
In Florida, we would like to thank the Florida Department of Environmental
Protection, in particular Ed Garrett and David Taylor, for providing statewide oil
production history and oil field descriptions.
Finally, the study would like to acknowledge Mr. William “Clay” Kimbrell of
Kimbrell & Associates, LLC, a co-author of SPE 35431, “Screening Criteria for
Application of Carbon Dioxide Miscible Displacement in Waterflooded Reservoirs
Containing Light Oil”, who helped identify and explain the information used in his most
valuable SPE paper.

2-1 February 2006
2. INTRODUCTION
2.1 CURRENT SITUATION. The Gulf Coast oil producing region addressed in
the report is mature and in decline. Stemming the decline in oil production will be a
major challenge, requiring a coordinated set of actions by numerous parties who have a
stake in this problem — Gulf Coast state revenue and economic development officials;
private, state and federal royalty owners; the Gulf Coast oil production and refining
industry; the public, and the federal government.
The main purpose of this report is to provide information to these “stakeholders”
on the potential for pursuing CO2 enhanced oil recovery (CO2-EOR) as one option for
slowing and potentially stopping the decline in the Gulf Coast’s oil production.
This report, “Basin Oriented Strategies for CO2 Enhanced Oil Recovery:
Onshore Gulf Coast Region of Alabama, Florida, Louisiana and Mississippi,” provides
information on the size of the technical and economic potential for CO2-EOR in the Gulf
Coast oil producing regions. It also identifies the many barriers — insufficient and costly
CO2 supplies, high market and economic risks, and concerns over technology
performance — that currently impede the cost-effective application of CO2-EOR in the
Gulf Coast oil producing region.
2.2 BACKGROUND. The onshore Gulf Coast region of Louisiana, Mississippi,
Alabama and Florida was, at one time, one of the largest onshore domestic oil
producing regions. With severe declines in crude oil reserves and production capacity,
these four areas of the Gulf Coast currently produce only 192 thousand barrels of oil per
day (in 2004). However, the deep, light oil reservoirs of this region are ideal candidates
for miscible carbon dioxide-based enhanced oil recovery (CO2-EOR). The Gulf Coast
oil producing region and the concentration of its major oil fields are shown in Figure 2.

2-2 February 2006
#
#
#
##
#
#
#
#
#
### #### # # ## ## #### ## ### ### ### ##### ## # ##
# ## ## ## #
#
#
#### #
###
#
# #
#
#
#
#
#
#
#
##
#
#
#
##
#
#
#
##
##
#
##
##
#
#
#
#
##
#
#
#
#
#
#
#
##
## #
#
#
##
##
#
#
#
#
#
#
#
#
#
#
#
#
#
##
#
##
#
##
##
#
#
##
##
#
#
#
##
#
#
##
##
##
#
#
#
#
#
#
#
#
##
##
##
#
##### #
###
#
# #
#
Florida
GAAlabama
Louisiana
MississippiAR
X
SC
TN NC
Gulf of Mexico
Fort Myers
Montgomery
Tallahassee
Monroe
Baton Rouge
Huntsville
Mobile
PensacolaNew Orleans
Jackson
Jacksonville
Orlando
Tampa
Birmingham
Miami80 0 80 160 240 Miles
Figure 2. Location of Major Gulf Coast Oil Fields.
Oil FieldCounty LineState LineCity
Gulf Coast Oil Fields
#
#
#
##
#
#
#
#
#
### #### # # ## ## #### ## ### ### ### ##### ## # ##
# ## ## ## #
#
#
#### #
###
#
# #
#
#
#
#
#
#
#
##
#
#
#
##
#
#
#
##
##
#
##
##
#
#
#
#
##
#
#
#
#
#
#
#
##
## #
#
#
##
##
#
#
#
#
#
#
#
#
#
#
#
#
#
##
#
##
#
##
##
#
#
##
##
#
#
#
##
#
#
##
##
##
#
#
#
#
#
#
#
#
##
##
##
#
##### #
###
#
# #
#
Florida
GAAlabama
Louisiana
MississippiAR
X
SC
TN NC
Gulf of Mexico
Fort Myers
Montgomery
Tallahassee
Monroe
Baton Rouge
Huntsville
Mobile
PensacolaNew Orleans
Jackson
Jacksonville
Orlando
Tampa
Birmingham
Miami80 0 80 160 240 Miles
Figure 2. Location of Major Gulf Coast Oil Fields.
Oil FieldCounty LineState LineCity
Gulf Coast Oil FieldsOil FieldCounty LineState LineCity
Oil FieldCounty LineState LineCity
Gulf Coast Oil Fields

2-3 February 2006
2.3 PURPOSE. This report, “Basin Oriented Strategies for CO2 Enhanced Oil
Recovery: Onshore Gulf Coast Region of Alabama, Florida, Louisiana and Mississippi”
is part of a larger effort to examine the enhanced oil recovery and CO2 storage potential
in key U.S. oil basins. The work involves establishing the geological and reservoir
characteristics of the major oil fields in the region; examining the available CO2 sources,
volumes and costs; calculating oil recovery and CO2 storage capacity; and, examining
the economic feasibility of applying CO2-EOR. The aim of this report is to provide
information that could assist: (1) formulating alternative public-private partnership
strategies for developing lower-cost CO2 capture technology; (2) launching R&D/pilot
projects of advanced CO2 flooding technology; and, (3) structuring royalty/tax incentives
and policies that would help accelerate the application of CO2-EOR and CO2 storage.
An additional important purpose of the study is to develop a desktop modeling
and analytical capability for “basin oriented strategies” that would enable Department of
Energy/Fossil Energy (DOE/FE) itself to formulate policies and research programs that
would support increased recovery of domestic oil resources. As such, this desktop
model complements, but does not duplicate, the more extensive TORIS modeling
system maintained by DOE/FE’s National Energy Technology Laboratory.
2.4 KEY ASSUMPTIONS. For purposes of this study, it is assumed that
sufficient supplies of CO2 will become available, either by pipeline from natural sources
such as Jackson Dome or from the numerous industrial sources in the region. These
sources include the hydrogen plants and refineries in Lake Charles, Louisiana;
Pascagoula, Mississippi; and Tuscaloosa, Alabama, the large gas processing and
chemical plants in the region and particularly the major electric power plants in these
four states. The study assumes that this CO2 will become available in the near future,
before the oil fields in the region are plugged and abandoned.
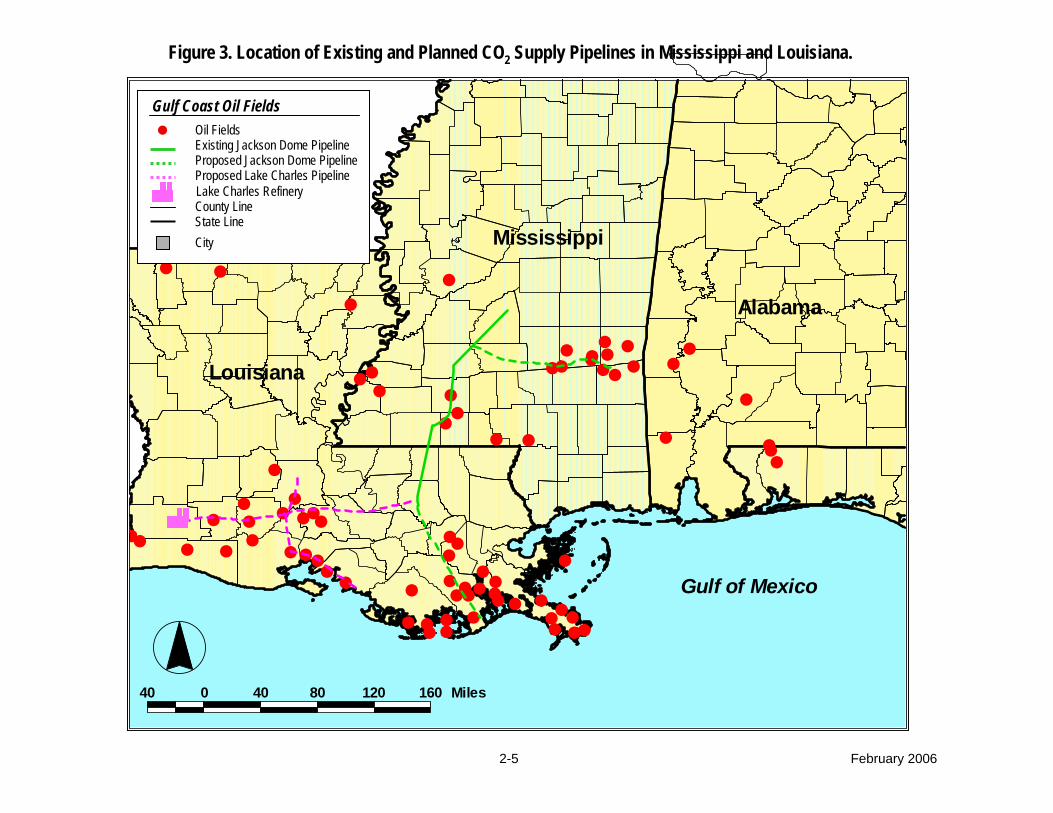
Figure 3 shows the existing pipeline system that transports CO2 from the natural
CO2 reservoir at Jackson Dome to the oil fields of central Mississippi and northeastern
Louisiana. It also shows the proposed extension of this pipeline system to the oil fields

2-4 February 2006
of eastern Mississippi and to southeastern Louisiana. According to a press release in
the fall of 2005, the operator of the Jackson Dome CO2 reservoir (Denbury Resources)
has initiated constructing of the 84-mile extension from Jackson Dome to oil fields in
eastern Mississippi.
Figure 3 also provides a conceptual illustration of a CO2 pipeline system that
would transport captured CO2 emissions from Louisiana’s refinery complex at Lake
Charles to the nearby oil fields of Louisiana. Once this primary trunkline is in place,
expansion to Alabama’s and Florida’s large oil fields is a possibility. This conceptual
industrial CO2 pipeline system could link with the existing natural CO2 pipeline system,
providing a more secure overall CO2 supply system for the Gulf Coast region.
2-5 February 2006
## # #### # # ## ## #### ## ### ### #
## ##### ## # ### ## ## ## #
#
#
####
##
##
##
#
##### #
###
#
# #
#
#
#
#
#
#
##
Louisiana
Mississippi
Alabama
AR
Gulf of Mexico
40 0 40 80 120 160 Miles
Figure 3. Location of Existing and Planned CO2 Supply Pipelines in Mississippi and Louisiana.
Oil Fields
County LineState LineCity
Gulf Coast Oil Fields
Existing Jackson Dome PipelineProposed Jackson Dome PipelineProposed Lake Charles PipelineLake Charles Refinery
Oil Fields
County LineState LineCity
Gulf Coast Oil Fields
Existing Jackson Dome PipelineProposed Jackson Dome PipelineProposed Lake Charles PipelineLake Charles Refinery

2-6 February 2006
2.5 TECHNICAL OBJECTIVES. The objectives of this study are to examine
the technical and the economic potential of applying CO2-EOR in the Gulf Coast oil
region, under two technology options:
1. “Traditional Practices” Technology. This involves the continued use of past CO2
flooding and reservoir selection practices. It is distinguished by using miscible
CO2-EOR technology in light oil reservoirs and by injecting moderate volumes of
CO2, on the order of 0.4 hydrocarbon pore volumes (HCPV), into these
reservoirs. (Immiscible CO2 is not included in the “Traditional Practices”
technology option). Given the still limited application of CO2-EOR in this region
and the inherent technical and geologic risks, operators typically add a risk
premium when evaluating this technology option in the Gulf Coast region.
2. “State-of-the-art” Technology. This involves bringing to the Gulf Coast the
benefits of recent improvements in the performance of the CO2-EOR process and
gains in understanding of how best to customize its application to the many
different types of oil reservoirs in the region. As further discussed below,
moderately deep, light oil reservoirs are selected for miscible CO2-EOR and the
shallower light oil and the heavier oil reservoirs are targeted for immiscible CO2-
EOR. “State-of-the-art” technology entails injecting much larger volumes of CO2,
on the order of 1 HCPV, with considerable CO2 recycling.
Under “State-of-the-art” technology, with CO2 injection volumes more than twice as
large, oil recovery is projected to be higher than reported for past field projects using
“Traditional Practices”. The CO2 injection/oil recovery ratio may also be higher under
this technology option, further spotlighting the importance of lower cost CO2 supplies.
With the benefits of field pilots and pre-commercial field demonstrations, the risk
premium for this technology option and scenario would be reduced to conventional
levels.
2-7 February 2006
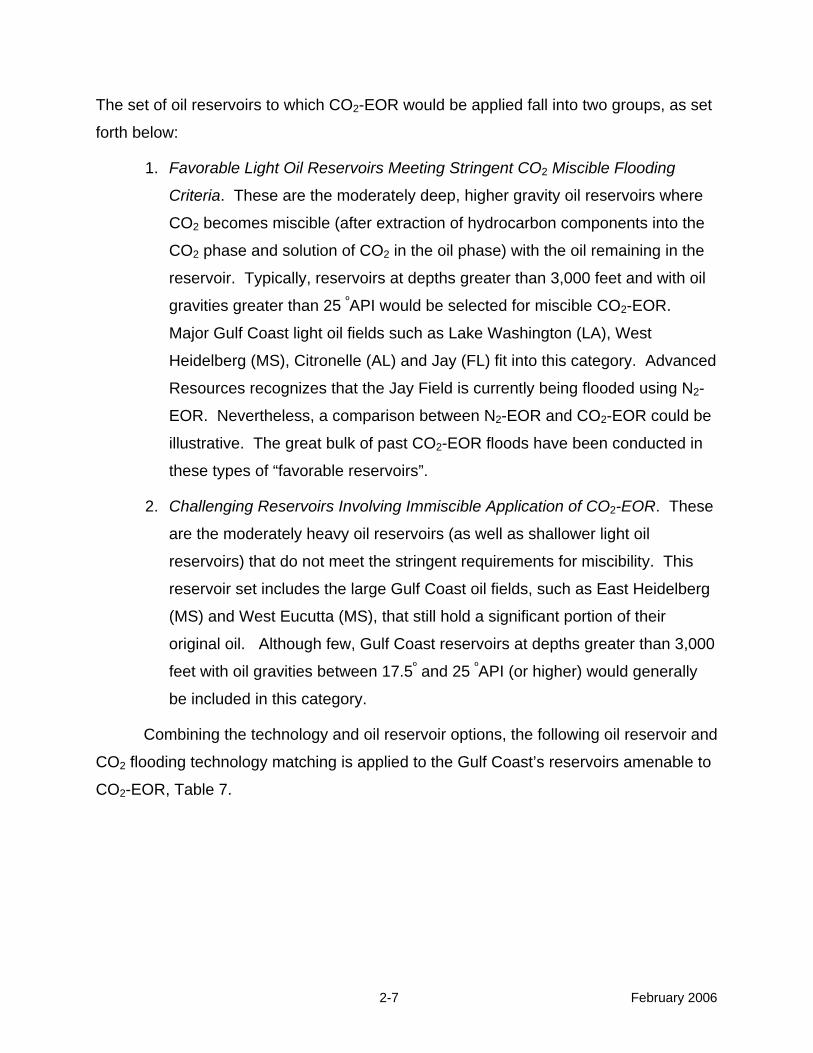
The set of oil reservoirs to which CO2-EOR would be applied fall into two groups, as set
forth below:
1. Favorable Light Oil Reservoirs Meeting Stringent CO2 Miscible Flooding
Criteria. These are the moderately deep, higher gravity oil reservoirs where
CO2 becomes miscible (after extraction of hydrocarbon components into the
CO2 phase and solution of CO2 in the oil phase) with the oil remaining in the
reservoir. Typically, reservoirs at depths greater than 3,000 feet and with oil
gravities greater than 25 ºAPI would be selected for miscible CO2-EOR.
Major Gulf Coast light oil fields such as Lake Washington (LA), West
Heidelberg (MS), Citronelle (AL) and Jay (FL) fit into this category. Advanced
Resources recognizes that the Jay Field is currently being flooded using N2-
EOR. Nevertheless, a comparison between N2-EOR and CO2-EOR could be
illustrative. The great bulk of past CO2-EOR floods have been conducted in
these types of “favorable reservoirs”.
2. Challenging Reservoirs Involving Immiscible Application of CO2-EOR. These
are the moderately heavy oil reservoirs (as well as shallower light oil
reservoirs) that do not meet the stringent requirements for miscibility. This
reservoir set includes the large Gulf Coast oil fields, such as East Heidelberg
(MS) and West Eucutta (MS), that still hold a significant portion of their
original oil. Although few, Gulf Coast reservoirs at depths greater than 3,000
feet with oil gravities between 17.5º and 25 ºAPI (or higher) would generally
be included in this category.
Combining the technology and oil reservoir options, the following oil reservoir and
CO2 flooding technology matching is applied to the Gulf Coast’s reservoirs amenable to
CO2-EOR, Table 7.

2-8 February 2006
2.6 OTHER ISSUES. This study draws on a series of sources for basic data on
the reservoir properties and the expected technical and economic performance of CO2-
EOR in the Gulf Coast’s major oil reservoirs. Because of confidentiality and proprietary
issues, the results of the study have been aggregated for the four producing areas
within the Gulf Coast. As such, reservoir-level data and results are not provided and
are not available for general distribution. However, selected non-confidential and non-
proprietary information at the field and reservoir level is provided in the report and
additional information could be made available for review, on a case by case basis, to
provide an improved context for the state level reporting of results in this report.
Table 7. Matching of CO2-EOR Technology With the Gulf Coast’s Oil Reservoirs
CO2-EOR Technology Selection
Oil Reservoir Selection
“Traditional Practices”; Miscible CO2-EOR 154 Deep, Light Oil Reservoirs
“State-of-the-art”; Miscible and Immiscible CO2-EOR
154 Deep, Light Oil Reservoirs 4 Deep, Moderately Heavy Oil Reservoirs

3-1 February 2006
3. OVERVIEW OF GULF COAST OIL PRODUCTION
3.1 HISTORY OF OIL PRODUCTION. Oil production for the onshore Gulf Coast
region of United States — encompassing Mississippi, north and south Louisiana,
Alabama and Florida — has steadily declined for the past 30 years, Figure 4. Since
reaching a peak in 1970, oil production dropped sharply for the next ten years before
starting a more gradual decline in the mid 1980s due to secondary recovery efforts. Oil
production reached a recent low of 70 million barrels (192,000 barrels per day) in 2004.
Louisiana onshore areas, with 45 million barrels of oil produced in 2002, has seen
its crude oil proved reserves fall in half in the past 10 years.
Mississippi, with 17 million barrels of oil produced in 2004, has maintained its
proved crude oil reserves and oil production for the past ten years.
Alabama onshore areas, with 5 million barrels of oil produced in 2004 has seen a
steady decline in its proven reserves and production in the last ten years.
Florida onshore areas, with 3 million barrels of oil produced in 2004 has also seen
a steady decline in its proven reserves and production over the past 10 years.
Figure 4. Gulf Coast Production Since 1950
JAF02449.PPT
0
100
200
300
400
500
600
1950 1956 1962 1968 1974 1980 1986 1992 1998 2004
Year
Prod
uctio
n (M
Mbl
s)
FLALLAMS
3-2 February 2006
However, the Gulf Coast still holds a rich resource of oil in the ground. With 44
billion barrels of original oil in-place (OOIP) and approximately 17 billion barrels
expected to be recovered, 28 billion barrels of oil will be “stranded” due to lack of
technology, lack of sufficient, affordable CO2 supplies and high economic and technical
risks.
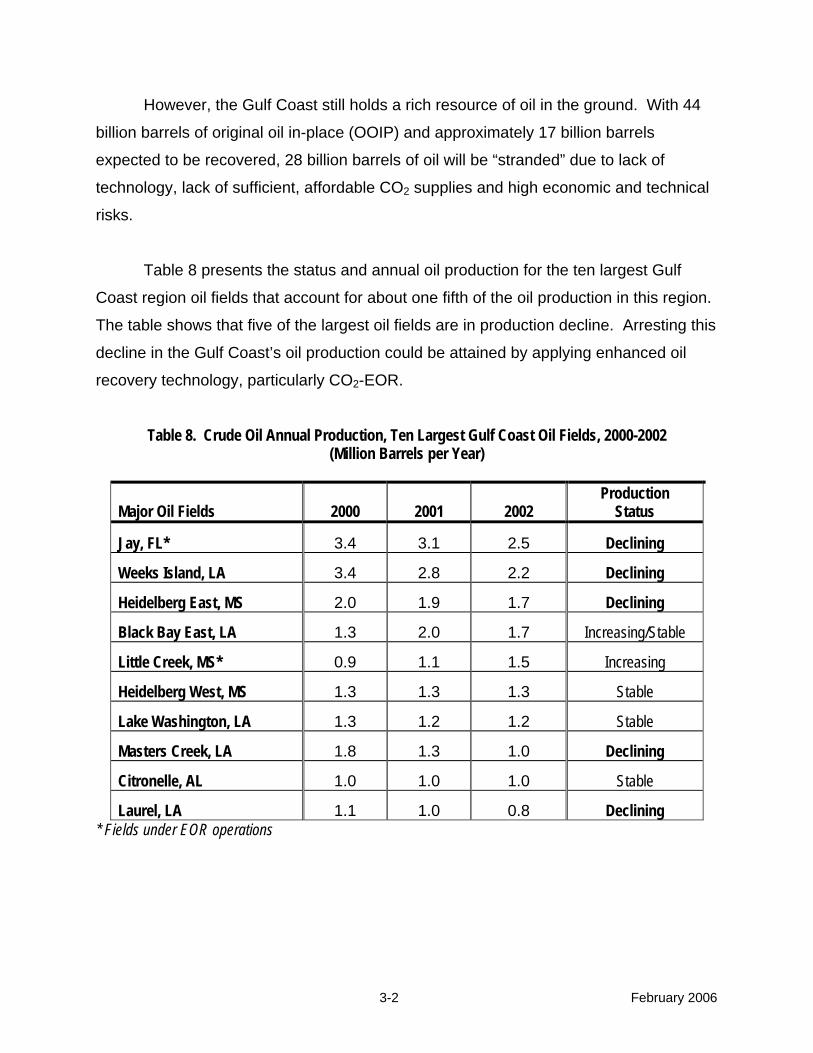
Table 8 presents the status and annual oil production for the ten largest Gulf
Coast region oil fields that account for about one fifth of the oil production in this region.
The table shows that five of the largest oil fields are in production decline. Arresting this
decline in the Gulf Coast’s oil production could be attained by applying enhanced oil
recovery technology, particularly CO2-EOR.
Table 8. Crude Oil Annual Production, Ten Largest Gulf Coast Oil Fields, 2000-2002 (Million Barrels per Year)
Major Oil Fields 2000 2001 2002 Production
Status
Jay, FL* 3.4 3.1 2.5 Declining
Weeks Island, LA 3.4 2.8 2.2 Declining
Heidelberg East, MS 2.0 1.9 1.7 Declining
Black Bay East, LA 1.3 2.0 1.7 Increasing/Stable
Little Creek, MS* 0.9 1.1 1.5 Increasing
Heidelberg West, MS 1.3 1.3 1.3 Stable
Lake Washington, LA 1.3 1.2 1.2 Stable
Masters Creek, LA 1.8 1.3 1.0 Declining
Citronelle, AL 1.0 1.0 1.0 Stable
Laurel, LA 1.1 1.0 0.8 Declining * Fields under EOR operations

3-3 February 2006
3.2 EXPERIENCE WITH IMPROVED OIL RECOVERY. Gulf Coast oil
producers are familiar with using technology for improving oil recovery. For example, a
large number of onshore Louisiana oil fields are currently under waterflood recovery and
pilot efforts are underway in applying CO2 for enhanced oil recovery.
One of the favorable conditions for the area is that the Gulf Coast contains a
natural source of CO2 at Jackson Dome, Mississippi. This natural source of CO2
enabled CO2-EOR to be pilot tested at Weeks Island and Little Creek oil fields by Shell
Oil in the 1980s. It is also the source for Denbury Resources’ CO2 supplies for a series
of new field-scale CO2 projects in Mississippi including Little Creek, Mallalieu and
McComb. Additional discussion of the experience with CO2-EOR in the Gulf Coast
region is provided in Chapter 6.
3.3 THE “STRANDED OIL” PRIZE. Even though the Gulf Coast’s oil production
is declining, this does not mean that the resource base is depleted. The four regions of
onshore production in the Gulf Coast – Louisiana, Mississippi, Alabama and Florida, still
contain 62% of their OOIP after primary and secondary oil recovery. This large volume
of remaining oil in-place (ROIP) is the “prize” for CO2-EOR.
Table 9 provides information on the maturity and oil production history of 8 large
Gulf Coast oil fields, each with estimated ultimate recovery of 200 million barrels or
more.

3-4 February 2006
Table 9. Selected Major Oil Fields of the Gulf Coast Region
Field/State Year
Discovered
Cumulative Production
(MMBbl)
Estimated Primary/
Secondary Reserves (MMBbl)
Remaining Oil In-Place
(MMBbl)
1 JAY – FL* 1970 350 28 352**
2 CITRONELLE – AL* 1955 168 7 362
3 LAKE WASHINGTON - LA 1931 272 14 360
4 LAFITTE - LA 1935 269 7 329
5 WEEKS ISLAND - LA 1945 265 19 347
6 BAXTERVILLE - MS 1944 253 6 489
7 WEST BAY - LA 1940 242 8 336
8 GARDEN ISLAND BAY - LA 1935 221 3 262 * Alabama and Florida production numbers are for 2004. **70 MMBbls of this is estimated to be recovered with N2-EOR
3.4 REVIEW OF PRIOR STUDIES. As part of the 1993 to 1997 DOE Class I
reservoir project, “Post Waterflood, CO2 Flood in a Light Oil, Fluvial Dominated Deltaic
Reservoir” (which also developed of CO2-PROPHET) Louisiana State University studied
the impact of using miscible CO2-EOR in Louisiana. The technical and economic
parameters of the study were as follows — recovery factor of 10% ROIP; oil price of
$17/Bbl, royalty and taxes of 15%; and CO2 costs of $0.60/Mcf:
• In Louisiana, the investigators began with a data base of 499 light-oil
waterflooded reservoirs to select candidates acceptable for CO2-EOR. The data
base included three reservoirs in which CO2 miscible flooding was already
occurring — Paradis (Lower 9000 Sand RM), South Pass Block 24 (8800’RD),
and West Bay (5 A’B”).

3-5 February 2006
• Of the 499 reservoirs screened (representing 5.3 billion Bbl of OOIP), 197 were
deemed acceptable for CO2-EOR and 40 were determined to be economic under
the constraints of the study. These 40 reservoirs were estimated to provide a
relatively modest volume of incremental oil production — 73 million barrels.
The much larger reservoir data base, the improved capability to calculate oil
recovery from miscible and immiscible CO2-EOR, and the significantly higher oil prices
used in the study lead to much higher expectations of oil production from Louisiana
onshore oil reservoirs.

4-1 February 2006
4. MECHANISMS OF CO2-EOR
4.1 MECHANISMS OF MISCIBLE CO2-EOR. Miscible CO2-EOR is a multiple
contact process, involving the injected CO2 and the reservoir’s oil. During this multiple
contact process, CO2 will vaporize the lighter oil fractions into the injected CO2 phase
and CO2 will condense into the reservoir’s oil phase. This leads to two reservoir fluids
that become miscible (mixing in all parts), with favorable properties of low viscosity, a
mobile fluid and low interfacial tension.
The primary objective of miscible CO2-EOR is to remobilize and dramatically
reduce the after waterflooding residual oil saturation in the reservoir’s pore space.
Figure 5 provides a one-dimensional schematic showing the various fluid phases
existing in the reservoir and the dynamics of the CO2 miscible process.
Figure 5. One-Dimensional Schematic Showing the CO2 Miscible Process
PureCO2
CO2 VaporizingOil Components
CO2Condensing
Into Oil
Original Oil
Miscibility is Developed in This Region(CO2 and Oil Form Single Phase)
Direction of Displacement
JAF02449.PPT
PureCO2
CO2 VaporizingOil Components
CO2Condensing
Into Oil
Original Oil
Miscibility is Developed in This Region(CO2 and Oil Form Single Phase)
Direction of Displacement
JAF02449.PPT

4-2 February 2006
4.2 MECHANISMS OF IMMISCIBLE CO2-EOR. When insufficient reservoir
pressure is available or the reservoir’s oil composition is less favorable (heavier), the
injected CO2 is immiscible with the reservoir’s oil. As such, another oil displacement
mechanism, immiscible CO2 flooding, occurs. The main mechanisms involved in
immiscible CO2 flooding are: (1) oil phase swelling, as the oil becomes saturated with
CO2; (2) viscosity reduction of the swollen oil and CO2 mixture; (3) extraction of lighter
hydrocarbon into the CO2 phase; and, (4) fluid drive plus pressure. This combination of
mechanisms enables a portion of the reservoir’s remaining oil to be mobilized and
produced. In general, immiscible CO2-EOR is less efficient than miscible CO2-EOR in
recovering the oil remaining in the reservoir.
4.3 INTERACTIONS BETWEEN INJECTED CO2 AND RESERVOIR OIL. The
properties of CO2 (as is the case for most gases) change with the application of
pressure and temperature. Figures 6A and 6B provide basic information on the change
in CO2 density and viscosity, two important oil recovery mechanisms, as a function of
pressure.
Oil swelling is an important oil recovery mechanism, for both miscible and
immiscible CO2-EOR. Figures 7A and 7B show the oil swelling (and implied residual oil
mobilization) that occurs from: (1) CO2 injection into a West Texas light reservoir oil;
and, (2) CO2 injection into a very heavy (12 ºAPI) oil reservoir in Turkey. Laboratory
work on the Bradford Field (Pennsylvania) oil reservoir showed that the injection of CO2,
at 800 psig, increased the volume of the reservoir’s oil by 50%. Similar laboratory work
on Mannville “D” Pool (Canada) reservoir oil showed that the injection of 872 scf of CO2
per barrel of oil (at 1,450 psig) increased the oil volume by 28%, for crude oil already
saturated with methane.
Viscosity reduction is a second important oil recovery mechanism, particularly for
immiscible CO2-EOR. Figure 8 shows the dramatic viscosity reduction of one to two
orders of magnitude (10 to 100 fold) that occur for a reservoir’s oil with the injection of
CO2 at high pressure.

4-3 February 2006
Figure 6A. Carbon Dioxide, CH4 and N2 densities at 1050F. At high pressures, CO2 has a density close to that of a liquid and much greater than that of either methane or nitrogen. Densities were
calculated with an equation of state (EOS)
CO2
CH4
N2
0 500 1,000 1,500 2,000 2,500 3,000 3,500 4,0000
0.1
0.2
0.3
0.4
0.5
0.6
0.7
0.8
0.9
Den
sity
, g/c
m3
Pressure, psia
JAF02450.PPT
Figure 6B. Carbon Dioxide, CH4 and N2 viscosities at 1050F. At high pressures, the viscosity of CO2 is also greater then that of methane or nitrogen, although it remains low in comparison to that of
liquids. Viscosities were calculated with an EOS.
CO2
CH4
N2
0 500 1,000 1,500 2,000 2,500 3,000 3,500 4,0000
0.01
0.02
0.03
0.04
0.05
0.06
0.07
0.08
0.09
Visc
osity
, cp
Pressure, psia
JAF02450.PPT

4-4 February 2006
1.24
0 500 1000 1500 2000
Pressure, PSIG
2500
1.22
1.2
1.18
1.16
1.14
1.12
1.1
1.08
1.06
1.04
Oil S
wellin
g Fa
ctor
Figure 7A. Relative Oil Volume vs. Pressure for a Light West Texas Reservoir Fluid (Holm and Josendal).
CO2 SaturatedSeparator Oil
1.6
1.7
1.5
1.4
1.3
1.2
1.1
1.0 0 500 1000 1500 2000
Relat
ive O
il Vol
ume,
BBL.
Oil/B
BL. R
esid
ual O
il at 6
0o F
Pressure, PSIG
RecombinedReservoir Fluid
CO2 SaturatedReservoir Fluid
Figure 7B. Oil Swelling Factor vs. Pressure for a Heavy Oil in Turkey (Issever and Topkoya).

4-5 February 2006
Figure 8. Viscosity Reduction Versus Saturation Pressure (Simon and Graue).
.7
.8
.6
.5
.4
.3
.2
.1
0 1000 30002000
Saturation Pressure, PSIG
0
.9
1.0
51050
100500
1000
Ratio
of A
ltere
d Vi
scos
ity to
Orig
inal
Visc
osity
Original Oil
Viscosity

5-1 February 2006
5. STUDY METHODOLOGY 5.1 OVERVIEW. A seven part methodology was used to assess the CO2-EOR
potential of the Gulf Coast’s oil reservoirs. The seven steps were: (1) assembling the
Gulf Coast Major Oil Reservoirs Data Base; (2) screening reservoirs for CO2-EOR; (3)
calculating the minimum miscibility pressure; (4) calculating oil recovery; (5) assembling
the cost model; (6) constructing an economics model; and, (7) performing scenario
analyses.
An important objective of the study was the development of a desktop model with
analytic capability for “basin oriented strategies” that would enable DOE/FE to develop
policies and research programs leading to increased recovery and production of
domestic oil resources. As such, this desktop model complements, but does not
duplicate, the more extensive TORIS modeling system maintained by DOE/FE’s
National Energy Technology Laboratory.
5.2 ASSEMBLING THE MAJOR OIL RESERVOIRS DATA BASE. The study
started with the National Petroleum Council (NPC) Public Data Base, maintained by
DOE Fossil Energy. The study updated and modified this publicly accessible data base
to develop the Gulf Coast Major Oil Reservoirs Data Base for onshore Louisiana,
Mississippi, Alabama and Florida.
Table 10 illustrates the oil reservoir data recording format developed by the
study. The data format readily integrates with the input data required by the CO2-EOR
screening and oil recovery models, discussed below. Overall, the Gulf Coast Major Oil
Reservoirs Data Base contains 239 reservoirs, accounting for 58.5% of the oil expected
to be ultimately produced in Gulf Coast by primary and secondary oil recovery
processes.

5-2 February 2006
Table 10. Reservoir Data Format: Major Oil Reservoirs Data Base Basin Name
Field Name
Reservoir
Reservoir Parameters: TORIS ARI Oil Production TORIS ARI Volumes TORIS ARIArea (A) Producing Wells (active) OOIP (MMbl)Net Pay (ft) Producing Wells (shut-in) Cum P/S Oil (MMbl)Depth (ft) 2003 Production (Mbbl) 2003 P/S Reserves (MMbl)Porosity Daily Prod - Field (Bbl/d) Ult P/S Recovery (MMbl)Reservoir Temp (deg F) Cum Oil Production (MMbbl) Remaining (MMbbl)Initial Pressure (psi) EOY 2003 Oil Reserves (MMbbl) Ultimate Recovered (%)Pressure (psi) Water Cut
OOIP Volume CheckBoi Water Production Reservoir Volume (AF)Bo @ So, swept 2001 Water Production (Mbbl) Bbl/AFSoi Daily Water (Mbbl/d) OOIP Check (MMbl)Sor
Swept Zone So Injection SROIP Volume CheckSwi Injection Wells (active) Reservoir Volume (AF)Sw Injection Wells (shut-in) Swept Zone Bbl/AF
2003 Water Injection (MMbbl) SROIP Check (MMbbl)API Gravity Daily Injection - Field (Mbbl/d)Viscosity (cp) Cum Injection (MMbbl)
Daily Inj per Well (Bbl/d) ROIP Volume CheckDykstra-Parsons ROIP Check (MMbl)
EORType2003 EOR Production (MMbbls)Cum EOR Production (MMbbls)Reserves (MMbbls)Ultimate Recovery (MMbbls)

5-3 February 2006
Considerable effort was required to construct an up-to-date, volumetrically
consistent data base that contained all of the essential data, formats and interfaces to
enable the study to: (1) develop an accurate estimate of the size of the original and
remaining oil in-place in the Gulf Coast; (2) reliably screen the reservoirs as to their
amenability for miscible and immiscible CO2-EOR; and, (3) provide the CO2-PROPHET
Model (developed by Texaco for the DOE Class I cost-share program) the essential
input data for calculating CO2 injection requirements and oil recovery.
5.3 SCREENING RESERVOIRS FOR CO2-EOR. The data base was screened
for reservoirs that would be applicable for CO2-EOR. Five prominent screening criteria
were used to identify favorable reservoirs. These were: reservoir depth, oil gravity,
reservoir pressure, reservoir temperature, and oil composition. These values were
used to establish the minimum miscibility pressure for conducting miscible CO2-EOR
and for selecting reservoirs that would be amenable to this oil recovery process.
Reservoirs not meeting the miscibility pressure standard were considered for immiscible
CO2-EOR.
The preliminary screening steps involved selecting the deeper oil reservoirs that
had sufficiently high oil gravity. A minimum reservoir depth of 3,000 feet, at the mid-
point of the reservoir, was used to ensure the reservoir could accommodate high
pressure CO2 injection. A minimum oil gravity of 17.5 ºAPI was used to ensure the
reservoir’s oil had sufficient mobility, without requiring thermal injection. Table 11
tabulates the oil reservoirs that passed the preliminary screening step. Many of these
fields contain multiple reservoirs, with each reservoir holding a great number of stacked
sands. Because of data limitations, this screening study combined the sands into a
single reservoir.

5-4 February 2006
Table 11. Gulf Coast Oil Reservoirs Screened Amenable to CO2-EOR
Basin Field Formation A. Louisiana Louisiana COTTON VALLEY BODCAW Louisiana DELHI DELHI ALL Louisiana HAYNESVILLE PETTIT Louisiana HAYNESVILLE TOKIO Louisiana HAYNESVILLE EAST BIRDSONG - OWENS Louisiana HAYNESVILLE EAST EAST PETTIT Louisiana LISBON PET LIME Louisiana NORTH SHONGALOO - RED ROCK AAA Louisiana RODESSA RODESSA ALL Louisiana AVERY ISLAND MEDIUM Louisiana BARATARIA 24 RESERVOIRS Louisiana BAY ST ELAINE 13600 - FT SAND, SEG C & C-1 Louisiana BAY ST ELAINE DEEP Louisiana BAYOU SALE SALE DEEP Louisiana BONNET-CARRE OPERCULINOIDES Louisiana CAILLOU ISLAND 9400 IT SAND, RBBIC Louisiana CAILLOU ISLAND DEEP Louisiana CECELIA FRIO Louisiana COTE BLANCHE BAY WEST MEDIUM Louisiana COTE BLANCHE BAY WEST WEST Louisiana COTE BLANCHE ISLAND DEEP Louisiana CUT OFF 45 RESERVOIRS Louisiana EGAN CAMERINA Louisiana EGAN HAYES Louisiana FIELD 6794 - 6794 Louisiana GARDEN ISLAND BAY 177 RESERVOIR A Louisiana GARDEN ISLAND BAY MEDIUM Louisiana GARDEN ISLAND BAY SHALLOW Louisiana GOOD HOPE P-RESEROIVR NO 45900 Louisiana GOOD HOPE S-RESERVOIR NO. 54900 Louisiana GRAND BAY 10B SAND, FAULT BLOCK A-1 Louisiana GRAND BAY 21 SAND, FAULT BLOCK B Louisiana GRAND BAY 2MEDIUM Louisiana GRAND BAY 31 MARKER SAND, FAULT BLOCK A Louisiana GRAND BAY MEDIUM Louisiana GRAND LAKE 873 Louisiana GUEYDAN ALLIANCE SAND Louisiana HACKBERRY WEST 2MEDIUM Louisiana HACKBERRY WEST CAMERINA C SAND - FB 5

5-5 February 2006
Table 11. Gulf Coast Oil Reservoirs Screened Amenable to CO2-EOR
Basin Field Formation Louisiana HACKBERRY WEST MEDIUM Louisiana HACKBERRY WEST OLIGOCENE AMOCO OPERATED ONLY Louisiana LAKE BARRE LB LM2 SU Louisiana LAKE BARRE LM1 LB SU Louisiana LAKE BARRE UNIT B UPPER M-1 SAND Louisiana LAKE BARRE UPPER MS RESERVOIR D Louisiana LAKE PALOURDE EAST All Louisiana LAKE PELTO PELTO DEEP Louisiana LAKE WASHINGTON 21 RESERVOIR A Louisiana LAKE WASHINGTON DEEP Louisiana OLD LISBON PETTIT LIME Louisiana PARADIS DEEP Louisiana PARADIS LOWER 9000 FT SAND RM Louisiana PARADIS PARADIS ZONE, SEG A-B Louisiana QUARANTINE BAY 3 SAND, RESERVOIR B Louisiana QUARANTINE BAY 8 SAND, RESERVOIR B Louisiana QUARANTINE BAY MEDIUM Louisiana ROMERE PASS 28 RESERVOIRS Louisiana ROMERE PASS 9700 Louisiana SATURDAY ISLAND All others Louisiana SATURDAY ISLAND 11 RESERVOIRS Louisiana SWEET LAKE All others Louisiana SWEET LAKE AVG 30 SANDS Louisiana VENICE B-13 SAND Louisiana VENICE B-30 SAND Louisiana VENICE B-6 SAND Louisiana VENICE B-7 SAND Louisiana VENICE M-24 SAND Louisiana WEEKS ISLAND DEEP Louisiana WEEKS ISLAND R-SAND RESERVOIR A Louisiana WEEKS ISLAND S-SAND RESERVOIR A Louisiana WEST BAY 11A SAND (RESERVOIR A) Louisiana WEST BAY 11B SAND FAULT BLOCK B Louisiana WEST BAY 6B RESERVOIR G Louisiana WEST BAY 8A SAND FAULT BLOCK A Louisiana WEST BAY 8AL SAND Louisiana WEST BAY MEDIUM Louisiana WEST BAY PROPOSED WB68 (RG) SAND UNIT Louisiana WEST BAY WB 1 (FBA) SU Louisiana WEST BAY X-11 (RESERVOIR A) Louisiana WEST BAY X-9 A SAND (RESERVOIR A)

5-6 February 2006
Table 11. Gulf Coast Oil Reservoirs Screened Amenable to CO2-EOR
Basin Field Formation Louisiana WEST DELTA BLOCK 83 10100 C SAND Louisiana WHITE LAKE WEST AMPH B Louisiana WHITE LAKE WEST BIG 3-2, RE, RC Louisiana ANSE LABUTTE MIOCENE AMOCO OPERATED ONLY Louisiana BATEMAN LAKE 10400 GRABEN Louisiana BLACK BAYOU FRIO SAND, RESERVOIR A Louisiana BLACK BAYOU T-SAND Louisiana BLACK BAYOU RESERVOIR OT SAND Louisiana BLACK BAYOU T2 SAND RESERVOIR F Louisiana BOSCO DISCORBIS Louisiana BULLY CAMP TEXTULARLA, RL Louisiana CAILLOU ISLAND UPPER 8000 RA SU Louisiana CAILLOU ISLAND 53-C RA SU Louisiana CHANDELEUR SOUND BLOCK 0025 BB RA SAND Louisiana CLOVELY M RESERVOIR B Louisiana CLOVELY 50 SAND, FAULT BLOCK VII Louisiana CLOVELY FAULT BLOCK IV NO. 50 SAND Louisiana COTE BLANCHE ISLAND 20 SAND Louisiana COTTON VALLEY BODCAW Louisiana DELHI DELHI ALL Louisiana DELTA DUCK CLUB A SEQ LOWER 6,300’ SAND Louisiana DELTA DUCK CLUB B SEQ LOWER 6,300’ SAND Louisiana DOG LAKE DGL CC RU SU (REVISION) Louisiana ERATH 8,700 Louisiana ERATH 7,300 SAND Louisiana FORDOCHE WI2 RA Louisiana HAYNESVILLE PETTIT Louisiana HAYNESVILLE TOKIO Louisiana HAYNESVILLE EAST EAST PETTIT Louisiana HAYNESVILLE EAST BIRDSONG-OWENS Louisiana LAFITTE LOWER SF DENNIS SAND, SEQ H Louisiana LAKE HATCH 9,850 SAND Louisiana LEEVILLE 95 SAND, SEQ B Louisiana LEEVILLE 96 SAND, SEQ B Louisiana LITTLE LAKE E-4 SAND, RES A Louisiana MAIN PASS BLOCK 0035 90 CHANNEL G2 Louisiana MAIN PASS BLOCK 0035 G2 RESERVOIR A SAND UNIT Louisiana MANILE VILLAGE 29 SAND Louisiana NORTH SHOUGALOO-RED ROCK AAA Louisiana LISBON PET LIME Louisiana PARADIS MAIN PAY, SET T

5-7 February 2006
Table 11. Gulf Coast Oil Reservoirs Screened Amenable to CO2-EOR
Basin Field Formation Louisiana PHOENIX LAKE BROWN A-1 Louisiana PORT BARRE FUTRAL SAND, RESERVOIR A Louisiana QUARANTINE BAY 9A SAND, FAULT BLOCK C Louisiana QUARANTINE BAY 5 SAND, (REF) Louisiana RODESSA RODESSE ALL Louisiana SECTION 28 2ND HACKBERRY, RESERVOIR D Louisiana SOUTHEAST PASS J-5 SAND RA Louisiana SOUTHEAST PASS L RESERVOIR C Louisiana TEPETATE ORTEGO A Louisiana TEPETATE WEST MILLER Louisiana VALENTINE N SAND RESERVOIR A Louisiana VALENTINE VAL N RC SU Louisiana VILLE PLATTE RL BASAL COCKFIELD Louisiana VILLE PLATTE RD BASAL COCKFIELD Louisiana VILLE PLATTE MIDDLE COCKFIELD RA Louisiana WELSH CAMERINA Louisiana WHITE CASTLE 01 RF SU Louisiana WHITE LAKE EAST 4- SAND B. Mississippi Mississippi BAY SPRINGS CVL LOWER COTTON VALLEY Mississippi CRANFIELD LOWER TUSCALOOSA Mississippi EUCUTTA EAST E_EUTAW Mississippi HEIDELBERG, EAST E_CHRISTMAS Mississippi HEIDELBERG, EAST E_EUTAW Mississippi HEIDELBERG, EAST UPPER TUSCALOOSA Mississippi HEIDELBERG, WEST W_CHRISTMAS Mississippi LITTLE CREEK LOWER TUSCALOOSA Mississippi MALLALIEU, WEST LOWER TUSCALOOSA WMU C Mississippi MCCOMB LOWER TUSCALOOSA B Mississippi PACHUTA CREEK, EAST ESOPU RES. Mississippi QUITMAN BAYOU 4600 WILCOX Mississippi SOSO BAILEY Mississippi TINSLEY SELMA-EUTAW-TUSCALOOSA Mississippi TINSLEY E_WOODRUFF SAND EAST SEGMENT Mississippi TINSLEY W_WOODRUFF SAND WEST SEGMENT Mississippi YELLOW CREEK, WEST EUTAW Mississippi EUCUTTA, WEST W_EUTAW Mississippi FIELD 13 013 Mississippi HEIDELBERG, WEST EUTAW

5-8 February 2006
Table 11. Gulf Coast Oil Reservoirs Screened Amenable to CO2-EOR
Basin Field Formation C. Alabama Alabama CITRONELLE RODESSA Alabama GILBERTOWN LOWER EUTAW Alabama LITTLE ESCAMBIA CREEK SMACKOVER Alabama NORTH FRISCO CITY FRISCO CITY Alabama WOMACK HILL SMACKOVER D. Florida Florida BLACKJACK CREEK SMACKOVER Florida JAY SMACKOVER Florida RACOON POINT SUNNILAND Florida SUNNILAND SUNNILAND Florida WEST FELDA ROBERTS
5.4 CALCULATING MINIMUM MISCIBILITY PRESSURE. The miscibility of a
reservoir’s oil with injected CO2 is a function of pressure, temperature and the
composition of the reservoir’s oil. The study’s approach to estimating whether a
reservoir’s oil will be miscible with CO2, given fixed temperature and oil composition,
was to determine whether the reservoir would hold sufficient pressure to attain
miscibility. Where oil composition data was missing, a correlation was used for
translating the reservoir’s oil gravity to oil composition.
To determine the minimum miscibility pressure (MMP) for any given reservoir,
the study used the Cronquist correlation, Figure 8. This formulation determines MMP
based on reservoir temperature and the molecular weight (MW) of the pentanes and
heavier fractions of the reservoir oil, without considering the mole percent of methane.
(Most Gulf Coast oil reservoirs have produced the bulk of their methane during primary
and secondary recovery.) The Cronquist correlation is set forth below:
MMP = 15.988*T (0.744206+0.0011038*MW C5+)
Where: T is Temperature in ºF, and MW C5+ is the molecular weight of pentanes
and heavier fractions in the reservoir’s oil.

5-9 February 2006
Mole Weight C5+
70 110 150 190 230 2700
1000
2000
0.3
4000
5000
6000
Mis
cibi
lity
Pres
sure
, psi
Temperature, oF
JAF02450.PPT
Figure 8. Estimating CO2 Minimum Miscibility Pressure
340 300 280 260 240 220 200
180
Correlation for CO2 Minimum Pressure as a Function of Temperature(Mungan, N., Carbon Dioxide Flooding Fundamentals, 1981)
The temperature of the reservoir was taken from the data base or estimated from
the thermal gradient in the basin. The molecular weight of the pentanes and heavier
fraction of the oil was obtained from the data base or was estimated from a correlative
plot of MW C5+ and oil gravity, shown in Figure 9.
The next step was calculating the minimum miscibility pressure (MMP) for a
given reservoir and comparing it to the maximum allowable pressure. The maximum
pressure was determined using a pressure gradient of 0.6 psi/foot. If the minimum
miscibility pressure was below the maximum injection pressure, the reservoir was
classified as a miscible flood candidate. Oil reservoirs that did not screen positively for
miscible CO2-EOR were selected for consideration by immiscible CO2-EOR.

5-10 February 2006
y = 4247.98641x-0.87022
R2 = 0.99763
0
100
200
300
400
500
0 20 40 60 80 100
Tank Oil Gravity, oAPI
Mol
ecul
ar W
T C
5+
Figure 9. Correlation of MW C5+ to Tank Oil Gravity.(modified from Mungan, N. Carbon Dioxide Flooding Fundamentals, 1981)
y = 4247.98641x-0.87022
R2 = 0.99763
0
100
200
300
400
500
0 20 40 60 80 100
Tank Oil Gravity, oAPI
Mol
ecul
ar W
T C
5+
Figure 9. Correlation of MW C5+ to Tank Oil Gravity.(modified from Mungan, N. Carbon Dioxide Flooding Fundamentals, 1981)
5.5 CALCULATING OIL RECOVERY. The study utilized CO2-PROPHET to
calculate incremental oil produced using CO2-EOR. CO2-PROPHET was developed by
the Texaco Exploration and Production Technology Department (EPTD) as part of the
DOE Class I cost-share program. The specific project was “Post Waterflood CO2 Flood
in a Light Oil, Fluvial Dominated Deltaic Reservoir” (DOE Contract No. DE-FC22-
93BC14960). CO2-PROPHET was developed as an alternative to the DOE’s CO2
miscible flood predictive model, CO2PM. According to the developers of the model,
CO2-PROPHET has more capabilities and fewer limitations than CO2PM. For example,
according to the above cited report, CO2-PROPHET performs two main operations that
provide a more robust calculation of oil recovery than available from CO2PM:
• CO2-PROPHET generates streamlines for fluid flow between injection and
production wells, and

5-11 February 2006
• The model performs oil displacement and recovery calculations along the
established streamlines. (A finite difference routine is used for oil
displacement calculations.)
Appendix A discusses, in more detail, the CO2-PROPHET model and the
calibration of this model with an industry standard reservoir simulator.
Even with these improvements, it is important to note the CO2-PROPHET is still
primarily a “screening-type” model, and lacks some of the key features, such as gravity
override and compositional changes to fluid phases, available in more sophisticated
reservoir simulators.
5.6 ASSEMBLING THE COST MODEL. A detailed, up-to-date CO2-EOR Cost
Model was developed by the study. The model includes costs for: (1) drilling new wells
or reworking existing wells; (2) providing surface equipment for new wells; (3) installing
the CO2 recycle plant; (4) constructing a CO2 spur-line from the main CO2 trunkline to
the oil field; and, (5) various miscellaneous costs.
The cost model also accounts for normal well operation and maintenance (O&M),
for lifting costs of the produced fluids, and for costs of capturing, separating and
reinjecting the produced CO2. A variety of CO2 purchase and reinjection costs options
are available to the model user. (Appendices B, C, D and E provide state-level details
on the Cost Model for CO2-EOR prepared by this study.)
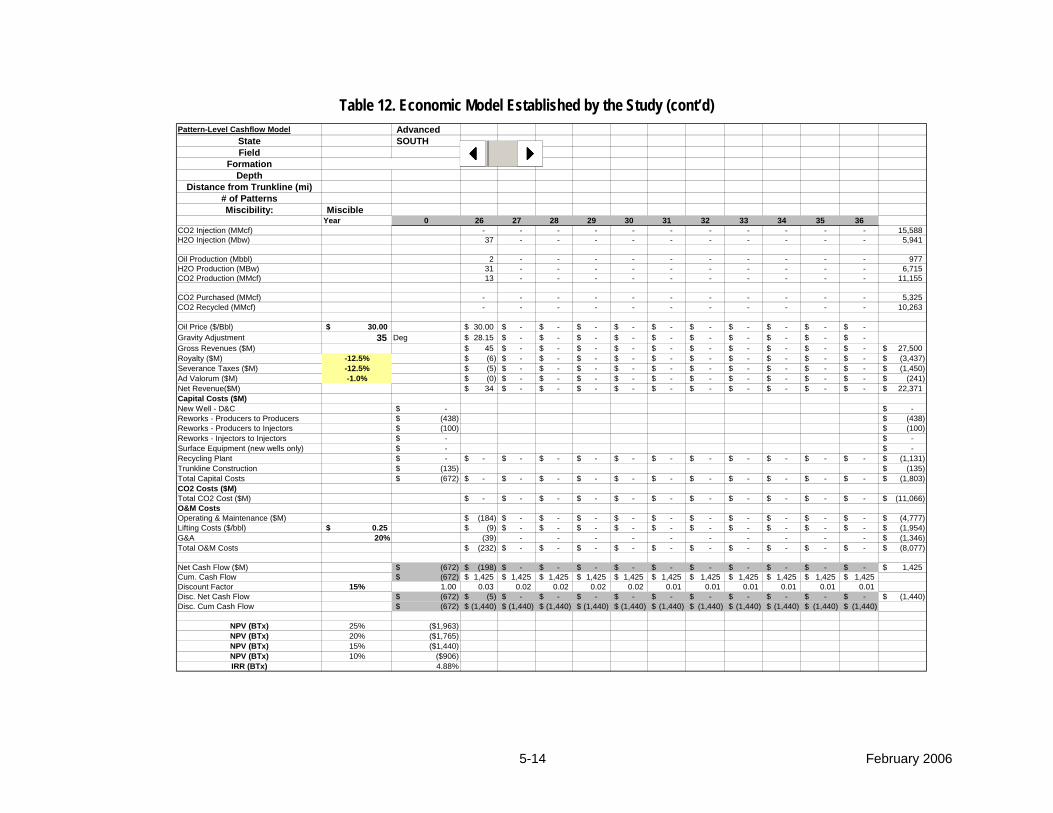
5.7 CONSTRUCTING AN ECONOMICS MODEL. The economic model used by
the study is an industry standard cash flow model that can be run on either a pattern or
a field-wide basis. The economic model accounts for royalties, severance and ad
valorem taxes, as well as any oil gravity and market location discounts (or premiums)
from the “marker” oil price. A variety of oil prices are available to the model user. Table
12 provides an example of the Economic Model for CO2-EOR used by the study.

5-12 February 2006
Table 12. Economic Model Established by the Study
Pattern-Level Cashflow Model AdvancedState S LA SOUTHField CLOVELLY New Injectors 0.00 21
Formation M RESERVOIR B Existing Injectors 0.00Depth 11,900 Convertable Producers 1.00
Distance from Trunkline (mi) 10 New Producers 0.0# of Patterns 7 Existing Producers 1.89Miscibility: Miscible
Year 0 1 2 3 4 5 6 7 8 9 10 11CO2 Injection (MMcf) 731 731 731 731 731 731 731 731 696 656 656 H2O Injection (Mbw) 183 183 183 183 183 183 183 183 200 220 220
Oil Production (Mbbl) - - 76 103 66 61 66 52 46 38 34 H2O Production (MBw) 475 475 387 264 258 241 224 218 216 234 242 CO2 Production (MMcf) - - 27 264 373 430 461 509 538 524 513
CO2 Purchased (MMcf) 731 731 704 466 357 301 270 222 158 132 143 CO2 Recycled (MMcf) - - 27 264 373 430 461 509 538 524 513
Oil Price ($/Bbl) 30.00$ 30.00$ 30.00$ 30.00$ 30.00$ 30.00$ 30.00$ 30.00$ 30.00$ 30.00$ 30.00$ 30.00$ Gravity Adjustment 35 Deg 28.15$ 28.15$ 28.15$ 28.15$ 28.15$ 28.15$ 28.15$ 28.15$ 28.15$ 28.15$ 28.15$ Gross Revenues ($M) -$ -$ 2,134$ 2,885$ 1,861$ 1,720$ 1,844$ 1,455$ 1,284$ 1,056$ 954$ Royalty ($M) -12.5% -$ -$ (267)$ (361)$ (233)$ (215)$ (230)$ (182)$ (160)$ (132)$ (119)$ Severance Taxes ($M) -12.5% -$ -$ -$ -$ -$ -$ -$ -$ -$ -$ (104)$ Ad Valorum ($M) -1.0% -$ -$ (19)$ (25)$ (16)$ (15)$ (16)$ (13)$ (11)$ (9)$ (8)$ Net Revenue($M) -$ -$ 1,848$ 2,499$ 1,612$ 1,490$ 1,597$ 1,261$ 1,112$ 914$ 722$ Capital Costs ($M)New Well - D&C -$ Reworks - Producers to Producers (438)$ Reworks - Producers to Injectors (100)$ Reworks - Injectors to Injectors -$ Surface Equipment (new wells only) -$ Recycling Plant -$ -$ (1,131)$ -$ -$ -$ -$ -$ -$ -$ -$ -$ Trunkline Construction (135)$ Total Capital Costs (672)$ -$ (1,131)$ -$ -$ -$ -$ -$ -$ -$ -$ -$ CO2 Costs ($M)Total CO2 Cost ($M) (1,095.8)$ (1,096)$ (1,063)$ (779)$ (648)$ (580)$ (543)$ (485)$ (398)$ (355)$ (368)$ O&M Costs Operating & Maintenance ($M) (184)$ (184)$ (184)$ (184)$ (184)$ (184)$ (184)$ (184)$ (184)$ (184)$ (184)$ Lifting Costs ($/bbl) 0.25$ (119)$ (119)$ (116)$ (92)$ (81)$ (75)$ (72)$ (68)$ (65)$ (68)$ (69)$ G&A 20% (61) (61) (60) (55) (53) (52) (51) (50) (50) (50) (51) Total O&M Costs (363)$ (363)$ (359)$ (331)$ (318)$ (311)$ (307)$ (301)$ (299)$ (302)$ (303)$
Net Cash Flow ($M) (672)$ (1,459)$ (2,590)$ 426$ 1,390$ 646$ 599$ 747$ 474$ 415$ 257$ 50$ Cum. Cash Flow (672)$ (2,131)$ (4,720)$ (4,295)$ (2,905)$ (2,258)$ (1,660)$ (912)$ (438)$ (23)$ 234$ 284$ Discount Factor 15% 1.00 0.87 0.76 0.66 0.57 0.50 0.43 0.38 0.33 0.28 0.25 0.21 Disc. Net Cash Flow (672)$ (1,269)$ (1,958)$ 280$ 795$ 321$ 259$ 281$ 155$ 118$ 64$ 11$ Disc. Cum Cash Flow (672)$ (1,941)$ (3,899)$ (3,619)$ (2,824)$ (2,503)$ (2,244)$ (1,963)$ (1,808)$ (1,690)$ (1,626)$ (1,616)$
NPV (BTx) 25% ($1,963)NPV (BTx) 20% ($1,765)NPV (BTx) 15% ($1,440)NPV (BTx) 10% ($906)IRR (BTx) 4.88%

5-13 February 2006
Table 12. Economic Model Established by the Study (cont’d) Pattern-Level Cashflow Model Advanced
State S LA SOUTHField CLOVELLY
Formation M RESERVOIR BDepth 11,900
Distance from Trunkline (mi) 10 # of Patterns 7 Miscibility: Miscible
Year 0 12 13 14 15 16 17 18 19 20 21 22 23 24 25CO2 Injection (MMcf) 656 656 656 656 656 656 656 656 656 656 656 518 - - H2O Injection (Mbw) 220 220 220 220 220 220 220 220 220 220 220 289 548 548
Oil Production (Mbbl) 34 37 47 46 48 42 33 28 23 19 19 20 20 20 H2O Production (MBw) 240 238 221 223 218 217 221 219 227 228 227 234 312 426 CO2 Production (MMcf) 519 518 531 531 537 556 570 585 581 588 590 604 540 253
CO2 Purchased (MMcf) 137 138 125 125 119 101 87 71 75 68 66 - - - CO2 Recycled (MMcf) 519 518 531 531 537 556 570 585 581 588 590 518 - -
Oil Price ($/Bbl) 30.00$ 30.00$ 30.00$ 30.00$ 30.00$ 30.00$ 30.00$ 30.00$ 30.00$ 30.00$ 30.00$ 30.00$ 30.00$ 30.00$ 30.00$ Gravity Adjustment 35 Deg 28.15$ 28.15$ 28.15$ 28.15$ 28.15$ 28.15$ 28.15$ 28.15$ 28.15$ 28.15$ 28.15$ 28.15$ 28.15$ 28.15$ Gross Revenues ($M) 960$ 1,033$ 1,334$ 1,289$ 1,362$ 1,191$ 929$ 794$ 633$ 532$ 521$ 557$ 552$ 574$ Royalty ($M) -12.5% (120)$ (129)$ (167)$ (161)$ (170)$ (149)$ (116)$ (99)$ (79)$ (67)$ (65)$ (70)$ (69)$ (72)$ Severance Taxes ($M) -12.5% (105)$ (113)$ (146)$ (141)$ (149)$ (130)$ (102)$ (87)$ (69)$ (58)$ (57)$ (61)$ (60)$ (63)$ Ad Valorum ($M) -1.0% (8)$ (9)$ (12)$ (11)$ (12)$ (10)$ (8)$ (7)$ (6)$ (5)$ (5)$ (5)$ (5)$ (5)$ Net Revenue($M) 727$ 782$ 1,010$ 976$ 1,031$ 901$ 703$ 601$ 479$ 403$ 394$ 422$ 418$ 435$ Capital Costs ($M)New Well - D&C -$ Reworks - Producers to Producers (438)$ Reworks - Producers to Injectors (100)$ Reworks - Injectors to Injectors -$ Surface Equipment (new wells only) -$ Recycling Plant -$ -$ -$ -$ -$ -$ -$ -$ -$ -$ -$ -$ -$ -$ -$ Trunkline Construction (135)$ Total Capital Costs (672)$ -$ -$ -$ -$ -$ -$ -$ -$ -$ -$ -$ -$ -$ -$ CO2 Costs ($M)Total CO2 Cost ($M) (361)$ (362)$ (347)$ (347)$ (340)$ (317)$ (301)$ (282)$ (287)$ (278)$ (276)$ (155)$ -$ -$ O&M Costs Operating & Maintenance ($M) (184)$ (184)$ (184)$ (184)$ (184)$ (184)$ (184)$ (184)$ (184)$ (184)$ (184)$ (184)$ (184)$ (184)$ Lifting Costs ($/bbl) 0.25$ (68)$ (69)$ (67)$ (67)$ (67)$ (65)$ (63)$ (62)$ (62)$ (62)$ (61)$ (64)$ (98)$ (127)$ G&A 20% (50) (50) (50) (50) (50) (50) (49) (49) (49) (49) (49) (49) (56) (62) Total O&M Costs (303)$ (303)$ (301)$ (301)$ (300)$ (298)$ (297)$ (295)$ (295)$ (294)$ (294)$ (297)$ (337)$ (373)$
Net Cash Flow ($M) (672)$ 63$ 117$ 362$ 328$ 391$ 286$ 106$ 24$ (103)$ (170)$ (176)$ (30)$ 80$ 62$ Cum. Cash Flow (672)$ 347$ 464$ 826$ 1,153$ 1,545$ 1,830$ 1,936$ 1,960$ 1,857$ 1,687$ 1,511$ 1,481$ 1,561$ 1,623$ Discount Factor 15% 1.00 0.19 0.16 0.14 0.12 0.11 0.09 0.08 0.07 0.06 0.05 0.05 0.04 0.03 0.03 Disc. Net Cash Flow (672)$ 12$ 19$ 51$ 40$ 42$ 27$ 9$ 2$ (6)$ (9)$ (8)$ (1)$ 3$ 2$ Disc. Cum Cash Flow (672)$ (1,604)$ (1,585)$ (1,534)$ (1,493)$ (1,452)$ (1,425)$ (1,417)$ (1,415)$ (1,421)$ (1,430)$ (1,438)$ (1,440)$ (1,437)$ (1,435)$
NPV (BTx) 25% ($1,963)NPV (BTx) 20% ($1,765)NPV (BTx) 15% ($1,440)NPV (BTx) 10% ($906)IRR (BTx) 4.88%
5-14 February 2006
Table 12. Economic Model Established by the Study (cont’d)
Pattern-Level Cashflow Model AdvancedState S LA SOUTHField CLOVELLY
Formation M RESERVOIR BDepth 11,900
Distance from Trunkline (mi) 10 # of Patterns 7 Miscibility: Miscible
Year 0 26 27 28 29 30 31 32 33 34 35 36CO2 Injection (MMcf) - - - - - - - - - - - 15,588 H2O Injection (Mbw) 37 - - - - - - - - - - 5,941
Oil Production (Mbbl) 2 - - - - - - - - - - 977 H2O Production (MBw) 31 - - - - - - - - - - 6,715 CO2 Production (MMcf) 13 - - - - - - - - - - 11,155
CO2 Purchased (MMcf) - - - - - - - - - - - 5,325 CO2 Recycled (MMcf) - - - - - - - - - - - 10,263
Oil Price ($/Bbl) 30.00$ 30.00$ -$ -$ -$ -$ -$ -$ -$ -$ -$ -$ Gravity Adjustment 35 Deg 28.15$ -$ -$ -$ -$ -$ -$ -$ -$ -$ -$ Gross Revenues ($M) 45$ -$ -$ -$ -$ -$ -$ -$ -$ -$ -$ 27,500$ Royalty ($M) -12.5% (6)$ -$ -$ -$ -$ -$ -$ -$ -$ -$ -$ (3,437)$ Severance Taxes ($M) -12.5% (5)$ -$ -$ -$ -$ -$ -$ -$ -$ -$ -$ (1,450)$ Ad Valorum ($M) -1.0% (0)$ -$ -$ -$ -$ -$ -$ -$ -$ -$ -$ (241)$ Net Revenue($M) 34$ -$ -$ -$ -$ -$ -$ -$ -$ -$ -$ 22,371$ Capital Costs ($M)New Well - D&C -$ -$ Reworks - Producers to Producers (438)$ (438)$ Reworks - Producers to Injectors (100)$ (100)$ Reworks - Injectors to Injectors -$ -$ Surface Equipment (new wells only) -$ -$ Recycling Plant -$ -$ -$ -$ -$ -$ -$ -$ -$ -$ -$ -$ (1,131)$ Trunkline Construction (135)$ (135)$ Total Capital Costs (672)$ -$ -$ -$ -$ -$ -$ -$ -$ -$ -$ -$ (1,803)$ CO2 Costs ($M)Total CO2 Cost ($M) -$ -$ -$ -$ -$ -$ -$ -$ -$ -$ -$ (11,066)$ O&M Costs Operating & Maintenance ($M) (184)$ -$ -$ -$ -$ -$ -$ -$ -$ -$ -$ (4,777)$ Lifting Costs ($/bbl) 0.25$ (9)$ -$ -$ -$ -$ -$ -$ -$ -$ -$ -$ (1,954)$ G&A 20% (39) - - - - - - - - - - (1,346)$ Total O&M Costs (232)$ -$ -$ -$ -$ -$ -$ -$ -$ -$ -$ (8,077)$
Net Cash Flow ($M) (672)$ (198)$ -$ -$ -$ -$ -$ -$ -$ -$ -$ -$ 1,425$ Cum. Cash Flow (672)$ 1,425$ 1,425$ 1,425$ 1,425$ 1,425$ 1,425$ 1,425$ 1,425$ 1,425$ 1,425$ 1,425$ Discount Factor 15% 1.00 0.03 0.02 0.02 0.02 0.02 0.01 0.01 0.01 0.01 0.01 0.01 Disc. Net Cash Flow (672)$ (5)$ -$ -$ -$ -$ -$ -$ -$ -$ -$ -$ (1,440)$ Disc. Cum Cash Flow (672)$ (1,440)$ (1,440)$ (1,440)$ (1,440)$ (1,440)$ (1,440)$ (1,440)$ (1,440)$ (1,440)$ (1,440)$ (1,440)$
NPV (BTx) 25% ($1,963)NPV (BTx) 20% ($1,765)NPV (BTx) 15% ($1,440)NPV (BTx) 10% ($906)IRR (BTx) 4.88%
5-15 February 2006
5.8 PERFORMING SCENARIO ANALYSES. A series of analyses were
prepared to better understand how differences in oil prices, CO2 supply costs and
financial risk hurdles could impact the volumes of oil that would be economically
produced by CO2-EOR from the Gulf Coast’s oil basins and major oil reservoirs.
Two technology cases were examined. As discussed in more detail in Chapter 2,
the study examined the application of two CO2-EOR options — “Traditional
Practices” and “State-of-the-art” Technology.
Two oil prices were considered. A $30 per barrel oil price was used to represent the
moderate oil price case; a $40 per barrel oil price was used to represent the
availability of federal/state risk sharing and/or the continuation of the current high oil
price situation.
Two CO2 supply costs were considered. The high CO2 cost was set at 5% of the oil
price ($1.50 per Mcf at $30 per barrel) to represent the costs of a new transportation
system bringing natural CO2 to the Gulf Coast’s oil basins. A lower CO2 supply cost
equal to 2% of the oil price ($0.80 per Mcf at $40 per barrel) was included to
represent the potential future availability of low-cost CO2 from industrial and power
plants as part of CO2 storage.
Two minimum rate of return (ROR) hurdles were considered, a high ROR of 25%,
before tax, and a lower 15% ROR, before tax. The high ROR hurdle incorporates a
premium for the market, reservoir and technology risks inherent in using CO2-EOR in
a new reservoir setting. The lower ROR hurdle represents application of CO2-EOR
after the geologic and technical risks have been mitigated with a robust program of
field pilots and demonstrations.
These various technology, oil price, CO2 supply cost and rate of return hurdles were
combined into four scenarios, as set forth below:
5-16 February 2006
The first scenario captures how CO2-EOR technology has been applied and has
performed in the past. This low technology, high risk scenario, is called “Traditional
Practices”.
The second scenario, entitled “State-of-the-art”, assumes that the technology
progress in CO2-EOR, achieved in the past ten years in other areas, is successfully
applied to the oil reservoirs of the Gulf Coast. In addition, this scenario assumes
that a comprehensive program of research, pilot tests and field demonstrations will
help lower the risk inherent in applying new technology to these complex Gulf Coast
oil reservoirs.
The third scenario, entitled “Risk Mitigation,” examines how the economic potential
of CO2-EOR could be increased through a strategy involving state production tax
reductions, federal tax credits, royalty relief and/or higher world oil prices that
together would add an equivalent $10 per barrel to the price that the producer uses
for making capital investment decisions for CO2-EOR.
The final scenario, entitled “Ample Supplies of CO2,” low-cost, “EOR-ready” CO2
supplies are aggregated from various industrial and natural sources. These include
industrial high-concentration CO2 emissions from hydrogen facilities, gas processing
plants, chemical plants and other sources in the region. These would be
augmented, in the longer-term, from concentrated CO2 emissions from refineries
and electric power plants. Capture of industrial CO2 emissions could be part of a
national effort for reducing greenhouse gas emissions.

6-1 February 2006
6. RESULTS BY STATE
6.1 LOUISIANA. Louisiana is a major oil producing state with a rich history of
oil and gas development. Crude oil production began in 1902, and has reached a
cumulative recovery of 13 billion barrels through 2004. In 2004, Louisiana Onshore
ranked 6th in oil production in the onshore U.S providing 45 MMBbls of oil (123
MBbls/day). It has about 27,000 producing oil wells and oil reserves of 362 MMBbls.
The bulk of oil production is from the southern portion of the state.
Despite still being one of the top oil producing states, Louisiana has seen a
significant decline in production in recent years, Table 13.
Table 13. Recent History of Louisiana Onshore Oil Production
Annual Oil Production
(MMBls/year) (MBbls/day)
1999 70 192
2000 59 162
2001 59 162
2002 49 134
2003 51 140
2004 45 123
An active program of secondary oil recovery has helped maintain oil production
in the state. In 1996, more than 300 onshore oil reservoirs in the state of Louisiana
were being waterflooded. However, these waterfloods are now mature, with many of
the fields near their production limits, calling for alternative methods for maintaining oil
production.

6-2 February 2006
Louisiana Oil Fields. To better understand the potential of using CO2-EOR in
Louisiana’s light oil fields, this section examines, in more depth, four large oil fields,
shown in Figure 11.
Caillou Island (Deep Reservoirs)
Lake Washington (Deep Reservoirs)
Weeks Island (Deep Reservoirs)
West Bay (Medium Reservoirs)
Figure 11. Large Louisiana Oil Fields
#
#
#
#
Weeks Island, Deep
#
Caillou Island, Deep
New Orleans
Baton Rouge
#
West Bay, Medium
#
Lake Washington, Deep
10 0 10 20 30 40 Miles
Oil FieldsCounty LineState LineCity
Large Louisiana Oil FieldsOil FieldsCounty LineState LineCity
Oil FieldsCounty LineState LineCity
Large Louisiana Oil Fields

6-3 February 2006
These four fields, distributed across southern Louisiana, could serve as the
“anchor” sites for CO2-EOR projects in the southern portion of the state that could later
be extended to other fields. The cumulative oil production, proved reserves and
remaining oil in place (ROIP) for these four large light oil fields are set forth in Table 14.
Table 14. Status of Large Oil Louisiana Fields/Reservoirs (as of 2002)
Large Fields/Reservoirs
Original Oil In-Place (MMBbls)
Cumulative Production (MMBbls)
Proved Primary/Secondary
Reserves (MMBbls)
Remaining Oil In-Place (MMBbls)
1 Callilou Island (Deep) 1,176 581 7 588
2 Lake Washington (Deep) 566 243 12 311
3 Weeks Island (Deep) 340 143 10 187
4 West Bay (Medium) 325 134 7 183
These four large “anchor” fields, each with 180 or more million barrels of ROIP,
appear to be favorable for miscible CO2 -EOR, based on their reservoir properties,
Table 15.
Table 15. Reservoir Properties and Improved Oil Recovery Activity, Large Louisiana Oil Fields/Reservoirs
Depth
Large Fields/Reservoirs (ft) Oil Gravity
(ºAPI) Active Waterflood or Gas
Injection
1 Callilou Island (Deep) 13,000 39.0 Undergoing waterflooding
2 Lake Washington (Deep) 12,500 26.0 Undergoing waterflooding
3 Weeks Island (Deep) 14,000 33.0 Past CO2-EOR Project
4 West Bay (Medium) 9,000 30.0 Undergoing waterflooding
Past CO2-EOR Projects. Past CO2-EOR pilot projects in onshore Louisiana
have been conducted in Paradis (Lower 9000 Sand RM), Bay St. Elaine (8,000 ft sand),

6-4 February 2006
and West Bay (5 A’B”) oil reservoirs. However, perhaps the most notable pilot project
has been Shell Oil Company’s Weeks Island gravity stable flood, discussed below:
Weeks Island. Beginning in 1978, Shell and the U.S. DOE began a CO2 gravity
stable pilot project at the “S” Sand Reservoir B of Weeks Island field. (Weeks Island
field is a piercement type salt dome, with commercial production from 37 Lower
Miocene sands.)
• Initial gas injection, containing 853 MMcf of CO2 (24% HCPV) and 55 MMcf of
natural gas, lasted from October 1978 until February 1980. This was followed by
re-injection of the produced CO2 and natural gas (at 761 Mcf/d) through 1987.
• Early production testing revealed that an oil bank was being mobilized in the
watered out sand, creating an oil bank measured at 57 feet of thickness.
• Oil production began in early 1981. By 1987, 261,000 barrels of oil, or 64% of
ROIP, had been recovered. Subtracting the mobile oil at the start, the project
mobalized 205,000 barrels of residual oil, equal to 60% of the oil left after water
displacement. As such, the pilot project in the “S” Sand Reservoir B at Weeks
Island was considered a success.
The full field application of the CO2 gravity project at Weeks Island was not
successful due to inability of the CO2 injection design to displace the strong bottom
water drive.
Bay St. Elane (8000 Foot Reservoir E Sand Unit). A gravity-stable miscible CO2
flood was initiated in the Bay St. Elane (RESU) field in 1981. The purpose of the project
was to test the effectiveness of CO2 injection into a steeply dipping (36º), low residual oil
(20%) sandstone reservoir.
Approximately 433 MMcf of CO2 solvent was injected into an up-dip well over a 9
month period, resulting in a 0.33 PV CO2 (plus methane/butane) injection.
Approximately 300 MMcf of nitrogen was then injected as the drive gas.

6-5 February 2006
The project expected to recover 75,000 barrels of incremental oil, assuming a
residual oil saturation after CO2 flooding of 5% and a CO2 sweep efficiency of
53% (based on 75% vertical and 70% areal conformance).
The operator reports that while an oil bank was mobilized and one of the
producing wells flowed at 92% oil cut (previously 100% water cut), there was
difficulty in producing the oil bank with the existing well placements. Final
performance results for this innovative CO2-EOR project are not available.
Immiscible CO2 (“Huff and Puff”). A series of small scale CO2 well stimulation
(“Huff and Puff”) tests were conducted in the mid-1980’s. This process, similar to using
steam stimulation in heavy oil fields, involves injecting a substantial volume of CO2 into
a producing well, allowing the CO2 to soak into the oil for a few weeks, and then
returning the well to production. The operators reported that incremental oil recoveries
were achieved at low CO2/oil ratios. One such project, Paradis (Main Pay Sand,
Reservoir T), was conducted in 1984/1985 and involved injecting two cycles of CO2 into
a producing well. A total of 39 MMcf of CO2 was injected resulting in reported
incremental oil recovery of 20,700 barrels. Post project analysis showed that higher
CO2 injection rates would have enabled the CO2 to contact more of the reservoir’s oil.
Future CO2-EOR Potential. Louisiana contains 128 reservoirs that are
candidates for miscible CO2-EOR. Under “Traditional Practices” (and Base Case
financial conditions, defined above), there is one economically attractive oil reservoirs
for miscible CO2 flooding in Louisiana. Applying “State-of-the-art Technology” (involving
higher volume CO2 injection) and lower risk financial conditions, the number of
economically favorable oil reservoirs in Louisiana increases to 4, providing 129 million
barrels of additional oil recovery, Table 16.

6-6 February 2006
Table 16. Economic Oil Recovery Potential Under Two Technologic Conditions, Louisiana
Original
Oil In-Place Technical Potential Economic Potential*
CO2-EOR Technology
No. of Reservoirs
Studied (MMBbls) (MMBbls) (No. of Reservoirs) (MMBbls)
“Traditional Practices” 128 16,050 1,429 1 3
“State-of-the-art” Technology 128 16,050 3,247 4 129
* Oil price of $30 per barrel; CO2 costs of $1.50/Mcf.
Combining “State-of-the-art” technologies with risk mitigation incentives and/or
higher oil prices and lower cost CO2 supplies would enable CO2-EOR in Louisiana to
recover 1,916 million barrels of CO2-EOR oil (from 52 major reservoirs), Table 17.
Table 17. Economic Oil Recovery Potential with More Favorable Financial Conditions, Louisiana
Economic Potential
More Favorable Financial Conditions
Technical Potential (MMBbls) (No. of Reservoirs) (MMBbls)
Plus: Risk Mitigation Incentives* 3,247 24 1,117
Plus: Low Cost CO2 Supplies** 3,247 52 1,916 * Oil price of $40 per barrel, adjusted for gravity and location differentials; CO2 supply costs, $2/Mcf ** CO2 supply costs, $0.80/Mcf
6.2 MISSISSIPPI. Mississippi is the 10th largest oil producing state, providing
17 MMBbls (47 MBbls/day) of oil (in 2004), from about 1,500 producing wells and 178
MMBbls of crude oil reserves. Oil production in the state of Mississippi began in 1889,
and cumulative oil recovery has reached almost 2.3 billion barrels. Despite having
many old fields, oil production in Mississippi has remained level in recent years, due to
improved oil recovery efforts, Table 18.

6-7 February 2006
Table 18. Recent History of Mississippi Onshore Oil Production
Annual Oil Production
(MMBbls/year) (MBbls/day)
1999 15 41
2000 18 49
2001 18 49
2002 18 49
2003 16 44
2004 17 47
Denbury Resources has been instrumental in revitalizing the aging oil fields of
Mississippi. They purchased the Heidelberg field in 1997 from Chevron, a field that has
produced almost 200 MMBbls of oil since discovery in 1944. Currently, oil production is
from five waterflood units producing from the Eutaw Formation. Production at
Heidelburg in 1997 was approximately 2,800 Bbls/day and has increased to 7,500
Bbls/day as a result of waterflooding. In addition, Denbury Resources has initiated a
series of CO2-EOR projects that produced 6,800 barrels per day in 2004.
Mississippi Oil Fields. Mississippi has a number of large oil fields that may be
amenable to miscible CO2- EOR, Figure 12. These include:
Tinsley (E. Woodruff Sand)
Quitman Bayou (4600 Wilcox)
East Heidelberg (Christmas)
These three major oil fields could serve sites for the CO2 projects that could later
extend to small fields in the state. The cumulative oil production, proved reserves and
remaining oil in-place (ROIP) for these three major light oil reservoirs are set forth in
Table 19.

6-1 February 2006
Figure 12. Large Mississippi Oil Fields
#
#
#Tinsley, E. Woodruff Sand
Quitman Bayou, 4600 Wilcox
East Heidelberg, Christmas
Jackson
10 0 10 20 30 40 50 Miles
Oil FieldsCounty LineState LineCity
Large Mississippi Oil FieldsOil FieldsCounty LineState LineCity
Oil FieldsCounty LineState LineCity
Large Mississippi Oil Fields
Table 19. Status of Large Mississippi Oil Fields/Reservoirs (as of 2002)
Large Fields/Reservoirs
Original Oil In-Place
(MMBbls)
Cumulative Production (MMBbls)
Proved Primary/Secondary
Reserves (MMBbls)
Remaining Oil In-Place (MMBbls)
1 Tinsley (E. Woodruff Sand) 163 50 2 111
2 Quitman Bayou (4600 Wilcox) 75 21 * 54
3 East Heidelberg (Christmas) 93 36 6 51
*Less than 0.5 MMBbls.

6-2 February 2006
These three large oil reservoirs, with 50 to over 100 million barrels of ROIP, are
amenable to CO2-EOR. Table 20 provides the reservoir and oil properties for these
three reservoirs and their current secondary oil recovery activities.
Table 20. Reservoir Properties and Improved Oil Recovery Activity, Large Mississippi Oil Fields/Reservoirs
Oil Depth Gravity
Large Fields/Reservoirs (ft) (ºAPI) Active Waterflood or Gas
Injection
1 Tinsley (E. Woodruff Sand) 4,900 33 Active Waterflood
2 Quitman Bayou (4600 Wilcox) 4,700 39 Active Waterflood
3 East Heidelberg (Christmas) 4,827 25 Active Waterflood
In addition to the three major light oil reservoirs, several fields in Mississippi have
reservoirs containing heavier oils, such as West Heidelberg and West Eucutta. These
fields could become candidate fields for immiscible CO2-EOR, Table 21.
Table 21. Reservoir Properties and Improved Oil Recovery Activity Potential, Mississippi “Immiscible-CO2” Oil Fields/Reservoirs
Depth
Candidate Fields/Reservoirs (ft)
Oil Gravity (ºAPI) Active Waterflood or Gas Injection
1 West Eucutta (Eutaw) 4,900 23 None
2 West Heidelberg (Eutaw) 5,000 22 Active waterflood
Past and Current CO2-EOR Projects. Mississippi has also seen an active
history of CO2 enhanced oil recovery, particularly at Little Creek and Mallalieu fields in
western Mississippi.
Little Creek (Lower Tuscaloosa Denkman). An experimental CO2 pilot was
conducted by Shell Oil in the Little Creek oil field from 1974 to 1977. The purpose of
6-3 February 2006
this pilot test was to determine the effectiveness of using CO2-EOR to recover immobile
residual oil from a thoroughly waterflood depleted, deep (10,400 feet) sandstone
reservoir.
The project involved one injection and three producing wells, essentially one-
quarter of an inverted nine-spot on a 40-acre spacing. The pilot area was confined
by surrounding water injection wells and a field pinchout.
Prior to the CO2-flood, the field had recovered 47 million barrels of its 130 million
barrels initially in place, leaving behind a low 21% residual oil saturation.
A large volume of CO2 (1,590 MMcf of purchased and 1,783 MMcf of recycled
CO2) equal to 1.6 HCPV was first injected and then followed by 1 PV of water.
The pilot produced 124,000 barrels of oil (through March 1978), equal to 21% of
OOIP (and 45% of ROIP). Post-flood reservoir simulation showed that gravity
segregation and lack of vertical conformance reduced the effectiveness of the CO2
flood. Post project reservoir simulation of operating flood on WAG (rather than
straight CO2) indicated that CO2 channeling could have been reduced, increasing
volumetric sweep efficiency and oil recovery.
Given the large CO2 slug and less than optimum sweep efficiency, the project had
a high CO2 to oil ratio of 27 Mcf/Bbl gross and 13 Mcf/Bbl net. The producing well
(Well 11-1) closest to the CO2 injector experienced early CO2 breakthrough
contributing to the high CO2 to oil ratio.
In 1999, Denbury Resources Inc. acquired the Little Creek Field and expanded the
field-scale CO2 flood (started in 1985) to the current 34 injectors and 28 producers.
The CO2 flood (at Little Creek plus Lazy Creek) is expected to recover 22 million
barrels of incremental oil (17% OOIP) in addition to 37% from primary/secondary
recovery operations.
Oil production at the end of 2004 was about 2,990 barrels per day, up from 1,350
barrels per day in 1999.
West Mallalieu Field Unit (WMU). The West Mallalieu Field (Lower Tuscaloosa
Sand), located in Lincoln Co., MS, has produced 35 million barrels (or 26% of the OOIP)

6-4 February 2006
with primary recovery, natural waterflood and a limited CO2 project. (The existence of a
strong natural water drive substituted for the waterflood.) New well drilling, in
preparation for the CO2 flood, showed that the reservoir was at residual oil saturation.
The field has experienced three phases of CO2-EOR:
1) Initial CO2-EOR Project. A CO2-EOR pilot was initiated in the WMU by Shell Oil
in 1986. The project involved four inverted five-spot patterns surrounded by
water injection barrier wells. By the end of 1988, because only three of the
producers showed oil response, the water injection wells were converted to
production wells. Oil production, due to CO2 injection, peaked at 1,200 B/D in
mid-1989 and then declined rapidly to about 200 B/D in mid-1991. As of the end
of 1997 when the field was shut-in, the WMU had produced 2.1 MMBbls due to
CO2-EOR.
2) Cyclic CO2 Pilot. In August 2000, in an effort to revitalize the field, J.P. Oil
Company initiated a USDOE sponsored cyclic CO2 pilot involving injection of 63
MMcf of CO2 into one producing well, WMU 17-2B. While all of the injected CO2
was produced back in the next three months, only negligible volumes of liquid
were produced.
3) Expanded CO2-EOR Project. Following the purchase of the WMU by Denbury
Resources, in mid-2001, Denbury expanded the initial CO2-EOR project by
adding four patterns in 2001, four patterns in 2002, three patterns in 2003 and
two patterns in 2004. (One additional pattern was started at East Mallalieu in
2004.)
Initial oil production to CO2 injection occurred in 2002, with an average
of 718 B/D in the fourth quarter of 2002, reaching 2,712 B/D in the
fourth quarter of 2004.
At the end of 2004, Denbury had booked 14.9 MMBbls of proved
reserves at E and W Mallalieu fields.

6-5 February 2006
The operator anticipated an EOR oil recovery efficiency in excess of
17% OOIP.
Other Current CO2-EOR Projects. Two recently started CO2-EOR projects are
underway in Western Mississippi at McComb and Brookhaven fields. The McComb
field produced 540 B/D in the fourth quarter of 2004 and has 11 million barrels of proved
reserves, with upward revisions expected in future years. Oil production response from
the Brookhaven field is expected in early 2006. The field contains 19 million barrels of
proved reserves. Smaller CO2-EOR projects have been conducted in the past at
Tinsley, Olive and Heidelberg oil fields.
Future CO2-EOR Potential. Mississippi contains 17 large light oil reservoirs
that are candidates for miscible CO2-EOR. In addition, the state has three heavy oil
fields, including West Heidelberg, (Eutaw) and West Eucutta, (Eutaw) that could benefit
from immiscible CO2-EOR.
Under “Traditional Practices” (involving a small volume of high cost CO2 injection
and high risk financial conditions), miscible CO2 flooding would not be economically
attractive in Mississippi. Applying “State-of-the-art Technology” (involving higher
volume CO2 injection, immiscible EOR, and lower risk), the number of economically
feasible oil reservoirs in Mississippi increases to 6, providing 79 million barrels of
additional oil recovery, Table 22.

6-6 February 2006
Table 22. Economic Oil Recovery Potential Under Two Technologic Conditions, Mississippi
Original Oil In-Place
Technical Potential
Economic Potential*
CO2-EOR Technology
No. of Reservoirs
Studied (MMBbls) (MMBbls) (No. of
Reservoirs) (MMBbls)
“Traditional Practices” 17 1,717 152 0 0
“State-of-the-art” Technology 20 1,879 351 6 79
* Oil price of $30 per barrel; CO2 costs of $1.50/Mcf.
Combining “State-of-the-art” technology with risk mitigation incentives and/or
higher oil prices plus lower cost CO2 supplies, would enable CO2-EOR Mississippi to
recover an additional 227 million barrels of CO2-EOR oil (from 14 major oil reservoirs),
Table 23. A portion of this CO2-EOR potential is already being developed in
Mississippi, as discussed above.
Table 23. Economic Oil Recovery Potential with More Favorable Financial Conditions, Mississippi
Economic Potential More Favorable Financial Conditions
Technical Potential (MMBbls) (No. of Reservoirs) (MMBbls)
Plus: Risk Mitigation Incentives* 1,879 9 163
Plus: Low Cost CO2 Supplies** 1,879 13 227 * Oil price of $40 per barrel, adjusted for gravity and location differentials; CO2 supply costs, $2/Mcfs ** CO2 supply costs, $0.80/Mcf
6.3 ALABAMA. Alabama is the 16th largest oil producing state, providing 5
MMBbls (13 MBbls/day) of oil in 2004, from 824 producing wells. Oil production in the
state of Alabama began in 1944, and cumulative oil recovery has reached 0.4 billion
barrels with 52 MMBbls of crude oil reserves. Oil production in Alabama has remained
relatively stable in recent years, Table 24.

6-7 February 2006
Table 24. Recent History of Alabama Onshore Oil Production
Annual Oil Production
(MMBbls/year) (MBbls/day)
1999 6 18
2000 6 16
2001 5 15
2002 5 14
2003 6 16
2004 5 13
Alabama Fields. Alabama contains several large oil fields that may be amenable
to miscible CO2-EOR, Figure 13. These include:
• Citronelle (Rodessa)
• Womack Hill (Smackover)
In addition, Alabama contains the deep Little Escambia Creek (Smackover) oil
field (part of the greater Jay oil field) that, while technically amenable to CO2-EOR, is
currently being produced with N2-EOR (see discussion under Florida).

6-8 February 2006
Figure 13. Large Alabama Oil Fields
#
#
Citronelle, Rodessa
Womack Hill, Smackover
PensacolaMobile
AL
FL
MS
10 0 10 20 30 40 Miles
Oil FieldsCounty LineState LineCity
Large Alabama Oil Fields
Little Escambia Creek, Smackover
JAF02449.PPT
#
#
Citronelle, Rodessa
Womack Hill, Smackover
PensacolaMobile
AL
FL
MS
10 0 10 20 30 40 Miles
Oil FieldsCounty LineState LineCity
Large Alabama Oil FieldsOil FieldsCounty LineState LineCity
Oil FieldsCounty LineState LineCity
Large Alabama Oil Fields
Little Escambia Creek, Smackover
JAF02449.PPT
The cumulative oil production, proved reserves and remaining oil in-place (ROIP)
in these two large oil reservoirs are provided in Table 25.
Table 25. Status of Large Alabama Oil Fields/Reservoirs (as of 2004)
Original Oil In-Place
Cumulative Production
Proved Primary/Secondary
Reserves Remaining Oil In-Place Large
Fields/Reservoirs (MMBbls) (MMBbls) (MMBbls) (MMBbls)
1 Citronelle (Rodessa) 537 168 7 362
2 Womack Hill (Smackover) 94 31 2 61

6-9 February 2006
These two large oil reservoirs, with 60 to 360 million barrels of ROIP, are
technically amenable for miscible CO2-EOR. Table 26 provides the reservoir and oil
properties for these reservoirs and their current oil recovery activities.
Table 26. Reservoir Properties and Improved Oil Recovery Activity, Large Alabama Oil Fields/Reservoirs
Large Fields/Reservoirs Depth
(ft)
Oil Gravity (ºAPI)
Active Waterflood or Gas Injection
1 Citronelle (Rodessa) 11,085 43 Active waterflood
2 Womack Hill (Smackover) 11,432 37 Active waterflood
Future CO2-EOR Potential. Alabama contains 5 oil reservoirs that are
candidates for miscible or immiscible CO2-EOR technology. The potential for
economically developing these oil reservoirs is examined first under Base Case
financial criteria that combine an oil price of $30 per barrel, CO2 supply costs
($1.50/Mcf), and a high risk rate of return (ROR) hurdle (25% before tax).
Under “Traditional Practices” (and Base Case financial conditions, defined
above), CO2-EOR would not be economic in Alabama, Table 27. In addition, applying
“state-of-the-art” technology (including higher volume CO2 injection) and the low risk
financial condition, CO2-EOR in Alabama is still not economically favorable.
Table 27. Economic Oil Recovery Potential Under Two Technologic Conditions, Alabama.
Original
Oil In-Place Technical Potential
Economic Potential*
CO2-EOR Technology No. of
Reservoirs (MMBbls) (MMBbls) (No. of
Reservoirs) (MMBbls)
“Traditional Practices” 4 752 76 0 0
“State-of-the-art” Technology 5 807 172 0 0
* Oil price of $30 per barrel.

6-10 February 2006
Combining “State-of-the-art” technologies with risk mitigation incentives and/or
higher oil prices plus lower cost CO2 supplies would enable CO2-EOR Alabama to
recover an additional 111 million barrels of CO2-EOR oil (from 1 major oil reservoir),
Table 28. (The EOR project at Little Escambia Creek is included in the estimate of
technical potential but not in the economic potential numbers.)
Table 28. Economic Oil Recovery Potential with More Favorable Financial Conditions, Alabama
Economic Potential More Favorable Conditions
Technical Potential (MMBbls) (No. of Reservoirs) (MMBbls)
Plus: Risk Mitigation* 172 1 111
Plus: Low Cost CO2** 172 1 111 *Oil price of $40 per barrel, adjusted for gravity differential; CO2 supply costs, $2/Mcf ** CO2 supply costs, to $0.80/Mcf
6.3 FLORIDA. Florida is the 20th largest oil producing state, providing 3 MMBbls
(8 MBbls/day) of oil in 2004, from 70 producing wells. Oil production in the state of
Florida began in 1943, and cumulative oil recovery has reached almost 0.6 billion
barrels. Florida has 68 MMBbls of crude oil reserves, ranking 17th in the U.S. Oil
production in Florida has declined in recent years, Table 29.
Table 29. Recent History of Florida Onshore Oil Production
Annual Oil Production
(MMBbls/year) (MBbls/day)
1999 5 13
2000 5 13
2001 4 12
2002 4 10
2003 3 9
2004 3 8

6-11 February 2006
Florida Fields. Florida contains two large oil fields that may be amenable to
miscible CO2-EOR, Figure 14. These include:
• Blackjack Creek (Smackover)
• West Felda (Roberts)
In addition, Florida contains the deep Jay (Smackover) oil field that, while
technically amenable to CO2-EOR, is currently being produced with N2-EOR.
Figure 14. Large Florida Oil Fields
#
##Jay, Smackover
West Felda, Roberts
Tampa Orlando
JacksonvillePensacola
Fort Myers
Blackjack Creek, Smackover
40 0 40 80 120 160 Miles
Oil FieldsCounty LineState LineCity
Large Florida Oil FieldsOil FieldsCounty LineState LineCity
Oil FieldsCounty LineState LineCity
Large Florida Oil Fields
The cumulative oil production, proved reserves and remaining oil in-place (ROIP)
in these three major oil reservoirs are provided in Table 30.

6-12 February 2006
Table 30. Status of Large Florida Oil Fields/Reservoirs (as of 2004)
Original Oil In-Place
Cumulative Production
Proved Primary/
Secondary Reserves
Remaining Oil In-Place
Large Fields/Reservoirs (MMBbls) (MMBbls) (MMBbls) (MMBbls)
1 Blackjack Creek (Smackover) 119 57 1 61
2 West Felda (Roberts) 209 46 6 157
3 Jay (Smackover) 730 378 0 352* * 70 MMBbls of this is estimated to be recovered by N2-EOR from the Florida portion of this field.
These three large oil fields, with 60 to over 300 million barrels of ROIP, are
technically amenable for miscible CO2-EOR. Table 31 provides the reservoir and oil
properties for these reservoirs and their current secondary oil recovery activities.
Table 31. Reservoir Properties and Improved Oil Recovery Activity, Large Florida Oil Fields/Reservoirs
Large Fields/Reservoirs Depth
(ft)
Oil Gravity (ºAPI)
Active Waterflood or Gas Injection
1 Blackjack Creek (Smackover) 15,700 48 Active Waterflood
2 West Felda (Roberts) 11,400 26 None
3 Jay (Smackover) 15,400 51 Active N2-EOR
Past CO2-EOR Projects. The most notable EOR project in Alabama is at the
Jay/Little Escambia Creek Field (Smackover Formation), which straddles the Alabama-
Florida border. This EOR project involves nitrogen enhanced oil recovery (N2-EOR).
Jay/Little Escambia Field. ExxonMobil initiated a N2 miscible WAG flood in 1981
following seven years of waterflooding. The target formation (Smackover) is a deep
(15,000+ ft), geologically complex carbonate reservoir. Favorable geologic
characteristics (natural vertical flow restrictions) and the use state-of-the-art

6-13 February 2006
technologies provide expectations of 10% OOIP oil recovery due to N2 injection and
overall 60% OOIP recovery from the field.
Evaluation of applying CO2-EOR to the Jay/Little Escambia oil field indicates
potential recovery of about 20% OOIP about twice the volume currently expected from
N2-EOR. However, the high cost of adding deep CO2 injection and oil production wells
indicates that, at the oil prices and CO2 costs examined by the study, the economics of
CO2-EOR in this oil field may be marginal.
Future CO2-EOR Potential. Florida contains 5 light oil reservoirs that are
candidates for miscible CO2-EOR technology. The potential for economically
developing these oil reservoirs is examined first under Base Case financial criteria that
combine an oil price of $30 per barrel, CO2 supply costs ($1.50/Mcf), and a high risk
rate of return (ROR) hurdle (25% before tax).
Under “Traditional Practices” or “State-of-the Art” technology (and Base Case
financial conditions, defined above), CO2-EOR would not be economic in Alabama,
Table 32.
Table 32. Economic Oil Recovery Potential Under Two Technologic Conditions, Florida
Original Oil In-Place
Technical Potential
Economic Potential*
CO2-EOR Technology
No. of Reservoirs
Studied (MMBbls) (MMBbls) (No. of
Reservoirs) (MMBbls)
“Traditional Practices” 5 1,265 141 0 0
“State-of-the-art” Technology* 5 1,265 329 0 0
* Oil price of $30 per barrel.
Combining “State-of-the-art” technologies with risk mitigation incentives and/or
higher oil prices plus lower cost CO2 supplies would enable Florida to recover an
additional 29 million barrels of CO2-EOR oil (from 1 major oil reservoir), Table 33. (The
EOR project at Jay is included in the estimate of technical potential, but not in the
economic potential numbers.)

6-14 February 2006
Table 33. Economic Oil Recovery Potential with More Favorable Financial Conditions, Florida
Economic Potential More Favorable Conditions
Technical Potential (MMBbls) (No. of Reservoirs) (MMBbls)
Plus: Risk Mitigation* 329 1 29
Plus: Low Cost CO2** 329 1 29 * Oil price of $40 per barrel, adjusted for gravity differential; CO2 supply costs, $2/Mcf ** CO2 supply costs, $0.80/Mcf

Appendix A
Using CO2-PROPHET for Estimating Oil Recovery

A-1 February 2006
Model Development
The study utilized the CO2-PROPHET model to calculate the incremental oil
produced by CO2-EOR from the large Gulf Coast Basin oil reservoirs. CO2-PROPHET
was developed by the Texaco Exploration and Production Technology Department
(EPTD) as part of the DOE Class I cost share program. The specific project was “Post
Waterflood CO2 Flood in a Light Oil, Fluvial Dominated Deltaic Reservoir” (DOE
Contract No. DE-FC22-93BC14960). CO2-PROPHET was developed as an alternative
to the DOE’s CO2 miscible flood predictive model, CO2PM.
Input Data Requirements
The input reservoir data for operating CO2-PROPHET are from the Major Oil
Reservoirs Data Base. Default values exist for input fields lacking data. Key reservoir
properties that directly influence oil recovery are:
Residual oil saturation, Dykstra-Parsons coefficient, Oil and water viscosity, Reservoir pressure and temperature, and Minimum miscibility pressure.
A set of three relative permeability curves for water, CO2 and oil are provided (or can be
modified) to ensure proper operation of the model.
Calibrating CO2-PROPHET
The CO2-PROPHET model was calibrated by Advanced Resources with an
industry standard reservoir simulator, GEM. The primary reason for the calibration was
to determine the impact on oil recovery of alternative permeability distributions within a
multi-layer reservoir. A second reason was to better understand how the absence of a
gravity override function in CO2-PROPHET might influence the calculation of oil
recovery. CO2-PROPHET assumes a fining upward permeability structure.

A-2 February 2006
The California San Joaquin Basin‘s Elk Hills (Stevens) reservoir data set was used for
the calibration. The model was run in the miscible CO2-EOR model using one
hydrocarbon pore volume of CO2 injection.
The initial comparison of CO2-PROPHET with GEM was with fining upward and
coarsening upward (opposite of fining upward) permeability cases in GEM. All other
reservoir, fluid and operational specifications were kept the same. As Figure A-1
depicts, the CO2-PROPHET output is bounded by the two GEM reservoir simulation
cases of alternative reservoir permeability structures in an oil reservoir.
A second comparison of CO2-PROPHET and GEM was for randomized permeability
(within the reservoir modeled with multiple layers). The two GEM cases are High
Random, where the highest permeability value is at the top of the reservoir, and Low
Random, where the lowest permeability is at the top of the reservoir. The permeability
values for the other reservoir layers are randomly distributed among the remaining
layers. As Figure A-2 shows, the CO2-PROPHET results are within the envelope of the
two GEM reservoir simulation cases of random reservoir permeability structures in an oil
reservoir.
Based on the calibration, the CO2-PROPHET model seems to internally compensate for
the lack of a gravity override feature and appears to provide an average calculation of
oil recovery, neither overly pessimistic nor overly optimistic. As such, CO2-PROPHET
seems well suited for what it was designed — providing project scoping and preliminary
results to be verified with more advanced evaluation and simulation models.
Comparison of CO2-PROPHET and CO2PM
According to the CO2-PROPHET developers, the model performs two main
operations that provide a more robust calculation of oil recovery than available from
CO2PM:

A-3 February 2006
0
100,000
200,000
300,000
400,000
500,000
600,000
700,000
800,000
900,000
1,000,000
12/5/2003 12/4/2007 12/3/2011 12/2/2015 12/1/2019 11/30/2023 11/29/2027
Time
Cum
Oil
(BB
LS)
Prophet
Fining Upward
Coarsening Upward
Figure A-1. CO2-PROPHET and GEM: Comparison to Upward Fining and Coarsening Permeability Cases of GEM
0
100,000
200,000
300,000
400,000
500,000
600,000
700,000
800,000
900,000
1,000,000
12/5/2003 12/4/2007 12/3/2011 12/2/2015 12/1/2019 11/30/2023 11/29/2027
Time
Cum
Oil
(BB
LS)
Prophet
High Random
Low Random
Figure A-2. CO2-PROPHET and GEM: Comparison to Random Permeability Cases of GEM
JAF0
2318
.PPT

A-4 February 2006
CO2-PROPHET generates streamlines for fluid flow between injection and production wells, and
The model then performs oil displacement and recovery calculations along the streamlines. (A finite difference routine is used for the oil displacement calculations.)
Other key features of CO2-PROPHET and its comparison with the technical capability of
CO2PM are also set forth below:
Areal sweep efficiency in CO2-PROPHET is handled by incorporating streamlines that are a function of well spacing, mobility ratio and reservoir heterogeneity, thus eliminating the need for using empirical correlations, as incorporated into CO2PM.
Mixing parameters, as defined by Todd and Longstaff, are used in CO2-PROPHET for simulation of the miscible CO2 process, particularly CO2/oil mixing and the viscous fingering of CO2.
A series of reservoir patterns, including 5 spot, line drive, and inverted 9 spot, among others, are available in CO2-PROPHET, expanding on the 5 spot only reservoir pattern option available in CO2PM.
CO2-PROPHET can simulate a variety of recovery processes, including continuous miscible CO2, WAG miscible CO2 and immiscible CO2, as well as waterflooding. CO2PM is limited to miscible CO2.

Appendix B
Louisiana CO2-EOR Cost Model

B-1 February 2006
Cost Model for CO2-Based Enhanced Oil Recovery (CO2-EOR) This appendix provides documentation for the cost module of the desktop CO2-EOR policy and analytical model (COTWO) developed by Advanced Resources for DOE/FE-HQ. The sections of this cost documentation report are organized according to the normal sequence of estimating the capital and operating expenditures for a CO2-EOR project: 1. Well Drilling and Completion Costs. The costs for well drilling and completion (D&C) are based on the 2001 JAS cost study recently published by API for Louisiana. The well D&C cost equation has a fixed cost constant for site preparation and other fixed cost items and a variable cost equation that increases exponentially with depth. The total equation is: Well D&C Costs = a0Da1 Where: a0 is 0.1933 (South) or 2.7405 (North), depending on location a1 is 1.8234 (South) or 1.3665 (North), depending on location D is well depth Figure B-1a and Figure B-1b provides the details for the cost equation and illustrates the “goodness of fit” for the well D&C cost equation for Louisiana.
Figure B-1a. – Oil Well D&C Costs for South Louisiana
y = 0.1933x1.8234
R2 = 0.9724
0
1,000,000
2,000,000
3,000,000
4,000,000
5,000,000
6,000,000
7,000,000
8,000,000
0 2,000 4,000 6,000 8,000 10,000 12,000 14,000 16,000
De pth, ft
Tota
l Dril
ling
Cos
t, U
S$
2003 API CostsPower (2003 API Costs)

B-2 February 2006
Figure B-1b. Oil Well D&C Costs for North Louisiana
y = 2.7405x1.3665
R2 = 0.9434
0
100,000
200,000
300,000
400,000
500,000
600,000
700,000
800,000
900,000
1,000,000
0 1,000 2,000 3,000 4,000 5,000 6,000 7,000 8,000 9,000 10,000
Depth, ft
Tota
l Dri
lling
Cos
t, US
$
2003 API CostsPower (2003 API Costs)
In order to bring the 2003 API drilling costs (the most recent available) into 2004 numbers where increased oil prices are expected to result in significantly increased drilling costs, a relationship was established between average drilling costs and average annual oil prices. Drillings costs from the ten year period of 1994-2003 (API data) were plotted versus the three year weighted average annual oil prices for those years (EIA Annual Energy Review, 2004) and the following relationship was established: Drilling costs (per foot) = $5.04(annual oil price) – $3.2116. Applying the 2004 average oil price of $36.77 gives a drilling cost of $182 per foot and an increase of 25.6% over the 2003 cost of $145 per foot. Therefore, drilling and completion costs were increased by 25% over the Louisiana D&C cost calculations to reflect this increase in 2004 drilling costs. 2. Lease Equipment Costs for New Producing Wells. The costs for equipping a new oil production well are based on data reported by the EIA in their 2004 EIA “Cost and Indices for Domestic Oil and Gas Field Equipment and Production Operations” report. This survey provides estimated lease equipment costs for 10 wells producing with artificial lift, from depths ranging from 2,000 to 12,000 feet, into a central tank battery. The equation contains a fixed cost constant for common cost items, such as free water knock-out, water disposal and electrification, and a variable cost component to capture depth-related costs such as for pumping equipment. The total equation is:
Production Well Equipping Costs = c0 + c1D

B-3 February 2006
Where: co = $81,403 (fixed) c1 = $7.033 per foot D is well depth
Figure B-2 illustrates the application of the lease equipping cost equation for a new oil production well as a function of depth.
Figure B-2. Lease Equipping Cost for a New Oil Production Well in Louisiana vs. Depth
y = 7.033x + 81403R2 = 0.9428
0
40,000
80,000
120,000
160,000
200,000
0 2,000 4,000 6,000 8,000 10,000 12,000 14,000
Depth, ft
Tota
l Cos
ts, U
S$
3. Lease Equipment Costs for New Injection Wells. The costs for equipping a new injection well in Louisiana include gathering lines, a header, electrical service as well as a water pumping system. The costs are estimated from the EIA Cost and Indices Report. Equipment costs include a fixed cost component and a depth-related cost component, which varies based on surface pressure requirements. The equation for Louisiana is:
Injection Well Equipping Costs = c0 + c1D Where: co = $17,214 (fixed)
c1 = $16.34 per foot D is well depth

B-4 February 2006
Figure B-3 illustrates the application of the lease equipping cost equation for a new injection well as a function of depth for West Texas. The West Texas cost data for lease equipment provides the foundation for the Louisiana cost equation.
Figure B-3. Lease Equipping Costs for a New Injection Well in West Texas vs. Depth
y = 14.63x + 9277.3R2 = 0.9674
0
20,000
40,000
60,000
80,000
100,000
120,000
140,000
0 1,000 2,000 3,000 4,000 5,000 6,000 7,000 8,000 9,000
Depth, ft
Cos
ts, U
S$
CostsLinear (Costs)
Basin co c1 co c1
US$ US$/ftW TX 1.00 1.00 9,277 14.63CA 0.80 2.10 7,463 30.73RM 1.51 0.83 14,051 12.11S TX 1.68 1.19 15,555 17.40LA 1.86 1.12 17,214 16.34OK 1.17 1.12 10,820 16.33
Ratio to W. TX
y = 14.63x + 9277.3R2 = 0.9674
0
20,000
40,000
60,000
80,000
100,000
120,000
140,000
0 1,000 2,000 3,000 4,000 5,000 6,000 7,000 8,000 9,000
Depth, ft
Cos
ts, U
S$
CostsLinear (Costs)
Basin co c1 co c1
US$ US$/ftW TX 1.00 1.00 9,277 14.63CA 0.80 2.10 7,463 30.73RM 1.51 0.83 14,051 12.11S TX 1.68 1.19 15,555 17.40LA 1.86 1.12 17,214 16.34OK 1.17 1.12 10,820 16.33
Ratio to W. TXBasin co c1 co c1
US$ US$/ftW TX 1.00 1.00 9,277 14.63CA 0.80 2.10 7,463 30.73RM 1.51 0.83 14,051 12.11S TX 1.68 1.19 15,555 17.40LA 1.86 1.12 17,214 16.34OK 1.17 1.12 10,820 16.33
Ratio to W. TX
4. Converting Existing Production Wells into Injection Wells. The conversion of existing oil production wells into CO2 and water injection wells requires replacing the tubing string and adding distribution lines and headers. The costs assume that all surface equipment necessary for water injection are already in place on the lease. The existing well conversion costs include a fixed cost component and a depth-related cost component, which varies based on the required surface pressure and tubing length. The equation for Louisiana is:
Well Conversion Costs = c0 + c1D Where: co = $16,607 (fixed)
c1 = $6.973 per foot D is well depth
Figure B-4 illustrates the average cost of converting an existing producer into an injection well for West Texas. The West Texas cost data for converting wells provide the foundation for the Louisiana cost equation.

B-5 February 2006
Figure B-4. Cost of Converting Existing Production Wells into Injection Wells in West Texas vs. Depth
y = 6.2412x + 8950R2 = 0.9896
0
10,000
20,000
30,000
40,000
50,000
60,000
70,000
0 1000 2000 3000 4000 5000 6000 7000 8000 9000
Depth, ft
Cos
t, U
S$
Basin co c1 co c1
US$ US$/ftW TX 1.00 1.00 8,950 6.24CA 0.80 2.10 7,200 13.11RM 1.51 0.83 13,555 5.16S TX 1.68 1.19 15,006 7.42LA 1.86 1.12 16,607 6.97OK 1.17 1.12 10,438 6.97
Ratio to W. TX
y = 6.2412x + 8950R2 = 0.9896
0
10,000
20,000
30,000
40,000
50,000
60,000
70,000
0 1000 2000 3000 4000 5000 6000 7000 8000 9000
Depth, ft
Cos
t, U
S$
Basin co c1 co c1
US$ US$/ftW TX 1.00 1.00 8,950 6.24CA 0.80 2.10 7,200 13.11RM 1.51 0.83 13,555 5.16S TX 1.68 1.19 15,006 7.42LA 1.86 1.12 16,607 6.97OK 1.17 1.12 10,438 6.97
Ratio to W. TXBasin co c1 co c1
US$ US$/ftW TX 1.00 1.00 8,950 6.24CA 0.80 2.10 7,200 13.11RM 1.51 0.83 13,555 5.16S TX 1.68 1.19 15,006 7.42LA 1.86 1.12 16,607 6.97OK 1.17 1.12 10,438 6.97
Ratio to W. TX
5. Costs of Reworking an Existing Waterflood Production or Injection Well for CO2-EOR (First Rework). The reworking of existing oil production or CO2-EOR injection wells requires pulling and replacing the tubing string and pumping equipment. The well reworking costs are depth-dependent. The equation for Louisiana is:
Well Rework Costs = c1D Where: c1 = $19.42 per foot)
D is well depth Figure B-5 illustrates the average cost of well conversion as a function of depth for West Texas. The West Texas cost data for reworking wells provides the foundation for the Louisiana cost equation.
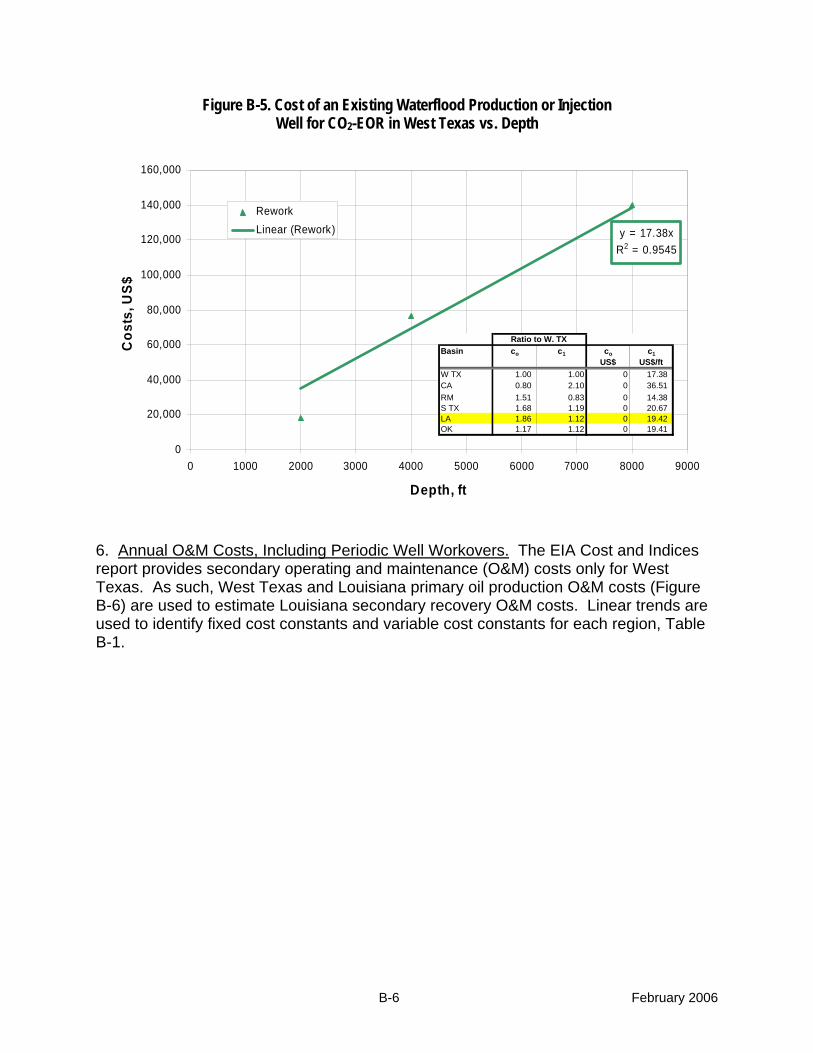
B-6 February 2006
Figure B-5. Cost of an Existing Waterflood Production or Injection Well for CO2-EOR in West Texas vs. Depth
y = 17.38xR2 = 0.9545
0
20,000
40,000
60,000
80,000
100,000
120,000
140,000
160,000
0 1000 2000 3000 4000 5000 6000 7000 8000 9000
Depth, ft
Cos
ts, U
S$
ReworkLinear (Rework)
Basin co c1 co c1US$ US$/ft
W TX 1.00 1.00 0 17.38CA 0.80 2.10 0 36.51RM 1.51 0.83 0 14.38S TX 1.68 1.19 0 20.67LA 1.86 1.12 0 19.42OK 1.17 1.12 0 19.41
Ratio to W. TX
y = 17.38xR2 = 0.9545
0
20,000
40,000
60,000
80,000
100,000
120,000
140,000
160,000
0 1000 2000 3000 4000 5000 6000 7000 8000 9000
Depth, ft
Cos
ts, U
S$
ReworkLinear (Rework)
Basin co c1 co c1US$ US$/ft
W TX 1.00 1.00 0 17.38CA 0.80 2.10 0 36.51RM 1.51 0.83 0 14.38S TX 1.68 1.19 0 20.67LA 1.86 1.12 0 19.42OK 1.17 1.12 0 19.41
Ratio to W. TXBasin co c1 co c1
US$ US$/ftW TX 1.00 1.00 0 17.38CA 0.80 2.10 0 36.51RM 1.51 0.83 0 14.38S TX 1.68 1.19 0 20.67LA 1.86 1.12 0 19.42OK 1.17 1.12 0 19.41
Ratio to W. TX
6. Annual O&M Costs, Including Periodic Well Workovers. The EIA Cost and Indices report provides secondary operating and maintenance (O&M) costs only for West Texas. As such, West Texas and Louisiana primary oil production O&M costs (Figure B-6) are used to estimate Louisiana secondary recovery O&M costs. Linear trends are used to identify fixed cost constants and variable cost constants for each region, Table B-1.

B-7 February 2006
Figure B-6. Annual Lease O&M Costs for Primary Oil Production by Area
y = 5.2672x + 7110.7R2 = 0.9945
y = 2.8014x + 16401R2 = 0.9611
y = 2.5075x + 8838.5R2 = 0.96
y = 2.7997x + 10309R2 = 0.9789
y = 2.9819x + 14820R2 = 0.9637
y = 2.0751x + 13387R2 = 0.9783
0
10,000
20,000
30,000
40,000
50,000
60,000
70,000
80,000
0 2,000 4,000 6,000 8,000 10,000 12,000 14,000
Depth, ft
Tota
l Cos
ts, U
S$ p
er Y
ear
California Oklahom aSouth Louis iana South TexasWes t Texas Rocky MountainsLinear (California) Linear (South Louis iana)Linear (Wes t Texas ) Linear (Oklahom a)Linear (South Texas ) Linear (Rocky Mountains )
Table B-1. Regional Lease O&M Costs and Their Relationship to West Texas
Basin c0 c1 c0 c1US$ US$
West Texas 8,839 2.51 1.00 1.00California 7,111 5.27 0.80 2.10Rocky Mountain 13,387 2.08 1.51 0.83South Texas 14,820 2.98 1.68 1.19Louisiana 16,401 2.80 1.86 1.12Oklahoma 10,309 2.80 1.17 1.12
Ratio to W. TXBasin c0 c1 c0 c1
US$ US$West Texas 8,839 2.51 1.00 1.00California 7,111 5.27 0.80 2.10Rocky Mountain 13,387 2.08 1.51 0.83South Texas 14,820 2.98 1.68 1.19Louisiana 16,401 2.80 1.86 1.12Oklahoma 10,309 2.80 1.17 1.12
Ratio to W. TX
To account for the O&M cost differences between waterflooding and CO2-EOR, two adjustments are made to the EIA’s reported O&M costs for secondary recovery. Workover costs, reported as surface and subsurface maintenance, are doubled to reflect the need for more frequent remedial well work in CO2-EOR projects. Liquid lifting are subtracted from annual waterflood O&M costs to allow for the more rigorous accounting of liquid lifting volumes and costs for CO2-EOR. (Liquid lifting costs for CO2-EOR are discussed in a later section of this appendix.) Figure B-7 shows the depth-relationship for CO2-EOR O&M costs in West Texas. These costs were adjusted to develop O&M for Louisiana, shown in the inset of Figure B-7. The equation for Louisiana is:

B-8 February 2006
Well O&M Costs = b0 + b1D Where: b0 = $38,447 (fixed)
b1 = $8.72 per foot D is well depth
Figure B-7. Annual CO2-EOR O&M Costs for West Texas
y = 7.8054x + 1557R2 = 0.9935
0
10,000
20,000
30,000
40,000
50,000
60,000
70,000
0 1,000 2,000 3,000 4,000 5,000 6,000 7,000 8,000 9,000
Depth, ft
Cos
ts p
er Y
ear,
US$
CO2-EOR O&M
Linear (CO2-EOR O&M)
Area b0 b1 b0 b1US$ US$
W TX 1.00 1.00 20,720 7.81 CA 0.80 2.10 16,669 16.40 RM 1.51 0.83 31,381 6.46 S TX 1.68 1.19 34,740 9.28 LA 1.86 1.12 38,447 8.72 OK 1.17 1.12 24,166 8.71
Ratio to W. TX
7. CO2 Recycle Plant Investment Cost. Operation of CO2-EOR requires a recycling plant to capture and reinject the produced CO2. The size of the recycle plant is based on peak CO2 production and recycling requirements. The cost of the recycling plant is set at $700,000 per MMcf/d of CO2 capacity. As such, small CO2-EOR project in the Tokio formation of the Haynesville field, with 16 MMcf/d of CO2 reinjection, will require a recycling plant costing $11 million. A large project in the Delhi field, with 177 MMcf/d of peak CO2 reinjection and 112 injectors requires a recycling plant costing $124 million. The model has three options for installing a CO2 recycling plant. The default setting costs the entire plant one year prior to CO2 breakthrough. The second option places the full CO2 recycle plant cost at the beginning of the project (Year 0). The third option installs the CO2 recycle plant in stages. In this case, half the plant is built (and half the cost is incurred) in the year of CO2 breakthrough. The second half of the plant is built when maximum recycle capacity requirements are reached.
8. Other COTWO Model Costs.

B-9 February 2006
a. CO2 Recycle O&M Costs. The O&M costs of CO2 recycling are indexed to energy costs and set at 1% of the oil price ($0.25 per Mcf @ $25 Bbl oil).
b. Lifting Costs. Liquid (oil and water) lifting costs are calculated on total liquid
production and costed at $0.25 per barrel. This cost includes liquid lifting, transportation and re-injection.
c. CO2 Distribution Costs. The CO2 distribution system is similar to the gathering
systems used for natural gas. A distribution “hub” is constructed with smaller pipelines delivering purchased CO2 to the project site. The distribution pipeline cost is dependent on the injection requirements for the project. The fixed component is $150,000. The variable cost component accounts for increasing piping diameters associated with increasing CO2 injection requirements. These range from $80,000 per mile for 4” pipe (CO2 rate less than 15MMcf/d), $120,000 per mile for 6” pipe (CO2 rate of 15 to 35 MMcf/d), $160,000 per mile for 8” pipe (CO2 rate of 35 to 60 MMcf/d), and $200,000 per mile for pipe greater than 8” diameter (CO2 rate greater than 60 MMcf/d). Aside from the injection volume, costs also depend on the distance from the CO2 “hub” (transfer point) to the oil field. Currently, the distance is set at 10 miles.
The CO2 distribution cost equation for Louisiana is:
Pipeline Construction Costs = $150,000 + CD*Distance Where: CD is the cost per mile of the necessary pipe diameter (from the CO2
injection rate) Distance = 10.0 miles
d. G&A Costs. General and administrative (G&A) costs of 20% are added to well
O&M and lifting costs. e. Royalties. Royalty payments are assumed to be 12.5%.
f. Production Taxes. Louisiana has enacted risk sharing actions for enhanced oil recovery. The Louisiana Revenue Statute Ann. 47:633.4 is effective as of July, 1984 with no sunset. Its stated goal is:
“To provide an economic incentive to producers to invest in tertiary recovery projects to enhance Louisiana’s crude oil production, to the ultimate benefit of the state and the people.”
The provisions of the “Tertiary Recovery Statute” are that no severance tax shall be due on production from a qualified tertiary recovery project approved by the Secretary of the Department of Natural Resources until the project has reached payout. Payout is calculated using investment costs; expenses particular to the tertiary project, not to

B-10 February 2006
include charges attributed to primary and secondary options on that reservoir; and interest at commercial rates.
The regular state oil severance tax rate in Louisiana is 12.5% of the value of the produced oil. As such, eliminating the severance tax until payout for CO2-EOR projects would provide front-end risk sharing equal to $3.28 per barrel of incrementally produced oil (assuming a sales price of $30 per barrel of oil and a royalty rate of 12.5%).
To the extent that this reduction in state severance taxes stimulates new projects and incremental oil production that otherwise would not occur, the State of Louisiana gains substantial new tax revenues. In the model, Severance and ad valorum taxes are set at 1% and 12.5% (after payout), respectively, for a total production tax of 13.5% on the oil production stream. Production taxes are taken following royalty payments.
g. Crude Oil Price Differential. To account for market and oil quality (gravity)
differences on the realized oil price, the cost model incorporated the current basis differential for Louisiana (-$0.60 per barrel) and the current gravity differential (-$0.25 per ºAPI, from a basis of 40 ºAPI) into the average wellhead oil price realized by each oil reservoir. The equation for Louisiana is:
Wellhead Oil Price = Oil Price + (-$0.60) – [$0.25*(40 - ºAPI)] Where: Oil Price is the marker oil price (West Texas intermediate)
ºAPI is oil gravity If the oil gravity is less than 40 ºAPI, the wellhead oil price is reduced; if the oil gravity is greater than 40 ºAPI, the wellhead oil price is increased. In addition, some fields within Louisiana contain very light oil (>45 API). In order to keep the economics of these fields level with the rest of the fields, we imposed a ceiling of 45 API for all fields with lighter oil when applying the Crude Oil Price Differential.
Appendix C
Mississippi CO2-EOR Cost Model

C-1 February 2006
Cost Model for CO2-Based Enhanced Oil Recovery (CO2-EOR) This appendix provides documentation for the cost module of the desktop CO2-EOR policy and analytical model (COTWO) developed by Advanced Resources for DOE/FE-HQ. The sections of this cost documentation report are organized according to the normal sequence of estimating the capital and operating expenditures for a CO2-EOR project: 1. Well Drilling and Completion Costs. The costs for well drilling and completion (D&C) are based on the 2003 JAS cost study recently published by API for Mississippi. The well D&C cost equation has a fixed cost constant for site preparation and other fixed cost items and a variable cost equation that increases exponentially with depth. The total equation is: Well D&C Costs = a0Da1 Where: a0 is 0.00655 a1 is 2.104 D is well depth Figure C-1 provides the details for the cost equation and illustrates the “goodness of fit” for the well D&C cost equation for Mississippi.
Figure C-1. Oil Well D&C Costs for Mississippi
y = 0.00655x2.10378
R2 = 0.99095
0
500,000
1,000,000
1,500,000
2,000,000
2,500,000
0 2,000 4,000 6,000 8,000 10,000 12,000
Depth, ft
Tota
l Dril
ling
Cos
t, U
S$
2003 API Cos ts
Power (2003 API Cos ts )
In order to bring the 2003 API drilling costs (the most recent available) into 2004 numbers where increased oil prices are expected to result in significantly increased drilling costs, a relationship was established between average drilling costs and average
C-2 February 2006
annual oil prices. Drillings costs from the ten year period of 1994-2003 (API data) were plotted versus the three year weighted average annual oil prices for those years (EIA Annual Energy Review, 2004) and the following relationship was established: Drilling costs (per foot) = $5.04(annual oil price) – $3.2116. Applying the 2004 average oil price of $36.77 gives a drilling cost of $182 per foot and an increase of 25.6% over the 2003 cost of $145 per foot. Therefore, drilling and completion costs were increased by 25% over the Mississippi D&C cost calculations to reflect this increase in 2004 drilling costs.
2. Lease Equipment Costs for New Producing Wells. The costs for equipping a new oil production well are based on data reported by the EIA in their 2004 EIA “Cost and Indices for Domestic Oil and Gas Field Equipment and Production Operations” report for South Louisiana. This survey provides estimated lease equipment costs for 10 wells producing with artificial lift, from depths ranging from 2,000 to 12,000 feet, into a central tank battery. The equation contains a fixed cost constant for common cost items, such as free water knock-out, water disposal and electrification, and a variable cost component to capture depth-related costs such as for pumping equipment. The total equation is:
Production Well Equipping Costs = c0 + c1D Where: co = $81,403 (fixed) c1 = $7.033 per foot D is well depth
Figure C-2 illustrates the application of the lease equipping cost equation for a new oil production well as a function of depth.

C-3 February 2006
Figure C-2. Lease Equipping Cost for a New Oil Production Well in Mississippi vs. Depth
y = 7.033x + 81403R2 = 0.9428
0
40,000
80,000
120,000
160,000
200,000
0 2,000 4,000 6,000 8,000 10,000 12,000 14,000
Depth, ft
Tota
l Cos
ts, U
S$
3. Lease Equipment Costs for New Injection Wells. The costs for equipping a new injection well in Mississippi include gathering lines, a header, electrical service as well as a water pumping system. The costs are estimated from the EIA Cost and Indices Report. Equipment costs include a fixed cost component and a depth-related cost component, which varies based on surface pressure requirements. The equation for Mississippi is:
Injection Well Equipping Costs = c0 + c1D Where: co = $17,214 (fixed)
c1 = $16.34 per foot D is well depth
Figure C-3 illustrates the application of the lease equipping cost equation for a new injection well as a function of depth for West Texas. The West Texas cost data for lease equipment provides the foundation for the Mississippi cost equation.

C-4 February 2006
Figure C-3. Lease Equipping Costs for a New Injection Well in West Texas vs. Depth
y = 14.63x + 9277.3R2 = 0.9674
0
20,000
40,000
60,000
80,000
100,000
120,000
140,000
0 1,000 2,000 3,000 4,000 5,000 6,000 7,000 8,000 9,000
Depth, ft
Cos
ts, U
S$
CostsLinear (Costs)
Basin co c1 co c1
US$ US$/ftW TX 1.00 1.00 9,277 14.63CA 0.80 2.10 7,463 30.73RM 1.51 0.83 14,051 12.11S TX 1.68 1.19 15,555 17.40MS 1.86 1.12 17,214 16.34OK 1.17 1.12 10,820 16.33
Ratio to W. TX
y = 14.63x + 9277.3R2 = 0.9674
0
20,000
40,000
60,000
80,000
100,000
120,000
140,000
0 1,000 2,000 3,000 4,000 5,000 6,000 7,000 8,000 9,000
Depth, ft
Cos
ts, U
S$
CostsLinear (Costs)
Basin co c1 co c1
US$ US$/ftW TX 1.00 1.00 9,277 14.63CA 0.80 2.10 7,463 30.73RM 1.51 0.83 14,051 12.11S TX 1.68 1.19 15,555 17.40MS 1.86 1.12 17,214 16.34OK 1.17 1.12 10,820 16.33
Ratio to W. TXBasin co c1 co c1
US$ US$/ftW TX 1.00 1.00 9,277 14.63CA 0.80 2.10 7,463 30.73RM 1.51 0.83 14,051 12.11S TX 1.68 1.19 15,555 17.40MS 1.86 1.12 17,214 16.34OK 1.17 1.12 10,820 16.33
Ratio to W. TX
4. Converting Existing Production Wells into Injection Wells. The conversion of existing oil production wells into CO2 and water injection wells requires replacing the tubing string and adding distribution lines and headers. The costs assume that all surface equipment necessary for water injection are already in place on the lease. The existing well conversion costs include a fixed cost component and a depth-related cost component, which varies based on the required surface pressure and tubing length. The equation for Mississippi is:
Well Conversion Costs = c0 + c1D Where: co = $16,607 (fixed)
c1 = $6.973 per foot D is well depth
Figure C-4 illustrates the average cost of converting an existing producer into an injection well for West Texas. The West Texas cost data for converting wells provide the foundation for the Mississippi cost equation.

C-5 February 2006
Figure C-4. Cost of Converting Existing Production Wells into Injection Wells in West Texas vs. Depth
y = 6.2412x + 8950R2 = 0.9896
0
10,000
20,000
30,000
40,000
50,000
60,000
70,000
0 1000 2000 3000 4000 5000 6000 7000 8000 9000
Depth, ft
Cos
t, U
S$
Basin co c1 co c1
US$ US$/ftW TX 1.00 1.00 8,950 6.24CA 0.80 2.10 7,200 13.11RM 1.51 0.83 13,555 5.16S TX 1.68 1.19 15,006 7.42MS 1.86 1.12 16,607 6.97OK 1.17 1.12 10,438 6.97
Ratio to W. TX
y = 6.2412x + 8950R2 = 0.9896
0
10,000
20,000
30,000
40,000
50,000
60,000
70,000
0 1000 2000 3000 4000 5000 6000 7000 8000 9000
Depth, ft
Cos
t, U
S$
Basin co c1 co c1
US$ US$/ftW TX 1.00 1.00 8,950 6.24CA 0.80 2.10 7,200 13.11RM 1.51 0.83 13,555 5.16S TX 1.68 1.19 15,006 7.42MS 1.86 1.12 16,607 6.97OK 1.17 1.12 10,438 6.97
Ratio to W. TXBasin co c1 co c1
US$ US$/ftW TX 1.00 1.00 8,950 6.24CA 0.80 2.10 7,200 13.11RM 1.51 0.83 13,555 5.16S TX 1.68 1.19 15,006 7.42MS 1.86 1.12 16,607 6.97OK 1.17 1.12 10,438 6.97
Ratio to W. TX
5. Costs of Reworking an Existing Waterflood Production or Injection Well for CO2-EOR (First Rework). The reworking of existing oil production or CO2-EOR injection wells requires pulling and replacing the tubing string and pumping equipment. The well reworking costs are depth-dependent. The equation for Mississippi is:
Well Rework Costs = c1D Where: c1 = $19.42 per foot)
D is well depth Figure C-5 illustrates the average cost of well conversion as a function of depth for West Texas. The West Texas cost data for reworking wells provides the foundation for the Mississippi cost equation.

C-6 February 2006
Figure C-5. Cost of an Existing Waterflood Production or Injection Well for CO2-EOR in West Texas vs. Depth
y = 17.38xR2 = 0.9545
0
20,000
40,000
60,000
80,000
100,000
120,000
140,000
160,000
0 1000 2000 3000 4000 5000 6000 7000 8000 9000
Depth, ft
Cos
ts, U
S$
ReworkLinear (Rework)
Basin co c1 co c1US$ US$/ft
W TX 1.00 1.00 0 17.38CA 0.80 2.10 0 36.51RM 1.51 0.83 0 14.38S TX 1.68 1.19 0 20.67MS 1.86 1.12 0 19.42OK 1.17 1.12 0 19.41
Ratio to W. TX
y = 17.38xR2 = 0.9545
0
20,000
40,000
60,000
80,000
100,000
120,000
140,000
160,000
0 1000 2000 3000 4000 5000 6000 7000 8000 9000
Depth, ft
Cos
ts, U
S$
ReworkLinear (Rework)
Basin co c1 co c1US$ US$/ft
W TX 1.00 1.00 0 17.38CA 0.80 2.10 0 36.51RM 1.51 0.83 0 14.38S TX 1.68 1.19 0 20.67MS 1.86 1.12 0 19.42OK 1.17 1.12 0 19.41
Ratio to W. TXBasin co c1 co c1
US$ US$/ftW TX 1.00 1.00 0 17.38CA 0.80 2.10 0 36.51RM 1.51 0.83 0 14.38S TX 1.68 1.19 0 20.67MS 1.86 1.12 0 19.42OK 1.17 1.12 0 19.41
Ratio to W. TX
6. Annual O&M Costs, Including Periodic Well Workovers. The EIA Cost and Indices report provides secondary operating and maintenance (O&M) costs only for West Texas. As such, West Texas and Mississippi primary oil production O&M costs (Figure C-6) are used to estimate Mississippi secondary recovery O&M costs. Linear trends are used to identify fixed cost constants and variable cost constants for each region, Table C-1.

C-7 February 2006
Figure C-6. Annual Lease O&M Costs for Primary Oil Production by Area
y = 5.2672x + 7110.7R2 = 0.9945
y = 2.8014x + 16401R2 = 0.9611
y = 2.5075x + 8838.5R2 = 0.96
y = 2.7997x + 10309R2 = 0.9789
y = 2.9819x + 14820R2 = 0.9637
y = 2.0751x + 13387R2 = 0.9783
0
10,000
20,000
30,000
40,000
50,000
60,000
70,000
80,000
0 2,000 4,000 6,000 8,000 10,000 12,000 14,000
Depth, ft
Tota
l Cos
ts, U
S$ p
er Y
ear
California Oklahom aSouth Louis iana South TexasWes t Texas Rocky MountainsLinear (California) Linear (South Louis iana)Linear (Wes t Texas ) Linear (Oklahom a)Linear (South Texas ) Linear (Rocky Mountains )
Table C-1. Regional Lease O&M Costs and Their Relationship to West Texas
Basin c0 c1 c0 c1US$ US$
West Texas 8,839 2.51 1.00 1.00California 7,111 5.27 0.80 2.10Rocky Mountain 13,387 2.08 1.51 0.83South Texas 14,820 2.98 1.68 1.19Mississippi 16,401 2.80 1.86 1.12Oklahoma 10,309 2.80 1.17 1.12
Ratio to W. TXBasin c0 c1 c0 c1
US$ US$West Texas 8,839 2.51 1.00 1.00California 7,111 5.27 0.80 2.10Rocky Mountain 13,387 2.08 1.51 0.83South Texas 14,820 2.98 1.68 1.19Mississippi 16,401 2.80 1.86 1.12Oklahoma 10,309 2.80 1.17 1.12
Ratio to W. TX
To account for the O&M cost differences between waterflooding and CO2-EOR, two adjustments are made to the EIA’s reported O&M costs for secondary recovery. Workover costs, reported as surface and subsurface maintenance, are doubled to reflect the need for more frequent remedial well work in CO2-EOR projects. Liquid lifting are subtracted from annual waterflood O&M costs to allow for the more rigorous accounting of liquid lifting volumes and costs for CO2-EOR. (Liquid lifting costs for CO2-EOR are discussed in a later section of this appendix.)

C-8 February 2006
Figure C-7 shows the depth-relationship for CO2-EOR O&M costs in West Texas. These costs were adjusted to develop O&M for Mississippi, shown in the inset of Figure C-7. The equation for Mississippi is:
Well O&M Costs = b0 + b1D Where: b0 = $38,447 (fixed)
b1 = $8.72 per foot D is well depth
Figure C-7. Annual CO2-EOR O&M Costs for West Texas
y = 7.8054x + 1557R2 = 0.9935
0
10,000
20,000
30,000
40,000
50,000
60,000
70,000
0 1,000 2,000 3,000 4,000 5,000 6,000 7,000 8,000 9,000
Depth, ft
Cos
ts p
er Y
ear,
US$
CO2-EOR O&M
Linear (CO2-EOR O&M)
Area b0 b1 b0 b1US$ US$
W TX 1.00 1.00 20,720 7.81 CA 0.80 2.10 16,669 16.40 RM 1.51 0.83 31,381 6.46 S TX 1.68 1.19 34,740 9.28 MS 1.86 1.12 38,447 8.72 OK 1.17 1.12 24,166 8.71
Ratio to W. TX
7. CO2 Recycle Plant Investment Cost. Operation of CO2-EOR requires a recycling plant to capture and reinject the produced CO2. The size of the recycle plant is based on peak CO2 production and recycling requirements. The cost of the recycling plant is set at $700,000 per MMcf/d of CO2 capacity. As such, small CO2-EOR project in the Christmas formation of the West Heidelberg field, with 11 MMcf/d of CO2 reinjection, will require a recycling plant costing $7.7 million. A large project in the Lower Tuscaloosa formation of the Little Creek field, with 92 MMcf/d of peak CO2 reinjection and 86 injectors requires a recycling plant costing $64 million.
The model has three options for installing a CO2 recycling plant. The default setting costs the entire plant one year prior to CO2 breakthrough. The second option places the full CO2 recycle plant cost at the beginning of the project (Year 0). The third option installs the CO2 recycle plant in stages. In this case, half the plant is built (and half the cost is incurred) in the year of CO2 breakthrough. The second half of the plant is built when maximum recycle capacity requirements are reached.

C-9 February 2006
8. Other COTWO Model Costs.
a. CO2 Recycle O&M Costs. The O&M costs of CO2 recycling are indexed to energy costs and set at 1% of the oil price ($0.25 per Mcf @ $25 Bbl oil).
b. Lifting Costs. Liquid (oil and water) lifting costs are calculated on total liquid
production and costed at $0.25 per barrel. This cost includes liquid lifting, transportation and re-injection.
c. CO2 Distribution Costs. The CO2 distribution system is similar to the gathering
systems used for natural gas. A distribution “hub” is constructed with smaller pipelines delivering purchased CO2 to the project site. The distribution pipeline cost is dependent on the injection requirements for the project. The fixed component is $150,000. The variable cost component accounts for increasing piping diameters associated with increasing CO2 injection requirements. These range from $80,000 per mile for 4” pipe (CO2 rate less than 15MMcf/d), $120,000 per mile for 6” pipe (CO2 rate of 15 to 35 MMcf/d), $160,000 per mile for 8” pipe (CO2 rate of 35 to 60 MMcf/d), and $200,000 per mile for pipe greater than 8” diameter (CO2 rate greater than 60 MMcf/d). Aside from the injection volume, costs also depend on the distance from the CO2 “hub” (transfer point) to the oil field. Currently, the distance is set at 10 miles.
The CO2 distribution cost equation for Mississippi is:
Pipeline Construction Costs = $150,000 + CD*Distance Where: CD is the cost per mile of the necessary pipe diameter (from the CO2
injection rate) Distance = 10.0 miles
d. G&A Costs. General and administrative (G&A) costs of 20% are added to well
O&M and lifting costs. e. Royalties. Royalty payments are assumed to be 12.5%. f. Production Taxes. Mississippi has provided a risk sharing incentive for enhanced
oil recovery. The Mississippi Code Ann. 27-25-503(i) (1972) is effective as of April, 1994 with no sunset. Its stated goal is:
“Encourage the use of enhanced recovery methods of production.”
The “Enhanced Oil Recovery Statute” reduces the assessed severance tax rate to 3% of the value of the oil produced by an enhanced oil recovery method. The original statute, only covering use of carbon dioxide transported by a pipeline to the oil well, was

C-10 February 2006
expanded to include any other enhanced oil recovery method approved and permitted by the State Oil and Gas Board on or after April 1, 1994.
The regular state oil severance tax rate in Mississippi is 6% of the value of the produced oil. Reduction of the severance tax to 3% provides a modest risk sharing equal to $0.78 per barrel of incrementally produced oil (assuming a sales price of $30 per barrel of oil and a royalty rate of 12.5%). Severance and ad valorum taxes are set at 6.0% and 0.2%, respectively, for a total production tax of 6.2% on the oil production stream. Production taxes are taken following royalty payments.
g. Crude Oil Price Differential. To account for market and oil quality (gravity)
differences on the realized oil price, the cost model incorporated the current basis differential for Mississippi ($0.00 per barrel) and the current gravity differential (-$0.25 per ºAPI, from a basis of 40 ºAPI) into the average wellhead oil price realized by each oil reservoir. The equation for Mississippi is:
Wellhead Oil Price = Oil Price + ($0.00) – [$0.25*(40 - ºAPI)] Where: Oil Price is the marker oil price (West Texas intermediate)
ºAPI is oil gravity If the oil gravity is less than 40 ºAPI, the wellhead oil price is reduced; if the oil gravity is greater than 40 ºAPI, the wellhead oil price is increased. In addition, some fields within Mississippi contain very light oil (>45 API). In order to keep the economics of these fields level with the rest of the fields, we imposed a ceiling of 45 API for all fields with lighter oil when applying the Crude Oil Price Differential.

Appendix D
Alabama CO2-EOR Cost Model

D-1 February 2006
Cost Model for CO2-Based Enhanced Oil Recovery (CO2-EOR) This appendix provides documentation for the cost module of the desktop CO2-EOR policy and analytical model (COTWO) developed by Advanced Resources for DOE/FE-HQ. The sections of this cost documentation report are organized according to the normal sequence of estimating the capital and operating expenditures for a CO2-EOR project: 1. Well Drilling and Completion Costs. The costs for well drilling and completion (D&C) are based on the 2003 JAS cost study recently published by API for Mississippi and are applied to Alabama. The well D&C cost equation has a fixed cost constant for site preparation and other fixed cost items and a variable cost equation that increases exponentially with depth. The total equation is: Well D&C Costs = a0Da1 Where: a0 is 0.00655 a1 is 2.104 D is well depth Figure D-1 provides the details for the cost equation and illustrates the “goodness of fit” for the well D&C cost equation for Alabama.
Figure-D1 - Oil Well D&C Costs for Alabama
y = 0.00655x2.10378
R2 = 0.99095
0
500,000
1,000,000
1,500,000
2,000,000
2,500,000
0 2,000 4,000 6,000 8,000 10,000 12,000
Depth, ft
Tota
l Dril
ling
Cos
t, US
$
2003 API Cos tsPower (2003 API Cos ts )

D-2 February 2006
In order to bring the 2003 API drilling costs (the most recent available) into 2004 numbers where increased oil prices are expected to result in significantly increased drilling costs, a relationship was established between average drilling costs and average annual oil prices. Drillings costs from the ten year period of 1994-2003 (API data) were plotted versus the three year weighted average annual oil prices for those years (EIA Annual Energy Review, 2004) and the following relationship was established: Drilling costs (per foot) = $5.04(annual oil price) – $3.2116. Applying the 2004 average oil price of $36.77 gives a drilling cost of $182 per foot and an increase of 25.6% over the 2003 cost of $145 per foot. Therefore, drilling and completion costs were increased by 25% over the Alabama D&C cost calculations to reflect this increase in 2004 drilling costs.
2. Lease Equipment Costs for New Producing Wells. The costs for equipping a new oil production well are based on data reported by the EIA in their 2004 EIA “Cost and Indices for Domestic Oil and Gas Field Equipment and Production Operations” report for South Louisiana. This survey provides estimated lease equipment costs for 10 wells producing with artificial lift, from depths ranging from 2,000 to 12,000 feet, into a central tank battery. The equation contains a fixed cost constant for common cost items, such as free water knock-out, water disposal and electrification, and a variable cost component to capture depth-related costs such as for pumping equipment. The total equation is:
Production Well Equipping Costs = c0 + c1D Where: co = $81,403 (fixed) c1 = $7.033 per foot D is well depth
Figure D-2 illustrates the application of the lease equipping cost equation for a new oil production well as a function of depth.

D-3 February 2006
Figure D-2. Lease Equipping Cost for a New Oil Production Well in Alabama vs. Depth
y = 7.033x + 81403R2 = 0.9428
0
40,000
80,000
120,000
160,000
200,000
0 2,000 4,000 6,000 8,000 10,000 12,000 14,000
Depth, ft
Tota
l Cos
ts, U
S$
3. Lease Equipment Costs for New Injection Wells. The costs for equipping a new injection well in Alabama include gathering lines, a header, electrical service as well as a water pumping system. The costs are estimated from the EIA Cost and Indices Report. Equipment costs include a fixed cost component and a depth-related cost component, which varies based on surface pressure requirements. The equation for Alabama is:
Injection Well Equipping Costs = c0 + c1D Where: co = $17,214 (fixed)
c1 = $16.34 per foot D is well depth
Figure D-3 illustrates the application of the lease equipping cost equation for a new injection well as a function of depth for West Texas. The West Texas cost data for lease equipment provides the foundation for the Alabama cost equation.

D-4 February 2006
Figure D-3. Lease Equipping Costs for a New Injection Well in West Texas vs. Depth
y = 14.63x + 9277.3R2 = 0.9674
0
20,000
40,000
60,000
80,000
100,000
120,000
140,000
0 1,000 2,000 3,000 4,000 5,000 6,000 7,000 8,000 9,000
Depth, ft
Cos
ts, U
S$
CostsLinear (Costs)
Basin co c1 co c1
US$ US$/ftW TX 1.00 1.00 9,277 14.63CA 0.80 2.10 7,463 30.73RM 1.51 0.83 14,051 12.11S TX 1.68 1.19 15,555 17.40AL 1.86 1.12 17,214 16.34OK 1.17 1.12 10,820 16.33
Ratio to W. TX
y = 14.63x + 9277.3R2 = 0.9674
0
20,000
40,000
60,000
80,000
100,000
120,000
140,000
0 1,000 2,000 3,000 4,000 5,000 6,000 7,000 8,000 9,000
Depth, ft
Cos
ts, U
S$
CostsLinear (Costs)
Basin co c1 co c1
US$ US$/ftW TX 1.00 1.00 9,277 14.63CA 0.80 2.10 7,463 30.73RM 1.51 0.83 14,051 12.11S TX 1.68 1.19 15,555 17.40AL 1.86 1.12 17,214 16.34OK 1.17 1.12 10,820 16.33
Ratio to W. TXBasin co c1 co c1
US$ US$/ftW TX 1.00 1.00 9,277 14.63CA 0.80 2.10 7,463 30.73RM 1.51 0.83 14,051 12.11S TX 1.68 1.19 15,555 17.40AL 1.86 1.12 17,214 16.34OK 1.17 1.12 10,820 16.33
Ratio to W. TX
4. Converting Existing Production Wells into Injection Wells. The conversion of existing oil production wells into CO2 and water injection wells requires replacing the tubing string and adding distribution lines and headers. The costs assume that all surface equipment necessary for water injection are already in place on the lease. The existing well conversion costs include a fixed cost component and a depth-related cost component, which varies based on the required surface pressure and tubing length. The equation for Alabama is:
Well Conversion Costs = c0 + c1D Where: co = $16,607 (fixed)
c1 = $6.973 per foot D is well depth
Figure D-4 illustrates the average cost of converting an existing producer into an injection well for West Texas. The West Texas cost data for converting wells provide the foundation for the Alabama cost equation.

D-5 February 2006
Figure D-4. Cost of Converting Existing Production Wells into Injection Wells in West Texas vs. Depth
y = 6.2412x + 8950R2 = 0.9896
0
10,000
20,000
30,000
40,000
50,000
60,000
70,000
0 1000 2000 3000 4000 5000 6000 7000 8000 9000
Depth, ft
Cos
t, U
S$
Basin co c1 co c1
US$ US$/ftW TX 1.00 1.00 8,950 6.24CA 0.80 2.10 7,200 13.11RM 1.51 0.83 13,555 5.16S TX 1.68 1.19 15,006 7.42AL 1.86 1.12 16,607 6.97OK 1.17 1.12 10,438 6.97
Ratio to W. TX
y = 6.2412x + 8950R2 = 0.9896
0
10,000
20,000
30,000
40,000
50,000
60,000
70,000
0 1000 2000 3000 4000 5000 6000 7000 8000 9000
Depth, ft
Cos
t, U
S$
Basin co c1 co c1
US$ US$/ftW TX 1.00 1.00 8,950 6.24CA 0.80 2.10 7,200 13.11RM 1.51 0.83 13,555 5.16S TX 1.68 1.19 15,006 7.42AL 1.86 1.12 16,607 6.97OK 1.17 1.12 10,438 6.97
Ratio to W. TXBasin co c1 co c1
US$ US$/ftW TX 1.00 1.00 8,950 6.24CA 0.80 2.10 7,200 13.11RM 1.51 0.83 13,555 5.16S TX 1.68 1.19 15,006 7.42AL 1.86 1.12 16,607 6.97OK 1.17 1.12 10,438 6.97
Ratio to W. TX
5. Costs of Reworking an Existing Waterflood Production or Injection Well for CO2-EOR (First Rework). The reworking of existing oil production or CO2-EOR injection wells requires pulling and replacing the tubing string and pumping equipment. The well reworking costs are depth-dependent. The equation for Alabama is:
Well Rework Costs = c1D Where: c1 = $19.42 per foot)
D is well depth Figure D-5 illustrates the average cost of well conversion as a function of depth for West Texas. The West Texas cost data for reworking wells provides the foundation for the Alabama cost equation.

D-6 February 2006
Figure D-5. Cost of an Existing Waterflood Production or Injection Well for CO2-EOR in West Texas vs. Depth
y = 17.38xR2 = 0.9545
0
20,000
40,000
60,000
80,000
100,000
120,000
140,000
160,000
0 1000 2000 3000 4000 5000 6000 7000 8000 9000
Depth, ft
Cos
ts, U
S$
ReworkLinear (Rework)
Basin co c1 co c1US$ US$/ft
W TX 1.00 1.00 0 17.38CA 0.80 2.10 0 36.51RM 1.51 0.83 0 14.38S TX 1.68 1.19 0 20.67AL 1.86 1.12 0 19.42OK 1.17 1.12 0 19.41
Ratio to W. TX
y = 17.38xR2 = 0.9545
0
20,000
40,000
60,000
80,000
100,000
120,000
140,000
160,000
0 1000 2000 3000 4000 5000 6000 7000 8000 9000
Depth, ft
Cos
ts, U
S$
ReworkLinear (Rework)
Basin co c1 co c1US$ US$/ft
W TX 1.00 1.00 0 17.38CA 0.80 2.10 0 36.51RM 1.51 0.83 0 14.38S TX 1.68 1.19 0 20.67AL 1.86 1.12 0 19.42OK 1.17 1.12 0 19.41
Ratio to W. TXBasin co c1 co c1
US$ US$/ftW TX 1.00 1.00 0 17.38CA 0.80 2.10 0 36.51RM 1.51 0.83 0 14.38S TX 1.68 1.19 0 20.67AL 1.86 1.12 0 19.42OK 1.17 1.12 0 19.41
Ratio to W. TX
6. Annual O&M Costs, Including Periodic Well Workovers. The EIA Cost and Indices report provides secondary operating and maintenance (O&M) costs only for West Texas. As such, West Texas and Alabama primary oil production O&M costs (Figure D-6) are used to estimate Alabama secondary recovery O&M costs. Linear trends are used to identify fixed cost constants and variable cost constants for each region, Table D-1.

D-7 February 2006
Figure D-6. Annual Lease O&M Costs for Primary Oil Production by Area
y = 5.2672x + 7110.7R2 = 0.9945
y = 2.8014x + 16401R2 = 0.9611
y = 2.5075x + 8838.5R2 = 0.96
y = 2.7997x + 10309R2 = 0.9789
y = 2.9819x + 14820R2 = 0.9637
y = 2.0751x + 13387R2 = 0.9783
0
10,000
20,000
30,000
40,000
50,000
60,000
70,000
80,000
0 2,000 4,000 6,000 8,000 10,000 12,000 14,000
Depth, ft
Tota
l Cos
ts, U
S$ p
er Y
ear
California Oklahom aSouth Louis iana South TexasWes t Texas Rocky MountainsLinear (California) Linear (South Louis iana)Linear (Wes t Texas ) Linear (Oklahom a)Linear (South Texas ) Linear (Rocky Mountains )
Table D-1. Regional Lease O&M Costs and Their Relationship to West Texas
Basin c0 c1 c0 c1US$ US$
West Texas 8,839 2.51 1.00 1.00California 7,111 5.27 0.80 2.10Rocky Mountain 13,387 2.08 1.51 0.83South Texas 14,820 2.98 1.68 1.19Alabama 16,401 2.80 1.86 1.12Oklahoma 10,309 2.80 1.17 1.12
Ratio to W. TXBasin c0 c1 c0 c1
US$ US$West Texas 8,839 2.51 1.00 1.00California 7,111 5.27 0.80 2.10Rocky Mountain 13,387 2.08 1.51 0.83South Texas 14,820 2.98 1.68 1.19Alabama 16,401 2.80 1.86 1.12Oklahoma 10,309 2.80 1.17 1.12
Ratio to W. TX
To account for the O&M cost differences between waterflooding and CO2-EOR, two adjustments are made to the EIA’s reported O&M costs for secondary recovery. Workover costs, reported as surface and subsurface maintenance, are doubled to reflect the need for more frequent remedial well work in CO2-EOR projects. Liquid lifting are subtracted from annual waterflood O&M costs to allow for the more rigorous accounting of liquid lifting volumes and costs for CO2-EOR. (Liquid lifting costs for CO2-EOR are discussed in a later section of this appendix.)

D-8 February 2006
Figure D-7 shows the depth-relationship for CO2-EOR O&M costs in West Texas. These costs were adjusted to develop O&M for Alabama, shown in the inset of Figure D-7. The equation for Alabama is:
Well O&M Costs = b0 + b1D Where: b0 = $38,447 (fixed)
b1 = $8.72 per foot D is well depth
Figure D-7. Annual CO2-EOR O&M Costs for West Texas
y = 7.8054x + 1557R2 = 0.9935
0
10,000
20,000
30,000
40,000
50,000
60,000
70,000
0 1,000 2,000 3,000 4,000 5,000 6,000 7,000 8,000 9,000
Depth, ft
Cos
ts p
er Y
ear,
US$
CO2-EOR O&M
Linear (CO2-EOR O&M)
Area b0 b1 b0 b1US$ US$
W TX 1.00 1.00 20,720 7.81 CA 0.80 2.10 16,669 16.40 RM 1.51 0.83 31,381 6.46 S TX 1.68 1.19 34,740 9.28 AL 1.86 1.12 38,447 8.72 OK 1.17 1.12 24,166 8.71
Ratio to W. TX
7. CO2 Recycle Plant Investment Cost. Operation of CO2-EOR requires a recycling plant to capture and reinject the produced CO2. The size of the recycle plant is based on peak CO2 production and recycling requirements. The cost of the recycling plant is set at $700,000 per MMcf/d of CO2 capacity. As such, a project in the Rodessa formation of the Citronelle field, with 114 MMcf/d of peak CO2 reinjection and 203 injectors requires a recycling plant costing $80 million.
The model has three options for installing a CO2 recycling plant. The default setting costs the entire plant one year prior to CO2 breakthrough. The second option places the full CO2 recycle plant cost at the beginning of the project (Year 0). The third option installs the CO2 recycle plant in stages. In this case, half the plant is built (and half the cost is incurred) in the year of CO2 breakthrough. The second half of the plant is built when maximum recycle capacity requirements are reached.

D-9 February 2006
8. Other COTWO Model Costs.
a. CO2 Recycle O&M Costs. The O&M costs of CO2 recycling are indexed to energy costs and set at 1% of the oil price ($0.25 per Mcf @ $25 Bbl oil).
b. Lifting Costs. Liquid (oil and water) lifting costs are calculated on total liquid
production and costed at $0.25 per barrel. This cost includes liquid lifting, transportation and re-injection.
c. CO2 Distribution Costs. The CO2 distribution system is similar to the gathering
systems used for natural gas. A distribution “hub” is constructed with smaller pipelines delivering purchased CO2 to the project site. The distribution pipeline cost is dependent on the injection requirements for the project. The fixed component is $150,000. The variable cost component accounts for increasing piping diameters associated with increasing CO2 injection requirements. These range from $80,000 per mile for 4” pipe (CO2 rate less than 15MMcf/d), $120,000 per mile for 6” pipe (CO2 rate of 15 to 35 MMcf/d), $160,000 per mile for 8” pipe (CO2 rate of 35 to 60 MMcf/d), and $200,000 per mile for pipe greater than 8” diameter (CO2 rate greater than 60 MMcf/d). Aside from the injection volume, costs also depend on the distance from the CO2 “hub” (transfer point) to the oil field. Currently, the distance is set at 10 miles.
The CO2 distribution cost equation for Alabama is:
Pipeline Construction Costs = $150,000 + CD*Distance Where: CD is the cost per mile of the necessary pipe diameter (from the CO2
injection rate) Distance = 10.0 miles
d. G&A Costs. General and administrative (G&A) costs of 20% are added to well
O&M and lifting costs. e. Royalties. Royalty payments are assumed to be 12.5%. f. Production Taxes. Alabama has enacted a risk sharing action for enhanced oil
recovery. The Alabama Severance Tax Law Chapter 20, Article 1, Section 40-20-2 is effective May 1, 1985. It states:
“…the incremental oil or gas production produced during a given year resulting from
a qualified enhanced recovery project shall be taxed at the rate of four percent of gross value at the point of production of said incremental oil or gas production.”

D-10 February 2006
The severance tax in the model was therefore set at 6.0% (the 4% privilege tax plus a 2% production tax). The conventional oil severance tax rate in Alabama is 10% of the value of the produced oil. Reduction in the severance tax by 4% for enhanced oil recovery provides a savings of $1.05 per barrel of incrementally produced oil (assuming a sales price of $30 per barrel of oil and a royalty rate of 12.5%). Production taxes are taken following royalty payments.
g. Crude Oil Price Differential. To account for market and oil quality (gravity)
differences on the realized oil price, the cost model incorporated the current basis differential for Alabama ($0.00 per barrel) and the current gravity differential (-$0.25 per ºAPI, from a basis of 40 ºAPI) into the average wellhead oil price realized by each oil reservoir. The equation for Alabama is:
Wellhead Oil Price = Oil Price + ($0.00) – [$0.25*(40 - ºAPI)] Where: Oil Price is the marker oil price (West Texas intermediate)
ºAPI is oil gravity If the oil gravity is less than 40 ºAPI, the wellhead oil price is reduced; if the oil gravity is greater than 40 ºAPI, the wellhead oil price is increased. In addition, some fields within Alabama contain very light oil (>45 API). In order to keep the economics of these fields level with the rest of the fields, we imposed a ceiling of 45 API for all fields with lighter oil when applying the Crude Oil Price Differential.