aspect capital insight template · stagflation occurrences and their potential impact on...
TRANSCRIPT
Aspect Capital Insight Series │ The Return of Stagflation?
April 2020 Page 1 of 12
Private and Confidential
The Return of Stagflation?
Post-Pandemic Implications for Asset Owners
April 2020
The following paper was originally written in October 2019, in response to a client question about the possible impacts of a
stagflationary environment on long-term asset owners’ portfolios. At the time, the risk of stagflation seemed a remote possibility.
However, the unprecedented fiscal and monetary stimulus provided by central banks and governments in response to the Covid-19
pandemic has prompted a fascinating debate in economic circles, between those who see the sudden and widespread impact on
consumption precipitated by the crisis as having a deflationary effect, and those who view inflation as the inevitable result of the
unprecedented supply shock and injection of capital into developed economies. Regardless of which side of the inflation debate one
takes, the post-pandemic state of the global economy merits consideration. In light of that, we are sharing our insights into the potential
implications of a stagflationary environment on asset owners’ portfolios and the possible solutions that can be put in place to mitigate
its effects.
1. Introduction
Some describe central banks as chaperones, whose job it is to
take away the punchbowl just as the party gets going. In the
clutches of the Covid-19 pandemic, however, the response has
been to lace the punch with an unprecedented injection of
liquidity and public debt. Consequently, it seems entirely
possible that when we emerge from this extraordinary situation
we will be confronted by, in Niall Ferguson’s words, ‘An
almighty fiscal and monetary hangover1’, in the form of
renewed inflationary pressures. At the same time, growth rates
have stalled - obstructed initially by trade wars and unstable
geopolitics, and more recently (and significantly) by the
aggressive social measures taken to contain the pandemic. In
light of this, it is not inconceivable that stagflation could make a
late entrance and ruin the party for everyone.
We define stagflation in a way that is of most relevance to
pension plans: the combination of sustained high inflation and
prolonged stagnant economic growth, which leads to persistent
erosion in the real value of asset owner portfolios.
We utilise data from deep history to understand the nature of
stagflation occurrences and their potential impact on traditional
portfolios. Furthermore, we study more recent data to make our
analysis relevant to today’s world. We demonstrate that a
commodity-heavy trend following system combined with multi-
asset cross-sectional carry models as well as potential short-
1 Coronavirus: the legacy of a lockdown, Niall Ferguson, 19th April 2020
term alpha trading strategies can provide a well-rounded
solution for traditional portfolios during stagflationary periods.
Our solution also has positive expected returns during non-
stagflationary periods. Given the low likelihood of stagflation
occurring but its impact being profound, such a solution needs
to produce useful returns during non-stagflationary periods,
which is something that long allocations to commodity markets
fail to achieve.
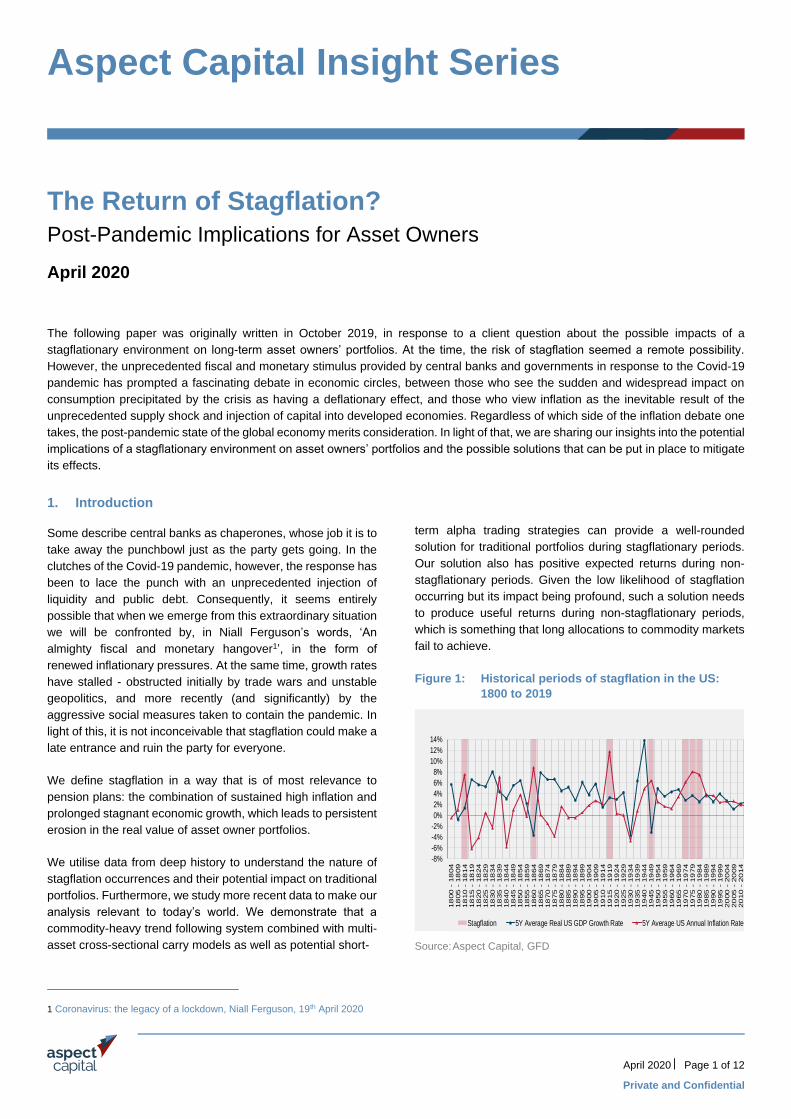
Figure 1: Historical periods of stagflation in the US:
1800 to 2019
Source: Aspect Capital, GFD
-8%
-6%
-4%
-2%
0%
2%
4%
6%
8%
10%
12%
14%
18
00
- 1
804
18
05
- 1
809
18
10
- 1
814
18
15
- 1
819
18
20
- 1
824
18
25
- 1
829
18
30
- 1
834
18
35
- 1
839
18
40
- 1
844
18
45
- 1
849
18
50
- 1
854
18
55
- 1
859
18
60
- 1
864
18
65
- 1
869
18
70
- 1
874
18
75
- 1
879
18
80
- 1
884
18
85
- 1
889
18
90
- 1
894
18
95
- 1
899
19
00
- 1
904
19
05
- 1
909
19
10
- 1
914
19
15
- 1
919
19
20
- 1
924
19
25
- 1
929
19
30
- 1
934
19
35
- 1
939
19
40
- 1
944
19
45
- 1
949
19
50
- 1
954
19
55
- 1
959
19
60
- 1
964
19
65
- 1
969
19
70
- 1
974
19
75
- 1
979
19
80
- 1
984
19
85
- 1
989
19
90
- 1
994
19
95
- 1
999
20
00
- 2
004
20
05
- 2
009
20
10
- 2
014
20
15
- 2
019
Stagflation 5Y Average Real US GDP Growth Rate 5Y Average US Annual Inflation Rate
Aspect Capital Insight Series
Private and Confidential

Aspect Capital Insight Series │ The Return of Stagflation?
April 2020 Page 2 of 12
Private and Confidential
By our definition, the shaded 5Y periods in Figure 1 can be
classified as being ‘stagflationary’. In other words, the shaded
periods highlight prolonged periods where inflation significantly
outstrips growth. These periods would be problematic for
traditional long-only equity and bond portfolios. We classify the
following five stagflationary periods:
The first four periods were the result of US wartime activity
which saw the US expand monetary supply substantially and
purchase goods faster than they were being produced in many
cases:
• 1810 to 1814 – The War of 1812 – The US chapter of the
Napoleonic Wars (1812-1815)
• 1860 to 1864 – The American Civil War
• 1915 to 1919 – World War I
• 1945 to 1949 – Aftermath of World War II
The fifth period was markedly different from previous ones. Not
only was it the longest, but its causes were rooted in external
oil shocks and misguided monetary policy.
• 1970 to 1984 – ‘The Great Stagflation’
2. Deep history analysis
We use real (inflation-adjusted) returns for traditional assets to
see which ones kept up pace with inflation during each
stagflationary period.
The chart below compares their performance (note: only bond
and gold returns were available for the first two periods):
Figure 2: Compound annual real return: 5 stagflation
periods
Source: Aspect Capital, GFD. Please see disclaimer on pages 11 and
12.
The promissory nature of nominal assets such as bonds and
stocks may help explain their relative weakness over these five
phases.
In the case of bonds, promised streams of money are fixed and
the purchasing power of the streams decline as inflation
increases, causing a downward re-pricing of existing bonds in
real terms.
All else equal, the rise of bond yields increases discount rates
for future stock cash flows, which in turn depresses real stock
prices.
Stagnant or lower economic growth can also stunt stock prices
due to reduced profitability and increased riskiness.
Stocks outperformed between 1945 to 1949 due to a post-war
‘victory’ rally mostly attributable to dividends.
For real assets such as gold and oil, the picture appears more
mixed, especially before the 1970s, which saw reductions in
restrictions on the usage of these assets by markets.
The primary reason for gold’s periods of negative real return
was that the US government effectively fixed prices under a
gold standard until the 1970s.
-15%
-10%
-5%
0%
5%
10%
15%
1810 - 1814(5 years)
1860 - 1864(5 years)
1915 - 1919(5 years)
1945 - 1949(5 years)
1970 - 1984(15 years)
Co
mp
ou
nd
An
nu
al
Re
al R
etu
rnBONDS(1786)
STOCKS(1871)
60/40 STOCKS BOND MIX(1871)
OIL(1900)
GOLD(1723)

Aspect Capital Insight Series │ The Return of Stagflation?
April 2020 Page 3 of 12
Private and Confidential
To fund the civil war in the 1860s, the US issued its first paper
currency and briefly moved away from a gold standard. High
inflation and loss of convertibility and confidence in the dollar
caused gold’s strong real returns in this period.
The technological revolution and WWI initially drove early 20th
century oil demand. However numerous oil discoveries and
price controls kept oil prices supressed until the 1970s.
In the 1970s, a combination of repeated global oil supply
disruptions, record-breaking inflationary fears and the
untethering of gold from the dollar boosted both gold and oil in
the Great Stagflation.
The heuristic approach of favouring commodities over stocks
and bonds during stagflation is not necessarily corroborated by
extensive historical data but is probably based on post-1970s
data.
It is essential to remember that the foundations and anatomy
of each stagflation period are different with each period also
featuring once-in-a-generation events.
Consequently, we cannot rely on prior stagflation period returns
as our sole guide.
3. Contemporary data analysis
We aim to investigate investable assets and strategies under
financial conditions more akin to today with the following
approach:
• We will focus on the inflationary aspects of stagflation by
analysing the inflationary resilience of assets and
strategies.
• Assets and strategies which tend to keep pace with US
inflation irrespective of economic growth should be
emphasized within a stagflationary investment solution.
• This approach provides more data points from which more
reliable conclusions can be drawn.
• Overall performance will be considered to ensure
assets/strategies do not harm portfolios if stagflation does
not materialise.
• Previous stretches of stagflation have compelled
extraordinary central bank action, e.g. drastic fast-paced
short-term interest hikes during the early 1980s.
A stagflation solution design should be able to withstand
this stress and possibly even take advantage of it.
• The onset of stagflation and associated central bank
reaction could easily create short or longer periods of
market instability.
It is worth considering solution components that can
respond to mitigate unsteadiness and tail-risk.
3.1. Traditional Long-Only Asset Behaviour
Assets are represented using datasets (from 1950s onwards)
more consistent with today’s financial conditions.
Figure 3 shows how the real asset returns have generally
responded to increases in the US annual inflation rate in terms
of direction and magnitude of co-movement.
Figure 4 shows average real risk-adjusted returns (IR) during
months with increases in the US annual inflation rates
An asset could be viewed as having inflation-hedging
properties if it has both a consistently positive conditional beta
and IR with respect to upward inflation movements.
• Commodity futures, oil and gold have demonstrated
inflationary resilience since the 1950s showing both real
return growth and positive sensitivity during inflation rate
rises.
• Real returns on bonds were not able to keep pace with
inflation during inflation rate increases and showed
adverse reactions to inflation rate upticks.
• Real returns of stocks and a 60/40 stocks bond mix are
more likely to see real return erosion during persistent
inflation rate increases despite providing positive
performance.

Aspect Capital Insight Series │ The Return of Stagflation?
April 2020 Page 4 of 12
Private and Confidential
Figure 3: Conditional beta for months with US inflation
rate upticks: multiple time frames
Source: Aspect Capital, GFD. Please see disclaimer on pages 11 and
12.
Figure 4: Conditional IR for months with US inflation
rate upticks: multiple time frames
Source: Aspect Capital, GFD. Please see disclaimer on pages 11 and
12.
Figure 5 shows long-term real (unconditional) information
ratios. It is evident that the commodity futures and commodity
assets have consistently underperformed stocks, bonds and a
60/40 mix.
Figure 5: Unconditional information ratio: multiple time
frames
Source: Aspect Capital, GFD. Please see disclaimer on pages 11 and
12.
In the absence of inflation increases or deflation, commodities
have been seen to underperform nominal assets such as
stocks and bonds.
A major risk of over-reliance on commodities for inflation-
hedging comes in the form of muted or negative overall risk-
adjusted performance over longer-term timeframes.
These traditional long-only assets are unlikely to be enough for
an effective stagflation solution.
3.2. Beyond Traditional Long-Only Assets
To combat stagflation effectively, favourable strategies should
harness rising inflation without harming portfolios in the
absence of inflation.
One approach to protect against stagflation whilst minimising
long-term performance degradation could be to dynamically
alter a portfolio’s sensitivity to inflation by changing allocations
between traditional long-only assets.
Besides the fact that this is akin to factor timing, which is
notoriously difficult, here are reasons why one might avoid this
route:
• Identifying stagflation on an ex-ante basis without incurring
false positives is unlikely to be straightforward
-4-3-2-10123456
ST
OC
KS
(195
0)
BO
ND
S(1
95
0)
60/4
0 S
TO
CK
S/B
ON
DS
(195
0)
CO
MM
OD
ITIE
S(F
UT
UR
ES
)(1
97
0) O
IL(1
95
0)
GO
LD
(195
0)
Traditional Long-Only Assets - Based on Real (Inflation-Adjusted) Returns
Be
ta
Inception to 20191980s to 20191990s to 20192000s to 2019
-0.6
-0.4
-0.2
0
0.2
0.4
0.6
0.8
1
ST
OC
KS
(195
0)
BO
ND
S(1
95
0)
60/4
0 S
TO
CK
S/B
ON
DS
(195
0)
CO
MM
OD
ITIE
S(F
UT
UR
ES
)(1
97
0) O
IL(1
95
0)
GO
LD
(195
0)
Traditional Long-Only Assets - Based on Real (Inflation-Adjusted) Returns
Info
rma
tio
n R
ati
o
Inception to 20191980s to 20191990s to 20192000s to 2019

Aspect Capital Insight Series │ The Return of Stagflation?
April 2020 Page 5 of 12
Private and Confidential
• At the point of reallocation, liquidity constraints may appear
within the asset classes requiring overexposure
• During choppy macroeconomic regimes, frequent
reallocation would likely sustain unnecessary and
penalising trading costs
A more robust stagflation solution needs to extend beyond
traditional long-only assets and focus on the following:
• A well-balanced combination of alternative investment
strategies may allow one to benefit from varying dynamics
across asset classes without being overexposed to
inflation risks
• Strategies with sound theories or evidence surrounding
their ability to perform during inflationary regimes.
• These strategies should not necessarily rely on US growth
only and should be implemented globally in a scalable and
liquid manner
4. Spotlight on trend following as a stagflation solution
During stagflation, surging inflation is likely to cause a series of
persistent directional movements in many asset classes –
these can be captured with a trend following system.
We use the Mt. Lucas Management Index to characterise trend
following because it has a very long history, having been first
introduced in 1988 and using data going back to 1961.
It represents the intrinsic features of trend following that have
positive stagflation characteristics.
Clearly superior trend systems such as those developed at
Aspect are always preferable, but we wanted to highlight that
even the most simplistic and rudimentary trend implementation
still possesses the correct attributes which we seek. The MLM
Index has the following features:
• 22 equally weighted markets with the following
composition: 11 Commodities, 6 FX, 5 Fixed Income (FI)
• Each month, if the 200-day moving average is above a
market’s nearby future’s close price, go short, otherwise go
long
1970 to 1984 houses the most recent and arguably the most
(in)famous and prolonged period of stagflation in recorded
history. Figure 6 and Table 1 compare real (inflation-adjusted)
performances over this period:
Figure 6: Real growth of USD 100 for selected indices
and US annual inflation: 1970 to 1984
Source: Aspect Capital, GFD. Please see disclaimer on pages 11 and
12.
Table 1: Real (inflation-adjusted) performance of
selected indices: 1970 to 1984
Dec 1969 to Dec 1984
MLM Index
MLM (COM)
MLM (FX)
MLM (FI)
(Futures) (60/40)
Ann Ret 13.1% 13.8% 7.8% 6.2% 7.0% 1.4%
Ann Vol 14.0% 15.5% 7.2% 14.6% 19.4% 11.5%
IR 0.93 0.89 1.08 0.43 0.36 0.12
Source: Aspect Capital, GFD. Please see disclaimer on pages 11 and
12.
• The MLM index comprising a simple commodity-heavy
trend following system provides the strongest real
performance with positive real contributions from each
sector
• The MLM index also only had a 0.26 correlation with long-
only commodities and -0.04 correlation with the 60/40
stocks bond mix over this period
• Commodity futures fared reasonably during this period but
struggled as inflation came down
0%
2%
4%
6%
8%
10%
12%
14%
16%
0
100
200
300
400
500
600
700
800
Dec-6
9
Dec-7
0
Dec-7
1
Dec-7
2
Dec-7
3
Dec-7
4
Dec-7
5
Dec-7
6
Dec-7
7
Dec-7
8
Dec-7
9
Dec-8
0
Dec-8
1
Dec-8
2
Dec-8
3
Dec-8
4
MLM Index(1961)
MLMCommodities(1961)
MLMFX(1975)
MLMFI(1978)
COMMODITIES(FUTURES)(1970)
60/40STOCKS BONDS(1950)
US AnnualInflation (RHS)
Aspect Capital Insight Series │ The Return of Stagflation?
April 2020 Page 6 of 12
Private and Confidential
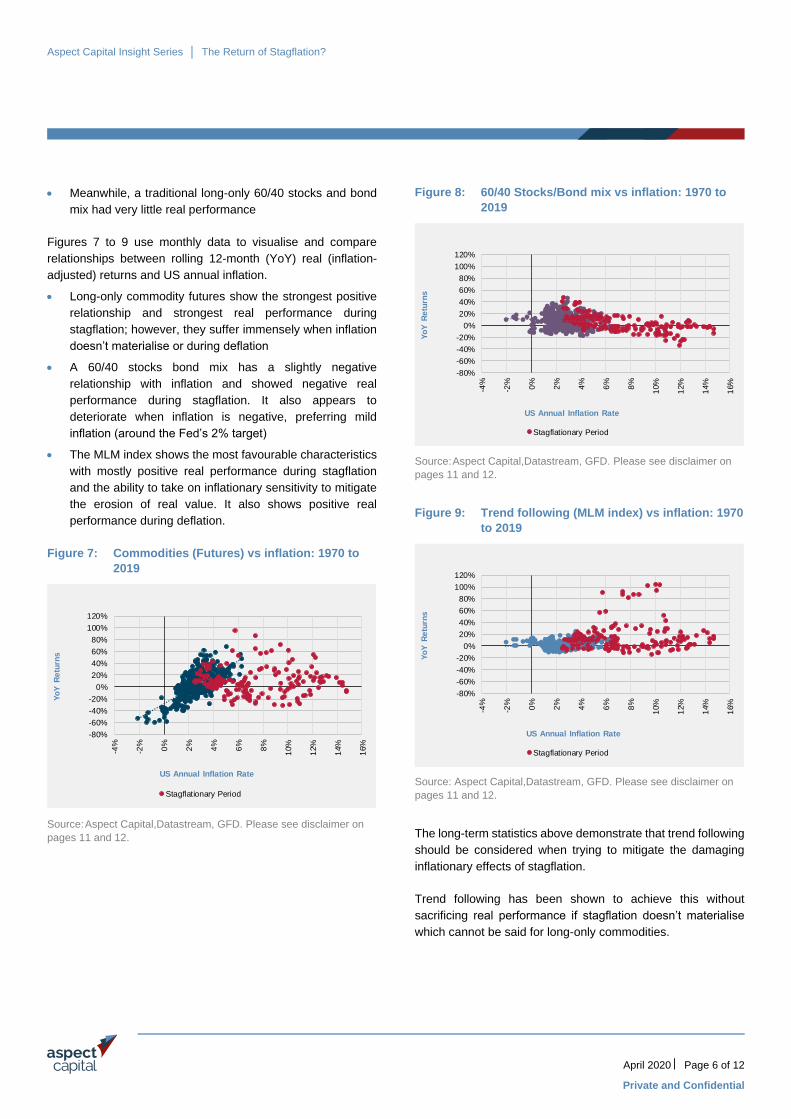
• Meanwhile, a traditional long-only 60/40 stocks and bond
mix had very little real performance
Figures 7 to 9 use monthly data to visualise and compare
relationships between rolling 12-month (YoY) real (inflation-
adjusted) returns and US annual inflation.
• Long-only commodity futures show the strongest positive
relationship and strongest real performance during
stagflation; however, they suffer immensely when inflation
doesn’t materialise or during deflation
• A 60/40 stocks bond mix has a slightly negative
relationship with inflation and showed negative real
performance during stagflation. It also appears to
deteriorate when inflation is negative, preferring mild
inflation (around the Fed’s 2% target)
• The MLM index shows the most favourable characteristics
with mostly positive real performance during stagflation
and the ability to take on inflationary sensitivity to mitigate
the erosion of real value. It also shows positive real
performance during deflation.
Figure 7: Commodities (Futures) vs inflation: 1970 to
2019
Source: Aspect Capital,Datastream, GFD. Please see disclaimer on
pages 11 and 12.
Figure 8: 60/40 Stocks/Bond mix vs inflation: 1970 to
2019
Source: Aspect Capital,Datastream, GFD. Please see disclaimer on
pages 11 and 12.
Figure 9: Trend following (MLM index) vs inflation: 1970
to 2019
Source: Aspect Capital,Datastream, GFD. Please see disclaimer on
pages 11 and 12.
The long-term statistics above demonstrate that trend following
should be considered when trying to mitigate the damaging
inflationary effects of stagflation.
Trend following has been shown to achieve this without
sacrificing real performance if stagflation doesn’t materialise
which cannot be said for long-only commodities.
-80%
-60%
-40%
-20%
0%
20%
40%
60%
80%
100%
120%
-4%
-2%
0%
2%
4%
6%
8%
10%
12%
14%
16%
Yo
Y R
etu
rns
US Annual Inflation Rate
Stagflationary Period
-80%
-60%
-40%
-20%
0%
20%
40%
60%
80%
100%
120%
-4%
-2%
0%
2%
4%
6%
8%
10%
12%
14%
16%
Yo
Y R
etu
rns
US Annual Inflation Rate
Stagflationary Period
-80%
-60%
-40%
-20%
0%
20%
40%
60%
80%
100%
120%
-4%
-2%
0%
2%
4%
6%
8%
10%
12%
14%
16%
Yo
Y R
etu
rns
US Annual Inflation Rate
Stagflationary Period

Aspect Capital Insight Series │ The Return of Stagflation?
April 2020 Page 7 of 12
Private and Confidential
Trend following can also participate during inflationary
environments, unlike 60/40 stocks and bonds which have
appeared to be adversely sensitive to accelerating inflation.
Figure 10: Long-term statistics based on real returns:
1970 to 2019
Source: Aspect Capital,Datastream, GFD. Please see disclaimer on
pages 11 and 12.
The summary in Figure 10 highlights the effect we were aiming
to show. Although commodities provide protection during rising
inflation, they can be a drag in the absence of inflation. Also,
the traditional 60/40 portfolio struggles during inflationary
periods and furthermore its sensitivity to rising inflation is
progressively worse as inflation rises. This is evidenced by the
strong negative beta during months with rising inflation. Only
trend following, despite it being represented by a rudimentary
index, provides strong real returns in both rising and non-rising
inflationary periods.
4.1. Stagflation and central bank reactions
We would like to consider the possible ancillary effects of likely
central bank actions that seek to combat inflation or the threat
of inflation There are times when the threat of inflation,
particularly against a low growth environment, elicits central
bank policy changes.
Following the early 1980s stagflation, the Fed opted to focus
less on reviving growth and more on combatting inflation by
tightening monetary policy at a rapid pace.
The chart below represents the pace of tightening as the
positive average monthly rate of change in the 10Y bond yield
(on a rolling 12-month basis).
Figure 11: Stagflation and central bank tightening
Source: Aspect Capital,Datastream, GFD. Please see disclaimer on
pages 11 and 12.
We identify the three historical hiking cycle periods with the
largest peaks and observe that two of them occurred during
stagflation:
• July 1980 to July 1981:
The Fed’s then new chairman, Paul Volcker, took
unprecedented measures to fight inflation during the
Great Stagflation by doubling the fed funds rate to
20%, its highest point in history.
Inflation was sent spiralling lower restoring Fed
credibility but not without the triggering of the 1981
recession. This commenced a new paradigm of
managing inflation expectations alongside swift or
even pre-emptive interest rate action.
• October 1983 to June 1984
Investors were spooked by US inflation flirting around
the 4% mark and took concern that inflation was about
to come back in full force so fed funds were raised to
a peak of 11.44% (from 8.50% at the beginning of the
hike cycle).
-3
-2.5
-2
-1.5
-1
-0.5
0
0.5
1
1.5
InformationRatio (IR)
ConditionalIR for months
with US inflationrate upticks
ConditionalIR for months
without USinflation rate
upticks
ConditionalBeta for monthswith US inflation
rate upticks
COMMODITIES (FUTURES)
Trend-Following (MLM INDEX)
60/40 STOCKS BONDS
-4
-2
0
2
4
6
8
10
12
14
16
18
0%
5%
10%
15%
20%
25%
30%
35%
40%
Dec-7
0
Dec-7
2
Dec-7
4
Dec-7
6
Dec-7
8
Dec-8
0
Dec-8
2
Dec-8
4
Dec-8
6
Dec-8
8
Dec-9
0
Dec-9
2
Dec-9
4
Dec-9
6
Dec-9
8
Dec-0
0
Dec-0
2
Dec-0
4
Dec-0
6
Dec-0
8
Dec-1
0
Dec-1
2
Dec-1
4
Dec-1
6
Dec-1
8
(%)
10Y Bond Yield Rate of Change
US 10Y Bond Yield (RHS)
US Annual Inflation Rate (RHS)

Aspect Capital Insight Series │ The Return of Stagflation?
April 2020 Page 8 of 12
Private and Confidential
• February 1994 to November 1994
Referred to by many as ‘The 1994 Bond Massacre’ as
the FOMC exuberantly raised the Fed funds by 300
bps in a year to head off the threat of inflation. This
followed a period of complacency which came after
inflation during the early 1990s appeared to be
contained.
Whilst the 1994 Bond Massacre did not occur within stagflation,
it shared, in common with the other two periods, the fear of
great inflation as its primary trigger. It is conceivable that the
reappearance of stagflation or roaring inflation in the US would
elicit similar reactions and it would be prudent for a solution to
be able to navigate these episodes. With this in mind, Figure
12 compares the real returns of traditional long-only assets and
trend following.
Figure 12: Real returns for selected assets
Source: Aspect Capital,Datastream, GFD. Please see disclaimer on
pages 11 and 12.
A 60/40 stocks and bond mix provided negative real returns in
each period and commodity futures, oil and gold were very
mixed.
Higher interest rates have been known to hurt commodities
such as gold due to the increase in opportunity cost as gold
does not yield anything.
It is noteworthy that trend following is the only consistent source
of real return – having been strongly positive over each period.
In each case, positive real contributions came from the
commodities, FX and FI sectors of the MLM index highlighting
the breadth of performance contributions.
4.2. Spotlight on cross-sectional carry
Whilst we cannot know how the Fed would react to a revival of
inflation, their reaction could very well create global central
bank policy divergence.
This could create new dislocations throughout the global cross-
section of term structures within asset classes which could be
harvested by relative carry models.
Using long-term historical data, we derived monthly carry
estimates going back to 1936 for a group of fixed income and
equity assets as follows:
• Fixed income carry: bond yield minus 3-month repo rate for
20 global bonds across maturities and developed market
regions (e.g. USA, UK, France, Germany, Japan,
Australia, etc.)
• Equity carry: dividend yield minus 3-month repo rate for 25
global stock indices from both developed and emerging
market regions (e.g. USA, UK, France, Germany, Japan,
Australia, Thailand, India etc.)
Figure 13: Standard deviation of fixed income carry:
1936 to 2019
Source: Aspect Capital, GFD. Please see disclaimer on pages 11 and
12.
ST
OC
KS
BO
ND
S
60/4
0 S
TO
CK
S
BO
ND
MIX
CO
MM
OD
ITIE
S
(FU
TU
RE
S)
OIL
GO
LD
TR
EN
D-
FO
LL
OW
ING
(M
LM
IND
EX
)
Jul-1980 to Jul-1981 8.97% -20.28% -3.41% -15.99% -20.44% -44.19% 18.85%
Oct-1983 to Jun-1984 -7.39% -6.97% -7.19% 6.83% -5.14% -10.58% 9.19%
Feb-1994 to Nov-1994 -5.72% -11.85% -8.16% -8.18% 15.60% -2.58% 9.14%
0%
1%
2%
3%
4%
5%
6%
-10%
-5%
0%
5%
10%
15%
20%
25%
Sta
nd
ard
De
via
tio
n o
f C
arr
y E
sti
ma
tes
US Annual Inflation Rate

Aspect Capital Insight Series │ The Return of Stagflation?
April 2020 Page 9 of 12
Private and Confidential
Figure 14: Standard deviation of equity carry: 1936 to
2019
Source: Aspect Capital, GFD. Please see disclaimer on pages 11 and
12.
For both asset classes, we see that the standard deviation of
carry estimates tended to rise with increased US annual
inflation rates. One could argue that this presents more
opportunities for a relative cross-sectional carry model.
FX carry relies on short-term rate differentials within a basket
of currencies, which we can attempt to measure using the
standard deviation of repo rates amongst the same 25
countries used to estimate equity carry.
Figures 15 and 16 show that pre-1970 and post-1970 display a
marked contrast in the relationship between general interest
rate differentials and inflation.
Figure 15: Standard deviation of repo rates: 1936 to 1969
Source: Aspect Capital, GFD. Please see disclaimer on pages 11 and
12.
The 1970s were significant not only because it was a decade
characterised by stagflation but it also saw the passing of the
US Federal Reserve Reform Act.
Here, price stability was explicitly mandated as a US national
policy goal giving the Federal Reserve more authority to
instigate unprecedented short-end rate hikes to combat
gruesome bouts of inflation.
In currencies, over the long-term, surging inflation is damaging
for the currency but over the short-term, the carry trade will
boost the currency if rates are hiked.
A relative currency carry model might be well placed to exploit
an increased range of short-term rates which may occur if US
stagflation materialises.
0%
1%
2%
3%
4%
5%
6%
-10%
-5%
0%
5%
10%
15%
20%
25%
Sta
nd
ard
De
via
tio
n o
f C
arr
y E
sti
ma
tes
US Annual Inflation Rate
0.0%
0.5%
1.0%
1.5%
2.0%
2.5%
3.0%
3.5%
4.0%
-10%
-5%
0%
5%
10%
15%
20%
25%Sta
nd
ard
De
via
tio
n o
f R
ep
o R
ate
s
US Annual Inflation Rate

Aspect Capital Insight Series │ The Return of Stagflation?
April 2020 Page 10 of 12
Private and Confidential
Figure 16: Standard deviation of repo rates: 1970 to 2019
Source: Aspect Capital, GFD. Please see disclaimer on pages 11 and
12.
Limited history for multiple expiry futures contracts precludes
very reliable scrutiny of the relationship between commodity
carry dispersion and inflation.
Despite this, there appears to be positive correlations between
the standard deviation of carry estimates and US inflation for
major commodity subsectors such as precious metals and
agriculturals.
Once again, this is potentially supportive of incorporating
relative commodity carry models during high inflationary or
stagflationary environments.
5. Stagflation and market instability
Another ancillary effect that we would like to highlight is the
potential for market instability during periods of stagflation.
Figure 17 shows how stagflation coincided with some of the
largest jumps in volatility ever recorded across asset classes.
Of course, there are many reasons and drivers for market
instability, but stagflation could certainly be one of them.
Figure 17: Stagflation and instability
Source: Aspect Capital, GFD. Please see disclaimer on pages 11 and
12.
The addition of shorter-term strategies designed to capture
opportunities in expanding volatility environments – whether
these strategies are operated on liquid futures or option
markets – would offer useful complementary performance to
traditional assets in the early stages of market instability –
regardless of the source of the market instability.
Aspect’s buildout over the years of systematic and
complementary trading strategies spanning timeframes from
days to several months gives us a wide-ranging set of
strategies to utilise in the design of a stagflation-mitigation
solution.
0%
1%
2%
3%
4%
5%
6%
7%
8%
-10%
-5%
0%
5%
10%
15%
20%
25%Sta
nd
ard
De
via
tio
n o
f R
ep
o R
ate
s
US Annual Inflation Rate
0%
5%
10%
15%
20%
25%
30%
35%
40%
45%
50%
Dec-7
0
Dec-7
2
Dec-7
4
Dec-7
6
Dec-7
8
Dec-8
0
Dec-8
2
Dec-8
4
Dec-8
6
Dec-8
8
Dec-9
0
Dec-9
2
Dec-9
4
Dec-9
6
Dec-9
8
Dec-0
0
Dec-0
2
Dec-0
4
Dec-0
6
Dec-0
8
Dec-1
0
Dec-1
2
Dec-1
4
Dec-1
6
Dec-1
8
Stagflation
STOCKS - Rolling 12-month volatility
BONDS - Rolling 12-month volatility
COMMODITIES - Rolling 12-month volatility

Aspect Capital Insight Series │ The Return of Stagflation?
April 2020 Page 11 of 12
Private and Confidential
6. Stagflation solution
We have explored ways in which we can mitigate the risks of stagflation on pension plan portfolios.
• A holistic approach should include trend following components providing dynamic directional exposure to a diversified set of asset
classes, particularly commodities.
• It would be likely to benefit from relative carry models to capture policy-driven dislocations.
• It should also contain some faster strategies designed to protect from short-term market shocks caused by market instability.
Aspect can tailor scalable customised stagflation mitigation solutions for our pension plan clients, at various levels of complexity and
capacity, that benefit from:
• Aspect’s research-enhanced trend following models, continuously developed over 22+ years’ experience.
• Carefully chosen additional systematic models designed to capture diversifying enhanced multi-asset carry opportunities.
• Potential additional allocation to faster, lower capacity, alpha strategies that seek to deliver strong returns during periods of short-
term market instability.
References and notes
1. Traditional asset classes, inflation and growth references
STOCKS S&P 500 Total Return Index
BONDS GFD USA 10-year Government Bond Total Return Index
COMMODITIES (FUTURES) S&P GSCI Total Return Index
OIL West Texas Intermediate Oil Price (US$/Barrel)
GOLD Gold Bullion Price-New York (US$/Ounce)
US INFLATION United States BLS Consumer Price Index
US REAL GDP United States Real GDP 2012 Dollars (Federal Reserve)
Note: The data with respect to various indices is shown for illustrative purposes only. Detailed descriptions of the indices used are
available from Aspect upon request.
2. Dates within parentheses indicate inception date within utilised data series
3. Inflation adjustments consist of a subtraction of monthly inflation rates based on the United States BLS Consumer Price Index
Any opinions expressed are subject to change, are for information purposes only and should not be interpreted as investment advice
or a recommendation.

Aspect Capital Insight Series │ The Return of Stagflation?
April 2020 Page 12 of 12
Private and Confidential
Investment Risks
Any person making an investment in an Aspect Product must be able to bear the risks involved and must meet such Aspect Product’s suitability requirements. Some or all alternative investment programmes may not be suitable for certain investors. No assurance can be given that any Aspect Product’s investment objective will be achieved. Among the risks which Aspect Capital Limited wishes to call to the particular attention of persons receiving this brochure are the following: Aspect Products are speculative and involve a substantial degree of risk; Aspect Products’ performance may be volatile; Redemptions may be made only if an investor provides prior written notice of its desire to redeem in advance of the intended redemption date; There is no secondary market for the shares in Aspect Products that are in the form of an investment fund and none is expected to develop; There are restrictions on transferring shares in an Aspect Product that are in the form of an investment fund; An Aspect Product’s fees and expenses are significant. Trading profits must be greater than such fees and expenses to avoid loss of capital; Aspect Products are not required to provide periodic pricing or valuation information to investors with respect to the Aspect Product's individual investments; Aspect Products are not mutual funds and are not subject to regulation under the US Investment Company Act 1940, as amended; Orders executed for Aspect Products will take place on non-US and US markets; Aspect Products may be subject to conflicts of interest.
This material has been prepared by Aspect Capital Limited which is authorised and regulated for investment management by the Financial Conduct Authority ("FCA") in the United Kingdom.
This information has been prepared for circulation to investment professionals who are or would be classified as Professional Clients or Eligible Counterparties under the UK FCA rules and who, if they are US residents or citizens, are or would be qualified as “Qualified Purchasers” under the US Investment Company Act 1940 and “Qualified Eligible Persons” under the US Commodity Futures Trading Commission regulations and who if they are resident in Canada are “permitted clients" within the meaning of Canadian securities legislation, and is specifically not intended for any other persons including persons who are or would be classified as Retail Clients under the UK FCA rules. It is a confidential communication to, and solely for the use of such persons who, as set out above, are permitted to receive it. The information may be subject to verification or amendment and has been supplied for information purposes only. No representation or warranty is made, whether expressly or implied, by Aspect Capital Limited, its Directors or employees, as to the accuracy or completeness of the information provided. An Aspect investment programme investor may lose all or substantially all of its investment.
To the extent that the term/s "systematic" and/or "automatic" is/are used in this document to describe Aspect Capital Limited's investment strategy and/or a number of related processes, it should be noted that human discretion is necessarily involved in the development of Aspect Capital Limited's operations (including the Aspect Diversified Programme and other programmes offered by Aspect Capital Limited from time to time) and in certain circumstances Aspect Capital Limited may also deviate from its automatic systems, for example as a result of external, unforeseen or dramatic events.
Note that any Assets Under Management ("AUM") figure for Aspect Capital Limited detailed in this document includes all AUM managed by Aspect on a discretionary basis. It does not include AUM managed by Aspect on an non-discretionary basis.
This information is neither an offer to sell an interest or otherwise invest in any fund or other investment vehicle including a managed account, sponsored or managed by Aspect Capital Limited whether as investment manager, commodity trading advisor or otherwise (each, an “Aspect Product”). Any such offer, if made, would be made only by way of the final offering documents, disclosure document and/or investment management agreement (together "offering documents") of such Aspect Product and only in jurisdictions where, and to such persons to whom, such an offer would be lawful. Any decision to invest in an Aspect Product should be made only on the basis of consideration of all of the final offering documents in respect of such Aspect Product. Such final offering documents contain important information concerning risk factors and other material aspects of such Aspect Product and must be read carefully before a decision to invest is made. This information must be accompanied or preceded by the final offering documents of the relevant Aspect Product. In accepting receipt of the information contained herein all recipients will be taken to have agreed with Aspect Capital Limited not to distribute such information to any other person save (i) in accordance with the above restrictions, and applicable law and regulation and (ii) without making any changes which would make that information inaccurate or misleading.
Aspect Capital Limited is exempt from the requirement to hold an Australian financial services licence under the Corporations Act 2001 (Cth). Aspect Capital Limited is authorised and regulated under the laws of the United Kingdom which differ from Australian laws. Aspect Capital Limited is not registered with any securities regulatory authority in Canada.
Certain Aspect Products are distributed in Switzerland. ACOLIN Fund Services AG, Geneva Branch, with registered office at 6 Cours de Rive, 1204 Geneva (www.acolin.com), is the representative of such Aspect Products (the "Representative"). The paying agent in Switzerland is Swissquote Bank Limited. The distribution of shares in Aspect Products in Switzerland must exclusively be made to qualified investors. The place of performance and jurisdiction for shares in those Aspect Products distributed in Switzerland are at the registered office of the Representative.
Aspect Capital Limited is a company registered in England and Wales under registered no. 3491169. Its registered office is at 10 Portman Square, London W1H 6AZ. ASPECT, ASPECT CAPITAL, the ASPECT CAPITAL device and ASPECT CAPITAL: THE SCIENCE OF INVESTMENT are registered trademarks of Aspect Capital Limited. © Aspect Capital Limited 2020. All rights reserved.